
HEALTHSOUTH
Current Investor Presentation
November 2007
Exhibit 99
1

The information contained in this presentation includes certain estimates, projections and
other forward-looking information that reflect our current views with respect to future events
and financial performance. These estimates, projections and other forward-looking
information are based on assumptions that HealthSouth believes, as of the date hereof, are
reasonable. Inevitably, there will be differences between such estimates and actual results,
and those differences may be material.
There can be no assurance that any estimates, projections or forward-looking
information will be realized.
All such estimates, projections and forward-looking information speak only as of the date
hereof. HealthSouth undertakes no duty to publicly update or revise the information
contained herein.
You are cautioned not to place undue reliance on the estimates, projections and other
forward-looking information in this presentation as they are based on current expectations
and general assumptions and are subject to various risks, uncertainties and other factors,
including those set forth in our Form 10-Q for the periods ended March 30, 2007, June 30,
2007 & Sept. 30, 2007, the Form 10-K for the fiscal year ended December 31, 2006 and
current report on Form 8-K dated March 30, 2007 and in other documents that we previously
filed with the SEC, many of which are beyond our control, that may cause actual results to
differ materially from the views, beliefs and estimates expressed herein.
Forward-Looking Statements
2
3
Operations Remained Focused on Providing High Quality Patient Care
Massive Internal Control Weaknesses Identified & Mitigated
New Management Recruited
New Board of Directors Recruited
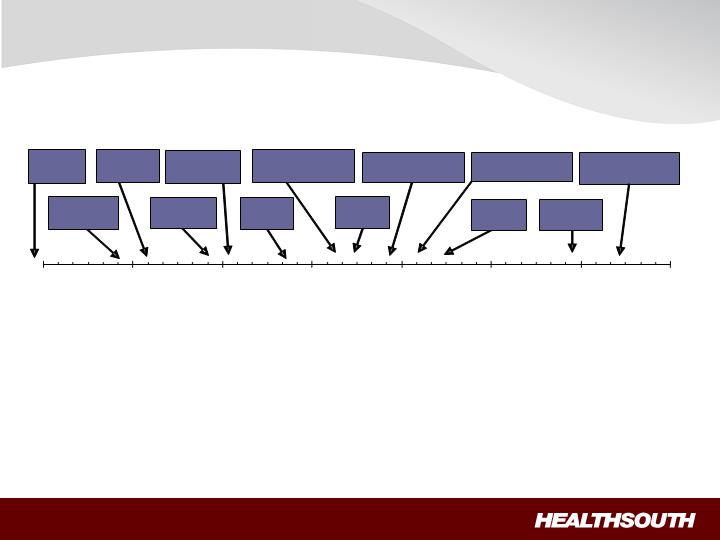
A Look Back……
June-04
December-04
June-05
December-05
June-06
December-06
June-07
Cured Bond
Defaults
Reached CMS
Settlement
Cured Bank
Defaults
Reached SEC
Settlement
Filed 2000 -
2003 Form 10k
Filed 2004
Form 10k
Refinanced Balance
Sheet $2.55B
Filed 2005
Form 10k
Completed $1B
Senior Notes Offering
Announced Strategic
Repositioning
Relisted on
NYSE
Divestitures
Completed
$440M Tax Recovery
Received

Leadership Franchise: largest provider of inpatient rehabilitative care in the U.S.
Market share gains realized despite 75% Rule headwind
Attractive industry: demand for post-acute services expected to grow (favorable
demographics)
Earnings growth: through organic and disciplined development initiatives
Positive EPS
Strong cash flows: shareholder value enhanced through strategic use of FCF
Focused management: proven track record of achieving objectives
HealthSouth Today
4
The “New” HealthSouth
Our Goal: To be the preeminent provider of inpatient
rehabilitative care in the U.S. through:
clinical, service and operational excellence;
growing market share in existing markets;
building new hospitals in new markets; and
acquiring or joint-venturing competitors.
Longer term, we will evaluate expanding into other,
complementary post-acute services on an opportunistic basis.
5

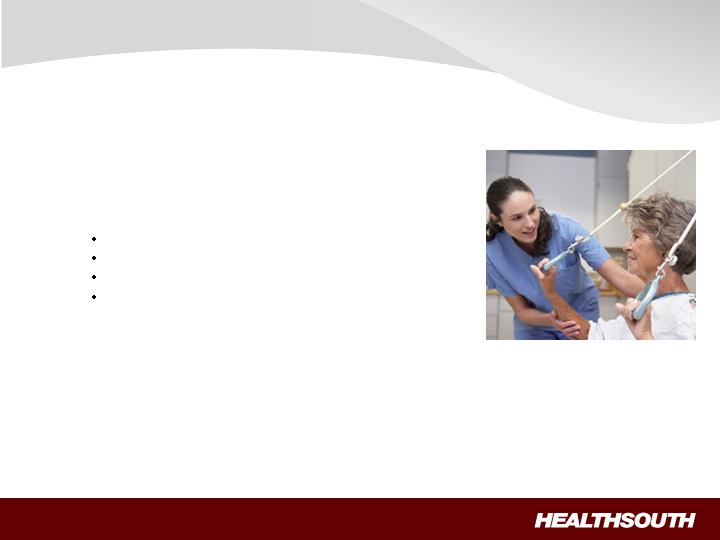
Leadership Franchise
Current Portfolio and Services
Current Portfolio:
94 inpatient rehabilitation hospitals
6 LTCH Hospitals
25 Licensed Home Health Agencies
Major Services Offered:
Specialized nursing care (24/7)
Three-hours intensive therapy per
day (minimum)
Physical Therapy
Occupational Therapy
Speech Therapy
Physician (Medical Director)
oversight
Key Statistics:
$1,314M Net Revenue (thru Q3 ’07)
$236M EBITDA* (thru Q3 ’07)
$25.2M Capex (thru Q3 '07)
22,000 current employees
* Adjusted Consolidated EBITDA - see appendix
6

FIM Gains
LOS Efficiency
Source: UDSmr Database –On Demand
Reports - Q2 2007
***Benchmark = Risk Adjusted Expectancy
Leadership Franchise
Value Proposition
7
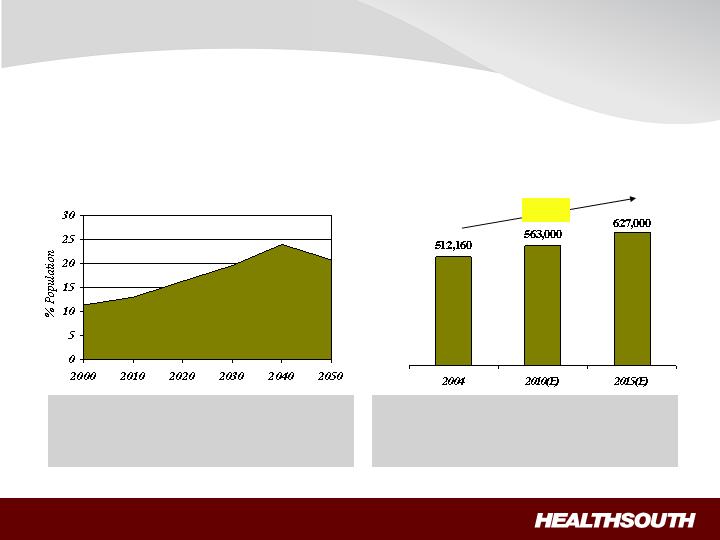
Projected percentage of US population
65 years or older through 2050 (1)
(1) Source: US Census Bureau, 2004
(2) Source: Medicare Provider Analysis and Review File (2004); Claritas
Projected Medicare Compliant Case Growth (2)
+ 22%
Attractive Industry
Expected Increased Demand
Demand for post-acute services will increase
as the U.S. population ages
“Compliant Cases” are expected to grow
~2% annually for the foreseeable future, creating
an attractive market.
8
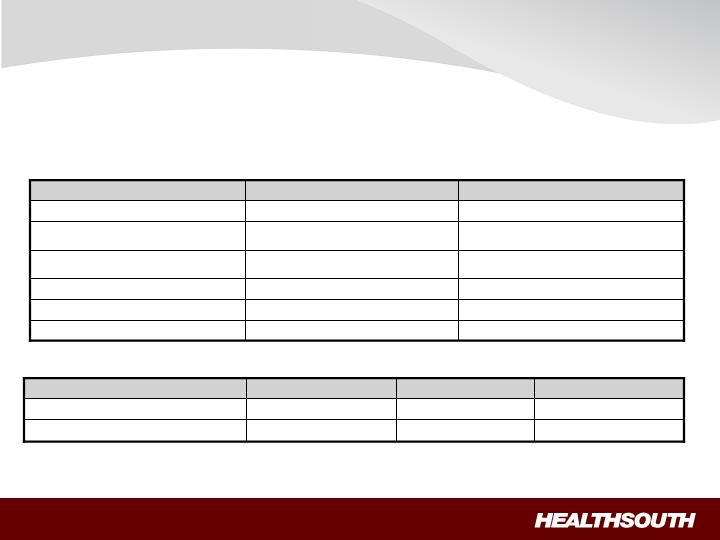
IRFs provide a Higher Level of Service…
Attractive Industry
Better Outcomes at a Comparable Cost
8 consecutive hours per day (min)
24 hours per day
RN oversight and availability
None
Rehabilitation specialty expertise
Nursing training, expertise
2.5 – 4.0
5.0 to 7.5
Nursing hours per patient per day
Not required
Required
MD or DO designated as
Rehabilitation Director
Not required
Required
Multi-disciplinary team approach;
coordinated Program of Care
At least every 30 days
4+ times per week
Attending physician visits
SNF
IRF
Characteristic
at Comparable Cost …
~$400
~$900
Average Cost/Day
~$12,000
~30
SNF
~$13,500
~15
IRF
Cost / Admission
Average LOS
9
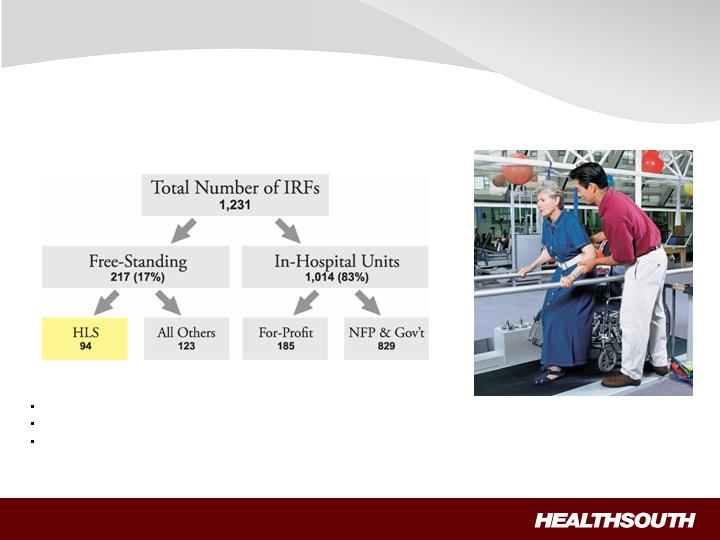
(1) Source: Report to Congress: Medicare Payment Policy; March 2007, MedPAC analysis of Providers of service files from CMS
(2) Typically a 15-30 bed unit/department of an acute care hospital
The inpatient rehabilitative sector is highly fragmented = consolidation opportunities
Inpatient rehabilitation is HLS’ core business -vs- one of many, secondary services provided by acute-care competitors
HLS hospitals can attract patients from multiple referral sources -vs- being dependent on just one source
Attractive Industry
Fragmented Sector with Consolidation Opportunities
1
2
2
10
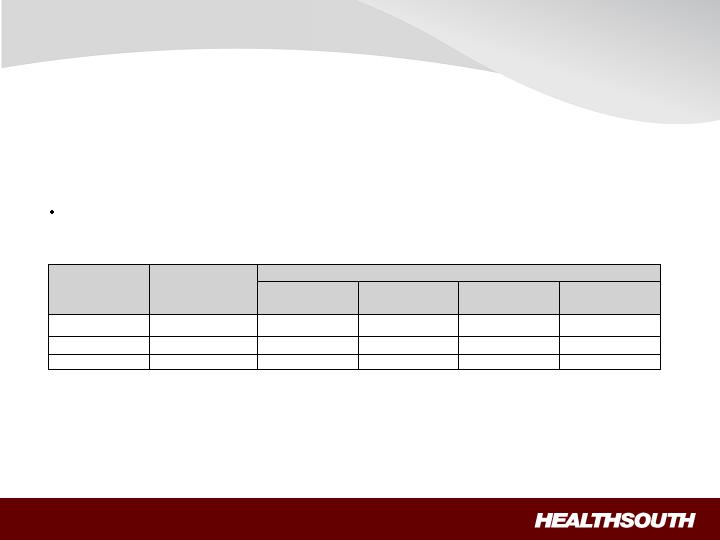
After July 1, 2008, 75% of patients must come from one of thirteen qualifying
conditions (i.e. Compliant Cases)
75% Rule limits access to inpatient rehabilitative care
Cost Reporting
Year End
# of Consolidated
HLS Hospitals*
Minimum Compliance Threshold
50%
60%
65%
75%
June 30
9
7/1/04 – 6/30/05
7/1/05 – 6/30/07
7/1/07 – 6/30/08
7/1/08 – Forward
December 31
65
1/1/05 – 12/31/05
1/1/06 – 12/31/07
1/1/08 – 12/31/08
1/1/09 – Forward
May 31
17
6/1/05 – 5/31/06
6/1/06 – 5/31/08
6/1/08 – 5/31/09
6/1/09 – Forward
HLS implementation schedule:
Industry Issue
75% Rule
HealthSouth is gaining market share despite 75% Rule “headwind”
Compliant Case Growth (Q2)
HLS = +6.7%
Competitors = -1.8%
11

Proposed legislative relief (“CHAMP”):
“Freeze” threshold at 60%
Co-morbidities included as qualifying conditions
Study inpatient rehabilitation across all post-acute settings
Adjust payments for knee/hip replacements and hip fractures
Industry-wide initiative to adopt legislation (except knee/hip payment adjustments)
House Bill (H.R. 1459) = 226 co-sponsors
Senate Bill (S. 543) = 60 co-sponsors
Will seek to include 75% Rule relief in year-end Medicare “package”
Industry Issue
75% Rule (continued)
12

Earnings Growth
Positive EPS
“Steady State”:*
J.V.
Acquire
1-2% SS Volume
2-3% Pricing
Labor @ 3-4%
Other Op Exp @ inflation
Organic
Post 75% Rule
= Mid- to high-single digit
EBITDA growth
12
Fully implemented 75% Rule
Primary focus: Consolidations in
existing markets
Opportunistically: Acquisitions
(existing and new markets)
Amended 75% Rule (i.e. 60%)
Primary focus: De-novo hospitals
(existing and new markets)
Opportunistically: Acquisitions
(existing and new markets)
Development
13
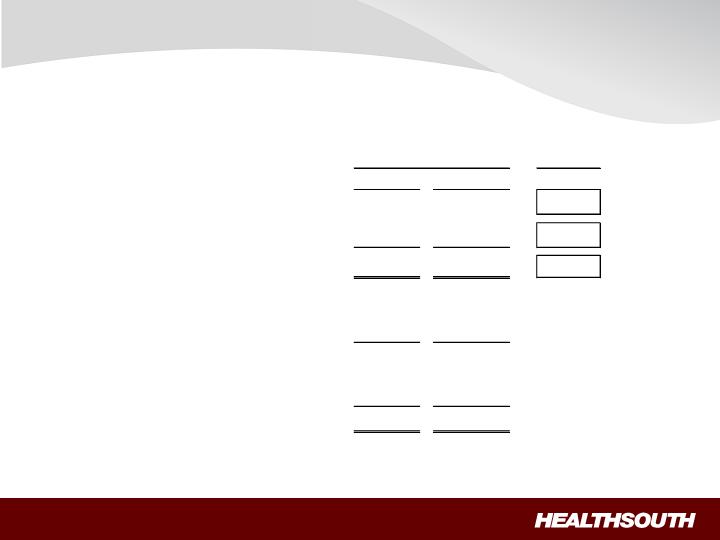
Third Quarter Highlights
14
(dollars in millions)
Dollars
Change
2007
2006
Inpatient Hospital Revenues
(a)
$384
$365
5%
Outpatient Satellites & Other
(b)
48
49
Flat
Total Revenues
$432
$414
4%
2007
2006
Consolidated Adjusted EBITDA
$88.7
$107.3
Non-recurring Items
($8.6)
($35.0)
Normalized
$80.1
$72.3
(a)
94 hospitals in 2007; 92 in 2006
(b)
70 satellites in 2007; 91 in 2006
15
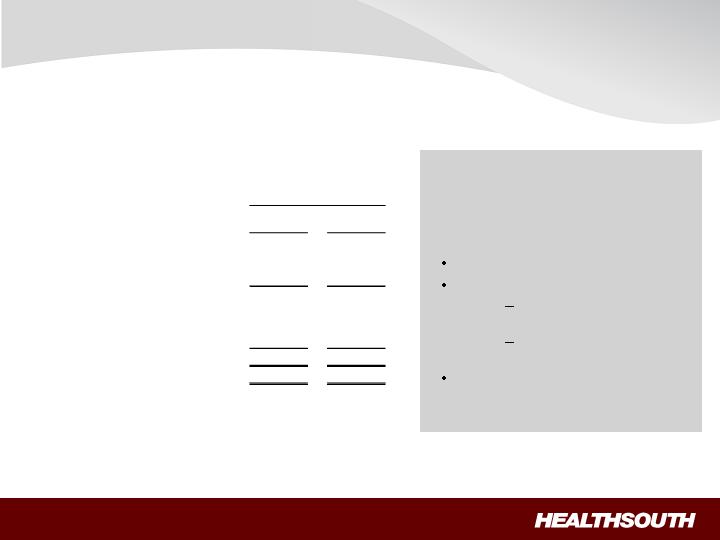
Solid Financials
Strong Cash Flow
Significant turnaround from 2006 FCF =
($208M)
All Settlement Payments completed by
12/31/07
FCF will be used for:
Reducing debt
Building new hospitals
HLS-financed =
$15-20M per IRF
Off-Balance Sheet =
$3-5M per IRF
Acquiring competitors
Note: Consolidations/JVs typically do not
require any CAPEX
Free Cash Flow
(a) Q3 Total of G&A to all revenues (continuing and discontinuing)
(b) Targeted rate of 4.75% (not including 123R costs)
(c) $190M cash run-rate post tax refund proceeds
(d) Before Preferred Stock Dividend
(in millions)
at 5.6%
(a)
of Rev.
at 5.2%
(b)
of Rev.
2007 Nine Months Adj. Consol. EBITDA
236.0
$
236.0
$
Source Medical Gain
(8.6)
(8.6)
Add: Normalization of G&A
33.6
38.9
Sub-total
261.0
$
266.3
$
Less: Capital expenditures
(25.2)
(25.2)
Cash interest cost
(c)
(142.5)
(142.5)
Excess
93.3
$
98.6
$
Annualized
(d)
124.4
$
131.5
$
Normalized
Gen & Admin Expense

Debt Balance
(in millions)
Debt Balance Per December 31, 2006 10K $3,411.4
Debt Balance Sept. 30, 2007 $2,401.0
Post Sept 30, 2007:
Additional Proceeds from Outpatient Sale $ 23.0
Tax Refund (Portion to pay down debt) $ 405.0
Final SEC & CMS/DOJ Payments ($ 47.3)
Derivative Proceeds from Litigation TBD
DEBT BALANCE POST SEPT 30, 2007 ~$2 BILLION
Tax losses available for future years ~ $2.5B
For foreseeable future, will allow all cash flow to be available for maximizing shareholder value
Solid Financials
Ongoing Debt Reduction
10.75% Senior Notes
Purchased ~$51M of
Notes during Sept/ Oct
timeframe at an average
price of 103.8
Will continue to
opportunistically look at
high cost debt to be
retired
16

Investment Considerations
Focused management: proven track record of achieving objectives
Attractive industry: demand for post-acute services expected to grow
(favorable demographics)
Strong presence: largest provider of inpatient rehabilitative care in the U.S.
Market share gains realized despite 75% Rule headwind
Earnings growth: through organic and disciplined development initiatives
Positive EPS beginning in 2008
Strong cash flows: shareholder value enhanced through strategic use of FCF
17

Appendix
18
Three Months Ended
September
30,
Nine Months Ended
September
30,
2007
2006
2007
2006
(In Millions)
Net income (loss)
$
287.6
$
(76.1)
$
699.2
$
(55
3.7)
(Income) loss from discontinued operations
(37.6)
18.0
(475.7)
35.4
Provision for income tax (benefit) expense
(281.1)
2.1
(288.2)
21.0
Loss on interest rate swap
21.4
28.7
6.8
13.9
Interest expense and amortization of debt discounts
and fees
60.2
56.8
177.9
176.8
Loss on early extinguishment of debt
2.2
–
19.9
365.6
Government, class action, and related settlements
3.9
28.4
(31.7)
49.9
Net noncash loss on disposal of assets
0.6
1.1
2.2
5.3
Impairment charges
0.
4
–
15.1
–
Depreciation and amortization
19.9
20.7
57.8
63.3
Professional fees
—
accounting, tax, and legal
9.2
23.1
44.3
99.4
Compensation expense under FASB Statement
No.
123(R)
2.0
3.6
8.1
11.6
Restructuring activities under FASB S
tatement No.
146
–
–
–
0.3
Sarbanes
-
Oxley related costs
–
0.9
0.3
4.2
Adjusted Consolidated EBITDA
(1)*
$
88.7
$
107.3
$
236.0
$
293.0
(1)
Adjusted Consolidated EBITDA is a non
-
GAAP financial measure. We believe it is useful to investors as it
is used in our
covenant calculations under our Credit Agreement.
Adjusted Consolidated EBITDA is not a measure of financial performance under accounting principles generally accepted
in the United States and should not be considered as an alternative to ne
t
income (
loss
)
or to cash flows from operating,
investing, or financing activities. Because Adjusted Consolidated EBITDA is not a measure determined in accordance with
generally accepted accounting principles and is susceptible to varying calculations, Ad
justed Consolidated EBITDA, as
presented, may not be comparable to other similarly titled measures presented by other companies.

Appendix (cont'd)
19
Our Credit Agreement allows certain items to be added to arrive at Adjusted Consolidated EBITDA that are viewed as not
being on
going costs once the Company has completed its restructuring.
After consummation of the divestitures of our surgery centers, outpatient, and diagnostic divisions, and in accordance with
our Credit Agreement, Adjusted Consolidated EBITDA is calculated to gi
ve effect to each divestiture, including adjustments
for the allocation of corporate overhead to each divested division.
However, these allocations are estimates and are not
necessarily indicative of the Adjusted Consolidated EBITDA that would have resulte
d had the applicable divisions been
divested as of the beginning of each period presented. Accordingly, t
hese adjustments are not included in the above table.
In
addition, we are allowed to add other income, including interest income, to the calculation of
Adjusted Consolidated
EBITDA under our Credit Agreement. This includes interest income associated with our federal income tax recovery. This
amount has not been included in the above calculation as it would not be indicative of our Adjusted Consolidated E
BITDA
for future periods.
Adjusted Consolidated EBITDA for the three and nine months ended September 30, 2007 includes an $8.6 million gain on
the
sale of our
remaining
investment in Source Medical Solutions, Inc. Adjusted Consolidated EBITDA for the three
and
nine months ended September 30, 2006 includes
a
$35.0 million recovery of incentive bonuses from Richard M. Scrushy,
our former chairman and chief executive officer.
*
Adjusted
Consolidated EBITDA includes general and administrative
expenses for all
divisions. G
eneral and administrative
expenses approximated
6.4
%
and
8.
2
%
of consolidated net operating revenues
for the three and
nine
months ended
September
30, 2007
, respectively
.
However,
these percentages decrease by 60 basis points and 260 basis poin
ts,
respectively
, if you include the revenues of the divisions reported in discontinued operations.