
Investor
Presentation
March 2008
1

The information contained in this presentation includes certain estimates, projections and
other forward-looking information that reflect our current views with respect to future events
and financial performance. These estimates, projections and other forward-looking
information are based on assumptions that HealthSouth believes, as of the date hereof, are
reasonable. Inevitably, there will be differences between such estimates and actual results,
and those differences may be material.
There can be no assurance that any estimates, projections or forward-looking
information will be realized.
All such estimates, projections and forward-looking information speak only as of the date
hereof. HealthSouth undertakes no duty to publicly update or revise the information
contained herein.
You are cautioned not to place undue reliance on the estimates, projections and other
forward-looking information in this presentation as they are based on current expectations
and general assumptions and are subject to various risks, uncertainties and other factors,
including those set forth in our Form 10-K for the fiscal year ended December 31, 2007 and
in other documents that we previously filed with the SEC, many of which are beyond our
control, that may cause actual results to differ materially from the views, beliefs and
estimates expressed herein.
Forward-Looking Statements
2
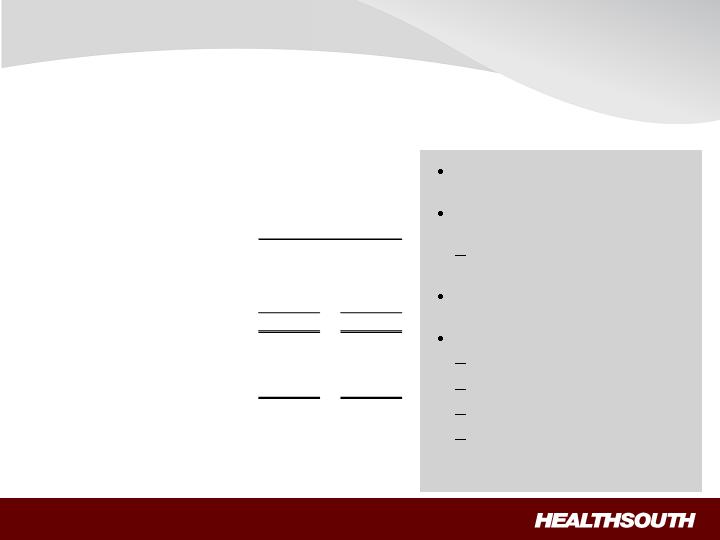
HealthSouth Snapshot
$1.8 billion
net operating revenues
100 hospitals
26 states
+
60 outpatient satellites & 25 hospital-
based home health agencies
~22,000 employees
Largest Provider of Inpatient Rehabilitative Healthcare Services in the U.S. (1)
(1) Source: Report to Congress: Medicare Payment Policy: March 2008, MedPAC analysis of Providers of service files from CMS
~8% of IRHs
~17% of inpatient beds
3

Turnaround Complete
Milestones
Resolved bond holder dispute: received consents on outstanding debt, curing all defaults
Settled with DOJ/CMS & SEC: final settlement payments made in Q4 2007
Reconstructed financial statements: using outside assistance, re-built from company
inception forward; filed 2005 Form 10-K on a timely basis
Refinanced balance sheet: refinanced capital structure to provide flexibility
Installed comprehensive internal control environment: built infrastructure from scratch
Recruited new, independent Board of Directors & re-built senior management team
Participated in industry-wide effort to modify "75% Rule": On December 29, 2007, the
President signed Pub. Law 110-173 which includes a 60% freeze of the "75% Rule"
HealthSouth spent over $1 billion in the turnaround phase
4
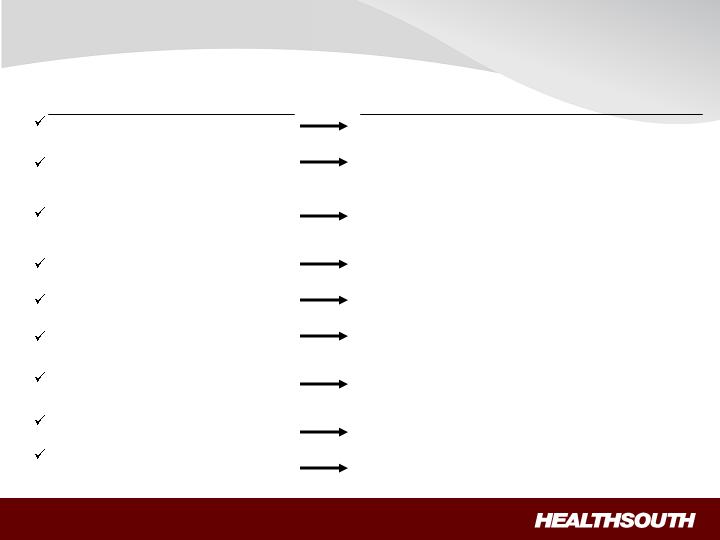
“Old” HealthSouth
“New” HealthSouth
Complex company with four operating
divisions and no synergies -- some
actual dis-synergies
Heavily levered with $3.5 billion of
debt
Over $1 billion total cash outflows
related to government settlements
and professional fees - accounting,
tax and legal
Non-existent internal controls;
multiple material weaknesses at YE
2004
Corporate governance issues
Post-acute provider with emphasis
on inpatient rehabilitation
Debt reduced to $2.0 billion as of
Q407
Paid last DOJ/CMS & SEC
settlement payments in Q407;
Company can now use excess
cash flow to invest in business
Created comprehensive internal
controls from ground up; 0 material
weaknesses at YE 2007
Industry leading corporate
governance standards in place;
legacy issues resolved
The “New” HealthSouth
5
Focused Strategy
With our turnaround complete our focus is now on executing
our strategic plan and growing EPS
Our Goal: To be the preeminent specialty provider of inpatient
rehabilitative care in the U.S. through:
clinical, service and operational excellence;
growing market share in existing markets;
building new hospitals in new markets; and
acquiring, or joint-venturing with, competitors
Longer term, we will evaluate expanding into other,
complementary post-acute services on an opportunistic basis
6

Projected percentage of US population
65 years or older through 2050 (1)
(1) Source: US Census Bureau, 2004
(2) Source: Medicare Provider Analysis and Review File (2004); Claritas
Projected Medicare Compliant Case Growth (2)
+ 22%
Attractive Industry
Aging Demographics = Increased Demand
Demand for post-acute services will increase
as the U.S. population ages
“Compliant Cases” are expected to grow
~2% per year for the foreseeable future, creating
an attractive market.
7
(1) Source: Report to Congress: Medicare Payment Policy; March 2008, MedPAC analysis of Providers of service files from CMS
(2) Typically a 15-30 bed unit/department of an acute care hospital
Inpatient rehabilitation is HLS’ core business -vs- one of many,
secondary services provided by acute-care hospitals
HLS not challenged by Bad Debt or CAPEX issues facing
acute-care hospitals
HLS can attract patients from multiple referral sources
Consolidation opportunities will be pursued
Attractive Industry
Fragmented Provider Base = Opportunities
1
2
Total Number of IRFs
1,224
Free-Standing Hospitals
217 (18%)
In-Hospital Units
1,007 (82%)
For-Profit
179
NFP & Gov’t
828
All Others
123
HLS
94
(1)
(2)
8
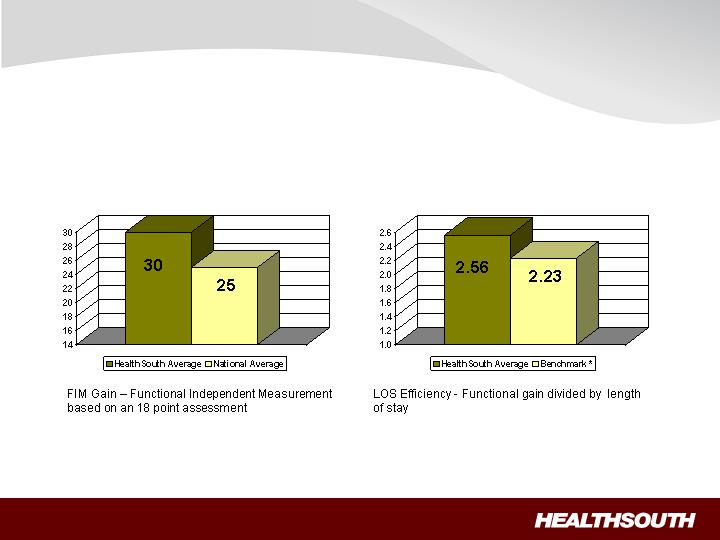
FIM Gains
LOS Efficiency
Source: UDSmr Database –On Demand
Reports - YTD 2007
*Benchmark = Risk Adjusted Expectancy
Leadership Franchise
Value Proposition = Quality of Care
9
IRHs provide a Higher Level of Service…
Leadership Franchise
Differentiation = Better Outcomes at Comparable Costs
8 consecutive hours per day (min.)
24 hours per day
RN oversight and availability
None
Rehabilitation specialty expertise
Nursing training, expertise
2.5 – 4.0
5.0 to 7.5
Nursing hours per patient per day
Not required
Required
MD or DO designated as
Rehabilitation Director
Not required
Required
Multi-disciplinary team approach;
coordinated Program of Care
Once every 30 days (min.)
4+ times per week
Attending physician visits
Nursing Home
Inpatient Rehabilitation Hospital
Service
at Comparable Cost …
~$400
~$900
Average Cost/Day
~$12,000
~30
Nursing Home
~$13,500
~15
Inpatient Rehabilitation Hospital
Average Cost / Admission
Average LOS
10

Financial Overview &
Growth Strategies
11
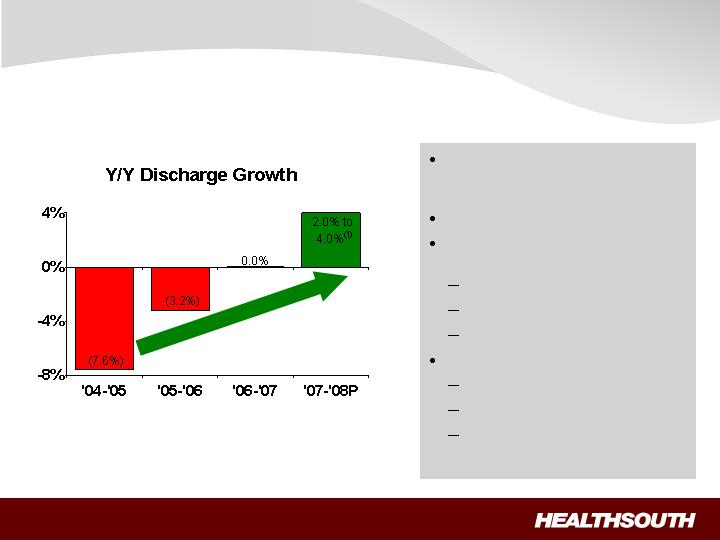
Volume Turnaround
Significant turnaround from the '04-
'05 and '05-'06 declines ("75%
Rule")
2007 Y/Y growth slightly positive
Non-HealthSouth Industry
declines(2):
'04-'05 = (9.4%)
'05-'06 = (6.3%)
'06-'07 = (4.9%)
2008 Guidance of 2.0% to 4.0%
TeamWorks
"60% Rule" freeze
Excess capacity = higher
incremental margins on
additional volume
(1)2008 Guidance of 2% to 4% increase year over year
(2) This summary information was provided by UDSmr and is used with prior written permission of UDSmr
12
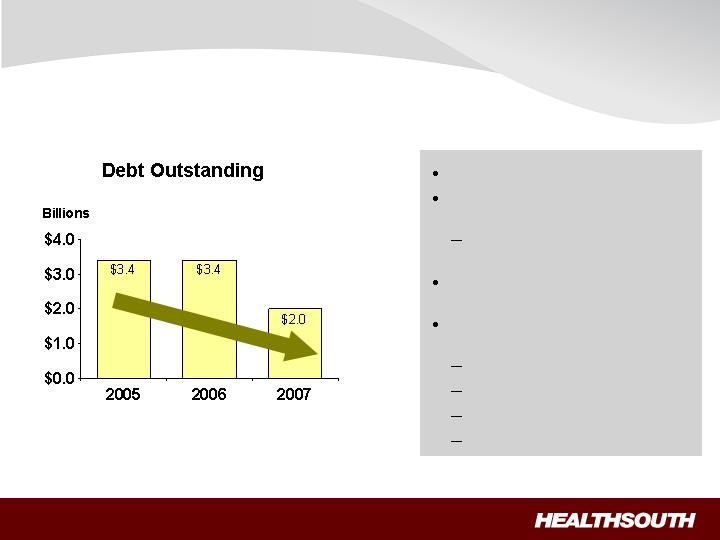
Debt Reduction
Significant debt reduction in 2007
Will continue to evaluate high cost
debt to be retired
Purchased $5M of 10.75%
Senior Notes in Jan/Feb 2008
SEC & CMS/DOJ payments
completed in 2007
Debt reduction will continue to be a
priority
Excess cash from operations
Sale of corporate campus
Additional income tax recoveries
Derivative proceeds
13

Fourth Quarter Highlights
Q4 2007 net operating revenues
from inpatient rehabilitation
hospitals increased by 4.6%
compared to Q4 2006
Total discharges increased by
0.9% compared to Q4 2006 and
1.9% sequential improvement
from Q3 2007
Total operating expenses
decreased by 1.5% in Q4 2007
compared to Q4 2006
2007 Q4/YTD Financial Recap
14
(1) Adjusted Consolidated EBITDA for the year ended December 31, 2007 included an $8.6 million gain on the sale of our remaining investment in Source Medical Solutions,
Inc.; Adjusted Consolidated EBITDA for the three months and year ended December 31, 2006 included a $12.8 million and a $47.8 million, respectively, recovery of
incentive bonuses from our former chairman and chief executive officer
(In Millions)
Three Months Ended Dec. 31,
2007
2006
Net operating revenues
439.0
$
422.8
$
Adjusted Consolidated EBITDA
87.1
$
84.4
$
Operating Earnings
21.9
$
3.3
$
Discharges
25,183
24,958
Year Ended Dec. 31,
2007
2006
Net operating revenues
1,752.5
$
1,711.6
$
Adjusted Consolidated EBITDA
(1)
323.2
$
376.4
$
Operating Earnings
149.4
$
86.9
$
Discharges
101,462
101,421

2008 Guidance
Note: The above guidance does not incorporate any assumptions related to: (1) mark-to-market adjustments to the liability associated with our securities litigation settlement that
are required until the applicable common stock and warrants are issued; and (2) any gain or loss associated with our interest rate swap over the remaining term of this agreement.
Inpatient discharges are expected to grow 2% to 4% year over year
Consolidated net operating revenues to be in the range of $1.80 billion to
$1.85 billion
Adjusted consolidated EBITDA is expected to be in the range of $320 million
to $335 million
Diluted loss per share available to common shareholders will be in the range
of ($0.08) to $0.00 per share
Our adjusted diluted earnings per share will be in the range of $0.30 per share to
$0.38 per share
Excludes accelerated depreciation from our corporate campus (~$10M) and professional fees
related to derivative litigation and tax recoveries (~$25M)
15
Significant turnaround from 2006
excess cash flow = ($208M)
Tax losses available for future
years ~ $2.5 billion
No federal income taxes for
foreseeable future
All Settlement Payments
completed by 12/31/07
Excess cash flow will be used for:
Reducing debt
Upgrading existing hospitals
Building new hospitals
Acquiring competitors
Note: Consolidations/JVs typically
do not require any CAPEX
Strong Cash Flow Characteristics
16
Normalized Cash Flow
Note: Before Professional Fees (2008 est. $25M) and Preferred Dividends ($26M)
Does not include non-cash amortization and discounts reported on a GAAP basis
(In Millions)
2008 Adj. Consol. EBITDA guidance
320.0
$
335.0
$
Less: Est. capital expenditures (maintenance)
(40.0)
(40.0)
Est. cash interest cost and swap payments
(190.0)
(195.0)
Excess
90.0
$
100.0
$
Excess per fully diluted share
0.98
$
1.09
$
2008 Guidance Range

De-novo Development Example
17
Real estate lease option available
at $3 - $5 million cash up-front
cost
Approx. 18-24 mos. to permit /
build + 6 mos. to "ramp-up"
Goal: Launch 5 /yr
New and existing market
opportunities
(In Thousands)
(1) Does NOT include estimated corporate overhead of ~4.75% of net operating revenues
(2) Does not assume any income tax implications
DeNovo - Pro forma (40 Bed)
Revenue
EBITDA
(1)
%
(1)
Year 1
$8,500
$1,275
15%
Year 2
$10,500
$2,500
24%
Run Rate
$11,500
$2,900
25%
Investment
$15,000-17,000
5-year Annualized ROI
(2)
14% -18%

Acquisitions and Consolidations
Acquisitions
Opportunistic in nature
Active in marketplace as we believe we're the natural consolidator in
this space
We will continue to be very disciplined in our approach -- carefully
evaluating these opportunities against our deleveraging priority
Consolidations
Complex transactions
Capacity rationalization
Incremental EBITDA with no cash investment
18

Investment Considerations
Turnaround Complete: 2008 will represent the first year the current management
team can focus 100% on operations
Volume Growth: #1 priority going forward; our TeamWorks initiative will help us
meet or exceed our targets
Expense Control: focused on managing our expenses in a disciplined manner,
while realizing that our most important "asset" is our dedicated employees
Continued Deleveraging: our goal is to reduce leverage to ~4.5X no later than the
end of 2010
Strong Cash Flows: shareholder value enhanced through strategic use of excess
cash flow
Management Team: proven track record of success
Focus: Growing EPS
19

Appendix
20
Review of Key Assumptions to EPS Growth
Key Assumptions:
SS Discharges: 2+%/yr
(2% - 4% guidance for 2008)
Pricing: 2-3%/yr
SW&B: 3-4%/yr
G&A: 4.75% of net op. revenues
Other op. expense: = inflation
Interest expense: $180-190M
(at current debt levels)
Federal income taxes: $0
(for foreseeable future)
Derivative proceeds: TBD
“Restructuring”: ~$25M in ‘08
Comments:
Primary operational focus (TeamWorks)
Beginning in Q409 (P.L. 110-173 “rolls-back”
pricing from Q208 thru Q309)
Higher in 2008 due to investment (“catch-up”) to
make benefits competitive
Target: End-of-Year 2008
Operational focus (TeamWorks)
Cash payments are lower ($170-180M)
(at current debt levels)
NOL’s (~$2.5B)
Will be used to re-pay debt; expect in 2009
Fees related to pursuit of derivative proceeds
(a)
(a) Targeted rate of 4.75% (not including FASB Statement No.123(R) costs); (b) Excludes swap payments
(b)
21

Supplemental Non-GAAP Disclosures
Adjusted Consolidated EBITDA
22
2007
2006
2007
2006
Net (loss) income
(45.9)
$
(71.4)
$
653.4
$
(625.0)
$
Loss (income) from discontinued operations
19.0
22.5
(454.6)
88.0
Provision for income tax (benefit) expense
(34.2)
1.4
(322.4)
22.4
Loss (gain) on interest rate swap
23.6
(3.4)
30.4
10.5
Interest expense and amortization of debt discounts and
fees
52.0
57.9
229.9
234.8
Loss on early extinguishment of debt
8.3
-
28.2
365.6
Government, class action, and related settlements
31.1
(24.5)
(2.8)
(4.8)
Net noncash loss on disposal of assets
3.6
2.2
5.9
6.4
Impairment charges
-
9.7
15.1
9.7
Depreciation and amortization
19.7
23.5
77.5
86.8
Professional fees—accounting, tax, and legal
7.3
62.0
51.6
161.4
Compensation expense under FASB Statement No. 123(R)
2.5
3.9
10.6
15.5
Restructuring activities under FASB Statement No. 146
0.1
-
0.1
0.3
��
Sarbanes-Oxley related costs
-
0.6
0.3
4.8
Adjusted Consolidated EBITDA
(1)*
87.1
$
84.4
$
323.2
$
376.4
$
Three Months Ended
December 31,
Year Ended
December 31,
(In Millions)
(1)
Adjusted
Consolidated EBITDA is a non
-
GAAP financial measure. We believe it is useful to investors as it is used in our
covenant calculations under our Credit Agreement.
Adjusted Consolidated EBITDA is not a measure of financial performance under accounting princi
ples generally accepted
in the United States and should not be considered as an alternative to net
income (
loss
)
or to cash flows from operating,
investing, or financing activities. Because Adjusted Consolidated EBITDA is not a measure determined in accord
ance with
generally accepted accounting principles and is susceptible to varying calculations, Adjusted Consolidated EBITDA, as
presented, may not be comparable to other similarly titled measures presented by other companies.

23
Supplemental Non-GAAP Disclosures (cont'd)
Adjusted Consolidated EBITDA
Our Credit Agreement allows ce
rtain items to be added to arrive at Adjusted Consolidated EBITDA that are viewed as not
being ongoing costs once the Company has completed its restructuring.
After consummation of the divestitures of our surgery centers, outpatient, and diagnostic divisio
ns, and in accordance with
our Credit Agreement, Adjusted Consolidated EBITDA is calculated to give effect to each divestiture, including adjustments
for the allocation of corporate overhead to each divested division.
However, these allocations are estimat
es and are not
necessarily indicative of the Adjusted Consolidated EBITDA that would have resulted had the applicable divisions been
divested as of the beginning of each period presented. Accordingly, t
hese adjustments are not included in the above table.
In
addition, we are allowed to add other income, including interest income, to the calculation of Adjusted Consolidated
EBITDA under our Credit Agreement. This includes interest income associated with our federal income tax recovery. This
amount has not be
en included in the above calculation as it would not be indicative of our Adjusted Consolidated EBITDA
for future periods.
Adjusted Consolidated EBITDA for the year ended December
31, 2007
included
an $8.6 million gain on the sale of our
remaining investme
nt in Source Medical Solutions, Inc. Adjusted Consolidated EBITDA for the
three months and
year
ended December
31, 2006
included
a $
12.8
million
and a $
47.
8
million, respectively,
recovery of incentive bonuses from
our former chairman and chief executive o
fficer.
*
Adjusted
Consolidated EBITDA includes general and administrative
expenses for all divisions. G
eneral and administrative
expenses approximated
6.3
%
and
7.7
%
of consolidated net operating revenues
for the three months
and year
ended
December
3
1
, 20
07
, respectively
.
However,
these percentages decrease by
30
basis points
and
200
basis points, respectively,
if you include the revenues of the divisions reported in discontinued operations.