
Third Quarter 2008 Earnings Call
Supplemental Slides
Exhibit 99.2

The information contained in this presentation includes certain estimates, projections and other forward-
looking information that reflect our current views with respect to future events and financial performance.
These estimates, projections and other forward-looking information are based on assumptions that
HealthSouth believes, as of the date hereof, are reasonable. Inevitably, there will be differences between
such estimates and actual results, and those differences may be material.
There can be no assurance that any estimates, projections or forward-looking information will be realized.
All such estimates, projections and forward-looking information speak only as of the date hereof.
HealthSouth undertakes no duty to publicly update or revise the information contained herein.
You are cautioned not to place undue reliance on the estimates, projections and other forward-looking
information in this presentation as they are based on current expectations and general assumptions and
are subject to various risks, uncertainties and other factors, including those set forth in our Form 10-Q for
the quarters ended March 31, 2008, June 30, 2008, and September 30, 2008, Form 10-K for the fiscal
year ended December 31, 2007, and in other documents we previously filed with the SEC, many of which
are beyond our control, that may cause actual results to differ materially from the views, beliefs and
estimates expressed herein.
Note Regarding Presentation of Non-GAAP Financial Measures
The following presentation includes certain “non-GAAP financial measures” as defined in Regulation G
under the Securities Exchange Act of 1934. A schedule is attached that reconciles the non-GAAP
financial measures included in the following presentation to the most directly comparable financial
measures calculated and presented in accordance with Generally Accepted Accounting Principles in the
United States. Our Form 8-K, dated November 4, 2008, to which the following supplemental slides are
attached as Exhibit 99.2, provides further explanation and disclosure regarding our use of non-GAAP
financial measures and should be read in conjunction with these supplemental slides.
Forward-Looking Statements

Table of Contents
Slide
Revenues (Q3, Sequential)....................................................... 4-5
Expenses (Q3)….…………………………………………………. 6
Labor……… ……………………………………………………..... 7
Expenses (Sequential)….………………………………………... 8
Bad Debt Expense……….……………………………………..… 9
Adjusted Consolidated EBITDA Results (Q3, Year to date).… 10
Adjusted Income Per Share Results….………………………… 11
Free Cash Flow………..………………………………………….. 12
Liquidity…………………………………………………………….. 13
Debt Reduction……………………………………………………. 14
Interest Expense and Swap Settlements……………………….. 15
Development Growth YTD…..…………………………………… 16
Appendix…………………………………………………………… 17
Outstanding Share Summary……………………………………. 18
Debt Schedule…………………………………………………….. 19
US GAAP Reconciliations ……………………………………….. 20-26
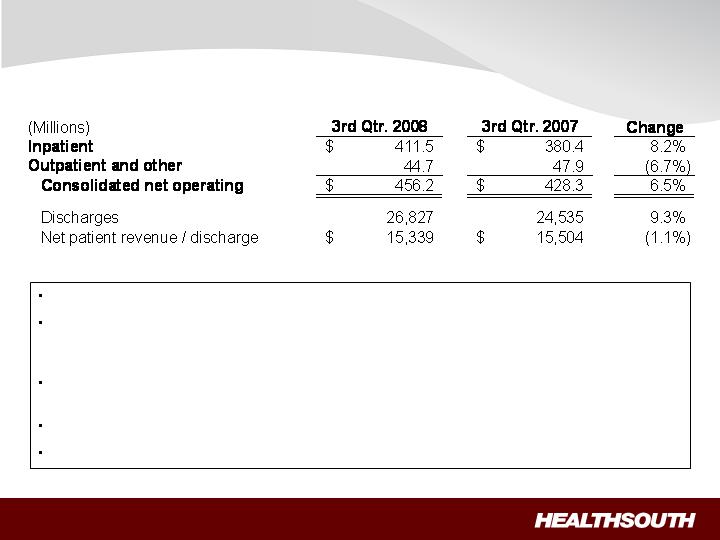
Revenues (Q3 2008 vs Q3 2007)
Inpatient revenue growth was driven by strong discharge volumes.
Volume growth was driven by the TeamWorks effort, the acquisition of a 34-bed hospital in
Vineland, NJ, and the acquisitions / consolidations of a 30-bed hospital unit in Arlington, TX
and a 38-bed hospital in Midland, TX.
“Same store” discharge growth was 8.1%, excluding our Fredericksburg, VA hospital, which
opened in the third quarter 2007, and the above-referenced Vineland, NJ hospital.
Net patient revenue / discharge was lower due to a slight decrease in acuity.
Outpatient revenue declined as a result of 15 fewer outpatient satellites quarter over quarter.
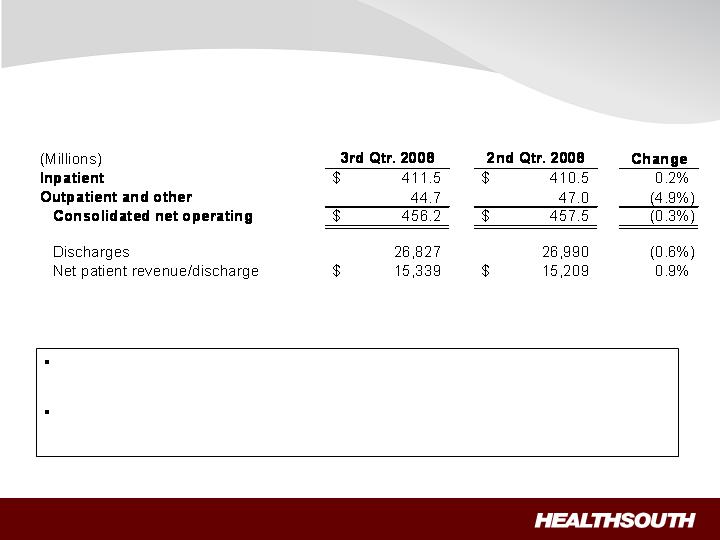
Revenues (Sequential)
The slight decline in consolidated net operating revenues and volumes
sequentially is a result of normal seasonality.
Outpatient and other revenue is down sequentially as a result of seasonality
and the closure of four outpatient satellites in the third quarter of 2008.

Expenses (Q3 2008 vs Q3 2007)
Salaries and benefits increased quarter over quarter due to an increase in the
number of employees required to serve the increase in volumes coupled with
higher labor cost per FTE (see next slide).
Hospital related expenses increase was driven by higher costs for supplies and
utilities and hurricane-related expenses.
G&A costs were fairly consistent with last year as the divestitures were
completed by Q3 07.
(Millions, except percent)
3rd Qtr. 2008
3rd Qtr. 2007
Change
Salaries and benefits
236.5
$
214.4
$
10.3%
Percent of net operating revenues
51.8%
50.1%
170 bps
Hospital related expenses
114.6
$
106.3
$
7.8%
(other operating, supplies, occupancy, bed debts)
Percent of net operating revenues
25.1%
24.8%
30 bps
General and administrative
23.0
$
23.8
$
-3.4%
(excludes $2.5 million and $2.0 million in stock
compensation, respectively)
Percent of net operating revenues
5.0%
5.6%
(60) bps
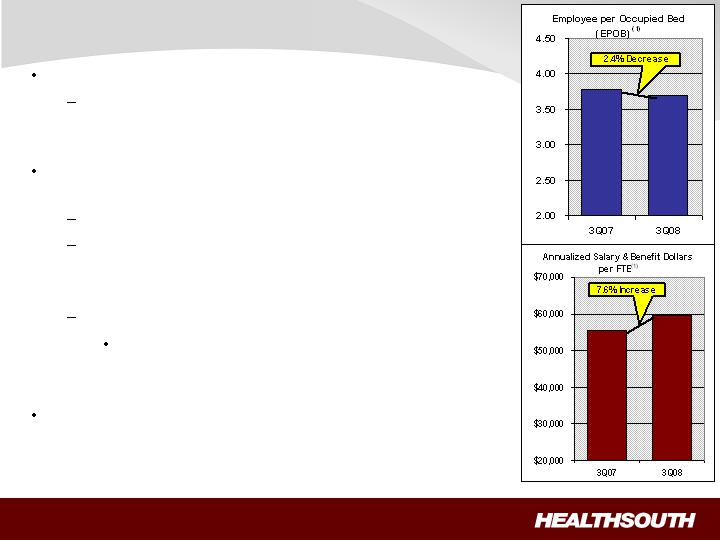
Productivity improved 2.4%
Employees per occupied bed, or EPOB,
decreased from 3.78 to 3.69
Salary, wage & benefit (“SWB”) dollars per FTE
increased 7.6% quarter over quarter due to:
October 1, 2007, merit increases of 3.7%
Range adjustments in select markets, contract
labor and the cost of recruitment and
orientation.
2008 benefit plans
Some changes to these plans will be made
November 15th; additional changes will be
made January 1st.
An average merit increase of 3.0% was given on
10/01/08 (except senior management).
Labor
(1)
Includes FTE’s associated with contract labor

Expenses (Sequential)
Salaries and benefits were up in third quarter primarily as the result of
higher cost per employee related to our benefits programs.
Hospital related expenses were higher in the third quarter mainly
attributed to insurance costs which tend to vary, higher seasonal utilities
costs, and some hurricane-related expenses.
(Millions, except percent)
3rd Qtr. 2008
2nd Qtr. 2008
Change
Salaries and benefits
236.5
$
234.1
$
1.0%
Percent of net operating revenues
51.8%
51.2%
60 bps
Hospital related expenses
114.6
$
110.5
$
3.7%
(other operating, supplies, occupancy, bed debts)
Percent of net operating revenues
25.1%
24.2%
90 bps
General and administrative
23.0
$
22.5
$
2.2%
(excludes $2.5 million and $2.7 million in stock
compensation, respectively)
Percent of net operating revenues
5.0%
4.9%
10 bps
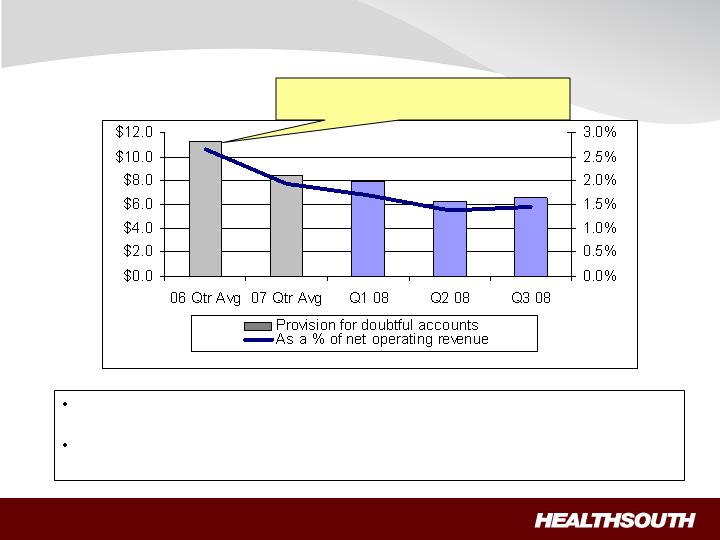
Bad Debt Expense
(Millions, except percent)
The decline of the provision for doubtful accounts is attributable to the
Patcom system we installed in 2006.
Provision for doubtful accounts is expected to be in the 1.5% to 1.8% range as
a percent of net operating revenues for the foreseeable future.
New collections software installed
in hospitals during 2006

Adjusted Consolidated EBITDA Results
(1)
Reconciliation to GAAP provided on slide 20 and slide 22
(2)
Includes an $8.6 million gain on the sale of our investment in Source Medical
(3)
Adjusted Consolidated EBITDA was revised upward in the second quarter 2008 earnings release
(3)
No change; benefit and nonproductive labor costs (e.g. PTO accruals) won’t change
significantly until new benefit year (effective January 1, 2009)
(Millions)
Adjusted Consolidated EBITDA
(1)
$
79.3
$
88.3
(2)
$
254.1
$
234.8
(2)
3rd Qtr.
2008
3rd Qtr.
2007
9 Months
2008
9 Months
2007

Adjusted Income per Share Results
(1)
Reconciliation to GAAP provided on slide 20 and slide 22
(2)
Q3 2007 calculated ignoring the antidilutive impact of negative EPS
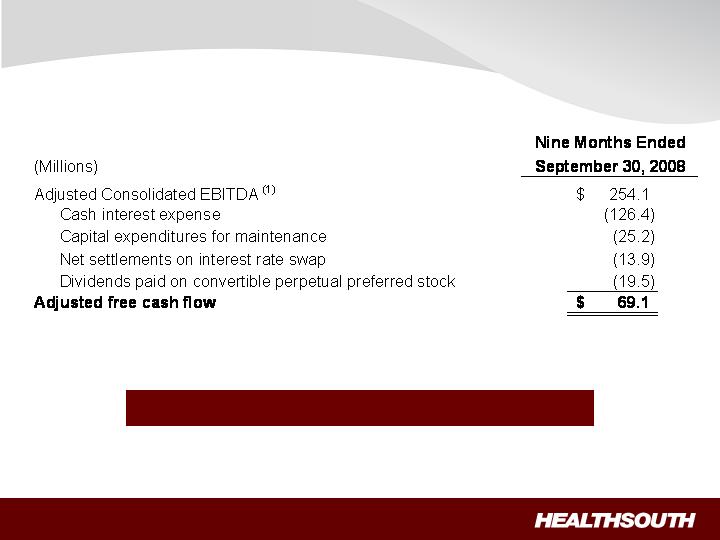
Free Cash Flow Year to Date
Strong Normalized Free Cash Flow
(1)
Reconciliation to GAAP provided on slide 22 and slide 26
(2)
Includes capital expenditures for the refresh programs
(2)

Liquidity
(Millions)
(1)
Letters of credit will be reduced by $33.6 million when we have court approval of the UBS settlement
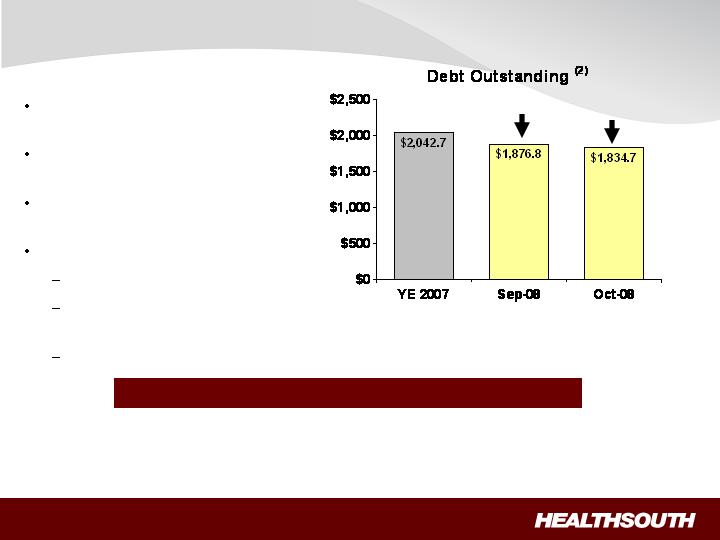
Debt Reduction
(Millions)
Significant debt reduction since
2004
$208 million paid down in first 10
months of 2008 (1)(2)
No near-term refinancing
requirements
Future debt reduction from:
Excess cash from operations
Additional income tax
recoveries
Derivative proceeds
$165.9
$208.0
Debt to EBITDA on September 30, 2008 = 5.5X ; Target = 4.5X
(1)
Credit Agreement limits debt pay down on non–term loan balances to $50 million per year with the addition of a lifetime
basket of $100 million. As of Sept. 30, 2008, the $50 million yearly limit had been reached for 2008, and we have used
approximately 1/3 of the $100 million lifetime basket.
(2)
A reconciliation can be found on slide 19
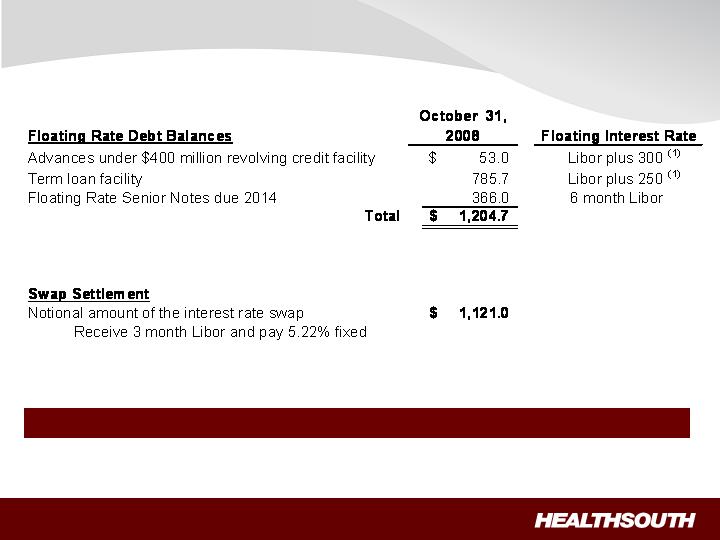
Interest Expense and Swap Settlements
(Millions)
As of September 30, 2008, we were in compliance with the covenants under our Credit Agreement.
(1)
We have the flexibility to peg 1,2,3 or 6 month Libor, or prime

Development Growth YTD
(2)
(1)
Plan to work with a developer to obtain a lease arrangement
(2)
CON is being appealed; Operational Date may change
154 additional beds in total, 34 of which apply to third quarter 2008
Revenue contribution starting in Q3 2008 through Q3 2010
Location
Announced
Type of Investment
Installed Beds
Operational
Date
Vineland, NJ
Aug-08
Acquisition of free
standing
34 Beds
Q3 2008
Arlington, TX
Aug-08
Acquisition and
consolidation
n/a
Q3 2008
Midland, TX
Sep-08
Acquisition and
consolidation
n/a
Q3 2008
Marion County, FL
Aug-08
De novo
(1)
40 Beds
3Q 2010
Loudoun County, VA
Aug-08
De novo
40 Beds
2Q 2010
Mesa, AZ
Oct-08
De novo
(1)
40 Beds
3Q 2009

Appendix

Outstanding Share Summary
(Millions)
3rd Qtr.
2008
3rd Qtr.
2007
9 Months
2008
9 Months
2007
Basic shares outstanding
(2)(3)
87.4
78.5
81.6
78.6
Diluted shares outstanding
(1)(2)(3)
101.0
91.8
95.1
91.9
Basic shares outstanding
(2)(3)
88.0
78.6
88.0
78.6
Diluted shares outstanding
(1)(2)(3)
101.6
91.9
101.5
91.9
Notes:
3) Does not include approximately 5.0 million shares of common stock and warrants to purchase
approximately 8.2 million shares of common stock at a strike price of $41.40 to settle our class action
securities litigation. This agreement received final court approval on January 11, 2007. As of September
30, 2008, these shares of common stock and warrants have not been issued and are not included in our
basic or diluted common shares outstanding. We expect a ruling in the first quarter 2009. If the
judgement is affirmed, the distribution would occur in the first half of 2009.
Average for the Period
End of Period
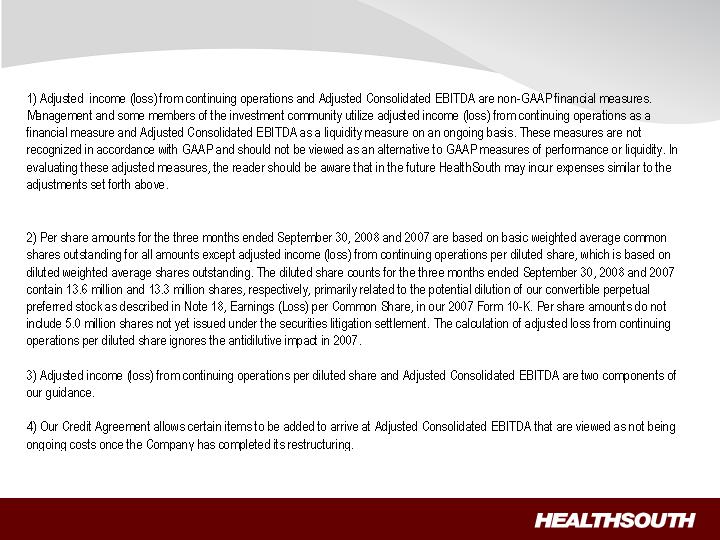
1) Potential shares for the three months ended September 30, 2008 and 2007, were 13.6 million and 13.3
million, respectively, and for the nine months ended September 30, 2008 and 2007, were 13.5 million and
13.3 million, respectively, and were primarily related to our convertible perpetual preferred stock.
2) Does not include warrants issued in connection with a January 2004 loan repaid to Credit Suisse First
Boston. In connection with this transaction, we issued warrants to the lender to purchase two million
shares of our common stock. Each warrant has a term of ten years from the date of issuance and an
exercise price of $32.50 per share. The warrants were not assumed exercised for dilutive shares
outstanding because they were antidilutive in the periods presented.

Debt Schedule
Debt to EBITDA on September 30, 2008 = 5.5X ; Target = 4.5X
(1)
Credit Agreement limits debt pay down on non–term loan balances to $50 million per year with the addition of a lifetime
basket of $100 million. As of Sept. 30, 2008, the $50 million yearly limit had been reached for 2008, and we have used
approximately 1/3 of the $100 million lifetime basket.
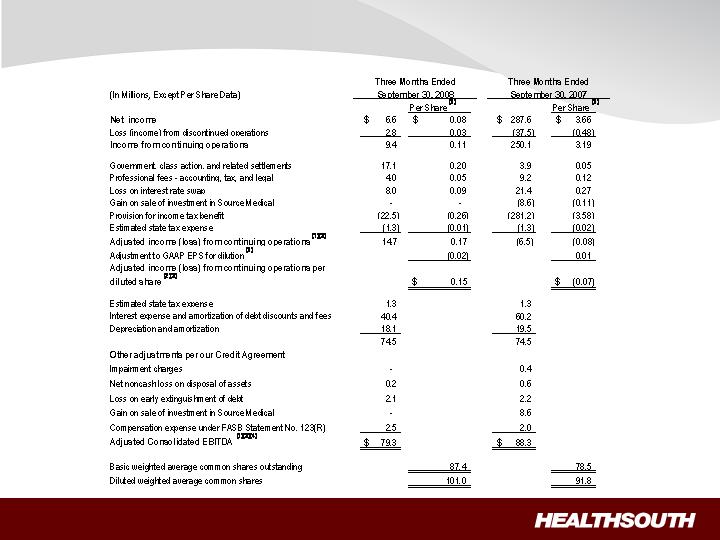
Q3 2008 Reconciliation of Net Income to Adjusted Income from Continuing
Operations and Adjusted Consolidated EBITDA (1)(3) – (Notes on following page)
Q3 2008 Reconciliation of Net Income to Adjusted Income from Continuing
Operations and Adjusted Consolidated EBITDA – Notes
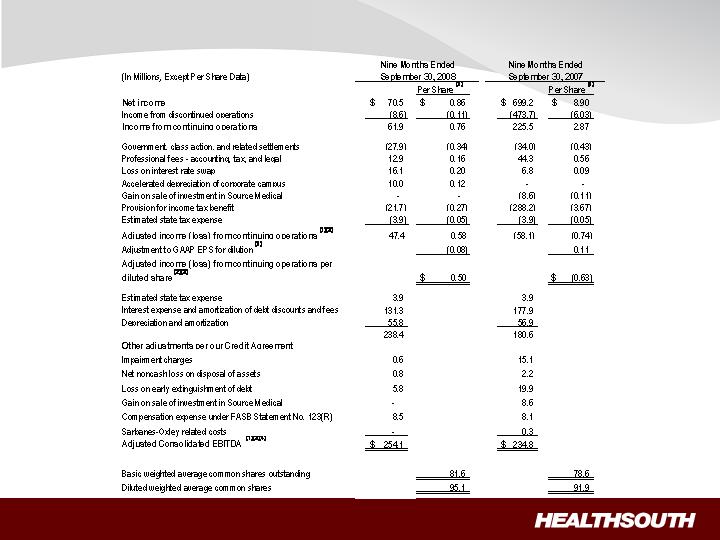
9 Months 2008 Reconciliation of Net Income to Adjusted Income from Continuing
Operations and Adjusted Consolidated EBITDA (1)(3) – (Notes on following page)

9 Months 2008 Reconciliation of Net Income to Adjusted Income from Continuing
Operations and Adjusted Consolidated EBITDA – Notes
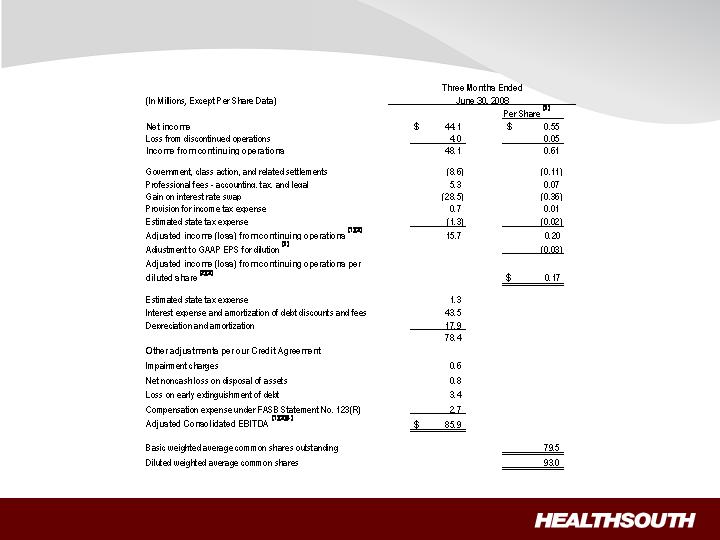
Q2 2008 Reconciliation of Net Income to Adjusted Income from Continuing
Operations and Adjusted Consolidated EBITDA (1)(3) – (Notes on following page)
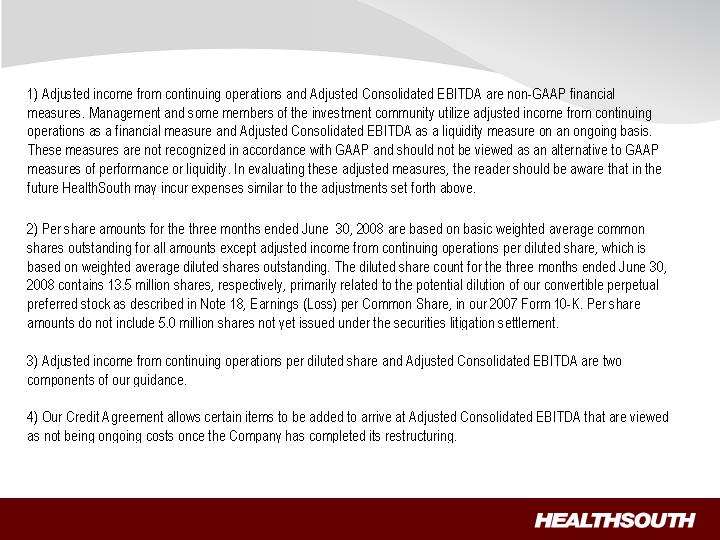
Q2 2008 Reconciliation of Net Income to Adjusted Income from Continuing
Operations and Adjusted Consolidated EBITDA – Notes
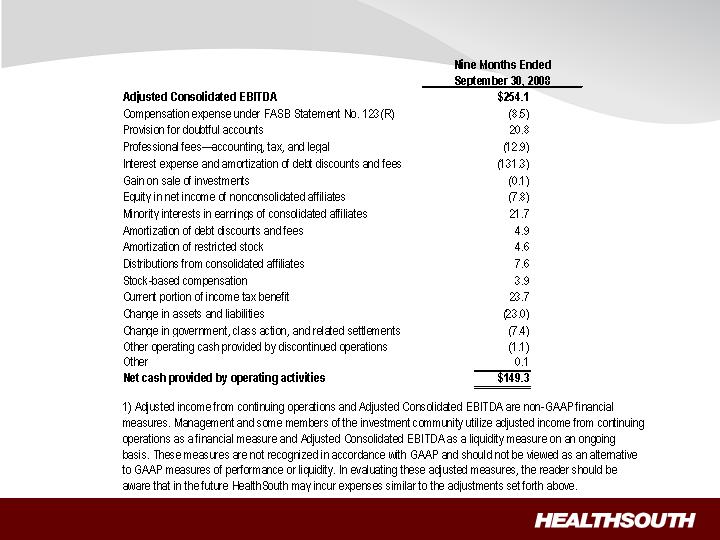
9 Months 2008 Reconciliation of Adjusted Consolidated EBITDA(1) to Net Cash
Provided by Operating Activities