
HealthSouth
Investor Day
November 10, 2008
Exhibit 99.1

Note Regarding Forward-Looking Statements
The information contained in this presentation includes certain estimates, projections and other forward-
looking information that reflect our current views with respect to future events and financial performance.
These estimates, projections and other forward-looking information are based on assumptions that
HealthSouth believes, as of the date hereof, are reasonable. Inevitably, there will be differences between
such estimates and actual results, and those differences may be material.
There can be no assurance that any estimates, projections or forward-looking information will be realized.
All such estimates, projections and forward-looking information speak only as of the date hereof.
HealthSouth undertakes no duty to publicly update or revise the information contained herein.
You are cautioned not to place undue reliance on the estimates, projections and other forward-looking
information in this presentation as they are based on current expectations and general assumptions and are
subject to various risks, uncertainties and other factors, including those set forth in our Form 10-Q for the
quarters ended March 31, 2008, June 30, 2008, and September 30, 2008, Form 10-K for the fiscal year
ended December 31, 2007, and in other documents we previously filed with the SEC, many of which are
beyond our control, that may cause actual results to differ materially from the views, beliefs and estimates
expressed herein.
Note Regarding Presentation of Non-GAAP Financial Measures
The following presentation includes certain “non-GAAP financial measures” as defined in Regulation G
under the Securities Exchange Act of 1934. The Appendix at the end of this presentation includes
reconciliations of the non-GAAP financial measures found in the following presentation to the most directly
comparable financial measures calculated and presented in accordance with Generally Accepted
Accounting Principles in the United States. Our Form 8-K, dated November 10, 2008, to which the following
presentation slides are attached as Exhibit 99.1, provides further explanation and disclosure regarding our
use of non-GAAP financial measures and should be read in conjunction with these presentation slides.
Cautionary Statements

HealthSouth Leadership
Jay Grinney
President and Chief Executive Officer
John Workman
Executive Vice President and Chief Financial Officer
Mark Tarr
Executive Vice President, Operations
John Whittington
Executive Vice President, General Counsel and Secretary

8:30 a.m. Strategy and Landscape
Questions and Answers
9:40 a.m. Break
9:45 a.m. Operational Model
Questions and Answers
10:40 a.m. Break
10:45 a.m. Financial Model
Questions and Answers
11:50 a.m. Litigation Update
Questions and Answers
12:00 p.m. Closing Remarks
Questions and Answers
Agenda
Jay Grinney
Mark Tarr
John Workman
John Whittington
Jay Grinney

Strategy and Landscape
Jay Grinney – President and Chief Executive Officer
Topics Covered:
HealthSouth: Past and Present
Post-Acute Industry and Inpatient
Rehabilitation Sector
Strategy and Business Model
Political & Regulatory Landscape
Investment Considerations
Questions and Answers

HealthSouth Today
IRH
LTCH
93 Rehabilitation Hospitals and
Outpatient Departments
6 LTCH Hospitals
55 Outpatient Satellites
25 Hospital-Based Home
Health Agencies
Operational Components
$1.38B Net Operating Revenues
$254.1M Adj. Consolidated EBITDA
$47.4M Adj. Income from Continuing Ops.
$0.50 Adj. EPS from Continuing Ops.
Q3 YTD Key Statistics
Largest Provider of Inpatient Rehabilitative Healthcare Services in the U.S.
Development Sites
Employees: 22,000
Corporate Office: Birmingham, AL
Exchange (Symbol): NYSE (HLS)
(1) Reconciliation to GAAP provided on slide 61

June
2007
December
2007
December
2005
June
2006
December
2006
HealthSouth spent over $1 billion to effect turnaround
Settlement payments (CMS, DOJ, OIG, SEC)
Reconstruction / restatement of financial statements (1+ million man-hours)
December
2004
Reached
SEC
Settlement
Filed 2000 –
2003 Form
10-K
Secured New
Bank Credit
$2.55B
Completed $1B
Senior Notes
Offering
Announced
Divestitures
$440M Tax
Recovery
Received
Relisted on
NYSE
Completed
Divestitures
All Settlements
Paid in Full
Reached
Securities
Litigation
Settlement
Corporate
Campus Sold
Turnaround Complete
Cured Bank
Defaults
Reached
DOJ/CMS
Settlement
June
2005
Cured
Bond
Defaults

Healthcare Services Continuum
Wellness
Programs
Disease
Management
Genetic
research
O/P Surgery
O/P Imaging
O/P Rehabilitation
Renal dialysis
O/P Cardiac
O/P Laboratory
General, acute
care hospitals
Specialty hospitals
(e.g. Cardiac,
Orthopedic, etc)
Inpatient
Rehabilitation
Long-term acute
care
Home Health
Hospice
Skilled Nursing
Preventive
Ambulatory
(Outpatient)
Acute-Care
Post-Acute

Post Acute Industry Components
(1) Source: MedPAC, A Data Book: Healthcare Spending and the Medicare Program, June 2008 (Section 9).
(2) These percents are Medicare spending only and do not include beneficiary copayments or other payors.
2007 Medicare Spending $45.1 Billion

IRF Segment: Fragmented Industry
Total Inpatient Rehabilitation
Facilities (IRF): 1,201
Total Free-Standing Inpatient
Rehabilitation Hospitals: 218
(HLS = 43%)
Total Inpatient Rehabilitation Revenue: ~$9 Billion
(1) Source: Medpac, Modern Healthcare, press releases and internal analysis
5
Vibra (Private)
125
93
All others
2
Reliant (Private)
Facilities
Free-Standing
Competitor Examples
2
Gulf States (Private)
2
Five Star Quality Care
(Public)
4
Centerre (Private)
5
Select (Private)
6
RehabCare (Public)
6
Ernest (Private)
Hospital-Based
983 (82%)
Free-
Standing
HealthSouth
93 (8%)
Other
125 (10%)

Projected percentage of US population
65 years or older through 2050(1)
(1) Source: US Census Bureau, 2004
(2) Source: Medicare Provider Analysis and Review File (2004); Claritas
Projected Medicare Compliant
Case Growth(2)
IRF Segment: Aging Demographics = Increased
Demand
Demand for post-acute services will
increase as the U.S. population ages.
“Compliant Cases” are expected to grow
~2% per year for the foreseeable future,
creating an attractive market.
+22%

Strategy:
To create shareholder value as the preeminent provider of
rehabilitative care in the U.S. by:
Creating a strong balance sheet through deleveraging;
Driving organic growth through operational excellence; and
Disciplined opportunistic growth.
Longer term, we will pursue complementary acquisitions in the
areas of Long-Term Acute Care Hospitals, Home Health, and / or Hospice
provided they are accretive to HealthSouth.
Target 5-8% annual Adjusted Consolidated EBITDA growth
Margins will expand modestly
Target 15-20% annual Adjusted EPS growth

Achieve leverage
of 4.5X or below
by 12/31/10
Target ~ $35M
maintenance
CAPEX
Target $15-20M for
bed expansion
Disciplined
opportunistic
growth
Ensure hospital
leadership inspires
/ motivates all
constituents
Differentiate by
being the
“Employer of
Choice”
Standardize best
practices; deploy
through
TeamWorks
Maintain
commitment to
Compliance and
Internal Controls
Define, and excel
in, standards of
care
Measure clinical
outcomes and
drive continuous
improvement
Integrate the
patient and family
experience into
the treatment plan
Grow market
share in all
markets
Differentiate
through
exceptional clinical
quality and patient
experience
Build local
HealthSouth
“brand”
Target 4+% annual
Same Store
Discharge growth
Target 4±% annual
growth in SWB
Performance
Market
Position
Clinical Focus
Organizational
Culture
Business Model
Balance Sheet
1
~ $5-10M
infrastructure
enhancements
Consolidations /
Acquisitions
“CAPEX lite” de
novos

Highlights…
HealthSouth has increased volumes, while competitors
have shown declines.
Change is Same-Store Discharges of HLS vs Non-HLS UDS Sites(1)
% in
Discharges
(1) Data provided by UDS MR, a data gathering and analysis organization for the rehabilitation industry; represents ~ 65-70% of industry.
N/A

Highlights…
HealthSouth has added new hospitals.
(2)
(1) Plan to work with a developer to obtain a lease arrangement
(2) CON is being appealed; Operational Date may change
154 additional beds in total, 34 of which apply to third quarter 2008
Revenue contribution starting in Q3 2008 through Q3 2010
Location
Announced
Type of Investment
Installed Beds
Operational
Date
Vineland, NJ
Aug-08
Acquisition of free
standing
34 Beds
Q3 2008
Arlington, TX
Aug-08
Acquisition and
consolidation
n/a
Q3 2008
Midland, TX
Sep-08
Acquisition and
consolidation
n/a
Q3 2008
Ocala, FL
Aug-08
De novo
(1)
40 Beds
3Q 2010
Loudoun County, VA
Aug-08
De novo
40 Beds
2Q 2010
Mesa, AZ
Oct-08
De novo
(1)
40 Beds
3Q 2009

Highlights…
HealthSouth has repaid significant debt and reduced its
leverage.
Debt Outstanding
(in millions)
$208.0
Debt to Adjusted
Consol. EBITDA 6.3x 5.5x
(1) Reconciliation to GAAP provided on slide 45

Political and Regulatory Landscape: “How the
sausage is made…”
NOTE: CMS provides recommendations to HHS on Medicare and Medicaid policies / regulations
(e.g. Congress establishing
new IRF payment
methodology)
Healthcare
Policy &
Regulations
Health &
Human
Services
Legislative
Directive
President’s
Annual Budget
Legislative
Authority
(e.g. Congress directing
CMS to change 75%
threshold)
CMS solicits public input to proposed new policies via Publication of Notice of Proposed
Rulemaking (“NPRM”)
CMS sponsors “Open Door Meetings”
Final Rules published after comment period
Provides opportunity
for industry input
=

Political and Regulatory Landscape: Looking
forward
CMS’s IRF-PPS staff currently focusing on report required by
Medicare, Medicaid and SCHIP Extension Act of 2007 (“MMSEA”)
Impact of 75% Rule on access to care
Alternatives / refinements to Rule
Analyzing types of patients best served by IRFs
HealthSouth is active in numerous industry advocacy groups
1.
American Hospital Association (“AHA”)
2.
American Medical Rehabilitation Providers Association (“AMRPA”)
3.
Federation of American Hospitals (“FAH”)
4.
Acute Long-Term Hospitals Association (“ALTHA”)
5.
State Hospital Associations
For Fiscal Year 2010, no major regulatory /
policy modifications are expected for IRFs

Investment Considerations:
Turnaround Complete: all “legacy issues” resolved,
management focused on operations and growth
Strong Cash Flows: CAPEX spend is discretionary
Deleveraging as Priority: reduce leverage to 4.5x or less by
YE 2010
Solid Organic Growth: TeamWorks initiative will help us
meet or exceed our EBITDA targets
Expand opportunistically in a disciplined manner
Focus: Delivering shareholder value
through strong EPS growth

Questions & Answers

HealthSouth
Investor Day
BREAK (Back at 9:45 a.m. EST)

Operational Performance
Topics Covered:
Our Business – “The Basics”
“Typical” HealthSouth Rehab Hospital
Patients We Serve
Payors and Reimbursement Methodologies
Sources of Patients
Explained
Our Competitors
IRF vs SNF
Quality Measures
Operational Agenda (2009 – 2011)
Mark Tarr – Executive Vice President, Operations
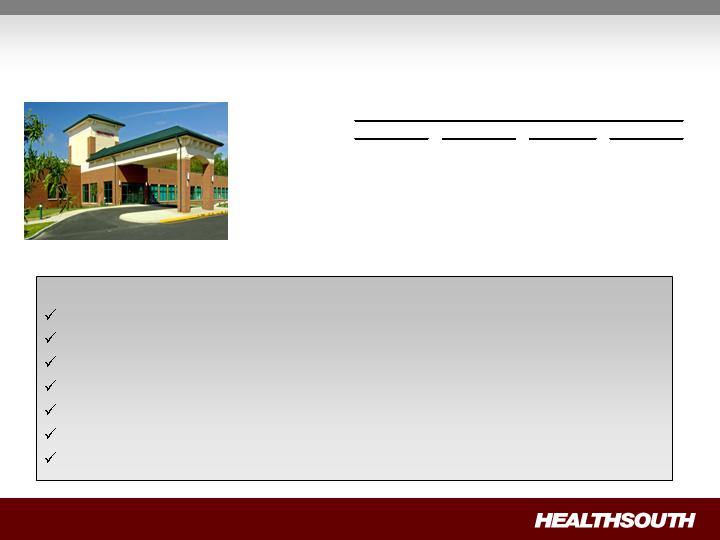
“The Basics”: What is a “typical” HealthSouth
rehabilitation hospital?
Major Services
Physician: manages and treats medical needs of patients
Rehabilitation Nursing: oversees treatment program of patient
Physical Therapy: addresses physical function, mobility, safety
Occupational Therapy: promotes independence and re-integration
Speech-Language Therapy: treats communication & swallowing disorders
Case Manager: coordinates care plan with physician, caregivers, family
Post-discharge services: outpatient therapy and home health
(1) We have seven hospitals of less than 40 beds
Number
(1)
37
31
8
10
Ave. FTEs
128
178
174
263
Ave. Net Rev.
$
11.2
$
15.8
$
15.8
$
22.5
(millions)
Bed Size
40 - 60
61 - 80
81 - 90
91+

Medicare Inpatient Rehabilitation Categories (RICs)
“The Basics”: What Kind of Patients Do We Treat?
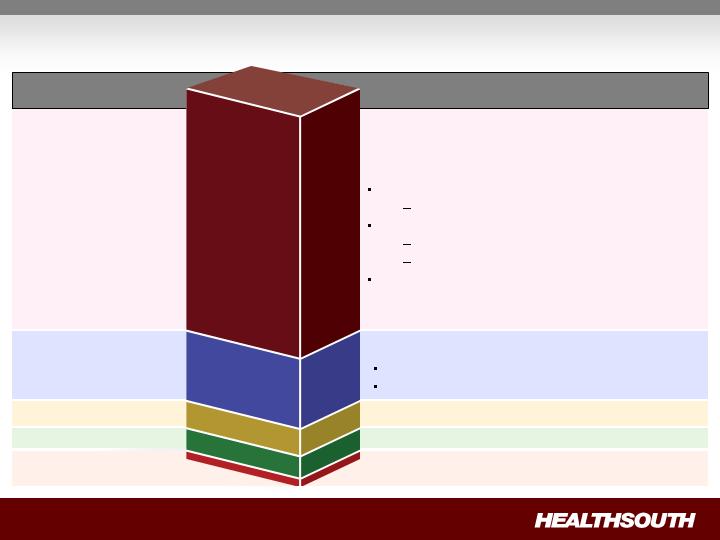
“The Basics”: Who Pays Us and How Are We Paid?
Prospective Payment Systems (“PPS”)
Payments based on Case Mix Groups (“CMGs”)
Diagnosis of patient’s illness
Fixed payment per CMG adjusted for:
Acuity / severity
Regional wage differential
Per diems for “short stays”
Variety of methodologies
Varies by State
Variety of methodologies
Medicare
67.2%
Managed Care
19.0%
Other Third-Party Payors
6.9%
Medicaid 2.2%
Workers’ Comp /
Patients / Other 4.7%
Q3 YTD Payor Mix
Payment Methodology
Per Diem
Negotiated rate
Some are “tiered” for acuity/severity
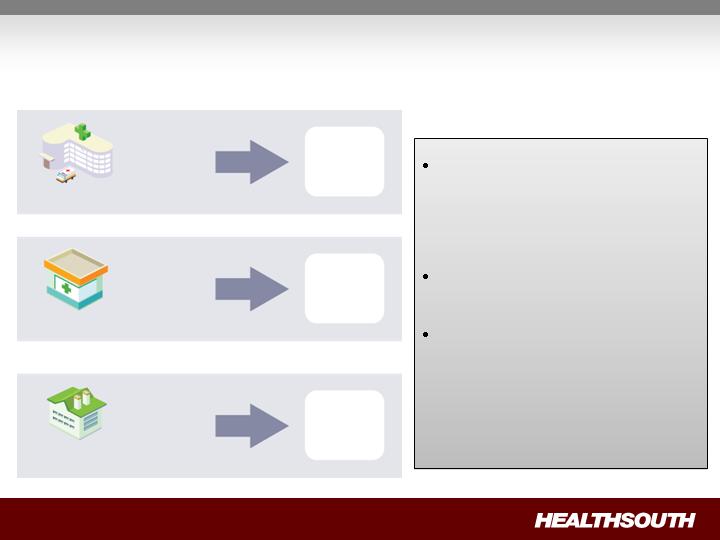
Acute care hospital
attending physician and
Case Managers play key
role
All IRF patients must meet
medical necessity criteria
All IRF patients must be
medically stable and have
potential to tolerate three
hours of therapy per day
(minimum)
“The Basics”: How Do We Get Our Patients?
94%
5%
1%
Referral Source
Acute Care Hospitals
Physician Offices
Skilled Nursing Facilities
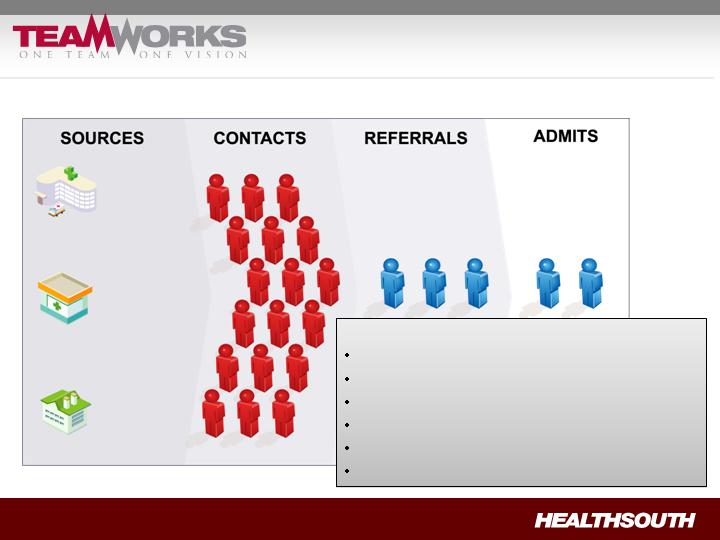
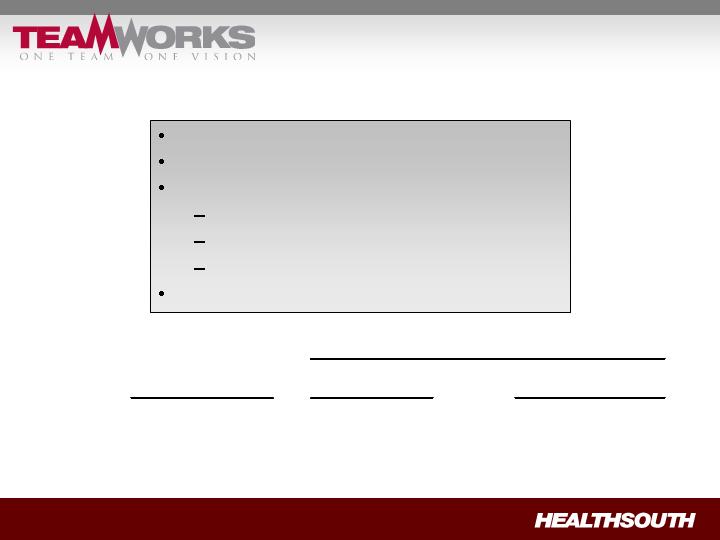
= Standardized Best Practices
Phase One: Sales and Marketing
What We Did:
Flowcharted activities
Assigned HLS “experts” to drive process
Streamlined processes
Created new job descriptions
Decentralized decision-making
Developed comprehensive reporting
Acute Care Hospitals
Physician Offices
Skilled Nursing Facilities
(cont’d)
Piloted in nine hospitals
Made adjustments / refinements
Began roll-out in Q4 2007
Realigned and trained employees
Aligned compensation / rewards
Monitored results
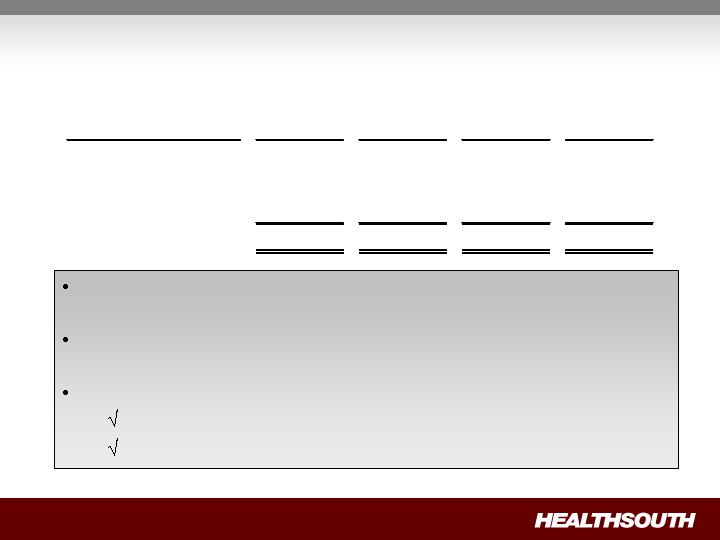
Full installation effect seen after 60 days
Implementation
Cumulative # of
Hospitals Fully
Installed
Quarter-over-
Quarter
Year-to-Date
Q1 2008
44
2.6%
2.6%
Q2 2008
76
5.6%
4.1%
Q3 2008
92
9.3%
5.8%
% Increase in Total Discharges (All Hospitals)
Our Hospitals Still Have Room for Growth
Number of Hospitals at Varying Occupancy Levels
Hospitals with greater than 85% occupancy are candidates for
bed expansion
We expect to add 65-75 beds by the end of 2009 and at least
another 44 beds in 2010
Average cost per bed:
With new construction = $100 – 250K
Internal renovation, only = $15 – 45K
(1)
(1) Includes Vineland, NJ and excludes Dallas, TX
Occupancy
Q4 2007
Q1 2008
Q2 2008
Q3 2008
High (85% or greater)
10
22
17
16
Medium (60% to 85%)
42
37
42
43
Low (Less than 60%)
41
34
34
34
Total
93
93
93
93
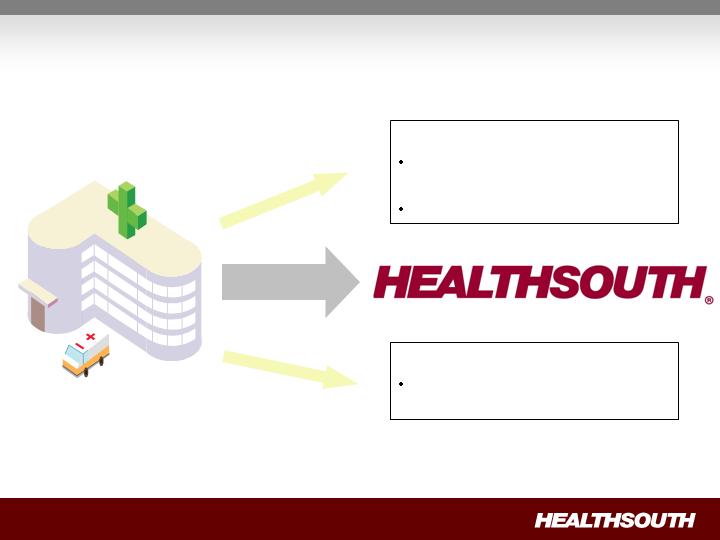
“The Basics”: Who Are Our Competitors?
Competitor IRFs
Typically smaller units (10–20
beds) inside acute care hospital
Often are orthopedic–focused
Nursing Homes
Primarily treat simple knee / hip
replacements
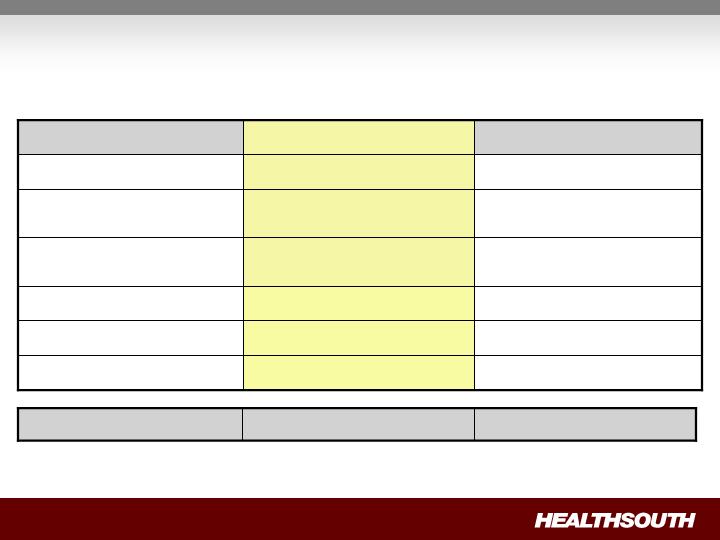
“The Basics”: How Are We Different (Better!) Than
Nursing Homes?
8 consecutive hours per day (min.)
24 hours per day
RN oversight and availability
None
Rehabilitation specialty expertise
Nursing training, expertise
2.5 – 4.0
5.0 – 7.5
Nursing hours per patient per day
Not required
Required
MD or DO designated as
Rehabilitation Director
Not required
Required; 3 hour (min.) therapy per
day
Multi-disciplinary team approach;
coordinated Program of Care
Once every 30 days (min.)
4+ times per week
Attending physician visits
Nursing Home
Inpatient Rehabilitation Hospital
Service
~ 15 days
~ 30 days
Average Length of Stay
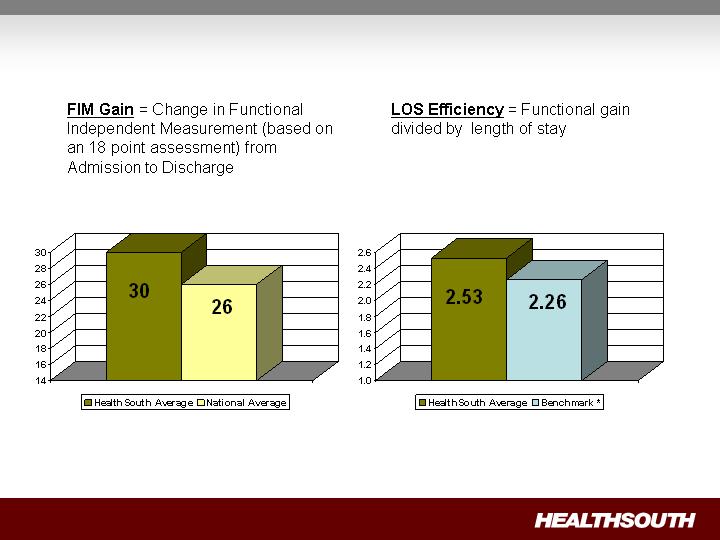
FIM Gain
LOS Efficiency
Source: UDSmr Database – On Demand
Reports – YTD September 2008
* Benchmark = Expected, Risk Adjusted LOS Efficiency
“The Basics”: How Do We Measure Quality?
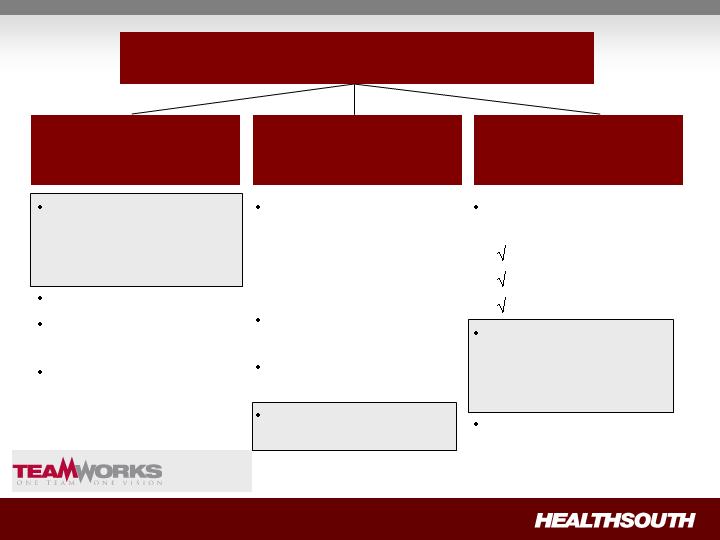
– Phase II
Operational Objectives (2009 – 2011)
Most effective
processes:
Clinical
Support
Financial
Highest productivity
and most effective
labor management
programs
Paperless and
automated
Customized clinical
experience through
differentiated intake
and assessment
process
Best total family
experience
Most prepared patients
(education, etc.)
Highest satisfaction
rating
Best quality and
outcomes with in
targeted clinical
treatment categories
Highest FIM gain
Minimize practice
variability
Best care coordination
Clinical Excellence
(Target: Stroke, Hip Fracture, Joint
Replacement, Spine/Neurological
Conditions and Cardiac)
Efficient Operations
Differentiated Service

Questions & Answers

HealthSouth
Investor Day
BREAK (Back at 10:45 a.m. EST)

Key Financial Information
Topics Discussed:
YTD Earnings and Adjustments
Revenue & Expense Trend
Free Cash Flow
Liquidity
Use of Cash
Debt Reduction
Interest Expense and Swap Settlements
Government, Class Action, and Related Settlements
Tax Refunds & NOL’s
Questions and Answers
John Workman – Executive Vice President, CFO
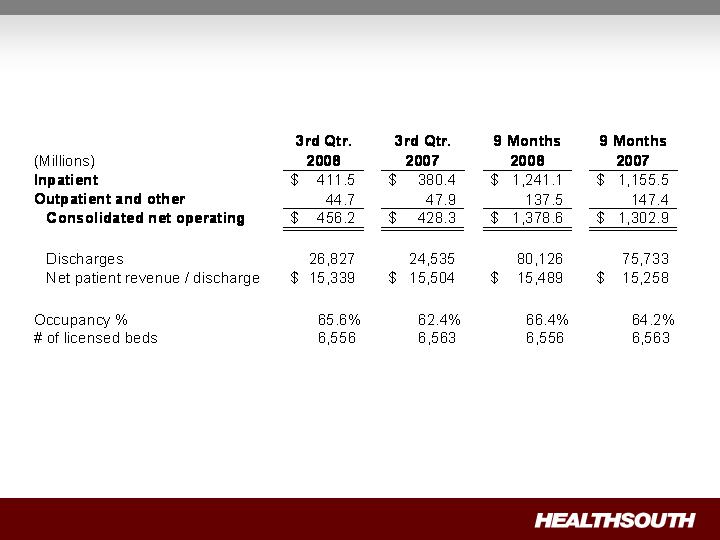
Revenues

Adjusted Consolidated EBITDA Results
(1) Reconciliation to GAAP provided on slide 59 and slide 61
(2) Includes an $8.6 million gain on the sale of our investment in Source Medical
(3) Adjusted EBITDA guidance was revised upward in the second quarter 2008 earnings release
No change; benefit and nonproductive labor costs (e.g. PTO accruals) won’t change
significantly until new benefit year
(Millions)
Adjusted Consolidated EBITDA
(1)
$
79.3
$
88.3
(2)
$
254.1
$
234.8
(2)
3rd Qtr.
2008
3rd Qtr.
2007
9 Months
2008
9 Months
2007
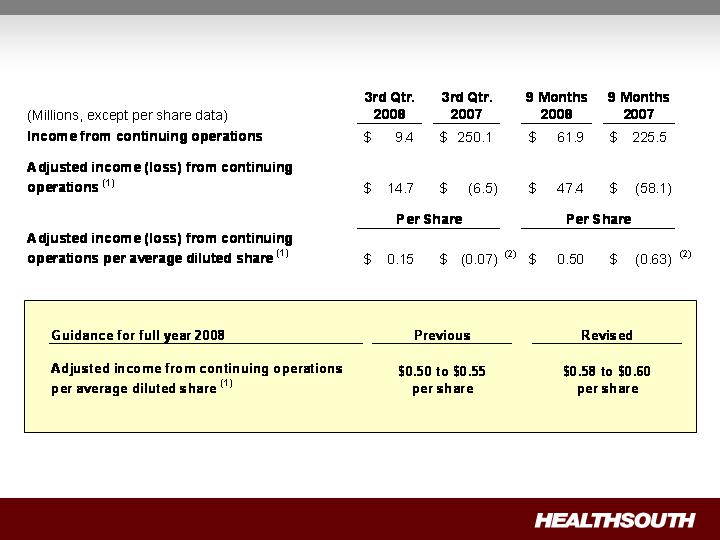
Adjusted Income per Share Results
(1) Reconciliation to GAAP provided on slide 59 and slide 61
(2) Q3 2007 calculated ignoring the antidilutive impact of negative EPS
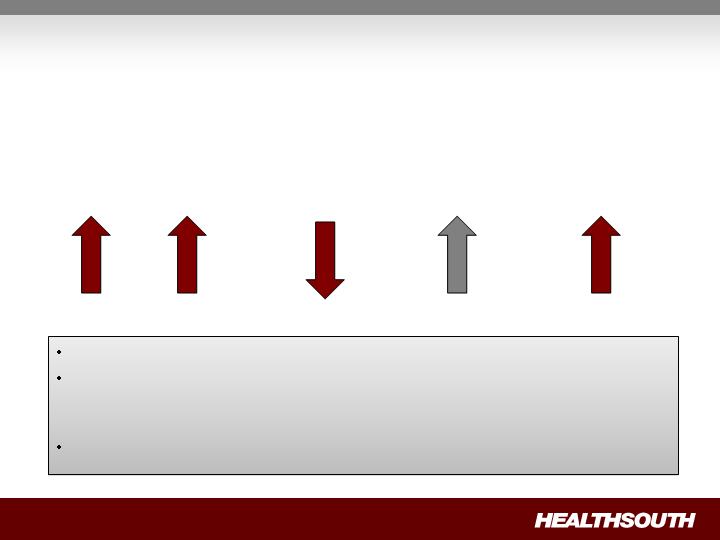
Nine Months 2008 Statistics
Revenue Volume Occupied Bed FTE EBITDA
+ 5.8% +5.8% -2.4% 7.6% 8.2%
Revenue and volume reflecting strong growth.
Improving productivity (EPOB) helps to offset increase in salaries
and benefits per employee. Actions being taken (including benefits
and PTO) to mitigate cost per employee rise.
On a year-to-date basis, margin rate has improved.
Employees per SWB per Adjusted
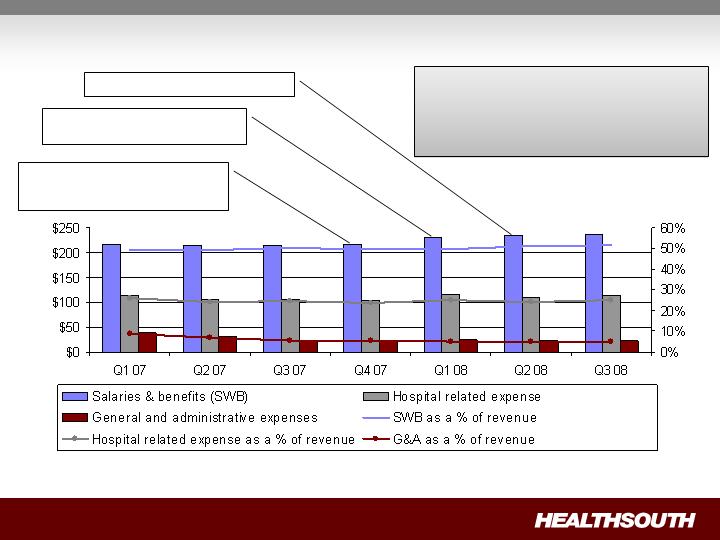
Expense Trend
Q4 07 ~2.8% CMS price increase;
3.7% employee merit increase
Q2 08 ~2.8% CMS price roll back
Q1 08 – Employee benefit
enhancement and consolidation
Some modifications made to benefit
plans on November 15, 2008 with
additional modifications on
January 1, 2009
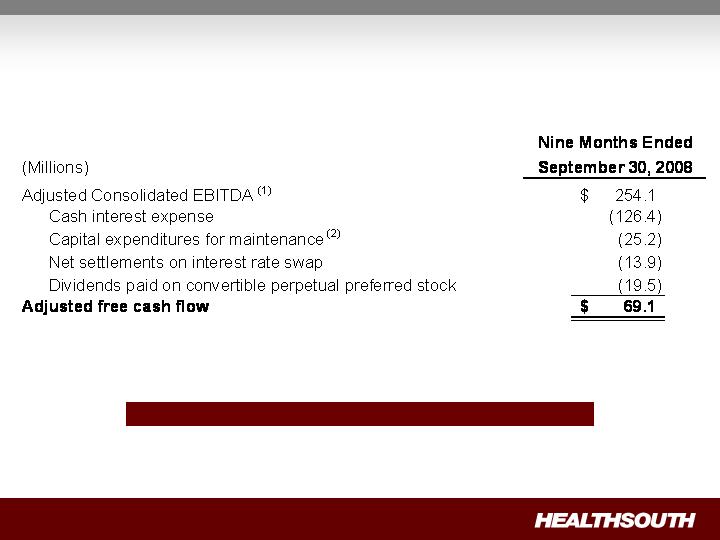
Free Cash Flow Year-to-Date
Strong Normalized Free Cash Flow
(1) Reconciliation to GAAP provided on slide 61 and slide 63
(2) Includes capital expenditures for the refresh program
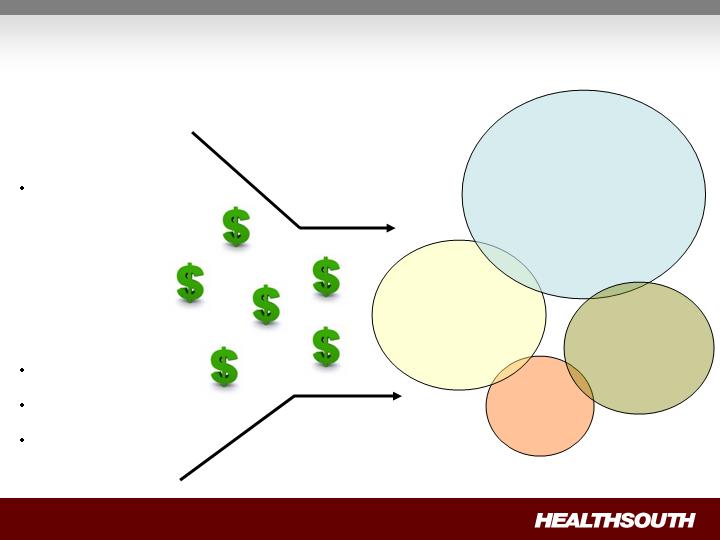
Sources and Uses of Cash
Operating Cash
Cash flow from
operations
Non-operating Cash
Tax refunds
Derivative proceeds
Digital Hospital
proceeds
De novo’s
Acquisitions/
Consolidations
Debt
Reduction
Bed
Expansions
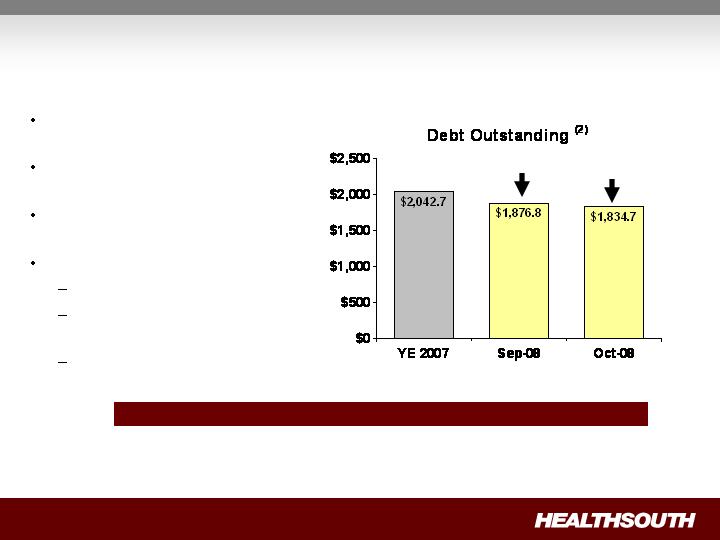
Debt Reduction
(Millions)
Significant debt reduction since
2004
$208 million paid down in first 10
months of 2008(1)(2)
No near-term refinancing
requirements
Future debt reduction from:
Excess cash from operations
Additional income tax
recoveries
Derivative proceeds
$165.9
$208.0
Debt to EBITDA on September 30, 2008 = 5.5X ; Target = 4.5X
(1) Credit Agreement limits debt pay down on non–term loan balances to $50 million per year with the addition of a lifetime basket of $100 million. As
of Sept. 30, 2008, the $50 million yearly limit had been reached for 2008, and we have used approximately 1/3 of the $100 million lifetime basket.
(2) A reconciliation can be found on slide 45
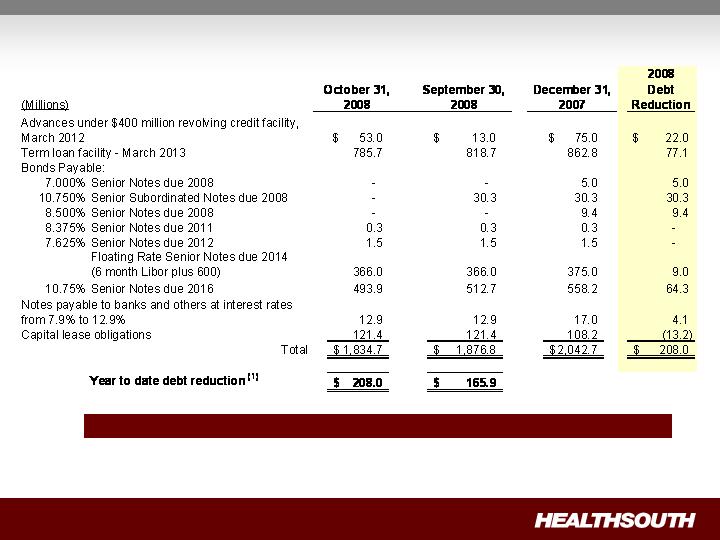
Debt Schedule
Debt to Adj. Consol. EBITDA on September 30, 2008 = 5.5X ; Target = 4.5X
(1) Credit Agreement limits debt pay down on non–term loan balances to $50 million per year with the addition of a lifetime basket of $100 million.
As of Sept. 30, 2008, the $50 million yearly limit had been reached for 2008, and we have used approximately 1/3 of the $100 million lifetime basket.
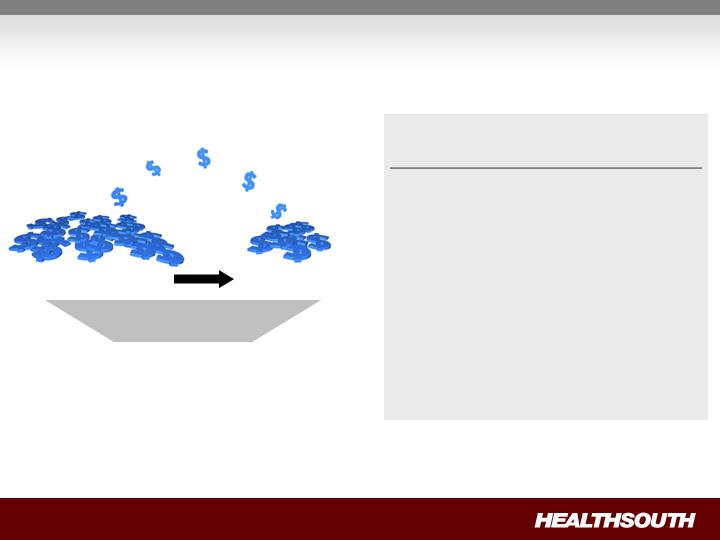
The Value of Debt Pay Down
Lower Interest Expense =
Higher EPS
Debt = $50 million
Interest Rate = 10.75%
Federal Taxes = 0
Earnings Per Basic Share = $0.06
Net Debt
Equity
Debt pay down increases
equity value
Enterprise Value

De novo: 40–Bed Proforma Example
(1) Does not include estimated corporate overhead of ~4.75% of net operating revenues.
(2) Assumes state income taxes only for first five years, then federal and state income taxes.
De novo’s attractive for future growth.
We evaluate based on commitment (cash or leased).
Leasing maximizes cash-on-cash returns in uncertain economy.
Revenue
EBITDA
%
(1)
Revenue
EBITDA
%
(1)
Year 1
8,500
$
1,275
$
15%
8,500
$
150
$
2%
Year 2
10,500
2,500
24%
10,500
1,300
12%
Run-Rate
11,500
2,900
25%
11,500
1,575
14%
Cash Investment
Five-Year Investment Return
76%
172%
Internal Rate of Return
(2)
14%–18%
Build and Fund
Leased Real Estate
$15,000–$17,000
$3,000–$4,000
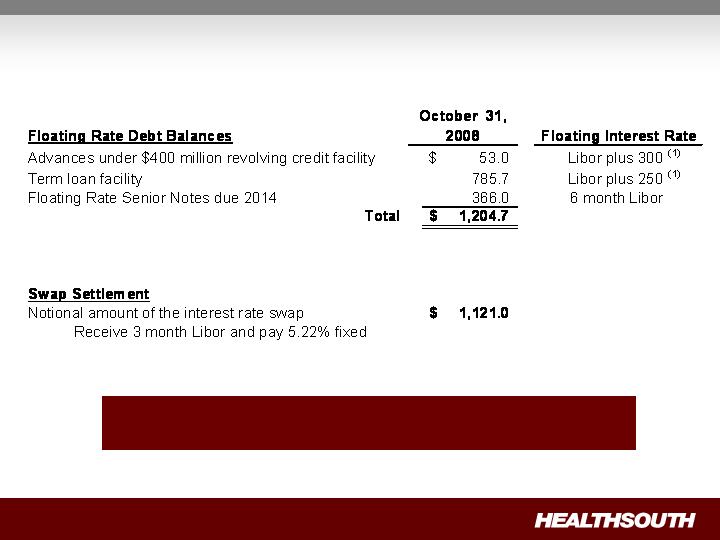
Interest Expense and Swap Settlements
(Millions)
As of September 30, 2008, we were in compliance with the
covenants under our Credit Agreement.
(1) We have the flexibility to peg 1,2,3 or 6 month Libor, or prime
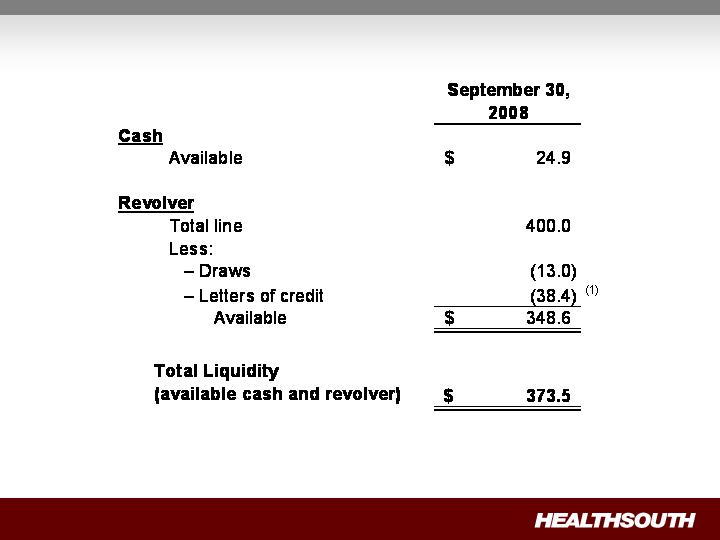
Liquidity
(Millions)
(1) Letters of credit will be reduced by $33.6 million when we have court approval of the UBS settlement
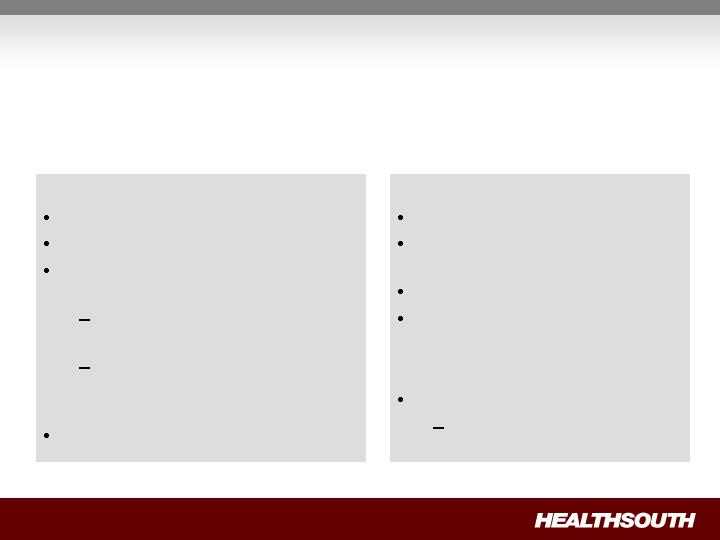
As Settled
Liability goes to “0”
Shareholders equity (paid in
capital) goes up
Outstanding shares go up
Cash effect “0”
Expected Settlement Date
2009
Currently under Appeal
Government, Class Action, and Related Settlements
Today
Under appeal
Shares are not issued
Change in fair value flows
through income statement
Share price goes up, liability
and expense go up
Share price goes down,
liability and expense go
down
Cash effect “0”
The class action Securities Litigation Settlement included 5.0
million shares of common stock and 8.2 million warrants at a strike
price of $41.40.
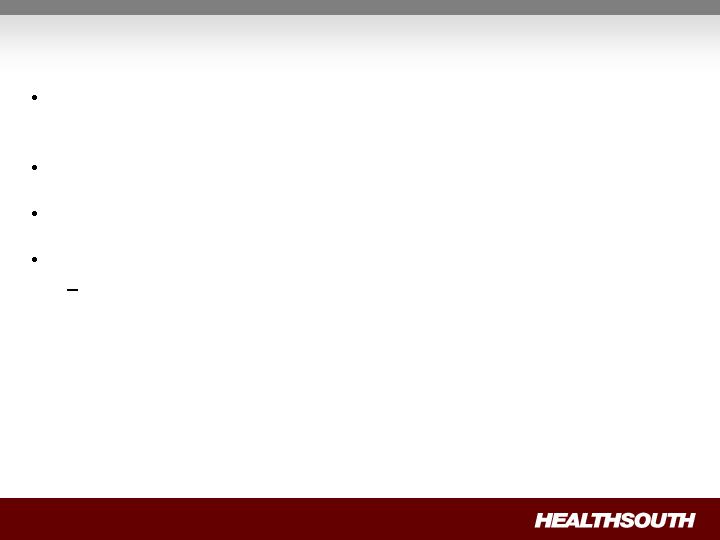
Convertible Perpetual Preferred Stock
400,000 shares 6.5% Series A preferred stock is convertible, at the
option of the holder
At initial conversion price of $30.50 per share
If converted represents 13.1 million shares
On or after July 20, 2011, we may cause conversion, if;
Closing price of our common stock exceeds 150% of the
conversion price ($45.75) for 20 of the last 30 consecutive
trading days
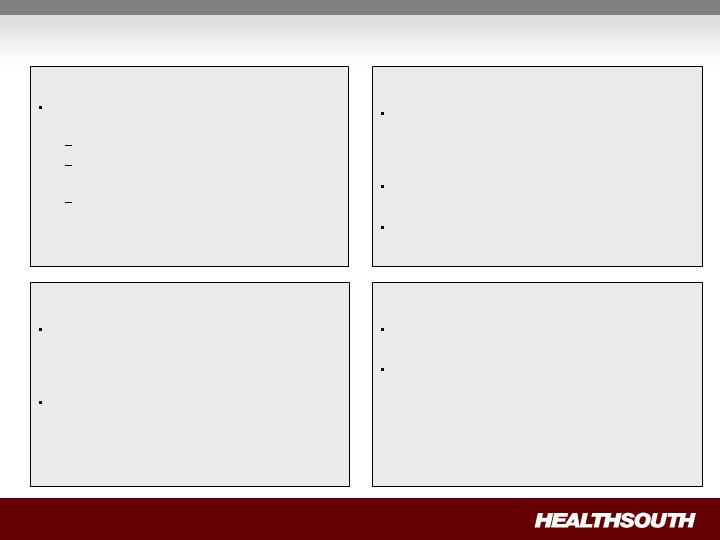
Tax Position Update
Cash Refunds
$63 million on balance sheet at September
30, 2008
Relates to years 2003 or earlier
$46 million received on October 1, 2008
(used for debt reduction)
Remainder expected to be later in 2008
or early 2009
Future Cash Tax Payments
Due to $2.5 billion in federal and state NOLs
and tax deductions, we do not expect to pay
significant federal income tax for the next 10-12
years
Expect to pay about $5-7 million per year state
income tax
Some exposure to Alternative Minimum Tax
(AMT)
GAAP Considerations
HealthSouth’s balance sheet currently reflects
a valuation allowance for the potential value
of NOLs and future deductions. The valuation
allowance is over $1.0 billion
GAAP tax rate will net to small amount for
foreseeable future as there will be a reduction
in the valuation allowance when NOLs are
utilized
NOL Usage
HealthSouth does not have an annual use
limitation (AUL) under section 382
If we experienced a “change of ownership” as
defined by the Internal Revenue Service we
would be subject to an AUL. However, even
with a change of ownership we do not expect to
pay significant federal income tax for the next
10-12 years

Questions & Answers
Litigation Update
Topics Discussed:
General Medicine
UBS Settlement
E & Y Arbitration
Claims against Scrushy
Questions and Answers
John Whittington – Executive Vice President,
General Counsel and Secretary

Concluding Remarks
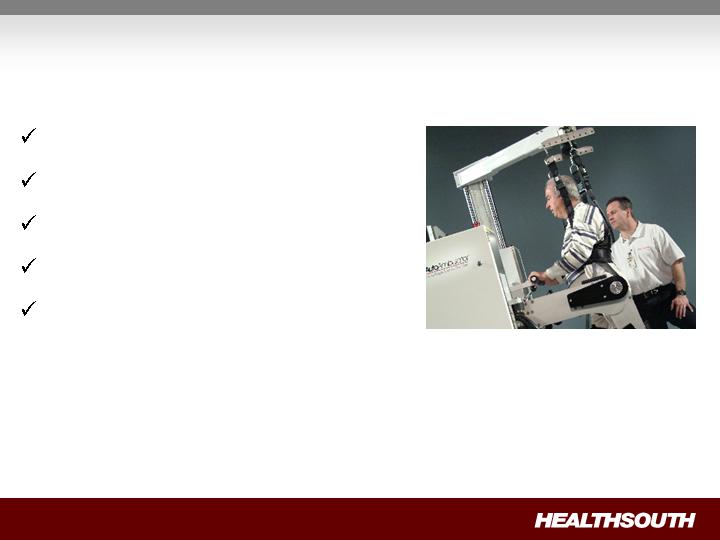
HealthSouth's Value Proposition
Attractive industry
Industry leader
Strong operating cash flows
Excellent growth opportunities
~ $2.5 billion NOL's

Appendix and
Reconciliation
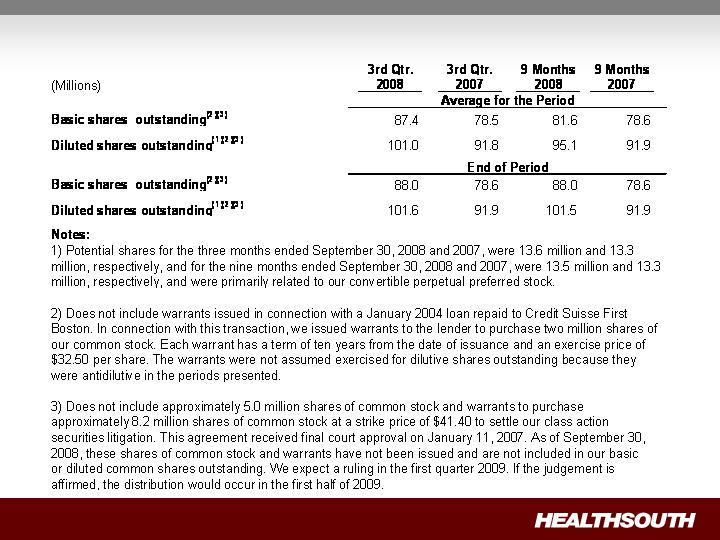
Outstanding Share Summary
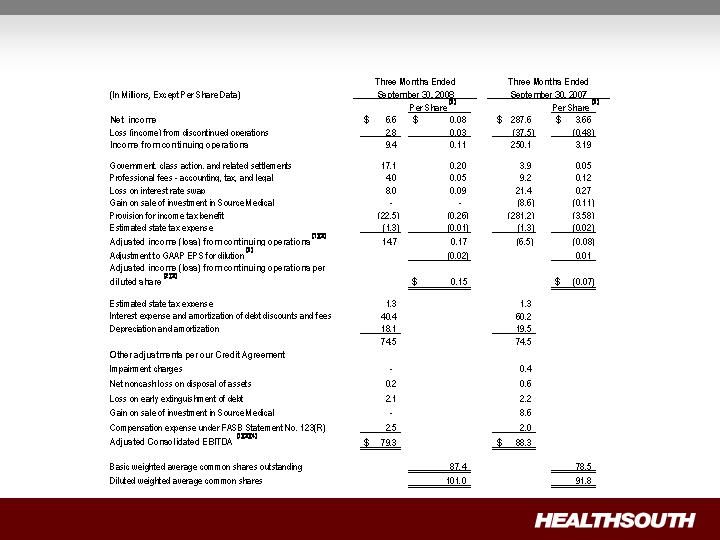
Q3 2008 Reconciliation of Net Income to Adjusted Income from Continuing
Operations and Adjusted Consolidated EBITDA (1)(3) – (Notes on following page)

Q3 2008 Reconciliation of Net Income to Adjusted Income from Continuing
Operations and Adjusted Consolidated EBITDA – Notes
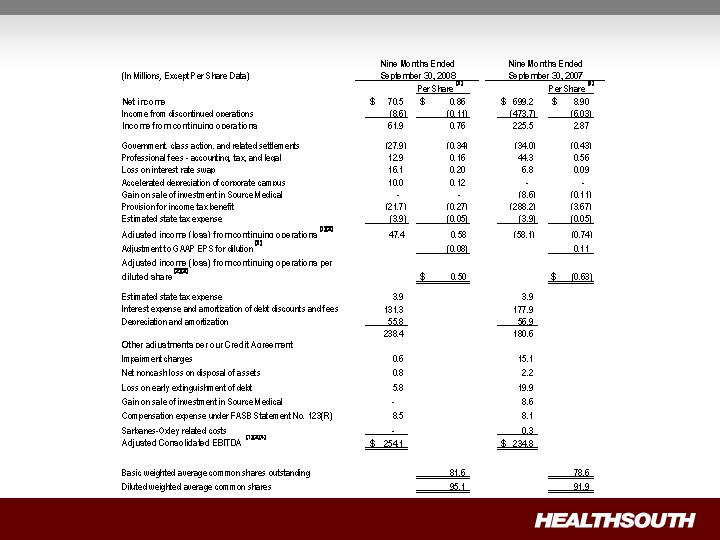
9 Months 2008 Reconciliation of Net Income to Adjusted Income from Continuing Operations
and Adjusted Consolidated EBITDA (1)(3) – (Notes on following page)
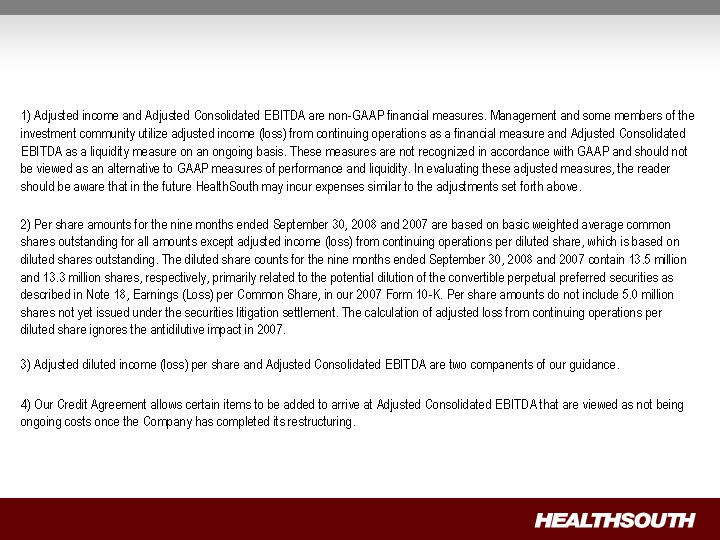
9 Months 2008 Reconciliation of Net Income to Adjusted Income from
Continuing Operations and Adjusted Consolidated EBITDA – Notes
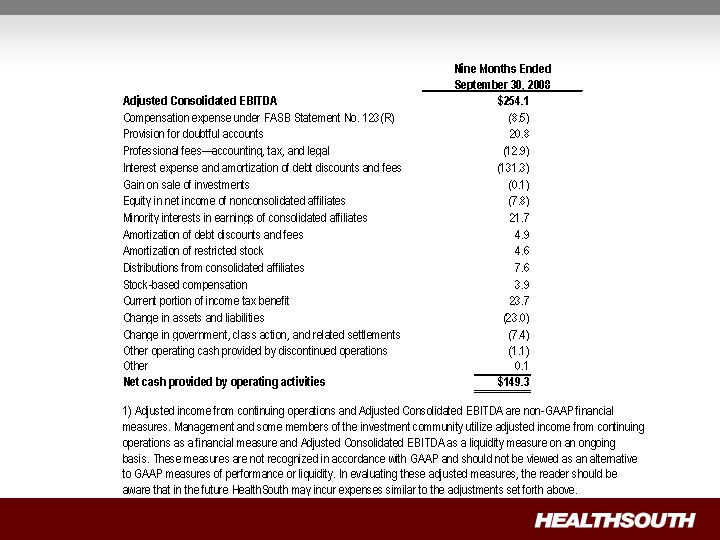
9 Months 2008 Reconciliation of Adjusted Consolidated EBITDA(1) to Net Cash
Provided by Operating Activities


