
HealthSouth
J.P. Morgan Global High
Yield & Leveraged Finance
Conference
Miami, Florida
February 3, 2009
Exhibit 99.1

Note Regarding Forward-Looking Statements
The information contained in this presentation includes certain estimates, projections and other forward-
looking information that reflect our current views with respect to future events and financial performance.
These estimates, projections and other forward-looking information are based on assumptions that
HealthSouth believes, as of the date hereof, are reasonable. Inevitably, there will be differences between
such estimates and actual results, and those differences may be material.
There can be no assurance that any estimates, projections or forward-looking information will be realized.
All such estimates, projections and forward-looking information speak only as of the date hereof.
HealthSouth undertakes no duty to publicly update or revise the information contained herein.
You are cautioned not to place undue reliance on the estimates, projections and other forward-looking
information in this presentation as they are based on current expectations and general assumptions and are
subject to various risks, uncertainties and other factors, including those set forth in our Form 10-Q for the
quarters ended March 31, 2008, June 30, 2008, and September 30, 2008, Form 10-K for the fiscal year
ended December 31, 2007, and in other documents we previously filed with the SEC, many of which are
beyond our control, that may cause actual results to differ materially from the views, beliefs and estimates
expressed herein.
Note Regarding Presentation of Non-GAAP Financial Measures
The following presentation includes certain “non-GAAP financial measures” as defined in Regulation G under
the Securities Exchange Act of 1934. The Appendix at the end of this presentation includes reconciliations of
the non-GAAP financial measures found in the following presentation to the most directly comparable
financial measures calculated and presented in accordance with Generally Accepted Accounting Principles
in the United States. Our Form 8-K, dated February 2, 2009, to which the following presentation slides are
attached as Exhibit 99.1, provides further explanation and disclosure regarding our use of non-GAAP
financial measures and should be read in conjunction with these presentation slides.
Cautionary Statements
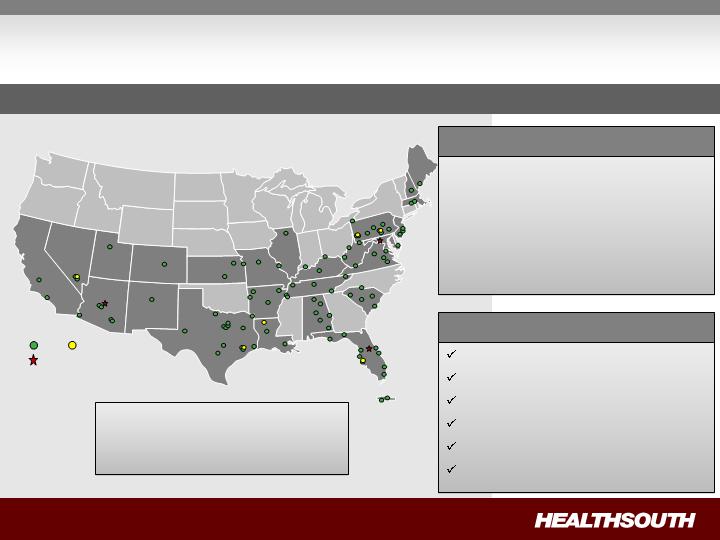
HealthSouth Today
IRH
LTCH
93 Rehabilitation Hospitals and
Outpatient Departments
6 LTCH Hospitals
55 Outpatient Satellites
25 Hospital-Based Home
Health Agencies
Operational Components
Rehabilitation Nursing
Physical Therapy
Occupational Therapy
Speech-Language Therapy
Case Management
Specialized Technology
Major Services
Largest Provider of Inpatient Rehabilitative Healthcare Services in the U.S.
Development Sites
Employees: ~ 22,000
Corporate Office: Birmingham, AL
Exchange (Symbol): NYSE (HLS)
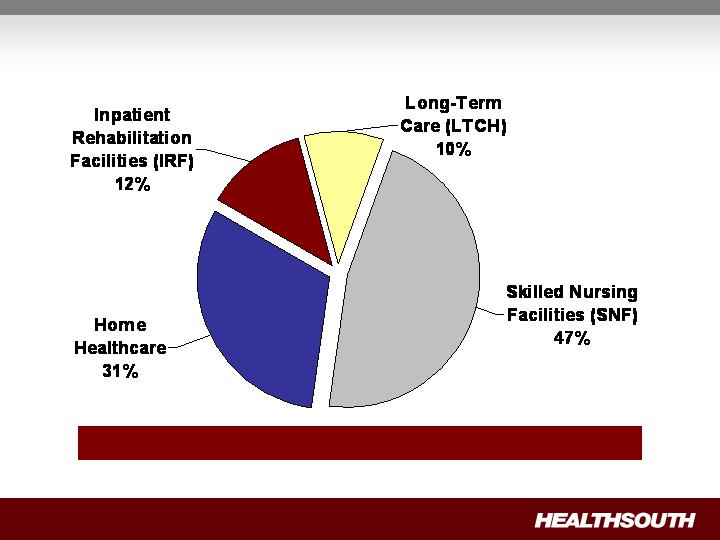
Post-Acute Industry
(1) Source: MedPAC, A Data Book: Healthcare Spending and the Medicare Program, June 2008 (Section 9).
(2) These percents are Medicare spending only and do not include beneficiary copayments or other payors.
2007 Medicare Spending = $45.1 Billion
Total Inpatient Rehabilitation Sector: ~ $9 Billion
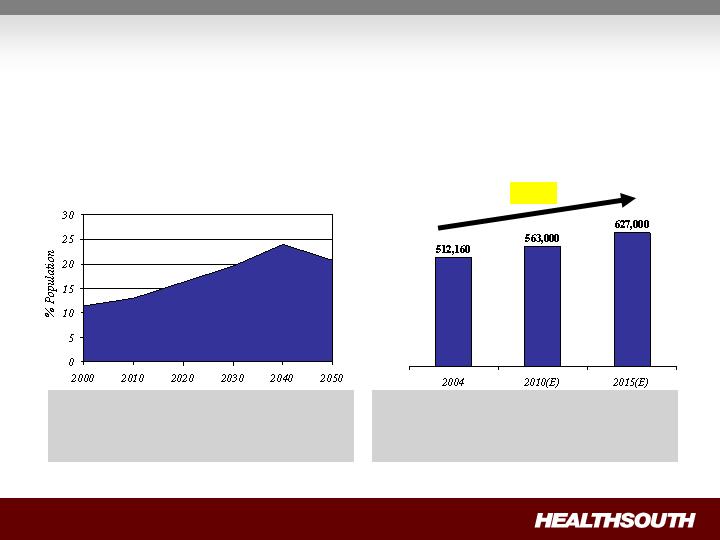
Projected percentage of US population
65 years or older through 2050(1)
(1) Source: US Census Bureau, 2004
(2) Source: Medicare Provider Analysis and Review File (2004); Claritas
Projected Medicare Compliant
Case Growth(2)
Inpatient Rehabilitation: Aging Demographics =
Increased Demand
Demand for post-acute services will
increase as the U.S. population ages.
“Compliant Cases” are expected to grow
~ 2% per year for the foreseeable future,
creating an attractive market.
+22%

Inpatient Rehabilitation: Fragmented Sector
Total Inpatient Rehabilitation
Facilities (IRF): 1,201
Total Freestanding Inpatient
Rehabilitation Hospitals: 218
(HLS = 43%)
(1) Source: Medpac, Modern Healthcare, press releases and internal analysis
5
Vibra (Private)
125
93
All others
2
Reliant (Private)
No. of
IRFs
Freestanding
Providers
2
Gulf States (Private)
2
Five Star Quality Care
(Public)
4
Centerre (Private)
5
Select (Private)
6
RehabCare (Public)
6
Ernest (Private)
Hospital-Based
983 (82%)
Freestanding
HealthSouth
93 (8%)
Other
125 (10%)
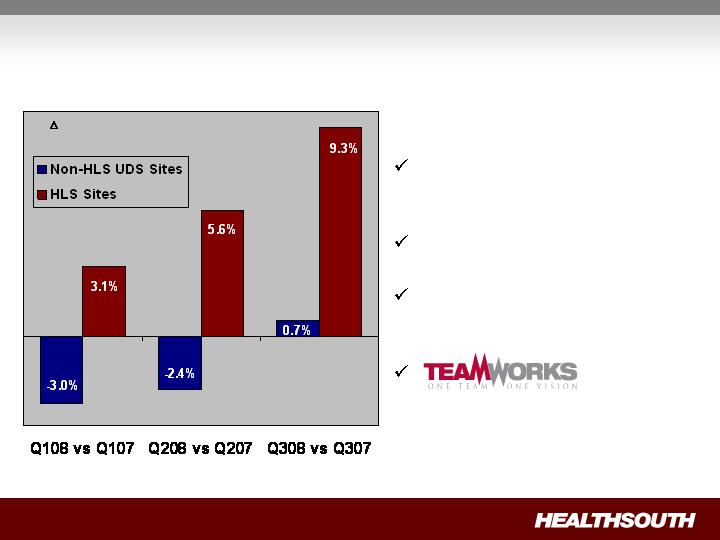
HealthSouth’s volume growth
continues to outpace
competitors’ growth
Same store discharges were
+8.1% for HLS in Q308
Projected sustainable discharge
growth: 4+% annual same
store
.
% Discharges of HLS vs. Non-HLS UDS Sites(1)
Strong Organic Growth
(1) Data provided by UDS MR, a data gathering and analysis organization for the rehabilitation industry; represents ~ 65-70% of industry.
Nine Months 2008 Statistics
(YTD Q307 vs. YTD Q308)
Volume Revenue EBITDA
+ 5.8% +5.8% +8.2%
Volume and revenue reflect strong growth.
Improving productivity (EPOB) helps offset increase in salaries
and benefits (SWB) per employee. Actions taken to mitigate
labor costs.
Employees per
Occupied Bed (EPOB) SWB per FTE
-2.4% 7.6%

Q408 Initial Observations
Volume:
Continued solid same-store discharge growth
Reminder: Q407 had hospitals limiting admissions due to phase-in to 65%
threshold which will favorably impact quarter-over-quarter comparisons.
Pricing:
No significant sequential change in pricing vs. Q308
Reminder: Quarter-over-quarter comparables will show decline due to April
1st pricing roll-back.
Expenses:
Continued improvement in productivity and managing labor costs
Reminder: An average 3% merit increase went into effect on October 1,
2008 for non-management employees; benefits changes were effective
January 1, 2009.

Year-End Initial Observations
(1) See supplemental information on slide 33
The Company has not yet finalized its audited results for the fourth
quarter and year-end 2008. At this time, the Company is not aware of
anything that would cause it to miss the previously disclosed guidance.
Q408, year-end results and 2009 guidance will be provided on
earnings conference call scheduled for 9:30 a.m. EST on February 24, 2009
Year-over-year growth in inpatient
discharges
5% to 6%
Consolidated net operating revenues
$1.825 billion to $1.875 billion
Net income per diluted share
$0.23 per share to $0.25 per share
Adjusted income from continuing
operations per average diluted share
(1)
$0.58 to $0.60 per share
Adjusted Consolidated EBITDA
(1)
$330 million to $335 million
Previous Guidance for Full-Year 2008

Longer term, we will pursue acquisitions of complementary,
post-acute services provided they are accretive to HealthSouth.
Target: 5-8% annual Adjusted Consolidated EBITDA growth
Margins will expand modestly
Target: 15-20% annual Adjusted EPS growth
Strategy:
To create shareholder value as the preeminent provider of
rehabilitative care in the U.S. by:
Creating a strong balance sheet through deleveraging;
Driving organic growth through operational excellence; and
Pursuing disciplined, opportunistic growth.
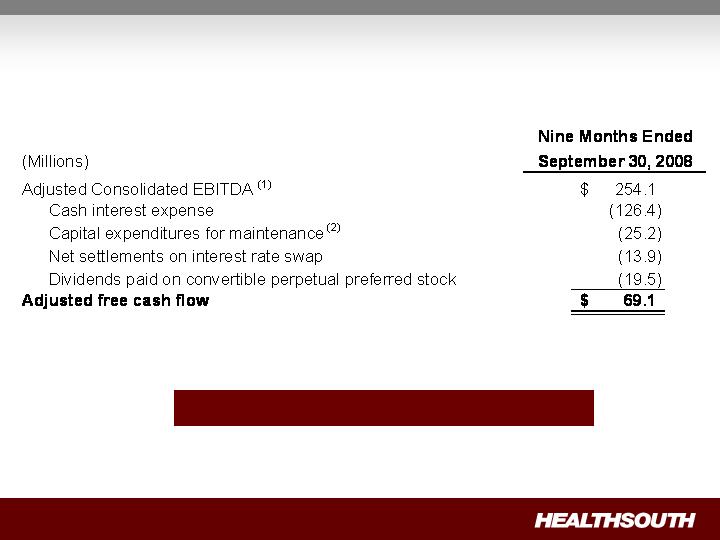
Free Cash Flow Year-to-Date
Strong Normalized Free Cash Flow
(1) Reconciliation to GAAP provided on slides 30 through 32
(2) Includes capital expenditures for the refresh program

Non-Operating Cash / Tax Position Update
Cash Refunds
$63 million on balance sheet at September
30, 2008
Relates to years 2003 or earlier
$46 million received on October 1, 2008
(used for debt reduction)
Additional $24 million tax refund +
applicable interest approved by Joint
Committee on Taxation; cash expected
Q109
Future Cash Tax Payments
Due to $2.5 billion in federal and state NOLs
and tax deductions, we do not expect to pay
significant federal income tax for the next 10-12
years
Expect to pay about $5-7 million per year state
income tax
Some exposure to Alternative Minimum Tax
(AMT)
GAAP Considerations
HealthSouth’s balance sheet currently reflects
a valuation allowance for the potential value
of NOLs and future deductions. The valuation
allowance is over $1.0 billion
GAAP tax rate will net to small amount for
foreseeable future as there will be a reduction
in the valuation allowance when NOLs are
utilized
NOL Usage
HealthSouth does not have an annual use
limitation (AUL) under section 382
If we experienced a “change of ownership” as
defined by the Internal Revenue Service we
would be subject to an AUL. However, even
with a change of ownership we do not expect to
pay significant federal income tax for the next
10-12 years

Non-Operating Cash / Derivative Proceeds
UBS Settlement
Net proceeds of ~ $60 million
Expect cash to be received in first half of 2009
E&Y Arbitration(1)
Expect arbitration to be completed in 2009
11% fee cap for the derivative plaintiffs’ attorneys
Claims Against Scrushy(1)
Trial scheduled for May 2009
35% fee cap for the derivative plaintiffs’ attorneys
(1) 25% of the net proceeds will go to the plaintiffs in the Securities Litigation pursuant to existing settlement agreements.
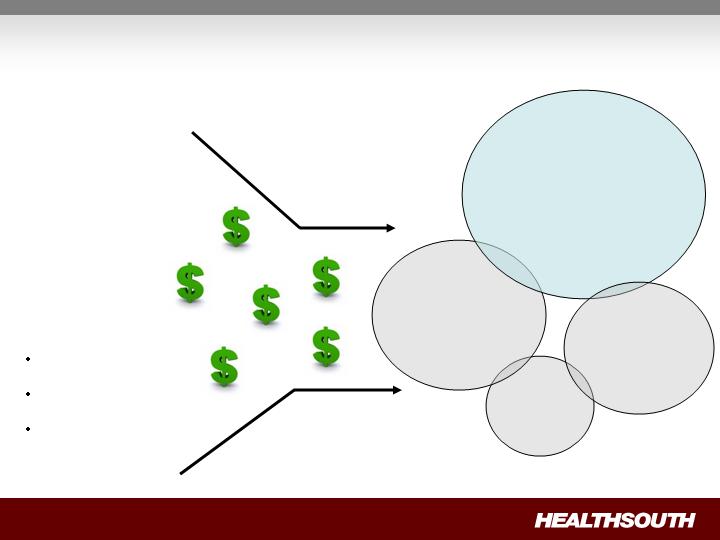
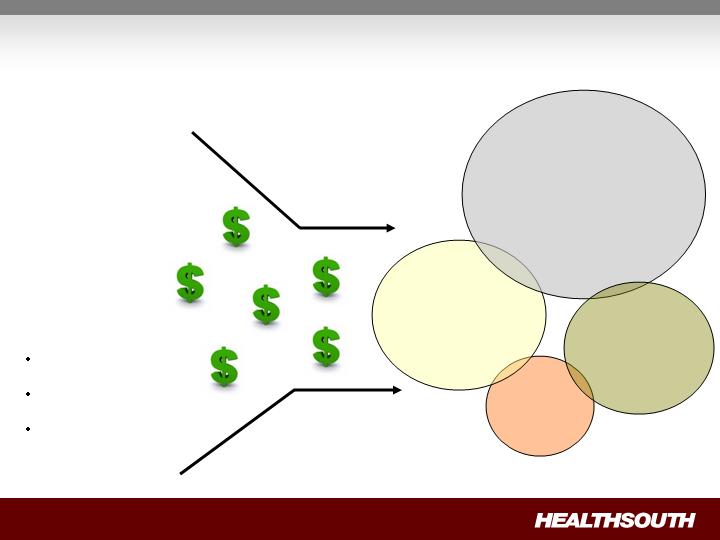
Disciplined Use of Cash
Non-Operating Cash
Tax refunds
Derivative proceeds
Digital Hospital
proceeds
De novo’s
Acquisitions/
Consolidations
Debt
Reduction
Bed
Expansions
Adjusted Free
Cash Flow(1)
(Major Focus)
(Opportunistic)
($15-20 million)
(3rd-party
financed)
(1) After maintenance CAPEX of ~ $35 million annually, which includes ~ $5-10 million for infrastructure enhancements
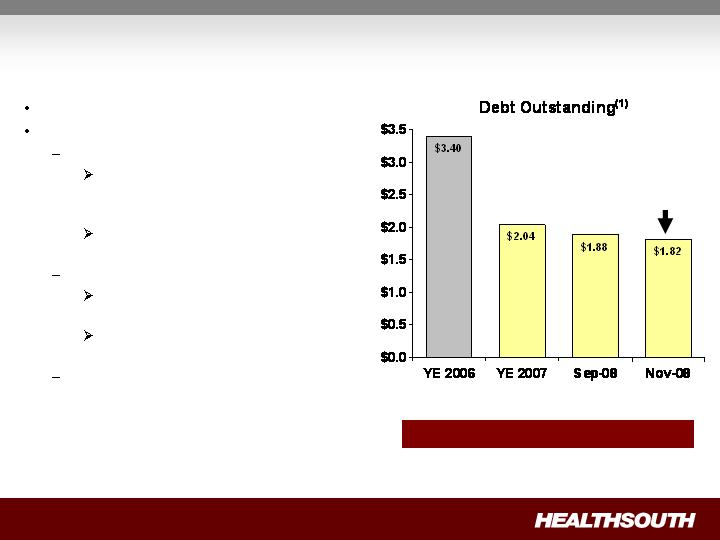
Debt Reduction
No near-term refinancing
Future debt reduction:
Additional income tax recoveries
$24 million federal tax refund
(+ interest) approved 12/30/08;
cash expected Q109(3)
Other recoveries being
pursued at state level
Derivative proceeds
UBS settled; cash expected
1H09
E&Y and Scrushy litigation on-
going
Excess cash from operations
$223.2M(2)
(1) A reconciliation can be found on slide 29
(2) Credit Agreement limits debt pay down on non–term loan balances. We have limited this to $50 million per year with the addition of a lifetime
basket of $100 million. We have the ability to buy back non-term loan debt with the discretionary cash available to the Company.
(3) Joint Committee on Taxation approved December 30, 2008 for 1995-1999 tax years
Debt to EBITDA 6.4X 6.3X 5.5X 5.5X
($ Billions)
Debt Reduction
Since 12/31/07
Short-Term Goal: 4.5X by YE 2010

Debt Schedule
(Millions)
$ 40.0
Term loan facility - March 2013
785.7
Bonds Payable:
8.375% Senior Notes due 2011
0.3
7.625% Senior Notes due 2012
1.5
Floating Rate Senior Notes due 2014 (6 month Libor plus 600)
366.0
10.75% Senior Notes due 2016
494.3
12.8
Capital lease obligations
118.9
Total
1,819.5
$
Debt
Balances
Nov. 30, 2008
Notes payable to banks and others at interest rates from 7.9% to 12.9%
Advances under $400 million revolving credit facility, March 2012
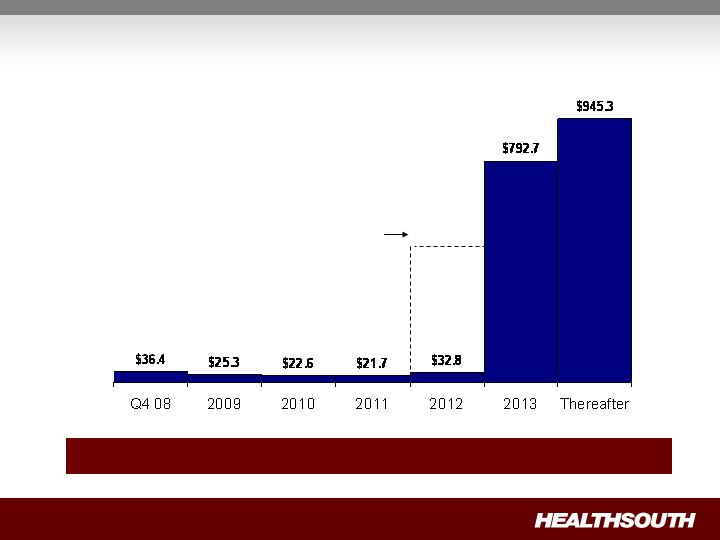
Debt Maturities
(Millions)
Minimal Amortization and No Near-Term Financing Risk
$400.0
Undrawn revolver
goes away in 2012

Credit Ratings
S&P
Moody's
Corporate Credit Rating
B
B3
Outlook
Stable
Positive
Prices
Bank Debt
Jan 28, 2009
Term loan facility - March 2013
BB-
Ba3
$85-$87
Bonds
Floating Rate Senior Notes due 2014
CCC+
Caa1
$83-$84
10.75% Senior Notes due 2016
CCC+
Caa1
$98-$99
Disciplined Use of Cash
Non-Operating Cash
Tax refunds
Derivative proceeds
Digital Hospital
proceeds
De novo’s
Acquisitions/
Consolidations
Debt
Reduction
Bed
Expansions
Adjusted Free
Cash Flow(1)
(Major Focus)
(Opportunistic)
($15-20 million)
(3rd-party
financed)
(1) After maintenance CAPEX of ~ $35 million annually, which includes ~ $5-10 million for infrastructure enhancements
Organic Growth Enhanced Through Bed Expansions
Hospitals with greater than 85% occupancy are candidates for
bed expansion
We expect to add 65-75 beds by the end of 2009 and at least
another 44 beds in 2010
Average cost per bed:
With new construction = $100 – 250K
Internal renovation, only = $15 – 45K
(1) Includes Vineland, NJ and excludes Dallas, TX
(1)
Occupancy
Q4 2007
Q1 2008
Q2 2008
Q3 2008
High (85% or greater)
10
22
17
16
Medium (60% to 85%)
42
37
42
43
Low (Less than 60%)
41
34
34
34
Total
93
93
93
93
Number of HLS Hospitals
Disciplined Development
(2)
(1) Plan to work with a developer to obtain a lease arrangement
(2) CON is being appealed; operational date may change
154 additional beds in total, 34 of which became operational in Q308
Development priorities:
1.
Consolidations
2.
De novo (with third-party financing)
Location
Announced
Type of Investment
Installed Beds
Operational
Date
Vineland, NJ
Aug-08
Acquisition
34 Beds
Q3 2008
Arlington, TX
Aug-08
Consolidation
n/a
Q3 2008
Ocala, FL
Aug-08
De novo
(1)
40 Beds
3Q 2010
Loudoun County, VA
Aug-08
De novo
40 Beds
2Q 2010
Midland, TX
Sep-08
Consolidation
n/a
Q3 2008
Mesa, AZ
Oct-08
De novo
(1)
40 Beds
3Q 2009

Liquidity
(Millions)
(1) Letters of credit will be reduced by $33.6 million in connection with implementing the court order approving the final UBS settlement. We expect
the administrative steps to be completed in the first quarter of this year.
September 30,
2008
Cash
Available
24.9
$
Revolver
Total line
400.0
$
Less:
– Draws
(13.0)
– Letters of credit
(38.4)
(1)
Available
348.6
$
Total Liquidity
(available cash and revolver)
373.5
$
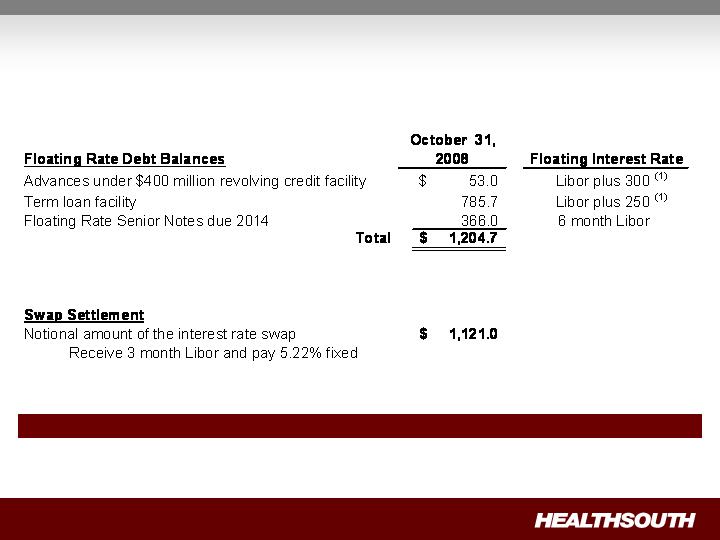
Interest Expense and Swap Settlements
(Millions)
As of September 30, 2008, we were in compliance with the covenants under our Credit Agreement.
(1) We have the flexibility to peg 1,2,3 or 6 month Libor, or prime
As Settled
Shareholders equity (paid-in-
capital) goes up
Outstanding shares go up
Cash effect “0”
Expected Settlement Date
1H 2009
Currently under appeal
Government, Class Action, and Related Settlements
Today
Under appeal
Shares are not issued
Change in fair value flows
through income statement
Share price goes up, liability
and expense go up
Share price goes down,
liability and expense go
down
Cash effect “0”
The class action Securities Litigation Settlement included
5.0 million shares of common stock and 8.2 million warrants
at a strike price of $41.40.

Convertible Perpetual Preferred Stock
400,000 shares 6.5% Series A preferred stock is convertible, at the
option of the holder
At initial conversion price of $30.50 per share
If converted represents 13.1 million shares
On or after July 20, 2011, we may cause conversion, if;
Closing price of our common stock exceeds 150% of the conversion
price ($45.75) for 20 of the last 30 consecutive trading days
Investment Considerations
Turnaround Complete: management focused on operations
and growth
Industry Leader in Attractive Industry
Strong Cash Flows: flexibility in the use of FCF
Deleveraging as Priority: reduce leverage to 4.5x or less by
YE 2010
Solid Organic Growth: TeamWorks initiative will help us meet
or exceed our EBITDA targets
Opportunistic, disciplined expansion
Focus: Delivering shareholder value
through strong EPS growth

Appendix and
Reconciliations

Debt Schedule
Debt to Adj. Consol. EBITDA on September 30, 2008 = 5.5X ; Target = 4.5X by YE 2010
(1) Credit Agreement limits debt pay down on non–term loan balances. We have limited this to $50 million per year with the addition of a lifetime
basket of $100 million. We have the ability to buy back non-term loan debt with the discretionary cash available to the Company.
(Millions)
2008
Debt
Reduction
March 2012
$ 40.0
$ 13.0
$ 75.0
$ 35.0
Term loan facility - March 2013
785.7
818.7
862.8
77.1
Bonds Payable:
7.000%
Senior Notes due 2008
-
-
5.0
5.0
10.750%
Senior Subordinated Notes due 2008
-
30.3
30.3
30.3
8.500%
Senior Notes due 2008
-
-
9.4
9.4
8.375%
Senior Notes due 2011
0.3
0.3
0.3
-
7.625%
Senior Notes due 2012
1.5
1.5
1.5
-
Floating Rate Senior Notes due 2014
366.0
366.0
375.0
9.0
(6 month Libor plus 600)
10.75%
Senior Notes due 2016
494.3
512.7
558.2
63.9
from 7.9% to 12.9%
12.8
12.9
17.0
4.2
Capital lease obligations
118.9
121.4
108.2
(10.7)
Total
1,819.5
$
1,876.8
$
2,042.7
$
223.2
$
Year-to-date debt reduction
(1)
223.2
$
165.9
$
November 30,
2008
Debt Balances
Notes payable to banks and others at interest rates
September 30,
2008
December 31,
2007
Advances under $400 million revolving credit facility,
9 Months 2008 Reconciliation of Net Income to Adjusted Income (Loss) from Continuing
Operations and Adjusted Consolidated EBITDA(1)(3) – (Notes on following page)
(In Millions, Except Per Share Data)
Per Share
(2)
Per Share
(2)
Net income
70.5
$
0.86
$
699.2
$
8.90
$
Income from discontinued operations
(8.6)
(0.11)
(473.7)
(6.03)
Income from continuing operations
61.9
0.76
225.5
2.87
Government, class action, and related settlements
(27.9)
(0.34)
(34.0)
(0.43)
Professional fees - accounting, tax, and legal
12.9
0.16
44.3
0.56
Loss on interest rate swap
16.1
0.20
6.8
0.09
Accelerated depreciation of corporate campus
10.0
0.12
-
-
Gain on sale of investment in Source Medical
-
-
(8.6)
(0.11)
Provision for income tax benefit
(21.7)
(0.27)
(288.2)
(3.67)
Estimated state tax expense
(3.9)
(0.05)
(3.9)
(0.05)
Adjusted income (loss) from continuing operations
(1)(3)
47.4
0.58
(58.1)
(0.74)
Adjustment to GAAP EPS for dilution
(2)
(0.08)
0.11
Adjusted income (loss) from continuing operations per
diluted share (2)(3)
$ 0.50
$ (0.63)
Estimated state tax expense
3.9
3.9
Interest expense and amortization of debt discounts and fees
131.3
177.9
Depreciation and amortization
55.8
56.9
238.4
180.6
Other adjustments per our Credit Agreement
Impairment charges
0.6
15.1
Net noncash loss on disposal of assets
0.8
2.2
Loss on early extinguishment of debt
5.8
19.9
Gain on sale of investment in Source Medical
-
8.6
Compensation expense under FASB Statement No. 123(R)
8.5
8.1
Sarbanes-Oxley related costs
-
0.3
Adjusted Consolidated EBITDA
(1)(3)(4)
254.1
$
234.8
$
Basic weighted average common shares outstanding
81.6
78.6
Diluted weighted average common shares
95.1
91.9
Nine Months Ended
September 30, 2008
Nine Months Ended
September 30, 2007

9 Months 2008 Reconciliation of Net Income to Adjusted Income (Loss) from
Continuing Operations and Adjusted Consolidated EBITDA – Notes
1) Adjusted income (loss) and Adjusted Consolidated EBITDA are non-GAAP financial measures.
Management and some members of the investment community utilize adjusted income (loss) from
continuing operations as a financial measure and Adjusted Consolidated EBITDA as a liquidity measure on
an ongoing basis. These measures are not recognized in accordance with GAAP and should not be viewed
as an alternative to GAAP measures of performance and liquidity. In evaluating these adjusted measures,
the reader should be aware that in the future HealthSouth may incur expenses similar to the adjustments
set forth above.
2) Per share amounts for the nine months ended September 30, 2008 and 2007 are based on basic
weighted average common shares outstanding for all amounts except adjusted income (loss) from
continuing operations per diluted share, which is based on diluted shares outstanding. The diluted share
counts for the nine months ended September 30, 2008 and 2007 contain 13.5 million and 13.3 million
shares, respectively, primarily related to the potential dilution of the convertible perpetual preferred
securities as described in Note 18, Earnings (Loss) per Common Share, in our 2007 Form 10-K. Per share
amounts do not include 5.0 million shares not yet issued under the securities litigation settlement. The
calculation of adjusted loss from continuing operations per diluted share ignores the antidilutive impact in
2007.
3) Adjusted diluted income (loss) per share and Adjusted Consolidated EBITDA are two components of our
guidance.
4) Our Credit Agreement allows certain items to be added to arrive at Adjusted Consolidated EBITDA that
are viewed as not being ongoing costs once the Company has completed its restructuring.

9 Months 2008 Reconciliation of Adjusted Consolidated EBITDA(1) to Net Cash Provided
by Operating Activities

2008 Full Year Guidance Notes
1) As previously reported, the Company’s earnings per share guidance does not
incorporate any assumptions related to actual amounts incurred in 2008 for: (1)
government, class action, and related settlement amounts, including the fair value
adjustments to the liability associated with the Company’s securities litigation settlement
that are required until the applicable common stock and warrants are issued and (2) any
gain or loss associated with the fair value adjustments to the Company’s interest rate
swap over the remaining term of this agreement. In addition, due to the income tax
benefits associated with the Company’s continued pursuit of its remaining income tax
refund claims, the Company’s earnings per share guidance does not include its provision
for income tax benefit, as such amounts are not reflective of the Company’s expected
income tax expense in future periods.
2) See supplemental information contained in exhibit 99.1 to the Current Report on Form
8-K filed on November 4, 2008 titled "Reconciliation of Net Income to Adjusted Income
(Loss) from Continuing Operations and Adjusted Consolidated EBITDA."