
Fourth Quarter 2008 Earnings Call
Supplemental Slides
Exhibit 99.2

The information contained in this presentation includes certain estimates, projections and other forward-
looking information that reflect our current views with respect to future events and financial performance.
These estimates, projections and other forward-looking information are based on assumptions that
HealthSouth believes, as of the date hereof, are reasonable. Inevitably, there will be differences between
such estimates and actual results, and those differences may be material.
There can be no assurance that any estimates, projections or forward-looking information will be realized.
All such estimates, projections and forward-looking information speak only as of the date hereof.
HealthSouth undertakes no duty to publicly update or revise the information contained herein.
You are cautioned not to place undue reliance on the estimates, projections and other forward-looking
information in this presentation as they are based on current expectations and general assumptions and are
subject to various risks, uncertainties and other factors, including those set forth in our Form 10-Q for the
quarters ended March 31, 2008, June 30, 2008, and September 30, 2008, and Form 10-K for the year
ended December 31, 2007, and in other documents we previously filed with the SEC, as well as our Form
10-K for the year ended December 31, 2008, when filed, many of which are beyond our control, that may
cause actual results to differ materially from the views, beliefs and estimates expressed herein.
Note Regarding Presentation of Non-GAAP Financial Measures
The following presentation includes certain “non-GAAP financial measures” as defined in Regulation G
under the Securities Exchange Act of 1934. A schedule is attached that reconciles the non-GAAP financial
measures included in the following presentation to the most directly comparable financial measures
calculated and presented in accordance with Generally Accepted Accounting Principles in the United States.
Our Form 8-K, dated February 23, 2009, to which the following supplemental slides are attached as Exhibit
99.2, provides further explanation and disclosure regarding our use of non-GAAP financial measures and
should be read in conjunction with these supplemental slides.
Forward-Looking Statements

Table of Contents
2008 Goals vs. Results
................................
................................
................................
....................
4
Organic Growth
................................
................................
................................
...............................
5
Debt Reduction
................................
................................
................................
................................
6
Development Growth
................................
................................
................................
.......................
7
Revenues (Q4)
................................
................................
................................
................................
8
Expenses (Q4)
................................
................................
................................
................................
9
Adjusted Consolidated EBITDA
................................
................................
................................
.....
10
Adjusted Income (Loss) Per Share
................................
................................
................................
11
Free Cash Flow
................................
................................
................................
.............................
12
Liquidity
................................
................................
................................
................................
.........
13
UBS Settlement
................................
................................
................................
.............................
14
Year
-
End Summary
................................
................................
................................
.......................
15
2009 Guidance
................................
................................
................................
..............................
16
Appendix
................................
................................
................................
................................
.......
17
Revenues (Sequential)
................................
................................
................................
..................
18
Expenses (Sequential)
................................
................................
................................
..................
19
Revenues (Year End)
................................
................................
................................
....................
20
Expenses (Year End)
................................
................................
................................
....................
21
Operational and Labor Metrics
................................
................................
................................
......
22
Supplemental Information
................................
................................
................................
..............
23
Debt Schedule
................................
................................
................................
...............................
24
Debt Maturities and Swap
................................
................................
................................
.............
25
Non
-
Operat
ing Cash/Tax Position
................................
................................
................................
.
26
Outstanding Share Summary
................................
................................
................................
........
27
Reconciliation to Non
-
GAPP Financial Measures
................................
................................
....
28
-
31

Highlights: 2008 Goals vs. Results
Goal One – Organic Growth
Achieved 7.0% year-over-year discharge growth through the
implementation of the TeamWorks sales and marketing initiative
Goal Two – Delever the Balance Sheet
Reduced debt by $228 million and leverage from 6.3X to 5.3X
Equity issuance of 8.8 million shares for $150 million
Goal Three – Disciplined Opportunistic Growth
Acquired freestanding hospital in Vineland, New Jersey
Acquired and consolidated hospitals in Arlington and Midland, Texas
Adjusted Consolidated EBITDA(1) $341.8M vs. $321.3M in 2007
Adjusted EPS(1) $0.75 vs. ($0.64) in 2007
(1) For a reconciliation of Adjusted Consolidated EBITDA and Adjusted EPS, see slides 28 through 31.
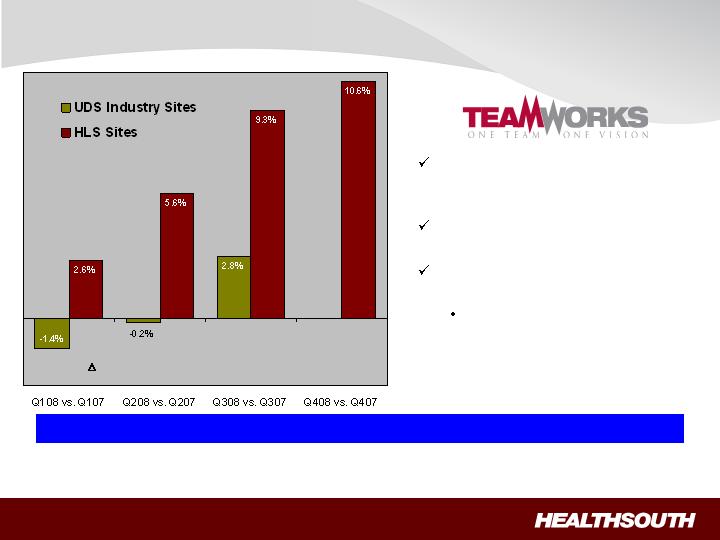
HealthSouth’s volume growth
continues to outpace competitors’
growth
Same store discharges were
+9.7% for HLS in Q408
Bed expansions will help facilitate
organic growth:
65 – 75 new beds in 2009;
another 44 in 2010
% Discharges of HLS vs. UDS Industry Sites(1)
(1) Data provided by UDSMR , a data gathering and analysis organization for the rehabilitation industry; represents ~ 65-70% of industry, including 88 HLS sites.
(2) Includes all 93 HLS inpatient rehab hospitals and six long-term acute care hospitals.
(3) Industry data is available on a quarter lag.
Highlights: Strong Organic Growth
Projected sustainable discharge growth: 4+% annual
(1)
(3)
(2)
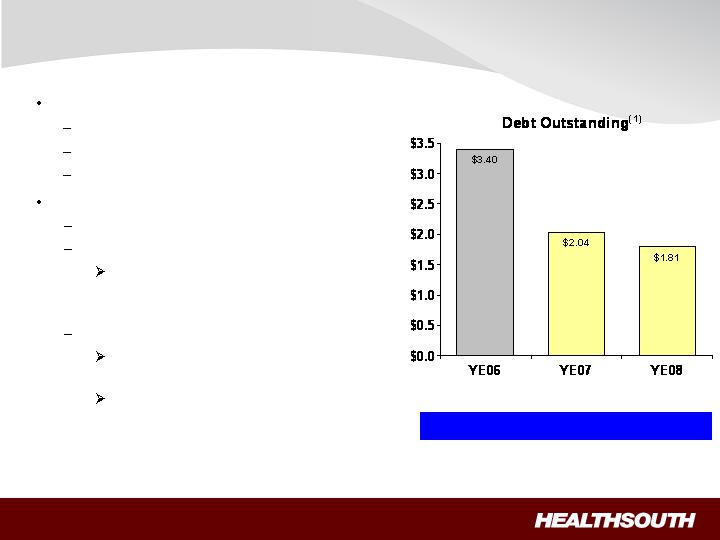
No near-term refinancing
Revolver = 2012
Term Loan = 2013
Bonds = 2014 & 2016
Future debt reduction:
Excess cash from operations
Additional income tax recoveries
$24 million federal income tax
refund (+ interest) received
February 2009
Derivative proceeds
UBS settled; ~ $60 million in
cash expected Q109
E&Y and Scrushy litigation
on-going
(1) Credit Agreement limits debt pay down on non–term loan balances. We have the right to buy back non-term loan debt with the discretionary
cash available to the Company.
Debt to EBITDA 6.3X 6.3X 5.3X
($ Billions)
Short-Term Goal: 4.5X by YE10
Highlight: Debt Reduction

Highlight: Development Growth
(2)
(1) Working with a third party to obtain lease arrangements.
(2) CON is being appealed; operational date may change.
154 additional beds in total, 34 added in third quarter 2008
Location
Announced
Type of Investment
Installed Beds
Operational
Date
Vineland, NJ
Aug-08
Acquisition of free
standing
34 Beds
Q308
Arlington, TX
Aug-08
Acquisition and
consolidation
n/a
Q308
Midland, TX
Sep-08
Acquisition and
consolidation
n/a
Q308
Mesa, AZ
Oct-08
De novo
(1)
40 Beds
Q309
Loudoun County, VA
Aug-08
De novo
40 Beds
Q210
Marion County, FL
Aug-08
De novo
(1)
40 Beds
Q310

Revenues (Q408 vs. Q407)
Inpatient revenue growth was driven by strong discharge volumes, offset by lower pricing
in Q408 due to Medicare pricing roll-back.
Volume growth was driven by the TeamWorks effort, the acquisition of a 34-bed hospital in
Vineland, NJ, and the acquisitions/consolidations of a 30-bed hospital unit in Arlington, TX
and a 38-bed hospital in Midland, TX.
“Same store” discharge growth was 9.7%, excluding our above-referenced Vineland, NJ
hospital.
Hospitals prepared for 65% threshold in Q407.
Net patient revenue/discharge was lower due to the roll-back in Medicare pricing on
April 1, 2008.
Outpatient revenue declined as a result of 11 fewer outpatient satellites year over year.
(Millions)
4th Qtr. 2008
4th Qtr. 2007
Change
Inpatient
418.4
$
388.4
$
7.7%
Outpatient and other
45.4
46.1
(1.5%)
Consolidated net operating
463.8
$
434.5
$
6.7%
(Actual Amounts)
Discharges
27,654
25,005
10.6%
Net patient revenue/discharge
15,130
$
15,533
$
(2.6%)

Expenses (Q408 vs. Q407)
Salaries and benefits increased quarter over quarter:
Increased labor costs in response to higher discharge volumes partially offset by productivity
improvements.
Range adjustments in select markets, contract labor, and the cost of recruitment and
orientation.
October 1, 2008 average merit increases of 3.0% (except senior management).
Minor adjustments to benefit plans November 15, 2008.
Hospital related expenses comparison affected by a reduction of self-insurance costs
in Q407 resulting from revised actuarial estimates.
Fewer non-comparable items in Q408.
G&A goal remains at 4.75% of net operating revenues.
(Millions, except percent)
Salaries and benefits
233.7
$
217.4
$
7.5
%
Percent of net operating revenues
50.4%
50.0%
40
bps
Hospital related expenses
113.2
$
102.8
$
10.1
%
(other operating, supplies, occupancy, bad debts)
Percent of net operating revenues
24.4%
23.7%
70
bps
General and administrative
23.5
$
23.6
$
(0.4)
%
(excludes 123(R) compensation expense)
Percent of net operating revenues
5.1%
5.4%
(30)
bps
4th Qtr. 2008
4th Qtr. 2007
Change
Adjusted Consolidated EBITDA(1)(2)
(Millions)
(1) Reconciliation to GAAP provided on slides 28 through 31.
(2) Q407 and Q108 included a market basket price increase that was rolled-back on April 1, 2008.
(3) Includes $8.6 million gain for Source Medical.
(3)
Q408 vs. Q407
Strong volume growth in Q408 helped offset
the absence of Medicare price increase
Q407 Medicare pricing: $7-8 million
benefit
2008 vs. 2007
Year-over-year improvement driven by:
increased volumes;
cost management; and
improved labor productivity.
4th Qtr.
2008
4th Qtr.
2007
87.8
$
86.4
$
Full-Year
2008
Full-Year
2007
341.8
$
321.3
$

Adjusted Income (Loss) per Share
(1) Reconciliation to GAAP provided on slides 28 through 31.
Year-over-year adjusted income from continuing operations per diluted share improved
by $1.39 per share. Major drivers were:
Lower interest expense
Lower early extinguishment of debt expenses
Lower G&A expense
Operational improvements
(Millions, except per share data)
4th Qtr.
2008
4th Qtr.
2007
Full-Year
2008
Full-Year
2007
Income (loss) from continuing operations
172.9
$
(27.3)
$
234.8
$
198.3
$
Adjusted income (loss) from continuing
operations
(1)
24.3
$
(0.7)
$
71.9
$
(58.5)
$
Adjusted income (loss) from continuing
operations per diluted share
(1)
0.24
$
(0.01)
$
0.75
$
(0.64)
$
Per Share
Per Share

Free Cash Flow
(1) Reconciliation to GAAP provided on slides 28 through 31.
(2) Includes capital expenditures for the hospital refresh program.
(Millions)
341.8
$
Cash interest expense
(158.5)
Change in working capital
(12.2)
Estimated state tax expense
(5.0)
Capital expenditures for maintenance
(2)
(37.3)
Net settlements on interest rate swap
(20.7)
Dividends paid on convertible perpetual preferred stock
(26.0)
Adjusted free cash flow
82.1
$
Adjusted Consolidated EBITDA
(1)
Year Ended
December 31, 2008

(1) In February 2009, draws under the revolver were reduced to zero.
(2) We expect the letters of credit will be reduced by approximately $33.6 million in connection with implementing the court order approving the
final UBS settlement in the first quarter of 2009.
Liquidity
(Millions)
December 31,
2008
Cash
Available
32.2
$
Revolver
Total line
400.0
$
Less:
– Draws
(40.0)
(1)
– Letters of credit
(52.7)
(2)
Available
307.3
$
Total Liquidity
(available cash and revolver)
339.5
$

UBS Settlement
(Announced October 27, 2008)
$100.0 million in cash (funded by UBS Securities and its insurance
carriers and held in escrow).
$30.7 million release of loan guarantee.
$21.3 million principal
$9.4 million accrued interest (included in interest expense)
Cash + principal = Gain on UBS Settlement.
$26.2 million fees and expenses owed to derivative plaintiffs’ attorneys
(included in professional fees – accounting, tax, and legal).
25% of net settlement proceeds to derivative plaintiffs (included in
government, class action, and related settlements expense).
~ $60 million of net cash proceeds to the Company.
Funds expected to be dispersed to applicable parties in Q109.
Summary 2008 vs. 2007
Volume Revenue EBITDA
+ 7.0% +6.0% +6.4%
Volume and revenue reflect strong organic growth.
Labor productivity (EPOB) helps offset increase in salaries and benefits
(SWB) per employee.
Employees per
Occupied Bed (EPOB)(1) SWB per FTE(1)
-2.7% 7.1%
(1) For full-time equivalents and EPOB table, see slide 22.

2009 Guidance
(1) Reconciliation to GAAP provided on slides 28 through 31.
(2) Adjusted income from continuing operations per diluted share.
Adjusted Consolidated EBITDA(1)
2008 Actual: $341.8 million
2009: Expected to be in the range of $342.0 million to $352.0 million
Adjusted Earnings per Share(1)(2)
2008 Actual: $0.75 per share
2009: Expected to be in the range of $0.85 to $0.90 per share

Appendix

Revenues (Sequential)
The increase in consolidated net operating revenues and volumes sequentially is
partially due to normal seasonality.
Outpatient and other revenue is up sequentially primarily as a result of seasonality.
Net patient revenue/discharge was lower as a result of a slight decline in acuity.
(Millions)
4th Qtr. 2008
3rd Qtr. 2008
Change
Inpatient
418.4
$
411.5
$
1.7%
Outpatient and other
45.4
44.7
1.6%
Consolidated net operating
463.8
$
456.2
$
1.7%
(Actual Amounts)
Discharges
27,654
26,827
3.1%
Net patient revenue/discharge
15,130
$
15,339
$
(1.4%)

Expenses (Sequential)
Adjustments were made to the benefit plans during Q408 and a 3.0% merit increase
was implemented October 1, 2008.
(Millions, except percent)
Salaries and benefits
233.7
$
236.5
$
(1.2)
%
Percent of net operating revenues
50.4%
51.8%
(140)
bps
Hospital related expenses
113.2
$
114.6
$
(1.2)
%
(other operating, supplies, occupancy, bad debts)
Percent of net operating revenues
24.4%
25.1%
(70)
bps
General and administrative
23.5
$
23.0
$
2.2
%
(excludes 123(R) compensation expense)
Percent of net operating revenues
5.1%
5.0%
10
bps
4th Qtr. 2008
3rd Qtr. 2008
Change

Revenues (Year End)
Inpatient revenue growth was driven by strong discharge volumes.
Volume growth was driven by the TeamWorks effort, the acquisition of a 34-bed hospital
in Vineland, NJ, and the acquisitions/consolidations of a 30-bed hospital unit in
Arlington, TX and a 38-bed hospital in Midland, TX.
“Same store” discharge growth was 6.1%, excluding our above-referenced Vineland, NJ
hospital.
Outpatient revenue declined as a result of 11 fewer outpatient satellites year over year.
(Millions)
2008
2007
Change
Inpatient
1,659.5
$
1,544.0
$
7.5%
Outpatient and other
182.9
193.5
(5.5%)
Consolidated net operating
1,842.4
$
1,737.5
$
6.0%
(Actual Amounts)
Discharges
107,780
100,738
7.0%
Net patient revenue/discharge
15,397
$
15,327
$
0.5%

Expenses (Year End)
Salaries and benefits were higher in 2008 driven by higher cost per employee and an
increase in the number of employees needed to manage the increase in discharge
volumes. The increase was offset by a 2.7% improvement in productivity.
Hospital related expenses were higher in 2008 mainly due to higher patient volumes,
but were essentially unchanged as a percent of net operating revenues.
(Millions, except percent)
Salaries and benefits
934.7
$
863.6
$
8.2
%
Percent of net operating revenues
50.7%
49.7%
100
bps
Hospital related expenses
454.8
$
430.1
$
5.7
%
(other operating, supplies, occupancy, bad debts)
Percent of net operating revenues
24.7%
24.8%
(10)
bps
General and administrative
93.8
$
117.3
$
(20.0)
%
(excludes 123(R) compensation expense)
Percent of net operating revenues
5.1%
6.8%
170
bps
Change
2008
2007

Operational and Labor Metrics
(1) Represents discharges from HealthSouth’s consolidated hospitals. As of December 31, 2008, the Company had 90 consolidated hospitals.
(2) Excludes 399 and 459 full-time equivalents for the three months ended December 31, 2008 and 2007, respectively, and 410 and 565 full-time
equivalents for the years ended December 31, 2008 and 2007, respectively, who are considered part of corporate overhead with their salaries
and benefits included in general and administrative expenses in the Company’s condensed consolidated statements of operations. Full-time
equivalents included in the above table represent HealthSouth employees who participate in or support the operations of the Company’s
hospitals.
(3) Employees per occupied bed, or “EPOB,” is calculated by dividing the number of full-time equivalents, including an estimate of full-time
equivalents from the utilization of contract labor, by the number of occupied beds during each period. The number of occupied beds is
determined by multiplying the number of licensed beds by the Company’s occupancy percentage.
2008
2007
2008
2007
Net patient revenue-inpatient
418.4
$
388.4
$
1,659.5
$
1,544.0
$
Net patient revenue-outpatient and
other revenues
45.4
46.1
182.9
193.5
Net operating revenues
463.8
$
434.5
$
1,842.4
$
1,737.5
$
Discharges
(1)
27,654
25,005
107,780
100,738
Outpatient visits
292,081
306,828
1,228,233
1,319,198
Average length of stay
14.3 days
14.9 days
14.7 days
15.1 days
Occupancy %
65.7%
61.6%
66.3%
63.5%
# of licensed beds
6,543
6,573
6,543
6,573
Occupied beds
4,299
4,049
4,338
4,174
Full-time equivalents (FTEs)
(2)
15,550
15,247
15,580
15,406
Contract labor
119
151
170
175
Total FTE and contract labor
15,669
15,398
15,750
15,581
EPOB
(3)
3.64
3.80
3.63
3.73
(Actual Amounts)
(In Millions)
Year Ended
December 31,
Three Months Ended
December 31,

Supplemental Information
For the Year Ended December 31,
100.0%
100.0%
100.0%
Total
2.8%
2.5%
1.8%
Other income
0.4%
0.6%
0.7%
Patients
5.0%
6.3%
7.0%
Other third-party payors
18.5%
18.5%
19.0%
Managed care and other discount plans
2.6%
2.3%
2.1%
Workers' compensation
2.1%
2.0%
2.2%
Medicaid
68.6%
67.8%
67.2%
Medicare
2006
2007
2008
Payment Source
TeamWorks Growth Initiative Implementation and Discharge Growth
Cumulative # of
Hospitals with TeamWorks
Quarter-over-Quarter
Year-over-Year
Q108
44
2.6%
2.6%
Q208
76
5.6%
4.1%
Q308
92
9.3%
5.8%
Q408
93
10.6%
7.0%
% Increase in Discharges for All Hospitals

Debt Schedule
Debt to Adj. Consol. EBITDA on December 31, 2008 = 5.3X ; Target = 4.5X by YE 2010
(1) The Company used approximately $254 million of cash to reduce its total debt outstanding. Due to the addition of two capital leases, the
Company net total debt reduction was $228.3 million.
(2) Credit Agreement limits debt pay down on non–term loan balances. We have the ability to buy back non-term loan debt with the discretionary
cash available to the Company.
(Millions)
2008 Debt
Reduction
(1)(2)
March 2012
$ 40.0
$ 75.0
$ 35.0
Term loan facility - March 2013
783.6
862.8
79.2
Bonds Payable:
7.000%
Senior Notes due 2008
-
5.0
5.0
10.750%
Senior Subordinated Notes due 2008
-
30.3
30.3
8.500%
Senior Notes due 2008
-
9.4
9.4
8.375%
Senior Notes due 2011
0.3
0.3
-
7.625%
Senior Notes due 2012
1.5
1.5
-
Floating Rate Senior Notes due 2014
366.0
375.0
9.0
(6 month Libor plus 600)
10.75%
Senior Notes due 2016
494.3
558.2
63.9
from 7.9% to 12.9%
12.8
17.0
4.2
Capital lease obligations
115.9
108.2
(7.7)
Total
1,814.4
$
2,042.7
$
228.3
$
Year-to-date debt reduction
(1)(2)
228.3
$
December 31,
2008
Debt Balances
Notes payable to banks and others at interest rates
December 31,
2007
Advances under $400 million revolving credit facility,
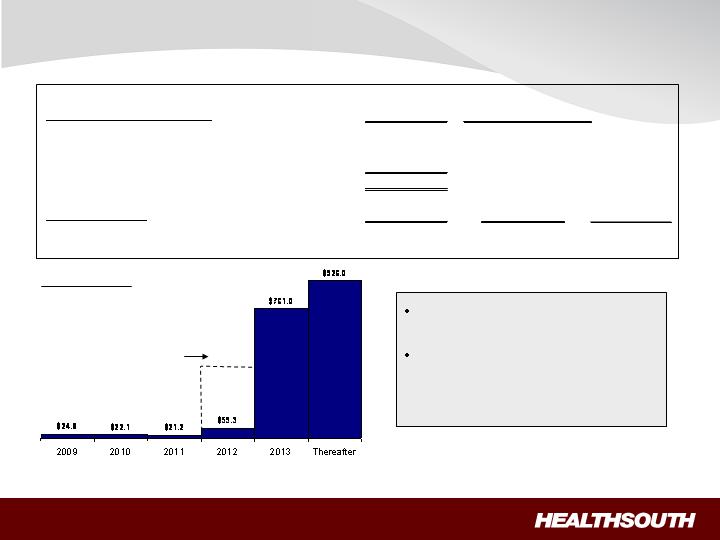
Debt Maturities and Swap
(Millions)
$400.0
Undrawn revolver
goes away in 2012
(1) We have the flexibility to peg 1,2,3 or 6 month Libor, or Prime.
(2) On December 31, 2008, a portion of the term loan was pegged to Prime.
Minimal amortization and no
near-term financing risk
As of December 31, 2008, we
were in compliance with the
covenants under our Credit
Agreement
Debt Maturities
December 31,
Floating Rate Debt Balances
2008
Advances under $400 million revolving credit facility
40.0
$
Libor plus 325
(1)
Term loan facility
783.6
Libor plus 250
(1)(2)
Floating Rate Senior Notes due 2014
366.0
6 month Libor +6%
Total
1,189.6
$
Swap Settlement
Dec. 31, 2008
March 2009
March 2011
Notional amount of the interest rate swap
1,121.2
$
1,056.0
$
-
$
Receive 3 month Libor and pay 5.22% fixed
Floating Interest Rate

Non-Operating Cash/Tax Position
Cash Refunds
$55.9 million receivable on balance sheet at
December 31, 2008.
$24 million tax refund + applicable interest
approved by Joint Committee on Taxation;
cash received in February 2009.
Future Cash Tax Payments
With over $2.5 billion in NOLs and tax
deductions, we do not expect to pay significant
federal income tax for the next 10-12 years.
Expect to pay about $5-7 million per year state
income tax.
Some exposure to Alternative Minimum Tax
(AMT).
GAAP Considerations
HealthSouth’s balance sheet currently reflects
a valuation allowance for the potential value
of NOLs and future deductions. The valuation
allowance is approximately $1.0 billion.
GAAP tax rate will net to small amount for
foreseeable future as there will be a reduction
in the valuation allowance when NOLs are
utilized.
NOL Usage
HealthSouth does not have an annual use
limitation (AUL) under section 382.
If we experienced a “change of ownership” as
defined by the Internal Revenue Service we
would be subject to an AUL. However, even
with a change of ownership we do not expect to
pay significant federal income tax for the next
10-12 years.

Outstanding Share Summary
(Millions)
4th Qtr.(4)
2008
4th Qtr.
2007
Year-End(4)
2008
Year-End
2007
Basic shares outstanding
(2)(3)
87.4
78.6
83.0
78.7
Diluted shares outstanding
(1)(2)(3)
100.7
91.9
96.4
92.0
Basic shares outstanding
(2)(3)
88.0
78.7
88.0
78.7
Diluted shares outstanding
(1)(2)(3)
101.3
92.0
101.4
92.0
Notes:
Average for the Period
End of Period
(1) The difference between the basic and diluted shares outstanding is primarily related to our convertible perpetual preferred
stock.
(2) Does not include warrants issued in connection with a January 2004 loan repaid to Credit Suisse First Boston. In
connection with this transaction, we issued warrants to the lender to purchase two million shares of our common stock.
Each warrant has a term of ten years from the date of issuance and an exercise price of $32.50 per share. The warrants
were not assumed exercised for dilutive shares outstanding because they were antidilutive in the periods presented.
(3) Does not include approximately 5.0 million shares of common stock and warrants to purchase approximately 8.2 million
shares of common stock at a strike price of $41.40 to settle our class action securities litigation. This agreement received
final court approval on January 11, 2007. As of December 31, 2008, these shares of common stock and warrants have
not been issued and are not included in our basic or diluted common shares outstanding. We expect a ruling in the first
quarter 2009. If the judgment is affirmed, the distribution would occur in the first half of 2009.
(4) Completed an equity offering for 8.8 million shares on June 27, 2008.

Fourth Quarter Reconciliation of Net Income (Loss) to Adjusted Income (Loss) from
Continuing Operations and Adjusted Consolidated EBITDA (1)(3)(4)
Per Share
(2)
Net income (loss)
$
181.9
2.08
$
$
(45.9)
$
(0.58)
(Income) loss from discontinued operations
(9.0)
(0.10)
18.6
0.24
Income (loss) from continuing operations
172.9
1.98
(27.3)
(0.35)
Gain on UBS Settlement
(121.3)
(1.39)
-
-
Government, class action, and related settlements
(39.3)
(0.45)
31.2
0.40
Professional fees - accounting, tax, and legal
31.5
0.36
7.3
0.09
Loss on interest rate swap
39.6
0.45
23.6
0.30
Provision for income tax benefit
(48.4)
(0.55)
(34.2)
(0.44)
Interest associated with UBS Settlement
(9.4)
(0.11)
-
-
Estimated state tax expense
(1.3)
(0.01)
(1.3)
(0.02)
Adjusted income (loss) from continuing operations
(1)(3)
24.3
0.28
(0.7)
(0.01)
Adjustment to GAAP EPS for dilution
(2)
(0.04)
-
Adjusted income (loss) from continuing operations per
per diluted share
(2)(3)
$ 0.24
$
(0.01)
Estimated state tax expense
1.3
1.3
Interest expense and amortization of debt discounts and fees,
excluding interest associated with the UBS Settlement
37.8
51.9
Depreciation and amortization
18.0
19.4
81.4
71.9
Other adjustments per the Company's Credit Agreement:
Impairment charges related to investments
1.8
-
Net noncash loss on disposal of assets
1.4
3.6
Loss on early extinguishment of debt
0.1
8.3
Compensation expense under FASB Statement No. 123(R)
3.2
2.5
Other
(0.1)
0.1
Adjusted Consolidated EBITDA
(1)(3)(4)
$
87.8
86.4
$
Weighted average common shares outstanding:
Basic
87.4
78.6
Diluted
100.7
91.9
Per Share
(2)
(In Millions, Except Per Share Data)
Three Months Ended December 31,
2007
2008

Twelve Month Reconciliation of Net Income to Adjusted Income (Loss) from Continuing
Operations and Adjusted Consolidated EBITDA(1)(3)(4)
Per Share
(2)
Net income
$
252.4
3.04
$
$
653.4
$
8.30
Income from discontinued operations
(17.6)
(0.21)
(455.1)
(5.78)
Income from continuing operations
234.8
2.83
198.3
2.52
Gain on UBS Settlement
(121.3)
(1.46)
-
-
Government, class action, and related settlements
(67.2)
(0.81)
(2.8)
(0.04)
Professional fees - accounting, tax, and legal
44.4
0.53
51.6
0.66
Loss on interest rate swap
55.7
0.67
30.4
0.39
Accelerated depreciation of corporate campus
10.0
0.12
-
-
Gain on sale of investment in Source Medical
-
-
(8.6)
(0.11)
Interest associated with UBS Settlement
(9.4)
(0.11)
-
`
Provision for income tax benefit
(70.1)
(0.84)
(322.4)
(4.10)
Estimated state tax expense
(5.0)
(0.06)
(5.0)
(0.06)
Adjusted income (loss) from continuing operations
(1)(3)
71.9
0.87
(58.5)
(0.74)
Adjustment to GAAP EPS for dilution
(2)
(0.12)
0.10
Adjusted income (loss) from continuing operations per
diluted share
(2)(3)
$ 0.75
$
(0.64)
Estimated state tax expense
5.0
5.0
Interest expense and amortization of debt discounts and fees,
excluding interest associated with the UBS Settlement
169.1
229.8
Depreciation and amortization, excluding accelerated
depreciation of corporate campus
73.8
76.2
319.8
252.5
Other adjustments per the Company's Credit Agreement:
Impairment charges, including investments
2.4
15.1
Net noncash loss on disposal of assets
2.0
5.9
Loss on early extinguishment of debt
5.9
28.2
Gain on sale of investment in Source Medical
-
8.6
Compensation expense under FASB Statement No. 123(R)
11.7
10.6
Other
-
0.4
Adjusted Consolidated EBITDA
(1)(3)(4)
$
341.8
$
321.3
Weighted average common shares outstanding:
Basic
83.0
78.7
Diluted
96.4
92.0
(In Millions, Except Per Share Data)
2007
2008
Per Share
(2)
Year Ended December 31,

2008 Reconciliation of Adjusted Consolidated EBITDA(1) to Net Cash Provided by
Operating Activities
Year Ended
December 31, 2008
Adjusted Consolidated EBITDA
341.8
$
Compensation expense under FASB Statement No. 123(R)
(11.7)
Provision for doubtful accounts
27.8
Professional fees—accounting, tax, and legal
(44.4)
Interest expense and amortization of debt discounts and fees
(159.7)
Loss on sale of investments
1.4
Equity in net income of nonconsolidated affiliates
(10.6)
Minority interests in earnings of consolidated affiliates
29.8
Amortization of debt discounts and fees
6.5
Amortization of restricted stock
6.7
Distributions from consolidated affiliates
10.9
Stock-based compensation
5.0
Current portion of income tax benefit
73.8
Change in assets and liabilities
(49.1)
Change in government, class action, and related settlements
(7.4)
Other operating cash provided by discontinued operations
6.4
Net cash provided by operating activities
227.2
$

Reconciliation Notes
1.
Adjusted income (loss) from continuing operations and Adjusted Consolidated EBITDA are
non-GAAP financial measures. Management and some members of the investment
community utilize adjusted income (loss) from continuing operations as a financial measure
and Adjusted Consolidated EBITDA as a liquidity measure on an ongoing basis. These
measures are not recognized in accordance with GAAP and should not be viewed as an
alternative to GAAP measures of performance or liquidity. In evaluating these adjusted
measures, the reader should be aware that in the future HealthSouth may incur expenses
similar to the adjustments set forth above.
2.
Per share amounts for the three months and twelve months ended December 31, 2008 and
2007 are based on basic weighted average common shares outstanding for all amounts
except adjusted income (loss) from continuing operations per diluted share, which is based on
diluted weighted average shares outstanding. The difference in shares between the basic and
diluted shares outstanding is primarily related to our convertible perpetual preferred stock. Per
share amounts do not include 5.0 million shares not yet issued under the securities litigation
settlement. The calculation of adjusted loss from continuing operations per diluted share
ignores the antidilutive impact in 2007.
3.
Adjusted income (loss) from continuing operations per diluted share and Adjusted
Consolidated EBITDA are two components of our guidance.
4.
The Company’s Credit Agreement allows all unusual non-cash or non-recurring charges to be
added to arrive at Adjusted Consolidated EBITDA.