
First Quarter 2009 Earnings Call
Supplemental Slides
Exhibit 99.2

The information contained in this presentation includes certain estimates, projections and other forward-
looking information that reflect our current views with respect to future events and financial performance.
These estimates, projections and other forward-looking information are based on assumptions that
HealthSouth believes, as of the date hereof, are reasonable. Inevitably, there will be differences between
such estimates and actual results, and those differences may be material.
There can be no assurance that any estimates, projections or forward-looking information will be realized.
All such estimates, projections and forward-looking information speak only as of the date hereof.
HealthSouth undertakes no duty to publicly update or revise the information contained herein.
You are cautioned not to place undue reliance on the estimates, projections and other forward-looking
information in this presentation as they are based on current expectations and general assumptions and
are subject to various risks, uncertainties and other factors, including those set forth in our Form 10-K for
the fiscal year ended December 31, 2008, the Form 10-Q for quarter ended March 31, 2009, when filed,
and in other documents we previously filed with the SEC, many of which are beyond our control, that may
cause actual results to differ materially from the views, beliefs and estimates expressed herein.
Note Regarding Presentation of Non-GAAP Financial Measures
The following presentation includes certain “non-GAAP financial measures” as defined in Regulation G
under the Securities Exchange Act of 1934. A schedule is attached that reconciles the non-GAAP financial
measures included in the following presentation to the most directly comparable financial measures
calculated and presented in accordance with Generally Accepted Accounting Principles in the United
States. Our Form 8-K, dated May 4, 2009, to which the following supplemental slides are attached as
Exhibit 99.2, provides further explanation and disclosure regarding our use of non-GAAP financial
measures and should be read in conjunction with these supplemental slides.
Forward-Looking Statements

Table of Contents
Highlights……………………………………………………………………………………………..
Revenues …………………………………………………………………………………………....
Expenses …………………………………………………………………………………………….
Adjusted Consolidated EBITDA …….……………………………….…………………………....
Adjusted Income per Share ……….……………………………………………………………....
Free Cash Flow……………………………………………………………………………………...
Debt Reduction…………………………………………………………………………..................
Liquidity……………………………………………………………………………………………….
2009 Guidance……………………………………………………………………………………....
Appendix……………………………………………………………………………………………..
Revenues (Sequential)……………………………………………………………………………..
Expenses (Sequential)……………………………………………………………………………...
Operational and Labor Metrics……………………………………………………………………..
Payment Sources………..…………………………………………………………………………..
Debt Maturities……………………………………………………………………………………….
Interest Rate Swaps……………………...………………………………………………………….
Debt Schedule………………………………………………………………………………………..
Non-Operating Cash/Tax Position..………………………………………………………………..
Outstanding Share Summary……………………………………………………………………....
US GAAP Reconciliations…………………………………………………………………………..
4
5
6
7
8
9
10
11
12
13
14
15
16
17
18
19
20
21
22
23-26

Highlights: Q1 2009
Achieved 5.7% quarter-over-quarter discharge growth.
Same store discharge growth was 4.8%.
Revenue growth of 2.3%.
Driven by higher discharge volume which more than offset the Medicare price
roll-back and lower outpatient revenue.
Cost-effective, high-quality patient care.
Driven by effective management of hospital expenses and improved labor
productivity.
Reduced debt by $85.1 million since year end.
Leverage ratio reduced to 4.9x(1) from 5.3x at year end.
Received UBS Settlement net proceeds of approximately $60 million.
(1) Based on trailing four quarter Adjusted Consolidated EBITDA of $351.2 million; reconciliation to GAAP provided on slides 23 through 26.

Revenues (Q1 2009 vs. Q1 2008)
Inpatient revenue growth was driven by strong discharge volumes, offset by the Medicare price
roll-back.
Volume growth was driven by the sustained TeamWorks effort and disciplined development.
Same store discharge growth was 4.8%.
Net patient revenue / discharge was lower in Q109 due to the Medicare price roll-back, offset by
higher non-Medicare pricing.
Outpatient revenue declined as a result of 12 fewer outpatient satellites quarter over quarter.
Favorable/
(Unfavorable)
(Millions)
1st Qtr. 2009
1st Qtr. 2008
Change
Inpatient
433.1
$
419.1
$
3.3%
Outpatient and other
42.0
45.1
(6.9%)
Consolidated net operating
475.1
$
464.2
$
2.3%
(Actual Amounts)
Discharges
27,807
26,309
5.7%
Net patient revenue / discharge
15,575
$
15,930
$
(2.2%)

Expenses (Q1 2009 vs. Q1 2008)
Adjustments made to benefit plans are reflected in Q109 results.
Continued progress on labor productivity demonstrated by lower EPOB.
Reduced hospital related expenses as a result of lower costs for TeamWorks.
Lower general and administrative as a result of right sizing the corporate office.
Favorable/
(Unfavorable)
(Millions, except percent)
1st Qtr. 2009
1st Qtr. 2008
Change
Salaries and benefits
234.7
$
230.4
$
(1.9%)
Percent of net operating revenues
49.4%
49.6%
20 bps
EPOB (employee per occupied bed)
3.47
3.53
1.7%
Hospital related expenses
114.6
$
115.8
$
1.0%
(other operating, supplies, occupancy, bad debts)
Percent of net operating revenues
24.1%
24.9%
80 bps
General and administrative
21.8
$
24.8
$
12.1%
(excludes 123(R) compensation)
Percent of net operating revenues
4.6%
5.3%
70 bps
Adjusted Consolidated EBITDA(1)
(Millions)
(1) Reconciliation to GAAP provided on slides 23 through 26.
Strong volume growth in Q109 helped offset the Medicare price roll-back.
Medicare market basket update: $7-8 million benefit in Q108.
Quarter-over-quarter improvement driven by:
Increased volumes
Lower G&A
Effective management of hospital related expenses
Improved labor productivity
1st Qtr.
1st Qtr.
2009
2008
$
%
98.7
$
89.2
$
9.5
$
10.7%
Change

Adjusted Income per Share
(1) Reconciliation to GAAP provided on slides 23 through 26.
Quarter-over-quarter adjusted income from continuing operations per diluted
share improved by $0.21 per share. Major drivers were:
Higher revenue driven by discharge growth
Lower interest expense
Lower G&A expense
Effective management of hospital related expenses
Improved labor productivity
1st Qtr.
1st Qtr.
(Millions, except per share data)
2009
2008
$
%
Income from continuing operations
attributable to HealthSouth
48.0
$
4.6
$
43.4
$
943.5%
Adjusted income from continuing
operations
(1)
39.8
$
17.0
$
22.8
$
134.1%
Adjusted income from continuing
operations per diluted share
(1)
0.39
$
0.18
$
0.21
$
116.7%
Per Share
Change

Free Cash Flow
(1)Includes capital expenditures for the hospital refresh program.
(Millions)
183.1
$
41.8
$
Incremental income tax expense
(0.3)
(1.4)
Capital expenditures for maintenance
(1)
(7.5)
(8.7)
Net settlements on interest rate swap
(8.5)
(0.2)
Dividends paid on convertible perpetual
preferred stock
(6.5)
(6.5)
Non-recurring items:
UBS Settlement proceeds,
less fees to derivative plaintiffs' attorneys
(73.8)
-
Income tax refund receivable
(47.8)
(3.8)
Adjusted free cash flow
38.7
$
21.2
$
Net cash provided by operating activities
2008
2009
Three Months Ended March 31,
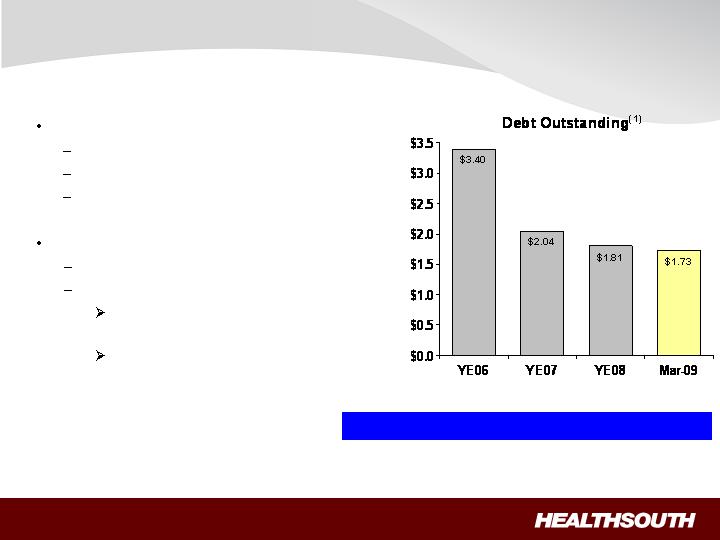
No near-term refinancing
Revolver = 2012
Term Loan = 2013
Bonds = 2014 & 2016
Future deleveraging:
Excess cash from operations
Derivative proceeds
UBS Settlement; net recovery
of ~ $60 million in cash
E&Y and Scrushy litigation
on-going
(1) Credit Agreement limits debt pay down on non–term loan balances. We have the right to buy back non-term loan debt with the discretionary
cash available to the Company.
(2) Based on four quarter trailing Adjusted Consolidated EBITDA of $351.2 million; see related debt schedule on slide 20, and reconciliation to
GAAP on slides 23 through 26.
Debt to EBITDA 6.3x 6.3x 5.3x 4.9x(2)
($ Billions)
Year-End 2012 Goal: 3.5x to 4.0x
Debt Reduction

Liquidity
(Millions)
March 31, 2009
December 31, 2008
Cash
Available
90.7
$
32.2
$
Revolver
Total line
400.0
$
400.0
$
Less:
– Draws
-
(40.0)
– Letters of credit
-
(52.7)
Available
400.0
$
307.3
$
Total Liquidity
(available cash and revolver)
490.7
$
339.5
$

2009 Guidance
(1) Reconciliation to GAAP provided on slides 23 through 26.
(2) Adjusted income from continuing operations per diluted share.
Adjusted Consolidated EBITDA(1)
2009 Range: $342.0 million to $352.0 million
Expect to be at the higher end of the range
Adjusted Earnings per Share(1)(2)
2009 Range: $0.85 to $0.90 per share
Expect to be at the higher end of the range
Key Drivers:
Sustainable discharge growth
Bed expansions
New hospitals
Cost-effective, high-quality patient care
Deleveraging

Appendix

Revenues (Sequential)
Inpatient revenue growth was driven by strong discharge growth and higher
revenue / discharge.
Favorable
(Unfavorable)
(Millions, except percent)
1st Qtr. 2009
4th Qtr. 2008
Change
Inpatient
433.1
$
418.4
$
3.5%
Outpatient and other
42.0
44.6
(5.8%)
Consolidated net operating
475.1
$
463.0
$
2.6%
(Actual Amounts)
Discharges
27,807
27,654
0.6%
Net patient revenue / discharge
15,575
$
15,130
$
2.9%

Expenses (Sequential)
Cost-effective, high-quality patient care.
Adjustments made to benefit plans are reflected in Q109 results.
Continued progress on labor productivity demonstrated by lower EPOB.
Favorable
(Unfavorable)
(Millions, except percent)
1st Qtr. 2009
4th Qtr. 2008
Change
Salaries and benefits
234.7
$
233.7
$
(0.4%)
Percent of net operating revenues
49.4%
50.5%
110 bps
EPOB (employee per occupied bed)
3.47
3.64
4.7%
Hospital related expenses
114.6
$
112.7
$
(1.7%)
(other operating, supplies, occupancy, bad debts)
Percent of net operating revenues
24.1%
24.3%
20 bps
General and administrative
21.8
$
23.5
$
7.2%
(excludes 123(R) compensation)
Percent of net operating revenues
4.6%
5.1%
50 bps

Operational and Labor Metrics
(1) Represents discharges from HealthSouth’s 90 consolidated hospitals.
(2) Excludes 395 and 444 full-time equivalents for the three months ended March 31, 2009 and 2008, respectively, who are considered part of
corporate overhead with their salaries and benefits included in general and administrative expenses in the Company’s condensed
consolidated statements of operations. Full-time equivalents included in the above table represent HealthSouth employees who participate in
or support the operations of the Company’s hospitals.
(3) Employees per occupied bed, or “EPOB,” is calculated by dividing the number of full-time equivalents, including an estimate of full-time
equivalents from the utilization of contract labor, by the number of occupied beds during each period. The number of occupied beds is
determined by multiplying the number of licensed beds by the Company’s occupancy percentage.
2009
2008
Net patient revenue-inpatient
433.1
$
419.1
$
Net patient revenue-outpatient and
other revenues
42.0
45.1
Net operating revenues
475.1
$
464.2
$
Discharges
(1)
27,807
26,309
Outpatient visits
285,101
306,145
Average length of stay
14.6 days
15.2 days
Occupancy %
69.4%
67.0%
# of licensed beds
6,523
6,565
Occupied beds
4,527
4,399
Full-time equivalents (FTEs)
(2)
15,566
15,319
Contract labor
144
202
Total FTE and contract labor
15,710
15,521
EPOB
(3)
3.47
3.53
Three Months Ended
March 31,
(In Millions)
(Actual Amounts)

Payment Sources
(1) Medicare Advantage revenues are included in “Managed care and other discount plans.”
2009
2008
Medicare
68.6%
68.2%
Medicaid
2.1%
2.3%
Workers' compensation
1.7%
2.2%
Managed care and other discount plans
(1)
22.2%
21.3%
Other third-party payors
3.2%
3.5%
Patients
0.8%
0.8%
Other income
1.4%
1.7%
Total
100.0%
100.0%
Three Months Ended March 31,
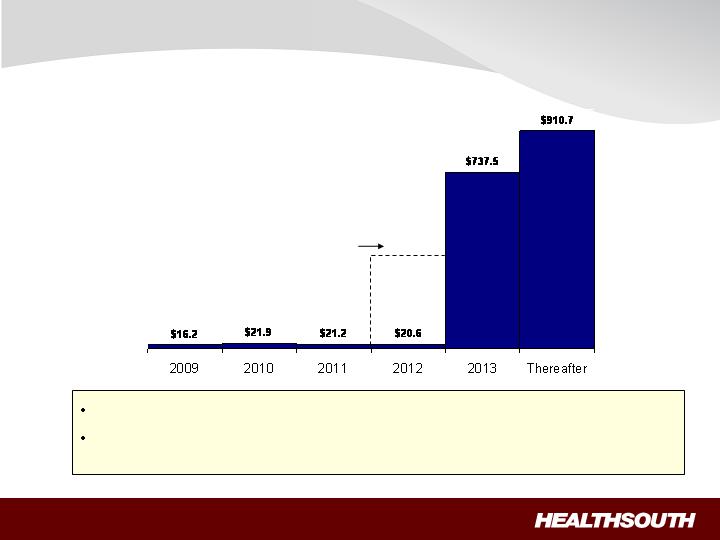
Debt Maturities
(Millions)
$400.0
Undrawn revolver
goes away in 2012
Minimal amortization and no near-term financing risk.
As of March 31, 2009, we were in compliance with the covenants under
our Credit Agreement.
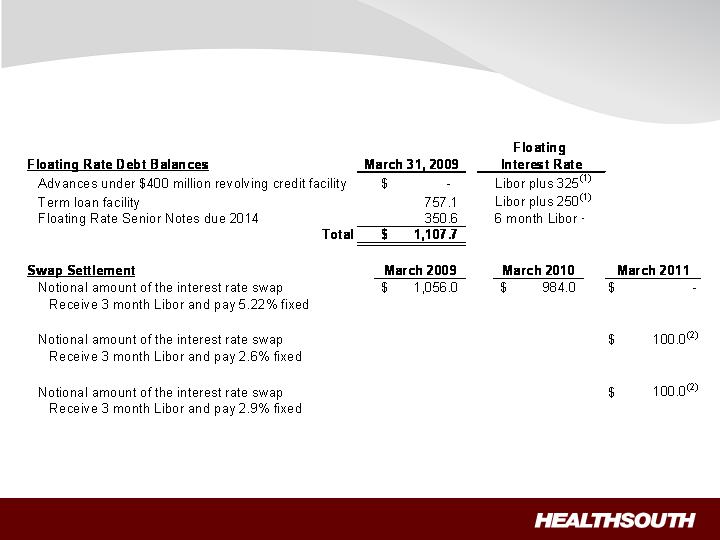
Interest Rate Swaps
(Millions)
(1) We have the flexibility to peg 1,2,3 or 6 month Libor, or Prime.
(2) Forward-starting interest rate swaps (designated as cash flow hedges).

Debt Schedule
(1) The Company had $90.7 million in cash and cash equivalents as of March 31, 2009.
(2) Credit Agreement limits debt pay down on non–term loan balances. We have the ability to buy back non-term loan debt with the discretionary
cash available to the Company.
(Millions)
Q109 Debt
Reduction
(1)(2)
March 2012
$ -
$ 40.0
$ (40.0)
Term loan facility - March 2013
757.1
783.6
(26.5)
Bonds Payable:
8.375%
Senior Notes due 2011
0.3
0.3
-
7.625%
Senior Notes due 2012
1.5
1.5
-
Floating Rate Senior Notes due 2014
350.6
366.0
(15.4)
(6 month Libor plus 600)
10.75%
Senior Notes due 2016
494.5
494.3
0.2
from 7.9% to 12.9%
12.6
12.8
(0.2)
Capital lease obligations
111.5
114.7
(3.2)
Total
1,728.1
$
1,813.2
$
(85.1)
$
Year-to-date debt reduction
(1)(2)
85.1
$
Debt Balances
December 31,
2008
Notes payable to banks and others at interest rates
Advances under $400 million revolving credit facility,
March 31,
2009

Non-Operating Cash/Tax Position
Cash Refunds
Federal tax recoveries virtually complete.
Approx. $42 million received in Q109.
State tax refunds in progress.
Approx. $6 million received in Q109.
Approx. $8 million net receivable on the
balance sheet March 31, 2009.
Future Cash Tax Payments
Expect to pay about $5-7 million per year of
income tax.
State income tax
Alternative Minimum Tax (AMT)
With over $2.5 billion in NOLs and tax
deductions, we do not expect to pay significant
federal income taxes for approximately the next
10-12 years.
At this time, we do not believe the use of
NOLs will be limited before they expire,
however, no assurances can be
provided.
HealthSouth is not currently subject to an
annual use limitation (AUL) under the Internal
Revenue Service section 382.
If we experienced a “change of ownership” as
defined by the Internal Revenue Service section
382, we would be subject to an AUL which is
equal to the value of the company at the time of
the “change of ownership” multiplied by the
long-term tax exempt rate.
GAAP Considerations
HealthSouth’s balance sheet currently reflects
a valuation allowance for the potential value
of NOLs and future deductions. The valuation
allowance is approximately $1.0 billion.
GAAP tax rate will net to small amount for
foreseeable future as there will be a reduction
in the valuation allowance when NOLs are
utilized.

Outstanding Share Summary
(Millions)
1st Qtr.(4)
2009
1st Qtr.
2008
Year-End(4)
2008
Year-End
2007
Basic shares outstanding
(2)(3)
87.5
78.9
83.0
78.7
Diluted shares outstanding
(1)(2)(3)
100.9
92.3
96.4
92.0
Basic shares outstanding
(2)(3)
88.3
79.1
88.0
78.7
Diluted shares outstanding
(1)(2)(3)
101.7
92.5
101.4
92.0
Notes:
Average for the Period
End of Period
(1) The difference between the basic and diluted shares outstanding is primarily related to our convertible perpetual preferred
stock.
(2) Does not include warrants issued in connection with a January 2004 loan repaid to Credit Suisse First Boston. In
connection with this transaction, we issued warrants to the lender to purchase two million shares of our common stock.
Each warrant has a term of ten years from the date of issuance and an exercise price of $32.50 per share. The warrants
were not assumed exercised for dilutive shares outstanding because they were antidilutive in the periods presented.
(3) Does not include approximately 5.0 million shares of common stock and warrants to purchase approximately 8.2 million
shares of common stock at a strike price of $41.40 to settle our class action securities litigation. This agreement received
final court approval on January 11, 2007. As of March 31, 2009, these shares of common stock and warrants have not
been issued and are not included in our basic or diluted common shares outstanding. We expect a ruling before the end
of third quarter. If the judgment is affirmed, the distribution would occur in 2009.
(4) Completed an equity offering for 8.8 million shares on June 27, 2008.
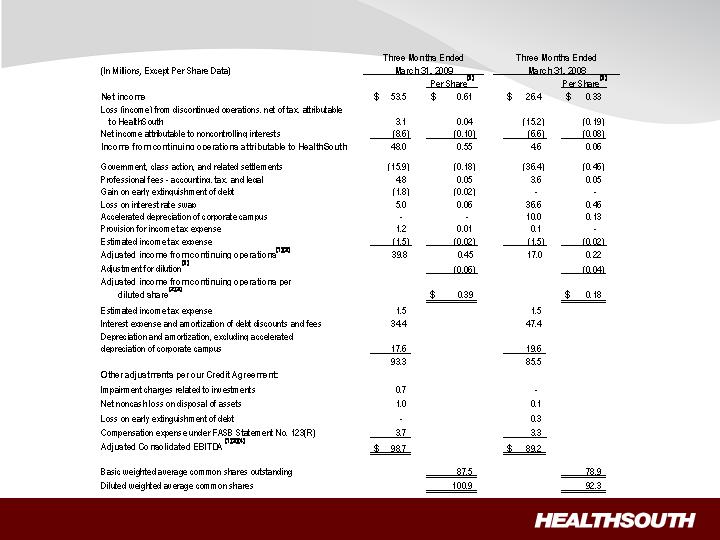
First Quarter Reconciliation of Net Income to Adjusted Income from Continuing
Operations and Adjusted Consolidated EBITDA (1)(3)
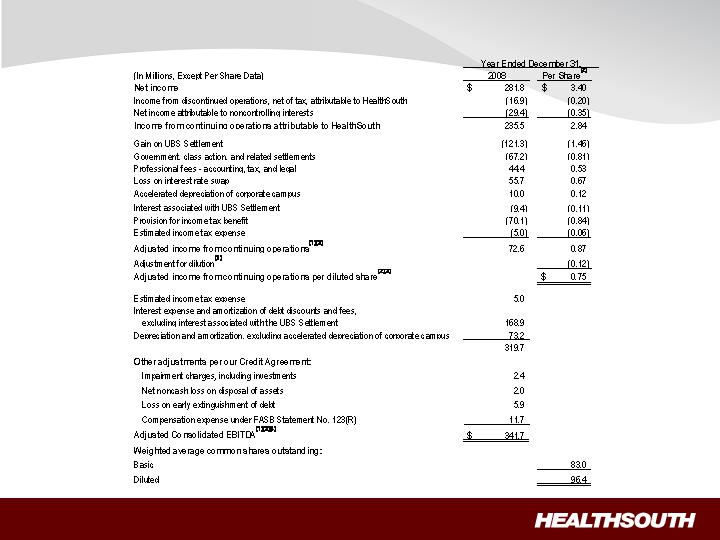
2008 Year-End Reconciliation of Net Income to Adjusted Income from
Continuing Operations and Adjusted Consolidated EBITDA(1)(3)

First Quarter Reconciliation of Adjusted Consolidated EBITDA(1) to Net Cash
Provided by Operating Activities

Reconciliation Notes
1.
Adjusted income from continuing operations and Adjusted Consolidated EBITDA are
non-GAAP financial measures. Management and some members of the investment
community utilize adjusted income from continuing operations as a financial measure
and Adjusted Consolidated EBITDA as a liquidity measure on an ongoing basis. These
measures are not recognized in accordance with GAAP and should not be viewed as an
alternative to GAAP measures of performance or liquidity. In evaluating these adjusted
measures, the reader should be aware that in the future HealthSouth may incur
expenses similar to the adjustments set forth above.
2.
Per share amounts for the three months ended March 31, 2009 and 2008 are based on
basic weighted average common shares outstanding for all amounts except adjusted
income from continuing operations per diluted share, which is based on diluted weighted
average shares outstanding. The difference in shares between the basic and diluted
shares outstanding is primarily related to our convertible perpetual preferred stock. Per
share amounts do not include 5.0 million shares not yet issued under the securities
litigation settlement.
3.
Adjusted income from continuing operations per diluted share and Adjusted
Consolidated EBITDA are two components of our guidance.
4.
The Company’s Credit Agreement allows certain other items to be added to arrive at
Adjusted Consolidated EBITDA, and there may be certain other deductions required.