
HealthSouth
Robert W. Baird & Co.
2009 Growth Stock Conference
Chicago, Illinois
May 14, 2009
Exhibit 99.1

Note Regarding Forward-Looking Statements
The information contained in this presentation includes certain estimates, projections and other forward-
looking information that reflect our current views with respect to future events and financial performance.
These estimates, projections and other forward-looking information are based on assumptions that
HealthSouth believes, as of the date hereof, are reasonable. Inevitably, there will be differences between
such estimates and actual results, and those differences may be material.
There can be no assurance that any estimates, projections or forward-looking information will be realized.
All such estimates, projections and forward-looking information speak only as of the date hereof.
HealthSouth undertakes no duty to publicly update or revise the information contained herein.
You are cautioned not to place undue reliance on the estimates, projections and other forward-looking
information in this presentation as they are based on current expectations and general assumptions and are
subject to various risks, uncertainties and other factors, including those set forth in our Form 10-K for the
year ended December 31, 2008, the Form 10-Q for the quarter ended March 31, 2009, and in other
documents we previously filed with the SEC, many of which are beyond our control, that may cause actual
results to differ materially from the views, beliefs and estimates expressed herein.
Note Regarding Presentation of Non-GAAP Financial Measures
The following presentation includes certain “non-GAAP financial measures” as defined in Regulation G under
the Securities Exchange Act of 1934. The Appendix at the end of this presentation includes reconciliations of
the non-GAAP financial measures found in the following presentation to the most directly comparable
financial measures calculated and presented in accordance with Generally Accepted Accounting Principles
in the United States. Our Form 8-K, dated May 13, 2009, to which the following presentation slides are
attached as Exhibit 99.1, provides further explanation and disclosure regarding our use of non-GAAP
financial measures and should be read in conjunction with these presentation slides.
Cautionary Statements
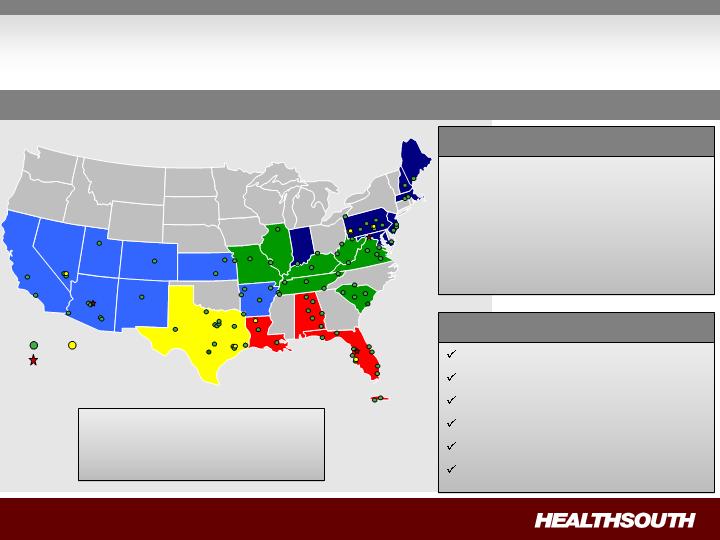
HealthSouth Today
IRH
LTCH
93 Rehabilitation Hospitals and
Outpatient Departments
6 Long-Term Acute Care Hospitals
48 Outpatient Satellites
25 Hospital-Based Home
Health Agencies
Operational Components
Rehabilitation Nursing
Physical Therapy
Occupational Therapy
Speech-Language Therapy
Case Management
Specialized Technology
Major Services
Largest Provider of Inpatient Rehabilitative Healthcare Services in the U.S.
Development Sites
Employees: ~ 22,000
Corporate Office: Birmingham, AL
Exchange (Symbol): NYSE (HLS)
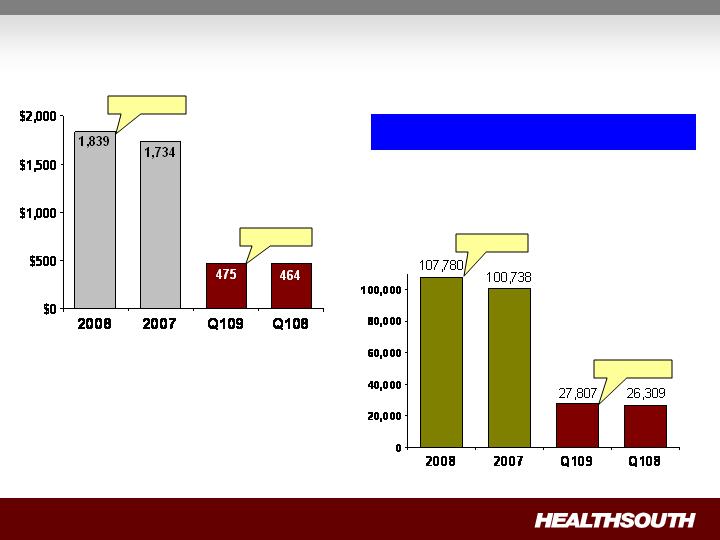
Positioned for Growth
+ 2.3%
+ 6.1%
Consolidated Net Operating Revenues
Discharge Volume
+ 5.7%
+ 7.0%
Volume growth drove revenue growth.
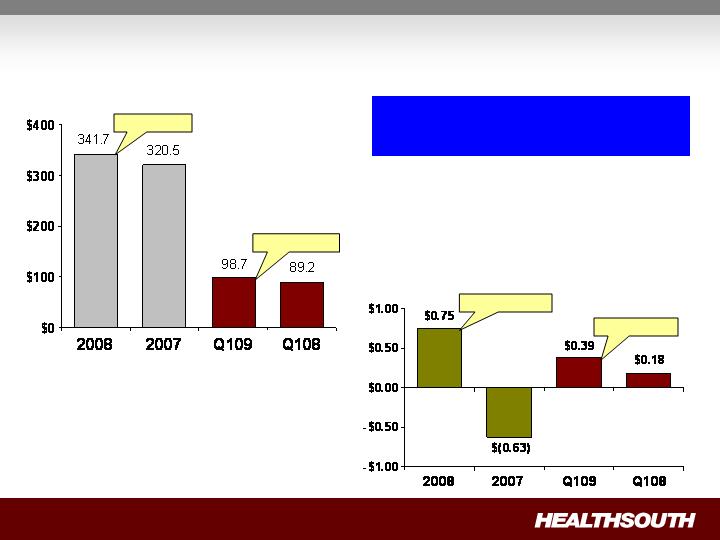
Positioned for Growth (cont’d)
Adjusted Consolidated EBITDA(1)
+ 10.7%
+ 6.6%
+ 219.0%
+ 116.7%
Adjusted Income (Loss) from
Continuing Operations per Diluted
Share (1)
Adjusted Consolidated EBITDA
growth coupled with deleveraging
drove very strong EPS growth.
(1) Reconciliation to GAAP provided on slides 33 through 36.

Longer term, we will pursue acquisitions of complementary,
post-acute services provided they are accretive to HealthSouth.
5-8+% annual Adjusted Consolidated EBITDA growth
15-20+% annual Adjusted EPS(1) growth
Strategy:
To create shareholder value as the preeminent provider of
rehabilitative care in the U.S. by:
Driving organic growth through operational excellence;
Creating a strong balance sheet through deleveraging; and
Pursuing disciplined, opportunistic growth.
(1) Adjusted income from continuing operations per diluted share.
HealthSouth’s volume growth
outpaced competitors’ in 2008.
Improvement in operating
expenses as % of Net
Revenues (Q109 vs. Q108)
Salaries and Benefits = 49.4%
Improved by 20 bp
Hospital-related exp. = 24.1%
Improved by 80 bp
G&A = 4.6%
Improved by 70 bp
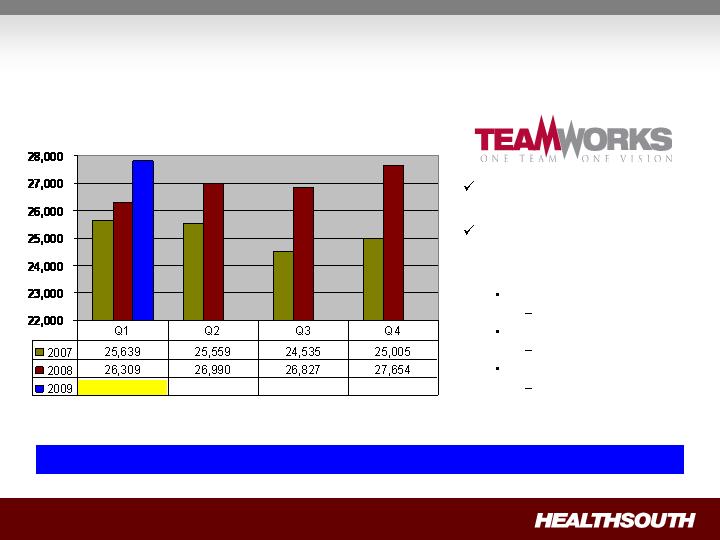
Organic Growth
Projected sustainable discharge growth: 4+% annual
Discharge Volume by Quarter
27,807
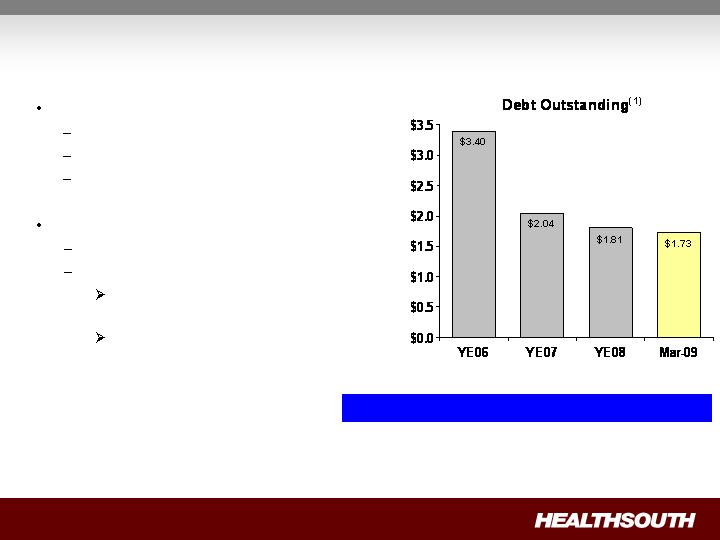
No near-term refinancing
Revolver = 2012
Term Loan = 2013
Bonds = 2014 & 2016
Future deleveraging:
Excess cash from operations
Derivative proceeds
UBS Settlement; net recovery
of ~ $60 million in cash
E&Y and Scrushy litigation
(ongoing)
(1) Credit Agreement limits debt pay down on non–term loan balances. We have the right to buy back non-term loan debt with the discretionary cash
available to the Company.
(2) Based on four quarter trailing Adjusted Consolidated EBITDA of $351.2 million; see related debt schedule on slide 30, and reconciliation to GAAP
on slides 33 through 36.
Debt to EBITDA 6.3x 6.3x 5.3x 4.9x(2)
($ Billions)
Year-End 2012 Goal: 3.5x to 4.0x
Deleveraging

Disciplined Growth
Bed expansions:
Approximately 100 beds being added in 2009 and a similar amount
in 2010.
Average investment per bed:
Internal renovation = $15 – 45K
New construction = $100 – 250K
Cash pay-back: 2 – 3 years
New hospitals:
(2)
(1) Working with a third party to obtain lease arrangements.
(2) CON is being appealed; operational date may change.
Location
Announced
Type of Investment
Installed Beds
Operational
Date
Mesa, AZ
Oct-08
De novo
(1)
40 Beds
Q309
Loudoun County, VA
Aug-08
De novo
40 Beds
Q210
Marion County, FL
Aug-08
De novo
(1)
40 Beds
Q310
Adjusted Consolidated EBITDA(1)
(Millions)
(1) Reconciliation to GAAP provided on slides 33 through 36.
Quarter-over-quarter improvement driven by:
Increased volumes
• Helped to offset 04/01/08 Medicare price roll-back
Lower G&A
Effective management of hospital related expenses
Improved labor productivity
1st Qtr.
1st Qtr.
2009
2008
$
%
98.7
$
89.2
$
9.5
$
10.7%
Change
Adjusted Income per Share
(1) Reconciliation to GAAP provided on slides 33 through 36.
Quarter-over-quarter improvement driven by:
Lower interest expense
Increased volumes
• Helped to offset 04/01/08 Medicare price roll-back
Lower G&A
Effective management of hospital related expenses
Improved labor productivity
1st Qtr.
1st Qtr.
(Millions, except per share data)
2009
2008
$
%
Income from continuing operations
attributable to HealthSouth
48.0
$
4.6
$
43.4
$
943.5%
Adjusted income from continuing
operations
(1)
39.8
$
17.0
$
22.8
$
134.1%
Adjusted income from continuing
operations per diluted share
(1)
0.39
$
0.18
$
0.21
$
116.7%
Per Share
Change

Free Cash Flow
(1) Includes capital expenditures for the hospital refresh program.
Year Ended
(Millions)
2008
183.1
$
41.8
$
227.2
$
Incremental income tax expense
(0.3)
(1.4)
(5.0)
Capital expenditures for maintenance
(1)
(7.5)
(8.7)
(37.3)
Net settlements on interest rate swap
(8.5)
(0.2)
(20.7)
Dividends paid on convertible perpetual
preferred stock
(6.5)
(6.5)
(26.0)
Non-recurring items:
UBS settlement proceeds,
less fees to derivative plaintiffs' attorneys
(73.8)
-
-
Income tax refunds
(47.8)
(3.8)
(47.1)
Net cash provided by operating activities of
discontinued operations
-
-
(6.6)
Adjusted free cash flow
38.7
$
21.2
$
84.5
$
Three Months Ended March 31,
Net cash provided by operating activities
2008
2009
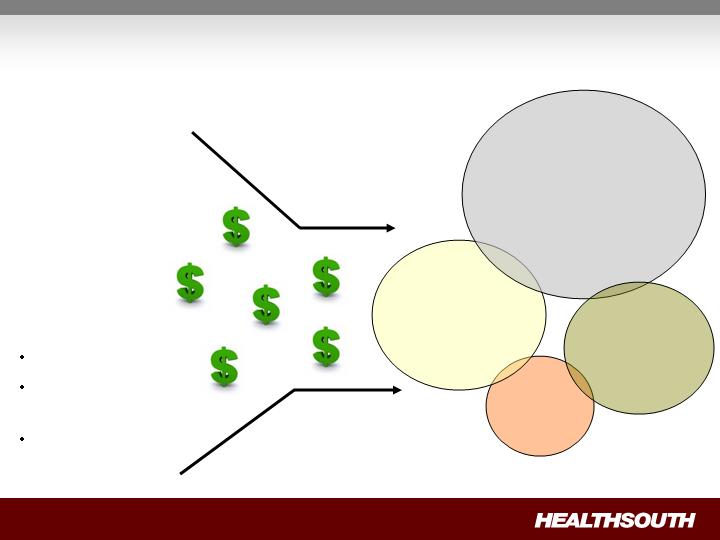
Disciplined Use of Cash
Non-Operating Cash
Derivative proceeds
Digital Hospital
proceeds
Tax refunds
De novo’s
Bed
Expansions
Debt
Reduction
Acquisitions/
Consolidations
Adjusted Free
Cash Flow(1)
(Major Focus)
(Opportunistic)
($15-20 million)
(3rd-party
financed)
(1) After maintenance CAPEX of ~ $35 million annually, which includes ~ $5-10 million for infrastructure enhancements.

Healthcare is a Regulated Industry
And has been since Medicare’s inception (1965).
Over the years, successful healthcare providers have been those who
have adjusted their business models to adapt to regulatory changes.
Recent regulatory changes affecting inpatient rehabilitation:
2002: change in reimbursement methodology.
2004: change in rule governing kinds of patients eligible for treatment.
HealthSouth has a proven track-record of successfully adapting to
regulatory changes.
Scale
Infrastructure
Management

Combining payments of multiple providers into a single, “bundled”
payment.
Intended to incentivize providers to cooperate with one another and
coordinate care throughout an entire episode.
Typically refers to bundling physician + acute care hospital payments.
Has been proposed before:
Included in President George H.W. Bush's 1992 budget proposal.
June 2008 MedPAC Report set forth recommendations for how Medicare
could develop a bundled payment system.
Focused on bundling physician and hospital payments.
Recommended voluntary pilot program to test the feasibility.
Most recently included in a December 2008 CBO report which listed 115
Medicare budget options.
What is “Bundling”?
Why has “Bundling” been Proposed?
“Nearly 18 percent of hospitalization of Medicare beneficiaries resulted in the
readmission of patients who had been discharged in the hospital within the last 30
days. Sometimes the readmission could not have been prevented, but many of
these readmissions are avoidable. To improve this situation, hospitals will receive
bundled payments that cover not just the hospitalization, but care from certain
post-acute providers the 30 days after the hospitalization, and hospitals with high
rates of readmission will be paid less if patients are re-admitted to the hospital
within the same 30-day period.” (Emphasis added)
“The money saved will also be contributed to the reserve fund for healthcare
reform.”
President Obama’s FY 2010 Budget Proposal,
Jumpstarting the Economy (February 2009),
pages 28 and 29
Proposed implementation schedule:
Begin: FY 2013
Full implementation: FY 2015
Readmission and Utilization Rates of Post-Acute
Care Providers
Note: Use of home health care and hospice is based on care that starts within three days of discharge. Other PAC care starts within one day of discharge. Home health use includes
episodes that overlap an inpatient stay.
Source: Medicare Payment Advisory Commission, “A Data Book: Healthcare spending and the Medicare program,” Chart 9-3 (June 2008).
Post-Acute Care
("PAC") Setting
Percent Discharged
from Hospital to
PAC Setting
Percent
Rehospitalized after
Using PAC Setting
Percent Died
in PAC
Setting
Skilled Nursing Facility
17.3%
22.0%
5.4%
Home Health
16.0%
18.1%
0.8%
Long-Term Care Hospital
1.0%
10.0%
15.5%
Inpatient Rehabilitation
3.2%
9.4%
0.4%
Inpatient Psychiatric
0.5%
8.7%
0.4%
Hospice
2.1%
4.5%
82.2%
TOTAL
40.0%
18.0%
6.2%
Senate Finance Committee Policy Option
Senate Finance Committee Policy Option: Beginning in fiscal year
(FY) 2015, acute IPPS hospital services and post-acute care services
occurring or initiated within 30 days after discharge from a hospital
would be paid through a bundled payment.
Bundling would be combined with developing a hospital readmission
policy.
Bundled payments would not necessarily be made directly to acute care
hospitals.
Other entities could receive bundled payments as long as acute care
hospitals are involved.
Proposed implementation schedule:
Phase I: FY 2015 – bundled payments for top 20% of post-acute spending.
Phase II: FY 2017 – bundled payments for next 30% of post-acute spending.
Phase III: FY 2019 – bundled payments for all post-acute spending.

Bundling – Can it Work?
1.
Physicians must remain ultimately responsible for deciding patients’
post-acute needs.
2.
Patients must maintain their right to choose where they receive care.
3.
Payments for post-acute care must be appropriate to ensure quality.
4.
Payments for post-acute care must “flow” to actual providers of the care.
5.
Access to post-acute care, especially in rural areas, must be ensured.
6.
Existing, laws, regulations and policies that preclude continuity of post-
acute care must be changed or eliminated.
Six core principals must serve as the foundation for any bundling
payment system:

Bundling “Take-Aways”
“Bundling” is not a new concept.
If structured properly, “bundling” could serve as a catalyst for
consolidations in the post-acute sector.
Due to high degree of complexities, much study has to be
done to devise a workable system.
HealthSouth will continue to work with the AHA(1) , Federation
of American Hospitals, and others to provide input.
If adopted later this year, implementation would not begin for
several years:
President’s Budget Proposal: Begin implementation in FY 2013.
Senate Finance Committee Option: Begin implementation in FY
2015.
(1) AHA = American Hospital Association

Q209 Initial Observations
Volume:
Through April, continued positive discharge growth.
Pricing:
Quarter-over-quarter comparables similar.
Reminder: Q208 was first quarter of Medicare pricing roll-back.
Expenses:
Continued focus on cost-effective patient care.
2009 Guidance
(1) Reconciliation to GAAP provided on slides 33 through 36.
(2) Adjusted income from continuing operations per diluted share.
Adjusted Consolidated EBITDA(1)
2009 Range: $342.0 million to $352.0 million
Expect to be at the higher end of the range
Adjusted Earnings per Share(1)(2)
2009 Range: $0.85 to $0.90 per share
Expect to be at the higher end of the range
Key Drivers:
Sustainable discharge growth
Bed expansions
New hospitals
Cost-effective, high-quality patient care
Deleveraging

Investment Considerations
Industry Leader: Attractive industry with good demographics.
Strong Cash Flows: Flexibility in the use of FCF.
Deleveraging Priority: Reduce leverage to between 3.5x and 4.0x by
YE 2012.
Solid Organic Growth: TeamWorks initiative + rigorous expense
management.
Opportunistic, disciplined expansion: Bed expansions and new
hospitals coming online over next three years.
Well positioned: Proven track record of adapting to regulatory
changes.
Goal : Delivering sustainable shareholder value
through 15% – 20+% Adjusted EPS growth.

Appendix and Reconciliations

Revenues (Q1 2009 vs. Q1 2008)
Inpatient revenue growth was driven by strong discharge volumes, offset by the
Medicare price roll-back.
Volume growth was driven by the sustained TeamWorks effort and disciplined development.
Same store discharge growth was 4.8%.
Net patient revenue / discharge was lower in Q109 due to the Medicare price roll-back,
offset by higher non-Medicare pricing.
Outpatient revenue declined as a result of 12 fewer outpatient satellites quarter over
quarter.
Favorable/
(Unfavorable)
(Millions)
1st Qtr. 2009
1st Qtr. 2008
Change
Inpatient
433.1
$
419.1
$
3.3%
Outpatient and other
42.0
45.1
(6.9%)
Consolidated net operating
475.1
$
464.2
$
2.3%
(Actual Amounts)
Discharges
27,807
26,309
5.7%
Net patient revenue / discharge
15,575
$
15,930
$
(2.2%)

Expenses (Q1 2009 vs. Q1 2008)
Adjustments made to benefit plans are reflected in Q109 results.
Continued progress on labor productivity demonstrated by lower EPOB.
Reduced hospital related expenses as a result of lower costs for TeamWorks.
Lower general and administrative as a result of right sizing the corporate office.
Favorable/
(Unfavorable)
(Millions, except percent)
1st Qtr. 2009
1st Qtr. 2008
Change
Salaries and benefits
234.7
$
230.4
$
(1.9%)
Percent of net operating revenues
49.4%
49.6%
20 bps
EPOB (employee per occupied bed)
3.47
3.53
1.7%
Hospital related expenses
114.6
$
115.8
$
1.0%
(other operating, supplies, occupancy, bad debts)
Percent of net operating revenues
24.1%
24.9%
80 bps
General and administrative
21.8
$
24.8
$
12.1%
(excludes 123(R) compensation)
Percent of net operating revenues
4.6%
5.3%
70 bps

Payment Sources
(1) Medicare Advantage revenues are included in “Managed care and other discount plans.”
2009
2008
Medicare
68.6%
68.2%
Medicaid
2.1%
2.3%
Workers' compensation
1.7%
2.2%
Managed care and other discount plans
(1)
22.2%
21.3%
Other third-party payors
3.2%
3.5%
Patients
0.8%
0.8%
Other income
1.4%
1.7%
Total
100.0%
100.0%
Three Months Ended March 31,
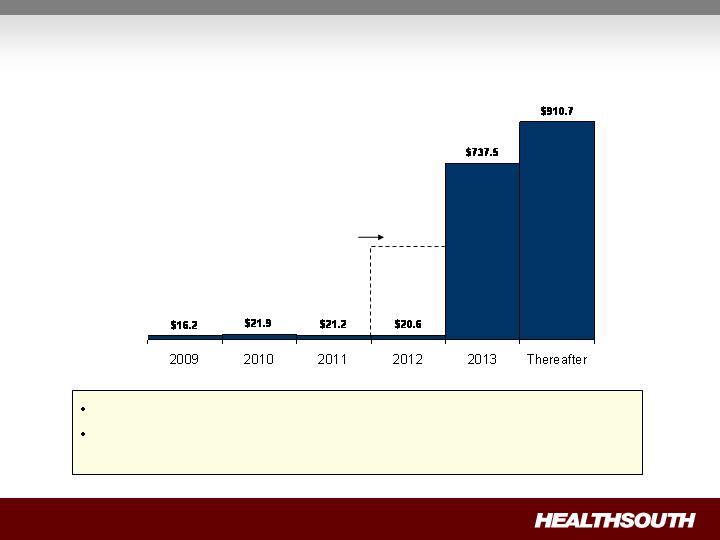
Debt Maturities
(Millions)
$400.0
Undrawn revolver
goes away in 2012
Minimal amortization and no near-term financing risk.
As of March 31, 2009, we were in compliance with the covenants under our
Credit Agreement.
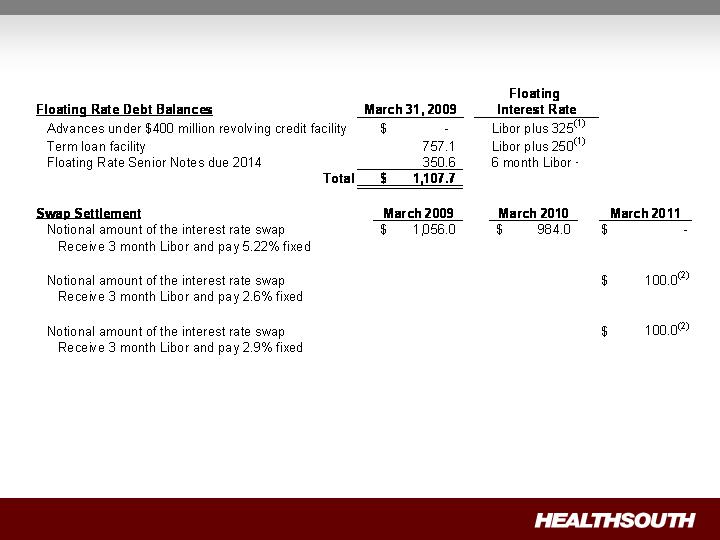
Interest Rate Swaps
(Millions)
(1) We have the flexibility to peg 1,2,3 or 6 month Libor, or Prime.
(2) Forward-starting interest rate swaps (designated as cash flow hedges).

Debt Schedule
(1) The Company had $90.7 million in cash and cash equivalents as of March 31, 2009.
(2) Credit Agreement limits debt pay down on non–term loan balances. We have the ability to buy back non-term loan debt with the discretionary
cash available to the Company.
(Millions)
Q109 Debt
Reduction
(1)(2)
March 2012
$ -
$ 40.0
$ (40.0)
Term loan facility - March 2013
757.1
783.6
(26.5)
Bonds Payable:
8.375%
Senior Notes due 2011
0.3
0.3
-
7.625%
Senior Notes due 2012
1.5
1.5
-
Floating Rate Senior Notes due 2014
350.6
366.0
(15.4)
(6 month Libor plus 600)
10.75%
Senior Notes due 2016
494.5
494.3
0.2
from 7.9% to 12.9%
12.6
12.8
(0.2)
Capital lease obligations
111.5
114.7
(3.2)
Total
1,728.1
$
1,813.2
$
(85.1)
$
Year-to-date debt reduction
(1)(2)
85.1
$
Debt Balances
December 31,
2008
Notes payable to banks and others at interest rates
Advances under $400 million revolving credit facility,
March 31,
2009

Non-Operating Cash/Tax Position
Cash Refunds
Federal tax recoveries virtually complete.
Approx. $42 million received in Q109.
State tax refunds in progress.
Approx. $6 million received in Q109.
Approx. $8 million net receivable on the
balance sheet March 31, 2009.
Future Cash Tax Payments
Expect to pay about $5-7 million per year of
income tax.
State income tax
Alternative Minimum Tax (AMT)
With over $2.5 billion in NOLs and tax
deductions, we do not expect to pay significant
federal income taxes for approximately the next
10-12 years.
At this time, we do not believe the use of
NOLs will be limited before they expire,
however, no assurances can be
provided.
HealthSouth is not currently subject to an
annual use limitation (AUL) under the Internal
Revenue Service section 382.
If we experienced a “change of ownership” as
defined by the Internal Revenue Service section
382, we would be subject to an AUL which is
equal to the value of the company at the time of
the “change of ownership” multiplied by the
long-term tax exempt rate.
GAAP Considerations
HealthSouth’s balance sheet currently reflects
a valuation allowance for the potential value
of NOLs and future deductions. The valuation
allowance is approximately $1.0 billion.
GAAP tax rate will net to small amount for
foreseeable future as there will be a reduction
in the valuation allowance when NOLs are
utilized.

Outstanding Share Summary
(Millions)
1st Qtr.(4)
2009
1st Qtr.
2008
Year-End(4)
2008
Year-End
2007
Basic shares outstanding
(2)(3)
87.5
78.9
83.0
78.7
Diluted shares outstanding
(1)(2)(3)
100.9
92.3
96.4
92.0
Basic shares outstanding
(2)(3)
88.3
79.1
88.0
78.7
Diluted shares outstanding
(1)(2)(3)
101.7
92.5
101.4
92.0
Notes:
Average for the Period
End of Period
(1) The difference between the basic and diluted shares outstanding is primarily related to our convertible perpetual preferred
stock.
(2) Does not include warrants issued in connection with a January 2004 loan repaid to Credit Suisse First Boston. In
connection with this transaction, we issued warrants to the lender to purchase two million shares of our common stock.
Each warrant has a term of ten years from the date of issuance and an exercise price of $32.50 per share. The warrants
were not assumed exercised for dilutive shares outstanding because they were antidilutive in the periods presented.
(3) Does not include approximately 5.0 million shares of common stock and warrants to purchase approximately 8.2 million
shares of common stock at a strike price of $41.40 to settle our class action securities litigation. This agreement received
final court approval on January 11, 2007. As of March 31, 2009, these shares of common stock and warrants have not
been issued and are not included in our basic or diluted common shares outstanding. We expect a ruling before the end
of third quarter. If the judgment is affirmed, the distribution would occur in 2009.
(4) Completed an equity offering for 8.8 million shares on June 27, 2008.

First Quarter Reconciliation of Net Income to Adjusted Income from Continuing Operations
and Adjusted Consolidated EBITDA (1)(3)

Full Year Reconciliation of Net Income to Adjusted Income (Loss) from Continuing
Operations and Adjusted Consolidated EBITDA (1)(3)
(In Millions, Except Per Share Data)
Per Share
(2)
Per Share
(2)
Net income
$
281.8
3.40
$
$
718.7
9.13
$
Income from discontinued operations, net of tax, attributable to HealthSouth
(16.9)
(0.20)
(454.9)
(5.78)
Net income attributable to noncontrolling interests
(29.4)
(0.35)
(65.3)
(0.83)
Income from continuing operations attributable to HealthSouth
235.5
2.84
198.5
2.52
Gain on UBS Settlement
(121.3)
(1.46)
-
-
Government, class action, and related settlements
(67.2)
(0.81)
(2.8)
(0.04)
Professional fees - accounting, tax, and legal
44.4
0.53
51.6
0.66
Loss on interest rate swap
55.7
0.67
30.4
0.39
Accelerated depreciation of corporate campus
10.0
0.12
-
-
Gain on sale of investment in Source Medical
-
-
(8.6)
(0.11)
Interest associated with UBS Settlement
(9.4)
(0.11)
-
-
Provision for income tax benefit
(70.1)
(0.84)
(322.4)
(4.10)
Estimated income tax expense
(5.0)
(0.06)
(5.0)
(0.06)
Adjusted income from continuing operations
(1)(3)
72.6
0.87
(58.3)
(0.74)
Adjustment for dilution
(2)
(0.12)
0.11
Adjusted income from continuing operations per diluted share
(2)(3)
$ 0.75
$ (0.63)
Estimated income tax expense
5.0
5.0
Interest expense and amortization of debt discounts and fees,
excluding interest associated with the UBS Settlement
168.9
229.4
Depreciation and amortization, excluding accelerated depreciation of corporate campus
73.2
75.7
319.7
251.8
Other adjustments per our Credit Agreement:
Impairment charges, including investments
2.4
15.1
Net noncash loss on disposal of assets
2.0
5.9
Loss on early extinguishment of debt
5.9
28.2
Gain on sale of investment in Source Medical
-
8.6
Compensation expense under FASB Statement No. 123(R)
11.7
10.6
Other
-
0.3
Adjusted Consolidated EBITDA
(1)(3)(4)
$
341.7
320.5
Weighted average common shares outstanding:
Basic
83.0
78.7
Diluted
96.4
92.0
2008
2007
Year Ended December 31,
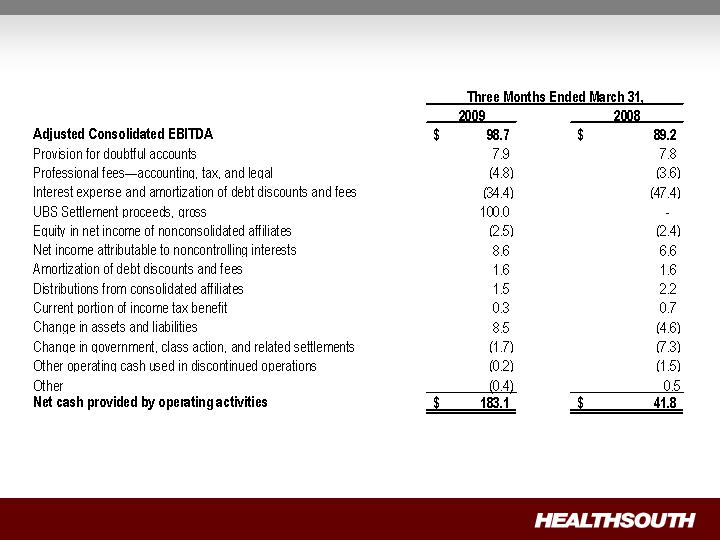
First Quarter Reconciliation of Adjusted Consolidated EBITDA(1) to Net Cash Provided by
Operating Activities

Reconciliation Notes
1.
Adjusted income (loss) from continuing operations and Adjusted Consolidated EBITDA
are non-GAAP financial measures. Management and some members of the investment
community utilize adjusted income from continuing operations as a financial measure
and Adjusted Consolidated EBITDA as a liquidity measure on an ongoing basis. These
measures are not recognized in accordance with GAAP and should not be viewed as an
alternative to GAAP measures of performance or liquidity. In evaluating these adjusted
measures, the reader should be aware that in the future HealthSouth may incur
expenses similar to the adjustments set forth above.
2.
Per share amounts are based on basic weighted average common shares outstanding
for all amounts except adjusted income (loss) from continuing operations per diluted
share, which is based on diluted weighted average shares outstanding. The difference
in shares between the basic and diluted shares outstanding is primarily related to our
convertible perpetual preferred stock. Per share amounts do not include 5.0 million
shares not yet issued under the securities litigation settlement. The calculation of
adjusted loss from continuing operations per diluted share ignores the antidilutive
impact in 2007.
3.
Adjusted income (loss) from continuing operations per diluted share and Adjusted
Consolidated EBITDA are two components of our guidance.
4.
The Company’s Credit Agreement allows certain other items to be added to arrive at
Adjusted Consolidated EBITDA, and there may be certain other deductions required.