UNITED STATES
SECURITIES AND EXCHANGE COMMISSION
WASHINGTON, D.C. 20549
FORM 10-K
(MARK ONE)
| x | ANNUAL REPORT PURSUANT TO SECTION 13 OR 15(d) OF THE SECURITIES EXCHANGE ACT OF 1934 |
| | FOR THE FISCAL YEAR ENDED JANUARY 31, 2009 |
OR
| ¨ | TRANSITION REPORT PURSUANT TO SECTION 13 OR 15(d) OF THE SECURITIES EXCHANGE ACT OF 1934 |
| | FOR THE TRANSITION PERIOD FROM TO |
COMMISSION FILE NUMBER 000-21250
THE GYMBOREE CORPORATION
(Exact name of registrant as specified in its charter)
| | |
| DELAWARE | | 94-2615258 |
| (State or other jurisdiction of | | (I.R.S. Employer |
| incorporation or organization) | | Identification No.) |
| |
500 Howard Street, San Francisco, California | | 94105 |
| (Address of principal executive offices) | | (Zip Code) |
Registrant’s telephone number, including area code: (415) 278-7000
SECURITIES REGISTERED PURSUANT TO SECTION 12(b) OF THE ACT:
| | |
Title of Each Class | | Name of each exchange on which registered |
| COMMON STOCK, $0.001 PAR VALUE | | The NASDAQ Stock Market LLC |
SECURITIES REGISTERED PURSUANT TO SECTION 12(g) OF THE ACT:
NONE.
Indicate by check mark if the registrant is a well-known seasoned issuer, as defined in Rule 405 of the Securities Act. Yes x No ¨
Indicate by check mark if the registrant is not required to file reports pursuant to Section 13 or Section 15(d) of the Act. Yes ¨ No x
Indicate by check mark whether the registrant (1) has filed all reports required to be filed by Section 13 or 15(d) of the Securities Exchange Act of 1934 during the preceding 12 months (or for such shorter period that the registrant was required to file such reports), and (2) has been subject to such filing requirements for the past 90 days. Yes x No ¨
Indicate by check mark if disclosure of delinquent filers pursuant to Item 405 of Regulation S-K is not contained herein, and will not be contained, to the best of registrant’s knowledge, in definitive proxy or information statements incorporated by reference in Part III of this Form 10-K or any amendment to this Form 10-K. x
Indicate by check mark whether the registrant is a large accelerated filer, an accelerated filer, a non-accelerated filer, or a smaller reporting company. See the definitions of “large accelerated filer,” “accelerated filer” and “smaller reporting company” in rule 12b-2 of the Exchange Act.
| | | | | | |
| Large accelerated filer x | | Accelerated filer ¨ | | Non-accelerated filer ¨ | | Smaller reporting company ¨ |
| | | | (Do not check if a smaller reporting company) | | |
Indicate by check mark whether the registrant is a shell company (as defined in Rule 12b-2 of the Act). Yes ¨ No x
The aggregate market value of the voting and non-voting stock held by non-affiliates of the registrant as of August 2, 2008, was approximately $1,031,000,000 based upon the last sales price reported for such date on The NASDAQ Stock Market LLC.
As of February 28, 2009, 29,132,240 shares of the registrant’s common stock were outstanding.
DOCUMENTS INCORPORATED BY REFERENCE
Portions of the Registrant’s Proxy Statement for the Annual Meeting of Stockholders to be held on June 9, 2009 (hereinafter referred to as the “Proxy Statement”) are incorporated by reference into Part III.
THE GYMBOREE CORPORATION
TABLE OF CONTENTS
2
FORWARD LOOKING STATEMENTS
The discussion in this Annual Report on Form 10-K contains forward-looking statements within the meaning of the Private Securities Litigation Reform Act of 1995. Inaccurate assumptions and known and unknown risks and uncertainties can affect the accuracy of forward-looking statements, and our actual results could differ materially from results that may be anticipated by such forward-looking statements. Certain risks and uncertainties that could cause our actual results to differ significantly from management’s expectations are described in Item 1A, “Risk Factors.” That section, along with other sections of this Annual Report, describes some, but not all, of the factors that could cause actual results to differ significantly from management’s expectations. When used in this document, the words “believes,” “expects,” “estimates,” or “anticipate” and similar expressions are intended to identify certain of these forward-looking statements. In addition, any statements that refer to expectations, projections or other characterizations of future events or circumstances are forward-looking statements. The cautionary statements made in this document should be read as being applicable to all forward-looking statements wherever they appear in this document. Readers are cautioned not to place undue reliance on these forward-looking statements, which are based on information available as of the date of this report. We do not intend to revise any forward-looking statements in order to reflect events or circumstances that may subsequently arise.
PART 1
The Gymboree Corporation is a specialty retailer operating stores selling high-quality apparel and accessories for children under the GYMBOREE®, GYMBOREE OUTLET, JANIE AND JACK® and Crazy 8® brands, as well as play programs for children under the GYMBOREE PLAY & MUSIC® brand. The Company operates retail stores in the United States, Canada and Puerto Rico, primarily in regional shopping malls and in selected suburban and urban locations. All references to “we,” “our,” “us,” and the “Company” in this Annual Report mean The Gymboree Corporation and its subsidiaries.
GENERAL
As of January 31, 2009, the Company conducted its business through five primary divisions: Gymboree, Gymboree Outlet, Janie and Jack, Crazy 8, and Gymboree Play & Music.
Gymboree: Gymboree stores offer high-quality, fashionable, child-appropriate apparel and accessories characterized by mix and match colors, patterns and whimsical graphics, complex embellishments, comfort, functionality, and durability for children sizes newborn through 12. As of January 31, 2009, the Company operated 615 Gymboree stores, including 584 stores in the United States, 29 stores in Canada, and two stores in Puerto Rico, as well as an online store atwww.gymboree.com.
Gymboree Outlet:Gymboree Outlet stores provide high-quality mix and match children’s apparel and accessories in the same size ranges as traditional Gymboree stores but at outlet prices. The majority of our Gymboree Outlet product is developed and manufactured exclusively for the Gymboree Outlet stores. As of January 31, 2009, we operated 117 Gymboree Outlet stores in the United States and one store in Puerto Rico.
Janie and Jack: Janie and Jack shops offer distinctive, finely crafted clothing and accessories for boys and girls sizes newborn through 8. Lush fabrics, a hand-made quality and details such as hand-embroidery, smocking and vintage prints are utilized to create classic looks. Shops have a European style reminiscent of a small boutique in Paris. As of January 31, 2009, we operated 115 Janie and Jack shops in the United States, as well as an online shop atwww.janieandjack.com.
3
Crazy 8:Crazy 8 stores provide wholesome age-appropriate fashion, at price points approximately 30% lower than Gymboree. Through merchandise design, product presentation, store environment, customer service and packaging, Crazy 8 stores reflect an upscale store experience at mass-market prices. Crazy 8 apparel is offered in sizes newborn through 14 and addresses a broader demographic customer base than Gymboree. The product assortment is a balanced offering of boy and girl product. As of January 31, 2009, we operated 38 Crazy 8 stores in the United States, as well as an online store atwww.crazy8.com.
Gymboree Play & Music. Gymboree Play & Music offers children ages newborn to 5 years the opportunity to explore, learn and play in an innovative parent-child program. Gymboree Play & Music offers an array of classes developed by early childhood experts, as well as birthday parties and developmental toys, books and music. As of January 31, 2009, Gymboree Play & Music programs were offered at seven Company-operated play centers (three in California and four in Florida) and 602 franchisee-operated play centers, of which approximately 41% are located in the United States, and the remaining 59% are located in 30 other countries: Argentina, Australia, Canada, Chile, China, Colombia, Costa Rica, Ecuador, El Salvador, France, Greece, Hong Kong, Indonesia, Ireland, Japan, Malaysia, Mexico, Panama, Peru, Philippines, Portugal, Singapore, South Africa, South Korea, Spain, Switzerland, Taiwan, Thailand, Turkey and the United Kingdom.
Gymboree was organized in October 1979 as a California corporation and re-incorporated as a Delaware corporation in June 1992.
RETAIL STORES
As of January 31, 2009, the Company operated a total of 886 retail stores, including 854 stores in the United States (584 Gymboree stores, 117 Gymboree Outlet stores, 115 Janie and Jack shops, and 38 Crazy 8 stores), 29 Gymboree stores in Canada, two Gymboree stores in Puerto Rico, and one Gymboree Outlet store in Puerto Rico. The Company also operates three online stores atwww.gymboree.com,www.janieandjack.com, andwww.crazy8.com.
In fiscal 2008, the Company opened 105 stores, including 23 Gymboree stores, 36 Gymboree Outlet stores, 22 Janie and Jack shops, and 24 Crazy 8 stores. The Company also relocated or remodeled 23 Gymboree stores and closed 5 Gymboree stores. During fiscal 2009, the Company plans to open approximately 75 new stores, including 25 Gymboree stores, 20 Gymboree Outlet stores, five Janie and Jack shops, and 25 Crazy 8 stores. The Company also plans to remodel, relocate or expand approximately 65 Gymboree stores.
The Gymboree online store atwww.gymboree.com offers the entire Gymboree product offering for children. The site also offers online registration for Gymboree Play & Music classes at selected U.S. locations. The Janie and Jack online store atwww.janieandjack.com offers the entire Janie and Jack product offering for children. The Crazy 8 online store atwww.crazy8.com offers the entire Crazy 8 product offering for children. The Company fully integrates its online stores and retail stores in determining pricing, product assortment and promotional strategies. The Company also has a “Save the Sale” policy, whereby retail stores order merchandise for customers from the online stores. In addition, customers are allowed to return merchandise purchased online at traditional retail stores and vice versa.
SUPPLIERS
The majority of our apparel is manufactured to our specifications by approximately 335 independent manufacturers in Asia (primarily China, Indonesia and Thailand), Central America, Africa, and South America. The Company purchases all products in U.S. dollars. One buying agent manages approximately 90% of our inventory purchases. We have no long-term contracts with suppliers and typically transact business on an order-by-order basis. Our factories undergo annual audits for social accountability by an independent third party. In addition, all products undergo a quality audit performed by independent third parties.
4
SEASONALITY AND COMPETITION
The Company’s operations are seasonal in nature, with sales from our retail operations peaking during the fourth quarter, primarily during the holiday season in November and December. During fiscal 2008, 2007 and 2006, the fourth quarter accounted for approximately 30% of our net sales from retail operations.
The Company’s Gymboree, Gymboree Outlet, Janie and Jack, and Crazy 8 brands compete on a national level with BabyGap and GapKids (divisions of Gap, Inc.), and certain leading department stores operating in malls, outlet centers or street locations, as well as certain discount retail chains such as Old Navy (a division of Gap, Inc.), The Children’s Place, Wal-Mart and Target. The Company’s Gymboree, Gymboree Outlet, Janie and Jack, and Crazy 8 brands also compete with a wide variety of local and regional specialty stores, with certain other retail chains, and with children’s retailers that sell their products by mail order, over the Internet or through outlet malls. The principal factors affecting competition for retail sales are product design, product quality, brand image, customer service and pricing. Our goal is to provide our customers with high-quality apparel at a price that reflects excellent value. We design and produce our apparel exclusively for sale at our retail and online stores.
TRADEMARKS AND SERVICE MARKS
In the United States, the Company is the owner of the trademarks and service marks “GYMBOREE,” “JANIE AND JACK,” “CRAZY 8,” and “GYMBOREE PLAY & MUSIC,” and the trademarks “GYMBO,” and “GYMBUCKS.” These marks and certain other of our marks are registered in the United States Patent and Trademark Office. The mark “GYMBOREE” is also registered, or is the subject of pending applications, in approximately 90 foreign countries. Each federal registration is renewable indefinitely if the mark is still in use at the time of renewal. Our rights in the “GYMBOREE,” “JANIE AND JACK,” and “CRAZY 8” marks and other marks are a significant part of our business. Accordingly, we intend to maintain the marks and the related registrations. We are not aware of any material claims of infringement or other material challenges to our right to use the “GYMBOREE,” “JANIE AND JACK,” and “CRAZY 8” marks in the United States.
The Company uses a number of other trademarks, certain of which have been registered with the United States Patent and Trademark Office and in certain foreign countries. We believe that our registered and common-law trademarks have significant value and that some of our trademarks are instrumental to our ability to both market our products and create and sustain demand for our products.
TEAM MEMBERS
As of January 31, 2009, the Company had approximately 11,500 full-time and part-time employees or 5,100 full-time equivalents. In addition, a significant number of seasonal employees are hired during each holiday selling season. None of the Company’s employees are represented by a labor union.
SEGMENT AND INTERNATIONAL FINANCIAL INFORMATION
Financial information for the Company’s two reportable segments, retail stores and Gymboree Play & Music, and for its Canadian subsidiary for each of the three fiscal years ended January 31, 2009, February 2, 2008, and February 3, 2007 is contained in Note 9 to the consolidated financial statements.
Less than 5% of the Company’s revenues were derived from outside the United States, and less than 2% of the Company’s long-lived assets were located outside the United States in fiscal 2008, 2007, and 2006.
AVAILABLE INFORMATION
The Company makes available on its website atwww.gymboree.com, under “Our Company—Financial Resources & SEC filings,” free of charge, its annual reports on Form 10-K, quarterly reports on Form 10-Q,
5
current reports on Form 8-K, and amendments to such documents as soon as reasonably practicable after the Company electronically files or furnishes such materials to the U.S. Securities and Exchange Commission (“SEC”). The Company also makes available under “Our Company—Corporate Governance,” its code of ethics as well as other documents and materials relating to corporate governance.
EXECUTIVE OFFICERS OF THE REGISTRANT
The following table sets forth information regarding our executive officers as of March 30, 2009:
| | | | |
Matthew K. McCauley | | 36 | | Chief Executive Officer and Chairman of the Board |
Blair W. Lambert | | 51 | | Chief Operating Officer and Chief Financial Officer |
Kip M. Garcia | | 58 | | President |
Marina Armstrong | | 46 | | Senior Vice President, Human Resources and Play & Music, and Secretary |
Lynda G. Gustafson | | 44 | | Vice President, Corporate Controller |
Jeffrey P. Harris | | 46 | | Vice President, Finance |
Matthew K. McCauley has served as our Chief Executive Officer since January 2006 and Chairman of the Board since July 2006. Mr. McCauley joined The Gymboree Corporation in July 2001 as Director of Allocation and was named Vice President of Planning and Allocation in 2003, Senior Vice President and General Manager in February 2005, President in June 2005, Chief Executive Officer in January 2006, and Chairman of the Board in July 2006. Mr. McCauley has been on our Board of Directors since October 2005. Prior to joining The Gymboree Corporation, Mr. McCauley served in a variety of positions at Gap, Inc., a clothing retailer, including Planning Manager from 2000 to 2001 and Manager of Business Solutions in 2001.
Blair W. Lambert has served as our Chief Operating Officer and Chief Financial Officer since January 2005 and has been on our Board of Directors since 2003. In August 2003, Mr. Lambert joined Illuminations.com, Inc., a candle and home decorating retailer, as the Chief Financial Officer. He was named to the Illuminations.com, Inc. Board of Directors in October 2003. Mr. Lambert has been a vineyard owner since October 2001 and, prior to becoming an officer of Illuminations.com, was a private consultant for specialty retail companies. Mr. Lambert served as the Chief Financial Officer of Bebe Stores, Inc., a clothing retailer, from June 1996 through October 2001. From 1988 to 1996, Mr. Lambert was employed by Esprit de Corp., a wholesaler and retailer of junior and children’s apparel, footwear and accessories, most recently serving as Corporate Vice President of Finance. Mr. Lambert is a Certified Public Accountant.
Kip M. Garcia joined The Gymboree Corporation in May 2004 as Senior Vice President of Merchandising – Kids and was named President in January 2006. Prior to joining The Gymboree Corporation, Mr. Garcia served as Senior Vice President for GapKids, a division of Gap Inc., a children’s clothing retailer, from April 2002 to February 2003 and Senior Vice President for DFS Merchandising Ltd., a travel retail company, from February 1992 to February 2002.
Marina Armstrong has served as our Senior Vice President, Human Resources, and Play & Music since August 2008 and Secretary since December 2004. Ms. Armstrong joined The Gymboree Corporation in May 1997 as a District Manager and became a Human Resources Staffing Manager at the corporate office in 1998. Later that year she was promoted to Director, Recruiting and Staffing. Ms. Armstrong was named Vice President, Human Resources in 1999, Senior Vice President, Stores, Human Resources and Loss Prevention in February 2005, and Senior Vice President, Stores, Human Resources, and Play & Music in January 2006. Ms. Armstrong was named Assistant Secretary in March 2002 and Secretary in December 2004. Prior to joining The Gymboree Corporation, Ms. Armstrong held several human resources and store operations positions with other retailers including Saks Fifth Avenue, Robinsons-May and The Bon Marche.
6
Lynda G. Gustafson has served as our Vice President, Corporate Controller since February 2005. Ms. Gustafson joined The Gymboree Corporation in August 2001 as the Corporate Controller and was promoted to Vice President, Corporate Controller in February 2005. Ms. Gustafson was a business consultant for various companies from September 2000 to July 2001. From November 1993 to August 2000, Ms. Gustafson was at US Home & Garden, Inc., and was the Vice President, Finance and Principal Accounting Officer when she departed. Ms. Gustafson is a Certified Public Accountant.
Jeffrey P. Harris joined the Gymboree Corporation in July 2005 as Vice President, Finance. In 2004, Mr. Harris served as Vice President of Finance for CBS MarketWatch, a leading multimedia source of financial news and information, until its sale to Dow Jones in 2005. From 2001 to 2004, he was employed at Lucasfilm in the capacity of Corporate Controller. Prior to that time, Mr. Harris worked in the Consumer Products division of The Walt Disney Company, an entertainment company, as Controller and Director of Finance for its Art and Collectibles division. He also spent over seven years working in various finance and audit roles for the Tribune Company based in Chicago, Illinois. Mr. Harris is a Certified Public Accountant.
The current global economic downturn may continue to harm our business.
The current global economic downturn has caused disruptions and extreme volatility in global financial markets, economic uncertainty, fluctuations in fuel prices, interest rates and tax rates, high unemployment levels, high consumer debt levels, limited availability of credit to customers, and declining consumer and business confidence, which has led to decreased levels of consumer spending. These macroeconomic developments have and could continue to negatively impact our business, which depends on the general economic environment and levels of consumer spending in the United States and other parts of the world. Consumer spending may not return to normal levels for an extended period of time. As a result, we may not be able to maintain or increase our sales generally, maintain sales levels at our existing stores, open and operate new stores, or maintain or improve our earnings. If the global economic downturn continues for a significant period or continues to worsen, our results of operations, financial condition, and cash flows will be materially adversely affected.
We are also dependent upon the continued popularity of malls as a shopping destination, and the ability of shopping mall anchor tenants and other attractions to generate customer traffic. A continued slowdown in the U.S. economy or an uncertain economic outlook could continue to lower consumer spending levels and cause a decrease in shopping mall traffic, each of which would adversely affect our growth, sales, and profitability. In addition, we lease a large number of our stores in malls owned and operated by highly leveraged real estate development companies. The inability of any one of these companies to refinance its debt when it comes due could result in mall closures or in foreclosures and distress sales of the mall properties. The closure of a mall or a change of ownership that resulted in changes or disruptions in mall operations, changes in tenant mix or otherwise impacted the character of the mall could affect our stores in those malls and could in turn materially adversely affect our results of operations, financial condition and cash flows.
Further, we work with a large number of small vendors some of whom have been or may be significantly impacted by the current economic downturn. If a number of these vendors fail, the delays and costs that we would likely incur in replacing them and in finding replacement goods and services could materially adversely affect our results of operations, financial condition and cash flows.
We may not be able to continue our current level of sales and earnings, which could cause the market price for our common stock to decline.
During the past four years, we realized substantial growth in both sales and earnings. We do not expect such growth, if any, to continue at these historical rates, particularly in light of the current economic downturn. Many factors have affected, and will continue to affect, our performance. We expect that future increases in net sales
7
and net income, if any, will be dependent on our ability, among other factors, to expand our two newer growth concepts, Janie and Jack and Crazy 8; to continue to reduce product costs while maintaining high-quality standards; to generate more sales to existing customers in the core Gymboree division through growth of the Boy department business and increased newborn product assortment; and to attract new customers through strategies such as direct mail campaigns and cross-brand marketing. Other factors that could impact our sales and earnings growth are discussed in this section. Any decline in our sales or earnings could have a material adverse effect on the market price of our common stock.
Our comparable store sales fluctuate over time, which may cause the market price of our common stock to decline.
Our comparable store sales have fluctuated significantly in the past and are expected to fluctuate in the future. Our comparable store sales are affected by a number of factors, including economic conditions, our merchandise assortment, inventory levels, weather conditions, timing of our promotional offerings, competition, regulatory changes, and the overall retail environment. The investment community often tracks comparable store sales, so a decline or significant fluctuation in comparable store sales, or a failure to meet investor expectations of comparable store sales, could materially affect the market price of our common stock.
Our business may be negatively impacted by consumer product safety laws, regulations or related legal actions.
The Consumer Product Safety Commission issued new standards, effective February 10, 2009, under the Consumer Product Safety Improvement Act of 2008 (“CPSIA”) regarding lead and other substances present in consumer products directed at children 12 years of age and under, including apparel and accessories. The new standard applies retroactively to all products, including those products manufactured prior to February 10, 2009, and is not limited to new manufacturing. We have been working to ensure that covered products are appropriately tested; however, there is still uncertainty regarding the meaning of the CPSIA and its implementation. As a result of our efforts to comply with the CPSIA, we incurred a $6.1 million charge in the fourth quarter of fiscal 2008 primarily comprised of a write-off of merchandise inventories, and we may experience additional compliance-related losses. In addition, new consumer product safety laws or changes to existing consumer product safety laws may be introduced in the future. We may incur significant costs complying with these new laws or changes to existing laws, which could have a material adverse effect on our earnings and stock price.
Furthermore, although we currently test products sold in our stores and at our Play & Music sites, we have in the past and may in the future need to recall products that we later determine may present safety issues. If these products have safety problems of which we are not aware, or if the Consumer Product Safety Commission recalls a product sold in our stores, we could experience negative publicity and product liability lawsuits, which could have a material adverse effect on our reputation, business and financial position.
Our results may be adversely affected by our failure to anticipate and respond to changes in fashion trends and consumer preferences in a timely manner.
Our sales and profitability depend upon the continued demand by customers for our apparel and accessories. We believe that our success depends in large part upon our ability to anticipate, gauge and respond in a timely manner to changing consumer demands and fashion trends and upon the appeal of our products. There can be no assurance that the demand for our apparel or accessories will not decline or that we will be able to anticipate, gauge, and respond effectively to changes in fashion trends. Further, current economic conditions and levels of discretionary spending also affect fashion trends and preferences. In addition, since much of our inventory is sourced from vendors located outside the United States, we usually must order merchandise, and enter into contracts for the purchase and manufacture of such merchandise, up to nine months in advance of the applicable selling season and frequently before trends are known. A decline in demand for our apparel and accessories or a misjudgment of fashion trends could, among other things, lead to lower sales, excess inventories and higher markdowns, each of which could have a material adverse effect on our business, financial condition and operating results.
8
Our new concepts and businesses require a substantial commitment of resources and are not certain of ultimate success.
Our ongoing efforts to develop, launch and grow new divisions, businesses and brands require significant capital expenditures and management attention. Our commitment of management resources and capital to a new concept means that those resources and capital are unavailable for our other activities and operations.
Our decision to launch a new business is based on our assessment that a significant opportunity exists in the marketplace. Our ability to successfully launch a new business depends in part on our ability to appropriately identify, develop and effectively execute our strategies and initiatives. Failure to effectively identify, develop and execute our strategies and initiatives may lead to increased costs and lower sales, each of which could have a material adverse effect on our operating results. We anticipate losses in the Crazy 8 division in fiscal 2009. These losses may depress the share price of our stock.
We have opened new businesses in the past that were ultimately unsuccessful such as the Janeville division, which we opened in fiscal 2004 and closed in fiscal 2006. There can be no assurance that new business concepts will be successful, and our incurrence of expenses in the launch of new business concepts that do not ultimately succeed could have a material adverse effect on our financial position.
Changes in seasonal consumer spending patterns that are beyond our control could harm our business.
Historically, a significant portion of our retail sales have been realized during the holiday season in November and December. We have also experienced periods of increased sales activity in the early spring, during the period leading up to the Easter holiday, and in the early fall, in connection with back-to-school sales. Changes in seasonal consumer spending patterns for reasons beyond our control could result in lower-than-expected sales during these periods. For example, the current global economic downturn and the timing of any recovery may have unanticipated effects on consumer spending patterns. Such circumstances could cause us to have excess inventory, necessitating markdowns to dispose of these excess inventories, which would reduce our profitability. Any failure by us to meet our business plan for, in particular, the third or fourth quarter of any fiscal year would have a material adverse effect on our earnings, which in all likelihood would not be offset by satisfactory results achieved in other quarters of the same fiscal year in which sales are less concentrated. Also, because we typically spend more in labor costs during the holiday season to hire temporary store employees in anticipation of holiday spending, a shortfall in expected sales during that period could result in a disproportionate decrease in our net income.
Competition and the strength of our competitors may impair our ability to maintain or grow our sales and adversely affect our operating results.
The apparel segment of the specialty retail industry is highly competitive, and we may not be able to successfully compete in the future. The principal factors of competition for retail sales are product design, product quality, brand image, customer service and pricing. Our Gymboree, Gymboree Outlet, Janie and Jack, and Crazy 8 brands compete on a national level with BabyGap and GapKids (divisions of Gap, Inc.), and certain leading department stores operating in malls, outlet centers or street locations, as well as certain discount retail chains such as Old Navy (a division of Gap, Inc.), The Children’s Place, Wal-Mart, and Target. Our Gymboree, Gymboree Outlet, Janie and Jack, and Crazy 8 brands also compete with a wide variety of local and regional specialty stores, with certain other retail chains, and with children’s retailers that sell their products by mail order, online or through outlet malls. Many of these competitors are larger than us and have substantially greater financial, marketing and other resources. Increased competition may reduce sales and gross margins, and increase operating expenses, each of which could have a material adverse effect on our operating results.
We may not be able to successfully operate if we lose key personnel, are unable to hire qualified additional personnel, or experience turnover of our management team.
Our continued success is largely dependent on the individual efforts and abilities of our senior management team and certain other key personnel and on our ability to retain current management and to attract and retain
9
qualified key personnel in the future. The loss of certain key employees or our inability to continue to attract and retain other qualified key employees could have a material adverse effect on our growth, operations and financial position.
Our business may be harmed by additional United States regulation of foreign trade or delays caused by additional United States customs requirements.
Our business is subject to the risk that the United States may adopt additional regulations relating to imported apparel products, including quotas, duties, taxes and other charges or restrictions on imported apparel. We cannot predict whether additional United States quotas, duties, taxes or other charges or restrictions will be imposed upon the importation of our products in the future, or what effect any such actions would have on our business, financial position and results of operations. If the United States government imposes any such charges or restrictions, our supply of products could be disrupted and their cost could substantially increase, either of which could have a material adverse effect on our operating results. Unforeseen delays in customs clearance of any goods could have a material adverse effect on our ability to deliver complete shipments to our stores in a timely manner, which in turn could have a material adverse effect on our business and operating results.
Because we purchase our products internationally, our business is sensitive to risks associated with international business.
Our products are currently manufactured to our specifications by independent factories located primarily in Asia, Central America, Africa, and South America. As a result, our business is subject to the risks generally associated with doing business abroad, such as foreign governmental regulations, currency fluctuations, adverse conditions such as epidemics, natural disasters, wars, acts of terrorism, social or political unrest, disruptions or delays in transportation or customs clearance, local business practices and changes in economic conditions in countries in which our suppliers are located. For example, we have incurred late deliveries in United States ports due to labor strikes. If related contract negotiations are not resolved, we could experience additional late deliveries, which could negatively impact our sales. We cannot predict the effect of such factors on our business relationships with foreign suppliers or on our ability to deliver products into our stores in a timely manner. If even a small portion of our current foreign manufacturing sources or textile mills were to cease doing business with us for any reason, such actions could have a material adverse effect on our operating results and financial position.
In addition, we are currently pursuing strategies to reduce product costs. These strategies may result in sourcing product from factories from which we have not previously purchased products and which may be in countries in which we have not done business before. Further, labor costs are currently increasing in some of the countries where our products are manufactured. Increased labor costs, together with the volatility in fuel prices and foreign exchange rates, may impact our ability to reduce product costs.
All of the foregoing risks are increased by the current global economic conditions and their impact on less developed economies in some of the countries in which we do business. These efforts could result in greater risk to timely deliveries and quality control.
We are dependent on two facilities for distribution of product to all of our stores.
We handle merchandise distribution for all of our United States stores from a single facility in Dixon, California, and distribution for all of our Canadian stores from a facility owned and operated by a third party in Toronto, Canada. Starting in June 2009, we will no longer utilize the distribution center in Canada and will distribute products to Canadian stores from our existing distribution center in Dixon, California. Our failure to effectively manage the transition to a single distribution facility, or any significant interruption in the operation of these distribution facilities due to natural disasters, accidents, system failures, or other unforeseen causes could delay or impair our ability to distribute merchandise to our stores, which could cause sales to decline and have a material adverse effect on our earnings and financial position.
10
We may be subject to negative publicity or be sued if our manufacturers violate labor laws or engage in practices that our customers believe are unethical.
We require our independent manufacturers to operate their businesses in compliance with the laws and regulations that apply to them. Our sourcing personnel periodically visit and monitor the operations of our independent manufacturers, but we cannot control their business and labor practices. We also rely on an independent third party to audit our factories on an annual basis. If an independent manufacturer violates or is suspected of violating labor laws or other applicable regulations, or if a manufacturer engages in labor or other practices that diverge from those typically acceptable in the United States, Canada or Europe, we could in turn experience negative publicity or be sued. Negative publicity or legal actions regarding our manufacturers or the production of our products could have a material adverse effect on our reputation, sales, business, financial position, and operating results.
The loss of a key buying agent could disrupt our ability to deliver our inventory supply in a timely fashion, impacting its value.
In fiscal 2008, 2007 and 2006, one buying agent managed approximately 90% of our inventory purchases. Although we believe that other buying agents could be identified and retained to place our required foreign production, the loss of this buying agent could result in delays in procuring inventory, which could result in a material adverse effect on our business and operating results.
We are dependent on third parties for critical business functions, and their failure to provide services to us could have a material adverse effect on our business and operating results.
We rely on third parties for critical functions involving credit card processing and store communications. These third parties may experience financial difficulties, particularly in light of the current global economic downturn, and unforeseen business disruptions that could adversely affect their ability to perform their contractual obligations to us, including their obligations to comply with Payment Card Industry (“PCI”) data security standards. Any such failure to provide services to us or to comply with PCI security requirements could impact our internal communications systems, including our ability to accept payment cards, which could have an adverse impact on business operations and lead to lower sales. Although we believe that other vendors could be identified and retained to provide these services, a change in vendors would take time and could result in a material adverse effect on our business and operating results.
Damage to our computer systems could severely impair our ability to manage our business.
Our operations depend on our ability to maintain and protect the computer systems we use to manage our purchase orders, store inventory levels, web applications, accounting functions and other critical aspects of our business. Our systems are vulnerable to damage from fire, floods, earthquakes, power loss, telecommunications failures and similar events. We have computer systems in each of our stores, with the main database servers for our systems located in San Francisco, California, which is located on or near known earthquake fault zones. An earthquake or other disaster could have a material adverse impact on our business and operating results not only by damaging our stores or corporate headquarters, but also by damaging our main servers, which could disrupt our business for an indeterminate length of time.
Our business may be harmed if our computer network security is compromised.
Despite our considerable efforts and technology to secure our computer network, security could be compromised, confidential information, such as customer credit card numbers, could be misappropriated, or system disruptions could occur. These events could lead to adverse publicity, loss of sales and could cause us to incur significant costs to reimburse third parties for damages which could adversely impact profits. We are currently compliant with PCI data security standards, which require annual audits by independent qualified security assessors to assess compliance. Failure to comply with the security requirements or rectify a security
11
issue may result in fines and the imposition of restrictions on our ability to accept payment cards. There can be no assurance that we will be able to continue to satisfy PCI security standards. In addition, PCI is controlled by a limited number of vendors who have the ability to impose changes in PCI’s fee structure and operational requirements without negotiation. Such changes in fees and operational requirements may result in our failure to comply with PCI security standards, as well as significant unanticipated expenses.
Our ability to successfully implement significant information technology systems is critical to our business.
We plan to continue to upgrade our information technology infrastructure. In fiscal 2009, these initiatives include upgrades to our customer relationship management functionality and our core production system, as well as enhancements to the functionality of our websites and distribution center systems. Such technology systems changes are complex and could cause disruptions that would adversely affect our business. While management strives to ensure the orderly implementation of various information technology systems, we may not be able to successfully execute these changes without potentially incurring a significant disruption to our business. Even if we are successful with implementation, we may not achieve the expected benefits from these initiatives, despite having expended significant capital. We may also determine that additional investment is required to bring our systems to their desired state; this could result in a significant additional investment of time and money and increased implementation risk. Furthermore, we intend to rely on third parties to fulfill contractual obligations related to some of these system upgrades. Failure of these third parties to fulfill their contractual obligations could lead to significant expenses or losses due to a disruption in business operations.
Our operating and financial performance in any given period might not meet the guidance that we have provided to the public.
We provide public guidance on our expected operating and financial results for future periods. Although we believe that this guidance gives investors and analysts a better understanding of management’s expectations for the future, and is useful to our shareholders and potential shareholders, such guidance is comprised of forward-looking statements that are subject to the risks and uncertainties described in this report and in our other public filings and public statements. Our guidance may not always be accurate, particularly in periods of severe economic disruption such as the current global economic downturn. In light of current economic conditions, we plan to provide guidance only one quarter at a time during fiscal 2009. If in the future our operating or financial results for a particular period do not meet our guidance or the expectations of investment analysts, or if we reduce our guidance for future periods, the market price of our common stock could significantly decline. Further, frequent changes in guidance could increase the volatility of our stock price.
We must timely and effectively deliver merchandise to our stores and customers.
We cannot control all of the various factors that might affect our fulfillment rates for online sales and timely and effective merchandise delivery to our stores. We rely upon third-party carriers for our merchandise shipments to and from stores and reliable data regarding the timing of those shipments. In addition, we are heavily dependent upon two carriers for the delivery of our merchandise to online customers. Labor disputes, union organizing activity, inclement weather, natural disasters, and acts of terrorism could affect those carriers’ ability to provide delivery services to meet our shipping needs. Failure to deliver merchandise in a timely and effective manner could damage our reputation and sales.
Our failure to successfully manage our online businesses could have a negative impact on our business.
The successful operation of our online businesses depends on efficient and uninterrupted operation of our order-taking and fulfillment operations. Disruptions or slowdowns in these areas could result from disruptions in telephone service or power outages, inadequate system capacity, system issues, computer viruses, human error, changes in programming, natural disasters or adverse weather conditions. Our online businesses are generally vulnerable to additional risks and uncertainties associated with the Internet, including changes in required
12
technology and other technical failures as well as changes in applicable federal and state regulation, security breaches, and consumer privacy concerns. Problems in any of these areas could result in a reduction in sales, increased selling, general and administrative expenses and damage to our reputation and brands.
Our growth would be hampered if we are unable to locate new stores and relocate existing stores in appropriate retail venues and shopping areas.
Our stores must be located in appropriate retail spaces in areas with demographic characteristics consistent with our customer base. These locations tend to be limited to malls and similar venues where the market for available space has historically been very competitive. The location of acceptable store sites and the negotiation of acceptable lease arrangements require considerable time, effort and expense. Our ability to lease desirable retail space for expansion and relocation of stores, and to renew our existing store leases, on favorable economic terms is essential to our revenue and earnings growth. Approximately 80, 50, and 50 store leases will come up for renewal during fiscal 2009, 2010 and 2011, respectively. We are also in the process of negotiating lease terms for approximately 50 stores, which are currently operating under month-to-month terms. There can be no assurance that we will be able to achieve our store expansion goals, effectively manage our growth, successfully integrate the planned new stores into our operations, or profitably operate our new and remodeled stores. Failure to obtain and renew leases for a sufficient number of stores on acceptable terms would have a material adverse effect on our revenues and results of operations.
Our growth would be hampered if we are unable to successfully open new stores.
We plan to open approximately 75 new stores in fiscal 2009. Our growth depends in large part on our ability to successfully open new stores in both the United States and abroad, which in turn is dependent on a number of factors, including our ability to hire and train skilled store operating and management teams and our ability to complete construction within planned timelines and budgets. There can be no assurance that we will successfully open the number of stores planned for fiscal 2009, and the resulting impact on our growth rate could materially affect the market price for our common stock.
We may experience fluctuations in our tax obligations and effective tax rate.
We are subject to income taxes in many United States, Canadian and Puerto Rican jurisdictions. We record tax expense based on our estimates of future payments, which include reserves for estimates of uncertain tax positions. At any one time, many tax years are subject to audit by various taxing jurisdictions. The results of these audits and negotiations with taxing authorities may impact the ultimate settlement of these tax positions. As a result, we expect that there could be ongoing variability in our quarterly tax rates as taxable events occur and exposures are re-evaluated. Further, our effective tax rate in a given financial statement period may be materially impacted by changes in the mix and level of earnings.
We are also subject to sales and use taxes in many United States, Canadian and Puerto Rican jurisdictions. At any one time, many tax years are subject to audit by various taxing jurisdictions. The results of these audits and negotiations with taxing authorities may adversely impact the ultimate settlement of these tax positions and our financial results.
We may require external funding sources for operating funds in the future.
We regularly review and evaluate our liquidity and capital needs. We currently believe that our available cash, cash flow from operations and cash available under our existing and future credit facilities will be sufficient to finance our operations and expected capital requirements for at least the next 12 months. However, as we continue to grow, we might experience peak periods for our cash needs during the course of our fiscal year, and we might need additional external funding to support our operations. In addition, our current credit facility expires in August 2009. Although we believe we will have access to debt and/or capital market funding as
13
needed, such funds may not be available to us on advantageous terms. If the cost of such funds is greater than expected, it could adversely affect our expenses and our operating results.
We may be unable to protect our trademarks and other intellectual property rights.
We believe that our trademarks and service marks are important to our success and our competitive position due to their name recognition with our customers. We devote substantial resources to the establishment and protection of our trademarks and service marks on a worldwide basis. In order to more effectively protect them from infringement and to defend against claims of infringement, the marks are owned by a separate subsidiary whose purpose is to maintain and manage existing and future marks, thereby increasing their value to us. We are not aware of any material claims of infringement or material challenges to our right to use any of our trademarks and service marks in the United States. Nevertheless, the actions we have taken to establish and protect our trademarks and service marks may not be adequate to prevent imitation of our products by others or to prevent others from seeking to block sales of our products as a violation of the trademarks, service marks and proprietary rights of others. Also, others may assert rights in, or ownership of, trademarks and other proprietary rights of ours and we may not be able to successfully resolve these types of conflicts to our satisfaction. In addition, the laws of certain foreign countries may not protect proprietary rights to the same extent as do the laws of the United States.
We may be a party to legal proceedings that could result in unexpected adverse outcomes.
From time to time, we are a party to legal proceedings, including matters involving personnel and employment issues, personal injury, and other proceedings arising in the ordinary course of business. In addition, there are an increasing number of cases being filed, particularly against retailers, that contain class action allegations under federal and state wage and hour laws. We evaluate our exposure to these legal proceedings and establish reserves for the estimated liabilities in accordance with generally accepted accounting principles. Assessing and predicting the outcome of these matters involve substantial uncertainties. Although not currently anticipated by management, unexpected outcomes in these legal proceedings, or changes in management’s evaluations or predictions, could have a material adverse impact on our financial results.
Any terrorist act that impacts consumer shopping could have a material adverse effect on our business.
We are dependent upon the continued popularity of malls as shopping destinations and the ability of mall anchor tenants and other attractions to generate customer traffic in the malls where our stores are located. Any terrorist act that decreases the level of mall traffic or other shopping traffic could have a material adverse effect on our business.
Our performance is dependent on attracting and retaining a large and growing number of qualified team members.
Many of those team members are in entry-level or part-time positions with historically high rates of turnover. Our ability to meet our labor needs while controlling our costs is subject to external factors such as unemployment levels, minimum wage legislation, health care legislation and changing demographics. In addition, our labor costs are influenced by health care and workers’ compensation costs, both of which have been rising in recent years. If we cannot hire enough qualified employees, or if there is a disruption in the supply of personnel we hire from third-party providers, especially during our peak season or certain high-volume events, our customer service levels and our operations could be negatively impacted.
| ITEM 1B. | UNRESOLVED STAFF COMMENTS |
None.
14
The Company leases approximately 162,400 square feet of office space in a building in San Francisco, California, for its corporate offices. The lease expires on April 14, 2018.
The Company owns a 444,000 square-foot distribution center on approximately 31 acres in Dixon, California. All products are distributed to our United States stores from this facility. The Company utilizes a distribution center owned and operated by a third party in Toronto, Canada, for Canadian operations. Starting in June 2009, the Company will no longer utilize the distribution center in Canada and will distribute products to Canadian stores from its existing distribution center in Dixon, California.
As of January 31, 2009, the Company’s 886 stores included an aggregate of approximately 1,735,000 square feet of space. Store leases typically have 10-year terms and include a cancellation clause if minimum revenue levels are not achieved during a specified 12-month period during the lease term. Some leases are structured with a minimum rent component plus a percentage rent based on the store’s net sales in excess of a certain threshold. Substantially all of the leases require the Company to pay insurance, utilities, real estate taxes, and common area repair and maintenance expenses. Approximately 80, 50, and 50 store leases will come up for renewal during fiscal 2009, 2010 and 2011, respectively. The Company is also in the process of negotiating lease terms for approximately 50 stores currently operating under month-to-month terms. As of January 31, 2009, we also operated seven Gymboree Play & Music corporate-owned sites in California and Florida under leases that expire between fiscal 2010 and fiscal 2013. See Note 3 to consolidated financial statements.
The Company is subject to various legal proceedings and claims arising in the ordinary course of business. Our management does not expect that the results of any of these legal proceedings, either individually or in the aggregate, would have a material adverse effect on our financial position, results of operations or cash flows.
| ITEM 4. | SUBMISSION OF MATTERS TO A VOTE OF SECURITY HOLDERS |
None.
PART II
| ITEM 5. | MARKET FOR REGISTRANT’S COMMON EQUITY, RELATED STOCKHOLDER MATTERS AND ISSUER PURCHASES OF EQUITY SECURITIES |
The Gymboree Corporation’s common stock is traded on The Nasdaq Stock Market LLC under the symbol “GYMB.” The following table sets forth the quarterly high and low sale prices per share of our common stock over the last two fiscal years, as reported on The Nasdaq Stock Market LLC.
| | | | | | | | | | | | |
| | | Fiscal 2008 | | Fiscal 2007 |
| | | High | | Low | | High | | Low |
First Quarter | | $ | 45.20 | | $ | 35.29 | | $ | 45.29 | | $ | 34.66 |
Second Quarter | | | 47.69 | | | 33.32 | | | 45.55 | | | 35.91 |
Third Quarter | | | 41.79 | | | 21.33 | | | 44.09 | | | 29.10 |
Fourth Quarter | | | 28.41 | | | 16.48 | | | 39.20 | | | 25.99 |
As of February 28, 2009, the number of holders of record of the Company’s common stock totaled approximately 670. The Company has never declared or paid cash dividends on its common stock and anticipates that all future earnings will be retained for development of its business or stock repurchases. The payment of any
15
future dividends will be at the discretion of the Company’s Board of Directors and will depend upon, among other things, future earnings, capital requirements, our financial position and general business conditions. In addition, the Company is restricted from paying dividends under the terms of its existing credit facility. This credit facility also limits stock repurchases.
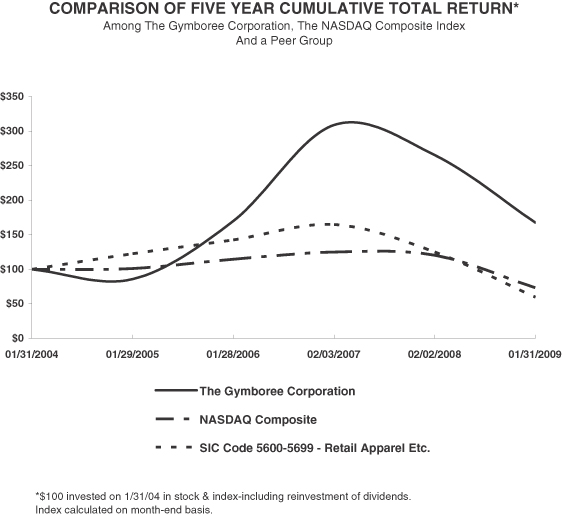
The following graph compares the cumulative five-year total return to shareholders on The Gymboree Corporation’s common stock relative to the cumulative total returns of the NASDAQ Composite index and a peer group of 58 companies contained in SIC Codes 5600-5699. The graph assumes that the value of the investment in the Company’s common stock, in the peer group, and the index (including reinvestment of dividends) was $100 on February 31, 2004 and tracks it through January 31, 2009.
| | | | | | | | | | | | | | | | | | |
| | | 01/31/2004 | | 01/29/2005 | | 01/28/2006 | | 02/03/2007 | | 02/02/2008 | | 01/31/2009 |
The Gymboree Corporation | | $ | 100.00 | | $ | 85.84 | | $ | 169.97 | | $ | 309.03 | | $ | 265.46 | | $ | 167.58 |
NASDAQ Composite | | | 100.00 | | | 101.08 | | | 114.61 | | | 124.99 | | | 120.39 | | | 73.10 |
SIC Code 5600-5699 - Retail Apparel Etc. | | | 100.00 | | | 122.71 | | | 142.62 | | | 164.81 | | | 124.93 | | | 59.47 |
The stock price performance included in this graph is not necessarily indicative of future stock price performance.
16
The 58 companies included in the customized peer group are: Abercrombie & Fitch Company, Aeropostale, Inc., American Eagle Outfitters, Inc., Ann Taylor Stores Corp., Bakers Footwear Group, Inc., Bluefly, Inc., Brown Shoe Company, Inc., Cache, Inc., Carter’s, Inc., Casual Male Retail Group, Inc., Cato Corp., Charlotte Russe Holding, Inc., Charming Shoppes, Inc., Chico’s FAS, Inc., Christopher & Banks Corp., Citi Trends, Inc., Collective Brands, Inc., Delia*’s, Inc., Destination Maternity Corp., Dover Saddlery, Inc., DSW, Inc., Eddie Bauer Holdings, Inc., Foot Locker, Inc., Footstar, Inc., Gap, Inc., Genesco, Inc., Harolds Stores, Inc., Hartmarx Corp., Hot Topic, Inc., J. Crew Group, Inc., Jo-Ann Stores, Inc., Kuhlman Company, Inc., Limited Brands, Inc., MediaG3, Inc., New York & Company, Inc., Nordstrom, Inc., One Price Clothing Stores, Ovale Group, Inc., Pacific Sunwear of California, Inc., Prevu, Inc., Ross Stores, Inc., Seaway Valley Capital, Corp., Shoe Carnival, Inc., Shoe Pavilion, Inc., Stage Stores, Inc., Stein Mart, Inc., Syms Corp., The Buckle, Inc., The Children’s Place Retail Stores, Inc., The Dress Barn, Inc., The Finish Line, Inc., The Gymboree Corp., The Men’s Wearhouse, Inc., Talbots, Inc., The Walking Company Holdings, Inc., Tween Brands, Inc., The Wet Seal, Inc., and Zumiez, Inc.
17
| ITEM 6. | SELECTED CONSOLIDATED FINANCIAL DATA |
The following selected financial data has been derived from the Consolidated Financial Statements of the Company. The Company’s United Kingdom and Ireland (collectively “Europe”) operations and its Janeville division have been presented as discontinued operations in the accompanying financial statements for fiscal years 2004 through 2006. Results of the Europe and Janeville operations in fiscal 2007 and fiscal 2008 are insignificant and are included in continuing operations. The data set forth below should be read in conjunction with “Management’s Discussion and Analysis of Financial Condition and Results of Operations” and our consolidated financial statements and notes thereto.
| | | | | | | | | | | | | | | | | | | | |
| | | Fiscal Year (number of weeks) | |
| | | 2008 (52) | | | 2007 (52) | | | 2006 (53) | | | 2005 (52) | | | 2004 (52) | |
| (In thousands, except operating data and per share amounts) | | | | | | | | | | | | | | | |
Statement of Operations Data: | | | | | | | | | | | | | | | | | | | | |
Net sales: | | | | | | | | | | | | | | | | | | | | |
Retail (1) | | $ | 987,859 | | | $ | 909,410 | | | $ | 781,172 | | | $ | 656,546 | | | $ | 578,266 | |
Play & Music | | | 12,819 | | | | 11,404 | | | | 10,466 | | | | 10,946 | | | | 10,753 | |
| | | | | | | | | | | | | | | | | | | | |
Total net sales | | | 1,000,678 | | | | 920,814 | | | | 791,638 | | | | 667,492 | | | | 589,019 | |
Cost of goods sold, including buying and occupancy expenses | | | (524,477 | ) | | | (478,020 | ) | | | (407,180 | ) | | | (372,158 | ) | | | (353,510 | ) |
| | | | | | | | | | | | | | | | | | | | |
Gross profit | | | 476,201 | | | | 442,794 | | | | 384,458 | | | | 295,334 | | | | 235,509 | |
Selling, general and administrative expenses | | | (327,893 | ) | | | (312,549 | ) | | | (278,294 | ) | | | (233,481 | ) | | | (211,986 | ) |
| | | | | | | | | | | | | | | | | | | | |
Operating income | | | 148,308 | | | | 130,245 | | | | 106,164 | | | | 61,853 | | | | 23,523 | |
Interest income | | | 1,690 | | | | 2,609 | | | | 5,314 | | | | 2,221 | | | | 1,022 | |
Interest expense | | | (208 | ) | | | (179 | ) | | | (232 | ) | | | (340 | ) | | | (355 | ) |
Other income (expense), net | | | (151 | ) | | | 769 | | | | 1,560 | | | | (75 | ) | | | (82 | ) |
| | | | | | | | | | | | | | | | | | | | |
Income from continuing operations, before income tax | | | 149,639 | | | | 133,444 | | | | 112,806 | | | | 63,659 | | | | 24,108 | |
Income tax expense | | | (56,159 | ) | | | (53,113 | ) | | | (41,655 | ) | | | (25,460 | ) | | | (2,550 | ) |
| | | | | | | | | | | | | | | | | | | | |
Income from continuing operations, net of income tax | | | 93,480 | | | | 80,331 | | | | 71,151 | | | | 38,199 | | | | 21,558 | |
Loss from discontinued operations, net of income tax | | | — | | | | — | | | | (10,901 | ) | | | (4,515 | ) | | | (14,120 | ) |
| | | | | | | | | | | | | | | | | | | | |
Income before cumulative effect of change in accounting principle | | | 93,480 | | | | 80,331 | | | | 60,250 | | | | 33,684 | | | | 7,438 | |
Cumulative effect of change in accounting principle, net of income tax | | | — | | | | — | | | | — | | | | — | | | | 1,206 | |
| | | | | | | | | | | | | | | | | | | | |
Net income | | $ | 93,480 | | | $ | 80,331 | | | $ | 60,250 | | | $ | 33,684 | | | $ | 8,644 | |
| | | | | | | | | | | | | | | | | | | | |
Basic income per share: | | | | | | | | | | | | | | | | | | | | |
Income from continuing operations, net of income tax | | $ | 3.35 | | | $ | 2.79 | | | $ | 2.25 | | | $ | 1.21 | | | $ | 0.70 | |
Loss from discontinued operations, net of income tax | | | — | | | | — | | | | (0.34 | ) | | | (0.14 | ) | | | (0.46 | ) |
Cumulative effect of change in accounting principle, net of income tax | | | — | | | | — | | | | — | | | | — | | | | 0.04 | |
| | | | | | | | | | | | | | | | | | | | |
Net income | | $ | 3.35 | | | $ | 2.79 | | | $ | 1.90 | | | $ | 1.07 | | | $ | 0.28 | |
| | | | | | | | | | | | | | | | | | | | |
Diluted income per share: | | | | | | | | | | | | | | | | | | | | |
Income from continuing operations, net of income tax | | $ | 3.21 | | | $ | 2.67 | | | $ | 2.15 | | | $ | 1.19 | | | $ | 0.69 | |
Loss from discontinued operations, net of income tax | | | — | | | | — | | | | (0.33 | ) | | | (0.14 | ) | | | (0.45 | ) |
Cumulative effect of change in accounting principle, net of income tax | | | — | | | | — | | | | — | | | | — | | | | 0.04 | |
| | | | | | | | | | | | | | | | | | | | |
Net income | | $ | 3.21 | | | $ | 2.67 | | | $ | 1.82 | | | $ | 1.05 | | | $ | 0.28 | |
| | | | | | | | | | | | | | | | | | | | |
Basic weighted average shares outstanding | | | 27,919 | | | | 28,797 | | | | 31,647 | | | | 31,485 | | | | 30,747 | |
Diluted weighted average shares outstanding | | | 29,154 | | | | 30,033 | | | | 33,099 | | | | 32,178 | | | | 31,391 | |
| | | | | |
Operating Data: | | | | | | | | | | | | | | | | | | | | |
Number of stores at end of period | | | 886 | | | | 786 | | | | 698 | | | | 642 | | | | 634 | |
Net sales per gross square foot at period-end (2) | | $ | 564 | | | $ | 595 | | | $ | 592 | | | $ | 549 | | | $ | 498 | |
Net sales per average store (3) | | $ | 1,105,000 | | | $ | 1,146,000 | | | $ | 1,111,000 | | | $ | 1,018,000 | | | $ | 911,000 | |
Comparable store net sales increase (4) | | | 0 | % | | | 7 | % | | | 12 | % | | | 9 | % | | | 2 | % |
| | | | | |
Balance Sheet Data: | | | | | | | | | | | | | | | | | | | | |
Working capital | | $ | 180,040 | | | $ | 58,038 | | | $ | 161,710 | | | $ | 179,045 | | | $ | 106,538 | |
Total assets | | | 520,581 | | | | 397,184 | | | | 454,208 | | | | 424,778 | | | | 351,699 | |
Stockholders’ equity | | | 334,275 | | | | 208,295 | | | | 275,727 | | | | 275,077 | | | | 217,406 | |
Notes:
| (1) | Net retail sales include revenues from the Company’s retail stores, online stores and the Gymboree Visa program. |
| (2) | Equals revenues from the Company’s retail stores and online stores, divided by total square feet of store space as of each fiscal year-end. |
| (3) | Equals revenues from the Company’s retail stores and online stores, divided by stores open as of each fiscal year-end. |
| (4) | A comparable store is one that has been open for a full 14 months. Stores that are relocated or expanded by more than 15% of their original square footage become comparable 14 months after final relocation or the completion of the expansion project. Comparable stores net sales include net sales from the Company’s online stores. Comparable stores net sales were calculated on a 52-week basis for all periods presented. |
18
| ITEM 7. | MANAGEMENT’S DISCUSSION AND ANALYSIS OF FINANCIAL CONDITION AND RESULTS OF OPERATIONS |
You should read the following discussion and analysis in conjunction with our consolidated financial statements and related notes included elsewhere in this report. Except for historical information, the following discussion contains forward-looking statements within the meaning of the Private Securities Litigation Reform Act of 1995. Inaccurate assumptions and known and unknown risks and uncertainties can affect the accuracy of forward-looking statements, and our actual results could differ materially from results that may be anticipated by such forward-looking statements. The principal factors that could cause or contribute to such differences include, but are not limited to, those discussed in Item 1A, “Risk Factors,” and those discussed elsewhere in this report. We do not intend to revise any forward-looking statements in order to reflect events or circumstances that may subsequently arise.
General
The Gymboree Corporation is a specialty retailer operating stores selling high-quality apparel and accessories for children under the GYMBOREE®, GYMBOREE OUTLET, JANIE AND JACK®, and CRAZY 8® brands, as well as play programs for children under the GYMBOREE PLAY & MUSIC® brand. As of January 31, 2009, the Company had 886 stores, including 854 stores in the United States (including 584 Gymboree stores, 117 Gymboree Outlet stores, 115 Janie and Jack shops, and 38 Crazy 8 stores), 29 Gymboree stores in Canada, two Gymboree stores in Puerto Rico, and one Gymboree Outlet store in Puerto Rico. The Company also operates three online stores atwww.gymboree.com,www.janieandjack.com, and www.crazy8.com.
The Company’s net sales for fiscal 2008 increased to $1.0 billion from $920.8 million in fiscal 2007 and $791.6 million in fiscal 2006. Net income totaled $93.5 million in fiscal 2008 compared to $80.3 million in fiscal 2007 and $60.3 million in fiscal 2006. Comparable store net sales (which include online stores), based on a 52-week period, remained flat during fiscal 2008 versus 2007, increased 7% during fiscal 2007 versus 2006, and increased 12% during fiscal 2006 versus 2005.
The Company expects the current challenging retail environment to continue throughout fiscal 2009. The Company expects a significant reduction in earnings for the first quarter of fiscal 2009 as a result of the global economic downturn, as well as the impact of recent changes to consumer product safety laws. The effect of the consumer product safety laws is expected to diminish by the third quarter of fiscal 2009 due to the Company’s product cycle lifespan. The duration and severity of the negative impact of the current global economic downturn is uncertain.
The Company continues to expect that future increases in net sales and net income will be dependent on, among other factors such as economic conditions, its ability to:
| | • | | Expand its two newer growth concepts, Janie and Jack and Crazy 8; |
| | • | | Continue to reduce product costs while maintaining high-quality standards; |
| | • | | Generate more sales to existing customers in the core Gymboree division through growth of the Boy department business and increased newborn product assortment; and |
| | • | | Attract new customers through strategies such as direct mail campaigns and cross-brand marketing. |
The Company’s long-term growth will also depend on refinement and expansion of newer retail concepts such as Janie and Jack and Crazy 8, as well as continued investment in its core retail brands, Gymboree and Gymboree Outlet. To foster long-term growth, the Company will continue to strategically evaluate the best uses of the Company’s assets in order to take advantage of opportunities in the marketplace.
The Company continues to be in a strong financial position with approximately $140.5 million in cash and cash equivalents and no debt as of January 31, 2009. In fiscal 2008, the Company generated $155.0 million of
19
cash flow from operations. The Company anticipates that cash generated from operations, together with existing cash resources and funds available from current and future credit facilities, will be sufficient to satisfy cash needs for the foreseeable future.
During 2009, the Company plans to open approximately 75 new stores, including 25 Gymboree stores (20 in the United States and five in Canada), 20 Gymboree Outlet stores, five Janie and Jack shops, and 25 Crazy 8 stores. The Company also plans to remodel, relocate or expand approximately 65 Gymboree stores.
The Company’s year-end is on the Saturday closest to January 31. Fiscal 2008 and fiscal 2007, which included 52 weeks, ended on January 31, 2009 and February 2, 2008, respectively. Fiscal 2006, which included 53 weeks, ended on February 3, 2007. Management estimates that the 53rd week of fiscal 2006 contributed approximately $0.05 per diluted share to income from continuing operations.
Critical Accounting Policies
Critical accounting policies are those accounting policies and estimates that management believes are important to the portrayal of the Company’s financial condition and results of operations and require management’s most difficult, subjective or complex judgments, often as a result of the need to make estimates about the effect of matters that are inherently uncertain.
Inventory Valuation. Merchandise inventories are recorded at the lower of cost or market (“LCM”), determined on a weighted-average basis. The Company reviews its inventory levels in order to identify slow-moving merchandise and broken assortments (items no longer in stock in a sufficient range of sizes) and records a reserve when the future estimated selling price is less than cost. This reserve is based on management’s estimate of overall business conditions including stocking positions, inventory aging, historical performance and the promotional environment. The Company takes a physical count of inventories in all stores once a year and in some stores twice a year, and performs cycle counts throughout the year in its distribution centers. The Company records an inventory shrink adjustment based upon physical counts and also provides for estimated shrink adjustments for the period between the last physical inventory count and each balance sheet date. The Company’s inventory shrink estimate can be affected by changes in merchandise mix and changes in actual shrink trends. The Company’s LCM estimate can be affected by changes in consumer demand and the promotional environment. We do not believe there is a reasonable likelihood that there will be a material change in the future estimates or assumptions we use to calculate our LCM or inventory shortage reserves. However, if estimates regarding consumer demand are inaccurate or our actual physical inventory shortage differs significantly from our estimate, our operating results could be affected.
Asset Impairment. The Company reviews long-lived assets for impairment whenever events or changes in circumstances indicate that the carrying value of an asset may not be recoverable. If the undiscounted future cash flows from the long-lived assets are less than the carrying value, the Company recognizes a loss equal to the difference between the carrying value and the fair value of the assets. Decisions to close a store or facility can also result in accelerated depreciation over the revised useful life. For locations to be closed that are under long-term leases, the Company records a charge for lease buyout expense or the difference between its rent and the rate at which it expects to be able to sublease the properties and related cost, as appropriate. Most closures occur upon the lease expiration. The Company’s estimate of future cash flows is based on historical experience, and in 2008, considered the current economic downturn in future sales assumptions. These estimates can be affected by factors that are difficult to predict, such as future store profitability, real estate demand and economic conditions. We do not believe there is a reasonable likelihood that there will be a material change in the estimates or assumptions we use to calculate impairment losses of long-lived assets. However, if actual results are not consistent with our estimates and assumptions used in the calculations, we may be exposed to losses that could be material. The Company’s recorded asset impairment charges have not been and are not expected to be material.
20
Income Taxes.The Company provides for income taxes in accordance with Statement of Financial Accounting Standards No. 109,Accounting for Income Taxes (“SFAS 109”). SFAS 109 requires the recognition of deferred tax assets and liabilities for the expected future tax consequences of temporary differences between the financial statement carrying amounts and the tax bases of assets and liabilities. The Company maintains valuation allowances when it is more likely than not that all or a portion of a deferred tax asset will not be realized. Changes in valuation allowances from period to period are included in the tax provision in the period of change. In determining whether a valuation allowance is warranted, the Company takes into account such factors as prior earnings history, expected future earnings, carryback and carryforward periods, and tax strategies that could potentially enhance the likelihood of realization of a deferred tax asset. The Company is subject to periodic audits by the Internal Revenue Service and other taxing authorities. These audits may challenge certain of the Company’s tax positions, such as the timing and amount of deductions and allocation of taxable income to the various tax jurisdictions. Income tax contingencies are accounted for in accordance with FASB Interpretation No. 48, “Accounting for Uncertainty in Income Taxes” (“FIN 48”). Determining the income tax expense for these potential assessments requires management to make assumptions that are subject to factors such as proposed assessments by tax authorities, changes in facts and circumstances, issuance of new regulations, and resolution of tax audits. Actual results could materially differ from these estimates and could significantly affect the effective tax rate and cash flows in future years.
Revenue Recognition. Revenue is recognized at the point of sale in retail stores. Online revenue is recorded when the Company estimates merchandise is delivered to the customer. Customers generally receive merchandise within three to five days of shipment. Shipping fees received from customers are included in net sales and the associated shipping costs are included in cost of goods sold. The Company also sells gift cards in its retail store locations, through its online stores, and through third parties. Revenue is recognized in the period that the gift card is redeemed. The Company recognizes unredeemed gift card and merchandise credit balances over three years old as other income within selling, general and administrative expenses. Sales are presented net of a sales return reserve, which is estimated based on historical return trends. We do not believe there is a reasonable likelihood that there will be a material change in the future estimates or assumptions we use to calculate our sales return reserve. However, if the actual rate of sales returns increases significantly, our operating results could be adversely affected.
Fiscal 2008 Compared to Fiscal 2007
Net Sales
Net retail sales for fiscal 2008 increased to $987.9 million from $909.4 million in fiscal 2007, an increase of $78.5 million, or 8.6%. This increase was primarily due to net store and square footage growth of 100 stores and approximately 222,000 square feet, respectively. Comparable store sales remained flat, primarily due to a general softening of the overall retail environment driven by macro-economic conditions. The pullback in consumer spending resulted in an overall decrease in average unit retail prices and units per transaction, and was partially offset by an increase in the total number of transactions.
Gymboree Play & Music net sales for fiscal 2008 increased to $12.8 million from $11.4 million in fiscal 2007. The increase was primarily due to increases in royalties, international franchise sales, and product sales. There were 609 Gymboree Play & Music sites at the end of fiscal 2008 (including seven Company-operated sites), compared to 559 sites (including three Company-operated sites) at the end of fiscal 2007.
Gross Profit
Gross profit for fiscal 2008 increased to $476.2 million from $442.8 million in fiscal 2007. As a percentage of net sales, gross profit decreased 0.5 percentage points to 47.6% from 48.1% last year. This decrease was primarily due to lower full-priced selling associated with the economic downturn and deleveraging of occupancy costs. The decrease was partially offset by product cost reductions and buying cost leverage. Gross profit for fiscal 2008 includes a $6.1 million write-off, recorded in the fourth quarter, related to merchandise inventories
21
and compliance with new consumer product safety laws relating to levels of lead and phthalates in children’s apparel and accessories.
Selling, General and Administrative Expenses
Selling, general and administrative (“SG&A”) expenses, which principally consist of non-occupancy store expenses, corporate overhead and distribution expenses, increased to $327.9 million in fiscal 2008 from $312.5 million in fiscal 2007, an increase of $15.4 million, or 4.9%. SG&A as a percentage of net sales decreased 1.1 percentage points to 32.8% from 33.9% in fiscal 2007. The SG&A decrease as a percentage of net sales for fiscal 2008 was primarily due to decreased marketing expenses and professional fees.
Interest Income
Interest income decreased to $1.7 million in fiscal 2008 from $2.6 million in fiscal 2007 mainly due to lower interest rates in fiscal 2008.
Income Taxes
Income tax expense for fiscal 2008 and 2007 resulted in effective tax rates of approximately 37.5% and 39.8%, respectively. The effective tax rate in fiscal 2008 benefited from foreign tax credits arising from foreign taxes accrued in fiscal 2008 and prior years, excluding deferred taxes and FIN 48 reserves.
Fiscal 2007 Compared to Fiscal 2006
Net Sales
Net retail sales for fiscal 2007 increased to $909.4 million from $781.2 million in fiscal 2006, an increase of $128.2 million, or 16%. Comparable store sales increased 7%, primarily driven by a variety of factors including a positive response to the Company’s direct marketing efforts and continued strength in sales from the Gymboree Boy departments, Janie and Jack, and Gymboree Outlet. Non-comparable store sales increased due to net store and square footage growth of 88 stores and approximately 200,000 square feet, respectively.
Gymboree Play & Music net sales for fiscal 2007 increased to $11.4 million from $10.5 million in fiscal 2006. There were 559 Gymboree Play & Music sites at the end of fiscal 2007 (including three Company-operated sites), compared to 548 sites (including three Company-operated sites) at the end of fiscal 2006.
Gross Profit
Gross profit for fiscal 2007 increased to $442.8 million from $384.5 million in fiscal 2006. As a percentage of net sales, gross profit decreased 0.5 percentage points to 48.1% from 48.6% in fiscal 2006. This decrease was primarily due to lower full-priced selling, as a result of a more promotional retail environment in fiscal 2007, as well as the absence of the 53rd week in fiscal 2007 and relatively lower gross margins generated in the Crazy 8 division.
Selling, General and Administrative Expenses
SG&A expenses increased to $312.5 million in fiscal 2007 from $278.3 million in fiscal 2006, an increase of $34.2 million, or 12%. SG&A as a percentage of net sales decreased 1.3 percentage points to 33.9% from 35.2% in fiscal 2006. SG&A expenses in fiscal 2006 included a charge of $3.7 million related to the retirement of the Company’s former Chairman and Chief Creative Officer (see Note 11). Excluding this item, SG&A as a percentage of net sales decreased 0.8 percentage points to 33.9% from 34.7% in fiscal 2006. SG&A decreases as a percentage of net sales for fiscal 2007 were primarily due to improved leveraging of store and corporate compensation expense (excluding share-based compensation), lower professional services fees and travel, partially offset by increases in marketing expenses and share-based compensation.
22
Interest Income
Interest income decreased to $2.6 million in fiscal 2007 from $5.3 million in fiscal 2006 resulting from lower average cash balances due to the Company’s stock repurchase programs in fiscal 2006.
Income Taxes
Income tax expense for fiscal 2007 and 2006 resulted in effective tax rates of approximately 39.8% and 36.9%, respectively. The effective tax rate in fiscal 2006 benefited from reversing a valuation allowance of approximately $3.6 million related to state net operating loss (“NOL”) carryforwards and foreign tax attributes.
Liquidity and Capital Resources
Cash and cash equivalents totaled $140.5 million and $33.3 million as of January 31, 2009 and February 2, 2008, respectively. Working capital as of January 31, 2009 totaled $180.0 million as compared to $58.0 million as of February 2, 2008. Working capital was lower in fiscal 2007 as a result of the Company’s share repurchase programs in that fiscal year.
Net cash provided by operating activities for fiscal 2008 was $155.0 million compared to $107.9 million in fiscal 2007. The increase in fiscal 2008 was primarily due to:
| | • | | an increase in operating income; |
| | • | | lower inventory levels, in part, due to compliance with new consumer product safety laws; |
| | • | | an increase in deferred revenues related to the Gymboree Visa program due to receipt of a minimum guaranteed annual payment; |
| | • | | an increase in construction allowances due to new store growth; and |
| | • | | a decrease in prepaid rent due to timing of payments. |
Net cash provided by operating activities for fiscal 2007 was $107.9 million compared to $121.7 million in fiscal 2006. The decrease in fiscal 2007 was primarily due to an increase in inventory purchases to support planned store and sales growth.
Net cash used in investing activities was $56.1 million in fiscal 2008 compared to net cash provided by investing activities of $60.5 million in fiscal 2007. Net cash used in investing activities in fiscal 2008 consisted of $56.2 million in capital expenditures related to the opening of 105 new stores, relocation, remodeling and/or expansion of 23 existing stores, store openings and relocations currently in progress, information technology improvements, and improvements to the Company’s distribution center.
Net cash provided by investing activities for fiscal 2007 was $60.5 million compared to net cash used in investing activities of $52.9 million in fiscal 2006. Net cash provided by investing activities for fiscal 2007 consisted of $129.3 million in net proceeds from the sale of marketable securities offset by $68.8 million in capital expenditures. Marketable securities were sold in fiscal 2007 to fund the Company’s authorized share repurchase program.
Net cash provided by financing activities in fiscal 2008 was $9.7 million compared to net cash used in financing activities of $164.3 million in fiscal 2007. The difference in fiscal 2008 was primarily due to decreased activity under the Company’s authorized share repurchase programs. Financing activities in fiscal 2008 included $5.6 million in stock repurchases, primarily reflecting employee minimum statutory tax withholding requirements for restricted stock awards and units that vested during the period. Employees satisfy their minimum statutory tax requirements through a net settlement feature whereby restricted stock awards and units are sold on their vest date to cover tax obligations.
23
Net cash used in financing activities for fiscal 2007 was $164.3 million compared to $73.2 million in fiscal 2006. The increase in fiscal 2007 was primarily due to $174.3 million in stock repurchases in fiscal 2007.
The Company has an unsecured revolving credit facility for borrowings of up to $80 million (subject to an option to increase the borrowing limit up to $100 million). The credit facility, which expires in August 2009, may be used for the issuance of documentary and standby letters of credit, working capital, and capital expenditure needs. The interest rate for each borrowing under the facility will be, at the option of the Company, a base rate plus an additional marginal rate (a total of 3.25% as of January 31, 2009) or the Eurodollar rate plus an additional marginal rate (a total of 2.4% as of January 31, 2009). This credit facility requires the Company to meet financial covenants on a quarterly basis, limits annual capital expenditures, restricts the payment of dividends, and limits stock repurchases. As of January 31, 2009, the Company was in compliance with these covenants. As of January 31, 2009, there were no outstanding borrowings and $56.3 million of documentary and standby letters of credit were outstanding. The maximum amount of documentary and standby letters of credit outstanding during the fiscal year and as of January 31, 2009 was $77.5 million.
The Company estimates capital expenditures for fiscal 2009 will approximate $50.0 million and will be used to open approximately 75 new stores, including 25 Gymboree stores, 20 Gymboree Outlet stores, five Janie and Jack shops, 25 Crazy 8 stores, and to remodel, relocate or expand approximately 65 Gymboree stores, as well as to continue investment in the Company’s systems infrastructure, websites, and distribution center. The Company’s current plans for Gymboree, Gymboree Outlet, Janie and Jack, and Crazy 8 will require increasing capital expenditures for new stores for the next several years.
We anticipate that cash generated from operations, together with our existing cash resources and funds available from current and future credit facilities, will be sufficient to satisfy our cash needs for the next twelve months.
Summary Disclosures about Contractual Obligations and Commercial Commitments
The following table reflects a summary of our contractual obligations as of January 31, 2009:
Contractual Obligations
| | | | | | | | | | | | | | | |
($ in thousands) | | Less than
1 year | | 1-3 years | | 3-5 years | | After
5 years | | Total |
Stand-by letters of credit | | $ | 5,765 | | $ | — | | $ | — | | $ | — | | $ | 5,765 |
Operating leases (1) | | | 71,306 | | | 132,133 | | | 119,303 | | | 191,911 | | | 514,653 |
Inventory purchase obligations (2) | | | 136,757 | | | — | | | — | | | — | | | 136,757 |
Other purchase obligations (3) | | | 8,578 | | | 2,941 | | | 1,008 | | | 504 | | | 13,031 |
| | | | | | | | | | | | | | | |
Total contractual cash obligations | | $ | 222,406 | | $ | 135,074 | | $ | 120,311 | | $ | 192,415 | | $ | 670,206 |
| | | | | | | | | | | | | | | |
| (1) | Other lease-required expenses such as utilities, real estate taxes and common area repairs and maintenance are excluded. See Note 3 to the Consolidated Financial Statements for discussion of the Company’s operating leases. |
| (2) | Inventory purchase obligations include outstanding purchase orders for merchandise inventories that are enforceable and legally binding on the Company and that specify all significant terms (including fixed or minimum quantities to be purchased), fixed, minimum or variable price provisions, and the approximate timing of the transaction. |
| (3) | Other purchase obligations include commitments for information technology and professional services. |
As of January 31, 2009, the Company had unrecognized tax benefits of $6.7 million, accrued interest of $1.2 million, and accrued penalties of $0.6 million. These amounts have been excluded from the contractual
24
obligations table because a reasonably reliable estimate of the timing of future tax settlements cannot be determined.
Recently Issued Accounting Standards
In September 2006, the Financial Accounting Standards Board (“FASB”) issued Statement of Financial Accounting Standards 157, “Fair Value Measurements,” (“SFAS 157”) which established a single authoritative definition of fair value and a framework for measuring fair value and expanded disclosure of fair value measurements for both financial and non-financial assets and liabilities. In February 2008, the FASB issued FASB Staff Position No. FAS 157-2, “Effective Date of FASB Statement No. 157,” which delayed the effective date of SFAS 157 for non-financial assets and liabilities, except for certain items that are recognized or disclosed at fair value at least annually. The Company elected to partially adopt SFAS 157 as of the beginning of fiscal 2008, as permitted by FSP 157-2. The Company does not expect the adoption of the remaining provisions of SFAS 157 (delayed by FSP 157-2) to have a material impact on the Company’s consolidated financial position, results of operations, or cash flows. The Company will adopt the remaining provisions of SFAS 157 as of the beginning of fiscal 2009.
In March 2008, the FASB issued Statement of Financial Accounting Standards No. 161, “Disclosures about Derivative Instruments and Hedging Activities, an amendment of FASB Statement No. 133,” (“SFAS 161”) which requires enhanced disclosures for derivative and hedging activities. The Company will adopt SFAS 161 as of the beginning of fiscal 2009. The Company does not expect the adoption of SFAS 161 to have a material impact on its consolidated financial statements.
Impact of Inflation
The impact of inflation on results of operations has not been significant in any of the last three fiscal years.
| ITEM 7A. | QUANTITATIVE AND QUALITATIVE DISCLOSURES ABOUT MARKET RISK |
The Company enters into forward foreign exchange contracts with respect to certain purchases in United States dollars of inventory to be sold in the Company’s retail stores in Canada. The purpose of these contracts is to protect the Company’s United States dollar margins on the eventual sale of the inventory from fluctuations in the exchange rate for Canadian and United States dollars. The term of the forward exchange contracts is generally less than one year.
The table below summarizes the notional amounts and fair values of the Company’s forward foreign exchange contracts in United States dollars (in thousands except weighted-average rate data):
| | | | | | | | | | |
| | | Notional
Amount | | Fair Value
Gain (Loss) | | | Weighted
Average
Rate |
January 31, 2009 | | $ | 3,367 | | $ | (163 | ) | | $ | 0.81 |
February 2, 2008 | | $ | 4,662 | | $ | 6 | | | $ | 1.01 |
25
| ITEM 8. | FINANCIAL STATEMENTS AND SUPPLEMENTARY DATA |
INDEX TO CONSOLIDATED FINANCIAL STATEMENTS
| | |
| | | PAGE |
Report of Independent Registered Public Accounting Firm | | 27 |
| |
Consolidated Balance Sheets as of January 31, 2009 and February 2, 2008 | | 29 |
| |
Consolidated Statements of Income for the years ended January 31, 2009, February 2, 2008, and February 3, 2007 | | 30 |
| |
Consolidated Statements of Cash Flows for the years ended January 31, 2009, February 2, 2008, and February 3, 2007 | | 31 |
| |
Consolidated Statements of Stockholders’ Equity for the years ended January 31, 2009, February 2, 2008, and February 3, 2007 | | 32 |
| |
Notes to Consolidated Financial Statements | | 33 |
26
REPORT OF INDEPENDENT REGISTERED PUBLIC ACCOUNTING FIRM
To the Board of Directors and Stockholders of
The Gymboree Corporation:
We have audited the accompanying consolidated balance sheets of The Gymboree Corporation and subsidiaries (the “Company”) as of January 31, 2009 and February 2, 2008, and the related consolidated statements of income, stockholders’ equity, and cash flows for each of the three fiscal years in the period ended January 31, 2009. We also have audited the Company’s internal control over financial reporting as of January 31, 2009, based on criteria established inInternal Control — Integrated Framework issued by the Committee of Sponsoring Organizations of the Treadway Commission. The Company’s management is responsible for these consolidated financial statements, for maintaining effective internal control over financial reporting, and for its assessment of the effectiveness of internal control over financial reporting included in the accompanying “Management’s Report on Internal Control over Financial Reporting.” Our responsibility is to express an opinion on these consolidated financial statements and an opinion on the Company’s internal control over financial reporting based on our audits.
We conducted our audits in accordance with the standards of the Public Company Accounting Oversight Board (United States). Those standards require that we plan and perform the audit to obtain reasonable assurance about whether the financial statements are free of material misstatement and whether effective internal control over financial reporting was maintained in all material respects. Our audits of the financial statements included examining, on a test basis, evidence supporting the amounts and disclosures in the financial statements, assessing the accounting principles used and significant estimates made by management, and evaluating the overall financial statement presentation. Our audit of internal control over financial reporting included obtaining an understanding of internal control over financial reporting, assessing the risk that a material weakness exists, and testing and evaluating the design and operating effectiveness of internal control based on the assessed risk. Our audits also included performing such other procedures as we considered necessary in the circumstances. We believe that our audits provide a reasonable basis for our opinions.
A company’s internal control over financial reporting is a process designed by, or under the supervision of, the company’s principal executive and principal financial officers, or persons performing similar functions, and affected by the company’s board of directors, management, and other personnel to provide reasonable assurance regarding the reliability of financial reporting and the preparation of financial statements for external purposes in accordance with generally accepted accounting principles. A company’s internal control over financial reporting includes those policies and procedures that (1) pertain to the maintenance of records that, in reasonable detail, accurately and fairly reflect the transactions and dispositions of the assets of the company; (2) provide reasonable assurance that transactions are recorded as necessary to permit preparation of financial statements in accordance with generally accepted accounting principles and that receipts and expenditures of the company are being made only in accordance with authorizations of management and directors of the company; and (3) provide reasonable assurance regarding prevention or timely detection of unauthorized acquisition, use, or disposition of the company’s assets that could have a material effect on the financial statements.
Because of the inherent limitations of internal control over financial reporting, including the possibility of collusion or improper management override of controls, material misstatements due to error or fraud may not be prevented or detected on a timely basis. Also, projections of any evaluation of the effectiveness of the internal control over financial reporting to future periods are subject to the risk that the controls may become inadequate because of changes in conditions, or that the degree of compliance with the policies or procedures may deteriorate.
In our opinion, the consolidated financial statements referred to above present fairly, in all material respects, the financial position of The Gymboree Corporation and subsidiaries as of January 31, 2009 and February 2, 2008, and the results of their operations and their cash flows for each of the three fiscal years in the period ended
27
January 31, 2009, in conformity with accounting principles generally accepted in the United States of America. Also, in our opinion, the Company maintained, in all material respects, effective internal control over financial reporting as of January 31, 2009, based on the criteria established inInternal Control — Integrated Framework issued by the Committee of Sponsoring Organizations of the Treadway Commission.
As discussed in Note 6 to the consolidated financial statements, on February 4, 2007, the Company adopted Financial Accounting Standards Board Interpretation No. 48, “Accounting for Uncertainty in Income Taxes.”
/s/ DELOITTE & TOUCHE LLP
San Francisco, California
March 30, 2009
28
THE GYMBOREE CORPORATION
CONSOLIDATED BALANCE SHEETS
(In thousands, except share data)
| | | | | | | | |
| | | January 31,
2009 | | | February 2,
2008 | |
ASSETS | | | | | | | | |
Current Assets: | | | | | | | | |
Cash and cash equivalents | | $ | 140,472 | | | $ | 33,313 | |
Accounts receivable, net of allowance of $388 and $498 | | | 18,735 | | | | 12,640 | |
Merchandise inventories | | | 114,972 | | | | 119,523 | |
Prepaid expenses | | | 4,596 | | | | 12,096 | |
Deferred income taxes | | | 15,108 | | | | 11,652 | |
| | | | | | | | |
Total current assets | | | 293,883 | | | | 189,224 | |
| | | | | | | | |
Property and Equipment: | | | | | | | | |
Land and buildings | | | 15,776 | | | | 12,476 | |
Leasehold improvements | | | 213,164 | | | | 186,777 | |
Furniture, fixtures, and equipment | | | 183,775 | | | | 176,900 | |
| | | | | | | | |
| | | 412,715 | | | | 376,153 | |
Less accumulated depreciation and amortization | | | (208,488 | ) | | | (190,796 | ) |
| | | | | | | | |
| | | 204,227 | | | | 185,357 | |
Deferred Income Taxes | | | 20,850 | | | | 21,028 | |
Other Assets | | | 1,621 | | | | 1,575 | |
| | | | | | | | |
Total Assets | | $ | 520,581 | | | $ | 397,184 | |
| | | | | | | | |
LIABILITIES AND STOCKHOLDERS’ EQUITY | | | | | | | | |
Current Liabilities: | | | | | | | | |
Accounts payable | | $ | 44,400 | | | $ | 52,915 | |
Accrued liabilities | | | 69,341 | | | | 70,282 | |
Income tax payable | | | 102 | | | | 7,989 | |
| | | | | | | | |
Total current liabilities | | | 113,843 | | | | 131,186 | |
| | | | | | | | |
Long-Term Liabilities: | | | | | | | | |
Deferred rent and other liabilities | | | 67,072 | | | | 51,722 | |
Unrecognized tax benefits | | | 5,391 | | | | 5,981 | |
| | | | | | | | |
Total Liabilities | | | 186,306 | | | | 188,889 | |
| | | | | | | | |
Commitments and Contingencies (see Note 3) | | | — | | | | — | |
Stockholders’ Equity: | | | | | | | | |
Common stock, including additional paid-in capital ($.001 par value: 100,000,000 shares authorized; 29,077,446 and 28,344,205 shares issued and outstanding at January 31, 2009 and February 2, 2008, respectively) | | | 175,519 | | | | 140,012 | |
Retained earnings | | | 160,178 | | | | 67,340 | |
Accumulated other comprehensive income (loss) | | | (1,422 | ) | | | 943 | |
| | | | | | | | |
Total Stockholders’ Equity | | | 334,275 | | | | 208,295 | |
| | | | | | | | |
Total Liabilities and Stockholders’ Equity | | $ | 520,581 | | | $ | 397,184 | |
| | | | | | | | |
See Notes to Consolidated Financial Statements.
29
THE GYMBOREE CORPORATION
CONSOLIDATED STATEMENTS OF INCOME
(In thousands, except per share data)
| | | | | | | | | | | | |
| | | Year Ended | |
| | | January 31,
2009 | | | February 2,
2008 | | | February 3,
2007 | |
Net sales: | | | | | | | | | | | | |
Retail | | $ | 987,859 | | | $ | 909,410 | | | $ | 781,172 | |
Play & Music | | | 12,819 | | | | 11,404 | | | | 10,466 | |
| | | | | | | | | | | | |
Total net sales | | | 1,000,678 | | | | 920,814 | | | | 791,638 | |
Cost of goods sold, including buying and occupancy expenses | | | (524,477 | ) | | | (478,020 | ) | | | (407,180 | ) |
| | | | | | | | | | | | |
Gross profit | | | 476,201 | | | | 442,794 | | | | 384,458 | |
Selling, general and administrative expenses | | | (327,893 | ) | | | (312,549 | ) | | | (278,294 | ) |
| | | | | | | | | | | | |
Operating income | | | 148,308 | | | | 130,245 | | | | 106,164 | |
Interest income | | | 1,690 | | | | 2,609 | | | | 5,314 | |
Interest expense | | | (208 | ) | | | (179 | ) | | | (232 | ) |
Other income (expense), net | | | (151 | ) | | | 769 | | | | 1,560 | |
| | | | | | | | | | | | |
Income from continuing operations, before income tax | | | 149,639 | | | | 133,444 | | | | 112,806 | |
Income tax expense | | | (56,159 | ) | | | (53,113 | ) | | | (41,655 | ) |
| | | | | | | | | | | | |
Income from continuing operations, net of income tax | | | 93,480 | | | | 80,331 | | | | 71,151 | |
Loss from discontinued operations, net of income tax | | | — | | | | — | | | | (10,901 | ) |
| | | | | | | | | | | | |
Net income | | $ | 93,480 | | | $ | 80,331 | | | $ | 60,250 | |
| | | | | | | | | | | | |
Basic per share amounts: | | | | | | | | | | | | |
Income from continuing operations, net of income tax | | $ | 3.35 | | | $ | 2.79 | | | $ | 2.25 | |
Loss from discontinued operations, net of income tax | | | — | | | | — | | | | (0.34 | ) |
| | | | | | | | | | | | |
Net income | | $ | 3.35 | | | $ | 2.79 | | | $ | 1.90 | |
| | | | | | | | | | | | |
Diluted per share amounts: | | | | | | | | | | | | |
Income from continuing operations, net of income tax | | $ | 3.21 | | | $ | 2.67 | | | $ | 2.15 | |
Loss from discontinued operations, net of income tax | | | — | | | | — | | | | (0.33 | ) |
| | | | | | | | | | | | |
Net income | | $ | 3.21 | | | $ | 2.67 | | | $ | 1.82 | |
| | | | | | | | | | | | |
Weighted average shares outstanding: | | | | | | | | | | | | |
Basic | | | 27,919 | | | | 28,797 | | | | 31,647 | |
Diluted | | | 29,154 | | | | 30,033 | | | | 33,099 | |
See Notes to Consolidated Financial Statements.
30
THE GYMBOREE CORPORATION
CONSOLIDATED STATEMENTS OF CASH FLOWS
(In thousands)
| | | | | | | | | | | | |
| | | Year Ended | |
| | | January 31,
2009 | | | February 2,
2008 | | | February 3,
2007 | |
CASH FLOWS FROM OPERATING ACTIVITIES: | | | | | | | | | | | | |
Net income | | $ | 93,480 | | | $ | 80,331 | | | $ | 60,250 | |
Adjustments to reconcile net income to net cash provided by operating activities: | | | | | | | | | | | | |
Depreciation and amortization | | | 34,854 | | | | 31,151 | | | | 28,769 | |
Benefit for deferred income taxes | | | (3,841 | ) | | | (9,771 | ) | | | (9,548 | ) |
Share-based compensation expense | | | 19,850 | | | | 16,381 | | | | 10,619 | |
Loss on disposal of property and equipment and other | | | 448 | | | | 687 | | | | 6,818 | |
Excess tax benefits from exercise of share-based awards | | | (6,023 | ) | | | (3,330 | ) | | | (8,475 | ) |
Tax benefit from exercise of stock options | | | 6,440 | | | | 3,841 | | | | 11,577 | |
Change in assets and liabilities: | | | | | | | | | | | | |
Accounts receivable | | | (6,122 | ) | | | 424 | | | | (797 | ) |
Merchandise inventories | | | 3,895 | | | | (14,874 | ) | | | (3,622 | ) |
Prepaid expenses and other assets | | | 7,408 | | | | (1,777 | ) | | | (6,641 | ) |
Accounts payable | | | (8,113 | ) | | | (3,343 | ) | | | 10,757 | |
Income tax payable | | | (7,877 | ) | | | 2,577 | | | | 13,286 | |
Accrued liabilities | | | 5,652 | | | | 3,964 | | | | 8,403 | |
Deferred rent and other liabilities | | | 14,973 | | | | 1,606 | | | | 296 | |
| | | | | | | | | | | | |
Net cash provided by operating activities | | | 155,024 | | | | 107,867 | | | | 121,692 | |
| | | | | | | | | | | | |
CASH FLOWS FROM INVESTING ACTIVITIES: | | | | | | | | | | | | |
Proceeds from sales and maturities of marketable securities | | | 34,700 | | | | 508,978 | | | | 1,245,226 | |
Purchases of marketable securities | | | (34,700 | ) | | | (379,653 | ) | | | (1,259,551 | ) |
Capital expenditures | | | (56,184 | ) | | | (68,794 | ) | | | (38,722 | ) |
Other | | | 70 | | | | — | | | | 189 | |
| | | | | | | | | | | | |
Net cash provided by (used in) investing activities | | | (56,114 | ) | | | 60,531 | | | | (52,858 | ) |
| | | | | | | | | | | | |
CASH FLOWS FROM FINANCING ACTIVITIES: | | | | | | | | | | | | |
Proceeds from issuance of common stock | | | 9,296 | | | | 6,577 | | | | 28,301 | |
Excess tax benefits from exercise of share-based awards | | | 6,023 | | | | 3,330 | | | | 8,475 | |
Repurchases of common stock | | | (5,591 | ) | | | (174,253 | ) | | | (109,999 | ) |
| | | | | | | | | | | | |
Net cash provided by (used in) financing activities | | | 9,728 | | | | (164,346 | ) | | | (73,223 | ) |
| | | | | | | | | | | | |
Net Increase (Decrease) in Cash and Cash Equivalents | | | 108,638 | | | | 4,052 | | | | (4,389 | ) |
Effect of exchange rate fluctuations on cash | | | (1,479 | ) | | | 1,768 | | | | (155 | ) |
CASH AND CASH EQUIVALENTS: | | | | | | | | | | | | |
Beginning of Year | | | 33,313 | | | | 27,493 | | | | 32,037 | |
| | | | | | | | | | | | |
End of Year | | $ | 140,472 | | | $ | 33,313 | | | $ | 27,493 | |
| | | | | | | | | | | | |
NON-CASH INVESTING ACTIVITIES: | | | | | | | | | | | | |
Capital expenditures incurred, but not yet paid | | $ | 2,992 | | | $ | 4,340 | | | $ | 6,587 | |
OTHER CASH FLOW INFORMATION: | | | | | | | | | | | | |
Cash paid during the year for income taxes | | $ | 62,615 | | | $ | 58,573 | | | $ | 19,636 | |
Cash paid during the year for interest | | $ | 90 | | | $ | 26 | | | $ | 67 | |
See Notes to Consolidated Financial Statements.
31
THE GYMBOREE CORPORATION
CONSOLIDATED STATEMENTS OF STOCKHOLDERS’ EQUITY
FOR THE YEARS ENDED JANUARY 31, 2009, FEBRUARY 2, 2008, AND FEBRUARY 3, 2007
(Dollars in thousands)
| | | | | | | | | | | | | | | | | | | | | | | | | | | |
| | | Common Stock | | | Additional
Paid In
Capital | | | Retained
Earnings | | | Accumulated
Other
Comprehensive
Income / (Loss) | | | Total | | | Total
Comprehensive
Income | |
| | | Shares | | | Amount | | | | | | |
BALANCE AT JANUARY 28, 2006 | | 32,774,860 | | | $ | 33 | | | $ | 91,320 | | | $ | 184,599 | | | $ | (875 | ) | | $ | 275,077 | | | | | |
Issuance of common stock under equity incentive and purchase plans | | 2,272,402 | | | | 2 | | | | 28,299 | | | | | | | | | | | | 28,301 | | | | | |
Share-based compensation | | | | | | | | | | 10,619 | | | | | | | | | | | | 10,619 | | | | | |
Stock repurchases | | (3,277,654 | ) | | | (3 | ) | | | (9,244 | ) | | | (100,752 | ) | | | | | | | (109,999 | ) | | | | |
Tax benefit from exercise of stock options and windfall tax benefits | | | | | | | | | | 11,577 | | | | | | | | | | | | 11,577 | | | | | |
Translation adjustments and unrealized net loss on cash flow hedges, net of tax | | | | | | | | | | | | | | | | | | (98 | ) | | | (98 | ) | | $ | (98 | ) |
Net income | | | | | | | | | | | | | | 60,250 | | | | | | | | 60,250 | | | | 60,250 | |
| | | | | | | | | | | | | | | | | | | | | | | | | | | |
| | | | | | | | | | | | | | | | | | | | | | | | | $ | 60,152 | |
| | | | | | | | | | | | | | | | | | | | | | | | | | | |
BALANCE AT FEBRUARY 3, 2007 | | 31,769,608 | | | $ | 32 | | | $ | 132,571 | | | $ | 144,097 | | | $ | (973 | ) | | $ | 275,727 | | | | | |
Adoption of FIN 48 | | | | | | | | | | | | | | (2,325 | ) | | | | | | | (2,325 | ) | | | | |
Issuance of common stock under equity incentive and purchase plans | | 1,247,334 | | | | 1 | | | | 6,576 | | | | | | | | | | | | 6,577 | | | | | |
Share-based compensation | | | | | | | | | | 16,381 | | | | | | | | | | | | 16,381 | | | | | |
Stock repurchases | | (4,672,737 | ) | | | (5 | ) | | | (19,485 | ) | | | (154,763 | ) | | | | | | | (174,253 | ) | | | | |
Tax benefit from exercise of stock options and windfall tax benefits | | | | | | | | | | 3,941 | | | | | | | | | | | | 3,941 | | | | | |
Translation adjustments and unrealized net loss on cash flow hedges, net of tax | | | | | | | | | | | | | | | | | | 1,916 | | | | 1,916 | | | $ | 1,916 | |
Net income | | | | | | | | | | | | | | 80,331 | | | | | | | | 80,331 | | | | 80,331 | |
| | | | | | | | | | | | | | | | | | | | | | | | | | | |
| | | | | | | | | | | | | | | | | | | | | | | | | $ | 82,247 | |
| | | | | | | | | | | | | | | | | | | | | | | | | | | |
BALANCE AT FEBRUARY 2, 2008 | | 28,344,205 | | | $ | 28 | | | $ | 139,984 | | | $ | 67,340 | | | $ | 943 | | | $ | 208,295 | | | | | |
Issuance of common stock under equity incentive and purchase plans | | 751,241 | | | | 1 | | | | 9,295 | | | | | | | | | | | | 9,296 | | | | | |
Share-based compensation | | | | | | | | | | 19,850 | | | | | | | | | | | | 19,850 | | | | | |
Stock repurchases | | (18,000 | ) | | | — | | | | (81 | ) | | | (642 | ) | | | | | | | (723 | ) | | | | |
Tax benefit from exercise of stock options and windfall tax benefits | | | | | | | | | | 6,442 | | | | | | | | | | | | 6,442 | | | | | |
Translation adjustments and unrealized net loss on cash flow hedges, net of tax | | | | | | | | | | | | | | | | | | (2,365 | ) | | | (2,365 | ) | | $ | (2,365 | ) |
Net income | | | | | | | | | | | | | | 93,480 | | | | | | | | 93,480 | | | | 93,480 | |
| | | | | | | | | | | | | | | | | | | | | | | | | | | |
| | | | | | | | | | | | | | | | | | | | | | | | | $ | 91,115 | |
| | | | | | | | | | | | | | | | | | | | | | | | | | | |
BALANCE AT JANUARY 31, 2009 | | 29,077,446 | | | $ | 29 | | | $ | 175,490 | | | $ | 160,178 | | | $ | (1,422 | ) | | $ | 334,275 | | | | | |
| | | | | | | | | | | | | | | | | | | | | | | | | | | |
See Notes to Consolidated Financial Statements.
32
THE GYMBOREE CORPORATION
NOTES TO CONSOLIDATED FINANCIAL STATEMENTS
| 1. | Summary of Significant Accounting Policies |
Nature of the Business
The Gymboree Corporation is a specialty retailer operating stores selling high-quality apparel, accessories and play programs for children. As of January 31, 2009, the Company conducted its business through five primary divisions: Gymboree, Gymboree Outlet, Janie and Jack, Crazy 8, and Gymboree Play & Music. The Company operates two reportable segments, retail stores and Gymboree Play & Music (see Note 9). As of January 31, 2009, the retail segment operated a total of 886 retail stores, including 854 stores in the United States (584 Gymboree stores, 117 Gymboree Outlet stores, 115 Janie and Jack shops, and 38 Crazy 8 stores), 29 stores in Canada, 2 Gymboree stores in Puerto Rico, and 1 Gymboree Outlet store in Puerto Rico, as well as three online stores atwww.gymboree.com,www.janieandjack.com, www.crazy8.com.
Gymboree Play & Music offers an array of classes developed by early childhood experts, as well as birthday parties and developmental toys, books and music. As of January 31, 2009, Gymboree Play & Music programs were offered at seven Company-operated play centers (three in California and four in Florida) and 602 franchisee-operated play centers, of which approximately 41% are located in the United States.
Fiscal Year
The Company’s year end is on the Saturday closest to January 31. Fiscal 2008 and fiscal 2007, which included 52 weeks, ended on January 31, 2009 and February 2, 2008, respectively. Fiscal 2006, which included 53 weeks, ended on February 3, 2007.
Basis of Presentation
The consolidated financial statements include The Gymboree Corporation and its subsidiaries, all of which are wholly owned (the “Company”). All intercompany balances and transactions have been eliminated in consolidation.
Use of Estimates
The preparation of financial statements in conformity with accounting principles generally accepted in the United States requires management to make estimates and assumptions that affect the reported amounts of assets and liabilities and disclosure of contingent assets and liabilities at the date of the financial statements and the reported amount of revenues and expenses during the reporting period. Actual results could differ from those estimates.
Cost of Goods Sold
Cost of goods sold includes cost of goods, buying expenses, occupancy expenses and shipping costs. Cost of goods consists of cost of merchandise, inbound freight and other inventory-related costs such as shrink and lower of cost or market adjustments. Buying expenses include costs incurred to design and produce merchandise. Occupancy expenses consist of rent and other occupancy costs, including common area maintenance and utilities. Shipping costs consist of third-party delivery services to customers.
Selling, General and Administrative Expenses
Selling, general and administrative expenses consist of non-occupancy-related costs associated with the Company’s retail stores, distribution centers and shared corporate services. These costs include payroll and benefits, depreciation, credit card fees, advertising and other general expenses.
33
Cash and Cash Equivalents
Cash equivalents consist of highly liquid investment instruments with a maturity of three months or less at date of purchase.
Accounts Receivable
The majority of the Company’s accounts receivable are due from major credit card companies and are collected within five days. Also included in accounts receivable are amounts due from Gymboree Play & Music franchisees for royalties and consumer product sales, as well as amounts due from landlord construction allowances. Royalties are due within 30 days of each calendar quarter end and receivables from consumer product sales are generally due upon shipment. Construction allowance receivable due dates vary. The Company estimates its allowance for doubtful accounts by considering a number of factors, including the length of time accounts receivable are past due and the Company’s previous loss history. The provision for doubtful accounts receivable is included in selling, general and administrative expenses. A summary of activity in the allowance for doubtful accounts is as follows:
| | | | | | | | | | | | |
Dollars in thousands | | Fiscal 2008 | | | Fiscal 2007 | | | Fiscal 2006 | |
Balance at beginning of year | | $ | 498 | | | $ | 274 | | | $ | 322 | |
Provision for doubtful accounts receivable | | | 274 | | | | 326 | | | | 67 | |
Accounts written off | | | (384 | ) | | | (102 | ) | | | (115 | ) |
| | | | | | | | | | | | |
Balance at end of year | | $ | 388 | | | $ | 498 | | | $ | 274 | |
| | | | | | | | | | | | |
Concentrations
Financial instruments that potentially subject the Company to concentrations of credit risk consist of cash and cash equivalents. At times, cash balances held at financial institutions are in excess of federally insured limits.
In fiscal 2008, 2007, and 2006, one buying agent managed approximately 90% of the Company’s inventory purchases and may potentially subject the Company to risks of concentration related to sourcing of its inventory.
Estimated Fair Value of Financial Instruments
The carrying value of cash and cash equivalents, receivables, and payables approximates their estimated fair values due to the short maturities of these instruments.
Fair Value Measurements
SFAS 157 established a single authoritative definition of fair value and a framework for measuring fair value and expands disclosure of fair value measurements. SFAS 157 requires financial assets and liabilities to be categorized based on the inputs used to calculate their fair values as follows:
Level 1—Quoted prices in active markets for identical assets or liabilities.
Level 2—Inputs other than quoted prices included within Level 1 that are observable for the asset or liability, either directly or indirectly.
Level 3—Unobservable inputs for the asset or liability, which reflect the Company’s own assumptions about the assumptions that market participants would use in pricing the asset or liability (including assumptions about risk).
34
As of January 31, 2009, the Company’s forward foreign exchange contracts liability had an estimated fair value of $162,000. The Company had no other financial assets or liabilities measured at fair value as of January 31, 2009. Fair value was determined using the market approach and Level 2 inputs. The market approach uses prices and other relevant information generated by market transactions involving identical or comparable assets and liabilities.
Merchandise Inventories
Merchandise inventories are recorded at the lower of cost or market, determined on a weighted-average cost basis. The Company reviews its inventory levels in order to identify slow-moving merchandise and broken assortments (items no longer in stock in a sufficient range of sizes) and records a reserve when the future estimated selling price is less than cost. This reserve is based on management’s estimate of overall business conditions including stocking positions, inventory aging, historical performance and the promotional environment. The Company takes a physical count of inventories in all stores once a year (in some stores twice a year) and performs cycle counts throughout the year in its distribution centers. The Company records an inventory shrink adjustment based upon physical counts and also provides for estimated shrink adjustments for the period between the last physical inventory count and each balance sheet date. The Company’s inventory shrink estimate can be affected by changes in merchandise mix and changes in actual shrink trends. The Company’s lower of cost or market estimate can be affected by changes in consumer demand and the promotional environment.
Property and Equipment
Property and equipment are stated at cost. Depreciation is computed using the straight-line method over the estimated useful lives of the assets, which range from approximately three to 25 years, except for the Company’s distribution center in Dixon, California, which has a useful life of 39 years. Leasehold improvements, which include internal payroll costs for employees dedicated to real estate construction projects, are amortized over the lesser of the applicable lease term, which ranges from five to 13 years, or the estimated useful life of the improvements. Software costs are capitalized in accordance with Statement of Position 98-1, “Accounting for the Costs of Computer Software Developed or Obtained for Internal Use,” and are amortized using the straight-line method based on an estimated useful life of three to 7 years. Construction in progress was $4.5 million and $9.4 million as of January 31, 2009 and February 2, 2008, respectively. Repair and maintenance costs are expensed as incurred.
Asset Impairment
Long-lived assets are reviewed for impairment whenever events or changes in circumstances indicate that the carrying value of an asset may not be recoverable. If the undiscounted future cash flows from the long-lived assets are less than the carrying value, a loss is recognized equal to the difference between the carrying value and the fair value of the assets. Decisions to close a store or facility can also result in accelerated depreciation over the revised useful life. For locations to be closed, which are under long-term leases, the Company records a charge for lease buyout expense or the difference between its rent and the rate at which it expects to be able to sublease the properties and related costs, as appropriate. Most closures occur upon the lease expiration. The estimate of future cash flows is based on historical experience and typically third-party advice or market data. In fiscal 2008, the estimate of future cash flows considered the current economic downturn in future sales assumptions. However, these estimates can be affected by factors such as future store profitability, real estate demand and economic conditions that can be difficult to predict.
Asset Retirement Obligations
An asset retirement obligation represents a legal obligation associated with the retirement of a tangible long-lived asset that is incurred upon the acquisition, construction, development or normal operation of that long-lived
35
asset. The Company recognizes asset retirement obligations in the period in which they are incurred, if a reasonable estimate of fair value can be made. The asset retirement obligation is subsequently adjusted for changes in fair value. The associated estimated asset retirement costs are capitalized in other assets and depreciated over their useful life. The Company’s asset retirement obligations relate to restoration provisions in leases for retail store locations and the Company’s corporate offices and are not significant.
Income Taxes
The Company provides for income taxes in accordance with Statement of Financial Accounting Standards No. 109, “Accounting for Income Taxes” (“SFAS 109”). SFAS 109 requires the recognition of deferred tax liabilities and assets for the expected future tax consequences of temporary differences between the financial statement carrying amounts and the tax bases of assets and liabilities. The Company maintains valuation allowances when it is more likely than not that all or a portion of a deferred tax asset will not be realized. Changes in valuation allowances from period to period are included in the tax provision in the period of change. In determining whether a valuation allowance is warranted, the Company takes into account such factors as prior earnings history, expected future earnings, carryback and carryforward periods, and tax planning strategies that could potentially enhance the likelihood of realization of a deferred tax asset. The Company is subject to periodic audits by the Internal Revenue Service and other taxing authorities. These audits may challenge certain of the Company’s tax positions such as the timing and amount of deductions and allocation of taxable income to the various tax jurisdictions. Income tax contingencies are accounted for in accordance with FASB Interpretation No. 48, “Accounting for Uncertainty in Income Taxes” (“FIN 48”), and may require significant management judgment in estimating final outcomes. Actual results could materially differ from these estimates and could significantly affect the effective tax rate and cash flows in future years.
Intangible Assets
Intangible assets primarily include costs incurred to register trademarks and service marks. These assets have been assigned an indefinite life and are reviewed for impairment on an annual basis. Intangible assets approximated $1.2 million and $0.8 million as of January 31, 2009 and February 2, 2008, respectively.
Rent Expense
Many of the Company’s operating leases contain free rent periods and predetermined fixed increases of the minimum rental rate during the initial lease term. For these leases, the Company recognizes the related rental expense on a straight-line basis over the life of the lease, starting at the time the Company takes physical possession of the property. Certain leases provide for contingent rents that are not measurable at inception. These amounts are excluded from minimum rent and are included in the determination of rent expense when it is probable that an expense has been incurred and the amount is reasonably estimable.
Construction Allowance
As part of many lease agreements, the Company receives construction allowances from landlords. The construction allowances are included in deferred rent and other liabilities and are amortized as a reduction of rent expense on a straight-line basis over the term of the lease, starting at the time the Company takes physical possession of the property. Construction allowances of $9.2 million, $8.3 million and $6.0 million were granted in fiscal 2008, 2007 and 2006, respectively.
Workers’ Compensation Liabilities
The Company is partially self-insured for workers’ compensation insurance. The Company records a liability based on claims filed and an actuarially determined amount of claims incurred, but not yet reported. This liability approximated $2.3 million and $1.8 million as of January 31, 2009 and February 2, 2008, respectively.
36
Any actuarial projection of losses is subject to a high degree of variability due to external factors, including future inflation rates, litigation trends, legal interpretations, benefit level changes and claim settlement patterns. If the actual amount of claims filed exceeds our estimates, reserves recorded may not be sufficient and additional accruals may be required in future periods.
Foreign Currency Translation
Assets and liabilities of foreign subsidiaries are translated into United States dollars at the exchange rates effective on the balance sheet date. Revenues, costs of sales, expenses and other income are translated at average rates of exchange prevailing during the year. Translation adjustments resulting from this process are recorded as other comprehensive income within stockholders’ equity. Foreign currency translation adjustments related to the discontinued United Kingdom and Ireland entities have been recognized as foreign exchange losses upon substantial liquidation of those entities in fiscal 2005, and are included in losses from discontinued operations in the accompanying fiscal 2006 consolidated statement of income (see Note 2).
Store Pre-opening Costs
Store pre-opening costs are expensed as incurred.
Advertising
The Company capitalizes direct costs for certain programs that meet the deferral requirements of Statement of Position 93-7,Reporting on Advertising Costs, associated with the development, production, and circulation of direct response advertising and amortizes such costs over the expected sales realization cycle, typically four to six weeks. Deferred direct response costs, included in prepaid expenses, were $0.2 million as of January 31, 2009 and zero as of February 2, 2008.
All other advertising costs are expensed as incurred. Advertising expense, including costs related to direct mail campaigns, totaled approximately $14.3 million, $18.2 million and $12.6 million in fiscal 2008, 2007 and 2006, respectively.
Revenue Recognition
Revenue is recognized at the point of sale in retail stores. Online revenue is recorded when the Company estimates merchandise is delivered to the customer. Customers generally receive merchandise within three to five days of shipment. Sales are presented net of a sales return reserve. Shipping fees received from customers are included in net sales and the associated shipping costs are included in cost of goods sold. The Company also sells gift cards in its retail store locations, through its websites, and through third parties. Revenue is recognized in the period that the gift card is redeemed. The Company recognizes unredeemed gift card and merchandise credit balances over three years old as other income within selling, general and administrative expenses. From time to time, customers may earn Gymbucks or Rise and Shine coupons and redeem them for merchandise at a discount during the redemption period. One-half of the coupon value is earned by customers when the minimum purchase requirement is met during the earning period, and the other half is earned when the additional purchase requirement is met during the redemption period. A liability is recorded for all coupons earned, but not redeemed, within an accounting period. Net retail sales include revenue from the Company’s co-branded credit card (see Note 10). The Company presents taxes collected from customers and remitted to governmental authorities on a net basis (excluded from revenues).
For the Gymboree Play & Music operations, initial franchise and transfer fees for all sites sold in a territory are recognized as revenue when the franchisee has paid the initial franchise or transfer fee, in the form of cash and/or a note payable, the franchisee has fully executed a franchise agreement and the Company has substantially completed its obligations under such agreement. The Company receives royalties based on each franchisee’s
37
gross receipts from operations. Such royalty fees are recorded when earned. The Company also recognizes revenues from consumer products and equipment sold to franchisees at the time title transfers to the franchisees.
A summary of activity in the sales return reserves is as follows:
| | | | | | | | | | | | |
Dollars in thousands | | Fiscal 2008 | | | Fiscal 2007 | | | Fiscal 2006 | |
Balance at beginning of year | | $ | 1,746 | | | $ | 1,754 | | | $ | 1,534 | |
Provision for sales returns | | | 29,455 | | | | 22,444 | | | | 19,274 | |
Actual sales returns | | | (27,999 | ) | | | (22,452 | ) | | | (19,054 | ) |
| | | | | | | | | | | | |
Balance at end of year | | $ | 3,202 | | | $ | 1,746 | | | $ | 1,754 | |
| | | | | | | | | | | | |
Comprehensive Income
Comprehensive income consists of net income, foreign currency translation adjustments and fluctuations in the fair market value of certain derivative financial instruments and is shown in the consolidated statements of stockholders’ equity.
Derivative Instruments
SFAS No. 133, “Accounting for Derivative Instruments and Hedging Activities,” (“SFAS 133”), as amended, requires that each derivative instrument be recorded on the balance sheet as either an asset or liability and measured at its fair value. SFAS 133 also requires that changes in the derivative’s fair value be recognized in earnings or accumulated other comprehensive income, depending on whether the derivative qualifies for hedge accounting treatment. The Company enters into forward foreign exchange contracts with respect to certain purchases in United States dollars of inventory to be sold in the Company’s retail stores in Canada. The purpose of these contracts is to protect the Company’s United States dollar margins on the eventual sale of the inventory from fluctuations in the exchange rate for Canadian and United States dollars. The term of the forward exchange contracts is generally less than one year. Accumulated other comprehensive income (loss) includes approximately $145,000 in unrealized gains and $141,000 in unrealized losses related to hedging activity as of January 31, 2009 and February 2, 2008, respectively. Amounts recognized in other comprehensive income are amortized to cost of sales over a three-month period.
Income Per Share
Basic income per share is calculated by dividing net income for the year by the number of weighted-average common shares outstanding for the year. Diluted income per share includes the effects of dilutive instruments, such as stock options and restricted stock, and uses the average share price for the period in determining the number of incremental shares that are to be added to the weighted-average number of shares outstanding.
The following table summarizes the incremental shares from potentially dilutive securities, calculated using the treasury stock method:
| | | | | | |
| | | Year Ended |
| | | January 31,
2009 | | February 2,
2008 | | February 3,
2007 |
| | | (In thousands) |
Shares used to compute basic EPS | | 27,919 | | 28,797 | | 31,647 |
Add: effect of dilutive securities | | 1,235 | | 1,236 | | 1,452 |
| | | | | | |
Shares used to compute diluted EPS | | 29,154 | | 30,033 | | 33,099 |
| | | | | | |
Share-based awards excluded from the computation of weighted-average shares due to their anti-dilutive effect totaled 73,412, 13,579, and 29,954 in fiscal 2008, 2007 and 2006, respectively.
38
Share-Based Compensation
Effective January 29, 2006, the Company adopted SFAS 123(R) using the modified prospective transition method. Under this transition method, compensation cost for (1) all share-based payments granted prior to, but not vested as of January 28, 2006, is based on the grant date fair value estimated in accordance with the original pro forma footnote disclosure provisions of SFAS 123, and (2) all share-based payments granted subsequent to January 28, 2006, is based on the grant date fair value estimated in accordance with the provisions of SFAS 123(R). The Company recognizes compensation expense on a straight-line basis for options and awards with time-based service conditions, and on an accelerated basis for awards with performance conditions (see Note 7).
Recently Issued Accounting Standards
In September 2006, the Financial Accounting Standards Board (“FASB”) issued Statement of Financial Accounting Standards No. 157, “Fair Value Measurements,” (“SFAS 157”) which established a single authoritative definition of fair value and a framework for measuring fair value and expanded disclosure of fair value measurements for both financial and non-financial assets and liabilities. In February 2008, the FASB issued FASB Staff Position No. FAS 157-2, “Effective Date of FASB Statement No. 157,” which delayed the effective date of SFAS 157 for non-financial assets and liabilities, except for certain items that are recognized or disclosed at fair value at least annually. The Company elected to partially adopt SFAS 157 as of the beginning of fiscal 2008, as permitted by FSP 157-2. The Company does not expect the adoption of the remaining provisions of SFAS 157 (delayed by FSP 157-2) to have a material impact on the Company’s consolidated financial position, results of operations, or cash flows. The Company will adopt the remaining provisions of SFAS 157 as of the beginning of fiscal 2009.
In March 2008, the FASB issued Statement of Financial Accounting Standards No. 161, “Disclosures about Derivative Instruments and Hedging Activities, an amendment of FASB Statement No. 133,” (“SFAS 161”) which requires enhanced disclosures for derivative and hedging activities. The Company will adopt SFAS 161 as of the beginning of fiscal 2009. The Company does not expect the adoption of SFAS 161 to have a material impact on its consolidated financial statements.
| 2. | Discontinued Operations |
On October 4, 2006, the Board of Directors authorized the Company to proceed with the closure of its Janeville division (17 stores) as a result of the division’s inability to achieve the level of financial performance expected by management and the desire to focus existing resources on other opportunities. All Janeville stores closed in the fourth quarter of fiscal 2006. The Company closed its Gymboree operations in the United Kingdom and Ireland (collectively, “Europe operations”) in fiscal 2004. The results of the Europe and Janeville operations have been presented as discontinued operations in the accompanying financial statements for fiscal year 2006. Results of the Europe and Janeville operations in fiscal 2007 and fiscal 2008 are insignificant and are included in continuing operations.
Results from discontinued operations, net of income tax, were as follows:
| | | | | | | | | | | | |
| | | Year Ended February 3, 2007 | |
| | | Janeville | | | Europe | | | Total | |
| | | (In thousands) | |
Net retail sales | | $ | 13,069 | | | $ | — | | | $ | 13,069 | |
| | | | | | | | | | | | |
Income (loss) from discontinued operations | | $ | (17,538 | ) | | $ | 132 | | | $ | (17,406 | ) |
Income tax benefit (expense) | | | 6,792 | | | | (287 | ) | | | 6,505 | |
| | | | | | | | | | | | |
Loss from discontinued operations, net of income tax | | $ | (10,746 | ) | | $ | (155 | ) | | $ | (10,901 | ) |
| | | | | | | | | | | | |
39
Losses for the Janeville division in fiscal 2006 included operating losses, as well as approximately $6.8 million for asset impairment, $4.8 million for lease disposition costs, $0.8 million for the cancellation of certain purchase commitments, and $0.3 million for employee severance.
| 3. | Commitments and Contingencies |
The Company leases its retail store locations, corporate headquarters, and certain fixtures and equipment under operating leases. The leases expire at various dates through fiscal 2021. Store leases typically have 10-year terms and include a cancellation clause if minimum revenue levels are not achieved during a specified 12-month period during the lease term. Some leases are structured with a minimum rent component plus a percentage rent based on the store’s net sales in excess of a certain threshold. Substantially all of the leases require the Company to pay insurance, utilities, real estate taxes, and common area repair and maintenance expenses.
Future minimum rental payments under non-cancelable operating leases at January 31, 2009 are as follows:
| | | |
Fiscal | | (In thousands) |
2009 | | $ | 71,306 |
2010 | | | 66,956 |
2011 | | | 65,177 |
2012 | | | 61,922 |
2013 | | | 57,381 |
Later years | | | 191,911 |
| | | |
Total | | $ | 514,653 |
| | | |
Rent expense for all operating leases totaled $101.3 million, $87.3 million and $75.5 million in fiscal 2008, 2007 and 2006, respectively, which includes common area maintenance expenses, real estate taxes, utilities, percentage rent expense and other lease required expenses of $35.8 million, $31.4 million and $27.1 million for fiscal 2008, 2007 and 2006, respectively. Percentage rent expense was approximately $0.8 million in each of fiscal 2008, 2007 and 2006.
The Company is subject to various legal proceedings and claims arising in the ordinary course of business. Management does not expect that the results in any of these legal proceedings, either individually or in the aggregate, will have a material adverse effect on the Company’s financial position, results of operations or cash flows.
The Company has an unsecured revolving credit facility for borrowings of up to $80 million (subject to an option to increase the borrowing limit up to $100 million). The credit facility, which expires in August 2009, may be used for the issuance of documentary and standby letters of credit, working capital and capital expenditure needs. The interest rate for each borrowing under the facility will be, at the option of the Company, a base rate plus an additional marginal rate (a total of 3.25% as of January 31, 2009) or the Eurodollar rate plus an additional marginal rate (a total of 2.4% as of January 31, 2009). This credit facility requires the Company to meet financial covenants on a quarterly basis, limits annual capital expenditures, restricts the payment of dividends, and limits stock repurchases. As of January 31, 2009, the Company was in compliance with these covenants. As of January 31, 2009, there were no outstanding borrowings and $56.3 million of documentary and standby letters of credit were outstanding. The maximum amount of documentary and standby letters of credit outstanding during the fiscal year was $77.5 million.
Total interest expense charged to operations during each of fiscal 2008, 2007 and 2006 was approximately $0.2 million.
40
Accrued liabilities consist of the following:
| | | | | | |
| | | January 31,
2009 | | February 2,
2008 |
| | | (In thousands) |
Store operating expenses and other | | $ | 23,811 | | $ | 25,061 |
Employee compensation | | | 20,611 | | | 20,168 |
Gift card liabilities and merchandise credits | | | 17,233 | | | 17,378 |
Deferred revenue primarily related to Gymboree Visa program | | | 5,494 | | | 5,683 |
Sales taxes | | | 2,192 | | | 1,992 |
| | | | | | |
Total | | $ | 69,341 | | $ | 70,282 |
| | | | | | |
The provision for income taxes consists of the following:
| | | | | | | | | | | | |
| | | 2008 | | | 2007 | | | 2006 | |
| | | (In thousands) | |
Current: | | | | | | | | | | | | |
Federal | | $ | 50,836 | | | $ | 52,844 | | | $ | 41,990 | |
State | | | 7,620 | | | | 7,570 | | | | 7,422 | |
Foreign | | | 1,735 | | | | 2,905 | | | | 1,766 | |
| | | | | | | | | | | | |
Total current | | | 60,191 | | | | 63,319 | | | | 51,178 | |
| | | | | | | | | | | | |
Deferred: | | | | | | | | | | | | |
Federal | | | (3,001 | ) | | | (10,777 | ) | | | (3,861 | ) |
State | | | 224 | | | | (45 | ) | | | (4,935 | ) |
Foreign | | | (1,255 | ) | | | 616 | | | | (727 | ) |
| | | | | | | | | | | | |
Total deferred | | | (4,032 | ) | | | (10,206 | ) | | | (9,523 | ) |
| | | | | | | | | | | | |
Total provision | | $ | 56,159 | | | $ | 53,113 | | | $ | 41,655 | |
| | | | | | | | | | | | |
Total provision: | | | | | | | | | | | | |
Continuing operations | | $ | 56,159 | | | $ | 53,113 | | | $ | 41,655 | |
Discontinued operations | | | — | | | | — | | | | (6,505 | ) |
| | | | | | | | | | | | |
| | $ | 56,159 | | | $ | 53,113 | | | $ | 35,150 | |
| | | | | | | | | | | | |
A reconciliation of the statutory federal income tax rate with the Company’s effective income tax rate for continuing operations is as follows:
| | | | | | | | | |
| | | 2008 | | | 2007 | | | 2006 | |
Statutory federal rate | | 35.0 | % | | 35.0 | % | | 35.0 | % |
State income taxes, net of income tax benefit | | 3.7 | | | 4.5 | | | 4.2 | |
Increase (decrease) in valuation allowances | | 0.7 | | | (0.2 | ) | | (3.2 | ) |
Other | | (1.9 | ) | | 0.5 | | | 0.9 | |
| | | | | | | | | |
Effective tax rate | | 37.5 | % | | 39.8 | % | | 36.9 | % |
| | | | | | | | | |
The amount of pre-tax income attributable to foreign operations for fiscal 2008, 2007 and 2006 was $14.1 million, $12.0 million and $10.0 million, respectively.
41
Temporary differences and carryforwards, which give rise to deferred tax assets and liabilities, are as follows:
| | | | | | | | |
| | | January 31,
2009 | | | February 2,
2008 | |
| | | (In thousands) | |
Deferred tax assets: | | | | | | | | |
Inventory valuation / bad debt | | $ | 4,058 | | | $ | 4,644 | |
Deferred revenue | | | 14,276 | | | | 10,816 | |
Accrued reserves | | | 17,408 | | | | 12,198 | |
Deferred rent | | | 7,039 | | | | 6,850 | |
State net operating loss carryforwards | | | 1,203 | | | | 2,070 | |
Foreign tax credits | | | 1,928 | | | | — | |
Other | | | 2,964 | | | | 2,520 | |
| | | | | | | | |
| | | 48,876 | | | | 39,098 | |
| | | | | | | | |
Deferred tax liabilities: | | | | | | | | |
Prepaid expenses | | | (1,810 | ) | | | (1,632 | ) |
State taxes | | | (2,803 | ) | | | (1,158 | ) |
Fixed asset basis differences | | | (7,054 | ) | | | (1,516 | ) |
Other | | | — | | | | (1,923 | ) |
| | | | | | | | |
| | | (11,667 | ) | | | (6,229 | ) |
| | | | | | | | |
Total | | | 37,209 | | | | 32,869 | |
Valuation allowance | | | (1,251 | ) | | | (189 | ) |
| | | | | | | | |
Net deferred tax assets | | $ | 35,958 | | | $ | 32,680 | |
| | | | | | | | |
As of January 31, 2009, the Company has state net operating loss carryforwards of approximately $29.3 million for tax purposes. These net operating loss carryforwards will expire between 2009 and 2024. As of January 31, 2009, the Company has foreign tax credit carryforwards of approximately $1.9 million for tax purposes. These credit carryforwards will expire between 2015 and 2018. Using its best estimates, the Company has recorded a valuation allowance of $1.3 million on its deferred tax assets for foreign tax credits as it is more likely than not that they will not be realized. The utilization of such net operating losses and foreign tax credits may be subject to a substantial annual limitation due to any future “changes in ownership” as defined by Section 382 of the Internal Revenue Code of 1986, as amended, and similar state provisions. Should the Company become subject to this annual limitation, the net operating loss and foreign tax credit carryforwards may expire before utilization.
The adoption of FIN 48 as of February 4, 2007 (the first day of fiscal 2007) resulted in the recognition of a $2.3 million decrease to retained earnings in fiscal 2007. The Company had unrecognized tax benefits of $6.7 and $6.9 million as of January 31, 2009 and February 2, 2008, respectively. A reconciliation of the beginning and ending amount of unrecognized tax benefits follows (in thousands):
| | | | | | | | |
| | | January 31, | | | February 2, | |
| | | 2009 | | | 2008 | |
| | | (In thousands) | |
Balance at beginning of year | | $ | 6,874 | | | $ | 6,946 | |
Gross increases—tax positions in current period | | | 1,404 | | | | 1,224 | |
Gross increases—tax positions in prior period | | | 813 | | | | 570 | |
Gross decreases—tax positions in prior period | | | (937 | ) | | | (241 | ) |
Settlements | | | (904 | ) | | | (1,752 | ) |
Lapsed statutes of limitations | | | (228 | ) | | | (138 | ) |
(Decreases) Increases based on currency translation adjustments | | | (355 | ) | | | 265 | |
| | | | | | | | |
Balance at end of year | | $ | 6,667 | | | $ | 6,874 | |
| | | | | | | | |
42
At January 31, 2009 and February 2, 2008, $4.6 million and $4.7 million, respectively, of unrecognized tax benefits would affect the effective tax rate if recognized. Additionally, at January 31, 2009 and February 2, 2008, $2.1 million and $2.2 million, respectively, of unrecognized tax benefits would result in adjustments to other tax accounts, primarily deferred taxes, if recognized.
The Company recognizes interest and penalties on income taxes in income tax expense. Income tax expense included a benefit of $142,000 and $147,000 in fiscal 2008 and fiscal 2007, respectively, related to interest expense on income taxes and included a benefit of $157,000 and $324,000 in fiscal 2008 and fiscal 2007, respectively, related to penalties on income taxes. As of January 31, 2009, the Company had a liability for interest on income taxes of $1.2 million and a liability for penalties on income taxes of $613,000. As of February 2, 2008, the Company had a liability for interest on income taxes of $1.6 million and a liability for penalties on income taxes of $475,000.
The Company does not anticipate that total unrecognized tax benefits will significantly change prior to the end of fiscal 2009.
The Company and its domestic subsidiaries file income tax returns with federal, state and local tax authorities within the United States. The Company’s foreign affiliates file income tax returns in various foreign jurisdictions, the most significant of which is Canada. With few exceptions, the Company is no longer subject to United States federal, state, or local examinations by tax authorities for tax years before 2005 and is no longer subject to foreign examinations by tax authorities for tax years before 2003.
Stock Plans
Share-based compensation expense is included as a component of selling, general and administrative expenses and consists of the following:
| | | | | | | | | |
| | | Year Ended |
| | | January 31,
2009 | | February 2,
2008 | | February 3,
2007 |
| | | (in millions) |
Stock options | | $ | 1.6 | | $ | 2.6 | | $ | 7.0 |
Restricted stock awards and units | | | 17.9 | | | 13.4 | | | 3.3 |
Employee stock purchase plan | | | 0.4 | | | 0.4 | | | 0.3 |
| | | | | | | | | |
Total | | $ | 19.9 | | $ | 16.4 | | $ | 10.6 |
| | | | | | | | | |
Share-based compensation expense for fiscal 2006 included a charge of $2.2 million related to the retirement of the Company’s former Chairman and Chief Creative Officer (see Note 11).
In the fourth quarter of fiscal 2007, the Company identified an error in its accounting for restricted stock awards with performance conditions that were granted earlier in fiscal 2007. As a result, an adjustment of approximately $3.2 million to increase selling, general and administrative expense was recorded to correct the amortization method the Company used to recognize compensation expense for such restricted stock awards. Performance-based restricted stock awards are required to be amortized on an accelerated basis (treating each vesting tranche of a performance award as a separate award with its own requisite service period) compared to the straight-line method the Company had used during the first three quarters of fiscal 2007. The Company recorded this adjustment in the fourth quarter of fiscal 2007 as the amounts were not material to the results of any prior quarter of fiscal 2007.
The Company recognized an income tax benefit related to share-based compensation expense of approximately $10.8 million (of which $6.4 million affected stockholders’ equity and $4.4 million affected net
43
income), $6.0 million (of which $3.8 million affected stockholders’ equity and $2.2 million affected net income), and $13.0 million (of which $11.6 million affected stockholders’ equity and $1.4 million affected income) for fiscal 2008, 2007, and 2006, respectively (including approximately $0.8 million in fiscal 2006 related to the retirement of the Company’s former Chairman and Chief Creative Officer as discussed in Note 11).
SFAS 123(R) requires the benefits of tax deductions in excess of the compensation cost recognized for those awards (excess tax benefits) to be classified as financing cash flows. For fiscal 2008, 2007, and 2006, the Company reported $6.0 million, $3.3 million, and $8.5 million, respectively, in excess tax benefits as financing cash inflows.
Equity Incentive Plan
The Company’s 2004 Equity Incentive Plan (the “2004 Plan”), provides for grants to employees of incentive stock options within the meaning of Section 422 of the Internal Revenue Code, for grants of non-statutory stock options to employees, consultants and non-employee directors of the Company, and for grants of other types of equity incentive compensation, such as restricted stock and restricted stock units. There are 4,630,322 shares of common stock currently reserved for issuance under the 2004 Plan. There were 1,035,907 shares available for the grant of awards under the 2004 Plan at January 31, 2009. The Company’s policy is to issue new shares for restricted stock awards, upon exercise of stock options, on payment of restricted stock units, and for purchases under the 1993 Employee Stock Purchase Plan (“Purchase Plan”).
Stock Options
The following table summarizes stock option activity during fiscal 2008, 2007, and 2006:
| | | | | | | | | | | |
| | | Number of
shares
(in thousands) | | | Weighted
average exercise
price per share | | Weighted
average
remaining
contractual life
(in years) | | Aggregate
intrinsic value |
Outstanding at January 28, 2006 | | 3,871 | | | $ | 14.51 | | | | | |
Granted | | 21 | | | | 23.45 | | | | | |
Exercised | | (1,848 | ) | | | 14.92 | | | | | |
Forfeited | | (220 | ) | | | 14.17 | | | | | |
Expired | | (24 | ) | | | 22.15 | | | | | |
| | | | | | | | | | | |
Outstanding at February 3, 2007 | | 1,800 | | | $ | 14.13 | | | | | |
Exercised | | (359 | ) | | | 15.09 | | | | | |
Forfeited | | (69 | ) | | | 14.13 | | | | | |
Expired | | (3 | ) | | | 10.32 | | | | | |
| | | | | | | | | | | |
Outstanding at February 2, 2008 | | 1,369 | | | $ | 13.89 | | | | | |
Exercised | | (567 | ) | | | 14.29 | | | | | |
Forfeited | | (10 | ) | | | 15.01 | | | | | |
Expired | | (3 | ) | | | 14.80 | | | | | |
| | | | | | | | | | | |
Outstanding at January 31, 2009 | | 789 | | | $ | 13.57 | | 5.5 | | $ | 8,624,648 |
| | | | | | | | | | | |
Vested and Expected to Vest at January 31, 2009 (1) | | 787 | | | $ | 13.56 | | 5.5 | | $ | 8,610,366 |
| | | | | | | | | | | |
Exercisable at January 31, 2009 | | 734 | | | $ | 13.39 | | 5.4 | | $ | 8,154,413 |
| | | | | | | | | | | |
| (1) | The expected to vest options are the result of applying the pre-vesting forfeiture rate assumptions to total unvested options outstanding. |
44
Options granted pursuant to the 2004 Plan have been granted at exercise prices equal to the fair market value of common stock on the date of grant. The options each have a term of ten years and generally vest over a four-year period.
The fair value of option grants issued under equity incentive plans are estimated on the date of grant using the Black-Scholes option valuation model. For purposes of this model, no dividends have been assumed. Expected stock price volatilities are estimated based on the Company’s historical volatility. The risk-free interest rates are based on United States Treasury yields in effect at the time of the grant for notes with comparable terms as the awards. The expected terms of options granted are based on analyses of historical employee termination rates and option exercises, giving consideration to expectations of future employee behavior. Assumptions used in the Black-Scholes valuation model are presented below:
| | | |
| | | Year Ended
February 3,
2007 | |
Expected dividend rate | | 0.0 | % |
Expected volatility | | 42.3 | % |
Risk-free interest rate | | 4.6 | % |
Expected lives (years) | | 4.1 | |
The weighted-average fair value per share of options granted during fiscal 2006 was $9.26. The total intrinsic value of options exercised during fiscal 2008, 2007, and 2006 was $16.2 million, $8.6 million, and $33.0 million, respectively.
As of January 31, 2009, there was $0.3 million of total unrecognized compensation cost, before income taxes, related to nonvested stock options, that is expected to be recognized over a weighted-average period of 0.5 years.
The following table summarizes information about stock options outstanding at January 31, 2009:
| | | | | | | | | | | | | | | |
| Options Outstanding | | Options Exercisable |
| Range of Exercise Prices | | Number
of Shares | | Weighted
Average
Remaining
Contractual
Term (Years) | | Weighted
Average
Exercise
Price | | Number
Exercisable
1/31/2009 | | Weighted
Average
Exercise
Price |
| $ | 2.81 | | $11.57 | | 63,341 | | 2.7 | | $ | 7.30 | | 60,926 | | $ | 7.14 |
| | 11.66 | | 11.66 | | 144,740 | | 5.7 | | | 11.66 | | 144,740 | | | 11.66 |
| | 11.77 | | 12.13 | | 60,104 | | 6.0 | | | 12.00 | | 56,878 | | | 12.00 |
| | 12.24 | | 12.24 | | 87,847 | | 6.1 | | | 12.24 | | 79,473 | | | 12.24 |
| | 12.39 | | 12.85 | | 79,358 | | 6.0 | | | 12.65 | | 78,170 | | | 12.65 |
| | 12.88 | | 15.21 | | 86,939 | | 5.7 | | | 13.87 | | 81,959 | | | 13.88 |
| | 15.31 | | 15.81 | | 83,935 | | 5.0 | | | 15.72 | | 82,664 | | | 15.72 |
| | 15.88 | | 17.01 | | 79,018 | | 6.4 | | | 16.86 | | 53,399 | | | 16.82 |
| | 17.02 | | 18.50 | | 87,380 | | 5.2 | | | 17.49 | | 85,902 | | | 17.49 |
| | 19.45 | | 25.05 | | 16,392 | | 7.0 | | | 22.74 | | 9,558 | | | 22.75 |
| | | | | | | | | | | | | | | |
| $ | 2.81 | | to $25.05 | | 789,054 | | 5.5 | | $ | 13.57 | | 733,669 | | $ | 13.39 |
| | | | | | | | | | | | | | | |
Restricted Stock and Restricted Stock Units
Shares of restricted stock have the same voting rights as other common stock and are issued and outstanding shares. Restricted stock units do not have voting rights, and the underlying shares are not considered to be issued and outstanding until vested. Restricted stock awards and restricted stock units generally vest over a four-year period. The fair values of restricted stock awards and restricted stock units are based on the fair value of the Company’s common stock on the date of grant.
45
Restricted stock award activity during fiscal 2008, 2007, and 2006 is summarized as follows:
| | | | | | |
| | | Restricted Stock Awards |
| | | Number of shares
(in thousands) | | | Weighted average grant
date fair value per
share |
Nonvested at January 29, 2006 | | 100 | | | $ | 12.90 |
Granted | | 391 | | | | 22.41 |
Vested | | (25 | ) | | | 12.60 |
| | | | | | |
Nonvested at February 3, 2007 | | 466 | | | | 20.90 |
Granted | | 801 | | | | 36.89 |
Vested | | (138 | ) | | | 20.02 |
| | | | | | |
Nonvested at February 2, 2008 | | 1,129 | | | | 32.35 |
Granted | | 393 | | | | 41.56 |
Vested | | (229 | ) | | | 29.43 |
Forfeited | | (329 | ) | | | 36.89 |
| | | | | | |
Nonvested at January 31, 2009 | | 964 | | | $ | 35.27 |
| | | | | | |
Restricted stock granted in fiscal 2007 included 790,000 shares subject to performance-based vesting conditions. Grantees forfeited and the Company cancelled 329,167 of these shares in March 2008, as the related performance targets were not met.
Restricted stock granted in fiscal 2008 included 380,000 shares subject to performance-based vesting conditions for fiscal 2008, which will determine the total number of restricted stock awards that could ultimately vest over four years. The satisfaction of the performance conditions will be finally determined during the first quarter of fiscal 2009 based on fiscal 2008 results and in accordance with the agreements with recipients.
As of January 31, 2009, there was $13.9 million of unrecognized compensation cost, before income taxes, related to nonvested restricted stock awards, which is expected to be recognized over a weighted-average period of 1.3 years.
The following table summarizes restricted stock unit activity during fiscal 2008, 2007, and 2006:
| | | | | | |
| | | Restricted Stock Units |
| | | Number of shares
(in thousands) | | | Weighted average grant
date fair value per
share |
Nonvested at January 28, 2006 | | — | | | $ | — |
Granted | | 200 | | | | 24.65 |
Forfeited | | (9 | ) | | | 27.19 |
| | | | | | |
Nonvested at February 3, 2007 | | 191 | | | | 24.53 |
Granted | | 115 | | | | 40.16 |
Vested | | (47 | ) | | | 37.73 |
Forfeited | | (22 | ) | | | 35.38 |
| | | | | | |
Nonvested at February 2, 2008 | | 237 | | | | 28.49 |
Granted | | 148 | | | | 39.73 |
Vested | | (70 | ) | | | 30.85 |
Forfeited | | (28 | ) | | | 34.38 |
| | | | | | |
Nonvested at January 31, 2009 | | 287 | | | $ | 33.14 |
| | | | | | |
46
As of January 31, 2009, there was $5.1 million of unrecognized compensation cost, before income taxes, related to nonvested restricted stock units, which is expected to be recognized over a weighted-average period of 2.1 years.
1993 Employee Stock Purchase Plan
We have reserved a total of 1,175,278 shares of common stock for issuance under the 1993 Employee Stock Purchase Plan (the “Purchase Plan”). The price at which stock is purchased under the Purchase Plan is equal to 85% of the fair market value of the common stock on the first day of the applicable offering period or the last day of the applicable purchase period, whichever is lower. There were 50,461, 39,636 and 34,105 shares issued under the Purchase Plan in fiscal 2008, 2007 and 2006, respectively. As of January 31, 2009, there was no unrecognized compensation cost related to the Purchase Plan. The Purchase Plan was suspended effective January 1, 2009.
The fair values of rights to purchase shares under the Purchase Plan are estimated on the date of grant using the Black-Scholes option valuation model. For purposes of this model, no dividends have been assumed. Expected stock price volatilities are estimated based on the Company’s historical volatility. The risk-free interest rates are based on United States Treasury yields in effect at the time of the grant for notes with comparable terms as the awards. The expected terms of rights to purchase shares under the Purchase Plan are based on the length of the purchase period. Assumptions used in the Black-Scholes valuation model are presented below:
| | | | | | | | | |
| | | Year Ended | |
| | | January 31, | | | February 2, | | | February 3, | |
| | | 2009 | | | 2008 | | | 2007 | |
Expected dividend rate | | 0.0 | % | | 0.0 | % | | 0.0 | % |
Expected volatility | | 51.4 | % | | 46.2 | % | | 42.3 | % |
Risk-free interest rate | | 2.8 | % | | 4.0 | % | | 4.8 | % |
Expected lives (years) | | 0.50 | | | 0.50 | | | 0.67 | |
The Company maintains a voluntary defined contribution 401(k) profit-sharing plan (the “Plan”) covering employees who have met certain service and eligibility requirements. Employees may elect to contribute up to 100% of their compensation to the Plan, not to exceed the dollar limit set by law. The Company contributes $1.00 to the Plan for each $1.00 contributed by an employee, up to 4% of the employee’s salary. The Plan permits employees to invest in the Company’s common stock with a limitation of 20% of their total investment. There are restrictions for certain employees trading Company stock. Matching contributions to the Plan totaled approximately $2.3 million, $2.3 million and $2.2 million in fiscal 2008, 2007 and 2006, respectively. The matching contributions were suspended effective March 1, 2009.
The Company has two reportable segments: retail stores and Gymboree Play & Music. These segments were identified based on differences in products and services. The retail stores segment includes four operating segments (brands) which sell high-quality apparel: Gymboree (including an online store), Gymboree Outlet, Janie and Jack (including an online store), and Crazy 8 (including an online store). In accordance with the aggregation criteria of SFAS No. 131, these four operating segments have been aggregated into one reportable segment because, in the Company’s judgment, these operating segments have similar historical economic characteristics and/or are expected to have similar economic characteristics and similar long-term financial performance in the future. Gross margin is the principal measure the Company considers in determining whether the economic characteristics are similar. In addition, each operating segment has similar products, production processes, type or class of customer, and methods of distribution. The Company believes that disaggregating its
47
operating segments would not provide material additional information. Corporate overhead (costs related to the Company’s distribution centers and shared corporate services) is included in the retail stores segment.
The following table provides the summary financial data of each reportable segment excluding discontinued operations (in thousands):
| | | | | | | | | |
| | | Year ended January 31, 2009 |
| | | Retail
Stores | | Play & Music | | Total |
Net sales | | $ | 987,859 | | $ | 12,819 | | $ | 1,000,678 |
Operating income | | | 143,390 | | | 4,918 | | | 148,308 |
Total assets | | | 516,077 | | | 4,504 | | | 520,581 |
| |
| | | Year ended February 2, 2008 |
| | | Retail
Stores | | Play & Music | | Total |
Net sales | | $ | 909,410 | | $ | 11,404 | | $ | 920,814 |
Operating income | | | 126,743 | | | 3,502 | | | 130,245 |
Total assets | | | 391,642 | | | 5,542 | | | 397,184 |
| |
| | | Year ended February 3, 2007 |
| | | Retail
Stores | | Play & Music | | Total |
Net sales | | $ | 781,172 | | $ | 10,466 | | $ | 791,638 |
Operating income | | | 103,285 | | | 2,879 | | | 106,164 |
Total assets | | | 450,208 | | | 3,874 | | | 454,082 |
Depreciation and amortization expense and capital expenditures have not been separately disclosed above as the amounts primarily relate to the retail segment.
The Company attributes revenues to individual countries based on selling location. Net retail sales from our Canadian subsidiary amounted to $40.4 million, $41.3 million and $33.0 million in fiscal 2008, 2007, and 2006, respectively. Long-lived assets held by our Canadian subsidiary amounted to $2.6 million and $3.1 million as of January 31, 2009 and February 2, 2008, respectively.
| 10. | Co-Branded Credit Card |
The Company has co-branded credit card agreements (the “Agreements”) with a third-party bank (the “Bank”) and Visa U.S.A. Inc. for the issuance of a Visa credit card bearing the Gymboree brand and administration of an associated incentive program for cardholders. These agreements expire in April 2009 and are currently being renegotiated. The Company recognizes revenues related to the Agreements as follows:
| | • | | New account fees are recognized as retail revenues on a straight-line basis over the estimated life of the credit card relationship. |
| | • | | Credit card usage fees are recognized as retail revenues as actual credit card usage occurs. |
| | • | | Minimum guaranteed annual payments, which exceed amounts earned based on the number of accounts opened and card usage, are recognized as retail revenues on a straight-line basis over the estimated life of the credit card relationship. |
| | • | | Rewards earned are recorded as gift card liabilities and recognized as retail revenues when the gift cards are redeemed. |
48
During fiscal 2008, fiscal 2007, and fiscal 2006, the Company recognized approximately $9.1 million, $8.6 million, and $5.6 million in usage fees, respectively. These fees are included in net retail sales in the accompanying consolidated statements of income. As of January 31, 2009 and February 2, 2008, $5.1 million and $5.1 million in current deferred revenue, and $0.5 million and $0.4 million in gift card liabilities, respectively, are included in accrued liabilities in the accompanying consolidated balance sheets. Other long-term liabilities include deferred revenue of $14.0 million and $2.9 million as of January 31, 2009 and February 2, 2008, respectively.
| 11. | Retirement of Chairman and Chief Creative Officer |
On July 20, 2006, the Company’s former Chairman and Chief Creative Officer retired from the Company. As a result, the Company recorded a charge of approximately $3.7 million, before income taxes, in selling, general, and administrative expenses in fiscal 2006 related to cash compensation ($1.5 million) and accelerated vesting of certain stock options ($2.2 million).
| 12. | Common Stock Repurchases |
Pursuant to authorization from the Board of Directors, the Company repurchased and retired 18,000 shares of Company stock at an aggregate cost of approximately $0.7 million, or approximately $40.15 per share, in fiscal 2008 and 4,672,737 shares of Company stock at an aggregate cost of approximately $174.3 million, or approximately $37.28 per share, in fiscal 2007 and 3,277,654 shares of Company stock at an aggregate cost of approximately $110.0 million, or approximately $33.55 per share, in fiscal 2006.
| 13. | Deferred Rent and Other Liabilities |
Deferred rent and other liabilities consist of the following:
| | | | | | |
| | | January 31,
2009 | | February 2,
2008 |
| | | (In thousands) |
Deferred rent | | $ | 17,492 | | $ | 16,440 |
Construction allowance | | | 35,162 | | | 30,635 |
Deferred revenue related to Gymboree Visa program | | | 14,035 | | | 2,922 |
Other | | | 383 | | | 1,725 |
| | | | | | |
Total | | $ | 67,072 | | $ | 51,722 |
| | | | | | |
49
| 14. | Quarterly Financial Information (Unaudited) |
The quarterly financial information presented below is derived from the Consolidated Statements of Income.
| | | | | | | | | | | | | | | |
| | | Fiscal 2008 Quarter Ended | | |
| | | May 3,
2008 | | August 2,
2008 | | November 1,
2008 | | January 31,
2009 | | 2008
Total |
| | | (In thousands, except per share amounts) |
Net sales | | | | | | | | | | | | | | | |
Retail | | $ | 238,917 | | $ | 202,818 | | $ | 261,296 | | $ | 284,828 | | $ | 987,859 |
Play & Music | | | 3,187 | | | 2,930 | | | 2,809 | | | 3,893 | | | 12,819 |
| | | | | | | | | | | | | | | |
Total net sales | | | 242,104 | | | 205,748 | | | 264,105 | | | 288,721 | | | 1,000,678 |
Gross profit | | | 123,418 | | | 93,942 | | | 134,585 | | | 124,256 | | | 476,201 |
Operating income | | | 41,593 | | | 12,875 | | | 50,208 | | | 43,632 | | | 148,308 |
Net income | | | 25,037 | | | 8,011 | | | 30,947 | | | 29,485 | | | 93,480 |
Basic net income per share | | | 0.91 | | | 0.29 | | | 1.10 | | | 1.05 | | | 3.35 |
Diluted net income per share | | | 0.86 | | | 0.27 | | | 1.06 | | | 1.00 | | | 3.21 |
| | |
| | | Fiscal 2007 Quarter Ended | | |
| | | May 5,
2007 | | August 4,
2007 | | November 3,
2007 | | February 2,
2008 * | | 2007
Total |
| | | (In thousands, except per share amounts) |
Net sales | | | | | | | | | | | | | | | |
Retail | | $ | 206,721 | | $ | 179,854 | | $ | 247,569 | | $ | 275,266 | | $ | 909,410 |
Play & Music | | | 2,579 | | | 2,500 | | | 3,163 | | | 3,162 | | | 11,404 |
| | | | | | | | | | | | | | | |
Total net sales | | | 209,300 | | | 182,354 | | | 250,732 | | | 278,428 | | | 920,814 |
Gross profit | | | 103,800 | | | 80,213 | | | 124,712 | | | 134,069 | | | 442,794 |
Operating income | | | 33,607 | | | 8,476 | | | 44,398 | | | 43,764 | | | 130,245 |
Net income | | | 20,855 | | | 5,802 | | | 26,895 | | | 26,779 | | | 80,331 |
Basic net income per share | | | 0.70 | | | 0.20 | | | 0.94 | | | 0.98 | | | 2.79 |
Diluted net income per share | | | 0.67 | | | 0.19 | | | 0.91 | | | 0.93 | | | 2.67 |
| * | In the fourth quarter of fiscal 2007, the Company identified an error in its accounting for restricted stock awards with performance conditions that were granted earlier in fiscal 2007. As a result, an adjustment of approximately $3.2 million to increase selling, general and administrative expense was recorded to correct the amortization method the Company used to recognize compensation expense for such restricted stock awards. Performance-based restricted stock awards are required to be amortized on an accelerated basis (treating each vesting tranche of a performance award as a separate award with its own requisite service period) compared to the straight-line method the Company had used during the first three quarters of fiscal 2007. The Company recorded this adjustment in the fourth quarter of fiscal 2007 as the amounts were not material to the results of any prior quarter of fiscal 2007. |
50
| ITEM 9. | CHANGES IN AND DISAGREEMENTS WITH ACCOUNTANTS ON ACCOUNTING AND FINANCIAL DISCLOSURE |
None.
| ITEM 9A. | CONTROLS AND PROCEDURES |
Disclosure Controls and Procedures
The Company conducted an evaluation, under the supervision and with the participation of the Company’s management, including the Chief Executive Officer and Chief Operating Officer and Chief Financial Officer, of the effectiveness of the design and operation of its disclosure controls and procedures (as such term is defined in Rules 13a-15(e) and 15d-15(e) under the Securities Exchange Act of 1934, as amended (the “Exchange Act”)) as of the end of the period covered by this report. There are inherent limitations to the effectiveness of any system of disclosure controls and procedures, including the possibility of human error and the circumvention or overriding of the controls and procedures. Accordingly, even effective disclosure controls and procedures can only provide reasonable assurance of achieving their control objectives. Based on the Company’s evaluation, the Chief Executive Officer and Chief Operating Officer and Chief Financial Officer concluded that the Company’s disclosure controls and procedures were effective as of the end of the period covered by this report to ensure that information relating to the Company (including its consolidated subsidiaries) required to be included in the Company’s reports filed or submitted under the Exchange Act is recorded, processed, summarized and reported within the time periods specified in Securities and Exchange Commission rules and forms. In addition, the Company’s Chief Executive Officer and Chief Operating Officer and Chief Financial Officer concluded as of the period covered by this report that the Company’s disclosure controls and procedures are also effective to ensure that information required to be disclosed in the Company’s reports filed or submitted under the Exchange Act is accumulated and communicated to the Company’s management, including the Chief Executive Officer and Chief Operating Officer and Chief Financial Officer, to allow timely decisions regarding required disclosure.
Management’s Report on Internal Control over Financial Reporting
The management of The Gymboree Corporation is responsible for establishing and maintaining adequate internal control over financial reporting as defined in Rules 13a-15(f) and 15d-15(f) under the Exchange Act. The Company’s internal control system is designed to provide reasonable assurance regarding the reliability of financial reporting and the preparation of financial statements for external purposes in accordance with generally accepted accounting principles.
Because of inherent limitations, internal control over financial reporting may not prevent or detect misstatements. Also, projections of any evaluation of effectiveness to future periods are subject to the risk that controls may become inadequate because of changes in conditions, or that the degree of compliance with the policies or procedures may deteriorate.
Management has assessed the effectiveness of the Company’s internal control over financial reporting as of January 31, 2009. In making this assessment, management used the criteria established inInternal Control – Integrated Frameworkissued by the Committee of Sponsoring Organizations of the Treadway Commission. Management believes that, as of January 31, 2009, the Company maintained effective internal control over financial reporting based on the criteria established inInternal Control – Integrated Frameworkissued by the Committee of Sponsoring Organizations of the Treadway Commission.
The Company’s independent registered public accounting firm has issued a report on the Company’s internal control over financial reporting. That report appears herein on page 27.
51
Changes in Internal Control over Financial Reporting
During the Company’s fourth fiscal quarter, there was no change in the Company’s internal control over financial reporting that materially affected, or is reasonably likely to materially affect, the Company’s internal control over financial reporting.
| ITEM 9B. | OTHER INFORMATION |
None.
PART III
| ITEM 10. | DIRECTORS AND EXECUTIVE OFFICERS AND CORPORATE GOVERNANCE |
The information required by this item is incorporated herein by reference to the sections entitled “Proposal One: Election of Directors,” “Board Meetings and Board Committees,” “Section 16(a) Beneficial Ownership Reporting Compliance” and “Other Information” in our 2009 Proxy Statement. See also Part 1, Item 1, “Business – Executive Officers of the Registrant” in this annual report.
| ITEM 11. | EXECUTIVE COMPENSATION |
The information required by this item is incorporated herein by reference to the sections entitled “2008 Director Compensation Table,” “Compensation Committee Report,” “Compensation Discussion and Analysis,” “Executive Compensation” and “Termination of Employment and Change-of-Control Arrangements and Employment Contracts” in our 2009 Proxy Statement.
| ITEM 12. | SECURITY OWNERSHIP OF CERTAIN BENEFICIAL OWNERS AND MANAGEMENT AND RELATED STOCKHOLDER MATTERS |
The information required by this item is incorporated herein by reference to the sections entitled “Security Ownership of Certain Beneficial Owners and Directors and Management” and “Equity Compensation Plan Information” in our 2009 Proxy Statement.
| ITEM 13. | CERTAIN RELATIONSHIPS AND RELATED TRANSACTIONS, AND DIRECTOR INDEPENDENCE |
The information required by this item is incorporated herein by reference to the section entitled “Board Membership and Director Independence” and “Certain Relationships and Related-Person Transactions” in our 2009 Proxy Statement.
| ITEM 14. | PRINCIPAL ACCOUNTANT FEES AND SERVICES |
The information required by this item is incorporated herein by reference to the section entitled “Independent Registered Public Accounting Firm Fees and Services” in our 2009 Proxy Statement.
52
PART IV
| ITEM 15. | EXHIBITS, FINANCIAL STATEMENT SCHEDULES |
(A)(1) FINANCIAL STATEMENTS
The following documents are filed as a part of this Annual Report on Form 10-K.
| | |
Report of Independent Registered Public Accounting Firm | | 27 |
Consolidated Balance Sheets as of January 31, 2009 and February 2, 2008 | | 29 |
Consolidated Statements of Income for the years ended January 31, 2009, February 2, 2008, and February 3, 2007 | | 30 |
Consolidated Statements of Cash Flows for the years ended January 31, 2009, February 2, 2008, and February 3, 2007 | | 31 |
Consolidated Statements of Stockholders’ Equity for the years ended January 31, 2009, February 2, 2008, and February 3, 2007 | | 32 |
Notes to Consolidated Financial Statements | | 33 |
(A)(2) FINANCIAL STATEMENT SCHEDULES
Financial statement schedules have been omitted because they are not required or are not applicable.
(A)(3) EXHIBITS
| | |
Exhibit
Number | | Description |
| 3.1 | | Restated Certificate of Incorporation of Registrant. (1) |
| |
| 3.2 | | Amended and Restated Bylaws of Registrant. (12) |
| |
| 4.1 | | Article III of Restated Certificate of Incorporation of Registrant (See Exhibit 3.1). (1) |
| |
| 4.2 | | Form of Certificate for Common Stock. (1) |
| |
| 10.31* | | Amended and Restated 1993 Stock Option Plan, with form of Stock Option Agreement, amended and restated as of November 11, 1998. (2) |
| |
| 10.50* | | 2002 Stock Incentive Plan. (3) |
| |
| 10.52* | | Amended and Restated Management Change of Control Plan. (4) |
| |
| 10.53* | | Amended and Restated Management Severance Plan. (14) |
| |
| 10.54* | | Key Terms of Compensation Arrangements for Named Executive Officers. (23) |
| |
| 10.55 | | Credit Agreement with Bank of America dated August 11, 2003. (5) |
| |
| 10.56* | | Annual Bonus Plan. (23) |
| |
| 10.57 | | Sublease Agreement for 500 Howard Street, San Francisco, CA. (6) |
| |
| 10.58* | | 2004 Equity Incentive Plan. (10) |
| |
| 10.59* | | Form of Stock Option Grant Notice and Agreement for 2004 Equity Incentive Plan. (7) |
| |
| 10.60 | | Waiver and First Amendment to Credit Agreement. (7) |
| |
| 10.62* | | Restricted Stock Award Notice and Agreement for Blair W. Lambert dated January 10, 2005. (8) |
| |
| 10.63* | | Stock Option Grant Notice and Agreement for Blair W. Lambert dated January 10, 2005. (8) |
53
| | |
Exhibit
Number | | Description |
| 10.70 | | Second Amendment to Credit Agreement dated July 27, 2005. (9) |
| |
| 10.71 | | Third Amendment to Credit Agreement dated March 30, 2006. (11) |
| |
| 10.73 | | Form of Indemnification Agreement. (16) |
| |
| 10.74 | | Fourth Amendment to Credit Agreement, dated July 5, 2006. (13) |
| |
| 10.78 | | Fifth Amendment to Credit Agreement, dated February 7, 2007. (15) |
| |
| 10.79* | | Form of Restricted Stock Award Notice and Agreement for 2004 Equity Incentive Plan. (17) |
| |
| 10.82 | | Sixth Amendment to Credit Agreement, dated April 24, 2007. (18) |
| |
| 10.83 | | Seventh Amendment to Credit Agreement, dated June 12, 2007. (19) |
| |
| 10.84 | | Eighth Amendment to Credit Agreement, dated July 31, 2007. (20) |
| |
| 10.85 | | Ninth Amendment to Credit Agreement, dated November 21, 2007. (21) |
| |
| 10.87 | | Tenth Amendment to Credit Agreement, dated as of August 8, 2008. (22) |
| |
| 10.88* | | Amended Compensation Arrangements for Named Executive Officers. (24) |
| |
| 10.89* | | Summary of Nonemployee Director Compensation. |
| |
| 10.90* | | Form of Restricted Stock Unit Award Notice and Agreement for 2004 Equity Incentive Plan. |
| |
| 21.1 | | Subsidiaries of the Registrant. |
| |
| 23.1 | | Consent of Independent Registered Public Accounting Firm. |
| |
| 31.1 | | Certification of Matthew K. McCauley Pursuant to §302 of the Sarbanes-Oxley Act of 2002. |
| |
| 31.2 | | Certification of Blair W. Lambert Pursuant to §302 of the Sarbanes-Oxley Act of 2002. |
| |
| 32.1 | | Certification of Matthew K. McCauley Pursuant to 18 U.S.C.§1350, as Adopted Pursuant to §906 of the Sarbanes-Oxley of 2002. |
| |
| 32.2 | | Certification of Blair W. Lambert Pursuant to 18 U.S.C.§1350, as Adopted Pursuant to §906 of the Sarbanes-Oxley of 2002. |
| (1) | Incorporated by reference to the Registrant’s Registration Statement on Form S-1 filed with the Securities and Exchange Commission (“the Commission”) on February 18, 1993 (File No. 33-58322), as amended. |
| (2) | Incorporated by reference to the corresponding exhibits to the Registrant’s 2000 Annual Report on Form 10-K filed with the Commission on May 4, 2001. |
| (3) | Incorporated by reference to the corresponding exhibits to the Registrant’s August 3, 2002 Quarterly Report on Form 10-Q filed with the Commission on September 17, 2002. |
| (4) | Incorporated by reference to Exhibit 10.52 to the Registrant’s Current report on Form 8-K filed with the Commission on April 7, 2008. |
| (5) | Incorporated by reference to the corresponding exhibits to the Registrant’s August 2, 2003 Quarterly Report on Form 10-Q filed with the Commission on September 11, 2003. |
| (6) | Incorporated by reference to the corresponding exhibits to the Registrant’s May 1, 2004 Quarterly Report on Form 10-Q filed with the Commission on June 9, 2004. |
| (7) | Incorporated by reference to the corresponding exhibits to the Registrant’s October 30, 2004 Quarterly Report on Form 10-Q filed with the Commission on December 8, 2004. |
| (8) | Incorporated by reference to the corresponding exhibits to the Registrant’s January 10, 2005 Current Report on Form 8-K filed with the Commission on January 13, 2005. |
| (9) | Incorporated by reference to Exhibit 10.3 to the Registrant’s Current Report on Form 8-K filed with the Commission on August 1, 2005. |
54
| (10) | Incorporated by reference to Appendix A to the Registrant’s Definitive Proxy Statement on Schedule 14A filed with the Commission on May 2, 2008. |
| (11) | Incorporated by reference to the corresponding exhibit to the Registrant’s January 28, 2006 Annual Report on Form 10-K filed with the Commission on April 12, 2006. |
| (12) | Incorporated by reference to the corresponding exhibit to the Registrant’s Current Report on Form 8-K filed with the Commission on April 23, 2007. |
| (13) | Incorporated by reference to Exhibit 10.73 to the Registrant’s Current Report on Form 8-K filed with the Commission on July 14, 2006. |
| (14) | Incorporated by reference to Exhibit 10.53 to the Registrant’s Current Report on Form 8-K filed with the Commission on April 7, 2008. |
| (15) | Incorporated by reference to Exhibit 10.74 to the Registrant’s Current Report on Form 8-K filed with the Commission on February 8, 2007. |
| (16) | Incorporated by reference to Exhibit 10.72 to the Registrant’s Current Report on Form 8-K filed with the Commission on June 19, 2006. |
| (17) | Incorporated by reference to Exhibit 10.1 to the Registrant’s Current Report on Form 8-K filed with the Commission on June 15, 2005. |
| (18) | Incorporated by reference to Exhibit 10.82 to the Registrant’s Current Report on Form 8-K filed with the Commission on April 26, 2007. |
| (19) | Incorporated by reference to the corresponding exhibit to the Registrant’s May 5, 2007 Quarterly Report on Form 10-Q filed with the Commission on June 12, 2007. |
| (20) | Incorporated by reference to Exhibit 10.84 to the Registrant’s Current Report on Form 8-K filed with the Commission on August 2, 2007. |
| (21) | Incorporated by reference to Exhibit 10.85 to the Registrant’s Current Report on Form 8-K filed with the Commission on November 29, 2007. |
| (22) | Incorporated by reference to Exhibit 10.87 to the Registrant’s Current Report on Form 8-K filed with the Commission on August 14, 2008. |
| (23) | Incorporated by reference to the corresponding exhibit to the Registrant’s May 3, 2008 Quarterly Report on Form 10-Q filed with the Commission on June 11, 2008. |
| (24) | Incorporated by reference to the Registrant’s Current Report on Form 8-K filed with the Commission on December 15, 2008. |
| * | Indicates management contracts or compensatory plans or arrangements required to be filed as exhibits to this report on Form 10-K. |
55
THE GYMBOREE CORPORATION
SIGNATURES
Pursuant to the requirements of Section 13 or 15(d) of the Securities Exchange Act of 1934, the Registrant has duly caused this report to be signed on its behalf by the undersigned, thereunto duly authorized.
| | | | | | | | |
| | | | | | THE GYMBOREE CORPORATION |
| | | |
March 30, 2009 | | | | By: | | /s/ MATTHEW K. MCCAULEY |
(Date) | | | | | | Matthew K. McCauley |
| | | | | | | | Chief Executive Officer and |
| | | | | | | | Chairman of the Board |
Pursuant to the requirements of the Securities Exchange Act of 1934, this Report has been signed below by the following persons on behalf of the Registrant and in the capacities and on the dates indicated.
| | | | |
NAME | | TITLE | | DATE |
| | |
/s/ MATTHEW K. MCCAULEY Matthew K. McCauley | | Chief Executive Officer and Chairman of the Board (Principal Executive Officer) | | March 30, 2009 |
| | |
/s/ BLAIR W. LAMBERT Blair W. Lambert | | Chief Operating Officer and Chief Financial Officer (Principal Financial Officer) | | March 30, 2009 |
| | |
/s/ LYNDA G. GUSTAFSON Lynda G. Gustafson | | Vice President, Corporate Controller (Principal Accounting Officer) | | March 30, 2009 |
| | |
/s/ GARY M. HEIL Gary M. Heil | | Director | | March 30, 2009 |
| | |
/s/ WILLIAM U. WESTERFIELD William U. Westerfield | | Director | | March 30, 2009 |
| | |
/s/ DANIEL R. LYLE Daniel R. Lyle | | Director | | March 30, 2009 |
| | |
/s/ JOHN C. POUND John C. Pound | | Director | | March 30, 2009 |
| | |
/s/ MICHAEL J. MCCLOSKEY Michael J. McCloskey | | Director | | March 30, 2009 |
56
THE GYMBOREE CORPORATION
EXHIBIT INDEX
| | |
Exhibit
Number | | Description |
| 3.1 | | Restated Certificate of Incorporation of Registrant. (1) |
| |
| 3.2 | | Amended and Restated Bylaws of Registrant. (12) |
| |
| 4.1 | | Article III of Restated Certificate of Incorporation of Registrant (See Exhibit 3.1). (1) |
| |
| 4.2 | | Form of Certificate for Common Stock. (1) |
| |
| 10.31* | | Amended and Restated 1993 Stock Option Plan, with form of Stock Option Agreement, amended and restated as of November 11, 1998. (2) |
| |
| 10.50* | | 2002 Stock Incentive Plan. (3) |
| |
| 10.52* | | Amended and Restated Management Change of Control Plan. (4) |
| |
| 10.53* | | Amended and Restated Management Severance Plan. (14) |
| |
| 10.54* | | Key Terms of Compensation Arrangements for Named Executive Officers. (23) |
| |
| 10.55 | | Credit Agreement with Bank of America dated August 11, 2003. (5) |
| |
| 10.56* | | Annual Bonus Plan. (23) |
| |
| 10.57 | | Sublease Agreement for 500 Howard Street, San Francisco, CA. (6) |
| |
| 10.58* | | 2004 Equity Incentive Plan. (10) |
| |
| 10.59* | | Form of Stock Option Grant Notice and Agreement for 2004 Equity Incentive Plan. (7) |
| |
| 10.60 | | Waiver and First Amendment to Credit Agreement. (7) |
| |
| 10.62* | | Restricted Stock Award Notice and Agreement for Blair W. Lambert dated January 10, 2005. (8) |
| |
| 10.63* | | Stock Option Grant Notice and Agreement for Blair W. Lambert dated January 10, 2005. (8) |
| |
| 10.70 | | Second Amendment to Credit Agreement dated July 27, 2005. (9) |
| |
| 10.71 | | Third Amendment to Credit Agreement dated March 30, 2006. (11) |
| |
| 10.73 | | Form of Indemnification Agreement. (16) |
| |
| 10.74 | | Fourth Amendment to Credit Agreement, dated July 5, 2006. (13) |
| |
| 10.78 | | Fifth Amendment to Credit Agreement, dated February 7, 2007. (15) |
| |
| 10.79* | | Form of Restricted Stock Award Notice and Agreement for 2004 Equity Incentive Plan. (17) |
| |
| 10.82 | | Sixth Amendment to Credit Agreement, dated April 24, 2007. (18) |
| |
| 10.83 | | Seventh Amendment to Credit Agreement, dated June 12, 2007. (19) |
| |
| 10.84 | | Eighth Amendment to Credit Agreement, dated July 31, 2007. (20) |
| |
| 10.85 | | Ninth Amendment to Credit Agreement, dated November 21, 2007. (21) |
| |
| 10.87 | | Tenth Amendment to Credit Agreement, dated as of August 8, 2008. (22) |
| |
| 10.88* | | Amended Compensation Arrangements for Named Executive Officers. (24) |
57
| | |
Exhibit
Number | | Description |
| 10.89* | | Summary of Nonemployee Director Compensation. |
| |
| 10.90* | | Form of Restricted Stock Unit Award Notice and Agreement for 2004 Equity Incentive Plan. |
| |
| 21.1 | | Subsidiaries of the Registrant. |
| |
| 23.1 | | Consent of Independent Registered Public Accounting Firm. |
| |
| 31.1 | | Certification of Matthew K. McCauley Pursuant to §302 of the Sarbanes-Oxley Act of 2002. |
| |
| 31.2 | | Certification of Blair W. Lambert Pursuant to §302 of the Sarbanes-Oxley Act of 2002. |
| |
| 32.1 | | Certification of Matthew K. McCauley Pursuant to 18 U.S.C.§1350, as Adopted Pursuant to §906 of the Sarbanes-Oxley of 2002. |
| |
| 32.2 | | Certification of Blair W. Lambert Pursuant to 18 U.S.C.§1350, as Adopted Pursuant to §906 of the Sarbanes-Oxley of 2002. |
| (1) | Incorporated by reference to the Registrant’s Registration Statement on Form S-1 filed with the Securities and Exchange Commission (“the Commission”) on February 18, 1993 (File No. 33-58322), as amended. |
| (2) | Incorporated by reference to the corresponding exhibits to the Registrant’s 2000 Annual Report on Form 10-K filed with the Commission on May 4, 2001. |
| (3) | Incorporated by reference to the corresponding exhibits to the Registrant’s August 3, 2002 Quarterly Report on Form 10-Q filed with the Commission on September 17, 2002. |
| (4) | Incorporated by reference to Exhibit 10.52 to the Registrant’s Current Report on Form 8-K filed with the Commission on April 7, 2008. |
| (5) | Incorporated by reference to the corresponding exhibits to the Registrant’s August 2, 2003 Quarterly Report on Form 10-Q filed with the Commission on September 11, 2003. |
| (6) | Incorporated by reference to the corresponding exhibits to the Registrant’s May 1, 2004 Quarterly Report on Form 10-Q filed with the Commission on June 9, 2004. |
| (7) | Incorporated by reference to the corresponding exhibits to the Registrant’s October 30, 2004 Quarterly Report on Form 10-Q filed with the Commission on December 8, 2004. |
| (8) | Incorporated by reference to the corresponding exhibits to the Registrant’s January 10, 2005 Current Report on Form 8-K filed with the Commission on January 13, 2005. |
| (9) | Incorporated by reference to Exhibit 10.3 to the Registrant’s Current Report on Form 8-K filed with the Commission on August 1, 2005. |
| (10) | Incorporated by reference to Appendix A to the Registrant’s Definitive Proxy Statement on Schedule 14A filed with the Commission on May 2, 2008. |
| (11) | Incorporated by reference to the corresponding exhibit to the Registrant’s January 28, 2006 Annual Report on Form 10-K filed with the Commission on April 12, 2006. |
| (12) | Incorporated by reference to the corresponding exhibit to the Registrant’s Current Report on Form 8-K filed with the Commission on April 23, 2007. |
| (13) | Incorporated by reference to Exhibit 10.73 to the Registrant’s Current Report on Form 8-K filed with the Commission on July 14, 2006. |
| (14) | Incorporated by reference to Exhibit 10.53 to the Registrant’s Current Report on Form 8-K filed with the Commission on April 7, 2008. |
| (15) | Incorporated by reference to Exhibit 10.74 to the Registrant’s Current Report on Form 8-K filed with the Commission on February 8, 2007. |
| (16) | Incorporated by reference to Exhibit 10.72 to the Registrant’s Current Report on Form 8-K filed with the Commission on June 19, 2006. |
| (17) | Incorporated by reference to Exhibit 10.1 to the Registrant’s Current Report on Form 8-K filed with the Commission on June 15, 2005. |
| (18) | Incorporated by reference to Exhibit 10.82 to the Registrant’s Current Report on Form 8-K filed with the Commission on April 26, 2007. |
58
| (19) | Incorporated by reference to the corresponding exhibit to the Registrant’s May 5, 2007 Quarterly Report on Form 10-Q filed with the Commission on June 12, 2007. |
| (20) | Incorporated by reference to Exhibit 10.84 to the Registrant’s Current Report on Form 8-K filed with the Commission on August 2, 2007. |
| (21) | Incorporated by reference to Exhibit 10.85 to the Registrant’s Current Report on Form 8-K filed with the Commission on November 29, 2007. |
| (22) | Incorporated by reference to Exhibit 10.87 to the Registrant’s Current Report on Form 8-K filed with the Commission on August 14, 2008. |
| (23) | Incorporated by reference to the corresponding exhibit to the Registrant’s May 3, 2008 Quarterly Report on Form 10-Q filed with the Commission on June 11, 2008. |
| (24) | Incorporated by reference to the Registrant’s Current Report on Form 8-K filed with the Commission on December 15, 2008. |
| * | Indicates management contracts or compensatory plans or arrangements required to be filed as exhibits to this report on Form 10-K. |
59