Table of Contents
UNITED STATES
SECURITIES AND EXCHANGE COMMISSION
Washington, D.C. 20549
FORM 20-F
[ ] REGISTRATION STATEMENT PURSUANT TO SECTION 12(b) OR (g)
OF THE SECURITIES EXCHANGE ACT OF 1934
OR
[X] ANNUAL REPORT PURSUANT TO SECTION 13 OR 15(d) OF
THE SECURITIES EXCHANGE ACT OF 1934
For the fiscal year ended March 31, 2002
Commission file number 1-7616
PIONEER KABUSHIKI KAISHA
(Exact name of Registrant as specified in its charter)
PIONEER CORPORATION
(Translation of Registrant’s name into English)
JAPAN
(Jurisdiction of incorporation or organization)
4-1, MEGURO 1-CHOME, MEGURO-KU, TOKYO 153-8654, JAPAN
(Address of principal executive offices)
Securities registered pursuant to Section 12(b) of the Act.
| Title of each class | Name of each exchange on which registered | |||
| Common Stock, each represented by one American Depositary Share | New York Stock Exchange |
Table of Contents
Securities registered pursuant to Section 12(g) of the Act.
None
Securities for which there is a reporting obligation pursuant to
Section 15(d) of the Act.
None
Indicate the number of outstanding shares of each of the issuer’s classes of capital or common stock as of the close of the period covered by the annual report.
| Outstanding as of March 31, 2002 | ||||
| Title of class | (Japan time) | |||
| Common Stock | 180,063,836 | |||
Indicate by check mark whether the registrant (1) has filed all reports required to be filed by Section 13 or 15(d) of the Securities Exchange Act of 1934 during the preceding 12 months (or for such shorter period that the registrant was required to file such reports), and (2) has been subject to such filing requirements for the past 90 days.
| Yes X | No |
Indicate by check mark which financial statement item the registrant has elected to follow.
| Item 17 X | Item 18 |
2
Table of Contents
TABLE OF CONTENTS
| Page | ||||
| Certain Defined Terms | 4 | |||
| Cautionary Statement with Respect to Forward-Looking Statements | 4 | |||
| PART I | ||||
| Item 1. Identity of Directors, Senior Management and Advisers | 4 | |||
| Item 2. Offer Statistics and Expected Timetable | 4 | |||
| Item 3. Key Information | 5 | |||
| Item 4. Information on the Company | 13 | |||
| Item 5. Operating and Financial Review and Prospects | 28 | |||
| Item 6. Directors, Senior Management and Employees | 45 | |||
| Item 7. Major Shareholders and Related Party Transactions | 53 | |||
| Item 8. Financial Information | 54 | |||
| Item 9. The Offer and Listing | 56 | |||
| Item 10. Additional Information | 57 | |||
| Item 11. Quantitative and Qualitative Disclosures About Market Risk | 72 | |||
| Item 12. Description of Securities Other than Equity Securities | 76 | |||
| PART II | ||||
| Item 13. Defaults, Dividend Arrearages and Delinquencies | 77 | |||
| Item 14. Material Modifications to the Rights of Security Holders and Use of Proceeds | 77 | |||
| Item 15. [Reserved] | ||||
| Item 16. [Reserved] | ||||
| PART III | ||||
| Item 17. Financial Statements | 78 | |||
| Item 18. Financial Statements | 78 | |||
| Item 19. Exhibits | 78 | |||
3
Table of Contents
Certain Defined Terms
As used herein, the term “Pioneer” refers to Pioneer Corporation, the registrant, and “we” and “our” refer to Pioneer and its consolidated subsidiaries as a group, unless the context otherwise indicates.
References in this annual report to fiscal years refer to the 12-month periods ended March 31 of each calendar year.
Billion is used in the American sense of one thousand million.
Cautionary Statement with Respect to Forward-Looking Statements
Statements made in this annual report with respect to our current plans, estimates, strategies and beliefs, and other statements that are not historical facts are forward-looking statements about our future performance. Forward-looking statements include but are not limited to those using words such as “believe,” “expect,” “anticipate,” “plans,” “strategy,” “prospects,” “forecast,” “estimate,” “project,” “may” or “might” and words of similar meaning in connection with a discussion of future operations or financial performance. From time to time, oral or written forward-looking statements may also be included in other materials released to the public. These statements are based on management’s assumptions and beliefs in light of the information currently available to it. We caution that a number of important risks and uncertainties could cause actual results to differ materially from those discussed in the forward-looking statements, and therefore you should not place undue reliance on them. You also should not rely on the belief that it is our obligation to update or revise any forward-looking statements, whether as a result of new information, future events or otherwise. We disclaim any such obligation. Risks and uncertainties that might affect us include, but are not limited to, (i) general economic conditions in our markets, particularly levels of consumer spending; (ii) exchange rates, particularly between the yen and the U.S. dollar, euro, and other currencies in which we make significant sales or in which our assets and liabilities are denominated; (iii) our ability to continue to design and develop and win acceptance of our products and services, which are offered in highly competitive markets characterized by continual new product introductions, rapid developments in technology and subjective and changing consumer preferences; (iv) our ability to implement successfully our business strategies; (v) our ability to compete and develop and implement successful sales and distribution strategies in light of technological developments in and affecting our businesses; (vi) our continued ability to devote sufficient resources to research and development, and capital expenditure; (vii) our ability to continuously enhance our brand image; (viii) the success of our joint ventures and alliances; and (ix) the outcome of contingencies.
PART I
Item 1. Identity of Directors, Senior Management and Advisers
Not applicable
Item 2. Offer Statistics and Expected Timetable
Not applicable
4
Table of Contents
Item 3. Key Information
A. Selected financial data
The following table presents selected financial information for us at the dates and for each of the years indicated, and has been derived from our financial statements included elsewhere herein, which are prepared in accordance with accounting principles generally accepted in the United States of America (“U.S. GAAP”), except for segment data which is prepared in accordance with the regulations under the Securities and Exchange Law of Japan.
| (In millions of yen, except per share data) | ||||||||||||||||||||||||
| Year ended March 31 | ||||||||||||||||||||||||
| 1998 | 1999 | 2000 | 2001 | 2002 | ||||||||||||||||||||
Consolidated Statement of Income Data: | ||||||||||||||||||||||||
| Operating revenue (1) | ¥ | 579,435 | ¥ | 589,065 | ¥ | 615,871 | ¥ | 647,069 | ¥ | 668,899 | ||||||||||||||
| Operating income (1) | 28,872 | 20,116 | 23,593 | 33,819 | 21,281 | |||||||||||||||||||
| Income before income taxes | 18,836 | 12,533 | 27,808 | 34,193 | 15,343 | |||||||||||||||||||
| Net income | 6,163 | 1,159 | 13,075 | 18,298 | 8,047 | |||||||||||||||||||
| Net income per share of common stock and per American Depositary Share (ADS) (2): | ||||||||||||||||||||||||
| Basic | 34.32 | 6.45 | 72.81 | 101.76 | 44.70 | |||||||||||||||||||
| Diluted | 34.32 | 6.45 | 72.80 | 101.70 | 44.69 | |||||||||||||||||||
Consolidated Balance Sheet Data: | ||||||||||||||||||||||||
| Total assets | ¥ | 595,553 | ¥ | 592,407 | ¥ | 601,137 | ¥ | 605,156 | ¥ | 645,129 | ||||||||||||||
| Short-term borrowings | 54,899 | 46,153 | 41,318 | 37,571 | 45,867 | |||||||||||||||||||
| Current portion of long-term debt | 8,835 | 6,455 | 37,235 | 7,996 | 2,551 | |||||||||||||||||||
| Long-term debt, less current portion | 58,097 | 82,958 | 47,060 | 38,304 | 35,677 | |||||||||||||||||||
| Shareholders’ equity | 330,098 | 313,244 | 312,460 | 336,995 | 347,003 | |||||||||||||||||||
| Number of shares outstanding (in thousands) | 179,573 | 179,573 | 179,588 | 179,894 | 180,064 | |||||||||||||||||||
5
Table of Contents
| (In millions of yen, except per share data and percentage amounts) | ||||||||||||||||||||||||||
| Year ended March 31 | ||||||||||||||||||||||||||
| 1998 | 1999 | 2000 | 2001 | 2002 | ||||||||||||||||||||||
Other Data: | ||||||||||||||||||||||||||
| Capital expenditures | ¥ | 26,898 | ¥ | 33,070 | ¥ | 25,458 | ¥ | 42,183 | ¥ | 46,996 | ||||||||||||||||
| Research and development (R&D) expenses | 31,042 | 31,131 | 33,265 | 37,105 | 39,050 | |||||||||||||||||||||
| Cash flows from operating activities | 36,015 | 37,904 | 45,390 | 51,241 | 57,110 | |||||||||||||||||||||
| Cash flows from investing activities | (31,836 | ) | (38,157 | ) | 11,984 | (41,581 | ) | (51,148 | ) | |||||||||||||||||
| Cash flows from financing activities | (744 | ) | 13,112 | (4,139 | ) | (46,567 | ) | (4,207 | ) | |||||||||||||||||
| Return on equity (3) | 1.88 | % | 0.36 | % | 4.18 | % | 5.63 | % | 2.35 | % | ||||||||||||||||
| Return on assets (4) | 1.06 | % | 0.20 | % | 2.19 | % | 3.03 | % | 1.29 | % | ||||||||||||||||
| Cash dividends declared per share of common stock and per ADS (5): | ||||||||||||||||||||||||||
| Interim | (in yen) | 2.50 | 5.00 | 5.00 | 7.50 | 7.50 | ||||||||||||||||||||
| (in U.S. dollars) | 0.02 | 0.04 | 0.05 | 0.07 | 0.06 | |||||||||||||||||||||
| Year-end | (in yen) | 5.00 | 5.00 | 5.00 | 7.50 | 7.50 | ||||||||||||||||||||
| (in U.S. dollars) | 0.04 | 0.04 | 0.05 | 0.06 | 0.06 | |||||||||||||||||||||
Notes:
| (1) | In fiscal 2000, we changed the reporting of income from patents and related expenses, which had been previously presented in “Other income (expenses).” The gross patent revenue is presented as “Royalty revenue” and the related expenses are included in “Selling, general and administrative expenses.” Previously reported amounts have been reclassified to conform to this presentation. | |
| (2) | Basic net income per share of common stock and per ADS has been computed based on the weighted average number of shares outstanding during each year. Diluted net income per share of common stock and ADS has been computed on the basis that all dilutive warrants and stock options were exercised. One ADS represents one share of common stock. | |
| (3) | Net income as a percentage of average shareholders’ equity. | |
| (4) | Net income as a percentage of average total assets. | |
| (5) | Cash dividends in U.S. dollars are based on the noon buying rate in yen for cable transfers in New York City as certified for customs purposes by the Federal Reserve Bank of New York on the date of the dividend payment. |
6
Table of Contents
Exchange rates (yen per U.S. dollar)
The exchange rate between the yen and the U.S. dollar, based upon the noon buying rate for cable transfers in New York City as certified for customs purposes by the Federal Reserve Bank of New York, was ¥116.62 = US ¥1.00 on July 11, 2002.
| Year ended March 31 | Average | High | Low | Period-end | |||||||||||||
| 1998 | ¥ | 123.57 | ¥ | 111.42 | ¥ | 133.99 | ¥ | 133.29 | |||||||||
| 1999 | 128.10 | 108.83 | 147.14 | 118.43 | |||||||||||||
| 2000 | 110.02 | 101.53 | 124.45 | 102.73 | |||||||||||||
| 2001 | 111.65 | 104.19 | 125.54 | 125.54 | |||||||||||||
| 2002 | 125.05 | 115.89 | 134.77 | 132.70 | |||||||||||||
2002 | |||||||||||||||||
| January | 130.93 | 134.64 | |||||||||||||||
| February | 132.26 | 134.77 | |||||||||||||||
| March | 127.07 | 133.46 | |||||||||||||||
| April | 128.13 | 133.40 | |||||||||||||||
| May | 123.08 | 128.66 | |||||||||||||||
| June | 119.38 | 125.64 | |||||||||||||||
For purposes of preparing our financial statements, we use rates obtained from the Tokyo foreign exchange market, which differ from the rates listed above.
B. Capitalization and indebtedness
Not applicable
C. Reasons for the offer and use of proceeds
Not applicable
D. Risk factors
This section describes some of the risks that could affect our business. The factors listed below should be considered in connection with any forward-looking statements given in this annual report and should be read in conjunction with “Item 5. Operating and Financial Review and Prospects.” They are subject to the Cautionary Statement with Respect to Forward-Looking Statements appearing elsewhere. This list is necessarily incomplete, as some risks may be as yet unknown to us. Any risk factor has the potential to adversely affect our business results, share price and financial condition.
7
Table of Contents
Economic conditions may adversely affect our business results and financial condition
Demand for consumer electronics products, which account for a significant proportion of our worldwide operating revenue, may be affected by general economic trends in the countries or regions in which our products are sold. Purchases of our products are, to a significant extent, discretionary. Similarly, demand for our business use products and for components we manufacture that go into products of third parties is affected by general economic trends in the various markets in which we sell our products. Economic downturns and resulting declines of demand in our major markets, including Japan, North America, Europe and Asia, may thus adversely affect our business results and financial condition.
Additionally, our operations may be indirectly affected by the economic conditions of regions where our competitors manufacture their products. For example, if a competitor enjoys lower local labor costs, it may be able to offer similar products at a lower price. As a result, our sales may be adversely affected. Also, a decrease in the value of the local currency in a region that produces parts and raw materials may lead to a decrease in production costs (on a yen or a U.S. dollar basis) not only to us but to other manufacturers, as well. Such a trend may in turn bring about vigorous export competition and price-cutting, both of which could adversely affect our business results and financial condition.
Fluctuations in foreign currency exchange rates may adversely affect our business results and financial condition
Our operations involve the global production and distribution of products. Revenue and expense items that are denominated in local currency, such as sales, expenses and assets in each region, are translated into yen in preparing our consolidated financial statements. Depending on the rate of exchange at the time of currency translation, the values of such items in yen may be affected, even if their value has not changed in their original currency. Generally, an appreciation of the yen against other currencies, particularly the yen against the U.S. dollar and the euro in which we make significant sales, has a negative effect on our business results. A depreciation of the yen against other currencies has the opposite effect.
An increase in the value of currencies in regions where we operate and produce may lead to an increase in the costs of manufacturing and procurement in those regions. Such an increase could accordingly adversely affect our profit margins and reduce our price competitiveness, thereby adversely affecting our business results. We engage in currency hedging transactions to attempt to minimize the negative effects of short-term fluctuations of foreign exchange rates among major currencies such as the U.S. dollar, euro and yen. However, as a result of mid-to-long-term exchange rate volatility, we cannot execute planned procurement, production, logistics, and sales activities with any certainty and, consequently, fluctuations in exchange rates may adversely affect our business results and financial condition.
If we are unable to innovate and to develop attractive new products, our future growth and profitability may be adversely affected
We derive a substantial portion of our revenues from sales of innovative new products. We expect that sales of our new products — currently including DVD-related products, plasma and organic electroluminescent (OEL) displays and car navigation systems — will continue to account for a substantial portion of our revenues, and we expect our future growth to rely primarily on the development and sale of innovative new products.
8
Table of Contents
While we believe that we are capable of continuing to develop innovative and attractive new products, the industry in which we operate is characterized by rapid changes, including technological changes. The process of developing and marketing new products is inherently complex and uncertain, and there are a number of risks, including the following:
| • | We cannot assure you that we will have adequate funding and resources necessary for investments in new products and technologies. | |
| • | We cannot assure you that our long-term investments and commitment of significant resources will result in successful new products or technologies. For example, we have invested substantial resources in the expansion of our production capacity at our Shizuoka plant to meet anticipated demand for plasma display panels, but such demand may not materialize. | |
| • | We cannot assure you that we can anticipate successfully the new products and technologies which will gain market acceptance and that such products can be successfully marketed. | |
| • | We cannot assure you that our newly developed products or technologies can be successfully protected as proprietary intellectual property rights. | |
| • | Our products may become obsolete due to rapid advancements in technology and changes in consumer preferences. |
Our failure to anticipate adequately changes in the industry and the market, and to develop attractive new products, including any of the risks described above, may reduce our future growth and profitability and may adversely affect our business results and financial condition.
Competition generally, and especially on price and standardization of products, may adversely affect our business results and financial condition
The electronics industry, including the audio, video and car electronics industry, is intensely competitive. We expect to face increased competition in the various product and geographic markets in which we operate. Our competitors include manufacturers and distributors, some of which have greater capital resources available for research, development, production and marketing. In addition, as new technology develops and as new electronics products gain increased market acceptance, it is possible that new competitors or alliances among existing competitors may emerge and rapidly acquire significant market share. While we believe we are a leading global manufacturer of advanced, high-quality and value-added electronics products, we cannot assure you that we will be able to compete effectively in the future. Pricing pressures or loss of potential customers resulting from our failure to compete effectively may adversely affect our business results and financial condition.
For example, competitors in the plasma display market may introduce alternative products at a lower price and in advance of our products. Moreover, due to standardization and the relative ease of imitation of products such as DVD players, competition from manufacturers in emerging markets may continue to intensify. Our research into the development of new products requires large costs that competitive imitators may not need to incur. In an aggressive price-cutting environment we may find it difficult to maintain or increase our market share or remain profitable against low-cost and low-budget competitors.
9
Table of Contents
Failure of our DVD-recorder format to gain broad market acceptance may adversely affect our business results and financial condition
Currently, there are a number of competing recording formats for digital versatile discs (DVDs): the DVD-RW format commercialized by us, Sony, Sharp and others, the DVD-RAM format commercialized by Matsushita, Hitachi, Toshiba and others, and the DVD+RW format commercialized by Philips and others. Each of the recording disc formats makes use of its own distinct technology and is generally incompatible with other formats.
The question of which format will prevail as the industry standard is not yet settled. Should the DVD-RW format fail to be accepted as thede facto industry standard, or otherwise to gain wide acceptance, our business results and financial condition would be adversely affected.
As a result of the expiration of patents relating to laser optical disc technologies, our royalty revenue is expected to decline substantially, starting in fiscal 2003
Our patent, license and other intellectual property rights make a significant contribution to our net income. Although less than 5% of our revenue is generated by our worldwide patents relating to laser optical disc technologies, these rights were responsible for between approximately 60%-80% of our operating income in the last three fiscal years. The legal protections afforded these rights have a limited duration under applicable laws, and the length of protection varies from country to country or region. Therefore, a significant portion of such patents will expire in Europe and Japan by the end of fiscal 2003. As a result, our royalty revenue is expected to decline substantially. While we are trying to develop new patents and acquire third party patent rights, we do not expect that the revenue, if any, from such new patents will be sufficient to offset the decrease in royalty revenue resulting from the expiration of our existing patents. Royalty revenue from patent licensing also depends to a material degree on the sales of patented products by our licensees, making it hard for us to predict actual royalty revenue amounts. For a discussion of our patent licensing business, see “Item 4.B. Business overview–Nature of operations.”
If we are unable to manage successfully the risks inherent in our international activities and our overseas expansion, our business results and financial condition could be adversely affected
A substantial portion of our manufacturing and marketing activity is conducted outside Japan, including in the United States, Europe, and in developing and emerging markets in Asia. There are a number of risks inherent in doing business in such overseas markets, including the following:
| • | Unexpected legal or regulatory changes | |
| • | Unfavorable political or economic factors | |
| • | Difficulties in recruiting and retaining personnel | |
| • | Less developed technological infrastructure, which can affect our production or other activities or result in lower customer acceptance of our products and services; and | |
| • | Potentially adverse tax consequences |
10
Table of Contents
In order to produce our products competitively and to reduce costs, we established new production facilities in the People’s Republic of China (China). We invested a total of ¥4 billion in fiscal 2002 to build production capacities for various products, including DVD-related components and car stereo products, in the Shanghai and Dongguan areas. In opening a new manufacturing facility, however, it typically takes time to achieve success in production. Therefore, there is no guarantee that cost savings as expected will be realized in the immediate term, if at all. Furthermore, we may experience difficulties in managing a production facility and entering into business arrangements in China in light of unexpected events, including political or legal changes, labor shortages or strikes or changes in economic conditions in China. Accordingly, such incidents could have an adverse impact on our business results and financial condition. For information on our China plants, see “Item 4.A. History and development of the Company–Principal capital expenditures, investments and divestitures.”
Our dependence on certain third-party manufacturers and suppliers for parts and components could adversely affect our business results and financial condition
While we strive to produce key components and parts internally, we are dependent on a number of outside manufacturers and suppliers. Third parties manufacture some of our most important components and parts, including semiconductors. Our arrangements with third-party manufacturers and suppliers are generally on a renewable short-term basis. While we have sought to assure supply where necessary through strategic alliances and other measures, we cannot assure you that we will not face shortages of key components from time to time. See “Item 4.B. Business overview–Raw materials and sources of supply” for a discussion of our outside manufacturers and suppliers. If we are forced to change contracts with such manufacturers and suppliers, this could result in a reduction in the availability of components and parts essential to us or in an increase of our costs. In addition, in periods of high demand for consumer electronics products and as components such as semiconductors are improved, producers of components and parts may not be able to produce enough components to satisfy our demand on a timely basis. Shortages of key components could result in increases in their prices, insufficient supply and quality control problems, and could adversely affect our business results and financial condition, as well as lead to strained relationships with our original equipment manufacturing (OEM) customers.
Our performance in the OEM business is substantially dependent on the performance of our customers’ business
We cater our OEM business to automobile manufacturers, electronics manufacturers, personal computer (PC) makers, the broadcasting industry and other large-scale businesses worldwide. The products we supply include car stereo products, DVD-R/RW drives, set-top boxes for cable-TV and digital satellite broadcast and OEL displays. Sales to business customers in these areas are significantly affected by the respective customers’ business results and by factors that are beyond our control. Further, price cutting to meet customer demands may cause a reduction in our profit margin. The under-performance of a customers’ business, the unexpected termination of contracts, changes in the purchasing practices of our OEM customers or aggressive price cutting to satisfy a large business customer’s demands may adversely affect our business results and financial condition.
11
Table of Contents
Because our products and technologies are dependent on the service of capable engineers and other key personnel, difficulty in recruiting and developing key personnel could have an adverse impact on our future growth, business results and financial condition
Our products and technologies are complex, and our future growth and success depend to a significant extent on the service of capable engineers and other key personnel, and hiring and training additional highly-skilled engineers and other competent personnel are important for our success.
Failure to recruit and develop key personnel may adversely affect our future growth, business results and financial condition. On the other hand, aggressive hiring of, among others, capable engineers who are experienced with the latest technology, may increase, sometimes substantially, both recruiting and actual labor costs. In addition, continued re-training of currently employed personnel, which may introduce higher costs, might also be necessary to maintain a superior level of innovation and technological advance. Such increased costs could have an adverse impact on our business results and financial condition.
Limits on intellectual property protection may make us vulnerable to competition from third parties that use our technology and expertise
While we have developed technology and expertise which differentiate our products from those of our competitors, some of our unique technology and expertise is either not fully capable of being protected by intellectual property rights or protected only to a limited extent pursuant to legal limitations in certain jurisdictions. Accordingly, we may be unable effectively to prevent third parties from using our intellectual property rights to produce products similar to ours. In addition, we may be unable to prevent third parties from developing technologies that are similar or superior to our technology, or from designing around or reverse engineering our patents and trade secrets. Moreover, our future products and technology might later be found to infringe upon a third party’s intellectual property rights.
Product defects resulting in a large-scale product recall or successful products liability claims against us could result in a significant cost or impact on our reputation and adversely affect our business results and financial condition
We manufacture various products at our plants worldwide in accordance with internationally accepted quality-control standards. We cannot be certain, however, that all of our products are defect-free and may not be recalled at some later date. Furthermore, although we maintain insurance against product liability claims, we cannot be certain that such insurance can adequately satisfy the liabilities ultimately incurred. In addition, insurance may not continue to be available on terms acceptable to us. A large-scale product recall or a successful products liability claim against us could result in significant costs or have a negative impact on our reputation, which may in turn lead to a decrease in sales, adversely affecting our business results and financial condition.
Failure in collaboration, tie-ups, and establishment of joint venture companies with third parties may adversely affect our business results and financial condition
In our technological development process, we carry out many activities with other companies in the forms of collaboration, technological tie-ups, or joint ventures to optimize management resources and utilize the synergy of combined technologies. We will continue to take a positive approach to exploiting these opportunities. If differences arise among the parties due to managerial, financial or other reasons, we may not enjoy the results of such effective development, and thereby our business results and financial condition may be adversely affected.
12
Table of Contents
Governmental regulation may limit our activities or increase our costs of operations
Various regulations by governments in countries in which we do business, such as required business/investment approvals, export regulations based on national security or other reasons and other export/import regulations, such as tariffs, apply to us. In addition, commercial, antitrust, patent, consumer, taxation, exchange control and environment/recycling laws and regulations also apply. If we are unable to comply with these regulations, they can serve to limit our activities. In addition, even if we are able to comply, these regulations could result in increased costs. Accordingly, these regulations could adversely affect our business results and financial condition. See “Item 4.B. Business overview–Governmental regulation” for a discussion of certain government regulations applicable to us.
Damages to our Shizuoka plant as a result of disasters, outages or similar events may significantly reduce our production capacity, and adversely affect our business results and financial condition
Our plasma display products are currently manufactured at our Shizuoka plant, and we are in the process of expanding our manufacturing lines at Shizuoka. We expect to continue to manufacture our plasma display panels there. Accordingly, our plasma display panel production capacity could be significantly reduced in the event of a major earthquake or other disruption of operations at the Shizuoka plant. We periodically carry out disaster prevention checks and facility maintenance at all of our facilities to minimize potential negative impact caused by disruptions on our manufacturing lines. We cannot assure you, however, that we can completely prevent or mitigate the effect of a disaster, outage or other disruption at our major facilities in Asia, including the Shizuoka plant.
Item 4. Information on the Company
A. History and development of the Company
History
Pioneer was incorporated under the Japanese Commercial Code as a joint stock company (Kabushiki Kaisha) in May 1947, with the name Fukuin Denki Kabushiki Kaisha, succeeding to the business founded in January 1938 by the late Mr. Nozomu Matsumoto. The present name, Pioneer Kabushiki Kaisha, was adopted in June 1961. Its English name was changed from “Pioneer Electronic Corporation” to “Pioneer Corporation” in June 1999.
Our business dates from January 1938 when we began the manufacture of audio speakers. In June 1955 we commenced the manufacture of audio amplifiers. During the 1960s, we expanded our line of products to include hi-fi stereo sets and components, hi-fi car stereos, as well as telephone-related equipment. Since the early 1960s we have established business offices and subsidiaries in and outside Japan to support our expanding manufacturing and sales activities. During the 1970s we expanded our business to include equipment related to cable-TV systems. Pioneer’s shares of common stock were listed on the Tokyo Stock Exchange and Osaka Securities Exchange in October 1961 and April 1968, respectively. In addition, Pioneer’s ADSs were listed on the New York Stock Exchange in December 1976.
In the 1980s, we began to expand our business base to include audio/video (AV) equipment. We started marketing laser disc (LD) players and LDs, and commenced our own music and video software business in Japan. Also, we introduced the world’s first car compact disc (CD) players. We also broadened our business base in commercial and industrial markets with such products as optical memory disc drives for use in computers, laser karaoke (sing-along) systems and multiscreen video systems.
13
Table of Contents
In the 1990s, we released to the Japanese consumer market the world’s first car navigation system incorporating the Global Positioning System (GPS). In addition, we introduced DVD players and thin-profile color plasma displays and began supplying digital direct-broadcast satellite (DBS) decoders to a European pay-TV company. Our other recent industry firsts include four-color OEL displays and DVD recorders.
In fiscal 2001, we started supplying to PC makers DVD-R/RW drives that can record up to seven times as much data as conventional CD-R/RW drives. In fiscal 2002, we introduced to the Japanese consumer market hard disk drive (HDD) car navigation systems with faster search and display of routes to designated destinations.
Registered office
Pioneer’s registered office is located at 4-1, Meguro 1-chome, Meguro-ku, Tokyo 153-8654, Japan. Its telephone number is 81-3-3494-1111.
Principal capital expenditures, investments and divestitures
Capital expenditures were paid for principally out of our internally generated working capital. See the table in “Item 3.A. Selected financial data” for figures. The facilities for production comprised those for OEL displays and DVD pickups, and plants and machinery for plasma displays. See the table in “Item 4.D. Property, plants and equipment,” of this annual report for a list of our principal plants.
In fiscal 2002, we installed a second manufacturing line for plasma displays at our plant in Shizuoka, Japan, enabling us to produce up to 150 thousand units a year. To meet potential demand for plasma displays, we plan to add another line there, which is expected to start operation in the fall of 2003, with an expected production of 100 thousand units annually.
To improve cost competitiveness and to reallocate a major portion of production to China, Pioneer established two production subsidiaries in China in fiscal 2001 and these plants began operation in the fall of 2001. We continue expanding parts procurement, designing products, and increasing the proportion of our production in China.
B. Business overview
Strategy
We aim to be a leading provider of advanced, high quality, value-added AV electronics products worldwide for consumer and business use. Our corporate philosophy is to “Move the Heart and Touch the Soul,” with products that are designed to bring joy and entertainment to everyday life.
To achieve our goals, we are pursuing the following strategies:
| • | Develop innovative, technologically-advanced products that meet and stimulate market demand | |
| • | Enhance our brand recognition and promote customer satisfaction | |
| • | Leverage our leadership position in the car electronics business | |
| • | Focus on our strategic products targeting global markets | |
| • | Adopt optimal production methods to maximize profitability |
14
Table of Contents
Develop innovative, technologically-advanced products that meet and stimulate market demand
We believe our core strength is our ability to innovate. Throughout our history, we have focused on the development of unique products, and have attempted to be the front-runner and market leader in our product areas. Such areas have included dynamic speakers, car audio, LD and car navigation systems. We intend to continue to take advantage of such strategy and gain consumer confidence by introducing differentiated products into the market ahead of our competitors.
Consistent with our strategy, we have recently introduced into the market several new products, such as plasma displays and digital broadcast set-top boxes. In the DVD market, we were the first to commercialize a DVD recorder. We were also the first to introduce a four-color OEL display to the market.
Enhance our brand recognition and promote customer satisfaction
The cornerstone of our business foundation lies in the quality of our products and consumers’ confidence in them. Accordingly, we focus on the enhancement of our brand image and customer satisfaction. In addition to the extensive quality control and assurance measures on the production side, we invest in various marketing campaigns to maintain and enhance the value of our brand. Combined with our new worldwide brand slogan of “sound. vision. soul,” we aim to establish Pioneer as a brand driven by innovation and clearly differentiating ourselves from our competitors. We believe customer satisfaction is based not only on reliability and technology, but also on the impact of the sound or vision delivered by our products.
Leverage our leadership position in the car electronics business
We believe one of our strengths lies in our core business segment, the car electronics business. We lead the world market for car audio products. We were the first in the industry to introduce car navigation systems to the Japanese consumer market in fiscal 1991 and have maintained a leading position by offering DVD-ROM type models. To strengthen this product line and lead the car navigation market, we introduced in Japan in June 2001 a new car navigation system incorporating a HDD, which features substantially faster access times than those of the existing DVD-ROM drive models, while in October 2001 we brought out affordably-priced and easy-to-operate DVD models.
Sales in this category are gradually shifting from the consumer market to the OEM market as automobile manufacturers place greater emphasis on differentiation of their cars, and we intend to expand our market share by increasing OEM sales.
Focus on our strategic products targeting global markets
We focus on our strategic products where we can secure the “first-mover advantage” or leadership. As part of our efforts to secure these positions, we play a major role in setting product standards. For example, we are promoting the DVD-RW format in DVD recorders and DVD-R/RW drives. This format has already gained support from other major consumer electronics companies such as Sony and Sharp. We also differentiate ourselves by introducing to targeted markets innovative plasma displays, OEL displays and HDD car navigation systems. We market these strategic products on a global basis. Although certain technological customization is required, most of our key products are currently sold in virtually all major economies in the world.
15
Table of Contents
Adopt optimal production methods to maximize profitability
We strive to adopt ideal production methods catered to each type of product and market demand. While we focus on reducing manufacturing and operating costs, our goal is to achieve overall efficiency in production by, for example, taking into account the proximity of the end-market, production facilities and labor costs. Consequently, to produce our strategic products we established two new plants in China and started production of DVD-related and car electronics products in fiscal 2002. We are continuing to expand parts procurement, design products, and increase the proportion of our production in China. Also, we are producing an increased volume of plasma displays in our expanded facility in Shizuoka, Japan. To enhance cost competitiveness and achieve economies of scale, we sell our key products on an OEM basis to other manufacturers. Additionally, we plan to introduce new inventory and production control systems to reduce inventories of the whole Pioneer group.
Strategic Focus—“Vision 2005”
Consistent with the strategies described above, in fiscal 1999 we announced “Vision 2005,” a medium term initiative as follows.
(i) To become a leader in the DVD industry
We believe the DVD format will become the dominant high-density, high-capacity medium for sound, video and data recording, storage and playback. As a leader in this field, we have introduced attractive models of consumer-use DVD recorders, DVD home theater systems, DVD car navigation systems as well as DVD-R/RW drives for PC use, that have a competitive edge in design, function and price, contributing to the expansion of the DVD market.
(ii) To establish a foundation for plasma and OEL displays
We believe large-screen plasma displays offer significant advantages over cathode ray tubes (CRTs). Among other advantages, plasma displays are thinner and lighter than CRTs. Thus, we expect that plasma display panels in the future will capture a substantial portion of the larger-screen TV market, in which currently CRTs and projection TVs are dominant. Since introducing the first plasma displays in fiscal 1998, we have established a solid presence both in consumer and commercial markets worldwide as a result of our excellent reputation for the large-screen high-resolution images of our plasma displays. To meet the expected rising demand, we expanded our production capacity in October 2001 by establishing a second line at our Shizuoka plant in Japan, and we plan to add another line there, which is expected to start operation in the fall of 2003.
OEL display is another type of display which we are promoting aggressively. In fiscal 1998, we became the first in the world to market car electronics products equipped with an OEL display, and in fiscal 2000 the first company to mass-produce four-color OEL displays. OELs are particularly well-suited for small size displays, and in fiscal 2001 we commenced deliveries of OEL displays for use in cellular phones of a major U.S. cellular phone maker. To strengthen our market position, Tohoku Pioneer Corporation, Pioneer’s majority-owned subsidiary, established a joint venture company, ELDis, Inc., in fiscal 2001 with Semiconductor Energy Laboratory Co., Ltd. and Sharp Corporation to develop and manufacture active-matrix full-color OEL displays.
16
Table of Contents
(iii) To develop and strengthen lines of network-related products
Our current approach is to develop network-related products drawing upon our strength as an AV manufacturer. We believe we have a competitive advantage in the interface function, where information is delivered to users. We believe we have an excellent brand image, as well as many years of experience in analog/digital cable-TV and digital broadcast markets through the sale of our set-top boxes. We are strengthening the synergy of digital home network-linkage of entertainment/information systems, such as AV components, DVD players, DVD recorders, plasma displays and set-top boxes.
(iv) To expand our key device business and develop our key technologies
To keep up with the accelerated pace of change in the electronics industry, it is important for us to promote key technologies and key devices, collaborating with third parties when beneficial. We believe such collaboration generates synergies that can create new advances in our key technologies and optimizes the use of our resources.
We believe that a producer of key devices is better able to develop and offer broader product differentiation and to influence the direction of market trends than a company that assembles products. Our strategically important key devices are DVD pickups, plasma display panel modules, speaker units, CD mechanisms for car manufacturers and OEL display panels for mobile phone companies.
Nature of operations
We develop, manufacture and sell electronics products such as audio, video and car electronics on a global scale, as well as plan, produce and distribute AV software. We are one of the leading innovators of differentiated DVD products and plasma displays. We also have the largest worldwide market share of car electronics products, such as car navigation systems.
Our principal production activities are carried out in Japan and Asia. Our products are generally sold under our own brand names, principally “Pioneer.” Our primary markets are Japan, North America, Europe and Asia. We sell our products to customers in consumer and business markets through sales offices in Japan, and through sales subsidiaries of Pioneer and independent distributors outside of Japan. In addition, on an OEM basis, we market certain products, such as car electronics products, DVD-R/RW drives and broadcast set-top boxes, to other companies.
17
Table of Contents
We classify our business groups into three segments: “Electronics,” “AV Software” and “Patent Licensing.” We further break down our “Electronics” segment into three product groups: “Audio/Video,” “Car Electronics” and “Others.” Operating revenue consists of net sales for both “Electronics” and “AV Software,” plus royalty revenue from “Patent Licensing.” (The consolidated financial statements included in this annual report and the financial information below are prepared in accordance with U.S. GAAP, except for segment data which is prepared in accordance with the regulations under the Securities and Exchange Law of Japan. The segment information pursuant to regulations in Japan is reported by reportable industrial segment, whereas segment information is required to be reported by reportable operating segment under U.S. GAAP.)
The profit margins in the “Patent Licensing” segment are substantially higher than those in the other two segments, since costs related to patent licensing are limited principally to amortization of patent rights and expenses for licensing activities.
The following table sets forth our operating revenue from unaffiliated customers by business segment for the respective periods indicated:
Operating Revenue from Unaffiliated Customers by Business Segments
(In millions of yen, except for percentage amounts)
| Year ended March 31 | |||||||||||||||||||||||||||||
| 2000 | 2001 | 2002 | |||||||||||||||||||||||||||
Electronics | |||||||||||||||||||||||||||||
| Audio/Video | |||||||||||||||||||||||||||||
| Domestic | ¥ | 56,482 | 9.2 | % | ¥ | 50,556 | 7.8 | % | ¥ | 51,177 | 7.6 | % | |||||||||||||||||
| Overseas | 133,547 | 21.7 | 140,583 | 21.7 | 144,541 | 21.6 | |||||||||||||||||||||||
| 190,029 | 30.9 | 191,139 | 29.5 | 195,718 | 29.2 | ||||||||||||||||||||||||
| Car Electronics | |||||||||||||||||||||||||||||
| Domestic | 82,353 | 13.3 | 89,891 | 13.9 | 96,115 | 14.4 | |||||||||||||||||||||||
| Overseas | 163,520 | 26.6 | 154,987 | 23.9 | 165,096 | 24.7 | |||||||||||||||||||||||
| 245,873 | 39.9 | 244,878 | 37.8 | 261,211 | 39.1 | ||||||||||||||||||||||||
| Others | |||||||||||||||||||||||||||||
| Domestic | 45,492 | 7.4 | 62,846 | 9.7 | 63,570 | 9.5 | |||||||||||||||||||||||
| Overseas | 67,343 | 10.9 | 87,766 | 13.6 | 86,976 | 13.0 | |||||||||||||||||||||||
| 112,835 | 18.3 | 150,612 | 23.3 | 150,546 | 22.5 | ||||||||||||||||||||||||
| Domestic | 184,327 | 29.9 | 203,293 | 31.4 | 210,862 | 31.5 | |||||||||||||||||||||||
| Overseas | 364,410 | 59.2 | 383,336 | 59.2 | 396,613 | 59.3 | |||||||||||||||||||||||
| Total | ¥ | 548,737 | 89.1 | % | ¥ | 586,629 | 90.6 | % | ¥ | 607,475 | 90.8 | % | |||||||||||||||||
AV Software | |||||||||||||||||||||||||||||
| Domestic | ¥ | 23,788 | 3.9 | % | ¥ | 27,690 | 4.3 | % | 31,560 | 4.7 | |||||||||||||||||||
| Overseas | 23,886 | 3.9 | 12,220 | 1.9 | 12,276 | 1.9 | |||||||||||||||||||||||
| Total | ¥ | 47,674 | 7.7 | % | ¥ | 39,910 | 6.2 | % | ¥ | 43,836 | 6.6 | % | |||||||||||||||||
Patent Licensing | ¥ | 19,460 | 3.2 | % | ¥ | 20,530 | 3.2 | % | ¥ | 17,588 | 2.6 | % | |||||||||||||||||
| Total Operating Revenue | ¥ | 615,871 | 100.0 | % | ¥ | 647,069 | 100.0 | % | ¥ | 668,899 | 100.0 | % | |||||||||||||||||
18
Table of Contents
Electronics
Audio/Video:
This group includes stereo systems, receivers, amplifiers, tuners, CD players, CD recorders, minidisc (MD) systems, cassette tape decks, speaker systems, DVD players, DVD recorders, laser disc (LD) players, online karaoke systems, plasma displays and projection TVs.
Sales by product for fiscal 2002 in the Audio/Video group are as follows: Plasma displays have rapidly grown mainly for home use, accounting for the largest sales in this group. DVD players and DVD recorders also contributed substantially to sales in this group. Sales of stereo systems accounted for a material portion of sales as well. Particularly in North America, both projection TVs and AV receivers accounted for a material portion of sales in this group.
We believe the traditional home audio markets of Japan, North America and Europe have matured and accordingly, price competition in these markets is strong. We do not expect the traditional home audio markets in these regions to grow substantially. We believe growth will come from new products, such as DVD-related products and plasma displays. JEITA (Japan Electronics and Information Technology Industry Association) forecasts an approximately 30% increase in consumer DVD player sales worldwide, from 29 million units in 2001 to 38 million in 2002. In our DVD business, we are shifting the emphasis from price-competitive DVD players to higher value-added DVD recorders and DVD home theater systems. In our plasma display business, we have launched new 50- and 43-inch models of high-definition displays in fiscal 2002 and we are promoting them vigorously in the worldwide market.
Car Electronics:
This group includes car stereos, car CD players, car MD players, car DVD players, car speakers and car navigation systems.
Sales by product for fiscal 2002 in the Car Electronics group are as follows: Car CD players accounted for the largest sales in this group. In Japan, our car navigation systems accounted for a material portion of sales in this group.
Both in Japan and outside Japan, sales in this group are generally made in the consumer market and to automobile manufacturers on an OEM basis for installation in new cars on production lines or as optional parts. Sales in this category are gradually shifting from the consumer market to the OEM market, as automobile manufacturers place greater emphasis on differentiation of their cars. Our strong brand recognition in both markets is helping us maintain our leading market share of car electronics products on a global basis. Especially in the field of car navigation systems, we launched in June 2001, HDD models which have substantially faster access times and have attractive and convenient features, such as their faster search and display of routes to designated destinations. Our affordable, easy-to-operate DVD models, which were launched in October 2001, have earned excellent reputations as well. In addition, car audio products incorporating a radio tuner for digital satellite broadcasting were well received. As we keep introducing innovative car electronics products, we will continue to seek to distinguish our products from our competitors.
19
Table of Contents
Others:
This group includes products primarily for business use, such as equipment for cable-TV systems, DVD-ROM drives, DVD-R/RW drives, factory automation systems, digital broadcast set-top boxes, OEL display panels and telephones for consumer use.
Sales by product for fiscal 2002 in this group are as follows: DVD-R/RW drives accounted for the largest sales in this group. Set-top boxes of cable-TV systems and digital broadcast, and DVD-ROM drives also accounted for a material portion of sales in this group. In Japan, factory automation systems such as for car-related systems, also contributed to sales.
Our computer peripheral sales are shifting from DVD-ROM to DVD-R/RW drives. In fiscal 2001, we began supplying DVD-R/RW drives to PC makers on an OEM basis. The DVD-R/RW drives can record both on a write-once blank DVD-R disc and a rewritable blank DVD-RW disc up to seven times as much data as that of a CD-R or CD-RW disc. In fiscal 2002, we launched a Pioneer-brand DVD-R/RW drive, the world’s first model that reads and writes data on all DVD-R, DVD-RW, CD-R and CD-RW discs.
AV Software
This segment includes the production, manufacture and sale of prerecorded DVDs, LDs, videocassettes, CDs and optical disc manufacturing systems.
Sales in this segment are substantially smaller than those of the Electronics segment. Characteristically, they show much volatility year to year, depending upon the presence or absence of hit movie and music titles. The main markets of this segment are Japan and North America. Sales analysis by product for fiscal 2002 in this segment is as follows: DVDs accounted for the largest sales in this category, due mainly to the expansion of the DVD player market, especially in Japan.
Patent Licensing
This segment includes the licensing of patents related primarily to laser optical disc technologies.
Most of the royalty revenue from this segment is obtained from patent, license and other intellectual property rights that are held by Discovision Associates, our wholly-owned U.S. partnership. These intellectual property rights expire over time, although the periods involved depend on the country or region. While continuing to research and develop new technologies, we also acquire patents held by third parties.
Royalty revenue from patent licensing of digital playback equipment, such as CD-ROM and CD-R drives, accounted for a substantial portion of revenue in this segment in fiscal 2002. In addition, patent licensing of digital discs contributed significantly to royalty revenue. As PC market sales slumped, our revenue from patent licensing was negatively affected in fiscal 2002.
Revenue from the Patent Licensing segment is substantially less than from our other segments, constituting less than 5% of operating revenue for fiscal 2002. However, contribution of this segment to our operating revenue is substantial compared to its contribution to our operating revenue constituting between approximately 60%-80% of our operating revenue in each of the last three fiscal years. A number of these patents in Europe and Japan will expire by the end of fiscal 2003, which will result in a substantial decrease in royalty revenue.
20
Table of Contents
Principal markets
The following table sets forth our operating revenue from unaffiliated customers by geographic market for the respective periods indicated:
Operating Revenue by Geographic Market
(In millions of yen, except for percentage amounts)
| Year ended March 31 | |||||||||||||||||||||||||
| 2000 | 2001 | 2002 | |||||||||||||||||||||||
| Japan | ¥ | 208,115 | 33.8 | % | ¥ | 230,983 | 35.7 | % | ¥ | 242,422 | 36.2 | % | |||||||||||||
| North America | 200,930 | 32.6 | 213,592 | 33.0 | 200,428 | 30.0 | |||||||||||||||||||
| Europe | 135,728 | 22.0 | 126,019 | 19.5 | 132,189 | 19.8 | |||||||||||||||||||
| Other Regions | 71,098 | 11.6 | 76,475 | 11.8 | 93,860 | 14.0 | |||||||||||||||||||
| Total | ¥ | 615,871 | 100.0 | % | ¥ | 647,069 | 100.0 | % | ¥ | 668,899 | 100.0 | % | |||||||||||||
| Note: | Operating revenue by geographic market represents revenue from unaffiliated customers, based on the geographic location of each unaffiliated customer. |
Seasonality
Global sales in the Electronics segment are seasonal. Sales for the third quarter (ending December 31) of each fiscal year are generally higher than those of other quarters of the same fiscal year, due to increased demand during the year-end holiday season. In Japan, sales of car electronics products generally increase in the summer months, due to increased car usage for summer vacations.
Marketing channels
We sell our products to a large number of retailers and distributors through our sales offices in Japan and through Pioneer’s sales subsidiaries and independent distributors outside Japan. In addition, we market certain products, such as car electronics products and DVD-R/RW drives, on an OEM basis to other manufacturers for resale under their own brand names. Our business is not dependent upon any particular customer or group of customers. Most of our sales are made from inventory rather than against customer orders. Our products generally are sold under our own brand names, principally “Pioneer.”
After-sales service
We maintain a policy of providing repair and other services in the countries where our products are sold. In Japan, after-sales service is provided through Pioneer’s wholly-owned service subsidiary, Pioneer Services Network Corporation (PSN), and authorized servicing companies. Pioneer established PSN in fiscal 2001 to enhance the efficiency of our operations for after-sales services and offer such services with higher quality. In countries where Pioneer’s subsidiaries are located, such as the United States and certain European countries, after-sales services are provided by such subsidiaries or through their authorized independent servicing companies. In other countries, such services are generally performed by our local distributors.
21
Table of Contents
In line with general industry practice, most of the products we sell to consumers are provided with a warranty for free repair work, generally for a period of one year from the date of purchase. Parts are kept available for after-sales service for a period ranging generally from two to eight years after discontinuation of production, depending on the characteristics of the parts.
Raw materials and sources of supply
We purchase a variety of raw materials and parts for use in the manufacture of our products. We generally maintain two or more suppliers to prevent a shortage of raw materials and parts. In accordance with corporate policy, however, we develop and manufacture certain key parts internally for our products, including plasma display panels, laser pickups and certain integrated circuits (ICs) and large-scale integrations (LSIs). We also purchase certain completed products, then sell them under our own brand names.
No single source accounted for more than 6% of total supply purchases in fiscal 2002. We have not experienced any material difficulties in obtaining raw materials, parts and products and believe that we will continue to be able to obtain them to meet our needs.
Semiconductors account for the largest percentage of parts purchased in fiscal 2002 (on a yen basis), representing approximately 40% of our total purchases. We purchase semiconductors from various suppliers, mainly pursuant to the terms of our basic supply agreement. Our basic supply agreement generally has a term of one year, with an automatic renewal clause. Where we do not have two or more suppliers, we seek longer term contracts or bulk purchases and place our order 3 to 4 months earlier than our usual practice to reduce the risk of being unable to obtain key parts. We purchase a portion (approximately 10%) of our semiconductor parts, which are custom-made for our needs in accordance with our designs and specifications, from STMicroelectronics N.V. While we do not currently have an alternative source for the type of semiconductors supplied by STMicroelectronics N.V., we have entered into a strategic alliance with STMicroelectronics N.V. to assure a stable source of supply.
We plan to increase the percentage of raw materials and parts we purchase through online network systems, including the Internet. We believe this will contribute to more timely manufacturing and a decrease in production costs.
Patents and licenses
We hold a variety of patents, including those relating to laser optical disc technology, in Japan and other countries, while we in turn are licensed to use a number of patents owned by third parties. We consider certain patents licensed from third parties to be important to our business. In particular, the patents licensed from Dolby Laboratories Licensing Corporation for such devices as noise reduction, with Koninklijke Philips Electronics N.V. for CD products and LD products, with Thomson Licensing S.A. for CD products and LD products and with MPEG LA, L.L.C. for digital video products are utilized in products accounting for a substantial portion of our net sales. Termination of such license agreements would have a material adverse effect on our business, although we have no reason to believe that such termination will occur.
22
Table of Contents
Competition
We believe that we compete successfully and that we have a strong position with respect to car electronics, plasma displays and DVD-related products. Our products, however, are exposed to intense competition in Japan and overseas. Our competitors, which vary in size, area of distribution, range of products and financial resources, are principally companies based in Japan and Europe, some of which are large, integrated home electric or electronic appliance manufacturers having substantially larger capital resources than we do. The electronics industry in general has been subject to substantial price competition in light of slower demand. In addition, electronics companies in Asia, particularly those from Korea and China, pose a severe threat through price competition with products possessing simplified functions at lower prices. To counter the intense competition, we place great emphasis on extensive marketing to stimulate demand of innovative and value-added products. Furthermore, we concentrate our efforts on technological research, quality control, sales promotion and the lowering of production costs by increasing procurement of parts and products made outside Japan and other measures. See also “Item 3.D. Risk factors-Competition generally, and especially on price and standardization of products, may adversely affect our business results and financial condition” and “Item 4.B. Business Overview-Strategy”
Import restrictions
In certain areas of the world, our products encounter tariff and other import restrictions. Tariffs applied to our products vary depending upon the classification of such products and the countries into which such products are imported. Import restrictions, such as prohibitions on imports of certain products, vary from nation to nation. To respond to this situation, we manufacture our products in certain locations outside Japan as well as commissioning their production to independent manufacturers.
Governmental regulation
Our business activities are subject to various governmental regulations in countries in which we operate, including regulations relating to business/investment approvals, export regulations including those related to national security considerations, tariffs, antitrust, intellectual property, consumer and business taxation, exchange controls, and environmental and recycling requirements.
23
Table of Contents
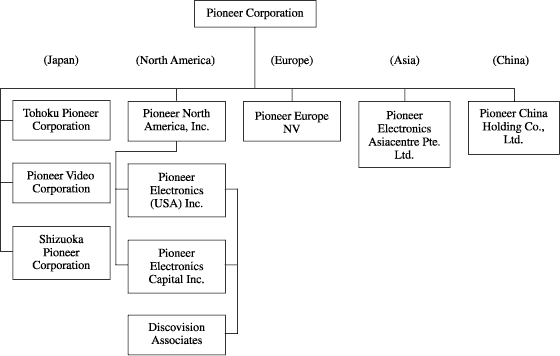
C. Organizational structure
Our basic corporate structure is shown in the following chart:
24
Table of Contents
The following table sets forth the principal subsidiaries owned, directly or indirectly, by Pioneer.
| Country of | Ownership | |||||
| Name of subsidiary | incorporation | interest | Principal business | |||
| Tohoku Pioneer Corporation | Japan | 67.0% | Manufacture of car electronics products and OEL display panels | |||
| Pioneer Video Corporation | Japan | 100.0% | Manufacture and distribution of optical discs, ICs and LSIs | |||
| Shizuoka Pioneer Corporation | Japan | 100.0% | Manufacture of displays | |||
| Pioneer North America, Inc. | U.S.A. | 100.0% | Coordination of the activities of Pioneer’s North American subsidiaries and affiliates | |||
| Pioneer Electronics (USA) Inc. | U.S.A. | 100.0% | Distribution of electronics products, and customer support of our products and strategic shared services of Pioneer’s U.S. subsidiaries | |||
| Pioneer Electronics Capital Inc. | U.S.A. | 100.0% | Financing to Pioneer and its subsidiaries | |||
| Discovision Associates* | U.S.A. | 100.0% | Licensing of worldwide patents relating to laser optical disc technologies | |||
| Pioneer Europe NV | Belgium | 100.0% | Coordination of the activities of Pioneer’s European subsidiaries and affiliates, and distribution of electronics products | |||
| Pioneer Electronics Asiacentre Pte. Ltd. | Singapore | 100.0% | Coordination of the activities of Pioneer’s Asian subsidiaries and affiliates, and manufacture and distribution of electronics products | |||
| Pioneer China Holding Co., Ltd. | China | 100.0% | Coordination of the activities of Pioneer’s Chinese subsidiaries and affiliates |
| * | Discovision Associates (DVA) is a general partnership organized under the laws of the State of California in the United States. |
25
Table of Contents
D. Property, plants and equipment
Our manufacturing operations are conducted principally in Japan, Southeast Asia and China. Of the total of 38 plants, 17 plants are in Japan and the remaining 21 are outside Japan. The following table sets forth information, as of March 31, 2002, with respect to our principal plants.
| Name of plant | Floor space | |||||
| (Name of company | (square feet) | |||||
| which owns the plant) | Location | [of which leased space] | Principal products | |||
| Japan | ||||||
| Shizuoka Plant (Shizuoka Pioneer Corporation) | Fukuroi, Shizuoka | 750,000 | Plasma displays, Projection TVs | |||
| Tendo Plant (Tohoku Pioneer Corporation) | Tendo, Yamagata | 495,000 | Cassette car stereos, Car CD/MD players, Car speakers, Loudspeakers | |||
| Tokorozawa Plant (Pioneer Corporation) | Tokorozawa, Saitama | 489,000 | Stereo systems, Individual stereo components, DVD players, DVD-R/RW drives, DVD recorders | |||
| Kawagoe Plant (Pioneer Corporation) | Kawagoe, Saitama | 414,000 | Cassette car stereos, Car CD/MD players, Car navigation systems | |||
| Kofu Plant (Pioneer Video Corporation) | Nakakoma, Yamanashi | 363,000 | DVDs, DVD-R/RW discs, CDs, Plasma display panels | |||
| Kokubo Plant (Pioneer Video Corporation) | Kofu, Yamanashi | 191,000 [77,000] | ICs, LSIs | |||
| Ohmori Plant (Pioneer Corporation) | Ohta, Tokyo | 170,000 | Equipment for cable-TV systems | |||
| Towada Plant (Towada Electronics Corporation) | Towada, Aomori | 158,000 | DVD players, DVD-R/RW drives, Cassette car stereos, Car CD players | |||
| Yonezawa Plant (Tohoku Pioneer Corporation) | Yonezawa, Yamagata | 151,000 | OEL displays, Car speakers, Car CD players | |||
| Tendo the 2nd Plant (Tohoku Pioneer Corporation) | Tendo, Yamagata | 139,000 | Factory automation systems |
26
Table of Contents
| Name of plant | Floor Space | |||||
| (Name of company | (square feet) | |||||
| which owns the plant) | Location | [of which leased space] | Principal products | |||
| Outside Japan | ||||||
| Mexico Plant (Pioneer Speakers, S.A. de C.V.) | Baja California, Mexico | 301,000 | Speaker systems | |||
| Thailand Plant (Pioneer Manufacturing (Thailand) Co., Ltd.) | Ayutthaya, Thailand | 300,000 | Cassette car stereos, Car CD players, Stereo systems | |||
| Taiwan Plant (Pioneer Electronic (Taiwan) Corp.) | Tao Yuan, Taiwan | 281,000 | Speaker systems | |||
| Malaysia Plant (Pioneer Technology (Malaysia) Sdn. Bhd.) | Johor, Malaysia | 262,000 | Stereo systems, CD players, Cassette car stereos, Car CD players | |||
| Shanghai Plant (Shanghai Pioneer Speakers Ltd.) | Shanghai, China | 255,000 | Speaker systems | |||
| Shanghai Plant (Pioneer Technology (Shanghai) Co., Ltd) | Shanghai, China | 233,000 | DVD players, Car tuners, Cassette car stereos | |||
| Guang Dong Plant (Dongguan Monetech Electronic Co., Ltd.) | Guang Dong, China | 231,000 [230,000] | Speaker systems | |||
| California Plant (Pioneer Electronics Technology, Inc.) | California, U.S.A. | 185,000 | Projection TVs, Speaker systems | |||
| U.K. Plant (Pioneer Technology (U.K.) Ltd.) | West Yorkshire, United Kingdom | 184,000 | Stereo systems, CD players, Tuners, Digital DBS decoders, | |||
| Guang Dong Plant (Pioneer Technology (Dongguan) Co., Ltd.) | Guang Dong, China | 182,000 | DVD-R/RW drives | |||
| Others (7 plants in Japan and 11 plants outside Japan) | 1,589,000 [52,000] | |||||
| Total | 7,323,000 [359,000] | |||||
27
Table of Contents
Most of the buildings of these plants and land on which they are located are owned by us.
As of March 31, 2002, we owned our headquarters buildings in Tokyo having an approximate aggregate floor space of 336,000 square feet. We lease approximately 34,000 square feet as additional head office space in Tokyo.
We also own an employee training center in Tokyo with an approximate floor space of 17,000 square feet, and R&D facilities with an approximate aggregate floor space of 288,000 square feet.
Our sales office buildings in Japan and outside Japan are mainly leased. The head office buildings of some distribution subsidiaries outside Japan are owned by us. Land and buildings for the Fukuroi Plant, the Ohio Plant, R&D facilities, and one of our headquarters buildings with an aggregate book value of ¥15,978 million were pledged as collateral for certain loans at March 31, 2002.
We believe that our properties are adequate to carry on our current business, though additional investment in plant and equipment is being made to ensure continued growth.
Item 5. Operating and Financial Review and Prospects
Critical accounting policies and estimates
The following analysis of financial condition and results of operations discusses our consolidated financial statements, which have been prepared in accordance with U.S. GAAP, except for segment data which is prepared in accordance with the regulations under the Securities and Exchange Law of Japan.
The preparation of the financial statements requires management to make estimates and assumptions that affect the reported amounts of assets and liabilities and the disclosure of contingent assets and liabilities at the date of the financial statements and the reported amounts of revenues and expenses during the reporting period. On an on-going basis, management evaluates its estimates and judgments, including those related to customer incentives, bad debts, inventories, investments, income taxes, financing operations, warranty obligations, retirement benefits, and contingencies and litigation. Management bases its estimates and judgments on historical experience and on various other factors that are believed to be reasonable under the circumstances, the results of which form the basis for making judgments about the carrying values of assets and liabilities that are not readily apparent from other sources. Actual results may differ from these estimates due to the inherent uncertainty involved in making estimates.
28
Table of Contents
We believe the following critical accounting policies, among others, affect our more significant judgments and estimates used in the preparation of our consolidated financial statements.
Revenue recognition
Allowances for doubtful accounts
Warranties
Inventories
Impairment of investments
Deferred tax assets
29
Table of Contents
Pension benefit costs
Overview
We classify our business groups into three segments: “Electronics,” “AV Software” and “Patent Licensing.” We further break down our “Electronics” segment into three product groups: Audio/Video, Car Electronics, and Others. “Electronics” is our largest segment by revenue, accounting for 90.8% of operating revenue (net sales plus royalty revenue) in fiscal 2002. In fiscal 2002, Audio/Video group, Car Electronics group and Others accounted for 29.2%, 39.1% and 22.5%, respectively, of operating revenue. The “AV Software” and “Patent Licensing” segments accounted for 6.6% and 2.6%, respectively, of operating revenue in fiscal 2002. Our primary markets for our products based on operating revenues from unaffiliated customers for fiscal 2002 were Japan (36%), North America (30%) and Europe (20%).
Electronics
The electronics industry is characterized by rapid technological changes, and our ability to introduce attractive new products to the market significantly affects the operating results of this segment. Sales of new products such as DVD players, plasma displays, car navigation systems, digital broadcast set-top boxes and DVD-R/RW drives for PC use have grown rapidly and in fiscal 2002 sales of such new products accounted for approximately 30% of our total sales. We will continue to concentrate our resources on these strategic products to expand sales even further.
The electronics industry is also characterized by continuing sales price decreases in most product categories, making it important for us to continually improve the efficiency of our manufacturing, distribution, service and administrative functions. As an example of our effort, in the past five years, we have increased the percentage of our manufacturing outside Japan from 48% to 62% in terms of the yen value of cost of goods produced, mainly by expanding production facilities in Southeast Asia and China.
AV Software
The AV software industry is very volatile and dependent upon the presence or absence of hit movie and music titles. Accordingly, its success in any years is very difficult to predict.
Patent Licensing
Our royalty revenue from Patent Licensing depends to a material extent on the sales of patented products by our licensees, making it difficult for us to predict actual royalty revenue each year. Therefore, sluggishness in the PC market negatively impacts our royalty revenue. In addition, a significant portion of our patents in Japan and Europe relating to laser optical disc technologies will expire by the end of fiscal 2003. Accordingly, we expect a substantial decrease in operating revenue and operating income from this segment. We are researching and developing new technologies, and we purchase patents held by third parties from time to time, which may generate additional revenue to help offset this expected decline. We do not, however, expect that the revenue, if any, from such new patents will be sufficient to offset the decrease in royalty revenue resulting from the expiration of our existing patents.
30
Table of Contents
A. Operating results
Fiscal 2002 compared with fiscal 2001
Summary
During fiscal 2002 which ended March 31, 2002, economic conditions continued to slow worldwide, with demand for Information Technology-related products weakening, a situation that was made worse by the terrorist attacks on September 11, 2001. As for foreign exchange markets, the average value of the yen during fiscal 2002 was approximately 12% lower against the U.S. dollar, and approximately 9% lower against the euro, compared to fiscal 2001. Despite these circumstances, operating revenue, the sum of net sales and royalty revenue, for fiscal 2002 reached an historic high, at ¥668.9 billion, up 3.4% from fiscal 2001. Operating income was ¥21.3 billion, a 37.1% decrease from ¥33.8 billion recorded in fiscal 2001, and net income came to ¥8.0 billion, down 56.0% from ¥18.3 billion posted in fiscal 2001.
Impact of foreign exchange fluctuations
Assuming yen exchange rates had remained unchanged from fiscal 2001, estimated operating revenue and operating income would have been lower by ¥43.5 billion and ¥14.4 billion, respectively. Such estimates are obtained by applying the yen’s average exchange rates in fiscal 2001 to foreign currency-denominated operating revenue, cost of sales and selling, general and administrative (“SGA”) expenses, and do not account for the effect of changes to sales prices implemented in accordance with foreign exchange fluctuations.
Net sales and royalty revenue
Net sales amounted to ¥651.3 billion, a 4.0% increase over fiscal 2001. Sales in Japan came to ¥242.4 billion, up 5.0% from fiscal 2001, and overseas net sales increased 3.4% to ¥408.9 billion.
Electronics segment sales increased 3.6% over fiscal 2001, amounting to ¥607.5 billion. Highlights of the segments results, by product group, are as follows:
| • | Audio/Video (AV) group sales were up 2.4% to ¥195.7 billion, primarily as a result of increased sales of plasma displays for home use, DVD recorders and DVD players. Plasma display sales grew 16% in terms of yen, and 43% in terms of units, which increased from 35 thousand to 50 thousand. In Japan, sales increased 1.2% to ¥51.2 billion, which is largely attributable to an increase in sales of plasma displays for home use and a rise in sales of DVD recorders. These increases more than offset a large decrease in compact stereo system sales. Overseas, sales increased by 2.8% to ¥144.5 billion primarily as a result of the yen’s depreciation and increased sales of plasma displays for home use and DVD home theater systems in North America and Europe. |
31
Table of Contents
| • | Car Electronics group sales grew 6.7% to ¥261.2 billion, mainly as a result of increased sales to consumer markets. In Japan, sales increased 6.9% to ¥96.1 billion, although car audio product sales to automobile manufacturers fell by approximately 10%. The increase is attributed to successful consumer market sales of advanced hard disk drive (HDD) and affordable, easy-to-operate DVD car navigation systems. Revenue from car navigation systems grew almost 80%. Overseas, sales also increased, rising by 6.5% to ¥165.1 billion, despite a drop in sales in Europe which was attributed to intensified competition. This net increase was primarily due to the impact of the yen’s depreciation and robust sales of certain products in North America. Most notably, car audio products that incorporate radio tuners for digital satellite broadcasting, which started in the U.S. in fiscal 2002, sold well. | ||
| • | Others sales in fiscal 2002 were comparable with fiscal 2001 at ¥150.5 billion. This was the net result of increased sales of DVD-R/RW drives both in Japan and overseas, which were offset by a decline in sales of cellular phones and digital cable-TV set-top boxes. In Japan, sales increased 1.2% to ¥63.6 billion as sales of DVD-R/RW drives to personal computer (PC) makers increased while sales of cellular phones declined. Overseas, fiscal 2002 sales were consistent with those for fiscal 2001 at ¥87.0 billion, reflecting the yen’s depreciation and a large increase in sales of DVD-R/RW drives to PC makers, which offset lower sales in North America of digital cable-TV set-top boxes and speaker devices for cellular phones. |
AV Software segment sales increased 9.8% from fiscal 2001 to ¥43.8 billion. Sales in Japan rose by 14.0% to ¥31.6 billion thanks to increased DVD software sales, while overseas sales were almost the same as for fiscal 2001 at ¥12.3 billion. In North America, DVD software sales rose, while animation videocassette sales dropped.
Royalty revenue from the Patent Licensing segment decreased 14.3% to ¥17.6 billion, compared to that of fiscal 2001. This decrease was attributable to a reduction in royalty revenue from digital playback/recording products such as CD-ROM and CD-R drives, as PC market sales slumped.
Cost of sales and selling, general and administrative expenses
Cost of sales increased to ¥465.3 billion from fiscal 2001’s ¥447.4 billion and cost of sales as a percentage of operating revenue also increased 0.5 percentage points to 69.6%. However, cost of sales as a percentage of net sales remained the same as in fiscal 2001 at 71.4%. The favorable effect of a weaker yen against the U.S. dollar and the euro on gross profit margin was offset by the unfavorable impact of declining product prices in our major product categories, including DVD players.
SGA expenses of ¥182.3 billion in fiscal 2002 increased by 9.9% or ¥16.4 billion over fiscal 2001. Advertising and sales promotion expenses increased as a result of vigorous marketing activities worldwide to promote the Pioneer brand name and our strategic products such as plasma displays. Royalty expenses related to digital technologies utilized in our products such as DVD products increased as well. Also, expenses incurred in connection with restructuring of some production sites and withdrawal from certain businesses facing unfavorable prospects account for a part of the increase in SGA expenses. For example, approximately ¥1.6 billion in costs were incurred in connection with the closure of the Hiwada plant in Japan, because of the transfer of production sites to China, for special voluntary termination benefits and other plant closure related expenses. In addition, personnel-related expenses increased as costs for pension plans in Japan and overseas increased. The increases in pension costs were mainly attributable to lower returns on pension plan assets both in Japan and overseas. The ratio of SGA expenses to operating revenue increased 1.7 percentage points to 27.3%.
32
Table of Contents
R&D expenditures, which are included in cost of sales and SGA expenses, increased 5.2% to ¥39.1 billion, representing 5.8% of operating revenue. The increase primarily reflected R&D activities in developing next-generation large-capacity optical disc system and new home network control system.
Operating income
Operating income for fiscal 2002 was ¥21.3 billion, a 37.1% decrease from ¥33.8 billion recorded in fiscal 2001. The decrease primarily reflected lower royalty revenue and increased SGA expenses as noted above. Operating income for the Electronics segment decreased to ¥2.7 billion from ¥13.8 billion, which was attributed to increased SGA expenses such as advertising and royalty expenses. The AV software segment posted ¥1.8 billion in operating income for fiscal 2002, compared with ¥0.1 billion income in fiscal 2001. This change primarily reflected increased sales of DVDs. In the Patent Licensing segment, operating income decreased to ¥16.8 billion from ¥19.7 billion, mainly due to a decline of royalty revenue from digital playback/recording products such as CD-ROM and CD-R drives, reflecting a sluggish PC market and declining unit prices.
Other income (expenses)
Other income, on a net basis, decreased from income of ¥0.4 billion in fiscal 2001 to a net expense of ¥5.9 billion in fiscal 2002. The net change was attributable to several factors. First, a ¥1.6 billion gain was realized on the sale of investment securities in fiscal 2001, while there was no material sale of investment securities in fiscal 2002. Second, an additional loss of ¥1.0 billion incurred on the write-down of investment securities, reflecting the sharp decline of stock prices experienced in Japan. Third, a net loss was realized in fiscal 2002 on the sale of fixed assets of ¥3.3 billion, whereas a similar net loss in fiscal 2001 amounted to ¥0.9 billion. The losses noted were offset by a net gain realized on foreign exchange of ¥0.3 billion, whereas the prior year experienced net losses from foreign exchange of ¥1.2 billion. The swing of the foreign exchange adjustments was due to a decrease in losses related to derivative financial instruments. Although we utilize derivative financial instruments to minimize foreign currency risk, none of these derivatives have been designated as hedging instruments under SFAS No.133 at March 31, 2002. Therefore, unrealized gains and losses on such instruments are recognized currently in earnings as a part of foreign exchange gain (loss). Lastly, we incurred net interest (interest income, less interest expense) expense of ¥0.4 billion in fiscal 2002 as compared with net interest income of ¥0.6 billion in fiscal 2001. This change to net interest expense was attributed to declining interest rates in the U.S. financial market.
Income before income taxes
Income before income taxes for fiscal 2002 decreased 55.1% to ¥15.3 billion from ¥34.2 billion for fiscal 2001, as a result of the above factors.
Income taxes
Income taxes as a percentage of pre-tax income (the effective tax rate) was 43.8%, as compared to 41.9% in fiscal 2001. The normal statutory tax rate in Japan is 42.0%.
Minority interest in income of subsidiaries
Minority interest in income of subsidiaries, which primarily consists of the earnings of Tohoku Pioneer Corporation and its subsidiaries attributable to its minority shareholders, amounted to ¥0.5 billion compared with ¥1.4 billion in fiscal 2001.
33
Table of Contents
Equity in earnings (losses) of affiliated companies
Equity in earnings (losses) of affiliated companies for fiscal 2002 resulted in a loss of ¥0.1 billion, substantially unchanged from fiscal 2001.
Net income
Net income for fiscal 2002 was ¥8.0 billion, a 56.0% decrease from fiscal 2001 net income of ¥18.3 billion. Basic net income per share of common stock was ¥44.70, compared with fiscal 2001’s ¥101.76. Diluted net income per share was ¥44.69 compared with fiscal 2001’s ¥101.70.
Fiscal 2001 compared with fiscal 2000
Summary
In the first half of fiscal 2001 ended March 31, 2001, economic conditions in the U.S. and Europe were generally favorable while conditions in Japan were sluggish. In the second half of fiscal 2001, the U.S. economy began to weaken and subsequently conditions in Europe and Japan also deteriorated. As for foreign exchange markets, the average value of the yen during fiscal 2001 was 1% higher against the U.S. dollar and 15% higher against the euro, when compared to levels of fiscal 2000. Despite such economic conditions, we recorded our highest-ever operating revenue at ¥647.1 billion, up 5.1% from fiscal 2000. Operating income was ¥33.8 billion, a 43.3% increase over the ¥23.6 billion recorded in fiscal 2000, while net income amounted to ¥18.3 billion compared to ¥13.1 billion posted in fiscal 2000, a 39.9% increase.
Impact of foreign exchange fluctuations
The stronger yen against the euro had a negative impact on our operating performance. We estimate that operating revenue and operating income would have been approximately ¥20.4 billion and ¥6.0 billion higher, respectively, if exchange rates had remained unchanged from fiscal 2000. Such estimates are obtained by simply applying the yen’s average exchange rates in fiscal 2000 to foreign currency denominated operating revenue, cost of sales and SGA expenses, and do not include the effect of changes to sales prices implemented to meet the foreign exchange fluctuations.
Net sales and royalty revenue
Net sales amounted to ¥626.5 billion, a 5.1% increase over fiscal 2000. Net sales in Japan rose 11.0% to ¥231.0 billion. Overseas net sales, despite the higher value of the yen against the euro particularly in the first half of fiscal 2001, increased 1.9% to ¥395.6 billion. On a local currency basis, overseas sales increased 7.2% from fiscal 2000.
34
Table of Contents
Electronics segment sales amounted to ¥586.6 billion, up 6.9% from fiscal 2000.
| • | Audio/Video group sales of ¥191.1 billion remained substantially unchanged from fiscal 2000. Such sales reflect primarily a worldwide increase in sales of plasma displays, especially for business markets, and DVD players, offset by reduced sales of stereo systems. Plasma display sales grew by more than 70% in terms of both units and revenue. Sales of DVD players by units increased by more than 40% although revenue growth was more moderate because of declining sales prices. In Japan, Audio/Video group sales dropped 10.5% to ¥50.6 billion, mainly due to decreased sales of compact stereo systems, although sales of plasma displays increased greatly in both the consumer and business markets. Overseas sales rose 5.3% to ¥140.6 billion, mainly due to increased sales of DVD players and plasma displays, though sales in Europe were adversely affected by the weakness of the euro. | ||
| • | Car Electronics group sales amounted to ¥244.9 billion, substantially the same as in fiscal 2000. Although sales to car manufacturers increased, sales of car audio products to consumer markets decreased. Sales in Japan increased 9.2% to ¥89.9 billion primarily due to increased sales of car audio products to car manufacturers. Sales to the consumer market in Japan slightly decreased although sales of car MD/CD players and car navigation systems increased. Overseas sales decreased 5.2% from fiscal 2000 to ¥155.0 billion. While sales of car audio products to car manufacturers increased, particularly in North America, sales of car audio products to the consumer market decreased. This decrease reflected a sharp decline in Europe due to intensified competition and the influence of the weakened euro. Sales in Asia outside of Japan and in Central America and South America increased from fiscal 2000. | ||
| • | Others sales rose 33.5% over fiscal 2000 to ¥150.6 billion. The sales growth of digital cable-TV set-top boxes, digital broadcast set-top boxes and factory automation systems contributed to the increase, but sales of CD-ROM drives decreased as we withdrew from the CD-ROM drive market and shifted to DVD-ROM drives. In Japan, sales climbed by 38.1% to ¥62.8 billion, reflecting increased sales of factory automation systems, cable-TV set-top boxes and DVD-ROM drives. Overseas sales were up 30.3% from fiscal 2000 to ¥87.8 billion. Sales of digital cable-TV set-top boxes in North America increased, as did sales of digital broadcast set-top boxes in Europe. |
AV Software segment sales fell 16.3% from fiscal 2000 to ¥39.9 billion. Sales in Japan increased 16.4% over fiscal 2000 to ¥27.7 billion due to good sales of DVD software such as the hit movieU-571. However, overseas sales declined by 48.8% to ¥12.2 billion. This decline was due to a large decline in sales of animation videocassettes in North America, caused by a lack of big hits such as fiscal 2000’sPokémonseries. A decline in sales of optical disc manufacturing systems in Asia accounted for the decrease, as well.
Royalty revenue from the Patent Licensing segment increased 5.5% to ¥20.5 billion from ¥19.5 billion in fiscal 2000, due mainly to a rise in royalties related to recording equipment such as CD-R/RW drives. A successful negotiation with customers for a lump-sum settlement of past period royalties also contributed to the increase. Without the lump-sum settlement, revenue would have decreased approximately 6% from fiscal 2000 to ¥18.4 billion.
35
Table of Contents
Cost of sales and selling, general and administrative expenses
Cost of sales increased to ¥447.4 billion from fiscal 2000’s ¥428.6 billion. However, as a percentage of operating revenue, cost of sales decreased 0.5 percentage points to 69.1%, despite the adverse effect of the stronger yen, particularly against the euro in the first half of fiscal 2001. The improved gross profit margin resulted partly from successful cost reductions in strategic products such as plasma displays and DVD products. Also, the favorable effects of the measures taken in fiscal 2000 to improve profitability, such as cost reduction realized through reorganization of production activity in the software business, shutting down LD plants in fiscal 2000, contributed to the improved gross profit margin.
SGA expenses increased by 1.3% or ¥2.2 billion over fiscal 2000 to ¥165.9 billion. However, the ratio of SGA expenses to operating revenue decreased 1.0 percentage point to 25.6%. Personnel-related expenses and sales promotion expenses increased, as did royalty expenses relating to DVD technologies. On the other hand, the stronger yen reduced the expenses of overseas subsidiaries in yen terms by approximately ¥4.0 billion. We recorded a ¥1.2 billion impairment loss in certain intangible assets related to the karaoke business, in addition to a ¥1.9 billion impairment loss recorded in fiscal 2000.
R&D expenditures, which are included in cost of sales and SGA expenses, increased 11.5% to ¥37.1 billion, representing 5.7% of operating revenue. The increase primarily reflected increased activity in developing third-generation plasma displays.
Operating income
Operating income was ¥33.8 billion — a 43.3% increase over the ¥23.6 billion recorded in fiscal 2000 — resulting from increased operating revenue and an improved gross profit margin. Operating income for the Electronics segment almost tripled to ¥13.8 billion, reflecting a substantial sales increase and improved gross profit margin mainly for strategic products such as plasma displays and DVD products. The AV Software segment posted ¥0.1 billion in operating income, almost the same as fiscal 2000’s ¥0.2 billion. A large decline in sales of animation videocassettes in North America was offset by increased sales of DVD software in Japan. Furthermore, in fiscal 2001, we did not have the expenses incurred in fiscal 2000 in connection with the closing of an LD plant in Japan. In the Patent Licensing segment, operating income increased 7.1% to ¥19.7 billion, due mainly to an increase in royalty revenue.
Other income (expenses)
Other income, on a net basis, decreased from ¥4.2 billion to ¥0.4 billion. This decrease was primarily due to a ¥12.5 billion gain recorded in fiscal 2000 in connection with the initial public offering of Pioneer’s subsidiary, Tohoku Pioneer Corporation, in March 2000. Gains on the sale of marketable equity securities and other investments also decreased to ¥1.6 billion from fiscal 2000’s ¥4.8 billion. Foreign exchange losses decreased by ¥3.9 billion, from ¥5.1 billion to ¥1.2 billion, reflecting a decrease, when compared to fiscal 2000, in exchange losses resulting from depreciation of the euro. Losses on the sale and impairment of fixed assets also decreased by ¥3.8 billion, from ¥4.7 billion to ¥0.9 billion. The losses in fiscal 2000 included losses recognized on the write-down of the real property for a closed LD plant in Japan, the sale of a laser optical disc manufacturing plant in the U.S. and disposal of facilities resulting from the downsizing of the karaoke business. The balance of interest income, less interest expense (net interest) improved to an income of ¥0.6 billion from an expense of ¥1.6 billion, mainly due to an increase in interest income as a result of an increase in the average balance of cash available for short-term investment.
36
Table of Contents
Income before income taxes
Income before income taxes rose to ¥34.2 billion, a 23.0% increase compared with ¥27.8 billion for fiscal 2000.
Income taxes
Income tax as a percentage of pre-tax income (the effective tax rate) declined from 54.7% in fiscal 2000 to 41.9% in fiscal 2001, almost the same level as the normal statutory tax rate of 42.0% in Japan. This decline was mainly due to increased profits of subsidiaries in the U.S. and Southeast Asian countries, where statutory income tax rates are relatively low. Also, the improved profit-and-loss of certain subsidiaries in Japan and Europe, which had operating loss carryforwards, helped the effective tax rate to decline. Some of the subsidiaries were benefited by the utilization of operating loss carryforwards.
Minority interest in income of subsidiaries
Minority interest in income of subsidiaries for fiscal 2001 primarily consists of the earnings of Tohoku Pioneer Corporation, attributable to its minority shareholders, and amounted to ¥1.4 billion, compared with less than ¥0.1 billion in fiscal 2000.
Equity in earnings (losses) of affiliated companies
Equity in earnings (losses) of affiliated companies registered a loss of ¥0.1 billion, compared with a gain of ¥0.5 billion for fiscal 2000.
Net income
Net income was ¥18.3 billion, a 39.9% increase over fiscal 2000’s ¥13.1 billion. Basic net income per share of common stock was ¥101.76, compared with fiscal 2000’s ¥72.81. Diluted net income per share was ¥101.70, compared with fiscal 2000’s ¥72.80.
37
Table of Contents
Segment Information
The following segment information is prepared pursuant to the regulations under the Securities and Exchange Law of Japan and is not in accordance with U.S. GAAP.
Business Segments
| Millions of yen | |||||||||||||||||||||||
| Year ended March 31, 2002 | |||||||||||||||||||||||
| Corporate and | |||||||||||||||||||||||
| Electronics | AV software | Patent Licensing | Eliminations | Consolidated | |||||||||||||||||||
| Operating revenue: | |||||||||||||||||||||||
| Unaffiliated customers | ¥ | 607,475 | ¥ | 43,836 | ¥ | 17,588 | — | ¥ | 668,899 | ||||||||||||||
| Inter-segment | 847 | 5,189 | 2,208 | (¥ | 8,244 | ) | — | ||||||||||||||||
| Total | ¥ | 608,322 | ¥ | 49,025 | ¥ | 19,796 | (¥ | 8,244 | ) | ¥ | 668,899 | ||||||||||||
| Operating income | ¥ | 2,663 | ¥ | 1,839 | ¥ | 16,837 | (¥ | 58 | ) | ¥ | 21,281 | ||||||||||||
| Identifiable assets | ¥ | 497,387 | ¥ | 31,665 | ¥ | 2,959 | ¥ | 113,118 | ¥ | 645,129 | |||||||||||||
| Depreciation and amortization | ¥ | 32,746 | ¥ | 3,617 | ¥ | 419 | — | ¥ | 36,782 | ||||||||||||||
| Capital expenditures (additions to fixed assets) | ¥ | 43,308 | ¥ | 3,702 | ¥ | 58 | — | ¥ | 47,068 | ||||||||||||||
| Millions of yen | |||||||||||||||||||||||
| Year ended March 31, 2001 | |||||||||||||||||||||||
| Corporate and | |||||||||||||||||||||||
| Electronics | AV software | Patent Licensing | Eliminations | Consolidated | |||||||||||||||||||
| Operating revenue: | |||||||||||||||||||||||
| Unaffiliated customers | ¥ | 586,629 | ¥ | 39,910 | ¥ | 20,530 | — | ¥ | 647,069 | ||||||||||||||
| Inter-segment | 723 | 4,776 | 1,883 | (¥ | 7,382 | ) | — | ||||||||||||||||
| Total | ¥ | 587,352 | ¥ | 44,686 | ¥ | 22,413 | (¥ | 7,382 | ) | ¥ | 647,069 | ||||||||||||
| Operating income | ¥ | 13,831 | ¥ | 125 | ¥ | 19,734 | ¥ | 129 | ¥ | 33,819 | |||||||||||||
| Identifiable assets | ¥ | 444,742 | ¥ | 36,175 | ¥ | 5,926 | ¥ | 118,313 | ¥ | 605,156 | |||||||||||||
| Depreciation and amortization | ¥ | 28,867 | ¥ | 3,002 | ¥ | 536 | — | ¥ | 32,405 | ||||||||||||||
| Capital expenditures (additions to fixed assets) | ¥ | 37,720 | ¥ | 5,125 | ¥ | 26 | — | ¥ | 42,871 | ||||||||||||||
| Note: | “Electronics” includes the manufacture and sale of AV (audio/video) equipment for consumer and commercial use, such as stereo systems, DVD players, DVD recorders, plasma displays and car electronics products. | |
| “AV Software” includes the production, manufacture and sales of DVDs, laser discs, compact discs and other AV media. | ||
| “Patent Licensing” includes the licensing of patents related to optical disc technology. |
38
Table of Contents
Geographic Segments
| Millions of yen | |||||||||||||||||||||||||||
| Year ended March 31, 2002 | |||||||||||||||||||||||||||
| Corporate and | |||||||||||||||||||||||||||
| Japan | North America | Europe | Other Regions | Eliminations | Consolidated | ||||||||||||||||||||||
| Operating revenue: | |||||||||||||||||||||||||||
| Unaffiliated customers | ¥ | 255,352 | ¥ | 199,059 | ¥ | 131,925 | ¥ | 82,563 | — | ¥ | 668,899 | ||||||||||||||||
| Inter-area | 266,487 | 7,403 | 416 | 157,780 | (¥ | 432,086 | ) | — | |||||||||||||||||||
| Total | ¥ | 521,839 | ¥ | 206,462 | ¥ | 132,341 | ¥ | 240,343 | (¥ | 432,086 | ) | ¥ | 668,899 | ||||||||||||||
| Operating income (loss) | ¥ | 5,713 | ¥ | 11,266 | (¥ | 122 | ) | ¥ | 6,323 | (¥ | 1,899 | ) | ¥ | 21,281 | |||||||||||||
| Identifiable assets | ¥ | 292,740 | ¥ | 127,963 | ¥ | 59,357 | ¥ | 97,006 | ¥ | 68,063 | ¥ | 645,129 | |||||||||||||||
| Depreciation and amortization | ¥ | 25,108 | ¥ | 3,115 | ¥ | 2,262 | ¥ | 6,297 | — | ¥ | 36,782 | ||||||||||||||||
| Capital expenditures (additions to fixed assets) | ¥ | 31,049 | ¥ | 2,164 | ¥ | 1,428 | ¥ | 12,427 | — | ¥ | 47,068 | ||||||||||||||||
| Millions of yen | |||||||||||||||||||||||||||
| Year ended March 31, 2001 | |||||||||||||||||||||||||||
| Corporate and | |||||||||||||||||||||||||||
| Japan | North America | Europe | Other Regions | Eliminations | Consolidated | ||||||||||||||||||||||
| Operating revenue: | |||||||||||||||||||||||||||
| Unaffiliated customers | ¥ | 242,900 | ¥ | 210,886 | ¥ | 125,806 | ¥ | 67,477 | — | ¥ | 647,069 | ||||||||||||||||
| Inter-area | 257,733 | 5,726 | 129 | 130,425 | (¥ | 394,013 | ) | — | |||||||||||||||||||
| Total | ¥ | 500,633 | ¥ | 216,612 | ¥ | 125,935 | ¥ | 197,902 | (¥ | 394,013 | ) | ¥ | 647,069 | ||||||||||||||
| Operating income (loss) | ¥ | 6,551 | ¥ | 20,285 | (¥ | 1,626 | ) | ¥ | 5,644 | ¥ | 2,965 | ¥ | 33,819 | ||||||||||||||
| Identifiable assets | ¥ | 271,232 | ¥ | 118,005 | ¥ | 61,487 | ¥ | 71,808 | ¥ | 82,624 | ¥ | 605,156 | |||||||||||||||
| Depreciation and amortization | ¥ | 22,603 | ¥ | 2,716 | ¥ | 2,403 | ¥ | 4,683 | — | ¥ | 32,405 | ||||||||||||||||
| Capital expenditures (additions to fixed assets) | ¥ | 29,628 | ¥ | 3,345 | ¥ | 1,481 | ¥ | 8,417 | — | ¥ | 42,871 | ||||||||||||||||
Note: Operating revenue reported in geographic segment information above represents that of the parent company and subsidiaries in
Japan, and each subsidiary in North America, Europe, and Other Regions.
39
Table of Contents
B. Liquidity and capital resources
Cash Flows
Fiscal 2002 compared with fiscal 2001
Net cash provided by operating activities was ¥57.1 billion, a ¥5.9 billion increase compared to fiscal 2001, despite a decrease in net income. This increase mainly reflected changes in operating assets and liabilities. Trade payables increased as a result of increased purchase of materials particularly for DVD-R/RW drives and car navigation systems, although overall inventory decreased. The decrease reflected our continued efforts to control and reduce inventory levels. Increased notes and accounts receivable reflected strong sales in the last few months of fiscal 2002, compared to the equivalent period of fiscal 2001.
Net cash used in investing activities was ¥51.1 billion for fiscal 2002, a ¥9.6 billion increase compared to fiscal 2001. The difference was partly the result of an increase in payments made in acquiring fixed assets, reflecting investments to complete the expansion of plasma display production facilities and two new plants in China. The remainder of the increase is primarily attributable to decreased proceeds from the sale of fixed assets and available-for-sale securities.
Net cash used in financing activities was ¥4.2 billion in fiscal 2002, compared with ¥46.6 billion used in fiscal 2001. The significant decrease is primarily attributable to the redemption of ¥30.0 billion in unsecured bonds, which matured in 2001, and the reduction of other short-term and long-term borrowings.
As a result of these activities and the effect of exchange rate changes on cash and cash equivalents of overseas subsidiaries, cash and cash equivalents increased by ¥6.0 billion to ¥127.1 billion at the end of fiscal 2002, from ¥121.1 billion at the end of fiscal 2001.
Fiscal 2001 compared with fiscal 2000
Net cash provided by operating activities was ¥51.2 billion, a ¥5.9 billion increase compared to fiscal 2000. The increase was principally due to our overall improved profitability. Net income increased despite the absence of a ¥12.5 billion gain on sale and issuance of subsidiary stock realized in fiscal 2000. Increases in notes and accounts receivable were largely offset by a decrease in inventories in fiscal 2001. Increase in notes and accounts receivable reflected strong sales in the last few months of fiscal 2001 in comparison with the equivalent period of fiscal 2000. The decrease in inventories was the result of our efforts to control and reduce inventories.
Net cash used in investing activities was ¥41.6 billion in fiscal 2001, compared to ¥12.0 billion in cash generated in fiscal 2000. A substantial part of the difference was the receipt in fiscal 2000 of ¥28.8 billion in proceeds from the sale and issuance of subsidiary stock. Also, payment for purchase of fixed assets increased, reflecting investment in plasma display production facilities and expansion of production capacity in China. In addition, payment for investment securities was ¥5.8 billion, compared with ¥0.5 billion for fiscal 2000, and primarily consists of investment of ¥4.5 billion in a joint venture company for manufacturing and marketing thin-film transistor substrates in active-matrix OEL displays. The result was also affected due to a decrease of ¥4.4 billion in proceeds from the sale of available-for-sale securities.
40
Table of Contents
Net cash used in financing activities was ¥46.6 billion in fiscal 2001, compared with ¥4.1 billion cash used in fiscal 2000. Financing activities for fiscal 2001 included redemption of ¥30.0 billion in unsecured bonds at maturity and reduction of other short-term and long-term borrowings.
As a result, cash and cash equivalents decreased by ¥30.7 billion to ¥121.1 billion at the end of fiscal 2001 from ¥151.8 billion at the end of fiscal 2000, although the weaker yen increased cash and cash equivalents of overseas subsidiaries in terms of yen by ¥6.2 billion.
Capital requirements
Our requirements for operating capital primarily are for the purchase of raw materials and parts for use in the manufacture of our products. Also, operating expenses, including manufacturing expenses and SGA expenses require a substantial amount of operating capital. Payroll and payroll-benefits, and marketing expenses, such as those incurred for advertising and sales promotion, account for a significant portion of operating expenses. Our expenditure for R&D is recorded as a part of various operating expenses, and payroll for R&D-related personnel accounts for a material portion of R&D expenses.
Purchase commitments outstanding as of March 31, 2002 for property, plant and equipment and advertising were ¥2.9 billion. This amount includes part of ¥40 billion in capital expenditure planned for fiscal 2003, primarily for production facilities and production molds. In July 2002, we announced a plan to expand production capacity for plasma display panels further. This plan will require additional ¥5 billion for capital expenditure in fiscal 2003 and ¥11 billion in fiscal 2004.
As for other contractual capital requirements, long-term debt maturing during fiscal 2003 is ¥2.6 billion, which is significantly less than ¥7.6 billion paid for long-term debt in fiscal 2002. The net minimum rental payment under outstanding noncancelable operating leases is ¥3.5 billion.
Financial Management
At present, funds required for operating capital and capital expenditure are financed through cash generated through operation or debt financing. With regard to debt financing, short-term debt financing, with a maturity of one year or less, is utilized to fund operating capital requirements. Therefore, in principle, such short-term borrowing is arranged locally in the currency in which each consolidated company carries out its operation. As of March 31, 2002, short-term borrowings of ¥45.9 billion comprised bank loans in 10 different currencies, principally Japanese yen and euro. On the other hand, long-term borrowing to finance long-term funding requirements such as investment in production facilities is, in principle, arranged in Japan on a fixed interest rate basis. As of March 31, 2002, substantially all of the long-term debt of ¥38.2 billion, including the portion due within one year, was fixed rate yen borrowings and was comprised of ¥12.3 billion loans principally from banks, ¥15.0 billion unsecured bonds due 2005, ¥10.0 billion unsecured bonds due 2008, and capital lease obligations and other loans arranged locally.
We believe that our sound financial position and ability to generate positive operating cash flows, together with an unused credit line of ¥228.1 billion, provide sufficient resources to fund future requirements for operating capital and for capital expenditures to sustain the growth of Pioneer.
41
Table of Contents
C. Research and development, patents and licenses, etc.
Our R&D activities have played a crucial role in the development of our business. Our R&D program currently centers on optical recording/playback, flat-panel displays, digital signal processing, information/communications, and core LSIs. In fiscal 2000, 2001 and 2002, our R&D expenses were ¥33,265 million, ¥37,105 million and ¥39,050 million, respectively, or 5.4%, 5.7% and 5.8%, respectively of our operating revenue. We plan to continue to spend more than 5% of operating revenue on R&D each year.
As at March 31, 2002, approximately 3,500 employees worldwide were engaged in R&D and product and production technique improvement.
Our R&D activities are carried out mainly in Japan at The Corporate Research & Development Laboratories, as well as the AV & Network Development Center, the Information & Communication Development Center, Optical Technology Center and PDP Development Center. At two of our overseas wholly-owned subsidiaries, we are also actively engaged in the development of system software related to digital TV and of digital network technologies at Pioneer Research Center USA, Inc., while at Pioneer Digital Design Centre, Ltd. in the UK, we are developing a digital TV set-top box utilizing multimedia home platform technology. Product improvement activities are the responsibility of the production engineering departments at our various manufacturing facilities both in Japan and overseas.
Next-Generation Large-Capacity Rewritable Optical Disc System
D. Trend information
The following is a description of the most significant recent trends in each of our business segments.
Electronics business segment
(i) Audio/Video group
Global demand for audio/video products has struggled recently, which we believe has resulted in downward price pressure and stagnant sales. This, in turn, has negatively impacted our production levels and our inventory. We have responded and will continue to respond to such downward pressure in sales and production through the introduction of new value-added products and models in the Audio/Video group, including home theater systems, DVD-related products and plasma displays.
42
Table of Contents
DVD products.As a result of the dramatic expansion of the market for DVD players, they have become commodity products and suffer from significant price competition. DVD was one of our fastest growing product areas during the past several fiscal years, and we believe we are well-positioned to face the competition, because of our accumulated expertise through LD development, our expected reduction of costs as a result of shifting production to China and introduction of new innovative products. There are, however, a number of competing digital recording disc formats: the DVD-RW format commercialized by us, Sony, Sharp and others, the DVD-RAM format commercialized by Matsushita, Hitachi, Toshiba and others, and the DVD+RW format commercialized by Philips and others.
Plasma displays.The large-screen display market for plasma displays has been expanding in recent years, and several manufacturers have started mass production of plasma displays that compete with ours. Each company is increasing investment and expanding production. As the number of companies entering this market increases, it is expected that the unit price will decrease due to intensifying competition. Under such circumstances, we are expanding production, while introducing new products with higher resolutions.
(ii) Car electronics group
Severe competition in the car electronics business worldwide has led to strong downward pressure on prices. However, the popularity of car navigation products, which we believe is a strong area of ours, continues to increase. In June 2001 we introduced in Japan a new car navigation system incorporating a hard disk drive (HDD), which features substantially faster access times. In October 2001, we also introduced in Japan affordably priced DVD models. These new models are receiving favorable acceptance from our customers for its attractive and convenient features. Pioneer is still leading the car navigation market; competitors, however, have started commercializing models of the same types.
There is also a trend in the car electronics industry of increased OEM sales to car manufacturers. Pioneer intends to increase its efforts to market itself towards such car manufacturers and strengthen its foothold in OEM sales, as well.
(iii) Others group
DVD-R/RW drives.In the computer industry, severe pricing pressure, strong demand for higher-performance products and short product life are characteristic. To counter these trends, we are focusing on high-value added products such as DVD-R/RW drives, both for PC makers and for the consumer market. The DVD-R/RW drives can record both on a write-once blank DVD-R disc and a rewritable blank DVD-RW disc up to seven times as much data as that of a CD-R or CD-RW disc. There are other competing formats—the DVD-RAM format and the DVD+RW format—in the drive market as well.
Set-top boxes. Recently, in both terrestrial and satellite broadcasting, digitalization is becoming more popular throughout the world. With respect to this trend, we put emphasis on developing and marketing digital models. In fiscal 2000 we started shipping digital cable-TV set-top boxes in the U.S. We have also been providing digital DBS set-top boxes in Europe since fiscal 1998, and in fiscal 2001 we started distributing digital DBS set-top boxes in Japan.
43
Table of Contents
OEL displays. With the entry of other companies, market competition in OEL displays is becoming even more intense, while each company is proceeding in the development of full-color versions. To meet the competition, we have created an alliance with Semiconductor Energy Laboratory Co., Ltd. and Sharp Corporation in fiscal 2001, and have developed the active-matrix full-color OEL displays since then.
AV software business segment
The AV software industry is very volatile and dependent upon the presence or absence of hit movie and music titles. Accordingly, its success in any year is very difficult to predict.
Patent licensing segment
We are in a patent business environment where every company follows a policy of emphasizing patent rights, and patent lawsuits are increasing noticeably. The value of patents is increasingly recognized, and there is intensive patent utilization through the transfer or licensing of patent rights. While poor economic conditions favor purchasers of patent rights, purchase prices generally are increasing because of the growing importance of such intellectual property.
We expect that our royalty revenue from the licensing of worldwide patents relating to laser optical disc technologies will decline substantially, as a significant portion of the patents in Japan and Europe will expire by the end of fiscal 2003. We intend to attempt to reduce the decline in royalty revenue through the acquisition and licensing of third party patent rights and increased enforcement of our existing patents, while we continue to research and develop new technologies that could provide us with future royalties from licensing. We do not, however, expect that the revenue, if any, from such new patents will be sufficient to offset the decrease in royalty revenue resulting from the expiration of our existing patents. See “Item 4.B. Business overview–Nature of operations–Patent licensing” for more information on our patent licensing business.
44
Table of Contents
Item 6. Directors, Senior Management and Employees
A. Directors and senior management
Pioneer’s Directors, Executive Officers and Corporate Auditors as of July 1, 2002, and their pertinent information, such as position and business experience, are as follows:
Directors
| Name | Current Position | |||
| (Date of birth) | (Month and year of expiration) | Prior Position | ||
| Kanya Matsumoto (June 12, 1930) | Chairman and Representative Director of Pioneer (June 2004) | June 1996: Vice Chairman and Representative Director of Pioneer | ||
| Kaneo Ito (Apr. 30, 1936) | President and Representative Director of Pioneer (June 2004) | June 1991: Senior Managing Director and Representative Director of Pioneer, and General Manager of International Business Group; in charge of overseas operations and Public Relations Division of Pioneer | ||
| Yoshimichi Inada (Sept. 8, 1936) | Executive Vice President and Representative Director of Pioneer; in charge of technologies, production and quality control in general; in charge of Components Business Division and Strategic IT Division of Pioneer (June 2003) | June 2001: Executive Vice President and Representative Director of Pioneer; in charge of technologies, production and quality control in general; in charge of Components Business Division, Procurement Center and Strategic IT Division of Pioneer | ||
| Katsuhiro Abe (Nov. 16, 1936) | Executive Vice President and Representative Director of Pioneer; in charge of administration and export management in general of Pioneer (June 2003) | June 2001: Senior Managing Director and Representative Director of Pioneer; in charge of administration and export management in general and General Manager of Corporate Planning Division of Pioneer | ||
| Akira Niijima (Mar. 9, 1944) | Senior Managing Director of Pioneer and President of Pioneer’s Home Entertainment Company (June 2003) | Jan. 2001: Managing Director of Pioneer and President of Pioneer’s Home Entertainment Company |
45
Table of Contents
| Name | Current Position | |||
| (Date of birth) | (Month and year of expiration) | Prior Position | ||
| Takashi Kobayashi (Sept. 27, 1940) | Senior Managing Director of Pioneer; in charge of Corporate Communications Division, Customer Satisfaction Planning and Coordination Division, Intellectual Property Division, and Business Development Division of Pioneer (June 2003) | Apr. 2000: Managing Director of Pioneer; in charge of Corporate Communications Division, Customer Satisfaction Planning and Coordination Division, Intellectual Property Division, Division of Environmental Preservation, and Business Development Division of Pioneer | ||
| Tadahiro Yamaguchi (Mar. 24, 1946) | Managing Director of Pioneer and Executive Vice President of Pioneer’s Home Entertainment Company (in charge of technologies, production and quality control) (June 2003) | Nov. 2001: Director of Pioneer and Executive Vice President of Pioneer’s Home Entertainment Company (in charge of technologies, production and quality control) | ||
| Satoshi Matsumoto (Apr. 15, 1954) | Managing Director of Pioneer and General Manager of Division of Environmental Preservation of Pioneer (June 2004) | June 1998: Director of Pioneer and General Manager of Division of Environmental Preservation of Pioneer | ||
| Hiroshi Aiba (Sept. 15, 1940) | Director of Pioneer and General Manager of External Relations Division of Pioneer (June 2003) | Apr. 2000: Director of Pioneer and General Manager of Business Systems Division of Pioneer | ||
| Shinji Yasuda (June 10, 1945) | Director of Pioneer and Managing Director of Pioneer China Holding Co., Ltd. (June 2003) | July 2000: Director of Pioneer; in charge of China Project of Pioneer | ||
| Koichi Shimizu (Feb. 3, 1944) | Director of Pioneer and General Manager of Production Management and Coordination Division, and of Procurement Center of Pioneer (June 2004) | June 2001: Senior Executive Officer of Pioneer and Managing Director of Pioneer Electronics Asiacentre Pte. Ltd. | ||
| Tatsuhiro Ishikawa (Apr. 4, 1939) | Director of Pioneer (June 2004) | Dec. 2001 to present: Attorney-at-Law |
46
Table of Contents
Executive Officers
| Name | Current Position | |||
| (Date of birth) | (Month and year of expiration) | Prior Position | ||
| Kazunori Yamamoto (Oct. 21, 1942) | Senior Executive Officer of Pioneer and President of Pioneer North America, Inc. and President of Pioneer Electronics (USA) Inc. (June 2003) | June 1999: Executive Officer of Pioneer and President of Pioneer North America, Inc. | ||
| Shungo Minato (Apr. 11, 1943) | Senior Executive Officer of Pioneer and Chairman and Managing Director of Pioneer Europe NV (June 2003) | June 1999: Executive Officer of Pioneer and Chairman and Managing Director of Pioneer Europe NV | ||
| Masaru Saotome (Aug. 20, 1944) | Senior Executive Officer of Pioneer and Executive Vice President of Pioneer’s Home Entertainment Company (in charge of sales and marketing) (June 2003) | June 1999: Executive Office of Pioneer and Executive Vice President of Pioneer’s Home Entertainment Company (in charge of sales and marketing) | ||
| Tamihiko Sudo (Apr. 28, 1947) | Senior Executive Officer of Pioneer and President of Pioneer’s Mobile Entertainment Company (June 2003) | June 2000: Executive Officer of Pioneer and Executive Vice President of Pioneer’s Mobile Entertainment Company | ||
| Hajime Ishizuka (May 3, 1947) | Senior Executive Officer of Pioneer and General Manager of Components Division; in charge of International Business Division of Pioneer (June 2003) | June 2001: Executive Officer of Pioneer and General Manager of Components Division; in charge of International Business Division of Pioneer | ||
| Osamu Yamada (Mar. 16, 1944) | Senior Executive Officer of Pioneer and General Manager of Research and Development Group of Pioneer (June 2004) | June 1999: Director-General of the NHK (Nippon Hoso Kyokai; Japan Broadcasting Corporation) Science and Technical Research Laboratories |
47
Table of Contents
| Name | Current Position | |||
| (Date of birth) | (Month and year of expiration) | Prior Position | ||
| Seiichiro Kurihara (Mar. 15, 1943) | Executive Officer of Pioneer and General Manager of Intellectual Property Division of Pioneer (June 2003) | June 1998: General Manager of Intellectual Property Division of Pioneer | ||
| Koki Aizawa (Dec. 19, 1944) | Executive Officer of Pioneer and Deputy General Manager of Research and Development Group of Pioneer (June 2003) | Jan. 2001: Deputy General Manager of Research and Development Group of Pioneer | ||
| Toshihiko Norizuki (May 23, 1945) | Executive Officer of Pioneer and General Manager of Business Systems Division and Plant Manager of Ohmori Plant of Pioneer (June 2003) | June 2001: General Manager of Business Systems Division and Plant Manager of Ohmori Plant of Pioneer | ||
| Buntarou Nishikawa (Mar. 24, 1946) | Executive Officer of Pioneer and Executive Vice President of Pioneer’s Mobile Entertainment Company (June 2003) | June 2001: Executive Officer of Pioneer and General Manager of Domestic Sales Division, Pioneer’s Mobile Entertainment Company | ||
| Osamu Takada (July 27, 1948) | Executive Officer of Pioneer and General Manager of Personnel Division of Pioneer (June 2003) | Sept. 1999: General Manager of Personnel Division of Pioneer | ||
| Masao Kawabata (Aug. 10, 1948) | Executive Officer of Pioneer and General Manager of Corporate Communications Division of Pioneer (June 2003) | Apr. 2000: General Manager of Corporate Communications Division of Pioneer | ||
| Sumitaka Matsumura (Oct. 10, 1948) | Executive Officer of Pioneer and Deputy General Manager of Research and Development Group of Pioneer (June 2003) | Jan. 2001: Deputy General Manager of Research and Development Group of Pioneer | ||
| Yoshio Taniyama (Nov. 19, 1948) | Executive Officer of Pioneer and General Manager of Finance Division of Pioneer (June 2003) | Sept. 1999: General Manager of Finance Division of Pioneer | ||
| Hideki Okayasu (May 12, 1950) | Executive Officer of Pioneer and General Manager of Accounting Division of Pioneer (June 2003) | July 2000: General Manager of Accounting Division of Pioneer |
48
Table of Contents
Corporate Auditors
| Name | Current Position | |||
| (Date of birth) | (Month and year of expiration) | Prior Position | ||
| Makoto Koshiba (Nov. 21, 1943) | Corporate Auditor (full time) of Pioneer (June 2003) | Sept. 1999: Director and General Manager of Accounting Division; in charge of Finance Division of Pioneer | ||
| Makito Baba (Oct. 9, 1934) | Corporate Auditor of Pioneer (June 2003) | June 1997: Corporate Auditor (full time) of Pioneer | ||
| Masanori Iijima (Nov. 27, 1928) | Corporate Auditor of Pioneer (June 2003) | Apr. 1955 to present: Attorney-at-Law | ||
| Terumichi Tsuchida (Aug. 22, 1921) | Corporate Auditor of Pioneer (June 2004) | July 1998 to present: Advisor of Meiji Life Insurance Company |
All of the above persons, with the exception of Messrs. Tatsuhiro Ishikawa, Makito Baba, Masanori Iijima and Terumichi Tsuchida, devote themselves full time to our business.
There is no arrangement or understanding between any Director, Executive Officer or Corporate Auditor and any other person pursuant to which he or she was elected as Director, Executive Officer or Corporate Auditor.
Mr. Kanya Matsumoto is the uncle of Mr. Satoshi Matsumoto. Mr. Kaneo Ito is married to a first cousin of Mr. Kanya Matsumoto.
49
Table of Contents
B. Compensation
The aggregate amount of compensation (including bonuses and stock-based compensation) paid by Pioneer to all Directors, Executive Officers and Corporate Auditors of Pioneer as a group for fiscal 2002 totaled ¥876 million. Also, as part of Pioneer’s incentive compensation arrangements for Directors and Executive Officers, Pioneer has issued bonds with detachable warrants in Japan for the periods from fiscal 1999 to 2002. Upon the issuance of detachable warrant bonds by Pioneer, it distributed the warrants at fair market value to both Directors and Executive Officers of Pioneer, and certain other executive employees as a part of their remuneration. In fiscal 2003, Pioneer changed its incentive compensation arrangements and issued share acquisition rights for its shares of common stock to Directors, Executive Officers and certain employees, and certain directors/officers of certain of its subsidiaries. See “Item 6.E. Share ownership” for further information.
The aggregate amount set aside as lump-sum severance indemnities by Pioneer during fiscal 2002 for Directors, Executive Officers and Corporate Auditors of Pioneer totaled ¥145 million. The aggregate amount is calculated by the formula as defined in the regulations of Pioneer concerning the retirement allowance. Provision is made for lump-sum severance payments for Directors and Corporate Auditors of Pioneer on a basis considered adequate for such future payments as may be approved by the shareholders. (See Note 7 in “Notes to Consolidated Financial Statements.”)
C. Board practices
Pioneer’s Articles of Incorporation provide for a Board of Directors of three or more members and for three or more Corporate Auditors. All Directors and Corporate Auditors are elected at general meetings of shareholders. In general, the term of office of Directors expires at the conclusion of the ordinary general meeting of shareholders held with respect to the last closing of accounts within two years after their assumption of office, and in the case of Corporate Auditors, within three years (in the case of Corporate Auditors to be elected at an ordinary general meeting of shareholders to be held with respect to the first fiscal year ending on and after May 1, 2002, four years) after their assumption of office; however, Directors and Corporate Auditors may serve any number of consecutive terms. With respect to each expiration of the term of office of Directors and Corporate Auditors, see “Item 6.A. Directors and senior management.”
The Directors constitute the Board of Directors, which has the ultimate responsibility for administration of our affairs. The Board of Directors may elect from among its members a Chairman and Director, a Vice Chairman and Director, a President and Director, one or more Executive Vice Presidents and Directors, Senior Managing Directors and Managing Directors. From among the Directors referred to above, the Board of Directors elects one or more Representative Directors. Each of the Representative Directors has the authority individually to represent Pioneer in the conduct of its affairs.
Pioneer introduced a Corporate Executive Officer system in June 1999 to improve management efficiency and speed up decision-making. Executive Officers are basically elected at the meeting of the Board of Directors held immediately after the ordinary general meeting of shareholders. In general, the term of office of Executive Officers expires at the conclusion of the ordinary general meeting of shareholders held with respect to the last closing of accounts within two years after their assumption of office. With respect to each expiration of the term of office of Executive Officers, see “Item 6.A. Directors and senior management.” The Board of Directors may elect from among Executive Officers one or more Senior Executive Officers. Each of the Executive Officers has the authority individually to operate businesses of which he or she is in charge under the control of the Board of Directors and Representative Directors.
50
Table of Contents
The Corporate Auditors of Pioneer are not required to be and are not certified public accountants. However, at least one (or, after the conclusion of the ordinary general meeting of shareholders to be held with respect to the first fiscal year ending on and after May 1, 2005, at least half) of the Corporate Auditors is required to be a person who has not been a Director, Executive Officer, general manager or employee of Pioneer or any of its subsidiaries during the five-year period prior to his or her election as a Corporate Auditor (or, after the conclusion of such ordinary general meeting of shareholders, a person who has not been a Director, or employee of Pioneer or any of its subsidiaries). The Corporate Auditors may not at the same time be Directors, Executive Officers, general managers or employees of Pioneer or any of its subsidiaries.
Each Corporate Auditor has the statutory duty to supervise the administration by the Directors of Pioneer’s affairs and also to examine the financial statements and business reports to be submitted by the Board of Directors at the general meeting of shareholders. They shall attend meetings of the Board of Directors but are not entitled to vote. In addition to Corporate Auditors, independent certified public accountants or an audit corporation must be appointed by general meetings of shareholders. Such independent certified public accountants or audit corporation have, as their primary statutory duties, the duties to examine the financial statements proposed to be submitted by the Board of Directors at general meetings of shareholders and to report their opinion thereon to the Corporate Auditors and the Directors.
The Corporate Auditors constitute the Board of Corporate Auditors. The Board of Corporate Auditors has a statutory duty to prepare and submit its audit report to the Board of Directors each year. A Corporate Auditor may note his or her opinion in the audit report if his or her opinion is different from the opinion expressed in the audit report. The Board of Corporate Auditors is empowered to establish audit principles, method of examination by Corporate Auditors of Pioneer’s affairs, and financial position and other matters concerning the performance of the Corporate Auditors’ duties.
There are no contractual arrangements providing for benefits to Directors upon termination of service. Also see “Item 10.B. Memorandum and articles of association–Directors.”
D. Employees
The following table sets forth the number of our employees at the end of the period indicated.
| Year ended March 31 | ||||||||||||
| 2000 | 2001 | 2002 | ||||||||||
| Number of employees | 27,414 | 28,871 | 31,220 | |||||||||
| �� | ||||||||||||
Pioneer and six of its subsidiaries in Japan have their respective labor unions for the employees of each company. Each such labor union is affiliated with the Japanese Electrical Electronic & Information Union. All employees except management, supervisory and certain other employees must become union members. We have not been materially affected by any work stoppages or difficulties in connection with labor negotiations or disputes and consider our labor relations to be good.
51
Table of Contents
E. Share ownership
The total number of shares of Pioneer’s common stock owned by our Directors, Executive Officers and Corporate Auditors as a group as of March 31, 2002 is as follows:
| Title of class | Identity of person or group | Number of shares owned | Percent of class | ||||||
| Common Stock | Directors, Executive Officers and Corporate Auditors as a group | 3,536,495 shares* | 1.96 | % | |||||
* Except for Mr. Kanya Matsumoto, Chairman of Pioneer, who owns 2,595,359 shares of common stock, which constitutes 1.44% of all outstanding shares as of March 31, 2002, none of Pioneer’s Directors, Executive Officers and Corporate Auditors is the owner of more than one percent of Pioneer’s common stock.
Pioneer has granted the following outstanding warrants to subscribe for shares of common stock to its Directors, Executive Officers and certain executive employees, and certain directors/officers of certain of its subsidiaries as part of their compensation.
| Total number of shares | Current | Number of shares | ||||||||||||
| Fiscal year | covered by warrants | exercise price | exercised | |||||||||||
| granted | (in thousands) | Exercise period | per share | (in thousands) | ||||||||||
| 1999 | 269 | From July 1, 1999 to June 8, 2001 | ¥ | 2,783 | 269 | |||||||||
| 2000 | 320 | From July 3, 2000 to September 12, 2002 | ¥ | 2,188 | 222 | |||||||||
| 2001 | 191 | From July 2, 2001 to September 11, 2003 | ¥ | 4,674 | — | |||||||||
| 2001 | 93 | From July 2, 2001 to September 25, 2003 | ¥ | 4,839 | — | |||||||||
| 2002 | 413 | From July 1, 2002 to August 26, 2004 | ¥ | 3,266 | — | |||||||||
Pioneer has also granted the following share subscription rights for its shares of common stock to certain of its employees.
| Total number of shares | Current | Number of shares | ||||||||||||
| Fiscal year | covered by option | exercise price | exercised | |||||||||||
| granted | (in thousands) | Exercise period | per share | (in thousands) | ||||||||||
| 2001 | 191 | From July 1, 2002 to June 30, 2005 | ¥ | 4,400 | — | |||||||||
| 2002 | 191 | From July 1, 2003 to June 30, 2006 | ¥ | 3,791 | — | |||||||||
52
Table of Contents
Under amendments to the Commercial Code of Japan which became effective on April 1, 2002, Pioneer has also issued share acquisition rights for its shares of common stock to its Directors, Executive Officers and certain employees, and certain directors/officers of certain of its subsidiaries.
| Total number of shares | Current | Number of shares | ||||||||||
| Fiscal year | covered by option | exercise price | exercised | |||||||||
| granted | (in thousands) | Exercise period | per share | (in thousands) | ||||||||
| 2003 | 564 | From July 1, 2004 to June 29, 2007 | ¥ | 2,477 | — | |||||||
Item 7. Major Shareholders and Related Party Transactions
A. Major shareholders
Major shareholders that owned 5% or more of Pioneer’s voting securities as of March 31, 2002 on the register of shareholders were as follows:
| Number of shares | Percentage of | |||||||||
| Title of class | Name | (in thousand) | outstanding shares | |||||||
| Common Stock | Japan Trustee Services Bank, Ltd. (Trust Account) | 15,859 | 8.80 | % | ||||||
Japan Trustee Services Bank, Ltd. is a securities processing services company. We understand that this shareholder is not the beneficial owner of our voting securities, but we do not have available further information concerning such beneficial ownership.
To our knowledge, there are no major shareholders that were beneficial owners of 5% or more of Pioneer’s voting securities during the past three years.
All shareholders of Pioneer have the same voting rights, subject to the limitation on exercise as set forth in “Item 10.B. Memorandum and articles of association–Common stock–Voting rights.”
As of March 31, 2002, there were 180,063,836 shares of common stock outstanding, of which 926,530 shares were held in the form of American Depositary Receipts (ADRs) (0.51%) and 9,863,888 shares (5.48%) were held of record in the form of common stock by residents in the United States (based solely on their addresses). The number of registered ADR holders of record (including DTC) was 88, and the number of registered holders of record in the United States (based solely on their addresses) of shares of common stock, including those who held shares through a Japanese securities clearing system, was 74.
To our knowledge, Pioneer is not directly or indirectly owned or controlled by any other corporation or by the Japanese or any foreign government.
To our knowledge, there is no arrangement, the operation of which may at a subsequent date result in a change in control of Pioneer.
53
Table of Contents
B. Related party transactions
None
C. Interests of experts and counsel
Not applicable
Item 8. Financial Information
A. Consolidated statements and other financial information
Consolidated financial statements
See the Consolidated Financial Statements and Schedules beginning on page F-1.
Legal proceedings
In common with other industrial companies conducting a global business, we are party to various lawsuits and administrative proceedings in the ordinary course of our business. Based on the advice of counsel in the respective matters, except as described below, we do not expect such lawsuits or administrative proceedings, individually or in the aggregate, to have a material effect on our financial condition and business results.
In fiscal 2001, we received a notice of proposed assessment from the German tax authorities for approximately DM41 million (¥2,434 million translated at the current foreign exchange rate at March 31, 2002) relating to a tax position taken in prior years concerning intercompany purchase prices. We officially challenged the proposed assessment by arbitration procedures. There was no further development in the proceedings during fiscal 2002. It is not possible at this time to determine the ultimate resolution of this matter.
In June 2002, we received a preliminary calculation from the United States Internal Revenue Service (“IRS”) for additional taxes of approximately US$66 million (¥8,795 million translated at the foreign exchange rate at March 31, 2002) relating to an adjustment to transfer prices between affiliated companies for the years ended March 31, 1997 through 1999. If, after completing its audit, the IRS files a notice of proposed assessment based on the preliminary calculation, we intend to file a protest. In the opinion of management, it is not possible at this time to determine the ultimate outcome of this matter.
We are also a defendant in a lawsuit in the United States in which the plaintiff, Gemstar-TV Guide International, Inc., alleges that we have infringed two patents, both of which have expired. The plaintiff has not yet specified damages. We have denied the allegations and have filed a counterclaim against the plaintiff and another company related to the alleged patent infringement. In addition, the same plaintiff alleges that we have infringed four other patents. The plaintiff filed both a complaint before the International Trade Commission (“ITC”) alleging patent infringement relating to our importation and sale of the products in the United States and a complaint for unspecified damages in the District Court, which complaint has been stayed pending the determination of the ITC. On June 21, 2002, the ITC’s administrative law judge issued his final initial determination concluding that we did not infringe plaintiff’s patents and also that plaintiff misused one of its patents. We anticipate that the ITC will adopt the findings and conclusions of the administrative law judge.
54
Table of Contents
Dividend policy
Pioneer normally pays cash dividends twice per year. Pioneer’s Board of Directors recommends year-end dividends to be paid following the end of each fiscal year. This recommended year-end dividend must then be approved by shareholders at the ordinary general meeting of shareholders usually held in June of each year. Immediately following approval of the dividend at the shareholders’ meeting, Pioneer pays the dividend to holders of record at the preceding March 31. In addition to these year-end dividends, Pioneer may pay interim dividends in the form of cash distributions from its retained earnings to its shareholders of record as of September 30 in each year by resolution of its Board of Directors and without shareholder approval. Pioneer normally pays interim dividends in December. See “Item 10.B. Memorandum and articles of association–Common stock–Dividends.”
The following table sets forth the dividends paid by Pioneer for each of the periods shown. The U.S. dollar equivalents for the dividends shown are based on the noon buying rate for cable transfer in New York City as certified for customs purposes by the Federal Reserve Bank of New York for yen on the date of the dividend payment:
| Dividend per share | |||||||||
| Record date | Yen | Dollars | |||||||
| March 31, 1998 | ¥ | 5.00 | $ | 0.04 | |||||
| September 30, 1998 | ¥ | 5.00 | $ | 0.04 | |||||
| March 31, 1999 | ¥ | 5.00 | $ | 0.04 | |||||
| September 30, 1999 | ¥ | 5.00 | $ | 0.05 | |||||
| March 31, 2000 | ¥ | 5.00 | $ | 0.05 | |||||
| September 30, 2000 | ¥ | 7.50 | $ | 0.07 | |||||
| March 31, 2001 | ¥ | 7.50 | $ | 0.06 | |||||
| September 30, 2001 | ¥ | 7.50 | $ | 0.06 | |||||
| March 31, 2002 | ¥ | 7.50 | $ | 0.06 | |||||
Pioneer intends to continue to pay an appropriate dividend amount on its common stock. The appropriate dividend amount is determined by taking into consideration its financial condition, consolidated business results and future prospects, and other factors for the mid- and long-term.
B. Significant changes
There were no significant changes nor have any relevant facts occurred after the date of the financial statements included in this annual report other than disclosed therein.
55
Table of Contents
Item 9. The Offer and Listing
A. Offer and listing details
The following table sets forth for the period indicated the reported high and low sales prices per share of Pioneer’s Common Stock on the Tokyo Stock Exchange and per share of Pioneer’s American Depositary Shares (ADSs) on the New York Stock Exchange. See “Item 9.C. Markets,” regarding the markets for Pioneer’s shares.
| Tokyo Stock Exchange | New York Stock Exchange | ||||||||||||||||
| Price per share of Common Stock | Price per share of ADS | ||||||||||||||||
| (yen) | (U.S. dollars) | ||||||||||||||||
| High | Low | High | Low | ||||||||||||||
Annual highs and lows | |||||||||||||||||
| Year ended March 31, | |||||||||||||||||
| 1998 | ¥ | 3,160 | ¥ | 1,850 | $ | 27.25 | $ | 15.13 | |||||||||
| 1999 | 2,920 | 1,720 | 21.13 | 14.88 | |||||||||||||
| 2000 | 3,690 | 1,711 | 34.75 | 16.13 | |||||||||||||
| 2001 | 4,940 | 2,085 | 45.38 | 20.50 | |||||||||||||
| 2002 | 4,250 | 2,150 | 34.70 | 16.75 | |||||||||||||
Quarterly highs and lows | |||||||||||||||||
| Fiscal 2001 | |||||||||||||||||
| 1st quarter | 4,350 | 2,085 | 40.50 | 20.50 | |||||||||||||
| 2nd quarter | 4,940 | 3,500 | 45.38 | 32.00 | |||||||||||||
| 3rd quarter | 4,580 | 2,710 | 42.50 | 24.13 | |||||||||||||
| 4th quarter | 3,750 | 2,720 | 30.94 | 23.45 | |||||||||||||
| Fiscal 2002 | |||||||||||||||||
| 1st quarter | 4,250 | 3,020 | 34.70 | 25.18 | |||||||||||||
| 2nd quarter | 3,920 | 2,155 | 31.05 | 16.85 | |||||||||||||
| 3rd quarter | 3,290 | 2,210 | 26.20 | 19.01 | |||||||||||||
| 4th quarter | 3,330 | 2,150 | 25.06 | 16.75 | |||||||||||||
Monthly highs and lows | |||||||||||||||||
| 2002 | |||||||||||||||||
| January | 3,330 | 2,800 | 25.06 | 20.00 | |||||||||||||
| February | 2,685 | 2,150 | 20.00 | 16.75 | |||||||||||||
| March | 2,910 | 2,440 | 22.71 | 18.70 | |||||||||||||
| April | 2,860 | 2,385 | 21.65 | 18.22 | |||||||||||||
| May | 2,595 | 2,280 | 20.07 | 18.20 | |||||||||||||
| June | 2,355 | 1,981 | 19.13 | 16.75 | |||||||||||||
B. Plan of distribution
Not applicable
56
Table of Contents
C. Markets
The primary market for shares of Pioneer’s common stock is the Tokyo Stock Exchange (TSE). Pioneer’s shares of common stock have been listed on the TSE since October 1961 and on the Osaka Securities Exchange since April 1968.
Since December 1976, Pioneer’s ADSs have been listed and traded on the New York Stock Exchange (NYSE), having been traded on the United States over-the-counter market since February 1970. Pioneer’s ADSs, each representing one share of common stock, are evidenced by ADRs issued by Citibank, N.A., New York, as Depositary.
In addition, Curaçao Depositary Shares of Pioneer, evidenced by Curaçao Depositary Receipts, have been listed and traded on the Euronext Amsterdam since February 1969.
D. Selling shareholders
Not applicable
E. Dilution
Not applicable
F. Expenses of the issue
Not applicable
Item 10. Additional Information
A. Share capital
Not applicable
B. Memorandum and articles of association
Organization
Pioneer is a joint stock corporation(kabushiki kaisha)incorporated in Japan under the Commercial Code(shoho)of Japan. It is registered in the Commercial Register(shogyo tokibo)maintained by the Meguro Branch Office of the Tokyo Legal Affairs Bureau.
57
Table of Contents
Objects and purposes
Article 2 of the Articles of Incorporation of Pioneer provides that its purpose is to engage in the following lines of business:
| • | manufacture and sale of electronic and electrical machinery and appliances, optical instruments, medical instruments, and other machinery and appliances; | |
| • | planning, production, manufacture and sale of audio, video and computer software; | |
| • | manufacture and sale of woodworks, agricultural products and plant for their cultivation; | |
| • | sale of foods and beverages including liquor, and operation of restaurants and amusement facilities; | |
| • | sale and purchase, rental and lease, and management of real estate and real estate agency business; | |
| • | publishing and printing business, advertising agency business, construction business and non-life insurance agency business; | |
| • | acquisition, management and transfer of industrial property rights, copyrights and other intellectual property rights; and | |
| • | all business incidental and related to each and every one of the businesses in the preceding businesses. |
Directors
Under the Commercial Code, each Director has executive powers and duties to manage the affairs of Pioneer and each Representative Director, who is elected from among the Directors by the Board of Directors, has the statutory authority to represent Pioneer in all respects. Under the Commercial Code, the Directors must refrain from engaging in any business competing with Pioneer unless approved by the Board of Directors and any Director who has a material interest in the subject matter of a resolution to be taken by the Board of Directors cannot vote on such resolution. The total amount of remuneration to Directors and that to Corporate Auditors are subject to the approval of the general meeting of shareholders. Within such authorized amounts the Board of Directors and the Board of Corporate Auditors respectively determine the compensation to each Director and Corporate Auditor.
Except as stated below, neither the Commercial Code nor Pioneer’s Articles of Incorporation make special provisions as to the Directors’ or Corporate Auditors’ power to vote in connection with their compensation; the borrowing power exercisable by a Representative Director (or a Director who is given power by a Representative Director to exercise such power), their retirement age or requirement to hold any shares of capital stock of Pioneer. The Commercial Code specifically requires the resolution of the Board of Directors for a company to acquire or dispose of material assets; to borrow a substantial amount of money; to employ or discharge from employment important employees, such as general managers; and to establish, change or abolish material corporate organization such as a branch office. The Regulations of the Board of Directors of Pioneer require a resolution of the Board of Directors for Pioneer to borrow a large amount of money or to give a guarantee in a large amount. There is no written rule as to what constitutes a “large” amount in these contexts. However, it has been the general practice of Pioneer’s Board of Directors to adopt a resolution for a borrowing or guaranteeing in an amount not less than ¥100 million or its equivalent.
58
Table of Contents
Common stock
General
Set forth below is information relating to Pioneer’s Common Stock, including brief summaries of the relevant provisions of Pioneer’s Articles of Incorporation and Share Handling Regulations, as currently in effect, and of the Commercial Code of Japan and related legislation. The discussion of the Commercial Code below reflects certain amendments to the Commercial Code, which became effective on October 1, 2001 (the “2001 Amendments”) and on April 1, 2002 (the “2002 Amendments”).
In order to assert shareholders’ rights against Pioneer, a shareholder must have its name and address registered on Pioneer’s register of shareholders, in accordance with Pioneer’s Share Handling Regulations. The registered beneficial holder of deposited shares underlying the ADSs is the Depositary for the ADSs. Accordingly, holders of ADSs will not be able directly to assert shareholders’ rights to Pioneer.
A holder of shares may choose, at its discretion, to participate in the central clearing system for share certificates under the Law Concerning Central Clearing of Share Certificates and Other Securities of Japan. Participating shareholders must deposit certificates representing all of the shares to be included in this clearing system with the Japan Securities Depository Center, Inc. (“JASDEC”). If a holder is not a participating institution in JASDEC, it must participate through a participating institution, such as securities company or bank having a clearing account with JASDEC. All shares deposited with JASDEC will be registered in the name of JASDEC on Pioneer’s register of shareholders. Each participating shareholder will in turn be registered on Pioneer’s register of beneficial shareholders and be treated in the same way as shareholders registered on Pioneer’s register of shareholders. For the purpose of transferring deposited shares, delivery of share certificates is not required. Entry of the share transfer in the books maintained by JASDEC for participating institutions, or in the book maintained by a participating institution for its customers, has the same effect as delivery of share certificates. The registered beneficial owners may exercise the rights attached to the shares, such as voting rights, and will receive dividends (if any) and notices to shareholders directly from Pioneer. The shares held by a person as a registered shareholder and those held by the same person as a registered beneficial owner are aggregated for these purposes. Beneficial owners may at any time withdraw their shares from deposit and receive share certificates.
Authorized capital
Article 5 of the Articles of Incorporation of Pioneer provides that the total number of shares authorized to be issued by Pioneer is four hundred million (400,000,000) shares.
As of March 31, 2002, 180,063,836 shares of common stock were issued and outstanding.
The 2001 Amendments eliminated the concept of “par value” of shares of capital stock. Thus, all shares of capital stock of Pioneer have no par value.
59
Table of Contents
Dividends
The Articles of Incorporation of Pioneer provide that the accounts shall be closed on March 31 of each year and that dividends, if any, shall be paid to shareholders, beneficial shareholders and pledgees of record as of the end of such day. After the close of the fiscal period, the Board of Directors prepares, among other things, a proposed allocation of profits for dividends and other purposes; this proposal is submitted to the Board of Corporate Auditors of Pioneer and to independent certified public accountants and then submitted for approval to the ordinary general meeting of shareholders, which is normally held in June each year. In addition to provisions for dividends, if any, and for the legal reserve and other reserves, the allocation of profits customarily includes a bonus to Directors and Corporate Auditors. In addition to year-end dividends, the Board of Directors may by its resolution declare a cash distribution pursuant to Article 293-5 of the Commercial Code (an “interim dividend”) to shareholders, beneficial shareholders and pledgees of record as of the end of each September 30, without shareholders’ approval, but subject to the limitations described below.
The Commercial Code provides that a company may not make any distribution of profit by way of dividends or interim dividends for any fiscal period unless it has set aside in its legal reserve an amount equal to at least one-tenth of the amount paid by way of appropriation of retained earnings for such fiscal period or of the amount of such interim dividends until the aggregate amount of additional paid-in capital and legal reserve equals to one-quarter of its stated capital. Under the Commercial Code, Pioneer is permitted to distribute profits by way of year-end or interim dividends out of the excess of its net assets over the aggregate of:
| (i) | its stated capital; | |
| (ii) | its additional paid-in capital; | |
| (iii) | its accumulated legal reserve; | |
| (iv) | the legal reserve to be set aside in respect of the fiscal period concerned; | |
| (v) | the excess, if any, of unamortized expenses incurred in preparation for commencement of business and in connection with R&D over the aggregate of amounts referred to in (ii), (iii) and (iv) above; and | |
| (vi) | if certain assets of Pioneer are stated at market value on such balance sheet pursuant to the provisions of the Commercial Code, the excess, if any, of the aggregate amount of their market value over the aggregate acquisition cost thereof. |
In the case of interim dividends, the net assets are calculated by reference to the non-consolidated balance sheet as at the last closing of Pioneer’s accounts, but adjusted to reflect; (x) any subsequent payment by way of appropriation of retained earnings and transfer to legal reserve in respect thereof; (y) any subsequent transfer of retained earnings to stated capital; and (z) if Pioneer has been authorized, pursuant to a resolution of an ordinary general meeting of shareholders, to purchase shares of its common stock (see “Acquisition by Pioneer of its common stock” below), the total amount of the purchase price of such shares so authorized by such resolution that may be paid by Pioneer, provided that interim dividends may not be paid where there is a risk that at the end of the fiscal year there might not be any excess of net assets over the aggregate of the amounts referred to in (i) through (vi) above.
Under its Articles of Incorporation, Pioneer is not obligated to pay any dividends which are left unclaimed for a period of three years after the date on which they first became payable.
60
Table of Contents
Stock splits
Pioneer may at any time split shares in issue into a greater number of shares by resolution of the Board of Directors, and may amend its Articles of Incorporation to increase the number of the authorized shares to be issued in proportion to the relevant stock split in principle pursuant to a resolution of the Board of Directors rather than a special resolution of a general meeting of shareholders which is otherwise required for amending the Articles of Incorporation.
In the event of a stock split, generally, shareholders will not be required to exchange share certificates for new share certificates, but certificates representing the additional shares resulting from the stock split will be issued to shareholders. When a stock split is to be made, Pioneer must give public notice of the stock split, specifying the record date therefor, at least two weeks prior to such record date. In addition, promptly after the stock split takes effect, Pioneer must give notice to each shareholder specifying the number of shares to which such shareholder is entitled by virtue of the stock split.
General meeting of shareholders
The ordinary general meeting of shareholders of Pioneer for each fiscal year is normally held in June in each year in or near Meguro-ku or Minato-ku, Tokyo, Japan. In addition, Pioneer may hold an extraordinary general meeting of shareholders whenever necessary by giving notice of convocation thereof at least two weeks prior to the date set for the meeting.
Notice of convocation of a shareholders’ meeting setting forth the place, time and purpose thereof, must be mailed to each shareholder having voting rights (or, in the case of a non-resident shareholder, to his or her standing proxy or mailing address in Japan) at least two weeks prior to the date set for the meeting. Under the 2002 Amendments, such notice may be given to shareholders by electronic means, subject to the consent by the relevant shareholders. The record date for an ordinary general meeting of shareholders is March 31 of each year.
Any shareholder or group of shareholders holding at least 3% of the total number of voting rights for a period of six months or more may require the convocation of a general meeting of shareholders for a particular purpose. Unless such shareholders’ meeting is convened promptly or a convocation notice of a meeting which is to be held not later than six weeks from the day of such demand is dispatched, the requiring shareholder may, upon obtaining a court approval, convene such shareholders’ meeting.
Any shareholder or group of shareholders holding at least 300 voting rights or 1% of the total number of voting rights for a period of six months or more may propose a matter to be considered at a general meeting of shareholders by submitting a written request to a Representative Director at least six weeks prior to the date set for such meeting.
61
Table of Contents
Voting rights
So long as Pioneer maintains the unit share system (see “New “unit” share system” below) a holder of shares constituting one or more whole units is entitled to one voting right per unit of shares subject to the limitations on voting rights set forth in the following paragraph. If Pioneer eliminates from its Articles of Incorporation the provisions relating to the unit of shares, holders of common stock will have one voting right for each share they hold. Except as otherwise provided by law or by the Articles of Incorporation, a resolution can be adopted at a general meeting of shareholders by a majority of the number of voting rights of all the shareholders represented at the meeting. The Commercial Code and Pioneer’s Articles of Incorporation provide, however, that the quorum for the election of Directors and Corporate Auditors shall not be less than one-third of the total number of voting rights of all the shareholders. Pioneer’s shareholders are not entitled to cumulative voting in the election of Directors. A corporate shareholder more than one-quarter of whose total voting rights are directly or indirectly owned by Pioneer may not exercise its voting rights with respect to shares of common stock of Pioneer that it owns. In addition, Pioneer may not exercise its voting rights with respect to its shares that it owns. Shareholders may exercise their voting rights through proxies, provided that the proxies are also shareholders holding voting rights. Pioneer’s shareholders also may cast their votes in writing. Under the 2002 Amendments, shareholders may also exercise their voting rights by electronic means when the Board of Directors decides to permit such method of exercising voting rights.
The Commercial Code provides that in order to amend the Articles of Incorporation and in certain other instances, including, a reduction of stated capital, the removal of a Director or Corporate Auditor, dissolution, merger or consolidation with a certain exception under which shareholders’ resolution is not required, the transfer of the whole or an important part of the business, the taking over of the whole of the business of any other corporation with a certain exception under which shareholders resolution is not required, share exchange or share transfer for the purpose of establishing 100% parent-subsidiary relationships with a certain exception under which shareholders resolution is not required, splitting of the corporation into two or more corporations with a certain exception under which shareholders resolution is not required, or any offering of new shares at a “substantially favorable” price (or any offering of share acquisition rights to subscribe for or acquire shares of capital stock (“share acquisition rights”) or bonds with share acquisition rights at a “substantially favorable” exercise conditions) to any persons other than shareholders, the quorum shall be a majority of the total voting rights of all the shareholders and the approval by at least two-thirds of the voting rights of all the shareholders represented at the meeting is required (the “special shareholders resolutions”).
Issue of additional shares and pre-emptive rights
Holders of Pioneer’s shares of common stock have no pre-emptive rights under its Articles of Incorporation. Authorized but unissued shares may be issued at such times and upon such terms as the Board of Directors determines, subject to the limitations as to the offering of new shares at a “substantially favorable” price mentioned under “Voting rights” above. The Board of Directors may, however, determine that shareholders shall be given subscription rights regarding a particular issue of new shares, in which case such rights must be given on uniform terms to all shareholders as at a record date of which not less than two weeks’ prior public notice must be given. Each of the shareholders to whom such rights are given must also be given notice of the expiry thereof at least two weeks prior to the date on which such rights expire.
62
Table of Contents
Rights to subscribe for new shares may be made generally transferable by the Board of Directors. Whether Pioneer will make subscription rights generally transferable in future rights offerings will depend upon the circumstances at the time of such offerings. If subscription rights are not made generally transferable, transfers by a non-resident of Japan or a corporation organized under the laws of a foreign country or whose principal office is located in a foreign country will be enforceable against Pioneer and third parties only if Pioneer’s prior written consent to each such transfer is obtained. When such consent is necessary in the future for the transfer of subscription rights, Pioneer intends to consent, on request, to all such transfers by such a non-resident or foreign corporation.
Under the 2002 Amendments, subject to certain requirements, Pioneer may issue share acquisition rights by a resolution of the Board of Directors. Holders of share acquisition rights may exercise their rights to acquire a certain number of shares within the exercise period as prescribed in the terms of their share acquisition rights. Upon exercise of share acquisition rights, Pioneer will be obliged to issue the relevant number of new shares or alternatively to transfer the necessary number of existing shares held by it.
Liquidation rights
In the event of a liquidation of Pioneer, the assets remaining after payment of all debts and liquidation expenses and taxes will be distributed among shareholders in proportion to the respective numbers of shares of common stock held.
Record date
March 31 is the record date for Pioneer’s year-end dividends. So long as Pioneer maintains in its Articles of Incorporation a provision for the unit of shares, the shareholders and beneficial shareholders who are registered as the holders of one unit of shares or more in Pioneer’s registers of shareholders and/or beneficial shareholders at the end of each March 31 are also entitled to exercise shareholders’ rights at the ordinary general meeting of shareholders with respect to the fiscal year ending on such March 31. September 30 is the record date for interim dividends. In addition, Pioneer may set a record date for determining the shareholders and/or beneficial shareholders entitled to other rights and for other purposes by giving at least two weeks’ prior public notice.
The price of shares generally goes ex-dividends or ex-rights on Japanese stock exchanges on the third business day prior to a record date (or if the record date is not a business day, the fourth business day prior thereto), for the purpose of dividends or rights offerings.
63
Table of Contents
Acquisition by Pioneer of its common stock
Pioneer may acquire its own shares through a stock exchange on which such shares are listed (pursuant to an ordinary resolution of an ordinary general meeting of shareholders), by way of tender offer (pursuant to an ordinary resolution of an ordinary general meeting of shareholders), or by purchase from a specific party other than a subsidiary of Pioneer (pursuant to a special resolution of an ordinary general meeting of shareholders) or from a subsidiary of Pioneer (pursuant to a resolution of the Board of Directors). When such acquisition is made by Pioneer from a specific party other than a subsidiary of Pioneer, any other shareholder may make a demand to a Representative Director, more than five calendar days prior to the relevant shareholders’ meeting, that Pioneer also purchase the shares held by such shareholder. Any such acquisition of shares must satisfy certain requirements, including that the total amount of the purchase price may not exceed the amount of the retained earnings available for dividend payments after taking into account any reduction, if any, of the stated capital, additional paid-in capital or legal reserve (if such reduction of the stated capital, additional paid-in capital or legal reserve has been authorized pursuant to a resolution of the relevant ordinary general meeting of shareholders), minus the amount to be paid by way of appropriation of retained earnings for the relevant fiscal year and the amount to be transferred to stated capital. However, if it is anticipated that the net assets on the balance sheet as at the end of the immediately following fiscal year will be less than the aggregate amount of the stated capital, additional paid-in capital and other items as described in (i) through (vi) to “Dividends” above, Pioneer may not acquire such shares.
Shares acquired by Pioneer may be held by it for any period or may be cancelled by resolution of the Board of Directors. Pioneer may also transfer to any person the shares held by it, subject to a resolution of the Board of Directors, and subject also to other requirements similar to those applicable to the issuance of new shares, as described in “Issue of additional shares and pre-emptive rights” above. Pioneer may also utilize its treasury stock for the purpose of transfer to any person upon exercise of share acquisition rights or for the purpose of acquiring another company by way of merger, share exchange or corporate split through exchange of treasury stock for shares or assets of the acquired company.
64
Table of Contents
New “unit” share system
The 2001 Amendments introduced a new unit share system called “tangen-kabushiki”.
Pursuant to these amendments and the Articles of Incorporation of Pioneer, 100 shares constitute one unit. Although the number of shares constituting a new unit is included in the Articles of Incorporation, any amendment to the Articles of Incorporation reducing (but not increasing) the number of shares constituting a unit or eliminating the provisions for the unit of shares may be made by the resolution of the Board of Directors rather than by the special shareholders resolution, which is otherwise required for amending the Articles of Incorporation. The number of shares constituting one new unit, however, cannot exceed 1,000 or one two-hundredth (1/200) of all issued shares.
—Voting rights under the new unit share system
Under the new unit share system, shareholders shall have one voting right for each unit of shares that they hold. Any number of shares less than a full unit will carry no voting rights.
—Share certificates for less than a unit
Unless Pioneer’s Board of Directors adopts a resolution to eliminate the provision for the unit shares from the Articles of Incorporation or the shareholders amend the Articles of Incorporation by a special shareholders resolution to eliminate the provision not to issue share certificates for less than a unit of shares, a share certificate for any number of shares less than a unit will in general not be issued. As the transfer of shares normally requires the delivery of the share certificates therefor, any fraction of a unit for which no share certificates are issued is not transferable.
—Repurchase by Pioneer of shares constituting less than a unit
A holder of shares constituting less than one unit may require Pioneer to purchase such shares at their market value in accordance with the provisions of the Share Handling Regulations of Pioneer.
—Effect of the unit share system on holders of ADRs
A holder who owns ADRs evidencing less than 100 ADSs will indirectly own less than a whole unit of shares of common stock. Although, as discussed above, under the unit share system holders of less than a unit have the right to require Pioneer to purchase their shares, holders of ADRs evidencing ADSs that represent other than integral multiples of whole units are unable to withdraw the underlying shares of common stock representing less than a unit and, therefore, are unable, as a practical matter, to exercise the rights to require Pioneer to purchase such underlying shares unless Pioneer’s Articles of Incorporation are amended to eliminate the provision not to issue share certificates for the numbers of shares less than a unit. As a result, access to the Japanese markets by holders of ADRs through the withdrawal mechanism will not be available for dispositions of shares of common stock in lots less than a unit. The unit share system does not affect the transferability of ADSs, which may be transferred in lots of any size.
65
Table of Contents
Reporting of substantial shareholdings
The Securities and Exchange Law of Japan and regulations thereunder requires any person who has become, beneficially and solely or jointly, a holder of more than 5% of the total issued shares of capital stock of a company listed on any Japanese stock exchange or whose shares are traded on the over-the-counter market in Japan to file with the Director-General of a competent Local Finance Bureau of Ministry of Finance within five business days a report concerning such shareholdings.
A similar report must also be filed in respect of any subsequent change of 1% or more in any such holding or any change in material matters set out in reports previously filed, with certain exceptions. For this purpose, shares issuable to such person upon conversion of convertible securities or exercise of share subscription warrants or share acquisition rights are taken into account in determining both the number of shares held by such holder and the issuer’s total issued share capital. Copies of such report must also be furnished to the issuer of such shares and all Japanese stock exchanges on which the shares are listed or (in the case of shares traded over-the-counter) the Japan Securities Dealers Association.
Except for the general limitation under Japanese anti-trust and anti-monopoly regulations against holding of shares of capital stock of a Japanese corporation which leads or may lead to a restraint of trade or monopoly, and except for general limitations under the Commercial Code or Pioneer’s Articles of Incorporation on the rights of shareholders applicable regardless of residence or nationality, there is no limitation under Japanese laws and regulations applicable to Pioneer or under its Articles of Incorporation on the rights of non-resident or foreign shareholders to hold the shares of common stock of Pioneer or exercise voting rights thereon.
There is no provision in Pioneer’s Articles of Incorporation that would have an effect of delaying, deferring or preventing a change in control of Pioneer and that would operate only with respect to merger, consolidation, acquisition or corporate restructuring involving Pioneer.
C. Material contracts
Not applicable
D. Exchange Controls
The Japanese Foreign Exchange and Foreign Trade Law, currently in effect (the “Law”), does not affect or restrict the rights of a non-resident or foreign corporation to acquire or hold shares of capital stock of Pioneer except that in the event of acquisition of shares of common stock, unless such acquisition is made through a securities company or other financial institution, the acquiring non-resident or foreign corporation is subject to a post-transaction reporting requirement under the Law. However, the Minister of Finance has the power to impose a licensing requirement in certain acquisitions in extremely limited circumstances. Under the Law, dividends paid on, and the proceeds of sales in Japan of, shares of common stock of Pioneer held by non-residents may in general be converted into any foreign currency and repatriated abroad.
66
Table of Contents
E. Taxation
The discussion below is not intended to constitute a complete analysis of all tax consequences relating to the acquisition, ownership and disposition of shares of common stock and ADSs. Prospective purchasers and holders of the shares of common stock or ADSs should consult their own tax advisors concerning the tax consequences of their particular situations.
The following is a general summary of the principal U.S. federal and Japanese tax consequences of the acquisition, ownership and disposition of shares of common stock or ADSs by an investor that holds those shares or ADSs as capital assets (generally, property held for investment). This summary does not purport to address all material tax consequences that may be relevant to holders of shares of common stock or ADSs, and does not take into account the specific circumstances of any particular investors, some of which (such as tax-exempt entities, banks, insurance companies, broker-dealers, investors liable for alternative minimum tax, investors that own or are treated as owning 10% or more of Pioneer’s voting stock, investors that hold shares of common stock or ADSs as part of a straddle, hedge, conversion transaction or other integrated transaction, persons that hold shares of common stock or ADSs through a partnership or other pass-through entity and investors whose functional currency is not the U.S. dollar) may be subject to special tax rules. This summary is based on the tax laws of Japan and of the United States as in effect on the date hereof, as well as on the current income tax convention between the United States and Japan (the “Treaty”), all of which are subject to change (possibly with retroactive effect) and to differing interpretations. The discussion of the tax laws of Japan below reflects certain amendments to certain Japanese tax laws, which became effective on October 1, 2001, along with the amendments to the Commercial Code of Japan. In this regard, U.S. holders should note that the United States and Japan began formal renegotiation of the Treaty in October 2001, and the negotiations continue. In addition, this summary is based in part upon the representations of the depositary and the assumption that each obligation in the deposit agreement for ADSs and in any related agreement will be performed in accordance with its terms.
For purposes of this discussion, a “U.S. Holder” is any beneficial owner of shares of common stock or ADSs that is:
| • | a citizen or individual resident of the United States, | |
| • | a corporation or other entity taxable as a corporation organized under the laws of the United States, any State, or the District of Columbia, | |
| • | an estate the income of which is subject to U.S. federal income tax without regard to its source, or | |
| • | a trust that is subject to the primary supervision of a U.S. court and the control of one or more U.S. persons, or that has a valid election in effect under applicable Treasury regulations to be treated as a U.S. person. |
67
Table of Contents
An “Eligible U.S. Holder” is a U.S. Holder that:
| • | is a resident of the United States for purposes of the Treaty, | |
| • | does not maintain a permanent establishment or fixed base in Japan to which shares of common stock or ADSs are attributable and through which the U.S. Holder carries on or has carried on business (or, in the case of an individual, performs or has performed independent personal services), and | |
| • | is not otherwise ineligible for benefits under the Treaty with respect to income and gain derived in connection with the shares of common stock or ADSs. |
A “Non-U.S. Holder” is any beneficial owner of shares of common stock or ADSs that is:
| • | an individual who is classified as a nonresident for U.S. federal income tax purposes; | |
| • | a foreign corporation or other foreign entity taxable as a corporation; or | |
| • | an estate or trust that is not a U.S. Holder. |
This summary does not address any aspects of U.S. federal tax law other than income taxation, and does not discuss any aspects of Japanese tax law other than income taxation, inheritance and gift taxation and securities transfer taxation. Investors are urged to consult their tax advisor regarding the U.S. federal, state and local and Japanese and other tax consequences of acquiring, owning and disposing of shares of common stock or ADSs. In particular, where relevant, investors are urged to confirm their status as Eligible U.S. Holders with their tax advisors and to discuss with their tax advisors any possible consequences of their failure to qualify as Eligible U.S. Holders. In general, taking into account the earlier assumptions, for purposes of the Treaty and for U.S. federal income and Japanese tax purposes, beneficial owners of ADRs evidencing ADSs will be treated as the owners of the shares of common stock represented by those ADSs, and exchanges of shares of common stock for ADSs, and exchanges of ADSs for shares of common stock, will not be subject to U.S. federal income tax or Japanese tax.
Japanese taxation
Generally, a non-resident of Japan or a non-Japanese corporation is subject to Japanese withholding tax on dividends paid by a Japanese corporation. Stock splits in themselves are not subject to Japanese income tax.
In the absence of an applicable tax treaty, convention or agreement reducing the maximum rate of withholding tax, the rate of Japanese withholding tax applicable to dividends paid by Japanese corporations to non-residents of Japan or non-Japanese corporations is 20%. At the date of this document, Japan has income tax treaties, conventions or agreements whereby the withholding tax rate is reduced, in most cases, to 15% for portfolio investors with, among other countries, Australia, Belgium, Canada, Denmark, Finland, France, Germany, Ireland, Italy, Luxembourg, The Netherlands, New Zealand, Norway, Singapore, Spain, Sweden, Switzerland, the United Kingdom and the United States.
68
Table of Contents
Under the Treaty, as currently in force, the maximum rate of Japanese withholding tax which may be imposed on dividends paid by a Japanese corporation to Eligible U.S. Holders generally is limited to 15% of the gross amount actually distributed. An Eligible U.S. Holder is required to submit an Application Form for Income Tax Convention Regarding Relief from Japanese Income Tax on Dividends in advance through Pioneer to the relevant tax authority before such payment of dividends. A standing proxy in Japan for a non-resident holder of common stock may provide this application service. With respect to ADRs, the Depositary or its agent will apply for this reduced rate on behalf of Eligible U.S. Holders by submitting two Application Forms (one before payment of dividends, the other within eight months after Pioneer’s fiscal year-end) to the Japanese tax authorities. To claim this reduced rate, an Eligible U.S. Holder of ADRs will be required to file a proof of taxpayer status, residence and beneficial ownership (as applicable) and to provide other information or documents as may be required by the Depositary. An Eligible U.S. Holder who does not submit an application in advance will be entitled to claim the refund of withholding taxes withheld in excess of the rate under the Treaty from the relevant Japanese tax authority.
Gains derived by a non-resident of Japan or a non-Japanese corporation from the sale of shares of common stock or ADRs outside Japan or from the sale of shares of common stock within Japan by a non-resident of Japan or a non-Japanese corporation not having a permanent establishment in Japan, are in general not subject to Japanese income or corporation tax.
Japanese inheritance or gift tax at progressive rates may be payable by an individual who has acquired shares of common stock or ADRs as a legatee, heir or donee even though neither the individual nor the deceased nor donor is a Japanese resident.
69
Table of Contents
U.S. federal income taxation
U.S. Holders
Subject to the passive foreign investment company rules discussed below, under U.S. federal income tax law, the gross amount of any distribution made by us in respect of shares of common stock or ADSs (without reduction for Japanese withholding taxes) will constitute a taxable dividend to the extent paid out of current or accumulated earnings and profits, as determined for U.S. federal income tax purposes. A dividend generally will be included in the gross income of a U.S. Holder, as ordinary income, when the dividend is actually or constructively received by the U.S. Holder, in the case of shares of common stock, or by the depositary, in the case of ADSs. The dividend will not be eligible for the dividends received deduction generally allowed to U.S. corporations. A dividend paid in yen will be included in gross income in a U.S. dollar amount based on the yen/U.S. dollar exchange rate in effect on the date that dividend is included in the income of the U. S. Holder, regardless of whether the payment is converted into dollars. Generally, any gain or loss resulting from currency exchange fluctuations during the period from the date the dividend payment is included in the gross income of a U.S. Holder through the date that payment is converted into U.S. dollars (or otherwise disposed of) will be treated as U.S. source ordinary income or loss.
To the extent, if any, that the amount of any distribution received by a U.S. Holder in respect of shares of common stock or ADSs exceeds our current and accumulated earnings and profits, the distribution first will be treated as a tax-free return of the U.S. Holder’s adjusted tax basis in those shares or ADSs, and any balance in excess of that adjusted tax basis will be treated as capital gain. We do not expect to compute our earnings and profits under U.S. federal income tax principles, and therefore holders should assume that our distributions generally will be treated as paid out of our earnings and profits for U.S. federal income tax purposes.
Distributions of additional shares of common stock that are made to U.S. Holders with respect to their shares of common stock or ADSs and that are part of a pro rata distribution to all Pioneer’s shareholders generally will not be subject to U.S. federal income tax.
For U.S. foreign tax credit purposes, dividends included in gross income by a U.S. Holder in respect of shares of common stock or ADSs will constitute income from sources outside the United States and generally will be treated separately, together with other items of “passive income” (or, in the case of some holders, “financial services income”) in computing foreign tax credit limitations. Subject to generally applicable limitations under U.S. federal income tax law and the Treaty, any Japanese withholding tax imposed in respect of a Pioneer dividend may be claimed either as a credit against the U.S. federal income tax liability of a U.S. Holder or, if the U.S. Holder elects not to take a credit for any foreign taxes that year, as a deduction from that holder’s taxable income. Additionally, special rules apply to individuals whose foreign source income during the taxable year consists entirely of “qualified passive income” and whose creditable foreign taxes paid or accrued during the taxable year do not exceed $300 ($600 in the case of a joint return). Further, under some circumstances, a U.S. Holder that:
| • | has held shares of common stock or ADSs for less than a specified minimum period, or | |
| • | is obligated to make payments related to our dividends, |
will not be allowed a foreign tax credit for foreign taxes imposed on our dividends. Finally, foreign tax credits may not be allowed in respect of arrangements in which the Holder’s expected economic return, after non-U.S. taxes, is insubstantial. Holders are urged to consult their tax advisors regarding the availability of the foreign tax credit under their particular circumstances.
70
Table of Contents
Upon a sale or other disposition of shares of common stock or ADSs, a U.S. Holder will recognize gain or loss for U.S. federal income tax purposes in an amount equal to the difference between the amount realized and the U.S. Holder’s tax basis in those shares or ADSs. In general, subject to the passive foreign investment company rules discussed below, that gain or loss generally will be capital gain or loss and, if the U.S. Holder’s holding period for those shares or ADSs exceeds one year, will be long-term capital gain or loss. Some U.S. Holders, including individuals, are eligible for preferential rates of U.S. federal income tax in respect of net long-term capital gain. Under U.S. federal tax law, the deduction of capital losses is subject to limitations. Any gain or loss recognized by a U.S. Holder in respect of the sale or other disposition of shares of common stock or ADSs generally will be treated as U.S. source income or loss for foreign U.S. tax credit purposes.
We do not believe that we are, for U.S. federal income tax purposes, a passive foreign investment company (a “PFIC”), and we intend to continue our operations in such a manner that it is highly unlikely that we would become a PFIC in the future. The PFIC determination is made annually and is based on the portion of our assets (including goodwill) or the portion of our income that is characterized as passive under the PFIC rules. If we become a PFIC, unless a U.S. Holder elects to be taxed annually on a mark-to-market basis with respect to its shares of common stock or ADSs, any gain realized on a sale or other disposition of shares of common stock or ADSs and certain “excess distributions” would be treated as realized ratably over the U.S. Holder’s holding period for the shares of common stock or ADSs; amounts allocated to prior years while we are a PFIC would be taxed at the highest tax rate in effect for each such year, and an additional interest charge would be added in respect of the tax attributable to each such year. If a mark-to-market election were made, a U.S. Holder would take into account each year the appreciation or depreciation in value of its shares of common stock or ADS, which would be treated as ordinary income or (subject to limitations) ordinary loss, as would gains or losses on actual dispositions of common stock or ADSs. Any U.S. Holder who owns shares of common stock or ADSs during any year that we are a PFIC would be required to file Internal Revenue Service Form 8621.
Non-U.S. Holders
Distributions received by a Non-U.S. Holder in respect of shares of common stock or ADSs generally will not be subject to any U.S. federal income or withholding tax, unless the Non-U.S. Holder conducts trade or business within the United States, and the distributions are effectively connected with that trade or business.
A Non-U.S. Holder generally will not be subject to U.S. federal income tax in respect of gain recognized on a sale or other disposition of shares of common stock or ADS, unless the gain is effectively connected with a trade or business conducted by the Non-U.S. Holder within the United States, or the Non-U.S. Holder is an individual who was present in the United States for 183 or more days in the taxable year of the disposition and other conditions are met.
If an income tax treaty applies to a Non-U.S. Holder, it may require, as a condition for the Non-U.S. Holder to be subject to U.S. federal income taxation on dividends or capital gains that are effectively connected with trade or business conducted by a Non-U.S. Holder in the United States, that the dividends or capital gains be attributable to a permanent establishment or fixed base that the Non-U.S. Holder maintains in the United States.
Income that is effectively connected with a U.S. trade or business of a Non-U.S. Holder, and, if an income tax treaty applies and so requires, is attributable to a U.S. permanent establishment or fixed base of the Non-U.S. Holder, generally will be taxed in the same manner as the income of a U.S. Holder. In addition, however, under certain circumstances, such income that is realized by a corporate Non-U.S. Holder may be subject to an additional “branch profits tax” at the rate of 30% or at a lower rate that may be prescribed by an applicable income tax treaty.
71
Table of Contents
Backup withholding and information reporting
In general, information reporting requirements will apply to dividends on shares of common stock or ADSs paid to U.S. Holders in the United States or through certain U.S. related financial intermediaries and to the proceeds received upon the sale, exchange or redemption of shares of common stock or ADSs by U.S. Holders within the United States or through certain U.S. related financial intermediaries. Furthermore, backup withholding may apply to those amounts if a U.S. Holder fails to provide an accurate tax identification number or to report interest and dividends required to be shown on its U.S. federal income tax returns. The amount of backup withholding imposed on a payment to a U.S. Holder will be allowed as a credit against the holder’s U.S. federal income tax liability.
Dividends on shares of common stock or ADSs paid to Non-U.S. Holders and proceeds received upon the sale, exchange or redemption of shares of common stock or ADSs by non-U.S. Holders generally are exempt from information reporting and backup withholding. However, a holder may be required to provide certification of his or her non-U.S. status to obtain that exemption.
F. Dividends and paying agents
Not applicable
G. Statement by experts
Not applicable
H. Documents on display
It is possible to read and copy documents referred to in this annual report on Form 20-F that have been filed with the SEC at the SEC’s public reference room located at 450 Fifth Street, NW, Washington, D.C. 20549. You can also access the documents at the SEC’s website (http://www.sec.gov/).
I. Subsidiary information
Not applicable
Item 11. Quantitative and Qualitative Disclosures About Market Risk
We operate internationally, giving rise to exposure to market risks from changes in foreign exchange rates and interest rates. In an effort to manage potential adverse effects caused by market fluctuations in foreign exchange rates and interest rates, we hedge these market risks by selectively using derivative financial instruments. However, we do not hedge all of our exposure, and the extent of hedge as well as the type of hedging instruments to be used depends on factors including, but not limited to, type of risks exposed, market conditions and hedging cost. We do not hold or issue derivative financial instruments for trading purposes. To minimize credit risks from derivative financial instruments, we limit counterparties to reputable international financial institutions.
Marketable securities held by us are exposed to risk from changes in equity prices and consist entirely of available-for-sale securities. We do not take hedging measures against the market exposures on those securities.
72
Table of Contents
Foreign exchange risk
To hedge certain purchase and sale commitments and anticipated but not yet committed transactions denominated in other than functional currencies, we enter into forward exchange contracts and purchase and write currency options. Written options are entered into only with purchased options.
The following table provides information about our derivative financial instruments related to foreign currency exchange transactions as of March 31, 2002 and 2001, which have been translated into yen at the rate as of such date, together with the related weighted average contractual exchange rates at March 31, 2002 and 2001. All of the contracts mature within one year.
March 31, 2002
| Forward exchange contract | Millions of yen except average rates | |||||||||||||||||||||||||||
| Functional currency | Yen | THB | A$ | S$ | ||||||||||||||||||||||||
| Sell/Buy | US$/Yen | THB/US$ | A$/Yen | A$/US$ | A$/GBP | US$/S$ | Total | |||||||||||||||||||||
| Contract amounts | ¥266 | ¥149 | ¥100 | ¥1,395 | ¥54 | ¥1,067 | ¥3,031 | |||||||||||||||||||||
| Average contractual exchange rates | 131.50 | 43.407 | 69.85 | 0.5156 | 0.3640 | 1.829 | ||||||||||||||||||||||
| Fair value | (¥1 | ) | ¥0 | ¥1 | (¥26 | ) | (¥1 | ) | (¥6 | ) | (¥33 | ) | ||||||||||||||||
| Currency option | Millions of yen except average rates | ||||||||||||
| Functional currency | Yen | ||||||||||||
| Sell/Buy | EUR/Yen | Yen/EUR | Total | ||||||||||
| Notional amount | ¥1,440 | ¥1,440 | ¥ | 2,880 | |||||||||
| Average execution rate | 110.00 | 0.00909 | |||||||||||
| Fair value | ¥2 | (¥10 | ) | (¥8 | ) | ||||||||
March 31, 2001
| Forward exchange contract | Millions of yen except average rates | |||||||||||||||||||||||||||
| Functional currency | Yen | THB | Euro | A$ | S$ | |||||||||||||||||||||||
| Sell/Buy | US$/Yen | THB/US$ | Euro/Yen | A$/Yen | A$/US$ | US$/S$ | Total | |||||||||||||||||||||
| Contract amounts | ¥ | 11,647 | ¥32 | ¥7,544 | ¥301 | ¥186 | ¥123 | ¥ | 19,833 | |||||||||||||||||||
| Average contractual exchange rates | 115.37 | 36.429 | 107.01 | 59.98 | 0.5158 | 1.795 | ||||||||||||||||||||||
| Fair value | (¥660 | ) | ¥1 | (¥86 | ) | (¥1 | ) | ¥9 | ¥0 | (¥737 | ) | |||||||||||||||||
| Currency option | Millions of yen except average rates | |||||||||||||||||||
| Functional currency | Yen | A$ | ||||||||||||||||||
| Sell/Buy | US$/Yen | Yen/US$ | A$/US$ | US$/A$ | Total | |||||||||||||||
| Notional amount | ¥1,487 | ¥1,486 | ¥434 | ¥434 | ¥ | 3,841 | ||||||||||||||
| Average execution rate | 119.30 | 0.00838 | 0.55 | 0.58 | ||||||||||||||||
| Fair value | (¥6 | ) | (¥8 | ) | (¥46 | ) | ¥67 | ¥7 | ||||||||||||
73
Table of Contents
To change the currency and interest rate features of intercompany financial transactions, we have entered into currency swap contracts with banks. Currency swap contracts effectively changed, in substance, U.S. dollars floating interest rate intercompany borrowings into yen fixed interest rate borrowings and Euro floating interest rate borrowings. The foreign exchange risk inherent in our currency swap as of March 31, 2002 and 2001 are summarized as follows:
| Currency swap as of March 31, 2002 | Millions except average rates | ||||||||||||||||||||||||||||
| Expected maturity date | |||||||||||||||||||||||||||||
| Contract amounts | (year ending March 31) | ||||||||||||||||||||||||||||
| Sell | Buy | 2003 | 2004 | 2005 | Total | Fair value | |||||||||||||||||||||||
| Functional currency: Yen | ¥ | 24,678 | US$200 | ¥5,893 | ¥6,195 | ¥ | 12,590 | ¥ | 24,678 | ¥ | 2,048 | ||||||||||||||||||
| Average contractual exchange rate | 117.85 | 123.90 | 125.90 | ||||||||||||||||||||||||||
| Functional currency: Euro | EUR116 | US$100 | ¥ | 13,487 | ¥ | 13,487 | ( | ¥222 | ) | ||||||||||||||||||||
| Average contractual exchange rate | 0.86 | ||||||||||||||||||||||||||||
| Functional currency: Singapore dollar | S$65 | US$36 | ¥4,717 | ¥4,717 | ¥20 | ||||||||||||||||||||||||
| Average contractual exchange rate | 1.84 | ||||||||||||||||||||||||||||
| Currency swap as of March 31, 2001 | Millions except average rates | ||||||||||||||||||||||||
| Expected maturity date | |||||||||||||||||||||||||
| Contract amounts | (year ending March 31) | ||||||||||||||||||||||||
| Sell | Buy | 2002 | 2003 | Total | Fair value | ||||||||||||||||||||
| Functional currency: Yen | ¥ | 17,193 | US$150 | ¥ | 11,300 | ¥5,893 | ¥ | 17,193 | ¥ | 1,673 | |||||||||||||||
| Average contractual exchange rate | 113.54 | 117.85 | |||||||||||||||||||||||
| Functional currency: Euro | EUR110 | US$100 | ¥ | 12,016 | ¥ | 12,016 | ¥367 | ||||||||||||||||||
| Average contractual exchange rate | 0.91 | ||||||||||||||||||||||||
With respect to interest rate risk inherent in our currency swaps as of March 31, 2002 and 2001, see “Interest rate risk” below.
74
Table of Contents
Interest rate risk
Interest rate risk inherent in the aforementioned currency swaps as of March 31, 2002 and 2001 are summarized as follows:
| Currency swap as of March 31, 2002 | Millions except average rates | |||||||||||||||||||||||||||||
| Expected maturity date | ||||||||||||||||||||||||||||||
| Contract amounts | (year ending March 31) | |||||||||||||||||||||||||||||
| Sell | Buy | 2003 | 2004 | 2005 | Total | Fair value | ||||||||||||||||||||||||
| Functional currency: Yen | ||||||||||||||||||||||||||||||
| Variable (US$) to Fixed (Yen) | ¥ | 24,678 | US$200 | ¥5,893 | ¥ | 6,195 | ¥ | 12,590 | ¥ | 24,678 | ¥ | 2,048 | ||||||||||||||||||
| Average pay rate | 0.43 | % | 0.14 | % | 0.41 | % | ||||||||||||||||||||||||
| Average receive rate | 2.02 | % | 1.91 | % | 2.53 | % | ||||||||||||||||||||||||
| Functional currency: Euro | ||||||||||||||||||||||||||||||
| Variable (US$) to Variable (Euro) | EUR116 | US$100 | ¥ | 13,487 | ¥ | 13,487 | (¥222 | ) | ||||||||||||||||||||||
| Average pay rate | 3.85 | % | ||||||||||||||||||||||||||||
| Average receive rate | 1.89 | % | ||||||||||||||||||||||||||||
| Functional currency: Euro | ||||||||||||||||||||||||||||||
| Variable (US$) to Fixed (S$) | S$65 | US$36 | ¥4,717 | ¥4,717 | ¥20 | |||||||||||||||||||||||||
| Average pay rate | 1.14 | % | ||||||||||||||||||||||||||||
| Average receive rate | 1.95 | % | ||||||||||||||||||||||||||||
| Currency swap as of March 31, 2001 | Millions except average rates | |||||||||||||||||||||||||||||
| Expected maturity date | ||||||||||||||||||||||||||||||
| Contract amounts | (year ending March 31) | |||||||||||||||||||||||||||||
| Sell | Buy | 2002 | 2003 | Total | Fair value | |||||||||||||||||||||||||
| Functional currency: Yen | ||||||||||||||||||||||||||||||
| Variable (US$) to Fixed (Yen) | ¥ | 17,193 | US$150 | ¥ | 11,300 | ¥ | 5,893 | ¥ | 17,193 | ¥ | 1,673 | |||||||||||||||||||
| Average pay rate | 0.39 | % | 0.43 | % | ||||||||||||||||||||||||||
| Average receive rate | 6.11 | % | 5.45 | % | ||||||||||||||||||||||||||
| Functional currency: Euro | ||||||||||||||||||||||||||||||
| Variable (US$) to Variable (Euro) | EUR110 | US$100 | ¥ | 12,016 | ¥ | 12,016 | ¥367 | |||||||||||||||||||||||
| Average pay rate | 4.93 | % | ||||||||||||||||||||||||||||
| Average receive rate | 5.53 | % | ||||||||||||||||||||||||||||
75
Table of Contents
Principal cash flows by expected maturity dates, weighted average interest rates, and fair value of our debt obligations as of March 31, 2002 and 2001 are as follows:
| Long-term debt (including due within one year) as of March 31, 2002 | Millions of yen except average rates | |||||||||||||||||||||||||||||||||||||
| Expected maturity date (year ending March 31) | ||||||||||||||||||||||||||||||||||||||
| Functional | ||||||||||||||||||||||||||||||||||||||
| Currency | 2003 | 2004 | 2005 | 2006 | 2007 | Thereafter | Total | Fair value | ||||||||||||||||||||||||||||||
| Fixed rate (Yen) | Yen | ¥ | 2,446 | 1,591 | 5,831 | 15,326 | 256 | 12,007 | ¥ | 37,457 | ¥ | 38,254 | ||||||||||||||||||||||||||
| Average interest rate | 2.17 | % | 3.06 | % | 3.89 | % | 2.38 | % | 3.80 | % | 2.97 | % | 2.83 | % | ||||||||||||||||||||||||
| Variable rate (US$) | US$ | 666 | 666 | 666 | ||||||||||||||||||||||||||||||||||
| Average interest rate | 2.41 | % | 2.41 | % | ||||||||||||||||||||||||||||||||||
| Interest free loan (PTE) | PTE | 43 | 43 | 43 | ||||||||||||||||||||||||||||||||||
| Total | ¥ | 2,489 | 1,591 | 5,831 | 15,992 | 256 | 12,007 | ¥ | 38,166 | ¥ | 38,963 | |||||||||||||||||||||||||||
| Long-term debt (including due within one year) as of March 31, 2001 | Millions of yen except average rates | |||||||||||||||||||||||||||||||||||||
| Expected maturity date (year ending March 31) | ||||||||||||||||||||||||||||||||||||||
| Functional | ||||||||||||||||||||||||||||||||||||||
| Currency | 2002 | 2003 | 2004 | 2005 | 2006 | Thereafter | Total | Fair value | ||||||||||||||||||||||||||||||
| Fixed rate (Yen) | Yen | ¥ | 7,560 | 2,412 | 1,556 | 5,796 | 15,306 | 12,262 | ¥ | 44,892 | ¥ | 46,492 | ||||||||||||||||||||||||||
| Average interest rate | 1.77 | % | 2.37 | % | 3.09 | % | 3.91 | % | 2.38 | % | 2.99 | % | 2.65 | % | ||||||||||||||||||||||||
| Variable rate (US$) | US$ | 620 | 620 | 620 | ||||||||||||||||||||||||||||||||||
| Average interest rate | 4.47 | % | 4.47 | % | ||||||||||||||||||||||||||||||||||
| Interest free loan (PTE) | PTE | 82 | 41 | 123 | 123 | |||||||||||||||||||||||||||||||||
| Total | ¥ | 7,642 | 2,453 | 1,556 | 5,796 | 15,926 | 12,262 | ¥ | 45,635 | ¥ | 47,235 | |||||||||||||||||||||||||||
Market price risks on available-for-sale securities
We do not own any marketable securities for trading purposes. Our equity investment portfolio consists almost entirely of securities issued by Japanese companies. The following table sets forth the maturity dates and cost and fair values of debt securities in our investment portfolio, and the cost and fair values of equity securities therein, at March 31, 2002 and 2001.
| Millions of yen | ||||||||||||||||||||||||||||||||||||||
| 2002 | 2001 | |||||||||||||||||||||||||||||||||||||
| Cost | Fair value | Cost | Fair value | |||||||||||||||||||||||||||||||||||
| Debt securities (by contractual maturities) | ||||||||||||||||||||||||||||||||||||||
| Maturing within one year | 3,485 | 3,447 | 1,614 | 1,579 | ||||||||||||||||||||||||||||||||||
| Maturing over one year | 111 | 78 | 128 | 100 | ||||||||||||||||||||||||||||||||||
| Equity securities | 7,973 | 18,290 | 9,773 | 23,658 | ||||||||||||||||||||||||||||||||||
Item 12. Description of Securities Other than Equity Securities
Not applicable
76
Table of Contents
PART II
Item 13. Defaults, Dividend Arrearages and Delinquencies
None
Item 14. Material Modifications to the Rights of Security Holders and Use of Proceeds
Not applicable
Item 15. [Reserved]
Item 16. [Reserved]
77
Table of Contents
PART III
Item 17. Financial Statements
See Consolidated Financial Statements and Schedules. Reference is made to Item 19 for a list of all financial statements filed as part of this annual report.
Item 18. Financial Statements
We have responded to Item 17 in lieu of responding to this Item.
Item 19. Exhibits
| Page | |||||
Consolidated financial statements and schedules | |||||
| Index to Consolidated Financial Statements and Schedules | F-1 | ||||
| Independent Auditors’ Report | F-2 | ||||
| Consolidated Balance Sheets as of March 31, 2001 and 2002 | F-3 | ||||
| Consolidated Statements of Income for the years ended March 31, 2000, 2001 and 2002 | F-5 | ||||
| Consolidated Statements of Shareholders’ Equity for the years ended March 31, 2000, 2001 and 2002 | F-6 | ||||
| Consolidated Statements of Cash Flows for the years ended March 31, 2000, 2001 and 2002 | F-7 | ||||
| Notes to Consolidated Financial Statements | F-8 | ||||
| Supplemental information to conform with Regulation S-X: | |||||
| Independent Auditors’ Report | F-27 | ||||
| Supplemental Notes to Consolidated Financial Statements to Conform with Regulation S-X | F-28 | ||||
| Schedules for the Years Ended March 31, 2000, 2001 and 2002 II—Valuation and Qualifying Accounts | F-29 | ||||
| (Note—Schedules other those listed above are omitted because of the absence of the conditions under which they are required or because the information called for is included in the consolidated financial statements or notes thereto) |
| Exhibits | ||||
| 1.01 | The Articles of Incorporation, as amended and currently in effect (English translation) | |||
| 2(a).01 | Share Handling Regulations, as amended and currently in effect (English translation) | |||
| 2(a).02 | Regulation of Meetings of the Board of Directors, as amended and currently in effect (English translation) |
78
Table of Contents
SIGNATURES
The registrant hereby certifies that it meets all of the requirements for filing on Form 20-F and that it has duly caused and authorized the undersigned to sign this annual report on its behalf.
| PIONEER CORPORATION (Registrant) | ||||
| Date: July 25, 2002 | By | /s/ Katsuhiro Abe | ||
| Katsuhiro Abe Chief Financial Officer |
79
Table of Contents
INDEX TO CONSOLIDATED FINANCIAL STATEMENTS AND SCHEDULES
| Page | ||||
| | ||||
| Consolidated financial statements and schedules | ||||
| Independent Auditors’ Report | F-2 | |||
| Consolidated Balance Sheets as of March 31, 2001 and 2002 | F-3 | |||
| Consolidated Statements of Income for the years ended March 31, 2000, 2001 and 2002 | F-5 | |||
| Consolidated Statements of Shareholders’ Equity for the years ended March 31, 2000, 2001 and 2002 | F-6 | |||
| Consolidated Statements of Cash Flows for the years ended March 31, 2000, 2001 and 2002 | F-7 | |||
| Notes to Consolidated Financial Statements | F-8 | |||
| Supplemental information to conform with Regulation S-X: | ||||
| Independent Auditors’ Report | F-27 | |||
| Supplemental Notes to Consolidated Financial Statements to Conform with Regulation S-X | F-28 | |||
| Schedules for the Years Ended March 31, 2000, 2001 and 2002 | ||||
| II—Valuation and Qualifying Accounts | F-29 | |||
(Note—Schedules other those listed above are omitted because of the absence of the conditions under which they are required or because the information called for is included in the consolidated financial statements or notes thereto)
F-1
Table of Contents
Independent Auditors’ Report
To the Board of Directors and Shareholders of Pioneer Corporation:
We have audited the accompanying consolidated balance sheets of Pioneer Corporation and subsidiaries as of March 31, 2001 and 2002, and the related consolidated statements of income, shareholders’ equity and cash flows for each of the three years in the period ended March 31, 2002 (all expressed in Japanese yen). These financial statements are the responsibility of the Company’s management. Our responsibility is to express an opinion on these financial statements based on our audits.
We conducted our audits in accordance with auditing standards generally accepted in the United States of America. Those standards require that we plan and perform the audit to obtain reasonable assurance about whether the financial statements are free of material misstatement. An audit includes examining, on a test basis, evidence supporting the amounts and disclosures in the financial statements. An audit also includes assessing the accounting principles used and significant estimates made by management, as well as evaluating the overall financial statement presentation. We believe that our audits provide a reasonable basis for our opinion.
The accompanying consolidated financial statements do not present segment information concerning the Company’s operations which, in our opinion, is required for a complete presentation of the Company’s consolidated financial statements in accordance with accounting principles generally accepted in the United States of America.
In our opinion, except for the omission of segment information disclosures, such consolidated financial statements present fairly, in all material respects, the financial position of Pioneer Corporation and subsidiaries as of March 31, 2001 and 2002, and the results of their operations and their cash flows for each of the three years in the period ended March 31, 2002 in conformity with accounting principles generally accepted in the United States of America.
Our audits also comprehended the translation of Japanese yen amounts into U.S. dollar amounts and, in our opinion, such translation has been made in conformity with the basis stated in Note 1. Such U.S. dollar amounts are presented solely for the convenience of readers outside Japan.
/s/ Deloitte Touche Tohmatsu
Deloitte Touche Tohmatsu
Tokyo, Japan
May 2, 2002, except for Note 20.b and c, as to which the dates are June 28, 2002 and July 15, 2002, respectively.
F-2
Table of Contents
Consolidated Balance Sheets
Pioneer Corporation and Subsidiaries
March 31
| Thousands of | |||||||||||||||
| U.S. Dollars | |||||||||||||||
| Millions of Yen | (Note 1) | ||||||||||||||
| Assets | 2001 | 2002 | 2002 | ||||||||||||
Current assets: | |||||||||||||||
| Cash and cash equivalents— | |||||||||||||||
| Cash, including time deposits of ¥55,915 million— $420,414 thousand (¥83,197 million in 2001) | ¥121,127 | ¥127,113 | $ 955,737 | ||||||||||||
| Available-for-sale securities (Note 3) | 1,598 | 3,455 | 25,977 | ||||||||||||
| Trade receivables— | |||||||||||||||
| Notes | 8,079 | 10,240 | 76,992 | ||||||||||||
| Accounts | 116,594 | 120,456 | 905,684 | ||||||||||||
| Allowance for doubtful notes and accounts | (5,895 | ) | (5,133 | ) | (38,594 | ) | |||||||||
| Inventories (Note 4) | 94,429 | 96,910 | 728,647 | ||||||||||||
| Deferred income taxes (Note 8) | 21,897 | 26,270 | 197,519 | ||||||||||||
| Prepaid expenses and other current assets | 30,783 | 32,509 | 244,429 | ||||||||||||
| Total current assets | 388,612 | 411,820 | 3,096,391 | ||||||||||||
Investments and long-term receivables: | |||||||||||||||
| Available-for-sale securities (Note 3) | 23,739 | 18,360 | 138,045 | ||||||||||||
| Investments in and advances to affiliated companies (Note 5) | 6,395 | 11,067 | 83,210 | ||||||||||||
| Sundry investments (Note 15) | 4,787 | 3,203 | 24,083 | ||||||||||||
| Long-term receivables, less allowance for doubtful accounts of ¥186 million—$1,398 thousand (¥3,926 million in 2001) | 76 | 374 | 2,812 | ||||||||||||
| Total investments and long-term receivables | 34,997 | 33,004 | 248,150 | ||||||||||||
Property, plant and equipment(Note 6): | |||||||||||||||
| Land | 25,876 | 26,525 | 199,436 | ||||||||||||
| Buildings | 105,256 | 110,869 | 833,602 | ||||||||||||
| Machinery and equipment | 224,278 | 242,600 | 1,824,060 | ||||||||||||
| Construction in progress | 3,490 | 2,163 | 16,263 | ||||||||||||
| Total | 358,900 | 382,157 | 2,873,361 | ||||||||||||
| Accumulated depreciation | (219,143 | ) | (231,397 | ) | (1,739,827 | ) | |||||||||
| Net property, plant and equipment | 139,757 | 150,760 | 1,133,534 | ||||||||||||
Other assets: | |||||||||||||||
| Patents, net of accumulated amortization of ¥25,562 million— $192,195 thousand (¥23,048 million in 2001) | 3,484 | 3,287 | 24,715 | ||||||||||||
| Deferred income taxes (Note 8) | 16,301 | 25,151 | 189,105 | ||||||||||||
| Other | 22,005 | 21,107 | 158,699 | ||||||||||||
| Total other assets | 41,790 | 49,545 | 372,519 | ||||||||||||
| Total | ¥605,156 | ¥645,129 | $4,850,594 | ||||||||||||
See notes to consolidated financial statements.
F-3
Table of Contents
| Thousands of | |||||||||||||||
| U.S. Dollars | |||||||||||||||
| Millions of Yen | (Note 1) | ||||||||||||||
| Liabilities and Shareholders’ Equity | 2001 | 2002 | 2002 | ||||||||||||
Current liabilities: | |||||||||||||||
| Short-term borrowings (Note 6) | ¥ | 37,571 | ¥ | 45,867 | $ | 344,865 | |||||||||
| Current portion of long-term debt (Note 6) | 7,996 | 2,551 | 19,181 | ||||||||||||
| Trade payables | 45,877 | 57,231 | 430,308 | ||||||||||||
| Accrued liabilities— | |||||||||||||||
| Taxes on income | 6,008 | 4,642 | 34,902 | ||||||||||||
| Payroll | 14,799 | 15,662 | 117,759 | ||||||||||||
| Other | 48,196 | 52,302 | 393,248 | ||||||||||||
| Dividends payable | 1,349 | 1,350 | 10,150 | ||||||||||||
| Other current liabilities | 16,029 | 14,705 | 110,564 | ||||||||||||
| Total current liabilities | 177,825 | 194,310 | 1,460,977 | ||||||||||||
Long-term liabilities: | |||||||||||||||
| Long-term debt (Note 6) | 38,304 | 35,677 | 268,248 | ||||||||||||
| Accrued pension and severance cost (Note 7) | 30,472 | 46,270 | 347,895 | ||||||||||||
| Deferred income taxes (Note 8) | 721 | 918 | 6,902 | ||||||||||||
| Other long-term liabilities | 2,276 | 1,707 | 12,835 | ||||||||||||
| Total long-term liabilities | 71,773 | 84,572 | 635,880 | ||||||||||||
Commitments and contingent liabilities(Note 17) | |||||||||||||||
Minority interests | 18,563 | 19,244 | 144,692 | ||||||||||||
Shareholders’ equity(Note 9): | |||||||||||||||
| Common stock, ¥50 par value—2001, No par value—2002 Authorized— 400,000,000 shares Issued—179,894,370 shares—2001 and 180,063,836 shares—2002 | 48,843 | 49,049 | 368,790 | ||||||||||||
| Additional paid-in capital | 81,458 | 82,010 | 616,616 | ||||||||||||
| Retained earnings | 235,345 | 240,692 | 1,809,714 | ||||||||||||
| Accumulated other comprehensive income (loss) (Note 11) | (28,651 | ) | (24,736 | ) | (185,985 | ) | |||||||||
| Treasury stock, at cost 4,272 shares—2002 | – | (12 | ) | (90 | ) | ||||||||||
| Total shareholders’ equity | 336,995 | 347,003 | 2,609,045 | ||||||||||||
| Total | ¥ | 605,156 | ¥ | 645,129 | $ | 4,850,594 | |||||||||
F-4
Table of Contents
Consolidated Statements of Income
Pioneer Corporation and Subsidiaries
Year ended March 31
| Thousands of | |||||||||||||||||||
| U.S. Dollars | |||||||||||||||||||
| Millions of Yen | (Note 1) | ||||||||||||||||||
| 2000 | 2001 | 2002 | 2002 | ||||||||||||||||
Operating revenue: | |||||||||||||||||||
| Net sales | ¥596,411 | ¥626,539 | ¥651,311 | $ | 4,897,075 | ||||||||||||||
| Royalty revenue | 19,460 | 20,530 | 17,588 | 132,241 | |||||||||||||||
| Total operating revenue | 615,871 | 647,069 | 668,899 | 5,029,316 | |||||||||||||||
Operating costs and expenses: | |||||||||||||||||||
| Cost of sales | 428,575 | 447,389 | 465,336 | 3,498,767 | |||||||||||||||
| Selling, general and administrative | 163,703 | 165,861 | 182,282 | 1,370,541 | |||||||||||||||
| Total operating costs and expenses | 592,278 | 613,250 | 647,618 | 4,869,308 | |||||||||||||||
Operating income | 23,593 | 33,819 | 21,281 | 160,008 | |||||||||||||||
Other income (expenses): | |||||||||||||||||||
| Interest income | 3,072 | 4,920 | 3,039 | 22,849 | |||||||||||||||
| Gain on sale and issuance of subsidiary stock (Note 18) | 12,491 | – | – | – | |||||||||||||||
| Foreign exchange gain (loss) | (5,132 | ) | (1,192 | ) | 297 | 2,233 | |||||||||||||
| Interest expense | (4,679 | ) | (4,301 | ) | (3,445 | ) | (25,902 | ) | |||||||||||
| Other—net (Note 12) | (1,537 | ) | 947 | (5,829 | ) | (43,827 | ) | ||||||||||||
| Total other income (expenses) | 4,215 | 374 | (5,938 | ) | (44,647 | ) | |||||||||||||
Income before income taxes | 27,808 | 34,193 | 15,343 | 115,361 | |||||||||||||||
Income taxes(Note 8): | |||||||||||||||||||
| Current | 12,097 | 15,011 | 11,107 | 83,511 | |||||||||||||||
| Deferred | 3,119 | (691 | ) | (4,385 | ) | (32,970 | ) | ||||||||||||
| Total income taxes | 15,216 | 14,320 | 6,722 | 50,541 | |||||||||||||||
Income before minority interest and equity in earnings (losses) | 12,592 | 19,873 | 8,621 | 64,820 | |||||||||||||||
Minority interest in income of subsidiaries | (18 | ) | (1,445 | ) | (504 | ) | (3,789 | ) | |||||||||||
Equity in earnings (losses) of affiliated companies(Note 5) | 501 | (130 | ) | (70 | ) | (527 | ) | ||||||||||||
Net income | ¥ 13,075 | ¥ 18,298 | ¥ 8,047 | $ | 60,504 | ||||||||||||||
| Yen | U.S. Dollars | ||||||||||||||||||
| 2000 | 2001 | 2002 | 2002 | ||||||||||||||||
Per share of common stock and per American Depositary Share: | |||||||||||||||||||
| Net income (Note 16) | |||||||||||||||||||
| Basic | ¥72.81 | ¥101.76 | ¥44.70 | $0.34 | |||||||||||||||
| Diluted | 72.80 | 101.70 | 44.69 | 0.34 | |||||||||||||||
See notes to consolidated financial statements.
F-5
Table of Contents
Consolidated Statements of Shareholders’ Equity
Pioneer Corporation and Subsidiaries
Year ended March 31
| Millions of Yen | |||||||||||||||||||||||||||||
| Outstanding | Accumulated | ||||||||||||||||||||||||||||
| Number of | Additional | Other | Total | ||||||||||||||||||||||||||
| Shares | Common | Paid-in | Retained | Comprehensive | Treasury | Shareholders' | |||||||||||||||||||||||
| (Thousands) | Stock | Capital | Earnings | Income (Loss) | Stock | Equity | |||||||||||||||||||||||
| Balance at March 31, 1999 | 179,573 | ¥ 48,431 | ¥ 80,611 | ¥ 208,466 | (¥ 24,264 | ) | ¥ 313,244 | ||||||||||||||||||||||
| Comprehensive income | |||||||||||||||||||||||||||||
| Net income | 13,075 | 13,075 | |||||||||||||||||||||||||||
| Other comprehensive income (loss) | (12,178 | ) | (12,178 | ) | |||||||||||||||||||||||||
| Comprehensive income | 897 | ||||||||||||||||||||||||||||
| Exercise of warrants | 15 | 21 | 21 | 42 | |||||||||||||||||||||||||
| Value ascribed to warrants (Note 10) | 73 | 73 | |||||||||||||||||||||||||||
| Cash dividends (¥10.00 per share) | (1,796 | ) | (1,796 | ) | |||||||||||||||||||||||||
| Balance at March 31, 2000 | 179,588 | 48,452 | 80,705 | 219,745 | (36,442 | ) | 312,460 | ||||||||||||||||||||||
| Comprehensive income | |||||||||||||||||||||||||||||
| Net income | 18,298 | 18,298 | |||||||||||||||||||||||||||
| Other comprehensive income | 7,791 | 7,791 | |||||||||||||||||||||||||||
| Comprehensive income | 26,089 | ||||||||||||||||||||||||||||
| Exercise of warrants | 306 | 391 | 391 | 782 | |||||||||||||||||||||||||
| Value ascribed to warrants and stock options (Note 10) | 362 | 362 | |||||||||||||||||||||||||||
| Cash dividends (¥15.00 per share) | (2,698 | ) | (2,698 | ) | |||||||||||||||||||||||||
| Balance at March 31, 2001 | 179,894 | 48,843 | 81,458 | 235,345 | (28,651 | ) | 336,995 | ||||||||||||||||||||||
| Comprehensive income | |||||||||||||||||||||||||||||
| Net income | 8,047 | 8,047 | |||||||||||||||||||||||||||
| Other comprehensive income | 3,915 | 3,915 | |||||||||||||||||||||||||||
| Comprehensive income | 11,962 | ||||||||||||||||||||||||||||
| Exercise of warrants | 170 | 206 | 206 | 412 | |||||||||||||||||||||||||
| Value ascribed to warrants and stock options (Note 10) | 346 | 346 | |||||||||||||||||||||||||||
| Purchase and sale of treasury stock, net | (¥12 | ) | (12 | ) | |||||||||||||||||||||||||
| Cash dividends (¥15.00 per share) | (2,700 | ) | (2,700 | ) | |||||||||||||||||||||||||
| Balance at March 31, 2002 | 180,064 | ¥49,049 | ¥82,010 | ¥240,692 | (¥24,736 | ) | (¥12 | ) | ¥347,003 | ||||||||||||||||||||
| Thousands of U.S. Dollars (Note 1) | |||||||||||||||||||||||||
| Accumulated | |||||||||||||||||||||||||
| Additional | Other | Total | |||||||||||||||||||||||
| Common | Paid-in | Retained | Comprehensive | Treasury | Shareholders' | ||||||||||||||||||||
| Stock | Capital | Earnings | Income (Loss) | Stock | Equity | ||||||||||||||||||||
| Balance at March 31, 2001 | $ | 367,241 | $ | 612,466 | $ | 1,769,511 | ($215,421 | ) | $ | 2,533,797 | |||||||||||||||
| Comprehensive income | |||||||||||||||||||||||||
| Net income | 60,504 | 60,504 | |||||||||||||||||||||||
| Other comprehensive income | 29,436 | 29,436 | |||||||||||||||||||||||
| Comprehensive income | 89,940 | ||||||||||||||||||||||||
| Exercise of warrants | 1,549 | 1,549 | 3,098 | ||||||||||||||||||||||
| Value ascribed to warrants and stock options (Note 10) | 2,601 | 2,601 | |||||||||||||||||||||||
| Purchase and sale of treasury stock, net | ($90 | ) | (90 | ) | |||||||||||||||||||||
| Cash dividends ($0.11 per share) | (20,301 | ) | (20,301 | ) | |||||||||||||||||||||
| Balance at March 31, 2002 | $ | 368,790 | $ | 616,616 | $ | 1,809,714 | ($185,985 | ) | ($90 | ) | $ | 2,609,045 | |||||||||||||
See notes to consolidated financial statements.
F-6
Table of Contents
Consolidated Statements of Cash Flows
Pioneer Corporation and Subsidiaries
Year ended March 31
| Thousands of | |||||||||||||||||||
| U.S. Dollars | |||||||||||||||||||
| Millions of Yen | (Note 1) | ||||||||||||||||||
| 2000 | 2001 | 2002 | 2002 | ||||||||||||||||
Operating activities: | |||||||||||||||||||
| Net income | ¥ | 13,075 | ¥ | 18,298 | ¥ | 8,047 | $ | 60,504 | |||||||||||
| Adjustments to reconcile net income to net cash provided by operating activities: | |||||||||||||||||||
| Depreciation and amortization | 32,852 | 32,405 | 36,782 | 276,556 | |||||||||||||||
| Minority interest in income of subsidiaries | 18 | 1,445 | 504 | 3,789 | |||||||||||||||
| Equity in (earnings) losses of affiliated companies, less dividends | (250 | ) | 136 | 79 | 594 | ||||||||||||||
| Deferred income taxes | 3,119 | (691 | ) | (4,385 | ) | (32,970 | ) | ||||||||||||
| Provision for pension and severance cost, less payments | 1,763 | (1,993 | ) | 392 | 2,947 | ||||||||||||||
| Loss on sale of fixed assets | 2,641 | 914 | 3,340 | 25,113 | |||||||||||||||
| (Gain) loss on sale and write-down of investments and securities | (4,151 | ) | (254 | ) | 2,287 | 17,195 | |||||||||||||
| Impairment losses of fixed assets | 3,972 | 1,163 | – | – | |||||||||||||||
| Gain on sale and issuance of subsidiary stock | (12,491 | ) | – | – | – | ||||||||||||||
| Increase in trade notes and accounts receivable | (12,500 | ) | (6,729 | ) | (2,225 | ) | (16,729 | ) | |||||||||||
| Decrease in inventories | 6,416 | 5,786 | 3,288 | 24,722 | |||||||||||||||
| Increase in prepaid expenses and other current assets | (691 | ) | (2,430 | ) | (2,706 | ) | (20,346 | ) | |||||||||||
| Increase in trade payables | 5,536 | 177 | 9,304 | 69,955 | |||||||||||||||
| Increase (decrease) in accrued taxes on income | 185 | (1,204 | ) | (1,473 | ) | (11,075 | ) | ||||||||||||
| Increase in other accrued liabilities | 3,820 | 1,184 | 2,716 | 20,421 | |||||||||||||||
| Other | 2,076 | 3,034 | 1,160 | 8,722 | |||||||||||||||
| Net cash provided by operating activities | 45,390 | 51,241 | 57,110 | 429,398 | |||||||||||||||
Investing activities: | |||||||||||||||||||
| Payment for purchase of fixed assets | (25,458 | ) | (42,183 | ) | (46,996 | ) | (353,353 | ) | |||||||||||
| Payment for investment securities | (476 | ) | (5,798 | ) | (4,566 | ) | (34,331 | ) | |||||||||||
| Payment for available-for-sale securities | (1,046 | ) | (1,233 | ) | (2,031 | ) | (15,271 | ) | |||||||||||
| Proceeds from sale of fixed assets and investment securities | 5,675 | 5,631 | 2,203 | 16,564 | |||||||||||||||
| Proceeds from sale of available-for-sale securities | 6,140 | 1,789 | 177 | 1,331 | |||||||||||||||
| Proceeds from sale and issuance of subsidiary stock | 28,780 | – | – | – | |||||||||||||||
| Decrease in loans receivable | 1,835 | 410 | 1,071 | 8,053 | |||||||||||||||
| Other | (3,466 | ) | (197 | ) | (1,006 | ) | (7,564 | ) | |||||||||||
| Net cash provided by (used in) investing activities | 11,984 | (41,581 | ) | (51,148 | ) | (384,571 | ) | ||||||||||||
Financing activities: | |||||||||||||||||||
| Proceeds from long-term debt | 2,000 | – | – | – | |||||||||||||||
| Payment of long-term debt | (6,292 | ) | (37,760 | ) | (7,560 | ) | (56,842 | ) | |||||||||||
| Increase (decrease) in short-term borrowings | 1,158 | (7,078 | ) | 5,866 | 44,105 | ||||||||||||||
| Dividends paid | (1,796 | ) | (2,247 | ) | (2,699 | ) | (20,293 | ) | |||||||||||
| Other | 791 | 518 | 186 | 1,399 | |||||||||||||||
| Net cash used in financing activities | (4,139 | ) | (46,567 | ) | (4,207 | ) | (31,631 | ) | |||||||||||
| Effect of exchange rate changes on cash and cash equivalents | (3,493 | ) | 6,229 | 4,231 | 31,812 | ||||||||||||||
Net increase (decrease) in cash and cash equivalents | 49,742 | (30,678 | ) | 5,986 | 45,008 | ||||||||||||||
| Cash and cash equivalents, beginning of year | 102,063 | 151,805 | 121,127 | 910,729 | |||||||||||||||
Cash and cash equivalents, end of year | ¥ | 151,805 | ¥ | 121,127 | ¥ | 127,113 | $ | 955,737 | |||||||||||
See notes to consolidated financial statements.
F-7
Table of Contents
Notes to Consolidated Financial Statements
Pioneer Corporation and Subsidiaries
1. Basis of presentation and significant accounting policies:
1) Basis of Presentation
Basis of Financial Statements—
The accompanying consolidated financial statements are stated in Japanese yen, the currency of the country in which Pioneer Corporation (Pioneer Kabushiki Kaisha) (the “parent company”) is incorporated. The translation of Japanese yen amounts into U.S. dollar amounts for the year ended March 31, 2002 is included solely for the convenience of readers outside Japan and has been made at the rate of ¥133 to U.S.$1.00, the approximate rate of exchange at March 31, 2002. Such translation should not be construed as a representation that Japanese yen amounts could be converted into U.S. dollars at the above or any other rate.
The accompanying consolidated financial statements have been prepared on the basis of accounting principles generally accepted in the United States of America except for the omission of segment information concerning the operations of the parent company and its majority-owned subsidiaries (together, the “Company”), as required by Statement of Financial Accounting Standards (“SFAS”) No.131.
Effect has been given in the consolidated financial statements to adjustments which, because of either customary accounting practices in Japan or income tax law requirements, have not been entered in the Company’s general books of account. The major adjustments include those relating to (1) accounting for pension costs, (2) accounting for leases, and (3) accounting for financial instruments.
Nature of Operations—
The Company is engaged in the development, manufacture and sale of electronics products such as audio, video and car electronics, and of AV (audio/video) software on a global scale. The Company is one of the leading manufacturers of consumer, commercial and industrial AV products, including those employing laser optical disc technologies.
The principal production activities of the Company are carried out in Asia including Japan. The Company’s products are generally sold under its own brand names, principally “Pioneer.” The principal markets for the Company are Japan, the United States of America, European countries and Asia. The Company sells its products to customers in consumer, commercial and industrial markets through its sales offices in Japan, and its sales subsidiaries and independent distributors overseas. On an original-equipment-manufacturer basis, the Company markets certain products, such as car electronics products, to other companies.
Use of Estimates—
The preparation of the consolidated financial statements in conformity with generally accepted accounting principles requires management to make estimates and assumptions that affect the reported amounts of assets and liabilities and the disclosure of contingent assets and liabilities at the dates of these statements and the reported amounts of revenues and expenses during the reporting period.
Due to the inherent uncertainty involved in making estimates, actual results could differ from those estimates.
2) Summary of Significant Accounting Policies
Consolidation and Investments in Affiliated Companies—
The consolidated financial statements include the accounts of the parent company and its majority-owned subsidiaries. Investments in 20% to 50% owned companies are accounted for by the equity method of accounting. In July 2001, the Financial Accounting Standards Board issued Statement of Financial Accounting Standards No. 141 (“SFAS 141”), “Business Combinations.” SFAS 141 requires the purchase method of accounting for business combinations initiated after June 30, 2001 and eliminates the pooling-of-interests method. The excess of the cost of the investment in subsidiaries and 20% to 50% owned companies over the equity in the net assets at the date of acquisition before July 1, 2001 is amortized over a 5-to-10-year period. The adoption of SFAS 141 did not have a significant impact on the Company’s consolidated financial statements. All significant intercompany transactions have been eliminated.
Gains and losses resulting from the issuance of subsidiaries’ stock are recognized in consolidated earnings.
Foreign Currency Translation—
For all significant foreign operations, the functional currency is the local currency. Generally, all asset and liability accounts of foreign operations are translated into Japanese yen at year-end rates and all revenue and expense accounts are translated at rates prevailing at the time of the transactions. The resulting translation adjustments are accumulated and reported as a component of accumulated other comprehensive income (loss).
Foreign currency receivables and payables are translated at year-end exchange rates and resulting exchange gains and losses are recognized in earnings currently.
F-8
Table of Contents
Revenue Recognition—
Sales are generally recorded when merchandise is shipped to customers based on purchase orders or when services are rendered to the third parties. In certain cases, terms of the contract require the product to pass customer inspection after shipment and the Company records the sale upon satisfactory customer acceptance. Royalty revenue is recognized based on royalty statements from licensees.
Cash and Cash Equivalents—
Consolidated cash and cash equivalents include cash on hand and deposits in bank including time deposits. The Company considers all time deposits with an original maturity of one year or less to be cash equivalents. Generally, such time deposits can be withdrawn at any time without diminution of the principal amount.
Available-for-Sale Securities and Sundry Investments—
Under SFAS No. 115, “Accounting for Certain Investments in Debt and Equity Securities,” all debt securities and marketable equity securities held by the Company are classified as available-for-sale securities, and are carried at their fair values with unrealized gains and losses reported as a component of shareholders’ equity. Other investments other than marketable securities are stated at cost. The cost of securities is determined using the average-cost method.
The Company reviews the fair value of its available-for-sale securities on a regular basis to determine if the fair value of any individual security has declined below its cost and if such decline is other than temporary. If the decline in value is judged to be other than temporary, the cost basis of the security is written down to fair value. The resulting realized loss is included in the statements of consolidated income in the period in which the decline was deemed to be other than temporary.
Inventories—
Inventories are valued at the lower of cost, which is determined principally by the average-cost method, or market.
Property, Plant and Equipment and Depreciation—
Property, plant and equipment are stated at cost. Depreciation is computed principally using the declining-balance method for assets located in Japan and under the straight-line method for assets located outside Japan, using rates based on the estimated useful lives of the assets.
The estimated useful lives are as follows:
| Buildings | 3–65 years | ||
| Machinery and equipment | 2–17 years |
Patents—
The cost of patents, purchased when the Company acquired the business of a partnership, Discovision Associates, are amortized based on the straight-line basis over 10–20 years.
Long-Lived Assets—
The Company reviews its long-lived assets and certain identifiable intangibles for impairment whenever events or changes in circumstances indicate that the carrying amount of an asset may not be recoverable. When the sum of expected future cash flows is less than the carrying amount of the asset, an impairment loss is recognized. Such impairment loss is measured as the amount by which the carrying amount of the asset exceeds the fair value of the asset.
During the year ended March 31, 2000, the Company recorded an impairment loss of ¥1,872 million related to previously purchased intangible assets of its karaoke business reflecting reduced revenue expectations from the business and ¥2,100 million related to a factory facility closed during the year.
During the year ended March 31, 2001, the Company recorded an additional impairment loss of ¥1,163 million related to intangible assets of its karaoke business.
Income Taxes—
Income taxes are provided based on the asset and liability method of accounting. Deferred income taxes are recorded to reflect the tax consequences in future years of differences between the tax basis of assets and liabilities and their financial reporting amounts at year-end. These deferred taxes are measured by applying currently enacted tax laws. A valuation allowance is established to reduce deferred tax assets if it is more likely than not that all, or some portion, of such deferred tax assets will not be realized.
Accounting for Stock-Based Compensation—
The Company accounts for its stock-based compensation agreements using the fair value based method in accordance with SFAS No.123, “Accounting for Stock-Based Compensation.”
Earnings per Share—
Basic net income per share has been computed by dividing net income available to holders of common stock by the weighted-average number of shares of common stock outstanding during each year. Diluted net income per share reflects the potential dilution and has been computed on the basis that all dilutive warrants and stock options were exercised.
F-9
Table of Contents
Derivatives—
Derivative financial instruments utilized by the Company are comprised principally of forward exchange contracts, currency options and currency swaps. Forward exchange contracts and currency options, the majority of which mature within six months, and currency swaps, which mature from 2002 to 2005, are utilized to hedge exposures to foreign exchange risk and interest risk. The Company does not hold or issue derivative financial instruments for trading purposes.
Prior to April 1, 2001, gains and losses on hedges of existing assets and liabilities were included in the carrying amounts of those assets and liabilities and were ultimately recognized in other income (expenses). Gains and losses related to qualifying hedges of firm commitments or anticipated transactions were also deferred and were recognized in other income (expenses) or as adjustments of carrying amounts when the hedged transaction occurred. Unrealized gains and losses on forward contracts including foreign currency options intended as hedges for foreign currency risk of anticipated transactions with companies within the consolidated group were recognized currently in other income (expenses).
Accounting Changes—
At April 1, 2001, the Company adopted SFAS No. 133, “Accounting for Derivative Instruments and Hedging Activities,” as amended by SFAS No. 138, “Accounting for Certain Derivative Instruments and Certain Hedging Activities—an amendment of FASB Statement No.133.” Under SFAS No.133, all derivative instruments are recognized in the balance sheet at their fair values and changes in fair value are recognized immediately in earnings, unless the derivatives qualify as hedges of future cash flows. For derivatives qualifying as hedges of future cash flows, the effective portion of changes in fair value is recorded in other comprehensive income, then recognized in earnings along with the related effects of the hedged items. Any ineffective portion of hedges is reported in earnings as it occurs.
The cumulative effect of adopting this accounting change at April 1, 2001, was not significant.
Forward exchange contracts, currency swaps and currency options are utilized to hedge certain foreign currency and interest rate exposures. However, none of these derivatives were designated as hedging instruments under SFAS No. 133 at March 31, 2002. Unrealized gains and losses on such instruments are recognized currently in earnings.
Reclassifications—
Certain reclassifications and format changes have been made to prior year amounts to conform to the current year presentation.
New Accounting Standards—
In July 2001, the Financial Accounting Standards Board issued SFAS No. 142, “Goodwill and Other Intangible Assets,” which is effective for fiscal years beginning after December 15, 2001. Under SFAS No. 142, goodwill and other intangible assets with indefinite lives will no longer be amortized. Instead, the carrying value of these assets will be reviewed for impairment at least annually, or more frequently should circumstances indicate. Intangible assets with definite lives will continue to be amortized over their estimated useful lives. The adoption of SFAS No. 142 will not have a material impact on the Company’s consolidated financial position, result of operation or cash flows.
In June 2001, the Financial Accounting Standards Board issued SFAS No. 143, “Accounting for Asset Retirement Obligations,” which is effective for fiscal years beginning after June 15, 2002. SFAS No. 143 addresses the recognition and remeasurement of obligations associated with the retirement of tangible long-lived assets. The adoption of SFAS No. 143 will not have a material impact on the Company’s consolidated financial position, result of operation or cash flows.
In October 2001, the Financial Accounting Standards Board issued SFAS No.144, “Accounting for the Impairment or Disposal of Long-Lived Assets,” which is effective for fiscal years beginning after December 15, 2001. SFAS No. 144 applies to all long-lived assets (including discontinued operations) and it develops one accounting model for long-lived assets that are to be disposed of by sale. The Company has not determined the impact of its adoption on its consolidated financial position or result of operations.
In April 2001, the Emerging Issues Task Force reached a final consensus on Issue (“EITF”) 00-14, “Accounting for Certain Sales Incentives.” EITF 00-14 addresses the recognition, measurement, and income statement classification for sales incentives offered voluntarily by a vendor without charge to customers that can be used in, or that are exercisable by a customer as a result of, a single exchange transaction. In April 2001, the Emerging Issues Task Force also reached a final consensus on EITF 00-25, “Vendor Income Statement Characterization of Consideration Paid to a Reseller of the Vendor’s Products.” EITF 00-25 addresses income statement characterization of consideration, other than that directly addressed in EITF 00-14. EITF 01-9, “Accounting for Consideration given by a Vendor to a Customer” (including a Reseller of the Vendor’s Products), was issued to codify and reconcile EITF 00-14 and EITF 00-25.
F-10
Table of Contents
EITF 01-9 should be applied for the period beginning after December 15, 2001. The adoption of the recognition standards for liabilities is not expected to have a material effect on the Company’s consolidated financial position or results of operations. However, the adoption of the income statement display requirements of EITF 01-9 will result in a reduction in reported sales and a corresponding decrease in selling, general and administrative expenses, with no effect on net income. The Company is currently assessing the impact on the Company’s consolidated results of operations. The Company will reclassify prior years’ consolidated financial statements for comparative purposes if the impact is material.
2. Supplemental cash flow information:
Selected cash payments and noncash activities for the years ended March 31, 2000, 2001 and 2002 were as follows:
| Thousands of | |||||||||||||||||
| Millions of Yen | U.S. Dollars | ||||||||||||||||
| 2000 | 2001 | 2002 | 2002 | ||||||||||||||
| Cash payment for interest | ¥ | 4,608 | ¥ | 4,889 | ¥ | 3,281 | $ | 24,669 | |||||||||
| Cash payment for income taxes | 11,953 | 16,245 | 12,580 | 94,586 | |||||||||||||
| Noncash investing activities: | |||||||||||||||||
| Capitalized lease obligations incurred | 259 | 141 | – | – | |||||||||||||
3. Available-for-sale securities:
Cost, gross unrealized holding gains, gross unrealized holding losses and the aggregate fair value of available-for-sale securities at March 31, 2001 and 2002 were as follows:
| Millions of Yen | |||||||||||||||||||||||||||||||||||||
| 2001 | 2002 | ||||||||||||||||||||||||||||||||||||
| Gross | Gross | Gross | Gross | ||||||||||||||||||||||||||||||||||
| Unrealized | Unrealized | Unrealized | Unrealized | ||||||||||||||||||||||||||||||||||
| Holding | Holding | Aggregate | Holding | Holding | Aggregate | ||||||||||||||||||||||||||||||||
| Cost | Gains | Losses | Fair Value | Cost | Gains | Losses | Fair Value | ||||||||||||||||||||||||||||||
| Marketable equity securities: | |||||||||||||||||||||||||||||||||||||
| Current | ¥ | 19 | – | – | ¥ | 19 | ¥ | 10 | – | ¥ | 2 | ¥ | 8 | ||||||||||||||||||||||||
| Non-current | 9,754 | ¥ | 14,972 | ¥ | 1,087 | 23,639 | 7,963 | ¥ | 10,805 | 486 | 18,282 | ||||||||||||||||||||||||||
| Marketable debt securities: | |||||||||||||||||||||||||||||||||||||
| Current | 1,614 | – | 35 | 1,579 | 3,485 | – | 38 | 3,447 | |||||||||||||||||||||||||||||
| Non-current | 128 | – | 28 | 100 | 111 | – | 33 | 78 | |||||||||||||||||||||||||||||
| Total | ¥ | 11,515 | ¥ | 14,972 | ¥ | 1,150 | ¥ | 25,337 | ¥ | 11,569 | ¥ | 10,805 | ¥ | 559 | ¥ | 21,815 | |||||||||||||||||||||
F-11
Table of Contents
| Thousands of U.S. Dollars | ||||||||||||||||||
| 2002 | ||||||||||||||||||
| Gross | Gross | |||||||||||||||||
| Unrealized | Unrealized | |||||||||||||||||
| Holding | Holding | Aggregate | ||||||||||||||||
| Cost | Gains | Losses | Fair Value | |||||||||||||||
| Marketable equity securities: | ||||||||||||||||||
| Current | $ | 75 | – | $ | 15 | $ | 60 | |||||||||||
| Non-current | 59,872 | $ | 81,241 | 3,654 | 137,459 | |||||||||||||
| Marketable debt securities: | ||||||||||||||||||
| Current | 26,203 | – | 286 | 25,917 | ||||||||||||||
| Non-current | 834 | – | 248 | 586 | ||||||||||||||
| Total | $ | 86,984 | $ | 81,241 | $ | 4,203 | $ | 164,022 | ||||||||||
Gross realized gains on available-for-sale securities for the years ended March 31, 2000 and 2001 were ¥3,655 million and ¥1,556 million, respectively. Gross realized losses for the years ended March 31, 2000 and 2001 were ¥292 million and ¥2 million, respectively. Neither gross realized gains nor losses on available-for-sale securities was recorded for the year ended March 31, 2002.
At March 31, 2002, the fair values of marketable debt securities which were classified as available-for-sale due in one year and due over one year by contractual maturities were ¥1,999 million ($15,030 thousand) and ¥1,526 million ($11,473 thousand), respectively. For the years ended March 31, 2000, 2001 and 2002, losses on write-down of marketable equity securities were recognized to reflect the decline in market value considered to be other than temporary totaling ¥652 million, ¥246 million and ¥1,828 million ($13,744 thousand), respectively.
4. Inventories:
Inventories at March 31, 2001 and 2002 comprise the following:
| Thousands of | |||||||||||||
| Millions of Yen | U.S. Dollars | ||||||||||||
| 2001 | 2002 | 2002 | |||||||||||
| Finished products | ¥52,501 | ¥53,912 | $ | 405,354 | |||||||||
| Work in process | 16,921 | 18,813 | 141,451 | ||||||||||
| Materials and supplies | 25,007 | 24,185 | 181,842 | ||||||||||
| Total | ¥94,429 | ¥96,910 | $ | 728,647 | |||||||||
5. Investments in and advances to affiliated companies:
Investments in and advances to affiliated companies principally represent the Company’s equity in the underlying assets of 20% to 50% owned companies. Dividends received from companies accounted for on an equity basis were ¥251 million, ¥6 million and ¥9 million ($67 thousand), respectively, for the years ended March 31, 2000, 2001 and 2002.
F-12
Table of Contents
6. Short-term borrowings and long-term debt:
Short-term borrowings at March 31, 2001 and 2002 comprise the following:
| Thousands of | ||||||||||||||
| Millions of Yen | U.S. Dollars | |||||||||||||
| 2000 | 2001 | 2001 | ||||||||||||
| Bank loans | ||||||||||||||
| Weighted average interest rate 3.61% at March 31, 2001 and 2.04% at March 31, 2002: | ||||||||||||||
| Unsecured | ¥ | 37,571 | ¥ | 45,867 | $ | 344,865 | ||||||||
Long-term debt at March 31, 2001 and 2002 comprises the following:
| Thousands of | ||||||||||||||
| Millions of Yen | U.S. Dollars | |||||||||||||
| 2001 | 2002 | 2002 | ||||||||||||
| Loans, principally from banks, maturing serially through 2031 interest ranging from 0.88% to 4.00% at March 31, 2001 and from 1.39% to 4.00% at March 31, 2002: | ||||||||||||||
| Secured | ¥ | 6,792 | ¥ | 6,172 | $ | 46,406 | ||||||||
| Unsecured | 13,100 | 6,160 | 46,316 | |||||||||||
| 2.35% Unsecured bonds due 2005 | 15,000 | 15,000 | 112,782 | |||||||||||
| 2.80% Unsecured bonds due 2008 | 10,000 | 10,000 | 75,188 | |||||||||||
| Long-term capital lease obligations, 3.15% to 7.00% at March 31, 2001 and 6.15% at March 31, 2002, due principally to 2002 | 665 | 62 | 466 | |||||||||||
| Industrial development U.S. dollar revenue bonds due 2005 with fluctuating interest rates (3.70% at March 31, 2001, and 1.65% at March 31, 2002), subject to maximum rates of 15% in 2001 and 2002 and other | 743 | 834 | 6,271 | |||||||||||
| Total | 46,300 | 38,228 | 287,429 | |||||||||||
| Less—Portion due within one year | 7,996 | 2,551 | 19,181 | |||||||||||
| Total | ¥ | 38,304 | ¥ | 35,677 | $ | 268,248 | ||||||||
The outstanding bond indentures generally require the parent company to provide collateral for the outstanding bonds if the parent company provides collateral to new bonds issued in Japan.
Land and buildings with a book value of ¥15,978 million ($120,135 thousand) were pledged as collateral for certain loans of the Company at March 31, 2002.
The aggregate annual maturities of long-term debt during the five years ending March 31, 2007 are as follows:
| Year ending March 31 | Millions of Yen | Thousands of U.S. Dollars | ||||||
| 2003 | ¥ | 2,551 | $ | 19,181 | ||||
| 2004 | 1,591 | 11,962 | ||||||
| 2005 | 5,831 | 43,842 | ||||||
| 2006 | 15,992 | 120,241 | ||||||
| 2007 | 256 | 1,925 | ||||||
Substantially all short-term and long-term loans from banks are made under agreements which, as is customary in Japan, provide that the bank may, under certain conditions, require the borrower to provide collateral (or additional collateral) or guarantors with respect to the loans, and that the bank may treat any collateral, whether furnished as security for short-term or long-term loans or otherwise, as collateral for all indebtedness to such bank. The Company has no compensating balance arrangements with any lending bank.
F-13
Table of Contents
7. Pension plans and accrued severance cost:
The parent company and major domestic subsidiaries have trusteed non-contributory defined benefit pension plans which cover substantially all of their employees. The benefits are in the form of annuity payments and/or lump-sum payments and are based on points and length of service and conditions under which termination occurs. The Company’s policy is to fund amounts required to maintain sufficient plan assets to provide for accrued benefits, subject to the limitation on deductibility imposed by the Japanese income tax laws. The plan assets are invested primarily in interest-bearing securities, marketable equity securities and loan receivables.
The Company also sponsors a domestic contributory welfare pension plan covering substantially all of its Japanese employees. The benefits of the welfare pension plan are based on years of service and on the average compensation during years of service and subject to governmental regulations. The welfare plan consists of a basic component, which has been specified by the Japanese government’s welfare pension regulations, and an additional component established by the Company. Management considers that a portion of the contributory plan, which is administered by a board of trustees composed of management and labor representatives, represents a welfare pension plan carried on behalf of the Japanese government. Management believes that the benefit obligation for the additional component is approximately one fifth of the total benefit obligation. The welfare pension plan is funded in conformity with the funding requirements of applicable governmental regulations. The plan assets are invested primarily in interest-bearing securities, marketable equity securities and loan receivables.
In September 2000, the Company amended its domestic contributory welfare pension plan in accordance with the amendment of the Welfare Pension Insurance Act. A major change was a reduction of future pension benefit payments effective April 2000 and raising the eligibility age for pension benefit payments effective April 2002. The amendment generated an unrecognized prior service gain of ¥5,301 million.
Net periodic benefit costs for the non-contributory plans and the contributory plan of the parent company and certain domestic subsidiaries for 2000, 2001 and 2002 consisted of the following:
| Thousands of | |||||||||||||||||||||||||||||||||
| Millions of Yen | U.S. Dollars | ||||||||||||||||||||||||||||||||
| 2000 | 2001 | 2002 | 2002 | ||||||||||||||||||||||||||||||
| Non- | Non- | Non- | Non- | ||||||||||||||||||||||||||||||
| Contributory | Contributory | Contributory | Contributory | Contributory | Contributory | Contributory | Contributory | ||||||||||||||||||||||||||
| Plans | Plan | Plans | Plan | Plans | Plan | Plans | Plan | ||||||||||||||||||||||||||
| Service cost | ¥3,178 | ¥1,288 | ¥2,519 | ¥1,312 | ¥2,657 | ¥1,288 | $19,977 | $ 9,684 | |||||||||||||||||||||||||
| Interest cost | 2,152 | 2,649 | 1,732 | 2,954 | 1,662 | 2,926 | 12,496 | 22,000 | |||||||||||||||||||||||||
| Expected return on assets | (1,328 | ) | (1,508 | ) | (2,091 | ) | (2,450 | ) | (1,907 | ) | (2,245 | ) | (14,338 | ) | (16,880 | ) | |||||||||||||||||
| Amortization of unrecognized net actuarial loss | 577 | 651 | 171 | 276 | 744 | 1,287 | 5,594 | 9,677 | |||||||||||||||||||||||||
| Amortization of unrecognized net assets at date of application | (163 | ) | (344 | ) | (163 | ) | (344 | ) | (163 | ) | (344 | ) | (1,226 | ) | (2,586 | ) | |||||||||||||||||
| Amortization of unrecognized prior service gain | (9 | ) | – | (535 | ) | – | (535 | ) | (364 | ) | (4,022 | ) | (2,737 | ) | |||||||||||||||||||
| Net periodic benefit cost | ¥4,407 | ¥2,736 | ¥1,633 | ¥1,748 | ¥2,458 | ¥2,548 | $18,481 | $19,158 | |||||||||||||||||||||||||
F-14
Table of Contents
Reconciliations of beginning and ending balances of benefit obligations and the fair value of the plan assets are as follows:
| Thousands of | ||||||||||||||||||||||||||
| Millions of Yen | U.S. Dollars | |||||||||||||||||||||||||
| 2001 | 2002 | 2002 | ||||||||||||||||||||||||
| Non- | Non- | Non- | ||||||||||||||||||||||||
| Contributory | Contributory | Contributory | Contributory | Contributory | Contributory | |||||||||||||||||||||
| Plans | Plan | Plans | Plan | Plans | Plan | |||||||||||||||||||||
Change in benefit obligation: | ||||||||||||||||||||||||||
| Benefit obligation at beginning of year | ¥54,016 | ¥59,113 | ¥59,391 | ¥65,023 | $446,549 | $488,895 | ||||||||||||||||||||
| Service cost | 2,519 | 1,312 | 2,657 | 1,288 | 19,977 | 9,684 | ||||||||||||||||||||
| Interest cost | 1,732 | 2,954 | 1,662 | 2,926 | 12,496 | 22,000 | ||||||||||||||||||||
| Plan participants’ contribution | – | 1,050 | – | 1,080 | – | 8,120 | ||||||||||||||||||||
| Plan benefit amendments | – | (5,301 | ) | – | – | – | – | |||||||||||||||||||
| Actuarial loss | 3,041 | 6,627 | 1,492 | 4,718 | 11,218 | 35,474 | ||||||||||||||||||||
| Lump-sum cash payments | (1,671 | ) | – | (2,078 | ) | – | (15,624 | ) | – | |||||||||||||||||
| Benefits paid | (246 | ) | (732 | ) | (322 | ) | (730 | ) | (2,421 | ) | (5,489 | ) | ||||||||||||||
| Benefit obligation at end of year | ¥59,391 | ¥65,023 | ¥62,802 | ¥74,305 | $472,195 | $558,684 | ||||||||||||||||||||
Change in plan assets: | ||||||||||||||||||||||||||
| Fair value of plan assets at beginning of year | ¥46,459 | ¥54,436 | ¥42,334 | ¥49,899 | $318,301 | $375,181 | ||||||||||||||||||||
| Actual return on plan assets | (5,934 | ) | (6,473 | ) | (2,494 | ) | (2,855 | ) | (18,752 | ) | (21,466 | ) | ||||||||||||||
| Employer contribution | 3,726 | 1,618 | 3,727 | 2,384 | 28,022 | 17,925 | ||||||||||||||||||||
| Plan participants’ contribution | – | 1,050 | – | 1,080 | – | 8,120 | ||||||||||||||||||||
| Lump-sum cash payments | (1,671 | ) | – | (2,078 | ) | – | (15,624 | ) | – | |||||||||||||||||
| Benefits paid | (246 | ) | (732 | ) | (322 | ) | (730 | ) | (2,421 | ) | (5,489 | ) | ||||||||||||||
| Fair value of plan assets at end of year | ¥42,334 | ¥49,899 | ¥41,167 | ¥49,778 | $309,526 | $374,271 | ||||||||||||||||||||
| Funded status | (¥17,057 | ) | (¥15,124 | ) | (¥21,635 | ) | (¥24,527 | ) | ($162,669 | ) | ($184,413 | ) | ||||||||||||||
| Unrecognized actuarial loss | 19,456 | 25,267 | 24,605 | 33,798 | 185,000 | 254,120 | ||||||||||||||||||||
| Unrecognized net assets at the date of application | (972 | ) | (1,985 | ) | (809 | ) | (1,641 | ) | (6,083 | ) | (12,339 | ) | ||||||||||||||
| Unrecognized prior service gain | (9,305 | ) | (5,301 | ) | (8,770 | ) | (4,937 | ) | (65,940 | ) | (37,120 | ) | ||||||||||||||
| Net amount recognized | (¥ 7,878 | ) | ¥ 2,857 | (¥ 6,609 | ) | ¥ 2,693 | ($ 49,692 | ) | $ 20,248 | |||||||||||||||||
Amounts recognized in the statement of financial position consist of: | ||||||||||||||||||||||||||
| Accrued benefit liabilities | (¥14,181 | ) | (¥12,965 | ) | (¥19,358 | ) | (¥22,063 | ) | ($145,549 | ) | ($165,887 | ) | ||||||||||||||
| Accumulated other comprehensive income | 6,303 | 15,822 | 12,749 | 24,756 | 95,857 | 186,135 | ||||||||||||||||||||
| Net amount recognized | (¥�� 7,878 | ) | ¥ 2,857 | (¥ 6,609 | ) | ¥ 2,693 | ($ 49,692 | ) | $ 20,248 | |||||||||||||||||
| Accumulated benefit obligation at end of year | ¥56,515 | ¥62,864 | ¥60,438 | ¥71,841 | $454,421 | $540,158 | ||||||||||||||||||||
Actuarial assumptions: | ||||||||||||||||||||||||||
| Discount rate | 2.8% | 4.5% | 2.7% | 4.3% | ||||||||||||||||||||||
| Rate of salary increase | –* | 3.1% | –* | 2.7% | ||||||||||||||||||||||
| Long-term rate of return on plan assets | 4.5% | 4.5% | 4.5% | 4.5% | ||||||||||||||||||||||
| * | Non-contributory plans are not pay-related. |
F-15
Table of Contents
The unrecognized prior service gain, the unrecognized actuarial loss and the unrecognized net assets at the date of initial application are being amortized over the average remaining service period of employees, both for the non-contributory plans and for the contributory plan.
Substantially all of the employees of major U.S. subsidiaries are covered by a defined benefit pension plan. The projected benefit obligations for the plan and related fair value of plan assets were ¥3,509 million and ¥3,188 million, respectively, at March 31, 2001 and ¥4,450 million ($33,459 thousand) and ¥3,695 million ($27,782 thousand), respectively, at March 31, 2002.
With respect to directors, provision is made for lump-sum severance indemnities on a basis considered adequate for such future payments as may be approved by the shareholders.
In February 2002, the Company announced the closure of the Hiwada plant in Fukushima, Japan because of the transfer of production sites to China. In relation to this closure, the Company recorded special termination benefits for employees’ voluntary termination of ¥906 million ($6,812 thousand) for the year ended March 31, 2002 which were included in the selling, general and administrative expenses.
The net charges to income for worldwide pension plans, severance indemnities and special termination benefits for the years ended March 31, 2000, 2001 and 2002 were ¥10,087 million, ¥4,560 million and ¥8,947 million ($67,271 thousand), respectively.
8. Income taxes:
The Company is subject to a number of different income taxes which, in the aggregate, indicate a normal statutory tax rate of approximately 42% for the years ended March 31, 2000, 2001 and 2002 in Japan.
Income tax expense for the year ended March 31, 2000 included a ¥510 million charge resulting from the settlement of a proposed assessment from the Internal Revenue Service relating to a tax position taken in prior years in connection with a business realignment.
The Company’s provision for income taxes differed from the provision for income taxes at the normal statutory tax rates in Japan as follows:
| Millions of Yen | Thousands of U.S. Dollars | |||||||||||||||||
| 2000 | 2001 | 2002 | 2002 | |||||||||||||||
| Computed tax expense at normal statutory tax rate | ¥11,679 | ¥14,361 | ¥6,444 | $48,451 | ||||||||||||||
| Increase (decrease) resulting from: | ||||||||||||||||||
| Changes in valuation allowance, net of effects of carryforward loss expiration and exchange rate changes | 7,076 | 2,004 | 74 | 556 | ||||||||||||||
| Expenses not deductible for tax purpose | ||||||||||||||||||
| Domestic | 223 | 563 | 737 | 5,541 | ||||||||||||||
| Foreign | 424 | 229 | 221 | 1,662 | ||||||||||||||
| Amortization of goodwill | 339 | 256 | 314 | 2,361 | ||||||||||||||
| Difference in foreign and Japanese tax rates | (1,790 | ) | (2,739 | ) | (1,958 | ) | (14,722 | ) | ||||||||||
| Effect of tax rate change on deferred taxes | 384 | – | – | – | ||||||||||||||
| Write-down of investment in a subsidiary | – | (1,092 | ) | – | – | |||||||||||||
| Effect of tax on gain from sale and issuance of subsidiary stock | (1,747 | ) | – | – | – | |||||||||||||
| Other | (1,372 | ) | 738 | 890 | 6,692 | |||||||||||||
| Provision for income taxes | ¥15,216 | ¥14,320 | ¥6,722 | $50,541 | ||||||||||||||
F-16
Table of Contents
Total income taxes provided for the years ended March 31, 2000, 2001 and 2002 are as follows:
| Thousands of | ||||||||||||||||||
| Millions of Yen | U.S. Dollars | |||||||||||||||||
| 2000 | 2001 | 2002 | 2002 | |||||||||||||||
| Provision for income taxes | ¥ | 15,216 | ¥ | 14,320 | ¥6,722 | $50,541 | ||||||||||||
| Shareholders’ equity—directly charged (credited): | ||||||||||||||||||
| Minimum pension liability adjustments | 5,657 | (6,456 | ) | (6,460 | ) | (48,571 | ) | |||||||||||
| Net unrealized gains on securities | (639 | ) | (3,638 | ) | (1,502 | ) | (11,294 | ) | ||||||||||
| Total | ¥ | 20,234 | ¥ | 4,226 | (¥1,240 | ) | ($ 9,324 | ) | ||||||||||
The significant components of the deferred tax assets and liabilities at March 31, 2001 and 2002 are as follows:
| Thousands of | ||||||||||||||||||||||||
| Millions of Yen | U.S. Dollars | |||||||||||||||||||||||
| 2001 | 2002 | 2002 | ||||||||||||||||||||||
| Deferred Tax Assets | Deferred Tax Liabilities | Deferred Tax Assets | Deferred Tax Liabilities | Deferred Tax Assets | Deferred Tax Liabilities | |||||||||||||||||||
| Inventories | ¥ | 7,398 | – | ¥ | 9,214 | – | $ | 69,278 | – | |||||||||||||||
| Marketable equity securities | 30 | ¥ | 2,800 | 443 | ¥ | 24 | 3,331 | $ | 180 | |||||||||||||||
| Accrued expenses | 6,406 | – | 7,901 | – | 59,406 | – | ||||||||||||||||||
| Tax loss carryforwards | 13,278 | – | 15,184 | – | 114,165 | – | ||||||||||||||||||
| Pension and severance cost | 12,951 | – | 18,589 | – | 139,767 | – | ||||||||||||||||||
| Land | 2,052 | – | 2,347 | 248 | 17,647 | 1,865 | ||||||||||||||||||
| Depreciation | 1,890 | 330 | 958 | 293 | 7,203 | 2,203 | ||||||||||||||||||
| Royalty receivable | 1,491 | – | 953 | – | �� | 7,165 | – | |||||||||||||||||
| Other | 15,324 | 2,421 | 17,346 | 3,568 | 130,421 | 26,827 | ||||||||||||||||||
| Total | 60,820 | 5,551 | 72,935 | 4,133 | 548,383 | 31,075 | ||||||||||||||||||
| Valuation allowance | ( | 17,792 | ) | – | ( | 18,299 | ) | – | ( | 137,586 | ) | – | ||||||||||||
| Total | ¥ | 43,028 | ¥ | 5,551 | ¥ | 54,636 | ¥ | 4,133 | $ | 410,797 | $ | 31,075 | ||||||||||||
F-17
Table of Contents
The valuation allowance principally relates to deferred tax assets for loss carryforwards of subsidiaries.
During the years ended March 31, 2001 and 2002, the valuation allowances were increased by ¥1,289 million and ¥507 million ($3,812 thousand), respectively.
At March 31, 2002, the Company has tax loss carryforwards which are available to reduce taxable income in subsequent periods. If not utilized, such loss carryforwards expire as follows:
| Thousands of | |||||||||
| Year ending March 31 | Millions of Yen | U.S. Dollars | |||||||
| 2003 | ¥ 1,420 | $ | 10,677 | ||||||
| 2004 | 3,472 | 26,105 | |||||||
| 2005 | 2,818 | 21,188 | |||||||
| 2006 | 258 | 1,940 | |||||||
| 2007 | 5,610 | 42,180 | |||||||
| Thereafter | 29,202 | 219,564 | |||||||
| Total | ¥42,780 | $ | 321,654 | ||||||
No provision for income taxes is recognized on undistributed earnings of foreign subsidiaries where the Company considers that such earnings are reinvested or would not, under the present Japanese tax laws, be subject to additional taxation should they be distributed to the parent company. Undistributed earnings of foreign subsidiaries (including related cumulative translation adjustments) at March 31, 2001 and 2002 amounted to approximately ¥111,506 million and ¥133,934 million ($1,007,023 thousand), respectively. It is not practical to estimate the amount of taxes that might be payable on the eventual remittance of such earnings.
The domestic undistributed earnings would not, under the present Japanese tax laws, be subject to additional taxation.
9. Shareholders’ equity:
Common Stock and Additional Paid-in Capital—
As permitted by the Commercial Code of Japan (the “Code”) prior to April 1, 1991, the parent company had made free share distributions which were accounted for by a transfer from additional paid-in capital to common stock or without any transfers in the capital accounts.
Companies in the United States issuing shares in similar transactions would be required to account for them as stock dividends. Had the distributions been accounted for in the manner adopted by the United States companies, ¥179,076 million ($1,346,436 thousand) would have been transferred from retained earnings to appropriate capital accounts as of March 31, 2002.
Retained Earnings—
Retained earnings consist of legal reserve and unappropriated retained earnings.
The parent company is subject to the Code amendments which became effective from October 1, 2001. Prior to October 1, 2001, the Code required at least 50% of the issue price of new shares, with a minimum of the par value thereof, to be designated as stated capital as determined by resolution of the Board of Directors. Proceeds in excess of amounts designated as stated capital were credited to additional paid-in capital. Effective October 1, 2001, the revised Code eliminated common stock par values resulting in all shares being recorded with no par value.
Prior to October 1, 2001, the Code also provided that an amount at least equal to 10% of the aggregate amount of cash dividends and certain other cash payments which are made as an appropriation of retained earnings applicable to each fiscal period shall be appropriated and set aside as a legal reserve until such reserve equals 25% of stated capital. Effective October 1, 2001, the revised Code allows for such appropriations to be determined based on total additional paid-in capital and legal reserves. The amount of total additional paid-in capital and legal reserve which exceeds 25% of stated capital can be transferred to retained earnings by resolution of the shareholders.
The Code permits companies to transfer a portion of additional paid-in capital and legal reserve to stated capital by resolution of the Board of Directors. The Code also permits companies to transfer a portion of unappropriated retained earnings, available for dividends, to stated capital by resolution of the shareholders.
F-18
Table of Contents
Prior to October 1, 2001, the Code imposed certain restrictions on the purchase and sale of treasury stock. Effective October 1, 2001, the Code eliminated these restrictions allowing companies to purchase treasury stock by a resolution of the shareholders at the general shareholders’ meeting and dispose of such treasury stock by resolution of the Board of Directors on and after April 1, 2002.
The amount available for dividends is based on unappropriated retained earnings as recorded on the books of the parent company. Certain adjustments, not recorded on the parent company’s books, are reflected in the financial statements as described in Note 1. At March 31, 2002, retained earnings recorded on the parent company’s books of account were ¥143,108 million ($1,076,000 thousand).
The appropriations of retained earnings for the year ended March 31, 2002, which have been incorporated in the accompanying financial statements, will be proposed for approval at the general shareholders’ meeting to be held on June 27, 2002, and will be recorded in the parent company’s general books of account after shareholders’ approval.
10. Stock-based compensation plans:
The Company has two types of stock-based compensation plans as incentive plans for directors and selected employees.
Warrant plan—
Upon issuance of detachable warrant bonds by the parent company, a consolidated subsidiary purchased all of the bonds and the Company distributed the warrants at fair value to directors and certain employees of the Company as a part of their remuneration.
Stock option plan—
In accordance with approval of shareholders’ meetings on June 29, 2000 and June 28, 2001, the Company granted share subscription rights to employees. The Company recorded the fair value of the stock option as a part of their remuneration.
A summary of information for the Company’s stock-based compensation plans is as follows:
| Yen | ||||||||||||||||||||
| Year | Plan | Exercisable Period | Weighted-Average Exercise Price | Weighted-Average Grant Date Share Price | Number of Shares (Thousands) | |||||||||||||||
| 2000 | Warrant | From July 3, 2000 to September 12, 2002 | ¥ 2,188 | ¥ 1,925 | 320 | |||||||||||||||
| 2001 | Warrant | From July 2, 2001 to September 25, 2003 | 4,728 | 4,543 | 284 | |||||||||||||||
| 2001 | Stock option | From July 1, 2002 to June 30, 2005 | 4,400 | 4,250 | 191 | |||||||||||||||
| 2002 | Warrant | From July 1, 2002 to August 26, 2004 | 3,266 | 2,700 | 413 | |||||||||||||||
| 2002 | Stock option | From July 1, 2003 to June 30, 2006 | 3,791 | 3,750 | 191 | |||||||||||||||
| U.S. Dollars | ||||||||||||||||||||
| Year | Plan | Exercisable Period | Weighted-Average Exercise Price | Weighted-Average Grant Date Share Price | ||||||||||||||||
| 2002 | Warrant | From July 1, 2002 to August 26, 2004 | $24.56 | $20.30 | ||||||||||||||||
| 2002 | Stock option | From July 1, 2003 to June 30, 2006 | 28.50 | 28.20 | ||||||||||||||||
Remuneration cost recognized for stock-based compensation plans for the years ended March 31, 2000, 2001 and 2002 were ¥73 million, ¥362 million and ¥346 million ($2,601 thousand), respectively.
The weighted-average fair value per share at the date of grant for the warrants and the stock options granted during the years ended March 31, 2000, 2001 and 2002 were ¥228, ¥762 and ¥573 ($4.31), respectively, and were estimated using the Black-Scholes option-valuation model.
F-19
Table of Contents
A summary of the status of the Company’s warrants and options as of March 31, 2000, 2001 and 2002, and changes during the years is as follows:
| Number of Shares | Weighted-Average Remaining Life | Weighted-Average Price per Share | |||||||||||||||||
| (Thousands) | (Years) | Yen | U.S. Dollars | ||||||||||||||||
| Outstanding at March 31, 1999 | 269 | 2.3 | ¥2,783 | ||||||||||||||||
| Granted | 320 | 2,188 | |||||||||||||||||
| Exercised | (15 | ) | 2,783 | ||||||||||||||||
| Outstanding at March 31, 2000 | 574 | 1.9 | 2,452 | ||||||||||||||||
| Granted | 475 | 4,597 | |||||||||||||||||
| Exercised | (306 | ) | 2,551 | ||||||||||||||||
| Outstanding at March 31, 2001 | 743 | 2.4 | 3,782 | ||||||||||||||||
| Granted | 604 | 3,432 | $ | 25.80 | |||||||||||||||
| Exercised | (170 | ) | 2,425 | 18.23 | |||||||||||||||
| Outstanding at March 31, 2002 | 1,177 | 2.5 | ¥3,798 | $ | 28.56 | ||||||||||||||
| Exercisable at March 31, 2001 | 268 | ¥2,338 | |||||||||||||||||
| Exercisable at March 31, 2002 | 382 | ¥4,075 | $ | 30.64 | |||||||||||||||
11. Other comprehensive income:
Change in accumulated other comprehensive income (loss) is as follows:
| Millions of Yen | ||||||||||||||||
| Minimum Pension Liability Adjustments | Net Unrealized Gains on Securities | Cumulative Foreign Currency Translation Adjustments | Total Accumulated Other Comprehensive Income (Loss) | |||||||||||||
| Balance at March 31, 1999 | (¥10,616 | ) | ¥12,666 | (¥26,314 | ) | (¥24,264 | ) | |||||||||
| Adjustments for the year | 7,824 | (919 | ) | (19,083 | ) | (12,178 | ) | |||||||||
| Balance at March 31, 2000 | (2,792 | ) | 11,747 | (45,397 | ) | (36,442 | ) | |||||||||
| Adjustments for the year | (8,847 | ) | (5,085 | ) | 21,723 | 7,791 | ||||||||||
| Balance at March 31, 2001 | (11,639 | ) | 6,662 | (23,674 | ) | (28,651 | ) | |||||||||
| Adjustments for the year | (8,848 | ) | (2,079 | ) | 14,842 | 3,915 | ||||||||||
| Balance at March 31, 2002 | (¥20,487 | ) | ¥ 4,583 | (¥8,832 | ) | (¥24,736 | ) | |||||||||
| Thousands of U.S. Dollars | ||||||||||||||||
| Minimum Pension Liability Adjustments | Net Unrealized Gains on Securities | Cumulative Foreign Currency Translation Adjustments | Total Accumulated Other Comprehensive Income (Loss) | |||||||||||||
| Balance at March 31, 2001 | ($ | 87,511 | ) | $ | 50,090 | ($ | 178,000 | ) | ($ | 215,421 | ) | |||||
| Adjustments for the year | (66,527 | ) | (15,631 | ) | 111,594 | 29,436 | ||||||||||
| Balance at March 31, 2002 | ($ | 154,038 | ) | $ | 34,459 | ($ | 66,406 | ) | ($ | 185,985 | ) | |||||
F-20
Table of Contents
Tax effects allocated to each component of other comprehensive income (loss) and reclassification adjustments are as follows:
| Millions of Yen | |||||||||||||||||
| Before-Tax | Tax (Expense) | Minority | Net-of-Tax | ||||||||||||||
| Amount | or Benefit | Interest | Amount | ||||||||||||||
| 2000: | |||||||||||||||||
| Minimum pension liability adjustments | ¥13,471 | (¥ 5,657 | ) | ¥ 10 | ¥ 7,824 | ||||||||||||
| Net unrealized gains on securities: | |||||||||||||||||
| Unrealized holding gains arising during year | 1,194 | (500 | ) | (41 | ) | 653 | |||||||||||
| Less—Reclassification adjustment for gains realized in net income | (2,711 | ) | 1,139 | – | (1,572 | ) | |||||||||||
| Net unrealized losses | (1,517 | ) | 639 | (41 | ) | (919 | ) | ||||||||||
| Cumulative foreign currency translation adjustments | (19,561 | ) | – | 478 | (19,083 | ) | |||||||||||
| Other comprehensive income (loss) | (¥ 7,607 | ) | (¥ 5,018 | ) | ¥447 | (¥12,178 | ) | ||||||||||
| 2001: | |||||||||||||||||
| Minimum pension liability adjustments | (¥15,375 | ) | ¥ 6,456 | ¥ 72 | (¥ 8,847 | ) | |||||||||||
| Net unrealized gains on securities: | |||||||||||||||||
| Unrealized holding losses arising during year | (7,432 | ) | 3,121 | 45 | (4,266 | ) | |||||||||||
| Less—Reclassification adjustment for gains realized in net income | (1,308 | ) | 517 | (28 | ) | (819 | ) | ||||||||||
| Net unrealized losses | (8,740 | ) | 3,638 | 17 | (5,085 | ) | |||||||||||
| Cumulative foreign currency translation adjustments | 22,353 | – | (630 | ) | 21,723 | ||||||||||||
| Other comprehensive income (loss) | (¥ 1,762 | ) | ¥10,094 | (¥541 | ) | ¥ 7,791 | |||||||||||
| 2002: | |||||||||||||||||
| Minimum pension liability adjustments | (¥15,380 | ) | ¥ 6,460 | ¥ 72 | (¥ 8,848 | ) | |||||||||||
| Net unrealized gains on securities: | |||||||||||||||||
| Unrealized holding losses arising during year | (5,404 | ) | 2,270 | 7 | (3,127 | ) | |||||||||||
| Less—Reclassification adjustment for gains realized in net income | 1,828 | (768 | ) | (12 | ) | 1,048 | |||||||||||
| Net unrealized losses | (3,576 | ) | 1,502 | (5 | ) | (2,079 | ) | ||||||||||
| Cumulative foreign currency translation adjustments | 15,338 | – | (496 | ) | 14,842 | ||||||||||||
| Other comprehensive income (loss) | (¥ 3,618 | ) | ¥ 7,962 | (¥429 | ) | ¥ 3,915 | |||||||||||
| Thousands of U.S. Dollars | |||||||||||||||||
| Before-Tax | Tax (Expense) | Minority | Net-of-Tax | ||||||||||||||
| Amount | or Benefit | Interest | Amount | ||||||||||||||
| 2002: | |||||||||||||||||
| Minimum pension liability adjustments | ($115,639 | ) | $ | 48,571 | $ 541 | ($ 66,527 | ) | ||||||||||
| Net unrealized gains on securities: | |||||||||||||||||
| Unrealized holding losses arising during year | (40,631 | ) | 17,068 | 52 | (23,511 | ) | |||||||||||
| Less—Reclassification adjustment for gains realized in net income | 13,744 | (5,774 | ) | (90 | ) | 7,880 | |||||||||||
| Net unrealized losses | (26,887 | ) | 11,294 | (38 | ) | (15,631 | ) | ||||||||||
| Cumulative foreign currency translation adjustments | 115,323 | – | (3,729 | ) | 111,594 | ||||||||||||
| Other comprehensive income (loss) | ($27,203 | ) | $ | 59,865 | ($3,226 | ) | $ 29,436 | ||||||||||
F-21
Table of Contents
12. Supplemental information:
Supplemental information for the years ended March 31, 2000, 2001 and 2002 is as follows:
| Millions of Yen | Thousands of U.S. Dollars | |||||||||||||||
| 2000 | 2001 | 2002 | 2002 | |||||||||||||
| Research and development expenses charged to cost and expenses | ¥33,265 | ¥37,105 | ¥39,050 | $ | 293,609 | |||||||||||
| Advertising costs charged to expense as incurred | 10,682 | 10,434 | 13,117 | 98,624 | ||||||||||||
Other—net as shown in other income (expenses) for the years ended March 31, 2000, 2001 and 2002 consisted of the following:
| Millions of Yen | Thousands of U.S. Dollars | ||||||||||||||||
| 2000 | 2001 | 2002 | 2002 | ||||||||||||||
| Gains (losses) on sale and write-down of investments and securities | ¥4,151 | ¥254 | (¥2,287 | ) | ($17,195 | ) | |||||||||||
| Losses on sale and impairment of fixed assets | (4,741 | ) | (914 | ) | (3,340 | ) | (25,113 | ) | |||||||||
| Other | (947 | ) | 1,607 | (202 | ) | (1,519 | ) | ||||||||||
| Total | (¥1,537 | ) | ¥947 | (¥5,829 | ) | ($43,827 | ) | ||||||||||
13. Leased assets:
The Company leases certain land, machinery and equipment, office space, warehouses, computer equipment and employees’ residential facilities primarily under operating leases.
Rental expenses under operating leases for the years ended March 31, 2000, 2001 and 2002 aggregated ¥8,765 million, ¥5,962 million and ¥6,777 million ($50,955 thousand), respectively. Such rentals relate principally to cancelable leases which are renewable upon expiration.
The net minimum rental payments under operating leases that have initial or remaining noncancelable lease terms in excess of one year at March 31, 2002 are as follows:
| Year ending March 31 | Millions of Yen | Thousands of U.S. Dollars | |||||||
| 2003 | ¥3,537 | $ | 26,594 | ||||||
| 2004 | 2,070 | 15,564 | |||||||
| 2005 | 1,515 | 11,391 | |||||||
| 2006 | 1,018 | 7,654 | |||||||
| 2007 | 538 | 4,045 | |||||||
| Thereafter | 989 | 7,436 | |||||||
| Total minimum future rentals | ¥9,667 | $ | 72,684 | ||||||
F-22
Table of Contents
14. Financial instruments:
Derivatives—
The Company operates internationally, giving rise to exposure to market risks from changes in foreign exchange rates and interest rates. Derivative financial instruments are utilized by the Company to reduce those risks but are not held or issued for trading purposes.
To hedge certain purchase and sale commitments and anticipated but not yet committed transactions denominated in other than functional currencies, the Company enters into forward exchange contracts and purchases and writes currency options. Written options are entered into only with purchased options.
The notional amounts of forward exchange contracts as of March 31, 2001 and 2002 were ¥19,833 million and ¥3,031 million ($22,789 thousand), respectively. The notional amounts of currency options purchased were ¥1,921 million and ¥1,440 million ($10,827 thousand) as of March 31, 2001 and 2002, respectively. The notional amount of currency options written was ¥1,920 million and ¥1,440 million ($10,827 thousand) as of March 31, 2001 and 2002, respectively.
To change currency and interest rate features of intercompany finance transactions, the Company entered into currency swap contracts with banks. Currency swap contracts effectively changed, in substance, the U.S. dollars floating interest rate intercompany borrowings into Japanese yen fixed interest rate borrowings and euro floating interest rate borrowings. The notional amounts of currency swap contracts as of March 31, 2001 and 2002 were ¥29,209 million and ¥42,882 million ($322,421 thousand), respectively.
Concentration of Credit Risk—
The Company distributes its products to a diverse group of domestic and foreign customers. Trade receivables arising from these sales represent credit risk to the Company. However, due to the large number and diversity of the Company’s customer base, concentration of credit risk with respect to trade receivables is limited. The Company performs ongoing credit evaluation of its customers’ financial condition and, generally, requires no collateral from its customers.
Derivative financial instruments that the Company holds or issues may expose the Company to credit risks if the counterparties are unable to meet the terms of such contracts.
The Company minimizes credit risk exposure of these derivatives by limiting the counterparties to major international banks and financial institutions as well as avoiding concentration with certain counterparties, and also by making frequent credit reviews of these counterparties. Management does not expect to incur any significant losses as the result of counterparty default.
F-23
Table of Contents
15. Fair value of financial instruments:
The following table presents the carrying amounts and fair values of the Company’s financial instruments at March 31, 2001 and 2002:
| Millions of Yen | Thousands of U.S. Dollars | ||||||||||||||||||||||||||||
| 2001 | 2002 | 2002 | |||||||||||||||||||||||||||
| Assets (liabilities) | Assets (liabilities) | Assets (liabilities) | |||||||||||||||||||||||||||
| Carrying Amounts | Fair Value | Carrying Amounts | Fair Value | Carrying Amounts | Fair Value | ||||||||||||||||||||||||
| Assets: | |||||||||||||||||||||||||||||
| Available-for-sale securities | ¥25,337 | ¥25,337 | ¥21,815 | ¥21,815 | $164,022 | $164,022 | |||||||||||||||||||||||
| Long-term receivables | 76 | 76 | 374 | 365 | 2,812 | 2,744 | |||||||||||||||||||||||
| Other financial instruments | |||||||||||||||||||||||||||||
| Forward exchange contracts | 10 | 10 | |||||||||||||||||||||||||||
| Currency swap | 2,069 | 2,040 | 1,846 | 1,846 | 13,880 | 13,880 | |||||||||||||||||||||||
| Currency option | 67 | 67 | 2 | 2 | 15 | 15 | |||||||||||||||||||||||
| Liabilities: | |||||||||||||||||||||||||||||
| Long-term debt, including current maturity | (46,300 | ) | (38,228 | ) | (287,429 | ) | |||||||||||||||||||||||
| Less—Capital lease obligations | 665 | 62 | 466 | ||||||||||||||||||||||||||
| Long-term debt—net | (45,635 | ) | (47,235 | ) | (38,166 | ) | (38,963 | ) | (286,963 | ) | (292,955 | ) | |||||||||||||||||
| Other financial instruments: | |||||||||||||||||||||||||||||
| Forward exchange contracts | (747 | ) | (747 | ) | (33 | ) | (33 | ) | (248 | ) | (248 | ) | |||||||||||||||||
| Currency option | (60 | ) | (60 | ) | (10 | ) | (10 | ) | (75 | ) | (75 | ) | |||||||||||||||||
Estimation of Fair Values—
The following notes summarize the major methods and assumptions used in estimating the fair values of financial instruments.
Short-term financial instruments are valued at their carrying amounts included in the consolidated balance sheets, which are reasonable estimates of fair value due to the relatively short period to maturity of the instruments. This approach is applied to cash and cash equivalents, trade receivables, short-term borrowings and trade payables.
The carrying amounts and the fair values of available-for-sale securities are disclosed in Note 3.
Sundry investments included equity interests in non-public companies, amounting to ¥3,764 million and ¥2,591 million ($19,481 thousand) at March 31, 2001 and 2002, respectively, and memberships amounting to ¥1,023 million and ¥612 million ($4,602 thousand) at March 31, 2001 and 2002, respectively. The corresponding fair values at those dates were not computed as such estimation is not practicable.
The fair values of long-term receivables were estimated by discounting estimated future cash flows using current interest rates.
The fair values of the Company’s long-term debt were estimated using a discounted cash flow analysis based on incremental borrowing rates for similar types of borrowing arrangements.
The fair values of forward exchange contracts were estimated based on the quoted market rates of similar contracts. The currency swap and the interest rate swap were valued at replacement cost. The fair values of foreign currency options were measured using valuation models.
F-24
Table of Contents
16. Basic and diluted earnings per share:
A reconciliation of the numerators and denominators of basic and diluted net income per share computation for the years ended March 31, 2000, 2001 and 2002 is as follows:
| Millions of Yen | Thousands of U.S. Dollars | ||||||||||||||||
| 2000 | 2001 | 2002 | 2002 | ||||||||||||||
| Net income available to common shareholders | ¥13,075 | ¥18,298 | ¥8,047 | $ | 60,504 | ||||||||||||
| Number of Shares (Thousands) | |||||||||||||||||
| Weighted average common shares outstanding | 179,574 | 179,813 | 180,032 | ||||||||||||||
| Effect of dilutive warrants | 32 | 103 | 32 | ||||||||||||||
| Diluted common shares outstanding | 179,606 | 179,916 | 180,064 | ||||||||||||||
| Yen | U.S. Dollars | ||||||||||||||||
| Net income per share | |||||||||||||||||
| Basic | ¥72.81 | ¥101.76 | ¥44.70 | $0.34 | |||||||||||||
| Diluted | 72.80 | 101.70 | 44.69 | 0.34 | |||||||||||||
The stock options were not included in the computation of diluted earnings per share because to do so would have been antidilutive for the periods presented.
17. Commitments and contingent liabilities:
Commitments outstanding at March 31, 2002 for the purchase of property, plant and equipment and advertisement payments approximated ¥2,887 million ($21,707 thousand).
Contingent liabilities at March 31, 2002 principally for loans guaranteed in the ordinary course of business amounted to ¥3,101 million ($23,316 thousand).
During the year ended March 31, 2001, the Company received a notice of proposed assessment from the German tax authorities for approximately DM41 million (¥2,434 million translated at the current foreign exchange rate at March 31, 2002) relating to a tax position taken in prior years concerning intercompany purchase prices. The Company officially challenged the proposed assessment by arbitration procedures. There was no progress during the year ended March 31, 2002. In the opinion of management, it is not possible at this time to determine the ultimate resolution of this matter.
18. Gain on sale of interest in subsidiary:
In March 2000, the Company sold a portion of its holdings in its wholly owned subsidiary, Tohoku Pioneer Corporation through an initial public offering reducing the Company’s ownership to 67.0%. Tohoku Pioneer Corporation engages in the development, manufacture and sale of electronics products.
4,000 thousand shares were newly issued at ¥4,252 per share and 2,600 thousand shares were sold by the Company. The net cash proceeds from issuance of stock and sale of stock were ¥17,008 million and ¥11,772 million, respectively.
Gain on issuance of stock was ¥7,136 million and gain on sale of existing stock was ¥5,355 million.
F-25
Table of Contents
19. Remuneration of directors and officers:
The aggregate remuneration (including bonuses and stock-based compensation [See Note 10]) charged to income by the parent company for directors and officers for the years ended March 31, 2000, 2001 and 2002 totaled ¥733 million, ¥811 million and ¥876 million ($6,586 thousand), respectively.
20. Subsequent events:
| a. | On April 25, 2002, Tohoku Pioneer Corporation (“Tohoku”) announced the implementation of a voluntary early retirement plan subsequent to the approval by its board of directors. Tohoku assumes that retirement date is to be June 30, 2002 and a special retirement allowance is to be ¥1,200 million ($9,023 thousand). | |
| b. | In June 2002, the Company received a preliminary calculation from the United States Internal Revenue Service (“IRS”) for additional taxes of approximately US$66 million (¥8,795 million translated at the foreign exchange rate at March 31, 2002) relating to an adjustment to transfer prices between affiliated companies for the years ended March 31, 1997 through 1999. If, after completing its audit, the IRS files a notice of proposed assessment based on the preliminary calculation, the Company intends to file a protest. In the opinion of management, it is not possible at this time to determine the ultimate outcome of this matter. | |
| c. | In July 2002, the board of directors of Tohoku approved the guarantee of banks loans to Eldis Corporation in an aggregate amount not to exceed ¥25,000 million ($187,970 thousand). Eldis Corporation is a 45% owned, affiliated company of Tohoku and engages in the development and manufacture of organic electroluminescent panels. |
F-26
Table of Contents
INDEPENDENT AUDITORS’ REPORT ON SUPPLEMENTAL INFORMATION
To the Board of Directors and Shareholders of Pioneer Corporation:
We have audited the consolidated financial statements of Pioneer Corporation and subsidiaries as of March 31, 2001 and 2002, and for each of the three years in the period ended March 31, 2002, and our report thereon appears on page F-2. Our audits were conducted for the purpose of forming an opinion on the basic financial statements taken as a whole. The supplemental information listed in the index to consolidated financial statements and schedules is presented for the purpose of additional analysis and is not a required part of the basic financial statements. This supplemental information is the responsibility of the Company’s management. Such information has been subjected to the auditing procedures applied in our audits of the basic financial statements and, in our opinion, is fairly stated in all material respects when considered in relation to the basic financial statements taken as a whole.
/s/ Deloitte Touche Tohmatsu
Deloitte Touche Tohmatsu
Tokyo, Japan
May 2, 2002
F-27
Table of Contents
PIONEER CORPORATION AND SUBSIDIARIES
SUPPLEMENTAL NOTES TO CONSOLIDATED FINANCIAL STATEMENTS
TO CONFORM WITH REGULATION S-X
A. SHORT-TERM BORROWINGS AND LONG-TERM DEBT
| Unused lines of credit for short-term financing at March 31, 2002 approximated ¥220,730 million of which ¥30,000 million relates to commercial paper programs. Unused commitments for long-term financing arrangements at March 31, 2002 amounted to ¥7,400 million. There were no commitment fees. |
B. ACCRUED LIABILITIES—OTHER
| Accrued liabilities—other included accrued royalty of ¥11,233 million and ¥13,312 million at March 31, 2001 and 2002, respectively. |
C. INCOME TAXES
| Income before income taxes and income tax expense was comprised of the following components: |
| Millions of Yen | |||||||||||||
| Year Ended March 31 | |||||||||||||
| 2000 | 2001 | 2002 | |||||||||||
| Income (loss) before income taxes: | |||||||||||||
| Domestic | ¥ | 8,342 | ¥ | 5,967 | ¥ | (3,655 | ) | ||||||
| Foreign | 19,466 | 28,226 | 18,998 | ||||||||||
| ¥ | 27,808 | ¥ | 34,193 | ¥ | 15,343 | ||||||||
| Income taxes—Current: | |||||||||||||
| Domestic | ¥ | 2,883 | ¥ | 4,906 | ¥ | 3,879 | |||||||
| Foreign | �� | 9,214 | 10,105 | 7,228 | |||||||||
| ¥ | 12,097 | ¥ | 15,011 | ¥ | 11,107 | ||||||||
| Income taxes—Deferred: | |||||||||||||
| Domestic | ¥ | 2,927 | ¥ | (872 | ) | ¥ | (4,501 | ) | |||||
| Foreign | 192 | 181 | 116 | ||||||||||
| ¥ | 3,119 | ¥ | (691 | ) | ¥ | (4,385 | ) | ||||||
D. SHAREHOLDERS’ EQUITY
| Retained earnings at March 31, 2002 include the parent company’s and its consolidated subsidiaries’ equity in undistributed earnings of 20% to 50% owned companies accounted for on an equity basis in the amount of ¥163 million. |
F-28
Table of Contents
SCHEDULE II
PIONEER CORPORATION AND SUBSIDIARIES
VALUATION AND QUALIFYING ACCOUNTS
YEARS ENDED MARCH 31, 2000, 2001 AND 2002
| Millions of Yen | |||||||||||||||||||||
| Allowance for | Charged | ||||||||||||||||||||
| Doubtful Notes | Balance at | (Credited) to | Deductions | Balance at | |||||||||||||||||
| and Accounts | Beginning | Costs and | for Accounts | End of | |||||||||||||||||
| Receivables | of Period | Expenses | Written Off | Other | Period | ||||||||||||||||
| (a) | |||||||||||||||||||||
| | |||||||||||||||||||||
| 2000 | ¥ | 10,998 | ¥ | 908 | ¥ | (2,466 | ) | ¥ | (447 | ) | ¥ | 8,993 | |||||||||
| 2001 | 8,993 | 1,164 | (861 | ) | 525 | 9,821 | |||||||||||||||
| 2002 | 9,821 | (153 | ) | (4,660 | ) | 311 | 5,319 | ||||||||||||||
| (a) | Collection of accounts previously written off, translation adjustments, and effects of newly consolidated subsidiaries. |
F-29