Management Team
Name
Position
Age
Years of
Financial
Services
Experience
Relevant
Experience
R. Wayne Hall
President and Chief Executive Officer
62
36
EVP / CRO at Provident Bank
Blaise B. Bettendorf
Executive Vice President - Chief Financial Officer
49
28
SVP / CFO at Carolina Commerce Bank,
and Summit National Bank; Previously
Audit Manager with PricewaterhouseCoopers
J. Dale Hall
Executive Vice President - Chief Banking Officer
64
42
SVP / Commercial Market Executive
at Bank of America
Joseph W. Amy
Executive Vice President - Chief Credit Officer
62
38
Credit positions at Mellon and U.S. Bank
Richard A. Arthur
Executive Vice President - Retail Banking
40
16
SVP at Bank of America
Susan A. Bagwell
Executive Vice President - Human Resources
48
27
VP Human Resources at First Federal
Robert L. Davis
Executive Vice President - Corporate Counsel
59
30
Managing Director and General Counsel at
Provident Bankshares Corporation/Provident
Bank
John N. Golding
Executive Vice President - Commercial Banking
44
22
SVP at Wachovia/Wells Fargo
Kellee S. McGahey
Executive Vice President - Marketing
33
2
Assistant Director at College of
Charleston/Lowcountry Graduate Center
Eartha C. Morris
Executive Vice President - Support Services
55
34
EVP / COO at Congressional Bank
EVP / Head of Bank Operations at PNC Bank
(formerly Riggs National Bank)
Daniel S. Vroon
Executive Vice President - Wealth Management
44
15
SVP Bank of America
First Financial Holdings, Inc.
6

Strategic Initiatives Accomplished
During the Prior Twelve Months
• Sold insurance agencies in 2011 and generated non-dilutive tangible equity
• Completed the bulk sale of nonperforming and select performing assets
– Significantly reduced the level of problem loans
– Active management has maintained improved credit metrics
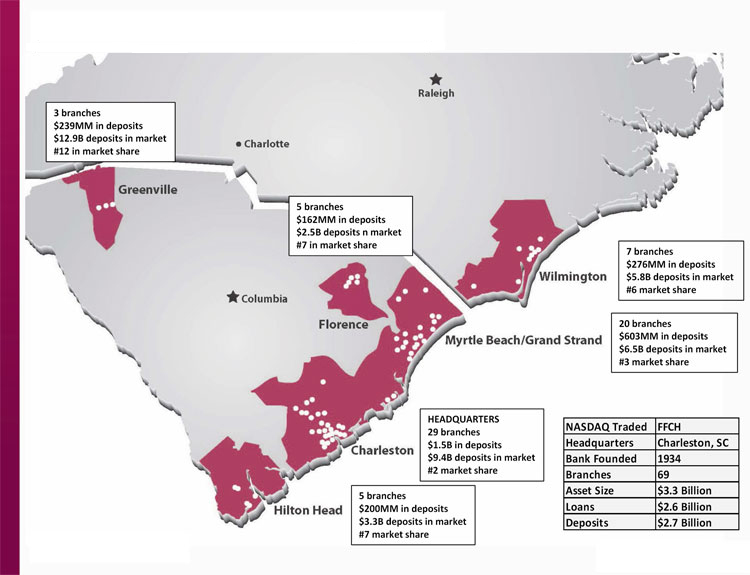
• Acquired Plantation Federal through an FDIC-assisted transaction
– Expanded coastal presence and entered Greenville, SC market
• Completed acquisition of 5 branches in the Hilton Head market
– Consolidated 3 into existing locations and added 2 new financial centers
• Repositioned the balance sheet to enhance future net interest income,
noninterest income and net interest margin
• Developed new sales process, retail deposit product set, and
complementary products to drive organic growth of core deposits and
revenue enhancements
• Consolidated five existing branches, excluding acquisition activities, to
improve profitability
First Financial Holdings, Inc.
7

Strategic Acquisition
Plantation Federal Bank
• FDIC-assisted transaction
— Purchased substantially all assets and assumed deposits and certain
other liabilities of Plantation Federal Bank on April 27, 2012
— Loss-share coverage on commercial loans and OREO
— 80% FDIC coverage on losses up to $55 million and 60% coverage
over $65 million
• Locations include Grand Strand coastal market and Upstate SC
— Initial entry into the demographically attractive Greenville market,
providing geographic diversification
— Expanded existing market share in Myrtle Beach and Pawleys Island
• Financially attractive
— Immediately accretive to EPS and tangible book value
— No external capital needed to complete transaction
— Considerable opportunity for operating efficiencies
First Financial Holdings, Inc.
8

Transaction Overview
Plantation Federal Bank
Financial Highlights as of April 27, 2012
($ in thousands)
Total assets $ 421,016
Loans 278,651
Residential 21.2%
Commercial 62.8%
Consumer 16.0%
FDIC indemnification asset, net 34,300
Other real estate owned 10,736
Core deposit intangible, net 1,710
Deposits 419,929
Transaction accounts 14.4%
Savings & money market 30.3%
Time deposits 55.3%
Deferred tax liability 5,583
Liability for FDIC indemnification
“claw-back” 3,520
Gain on acquisition, net of taxes 9,024
Asset discount bid 46,000
• Purchase accounting resulted in a fair value
adjustment on loans of 14.7% and on OREO
of 57.5%
• Loans accounted for under ASC 310-30
(Loans Acquired with Deteriorated Credit
Quality) represent 50.2% of acquired loans
• Loans covered by loss share are
approximately 60%; covered OREO are
approximately 90%
• Purchase accounting accretion of discounts
contributed to NIM increase
• Exercised option to acquire Plantation’s
Pawleys Island location (to close in Q3);
consolidate remaining acquired branches on
the coast in Q3 for no net increase in
financial centers; added 3 locations in
Greenville
First Financial Holdings, Inc.
9

Market Share Analysis
Plantation Federal Bank
Plantation Federal Bank Overview:
Founded in 1986 in Pawleys Island, SC
Leading market share in Pawleys Island
Established First Savers Bank in Greenville, SC as separate de novo
charter in 1996
Combined Plantation and First Savers charters in 2008
Attractive deposit mix with solid core deposits in excess of 40%
Market
# of New
Branches
Total
Deposits
(000s)
Deposit
Market
Share (%)
Market
Share Rank
Myrtle Beach/Grand Strand, SC1
0
$603,305
9.32%
3
Greenville, SC
3
238,923
1.85%
12
1 Includes Georgetown and Horry Counties
Source - SNL Financial; FDIC deposit data as of June 30, 2011
First Financial Holdings, Inc.
10
Strategic Expansion
Liberty Savings Bank Branches
Acquired five branches from
Liberty Savings Bank, FSB in the
Hilton Head market on
April 20, 2012
Moved to 7th from 12th in market
share and doubled deposit base
Consolidated 3 locations and
added 2 new financial centers
Attractive deposit mix with solid
core deposits in excess of 75%
and 0.39% cost of funds
Loans acquired were all
performing and in-market
($ in thousands)
Assets acquired:
Total loans
Residential
6,179
$
Commercial
2,852
Consumer
13,166
Intangibles
5,239
27,436
$
Liabilities assumed:
Total deposits
Transaction accounts
59,800
$
Savings & money market
25,106
Time deposits
28,010
112,916
$
Transaction Summary as of April 20, 2012
First Financial Holdings, Inc.
11

Balance Sheet Repositioning
Transaction considered economically accretive as breakeven point anticipated to be less
than 2 years
Securities with low book yield relative to duration/extension risk selected
Deleveraging the balance sheet created capital to support acquisition activities
($ in thousands)
Average
Rate/Yield
Balance Sheet
Impact
Equity
Impact
Anticipated
Ongoing
Annual
Income
Impact
Mortgage-backed securitites sold
1.79%
($203,628)
$2,197
($3,641)
FHLB advances terminated/Deleverage
3.15%
125,000
(5,287)
3,932
Net cash to reinvest after deleverage
(78,628)
(3,090)
291
Reinvestments1
Bank-owned life insurance2
5.00%
50,000
---
2,500
Other investment securities
2.00%
30,000
---
600
Net reduction in total assets
($123,628)
Annualized income impact, net of taxes
$2,103
2 Tax-equivalent yield estimate; earnings included in noninterest income.
1 Based on committed BOLI investments, partially funded in June 2012, with the balance to be completed in July 2012.
Other investments anticipated to be purchased in July 2012.
First Financial Holdings, Inc.
12

Profitability enhancements
Continue to expand mortgage correspondent and retail lending
channels
Continue to develop specialty financing channels
Expand Wealth Management presence and territory for broker-
dealer and 401k administration division
Enhance operating efficiencies through process improvement
initiatives
Position the franchise for the future
Fully integrate acquisitions and achieve efficiencies
Launch the brand in the new Greenville market
Consider financially and strategically attractive non-dilutive growth
opportunities
Strategic Priorities
First Financial Holdings, Inc.
13

FINANCIAL REVIEW
First Financial Holdings, Inc.
14

Operating Results Highlights
June 30,
September 30,
December 31,
March 31,
June 30,
2011
2011
2011
2012
2012
Core operating income1
$ 252
$ 2,596
$ 2,866
$ 3,850
$ 6,650
Net (loss) income
(43,001)
1,077
15,572
1,739
12,584
Net interest income
29,416
29,064
28,899
28,252
31,713
Provision for loan losses
77,803
8,940
7,445
6,745
4,697
Noninterest income
11,422
14,238
32,770
13,182
32,530
Noninterest expense
28,600
29,588
28,886
28,709
39,250
(Loss) income from continuing
operations
(40,277)
2,881
15,572
1,739
12,584
Loss from discontinued
operations (net of income taxes)2
(2,724)
(1,804)
---
---
---
EPS - continuing operations
(2.50)
0.12
0.88
0.05
0.70
EPS - common
(2.66)
0.01
0.88
0.05
0.70
Pretax preprovision earnings
12,238
13,714
32,783
12,725
24,993
Net interest margin
3.83%
3.87%
3.91%
3.84%
4.08%
($ in thousands)
For the Quarter Ended
1 Excludes the after-tax effect of: June 30, 2011 provision for loan losses for loan held for sale reclassification $40.1 million and goodwill impairment
$0.4 million; September 30, 2011 provision for loan losses for loan reclassification $0.9 million and gain on loans held for sale $(1.2) million;
December 31, 2011 gain on loans held for sale $(12.7) million; March 31, 2012 State DTA writeoff $2.1 million; and June 30, 2012 gain on
acquisition $(9.0) million, gain on securities sales $(2.2) million and FHLB prepayment penalty $5.3 million
2 Sale of First Southeast Insurance was completed on June 1, 2011 and the sale of Kimbrell was completed on September 30, 2011
First Financial Holdings, Inc.
15
Net Interest Margin Analysis
($ in thousands)
Average
Balance
Interest
Average
Rate
Average
Balance
Interest
Average
Rate
Average
Balance
Interest
Basis
Points
Earning assets:
Interest-bearing deposits
$ 8,484
$ 1
0.05%
$ 10,191
$ 19
0.75%
$ 1,707
$ 18
70
Investment securities1
490,356
3,867
3.31
443,181
3,538
3.40
(47,175)
(329)
9
Loans2
2,420,000
32,476
5.39
2,619,409
35,643
5.46
199,409
3,167
7
FDIC indemnification asset
48,774
15
0.12
69,816
143
0.82
21,042
128
70
Total earning assets
2,967,614
36,359
4.94
3,142,597
39,343
5.05
174,983
2,984
11
Interest-bearing liabilities:
Deposits
1,946,317
3,951
0.82
2,254,290
3,981
0.71
307,973
30
(11)
Borrowings
609,665
4,156
2.73
428,505
3,649
3.43
(181,160)
(507)
70
Total interest-bearing liabilities
2,555,982
8,107
1.28
2,682,795
7,630
1.14
126,813
(477)
(14)
Net interest income
$28,252
$31,713
$ 3,461
Net interest margin
3.84%
4.08%
24
2
Average loans include loans held for sale and nonaccrual loans. Loan fees, which are not material for any of the periods, have been included in loan interest income for the rate calculation.
For the Quarter Ended
March 31, 2012
June 30, 2012
Change in
1
Interest income used in the average rate calculation includes the tax equivalent adjustment of $182 thousand and $226 thousand for the quarter ended March 31, 2012 and June 30, 2012,
respectively, calculated based on a federal tax rate of 35%.
First Financial Holdings, Inc.
16

Noninterest Income
June 30,
September 30,
December 31,
March 31,
June 30,
2011
2011
2011
2012
2012
Service charges and fees on deposit accounts
6,982
$
7,196
$
7,099
$
7,302
$
7,558
$
Mortgage and other loan income
2,051
2,743
2,681
3,435
4,372
Trust and plan administration
1,116
1,333
1,192
1,081
1,078
Brokerage fees
657
588
532
664
875
Other
670
647
650
769
699
Other-than-temporary-impairment
(54)
(169)
(180)
(69)
(145)
Total core noninterest income
11,422
12,338
11,974
13,182
14,437
Gain on acquisition
---
---
---
---
14,550
Gain on sale of securities
---
---
---
---
3,543
Gain on sold loan pool, net
---
1,900
20,796
---
---
Total noninterest income
11,422
$
14,238
$
32,770
$
13,182
$
32,530
$
($ in thousands)
For the Quarter Ended
First Financial Holdings, Inc.
17

Noninterest Expense
June 30,
September 30,
December 31,
March 31,
June 30,
2011
2011
2011
2012
2012
Salaries and employee benefits
15,373
$
14,672
$
14,511
$
15,142
$
15,212
$
Occupancy costs
2,116
2,188
2,144
2,267
2,933
Furniture and equipment
1,769
1,725
1,870
1,809
1,893
Other real estate owned expenses, net
800
3,115
1,541
530
134
FDIC insurance and regulatory fees
850
576
830
986
761
Professional services
1,094
1,521
1,019
1,431
1,816
Advertising and marketing
810
868
792
656
972
Other loan expense
1,099
990
1,043
1,351
1,283
Intangible asset amortization
82
79
90
90
368
Other expense
3,976
3,854
5,046
4,447
5,353
Total core noninterest expense
27,969
$
29,588
$
28,886
$
28,709
$
30,725
$
FHLB prepayment penalty
---
---
---
---
8,525
Goodwill impairment
630
---
---
---
---
Total noninterest expense
28,599
$
29,588
$
28,886
$
28,709
$
39,250
$
($ in thousands)
For the Quarter ended
First Financial Holdings, Inc.
18

Balance Sheet Summary
June 30,
September 30,
December 31,
March 31,
June 30,
2011
2011
2011
2012
2012
Total assets
$ 3,221,544
$ 3,206,310
$ 3,146,964
$ 3,145,538
$ 3,304,174
Investment securities
478,570
469,561
457,730
500,331
293,400
Performing loans
2,329,502
2,312,375
2,337,747
2,305,666
2,582,546
Nonperforming loans
42,567
42,905
47,710
49,901
49,937
Loans
2,372,069
2,355,280
2,385,457
2,355,567
2,632,483
Allowance for loan losses
55,491
54,333
53,524
50,776
48,799
Net loans
2,316,578
2,300,947
2,331,933
2,304,791
2,583,684
Deposits
2,315,745
2,302,857
2,239,138
2,264,489
2,703,202
Borrowings
604,704
605,204
608,204
580,204
280,204
Shareholders’ Equity
266,564
268,506
277,178
278,043
287,264
Loan/deposit ratio
102.43%
102.28%
106.53%
104.02%
97.38%
($ in thousands)
As of
First Financial Holdings, Inc.
19

Capital Position
June 30,
September 30,
December 31,
March 31,
June 30,
2011
2011
2011
2012
2012
First Financial (FFCH)
Equity to assets
8.27%
8.37%
8.81%
8.84%
8.69%
6.08
6.27
6.67
6.70
6.47
$ 12.20
$ 12.31
$ 12.84
$ 12.89
$ 13.45
11.83
12.16
12.69
12.75
12.91
0.05
0.05
0.05
0.05
0.05
Common shares outstanding, end of period (000s)
16,527
16,527
16,527
16,527
16,527
Tier 1 leverage capital ratio2
10.22%
9.79%
Tier 1 risk-based capital ratio2
14.81
13.89
Total risk-based capital ratio2
16.08
15.16
First Federal (FFB)3
Tier 1 leverage capital ratio
7.48%
8.26%
8.92%
9.00%
9.06%
Tier 1 risk-based capital ratio
10.07
11.26
12.35
13.05
12.86
Total risk-based capital ratio
11.33
12.53
13.61
14.32
14.13
of Condition and Income (the “Call” Report). Prior period ratios are reported based on superseded regulatory requirements previously issued by the Office of Thrift Supervision.
3 Capital ratios for the quarter ended March 31, 2012 for First Federal Bank are based on reporting requirements for financial institutions filing FFIEC 041, FDIC Consolidated Reports
1 Non-GAAP
2 The quarter ended March 31, 2012 was the first period First Financial was required to file bank holding company ratios with the Federal Reserve Bank
As of
Book value per common share
Tangible common book value per share1
Dividends paid per common share, authorized
Tangible common equity to tangible assets1
First Financial Holdings, Inc.
20
Investment Portfolio
42% fixed/ 58% variable
Average portfolio yield: 4.89%
Modified duration: 3.0 years
Private label/CMO: mostly 2003-2005 vintages
All but 3 securities are in super senior or senior tranches (3 are in mezzanine)
Bank trust preferred CDOs: <$1 million individually; all are in mezzanine tranche
($ in thousands)
Amortized
Cost
Estimated
Fair Value
Amortized
Cost
Estimated
Fair Value
Securities available for sale
Obligations of the U.S. Government agencies
and corporations
$ 1,860
$ 1,887
$ 1,490
$ 1,516
State and municipal obligations
450
466
450
481
Collateralized debt obligations
7,385
3,354
6,697
3,541
Mortgage-backed securities
89,756
93,465
41,627
43,602
Collateralized mortgage obligations
313,029
314,540
192,592
188,377
Other securities
5,318
5,255
5,959
6,542
Total securities available for sale
417,798
$
418,967
$
248,815
$
244,059
$
Securities held to maturity
State and municipal obligations
$ 21,070
$ 22,972
$ 19,513
$ 22,022
Certificates of deposit
907
907
501
501
Total securities held to maturity
$ 21,977
$ 23,879
$ 20,014
$ 22,523
As of
June 30, 2012
June 30, 2011
First Financial Holdings, Inc.
21

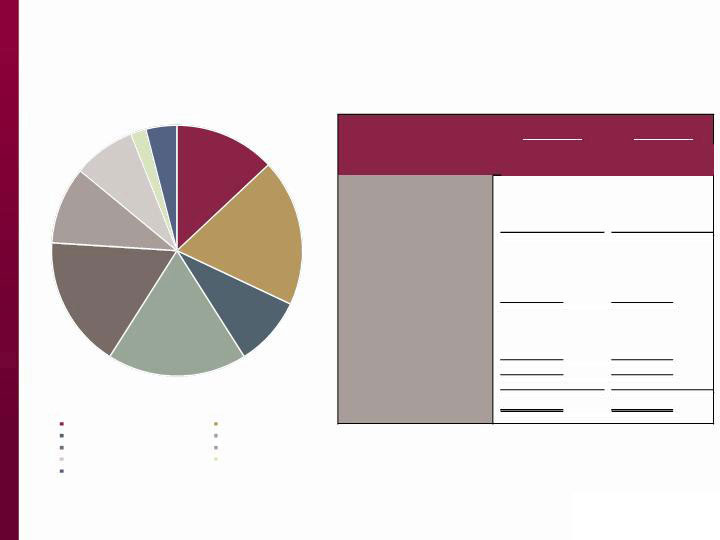
Loan Composition
June 30, 2012
39%
3%
4%
21%
3%
15%
11%
4%
Residential 1-4 family
Residential construction and land
Commercial business
Commercial real estate
Commercial construction and land
Home equity
Manufactured housing
Marine and other consumer
($ in thousands)
Balance
Avg
Yield
1
Balance
Avg
Yield
1
Residential loans
Residential 1-4 family
895,650
$
1,023,800
$
Residential construction
19,603
19,601
Residential land
42,763
56,073
Total residential loans
958,016
4.30%
1,099,474
3.98%
Commercial loans
Commercial business
80,566
107,804
Commercial real estate
482,315
555,588
Commercial construction
16,037
17,201
Commercial land
70,562
78,011
Total commercial loans
649,480
5.35%
758,604
6.53%
Consumer loans
Home equity
379,122
388,534
Manufactured housing
274,192
276,607
Marine
57,406
59,643
Other consumer
53,853
49,621
Total consumer loans
764,573
6.88%
774,405
6.95%
Total loans
2,372,069
$
5.40%
2,632,483
$
5.59%
Covered loans2
162,287
$
264,986
$
1 Portfolio yield is for the month presented
2 Covered loans as of June 30, 2011 were acquired in the Cape Fear Bank FDIC-assisted transaction and
June 30, 2012 also includes those acquired from Plantation Federal Bank. Both are subject to a loss
share agreement.
June 30, 2011
June 30, 2012
First Financial Holdings, Inc.
22
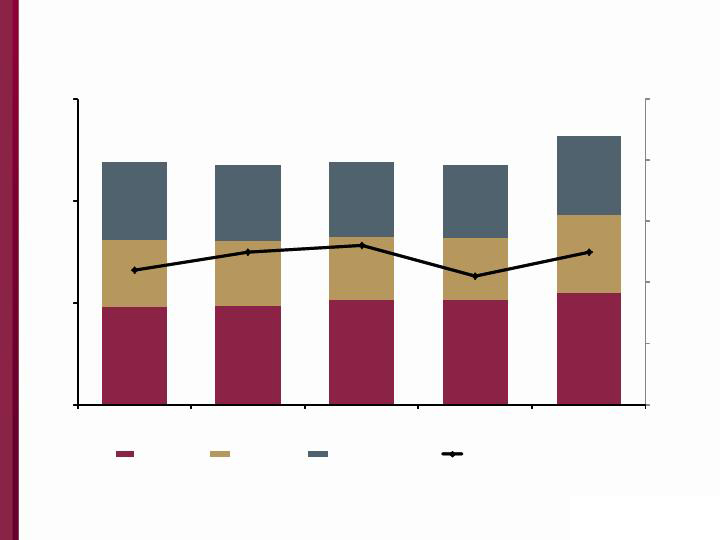
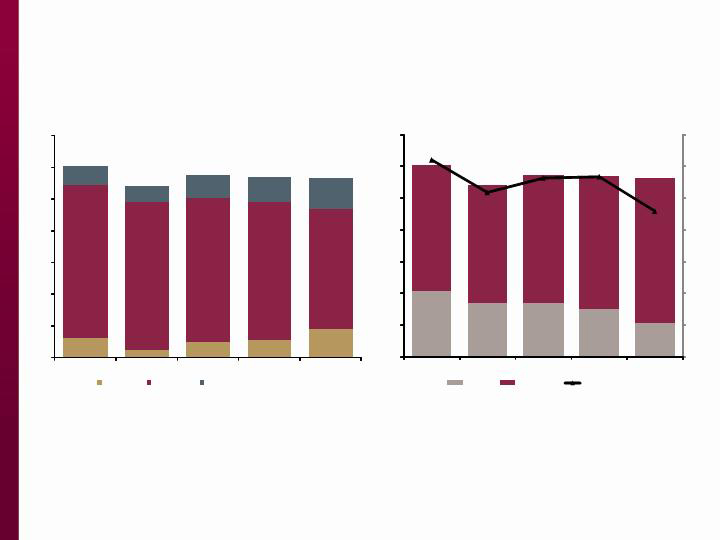
Loan Trends
$958
$967
$1,032
$1,029
$1,099
$649
$635
$618
$607
$759
$765
$753
$735
$720
$774
$2,372
$2,355
$2,385
$2,356
$2,632
5.44%
5.50%
5.52%
5.42%
5.50%
5.00%
5.20%
5.40%
5.60%
5.80%
6.00%
$0
$1,000
$2,000
$3,000
Jun-11
Sep-11
Dec-11
Mar-12
Jun-12
($ in millions)
Residential
Commercial
Consumer
Weighted Average Yield for Quarter
First Financial Holdings, Inc.
23
Deposit Mix
June 30, 2012
13%
19%
9%
18%
17%
10%
8%
2%
4%
Noninterest-bearing
Interest-bearing
Savings
Money market
Retail CDs < $100,000
Retail CDs > $100,000
Retail time deposits - IRAs
CDARs
Brokered CDs
($ in thousands)
Balance
Avg
Yield
1
Balance
Avg
Yield
1
Noninterest-bearing
$
234,478
---
$
359,552
---
Interest-bearing
437,179
0.33
%
502,530
0.14
%
Savings
189,283
0.27
252,380
0.16
Money market
316,953
0.47
479,049
0.45
Total core deposits
1,177,893
0.28
1,593,511
0.20
Retail CDs < $100,000
383,076
465,742
Retail CDs> $100,000
309,379
260,535
Retail time deposits - IRAs
161,747
207,968
Total retail time deposits
854,202
934,245
CDARs
94,809
67,850
Brokered CDs
188,841
107,596
Total wholesale time deposits
283,650
175,446
Total time deposits
1,137,852
1.71
1,109,691
1.12
Total deposits
$
2,315,745
0.99
%
$
2,703,202
0.58
%
1
Deposit yield is for the month presented
June 30, 2012
June 30, 2011
First Financial Holdings, Inc.
24
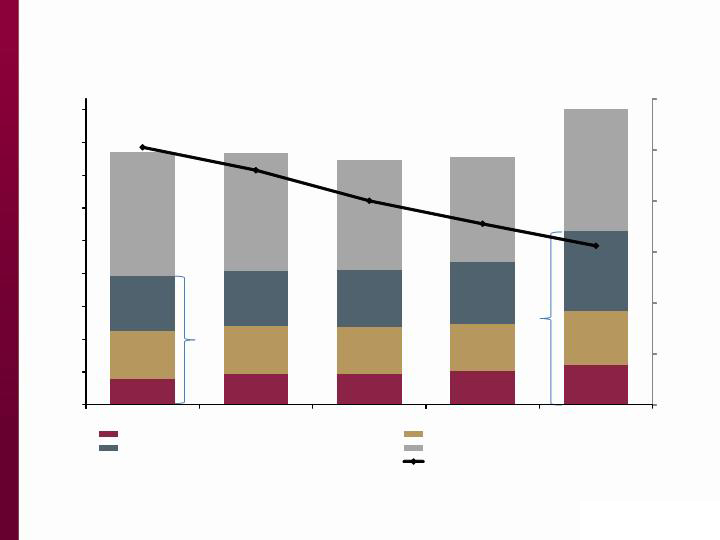
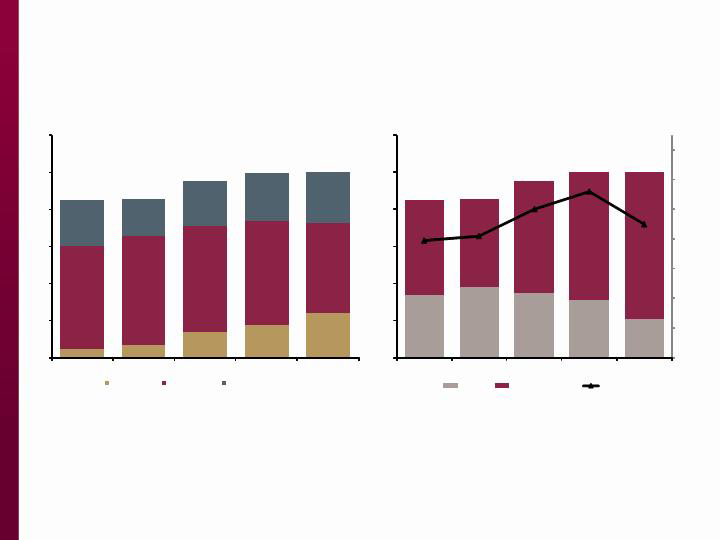
Deposit Trends
$235
$279
$280
$308
$360
$437
$441
$430
$435
$502
$506
$505
$522
$563
$731
$1,138
$1,078
$1,007
$958
$1,110
$2,316
$2,303
$2,239
$2,264
$2,703
1.01%
0.92%
0.80%
0.71%
0.62%
0.00%
0.20%
0.40%
0.60%
0.80%
1.00%
1.20%
$0
$300
$600
$900
$1,200
$1,500
$1,800
$2,100
$2,400
$2,700
Jun-11
Sep 11
Dec 11
Mar-12
Jun-12
($ in millions)
Non-interest Bearing
Interest Bearing
Savings and Money Market
CDs
Weighted Average Cost of Deposits For the Quarter
Core =
$1,178
Core =
$1,593
First Financial Holdings, Inc.
25
Liquidity Sources
June 30, 2012
Stable core deposit base
Multiple funding sources
Consistent cash flows from
securities portfolio
Capacity to obtain
additional Brokered and
Jumbo CDs
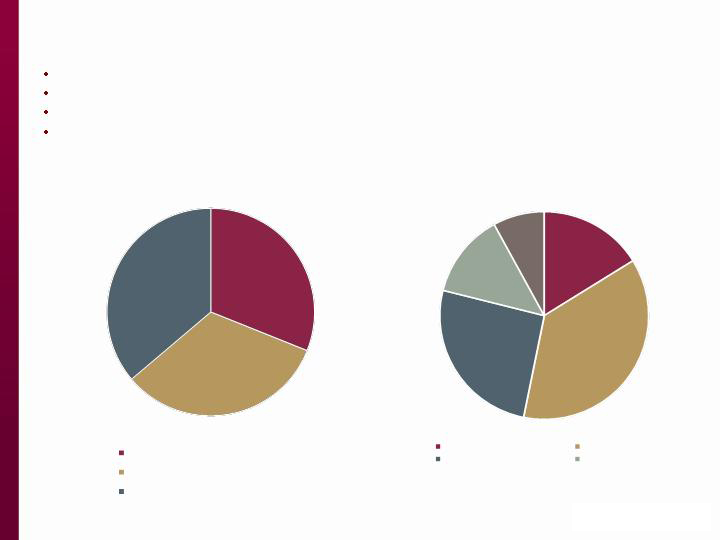
$191
$423
$40
$124
Primary Source Availability
FRB
FHLB
Fed Funds
Unpledged Securities
Total Available =
$778
million
Key Liquidity Ratios:
6/30/2011
6/30/2012
Funding Availability/Assets
22.49%
23.59%
Total Deposits/Total Funding
81.03%
92.10%
Brokered Deposits/Total Funding
9.64%
5.93%
Unpledged Securities/Total Assets
6.66%
3.87%
First Financial Holdings, Inc.
26

Credit Quality
First Financial Holdings, Inc.
27

Credit Trends
($ in millions)
June 30,
2011
September 30,
2011
December 31,
2011
March 31,
2012
June 30,
2012
Credit Metrics
Total nonperforming assets (“NPA”)
70.4
$
1
67.2
$
1
68.2
$
71.7
$
78.1
$
NPAs/assets
2.18%
1
2.10%
1
2.17%
2.28%
2.36%
Net charge-offs (“NCO”)
12.4
2
7.9
2
8.3
9.5
6.7
NCOs/average loans
1.96%
2
1.33%
2
1.39%
1.60%
1.04%
Allowance for loan losses/total loans
2.34%
2.31%
2.24%
2.16%
1.85%
3
Classified assets/FFB tier 1 capital +
allowance for loan losses (“ALL”)
50.58%
41.76%
40.53%
40.83%
40.45%
Classified assets/FFCH tier 1 capital + ALL4
41.57%
36.77%
36.12%
36.56%
37.78%
Credit Metrics Excluding Covered Assets
Total nonperforming assets
46.2
$
39.5
$
43.1
$
44.7
$
47.8
$
NPAs/assets
1.43%
1.23%
1.37%
1.42%
1.45%
ALL/Nonperforming loans
216.35%
5
227.09%
5
177.35%
148.22%
123.30%
Classified assets/FFB tier 1 capital + ALL
34.21%
28.29%
28.21%
28.51%
28.72%
Classified assets/FFCH tier 1 capital + ALL4
28.12%
24.91%
25.15%
25.53%
26.83%
3
Includes $295mm of acquired loans carried at fair value with no current allowance, excluding the acquired loans the allowance percentage is 2.09%
As of and for the Quarter ended
4
FFCH began reporting regulatory capital information at March 31, 2011. All prior periods are pro forma calculations.
5
Excludes nonperforming loans held for sale of $42.7 million and $39.4 million at June 30, 2011 and September 30, 2011, respectively.
1
Excludes nonperforming assets held for sale of $42.7 million and $41.3 million at June 30, 2011 and September 30, 2011, respectively.
2
Excludes charge-offs of $95.0 million and $2.2 million from loans reclassified to held for sale for the quarters ending June 30, 2011 and September 30, 2011, respectively.
First Financial Holdings, Inc.
28
Classified Loans
$12.0
$5.0
$10.0
$11.0
$18.0
$97.0
$93.0
$91.0
$87.0
$76.0
$12.0
$10.0
$14.0
$16.0
$19.0
$121.0
$108.0
$115.0
$114.0
$113.0
$0.0
$20.0
$40.0
$60.0
$80.0
$100.0
$120.0
$140.0
Jun-11
Sep-11
Dec-11
Mar-12
Jun-12
$ in millions
Residential
Commercial
Consumer
$41.0
$34.0
$34.0
$30.0
$21.0
$80.0
$74.0
$81.0
$84.0
$92.0
$121.0
$108.0
$115.0
$114.0
$113.0
5.10%
4.59%
4.82%
4.84%
4.29%
2.00%
2.50%
3.00%
3.50%
4.00%
4.50%
5.00%
5.50%
$0.0
$20.0
$40.0
$60.0
$80.0
$100.0
$120.0
$140.0
Jun-11
Sep-11
Dec-11
Mar-12
Jun-12
$ in millions
Covered
Noncovered
% of Loans
First Financial Holdings, Inc.
29

Delinquent Loans
$1.7
$1.8
$3.5
$2.0
$1.7
$5.9
$5.4
$5.6
$7.0
$4.6
$6.4
$7.6
$9.2
$5.6
$4.8
$14.1
$14.8
$18.4
$14.6
$11.1
$0.0
$2.0
$4.0
$6.0
$8.0
$10.0
$12.0
$14.0
$16.0
$18.0
$20.0
Jun-11
Sep-11
Dec-11
Mar-12
Jun-12
$ in millions
Residential
Commercial
Consumer
$3.0
$2.7
$2.3
$3.1
$2.9
$11.1
$12.1
$16.1
$11.5
$8.1
$14.1
$14.8
$18.4
$14.6
$11.1
0.59%
0.63%
0.77%
0.62%
0.42%
0.00%
0.10%
0.20%
0.30%
0.40%
0.50%
0.60%
0.70%
0.80%
0.90%
$0.0
$2.0
$4.0
$6.0
$8.0
$10.0
$12.0
$14.0
$16.0
$18.0
$20.0
Jun-11
Sep-11
Dec-11
Mar-12
Jun-12
$ in millions
Covered
Noncovered
% of Loans
First Financial Holdings, Inc.
30
Nonperforming Loans
Note:
Nonperforming loans include loans past due 90+ days still accruing interest and restructured loans still accruing interest.
Nonperforming loans held for sale of $43 million and $39 million were excluded from the graph, for the quarters ended
June 30, 2011 and September 30, 2011 respectively.
$2.4
$3.5
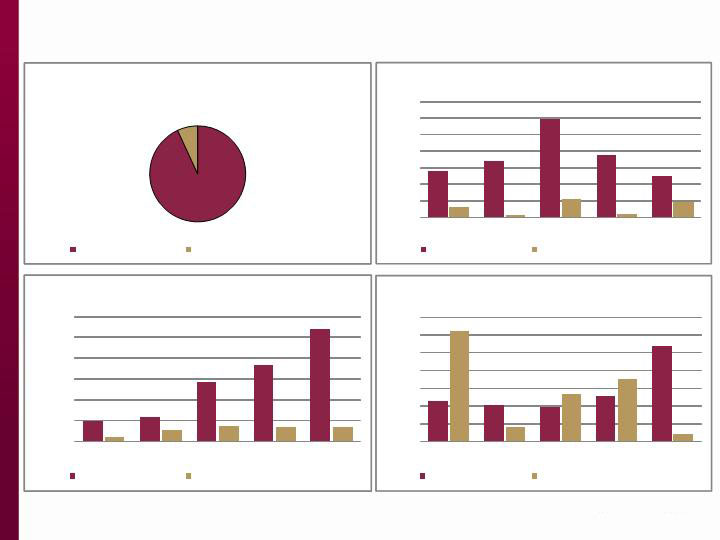
$7.2
$8.8
$12.2
$27.7
$29.3
$28.3
$28.1
$24.2
$12.4
$10.1
$12.2
$13.0
$13.6
$42.6
$42.9
$47.7
$49.9
$49.9
$0.0
$10.0
$20.0
$30.0
$40.0
$50.0
$60.0
Jun-11
Sep-11
Dec-11
Mar-12
Jun-12
$ in millions
Residential
Commercial
Consumer
$16.9
$19.0
$17.5
$15.6
$10.4
$25.6
$23.9
$30.2
$34.3
$39.6
$42.6
$42.9
$47.7
$49.9
$49.9
1.79%
1.82%
2.00%
2.12%
1.90%
1.00%
1.20%
1.40%
1.60%
1.80%
2.00%
2.20%
2.40%
$0.0
$10.0
$20.0
$30.0
$40.0
$50.0
$60.0
Jun-11
Sep-11
Dec-11
Mar-12
Jun-12
$ in millions
Covered
Noncovered
% of Loans
First Financial Holdings, Inc.
31

Other Repossessed Assets
Note: Other reposessed assets excludes $1.9 million of non-covered other
real estate owned that was included in assets held for bulk sale at
September 30, 2011.
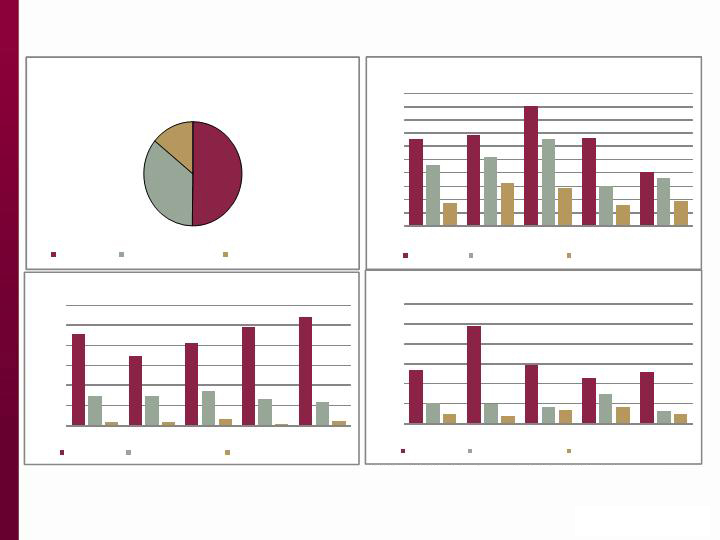
$10.6
$8.1
$7.8
$7.1
$5.7
$7.2
$7.8
$5.4
$4.6
$6.5
$8.8
$7.1
$5.8
$8.0
$14.3
$1.1
$1.3
$1.5
$2.1
$1.7
$27.8
$24.3
$20.5
$21.8
$28.2
$0.0
$5.0
$10.0
$15.0
$20.0
$25.0
$30.0
Jun-11
Sep-11
Dec-11
Mar-12
Jun-12
$ in millions
Residential
Commercial
Land
Other
$7.3
$8.7
$7.6
$11.4
$20.0
$20.5
$15.6
$12.9
$10.5
$8.2
$27.8
$24.3
$20.5
$21.8
$28.2
$0.0
$5.0
$10.0
$15.0
$20.0
$25.0
$30.0
Jun-11
Sep-11
Dec-11
Mar-12
Jun-12
$ in millions
Covered
Noncovered
First Financial Holdings, Inc.
32

Net Charge-offs and Provision
Provision $
Net Charge-offs $
(in millions)
Jun-12
Mar-12
Dec-11
Sep-11
Jun-11
$20.0
$18.0
$16.0
$14.0
$12.0
$10.0
$8.0
$6.0
$4.0
$2.0
$-
$4.7
$6.7
$7.4
$7.5
$12.1
$6.7
$9.5
$8.3
$7.9
$12.4
Note: Excludes charge-offs of $95.0 million and $2.2 million and provision of $65.7 million and $1.4 million from loans
reclassified as held for sale for the quarters ending June 30, 2011 and September 30, 2011, respectively.
First Financial Holdings, Inc.
33

Continued core earnings enhancement opportunities
Actively manage interest rate risk and net interest margin
Diversified income sources and initiatives for additional revenue enhancement
Ongoing evaluations of business processes and cost control for operating efficiency gains
Well-positioned balance sheet
Actively manage the balance sheet to maximize returns
Solid capital position
Actively managing problem assets yielded positive results and sound credit quality
Increased core deposit base and ample sources of liquidity
Experienced senior management team
Diverse backgrounds include national, regional and community banks
Demographically attractive banking markets
Economic development initiatives in existing markets
Carolinas markets considered highly attractive locations for new businesses and growth
opportunities
Investment Opportunity
First Financial Holdings, Inc.
34

APPENDIX
First Financial Holdings, Inc.
35
3.62%
US Average
Highly Attractive Markets
Population
676,751
368,176
275,035
60,440
207,064
189,493
645,404
4,682,632
9,658,876
Projected Population Growth
8.58%
9.01%
9.22%
2.88%
3.14%
10.41%
6.15%
6.04%
6.57%
Median Household Income (HHI)
$44,910
$40,649
$40,390
$38,486
$36,246
$51,129
$44,251
$41,607
$42,941
Projected Median HHI Growth
10.12%
11.73%
10.81%
4.67%
5.65%
9.96%
8.33%
8.43%
8.99%
Unemployment Rates 12/31/11*
7.70%
10.90%
12.00%
10.40%
10.40%
7.80%
7.60%
9.50%
10.20%
Unemployment Rates 05/31/12*
7.90%
9.60%
9.90%
9.50%
10.00%
8.30%
8.00%
9.30%
9.40%
* Not seasonally adjusted
Data Source:
SNL Financial as of June 30, 2011
9.28%
9.54%
9.28%
4.12%
3.65%
11.71%
6.25%
6.57%
6.78%
0.0%
2.0%
4.0%
6.0%
8.0%
10.0%
12.0%
14.0%
Charleston
MSA
Wilmington
MSA
Myrtle Beach
MSA
Georgetown
MSA
Florence
MSA
Hilton Head/
Beaufort
MSA
Greenville
MSA
SC
NC
2011-2016 Projected Household Growth Rate
First Financial Holdings, Inc.
36
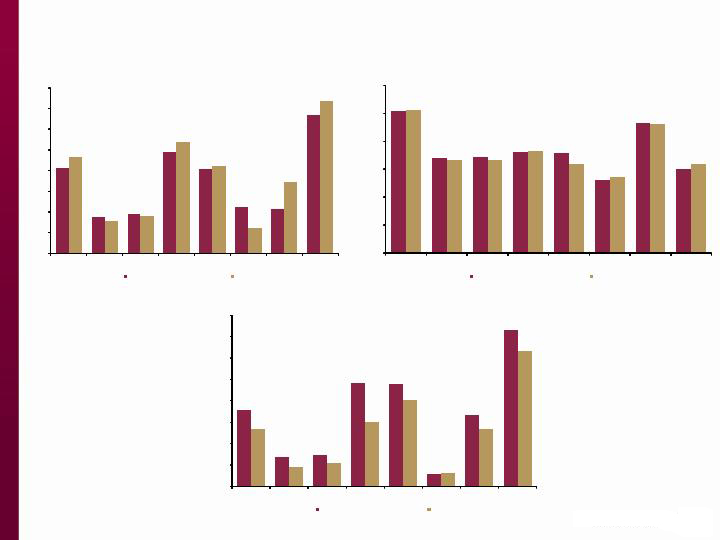
Real Estate Metrics
0
100
200
300
400
500
600
700
800
Charleston
Dorchester
Berkeley
Wilmington
Horry
Florence
Beaufort
Greenville
June 2011
June 2012
Number of Closed Sales
(Number of Homes Sold)
$0
$50,000
$100,000
$150,000
$200,000
$250,000
$300,000
Charleston
Dorchester
Berkeley
Wilmington
Horry
Florence
Beaufort
Greenville
June 2011
June 2012
Median Sales Price
(in $)
0
1,000
2,000
3,000
4,000
5,000
6,000
7,000
8,000
Charleston
Dorchester
Berkeley
Wilmington
Horry
Florence
Beaufort
Greenville
June 2011
June 2012
Inventory for Sale
(Housing Units)
First Financial Holdings, Inc.
37

Aerospace/Aviation
Boeing plant completed and Dreamliner production in process
First 787 rolled off the assembly line in April 2012
Four airplanes completed, awaiting delivery
Anticipate 3,800 direct jobs; opportunity to double with suppliers
In excess of $66 million in investment and over 700 jobs in the aerospace-related sector
announced for SC in 2011
TIGHITCO, an industry leader in the design, fabrication and repair of engineered
components and integrated systems for aerospace, locating a new $30 million
manufacturing facility in Charleston, creating 350 jobs in 2012
Alternative Energy
Clemson University Restoration Institute (CURI), created a 97-acre campus in Charleston
for experts and researchers in design, planning and construction to advance global
restoration methods and technologies
World’s largest, and one of only three, wind turbine drivetrain test facility; fully
operational by end of 2012, offering simultaneous testing of 7.5 and 15 megawatt power
train components
Potential for 20,000 jobs statewide with manufacturing contract
Economic Updates
Charleston Market Targeted Industries
First Financial Holdings, Inc.
38

Biomedical
Medical University of SC, nationally recognized research center and teaching hospital,
awards 800+ degrees each year, employs more than 11,000, and annually contributes over
$2.3 billion to the local economy
In excess of $243 million in research funding granted in 2011
MUSC opening drug discovery and bioengineering research buildings in next year
Bioscience activity in area includes 35 pharmaceutical and medical device manufacturers
and more than 50 research laboratories and development companies
Advanced Security and IT
Nearly every U.S. Department of Defense and Department of Homeland Security agency
engaged in next-generation security systems and monitoring technology are housed in the
region with more than 18,000 ex-military and government employees in the area
Hundreds of defense contractors are located in Charleston, including SAIC, SRC and BAE,
with an estimated $8 billion in contracts completed since 2000
Space & Naval Warfare Systems Center Atlantic (SPAWAR) will soon open a new
consolidated engineering laboratory to focus on IT innovations
Economic Updates
Charleston Market Targeted Industries
First Financial Holdings, Inc.
39

SC Port Authority - Charleston
Eighth largest U.S. container port by cargo value
Over $62.4 billion in goods move through the port annually
Deepest harbor and shipping channels in the South Atlantic
Regularly hosts post-Panamax vessels at high tide
Approval for study to deepen harbor 3 – 5 feet to accommodate larger ships at any tide
State has set aside funds allocated for harbor deepening; anticipate completion by 2019
Offers global connections to 150 countries
Fiscal 2011 year ended with container volume up 8.3%
Incremental 1.4 million twenty-foot equivalent units “TEU”
Breakbulk pier tonnage increased 21.5% during the first six months of fiscal 2012
New three-berth, 280-acre container terminal scheduled to open in 2013
Other Market Updates
Continental Tires building a Sumter, SC plant starting in mid-2012, total investment
expected to be $500 million and will bring 1,700 new jobs by 2020
2012 PGA Championship to be held at Kiawah Island will make a projected economic
impact of $193 million to SC
PeopleMatter, a human resource technology firm locating in downtown Charleston, will
invest $18.8 million and create 265 new jobs during the next 5 years
Economic Updates
First Financial Holdings, Inc.
40

Upstate Market Developments
SC Ports Authority approved development of in-land port in Greer, which will convert all-
truck container moves to multimodal moves via both truck and rail; anticipated capital
investment in excess of $23 million
BMW plans additional investments of nearly $900 million and 300 new jobs in 2012
Clemson University trustees approved the addition of a $6.5 million research and
education center in conjunction with Clemson University/Greenwood Genetic Center
Greenville-based Michelin North America to hire 500 people and invest $750 million in
Anderson and Lexington counties to meet growing demand for the massive tires used on
earth-moving equipment
JTEKT Automotive South Carolina Inc. to invest $102 million and add 80 jobs to its location
in Piedmont, SC during 2012
Amazon plans to open a one million square foot distribution center by fall 2012 in
Spartanburg, creating 390 jobs
Economic Updates
First Financial Holdings, Inc.
41
Residential Mortgage Loans
$-
$200
$400
$600
$800
$1,000
$1,200
$1,400
Jun-11*
Sep-11
Dec-11
Mar-12
Jun-12
Net Charge-Offs
Residential 1-4 family
Residential construction and land
($ in thousands)
$-
$2,000
$4,000
$6,000
$8,000
$10,000
$12,000
Jun-11
Sept-11
Dec-11
Mar-12
Jun-12
Nonperforming Loans
Residential 1-4 family
Residential construction and land
($ in thousands)
$-
$500
$1,000
$1,500
$2,000
$2,500
$3,000
$3,500
Jun-11
Sep-11
Dec-11
Mar-12
Jun-12
Delinquent Loans
Residential 1-4 family
Residential construction and land
($ in thousands)
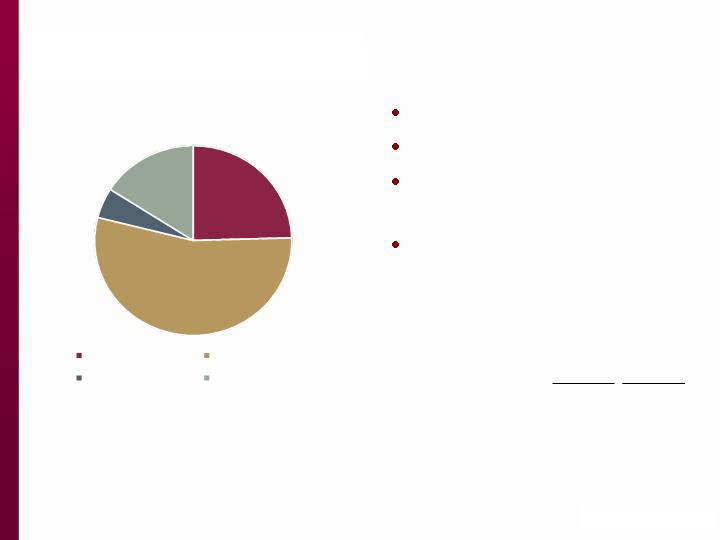
93%
7%
Residential Mortgage Loan Portfolio
As of June 30, 2012
Residential 1-4 family
Residential construction and land
* Excludes $15 million from loans reclassified as held for sale.
First Financial Holdings, Inc.
42

$22,685
Residential Mortgage Credit Quality Trends
June 30, 2011
September 30, 2011
December 31, 2011
March 31, 2012
June 30, 2012
(dollars in thousands)
$
% of
Portfolio
$
% of
Portfolio
$
% of
Portfolio
$
% of
Portfolio
$
% of
Portfolio
Delinquent Loans1
Residential 1-4 family
1,404
$
0.16%
1,722
$
0.19%
2,986
$
0.31%
1,889
$
0.19%
1,244
$
0.12%
Residential land
325
0.76
65
0.16
561
1.35
123
0.30
475
0.85
Total delinquent residential loans
1,729
$
0.18%
1,787
$
0.18%
3,547
$
0.34%
2,012
$
0.20%
1,719
$
0.16%
Nonperforming Loans
Residential 1-4 family
1,242
$
0.14%
1,595
$
0.18%
4,977
$
0.51%
6,649
$
0.68%
10,460
$
1.02%
Residential land
451
1.05
1,140
2.80
1,448
3.48
1,398
3.43
1,423
2.54
Total residential nonaccruing loans
1,693
0.18%
2,735
0.28%
6,425
0.62%
8,047
0.78%
11,883
1.08%
Restructured loans still accruing
733
734
734
734
330
Total nonperforming residential loans
2,426
$
3,469
$
7,159
$
8,781
$
12,213
$
Net Charge-Offs
Residential 1-4 family
461
$
2
0.21%
414
$
0.18%
391
$
0.16%
507
$
0.21%
1,070
$
0.42%
Residential land
1,237
2
11.57
165
1.58
532
5.31
701
6.75
78
0.59
Total residential net charge-offs
1,698
$
0.72%
579
$
0.24%
923
$
0.37%
1,208
$
0.47%
1,148
$
0.42%
1 Includes loans past due 30-89 days.
2 Excludes $11,716 and $2,862 from loans reclassified as held for sale
As of and for the Quarter ended
First Financial Holdings, Inc.
43

Analysis of Portfolio Loans
As of June 2012
% of
Portfolio
Avg
Yld
30-year Fixed Rate
13%
5.23%
30-year Jumbos
6%
5.14%
15-year Fixed Rate
23%
3.83%
Hybrid ARMs
9%
4.86%
Adjustable Rate
Mortgages 1
47%
3.25%
Other
2%
7.04%
100%
3.97%
Retail
CLD2
Source
47%
53%
Avg. FICO
756
768
Avg. LTV
70%
69%
Fixed rate locks
74%
99%
Purchase
percentage
38%
28%
Refinance
percentage
62%
72%
Residential Mortgage Loan Details
Origination Profile
As of June 2012
2 - Correspondent Lending Division
1 - Generally up to 30 year terms and annual rate adjustment after being
fixed for a period of 3, 5, 7 or 10 years in accordance with a designated
index. Either a 1%, 2% or 5% cap on the rate adjustment after the initial
repricing period, a 1% or 2% annual cap and a 4%, 5% or 6% life cap.
First Financial Holdings, Inc.
44

Commercial Loans
* Excludes $78 million from loans reclassified as held for sale
14%
73%
13%
Commercial Loan Portfolio
As of June 30, 2012
Commercial business
Commercial real estate
Commercial construction and land
Note:
39% of Legacy CRE consists of owner occupied property
$-
$500
$1,000
$1,500
$2,000
$2,500
$3,000
$3,500
$4,000
Jun-11
Sep-11
Dec-11
Mar-12
Jun-12
Delinquent Loans
Commercial business
Commercial real estate
Commercial construction and land
($ in thousands)
$-
$5,000
$10,000
$15,000
$20,000
$25,000
Jun-11
Sep-11
Dec-11
Mar-12
Jun-12
Nonperforming Loans
Commercial business
Commercial real estate
Commercial construction and land
($ in thousands)
$-
$500
$1,000
$1,500
$2,000
$2,500
$3,000
$3,500
Jun - 11*
Sep-11
Dec-11
Mar-12
Jun-12
Net Charge-Offs
Commercial business
Commercial real estate
Commercial construction and land
($ in thousands)
First Financial Holdings, Inc.
45

$22,685
Commercial Credit Quality Trends
June 30, 2011
(dollars in thousands)
$
% of
Portfolio
$
% of
Portfolio
$
% of
Portfolio
$
% of
Portfolio
$
% of
Portfolio
Delinquent Loans1
Commercial business
2,387
$
2.96%
868
$
1.07%
908
$
1.08%
1,677
$
1.90%
903
$
0.84%
Commercial real estate
2,703
0.56
3,394
0.72
3,514
0.77
3,065
0.69
3,014
0.54
Commercial construction
---
---
595
3.95
---
---
---
---
---
---
Commercial land
821
1.16
537
0.80
1,185
1.94
2,271
4.15
675
0.87
Total commercial delinquent loans
5,911
$
0.91%
5,394
$
0.85%
5,607
$
0.91%
7,013
$
1.16%
4,592
$
0.61%
Nonperforming Loans
Commercial business
3,664
$
4.55%
4,322
$
5.34%
3,665
$
4.37%
1,931
$
2.19%
1,198
$
1.11%
Commercial real estate
16,396
3.40
18,400
3.90
17,160
3.76
18,474
4.13
15,918
2.87
Commercial construction
1,451
9.05
266
1.77
573
3.48
261
1.60
261
1.52
Commercial land
5,411
7.67
6,310
9.36
5,232
8.54
5,240
9.56
4,577
5.87
Total commercial nonaccrual loans
26,922
4.15%
29,298
4.62%
26,630
4.31%
25,906
4.27%
21,954
2.89%
Restructured loans still accruing
802
---
1,677
2,229
2,215
Total commercial nonperforming
27,724
$
29,298
$
28,307
$
28,135
$
24,169
$
Net Charge-Offs
Commercial business
982
$
2
4.88%
136
$
0.69%
640
$
3.22%
825
$
3.60%
334
$
1.34%
Commercial real estate
2,233
2
1.85
433
0.36
1,417
1.22
1,462
1.30
715
0.54
Commercial construction
56
2
1.40
635
16.12
(3)
(0.07)
(2)
(0.05)
(2)
(0.05)
Commercial land
3,251
2
18.43
2,052
12.15
804
4.94
1,439
9.87
723
4.00
Total net commercial charge-offs
6,522
$
4.02%
3,256
$
2.04%
2,858
$
1.83%
3,724
$
2.41%
1,770
$
0.99%
1
Includes loans past due 30-89 days.
2
Excludes $5,844 in Commercial business, $38,789 in Commercial real estate, $3,011 in Commercial construction and $30,744 in Commercial Land reclassified as loans held for sale
December 31, 2011
September 30, 2011
June 30, 2012
As of and for the Quarter ended
March 31, 2012
First Financial Holdings, Inc.
46
Consumer Loans
50%
36%
14%
Consumer Loan Portfolio
As of June 30, 2012
Home equity
Manufactured housing
Marine and other consumer
$-
$500
$1,000
$1,500
$2,000
$2,500
$3,000
$3,500
$4,000
$4,500
$5,000
Jun-11
Sep-11
Dec-11
Mar-12
Jun-12
Delinquent Loans
Home equity
Manufactured housing
Marine and other consumer
($ in thousands)
$-
$2,000
$4,000
$6,000
$8,000
$10,000
$12,000
Jun-11
Sep-11
Dec-11
Mar-12
Jun-12
Nonperforming Loans
Home equity
Manufactured housing
Marine and other consumer
($
in thousands)
$-
$1,000
$2,000
$3,000
$4,000
$5,000
$6,000
Jun-11*
Sep-11
Dec-11
Mar-12
Jun-12
Net Charge - Offs
Home equity
Manufactured housing
Marine and other consumer
($ in thousands)
* Excludes $2 million from loans reclassified as held for sale
First Financial Holdings, Inc.
47

$22,685
Consumer Credit Quality Trends
June 30, 2011
September 30, 2011
(dollars in thousands)
$
% of
Portfolio
$
% of
Portfolio
$
% of
Portfolio
$
% of
Portfolio
$
% of
Portfolio
Delinquent Loans1
Home equity
3,266
0.86%
3,408
0.92%
4,525
1.27%
3,315
0.95%
2,017
0.52%
Manufactured housing
2,298
0.84
2,600
0.94
3,267
1.19
1,502
0.54
1,835
0.66
Marine
264
0.46
980
1.77
597
1.14
358
0.71
300
0.50
Other consumer
589
1.09
629
1.19
831
1.66
445
0.97
626
1.26
Total delinquent loans
6,417
$
0.84%
7,617
$
1.01%
9,220
$
1.25%
5,620
$
0.78%
4,778
$
0.62%
Nonperforming Loans
Home equity
9,165
2.42%
6,871
1.86%
8,192
2.29%
9,779
2.81%
10,636
2
2.74%
Manufactured housing
2,953
1.08
2,922
1.06
3,461
1.26
2,648
0.96
2,197
0.79
Marine
94
0.16
47
0.09
246
0.47
63
0.12
29
0.05
Other consumer
129
0.24
127
0.24
224
0.45
131
0.29
306
0.62
Total consumer nonaccrual loans
12,341
1.61%
9,967
1.32%
12,123
1.65%
12,621
1.75%
13,168
1.70%
Loans 90+ days still accruing
76
171
121
51
75
Restructured loans still accruing
---
---
---
314
313
Total consumer nonperforming loans
12,417
$
10,138
$
12,244
$
12,986
$
13,556
$
Net Charge-Offs
Home equity
2,686
$
3
2.83%
4,910
$
5.28%
2,955
$
3.26%
2,264
$
2.57%
2,580
$
2.71%
Manufactured housing
1,049
1.54
978
1.42
845
1.23
1,467
2.13
666
0.97
Marine
44
0.30
158
1.12
142
1.05
361
2.83
82
0.60
Other consumer
446
3.28
217
1.61
531
4.09
469
3.90
428
3.48
Total consumer net charge-offs
4,225
$
2.21%
6,263
$
3.31%
4,473
$
2.41%
4,561
$
2.51%
3,756
$
1.98%
1
Includes loans past due 30-89 days.
2
Of the $10,636 of nonperforming home equity loans, $4,597 are in first position, $2,615 are in second position where First Federal holds the first and $3,424 are in second position
where another bank holds the first
3
Excludes $2,039 from loans reclassified as held for sale
December 31, 2011
June 30, 2012
As of and for the Quarter ended
March 31, 2012
First Financial Holdings, Inc.
48
Annual review of collateral values and quarterly reviews of credit score
95% of lines are interest only
22% of lines are fully drawn as of June 30, 2012
20% of lines are frozen as result of reviews which identified material changes in financial
circumstances
Home Equity Composition
31%
33%
36%
1st Position
2nd Position to First Federal 1st Position
2nd Position to Third party 1st Position
16%
37%
26%
13%
8%
800 + beacon
750 -799 beacon
700 - 749 beacon
660 -699 beacon
Based on portfolio review conducted as of December 31, 2011
First Financial Holdings, Inc.
49

Non-GAAP Reconciliation
(dollars in thousands, except per share data)
June 30,
2011
September 30,
2011
December 31,
2011
March 31,
2012
June 30,
2012
Tangible assets and tangible common equity
Total assets
3,221,544
$
3,206,310
$
3,146,964
$
3,145,538
$
3,304,174
$
Goodwill1
(3,250)
---
---
---
---
Other intangible assets, net1
(2,776)
(2,491)
(2,401)
(2,310)
(8,931)
Tangible assets (non-GAAP)
3,215,518
$
3,203,819
$
3,144,563
$
3,143,228
$
3,295,243
$
Total shareholders’ equity
266,564
$
268,506
$
277,178
$
278,043
$
287,264
$
Preferred stock
(65,000)
(65,000)
(65,000)
(65,000)
(65,000)
Goodwill1
(3,250)
---
---
---
---
Other intangible assets, net1
(2,776)
(2,491)
(2,401)
(2,310)
(8,931)
Tangible common equity (non-GAAP)
195,538
$
201,015
$
209,777
$
210,733
$
213,333
$
Shares outstanding, end of period (000s)
16,527
16,527
16,527
16,527
16,527
Tangible common equity to tangible assets
6.08%
6.27%
6.67%
6.70%
6.47%
Tangible common book value per share
11.83
$
12.16
$
12.69
$
12.75
$
12.91
$
Pre-tax pre-provision earnings from
continuing operations
(Loss) income before income taxes
(65,565)
$
4,774
$
25,338
$
5,980
$
20,296
$
Provision for loan losses
77,803
8,940
7,445
6,745
4,697
Pre-tax pre-provision earnings (non-GAAP)
12,238
$
13,714
$
32,783
$
12,725
$
24,993
$
1
Represents amounts for continuing operations and for discontinued operations.
As of and For the Quarter Ended
First Financial Holdings, Inc.
50

First Financial Holdings, Inc.
Nasdaq: FFCH
www.firstfinancialholdings.com
R. Wayne Hall
Blaise B. Bettendorf
President & CEO
EVP & Chief Financial Officer
whall@firstfederal.com
bbettendorf@firstfederal.com
843.529.5907
843.529.5456