
First Financial Holdings, Inc. Nasdaq: FFCH December 31, 2012
2 Statements in this report that are not statements of historical fact, including without limitation, statements that include terms such as “believes,”“expects,”“anticipates,”“estimates,”“forecasts,” “intends,”“plans,”“targets,”“potentially,”“probably,”“projects,”“outlook,”or similar expressions or future conditional verbs such as “may,”“will,”“should,”“would,”or “could”constitute forward- looking statements within the meaning of the Private Securities Litigation Reform Act of 1995. These forward-looking statements regarding First Financial’s future financial and operating results, plans, objectives, expectations and intentions involve risks and uncertainties, many of which are beyond First Financial ’s control or are subject to change. No forward -looking statement is a guarantee of future performance and actual results could differ materially from those anticipated by the forward-looking statements. These factors also include risks and uncertainties detailed fromtime to time in First Financial’s other filings with the SEC, such as the risk factors listed in “Item 1A. Risk Factors,”of First Financial’s 2011 Annual Report on Form 10 -K and subsequent Forms 10 -Q (including this Form 10-Q). Other factors not currently anticipated may also materially and adversely affect First Financial’s results of operations, cash flows, and financial condition. There can be no assurance that future results will meet expectations. While First Financial be lieves that the forward -looking statements in this report are reasonable, the reader should not place undue reliance on any forward-looking statement. In addition, these statements speak only as of the date made. First Financial does not undertake, and expressly disclaims any obliga tion to update or alter any statements, whether as a result of new information, future events or otherwise, except as required by applicable law. Forward-looking Statements

3 Overview
4 • Carolinas-based financial institution – Largest publicly traded bank headquartered in Charleston, SC – Serving customers’banking needs since 1934 – Primary markets located in the Coastal Carolinas, Florence and Greenville, SC – Total of 66 financial centers with approximately 20% “in-store”locations – Convenient seven-day-a-week banking • Diversified business mix – Business Banking team delivers cash management and small business advisory services – Mortgage origination services available through financial centers and third-party channels • Total servicing portfolio of $2.9 billion including $1.8 billionserviced for others – Wealth management group offers personal relationship banking, trust, brokerage, and 401(k) administration services • Strategic advantages – Completed numerous strategic initiatives over the last six quarters to strengthen the balance sheet and provide for future income enhancements – Growth markets and strong distribution channels – Solid capital levels and improved credit quality – Experienced management team and associates Corporate Profile
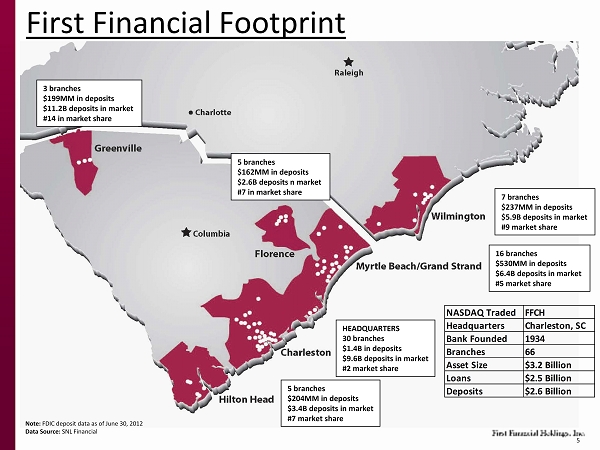
5 7 branches $237MM in deposits $5.9B deposits in market #9 market share 5 branches $162MM in deposits $2.6B deposits n market #7 in market share 5 branches $204MM in deposits $3.4B deposits in market #7 market share HEADQUARTERS 30 branches $1.4B in deposits $9.6B deposits in market #2 market share 16 branches $530MM in deposits $6.4B deposits in market #5 market share Note: FDIC deposit data as of June 30, 2012 Data Source: SNL Financial First Financial Footprint 3 branches $199MM in deposits $11.2B deposits in market #14 in market share NASDAQ Traded FFCH Headquarters Charleston, SC Bank Founded 1934 Branches 66 Asset Size $3.2 Billion Loans $2.5 Billion Deposits $2.6 Billion
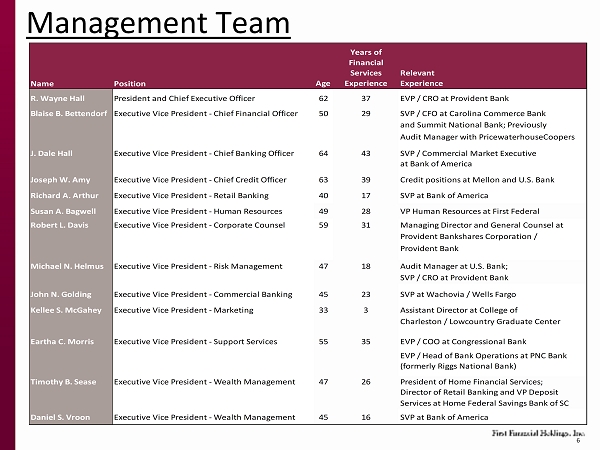
6 Management Team Name Position Age Years of Financial Services Experience Relevant Experience R. Wayne Hall President and Chief Executive Officer 62 37 EVP / CRO at Provident Bank Blaise B. Bettendorf Executive Vice President - Chief Financial Officer 50 29 SVP / CFO at Carolina Commerce Bank and Summit National Bank; Previously Audit Manager with PricewaterhouseCoopers J. Dale Hall Executive Vice President - Chief Banking Officer 64 43 SVP / Commercial Market Executive at Bank of America Joseph W. Amy Executive Vice President - Chief Credit Officer 63 39 Credit positions at Mellon and U.S. Bank Richard A. Arthur Executive Vice President - Retail Banking 40 17 SVP at Bank of America Susan A. Bagwell Executive Vice President - Human Resources 49 28 VP Human Resources at First Federal Robert L. Davis Executive Vice President - Corporate Counsel 59 31 Managing Director and General Counsel at Provident Bankshares Corporation / Provident Bank Michael N. Helmus Executive Vice President - Risk Management 47 18 Audit Manager at U.S. Bank; SVP / CRO at Provident Bank John N. Golding Executive Vice President - Commercial Banking 45 23 SVP at Wachovia / Wells Fargo Kellee S. McGahey Executive Vice President - Marketing 33 3 Assistant Director at College of Charleston / Lowcountry Graduate Center Eartha C. Morris Executive Vice President - Support Services 55 35 EVP / COO at Congressional Bank EVP / Head of Bank Operations at PNC Bank (formerly Riggs National Bank) Timothy B. Sease Executive Vice President - Wealth Management 47 26 President of Home Financial Services; Director of Retail Banking and VP Deposit Services at Home Federal Savings Bank of SC Daniel S. Vroon Executive Vice President - Wealth Management 45 16 SVP at Bank of America

7 FINANCIAL REVIEW
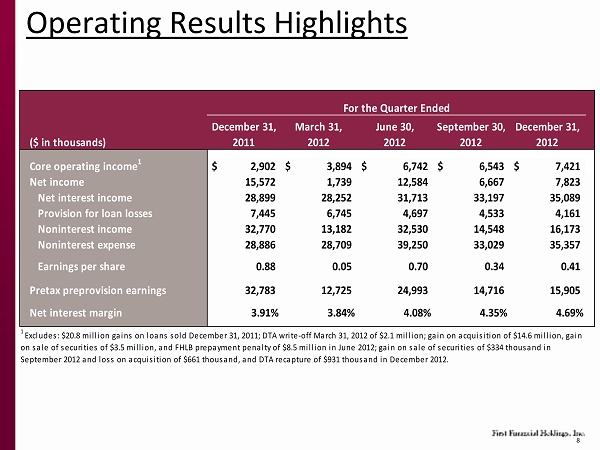
8 Operating Results Highlights December 31, March 31, June 30, September 30, December 31, 2011 2012 2012 2012 2012 Core operating income 1 $ 2,902 $ 3,894 $ 6,742 $ 6,543 $ 7,421 Net income 15,572 1,739 12,584 6,667 7,823 Net interest income 28,899 28,252 31,713 33,197 35,089 Provision for loan losses 7,445 6,745 4,697 4,533 4,161 Noninterest income 32,770 13,182 32,530 14,548 16,173 Noninterest expense 28,886 28,709 39,250 33,029 35,357 Earnings per share 0.88 0.05 0.70 0.34 0.41 Pretax preprovision earnings 32,783 12,725 24,993 14,716 15,905 Net interest margin 3.91% 3.84% 4.08% 4.35% 4.69% ($ in thousands) For the Quarter Ended 1 Excludes: $20.8 million gains on loans sold December 31, 2011; DTA write-off March 31, 2012 of $2.1 million; gain on acquisition of $14.6 million, gain on sale of securities of $3.5 million, and FHLB prepayment penalty of $8.5 million in June 2012; gain on sale of securities of $334 thousand in September 2012 and loss on acquisition of $661 thousand, and DTA recapture of $931 thousand in December 2012.
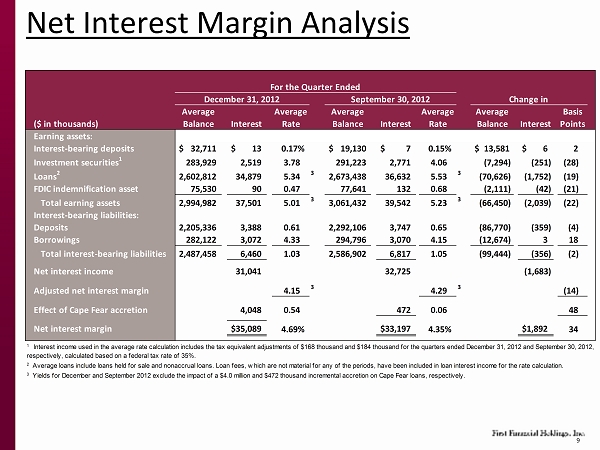
9 Net Interest Margin Analysis ($ in thousands) Average Balance Interest Average Rate Average Balance Interest Average Rate Average Balance Interest Basis Points Earning assets: Interest-bearing deposits $ 32,711 $ 13 0.17% $ 19,130 $ 7 0.15% $ 13,581 $ 6 2 Investment securities 1 283,929 2,519 3.78 291,223 2,771 4.06 (7,294) (251) (28) Loans 2 2,602,812 34,879 5.34 3 2,673,438 36,632 5.53 3 (70,626) (1,752) (19) FDIC indemnification asset 75,530 90 0.47 77,641 132 0.68 (2,111) (42) (21) Total earning assets 2,994,982 37,501 5.01 3 3,061,432 39,542 5.23 3 (66,450) (2,039) (22) Interest-bearing liabilities: Deposits 2,205,336 3,388 0.61 2,292,106 3,747 0.65 (86,770) (359) (4) Borrowings 282,122 3,072 4.33 294,796 3,070 4.15 (12,674) 3 18 Total interest-bearing liabilities 2,487,458 6,460 1.03 2,586,902 6,817 1.05 (99,444) (356) (2) Net interest income 31,041 32,725 (1,683) Adjusted net interest margin 4.15 3 4.29 3 (14) Effect of Cape Fear accretion 4,048 0.54 472 0.06 48 Net interest margin $35,089 4.69% $33,197 4.35% $1,892 34 3 Yields for December and September 2012 exclude the impact of a $4.0 million and $472 thousand incremental accretion on Cape Fear loans, respectively. For the Quarter Ended 2 Average loans include loans held for sale and nonaccrual loans. Loan fees, which are not material for any of the periods, have been included in loan interest income for the rate calculation. September 30, 2012December 31, 2012 Change in 1 Interest income used in the average rate calculation includes the tax equivalent adjustments of $168 thousand and $184 thousand for the quarters ended December 31, 2012 and September 30, 2012, respectively, calculated based on a federal tax rate of 35%.
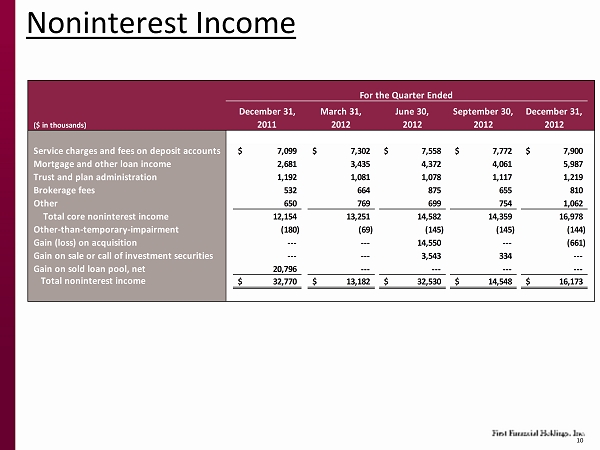
10 Noninterest Income December 31, March 31, June 30, September 30, December 31, 2011 2012 2012 2012 2012 Service charges and fees on deposit accounts 7,099$ 7,302$ 7,558$ 7,772$ 7,900$ Mortgage and other loan income 2,681 3,435 4,372 4,061 5,987 Trust and plan administration 1,192 1,081 1,078 1,117 1,219 Brokerage fees 532 664 875 655 810 Other 650 769 699 754 1,062 Total core noninterest income 12,154 13,251 14,582 14,359 16,978 Other-than-temporary-impairment (180) (69) (145) (145) (144) Gain (loss) on acquisition --- --- 14,550 --- (661) Gain on sale or call of investment securities --- --- 3,543 334 --- Gain on sold loan pool, net 20,796 --- --- --- --- Total noninterest income 32,770$ 13,182$ 32,530$ 14,548$ 16,173$ ($ in thousands) For the Quarter Ended
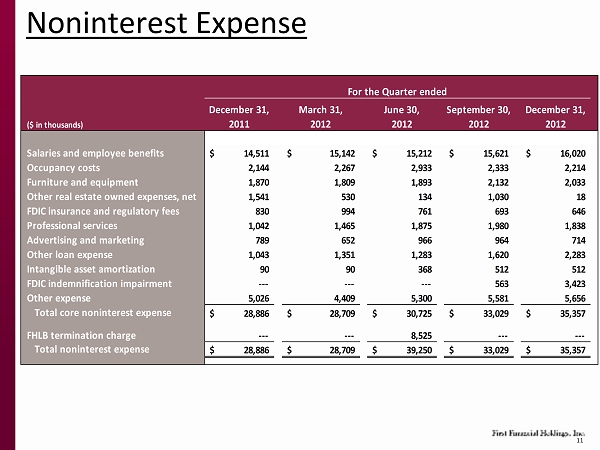
11 Noninterest Expense December 31, March 31, June 30, September 30, December 31, 2011 2012 2012 2012 2012 Salaries and employee benefits 14,511$ 15,142$ 15,212$ 15,621$ 16,020$ Occupancy costs 2,144 2,267 2,933 2,333 2,214 Furniture and equipment 1,870 1,809 1,893 2,132 2,033 Other real estate owned expenses, net 1,541 530 134 1,030 18 FDIC insurance and regulatory fees 830 994 761 693 646 Professional services 1,042 1,465 1,875 1,980 1,838 Advertising and marketing 789 652 966 964 714 Other loan expense 1,043 1,351 1,283 1,620 2,283 Intangible asset amortization 90 90 368 512 512 FDIC indemnification impairment --- --- --- 563 3,423 Other expense 5,026 4,409 5,300 5,581 5,656 Total core noninterest expense 28,886$ 28,709$ 30,725$ 33,029$ 35,357$ FHLB termination charge --- --- 8,525 --- --- Total noninterest expense 28,886$ 28,709$ 39,250$ 33,029$ 35,357$ ($ in thousands) For the Quarter ended
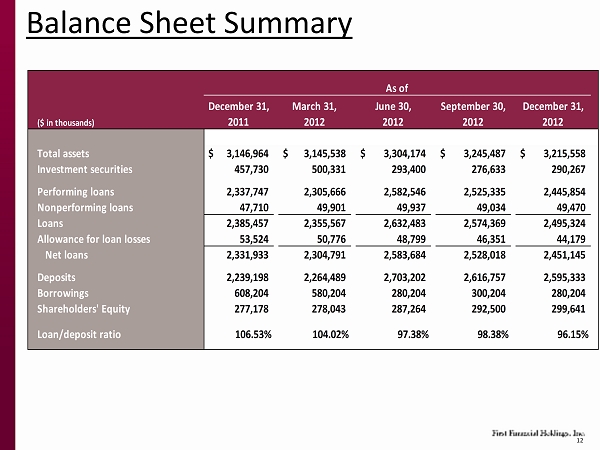
12 Balance Sheet Summary December 31, March 31, June 30, September 30, December 31, 2011 2012 2012 2012 2012 Total assets $ 3,146,964 $ 3,145,538 $ 3,304,174 $ 3,245,487 $ 3,215,558 Investment securities 457,730 500,331 293,400 276,633 290,267 Performing loans 2,337,747 2,305,666 2,582,546 2,525,335 2,445,854 Nonperforming loans 47,710 49,901 49,937 49,034 49,470 Loans 2,385,457 2,355,567 2,632,483 2,574,369 2,495,324 Allowance for loan losses 53,524 50,776 48,799 46,351 44,179 Net loans 2,331,933 2,304,791 2,583,684 2,528,018 2,451,145 Deposits 2,239,198 2,264,489 2,703,202 2,616,757 2,595,333 Borrowings 608,204 580,204 280,204 300,204 280,204 Shareholders' Equity 277,178 278,043 287,264 292,500 299,641 Loan/deposit ratio 106.53% 104.02% 97.38% 98.38% 96.15% ($ in thousands) As of
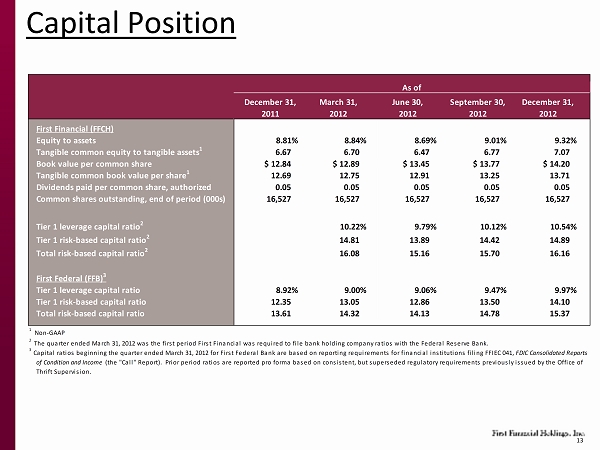
13 Capital Position December 31, March 31, June 30, September 30, December 31, 2011 2012 2012 2012 2012 First Financial (FFCH) Equity to assets 8.81% 8.84% 8.69% 9.01% 9.32% 6.67 6.70 6.47 6.77 7.07 $ 12.84 $ 12.89 $ 13.45 $ 13.77 $ 14.20 12.69 12.75 12.91 13.25 13.71 0.05 0.05 0.05 0.05 0.05 Common shares outstanding, end of period (000s) 16,527 16,527 16,527 16,527 16,527 Tier 1 leverage capital ratio 2 10.22% 9.79% 10.12% 10.54% Tier 1 risk-based capital ratio 2 14.81 13.89 14.42 14.89 Total risk-based capital ratio 2 16.08 15.16 15.70 16.16 First Federal (FFB) 3 Tier 1 leverage capital ratio 8.92% 9.00% 9.06% 9.47% 9.97% Tier 1 risk-based capital ratio 12.35 13.05 12.86 13.50 14.10 Total risk-based capital ratio 13.61 14.32 14.13 14.78 15.37 of Condition and Income (the "Call" Report). Prior period ratios are reported pro forma based on consistent, but superseded regulatory requirements previously issued by the Office of Thrift Supervision. 3 Capital ratios beginning the quarter ended March 31, 2012 for First Federal Bank are based on reporting requirements for financial institutions filing FFIEC 041, FDIC Consolidated Reports 1 Non-GAAP 2 The quarter ended March 31, 2012 was the first period First Financial was required to file bank holding company ratios with the Federal Reserve Bank. As of Book value per common share Tangible common book value per share 1 Dividends paid per common share, authorized Tangible common equity to tangible assets 1
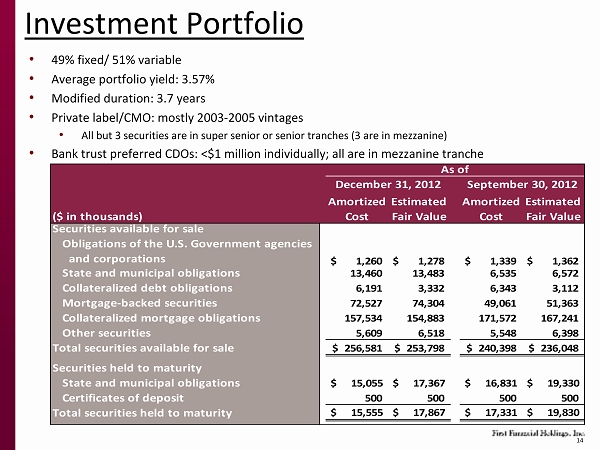
14 Investment Portfolio • 49% fixed/ 51% variable • Average portfolio yield: 3.57% • Modified duration: 3.7 years • Private label/CMO: mostly 2003-2005 vintages • All but 3 securities are in super senior or senior tranches (3 are in mezzanine) • Bank trust preferred CDOs: <$1 million individually; all are in mezzanine tranche ($ in thousands) Amortized Cost Estimated Fair Value Amortized Cost Estimated Fair Value Securities available for sale Obligations of the U.S. Government agencies and corporations $ 1,260 $ 1,278 $ 1,339 $ 1,362 State and municipal obligations 13,460 13,483 6,535 6,572 Collateralized debt obligations 6,191 3,332 6,343 3,112 Mortgage-backed securities 72,527 74,304 49,061 51,363 Collateralized mortgage obligations 157,534 154,883 171,572 167,241 Other securities 5,609 6,518 5,548 6,398 Total securities available for sale 256,581$ 253,798$ 240,398$ 236,048$ Securities held to maturity State and municipal obligations $ 15,055 $ 17,367 $ 16,831 $ 19,330 Certificates of deposit 500 500 500 500 Total securities held to maturity $ 15,555 $ 17,867 $ 17,331 $ 19,830 As of September 30, 2012December 31, 2012
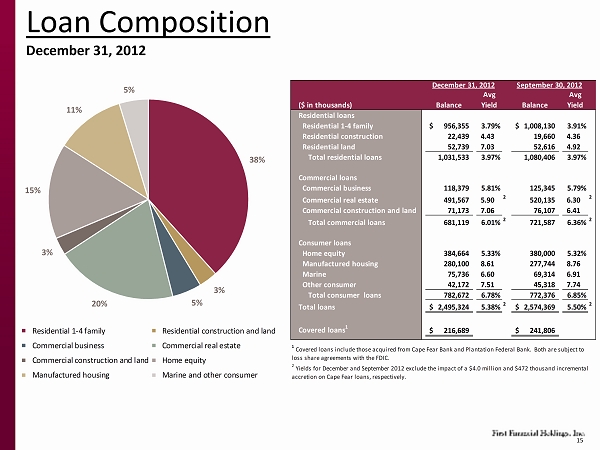
15 Loan Composition December 31, 2012 38% 3% 5% 20% 3% 15% 11% 5% Residential 1-4 family Residential construction and land Commercial business Commercial real estate Commercial construction and land Home equity Manufactured housing Marine and other consumer ($ in thousands) Balance Avg Yield Balance Avg Yield Residential loans Residential 1-4 family 956,355$ 3.79% 1,008,130$ 3.91% Residential construction 22,439 4.43 19,660 4.36 Residential land 52,739 7.03 52,616 4.92 Total residential loans 1,031,533 3.97% 1,080,406 3.97% Commercial loans Commercial business 118,379 5.81% 125,345 5.79% Commercial real estate 491,567 5.90 2 520,135 6.30 2 Commercial construction and land 71,173 7.06 76,107 6.41 Total commercial loans 681,119 6.01% 2 721,587 6.36% 2 Consumer loans Home equity 384,664 5.33% 380,000 5.32% Manufactured housing 280,100 8.61 277,744 8.76 Marine 75,736 6.60 69,314 6.91 Other consumer 42,172 7.51 45,318 7.74 Total consumer loans 782,672 6.78% 772,376 6.85% Total loans 2,495,324$ 5.38% 2 2,574,369$ 5.50% 2 Covered loans 1 216,689$ 241,806$ 1 Covered loans include those acquired from Cape Fear Bank and Plantation Federal Bank. Both are subject to loss share agreements with the FDIC. December 31, 2012 September 30, 2012 2 Yields for December and September 2012 exclude the impact of a $4.0 million and $472 thousand incremental accretion on Cape Fear loans, respectively.
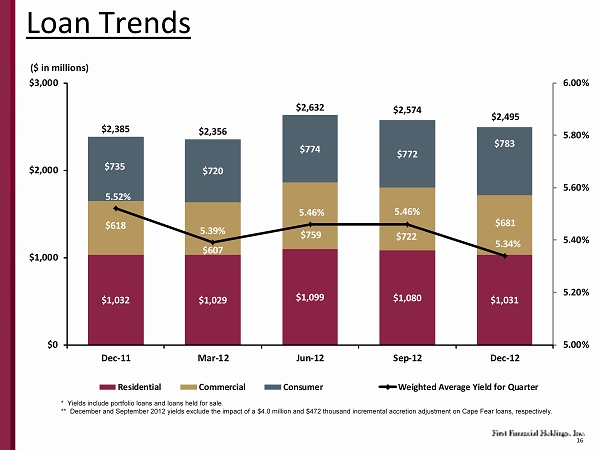
16 Loan Trends $1,032 $1,029 $1,099 $1,080 $1,031 $618 $607 $759 $722 $681 $735 $720 $774 $772 $783 $2,385 $2,356 $2,632 $2,574 $2,495 5.52% 5.39% 5.46% 5.46% 5.34% 5.00% 5.20% 5.40% 5.60% 5.80% 6.00% $0 $1,000 $2,000 $3,000 Dec-11 Mar-12 Jun-12 Sep-12 Dec-12 ($ in millions) Residential Commercial Consumer Weighted Average Yield for Quarter * Yields include portfolio loans and loans held for sale. ** December and September 2012 yields exclude the impact of a $4.0 million and $472 thousand incremental accretion adjustment on Cape Fear loans, respectively.
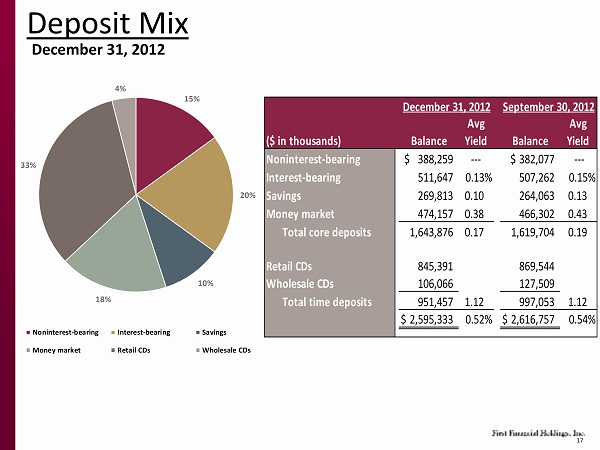
17 Deposit Mix December 31, 2012 15% 20% 10% 18% 33% 4% Noninterest-bearing Interest-bearing Savings Money market Retail CDs Wholesale CDs ($ in thousands) Balance Avg Yield Balance Avg Yield Noninterest-bearing 388,259$ --- $382,077 --- Interest-bearing 511,647 0.13% 507,262 0.15% Savings 269,813 0.10 264,063 0.13 Money market 474,157 0.38 466,302 0.43 Total core deposits 1,643,876 0.17 1,619,704 0.19 Retail CDs 845,391 869,544 Wholesale CDs 106,066 127,509 Total time deposits 951,457 1.12 997,053 1.12 $2,595,333 0.52% $2,616,757 0.54% December 31, 2012 September 30, 2012
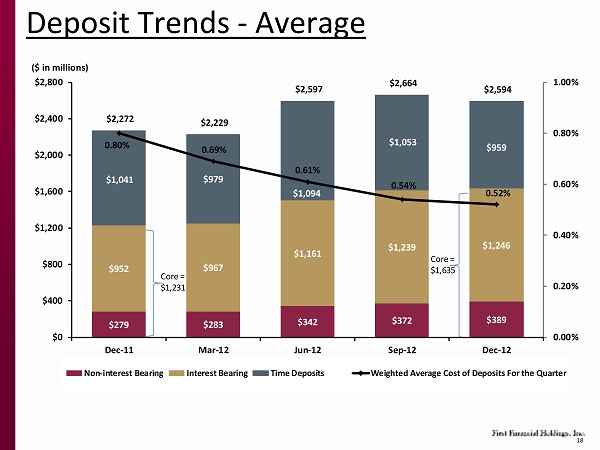
18 Deposit Trends -Average $279 $283 $342 $372 $389 $952 $967 $1,161 $1,239 $1,246 $1,041 $979 $1,094 $1,053 $959 $2,272 $2,229 $2,597 $2,664 $2,594 0.80% 0.69% 0.61% 0.54% 0.52% 0.00% 0.20% 0.40% 0.60% 0.80% 1.00% $0 $400 $800 $1,200 $1,600 $2,000 $2,400 $2,800 Dec-11 Mar-12 Jun-12 Sep-12 Dec-12 ($ in millions) Non-interest Bearing Interest Bearing Time Deposits Weighted Average Cost of Deposits For the Quarter Core = $1,231 Core = $1,635

19 Credit Quality
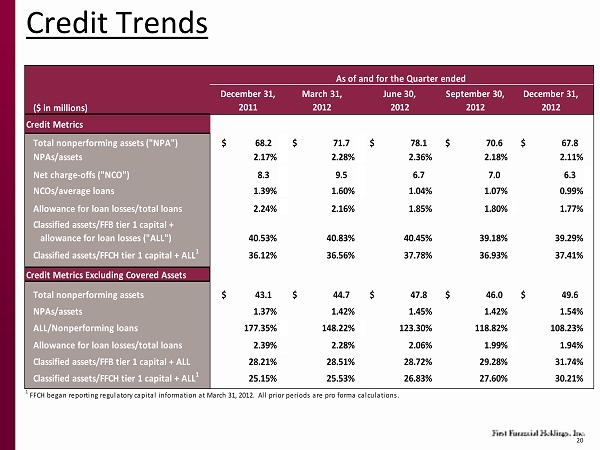
20 Credit Trends ($ in millions) December 31, 2011 March 31, 2012 June 30, 2012 September 30, 2012 December 31, 2012 Total nonperforming assets ("NPA") 68.2 $ 71.7 $ 78.1 $ 70.6 $ 67.8 $ NPAs/assets 2.17% 2.28% 2.36% 2.18% 2.11% Net charge-offs ("NCO") 8.3 9.5 6.7 7.0 6.3 NCOs/average loans 1.39% 1.60% 1.04% 1.07% 0.99% Allowance for loan losses/total loans 2.24% 2.16% 1.85% 1.80% 1.77% Classified assets/FFB tier 1 capital + allowance for loan losses ("ALL") 40.53% 40.83% 40.45% 39.18% 39.29% Classified assets/FFCH tier 1 capital + ALL 1 36.12% 36.56% 37.78% 36.93% 37.41% Credit Metrics Excluding Covered Assets Total nonperforming assets 43.1 $ 44.7 $ 47.8 $ 46.0 $ 49.6 $ NPAs/assets 1.37% 1.42% 1.45% 1.42% 1.54% ALL/Nonperforming loans 177.35% 148.22% 123.30% 118.82% 108.23% Allowance for loan losses/total loans 2.39% 2.28% 2.06% 1.99% 1.94% Classified assets/FFB tier 1 capital + ALL 28.21% 28.51% 28.72% 29.28% 31.74% Classified assets/FFCH tier 1 capital + ALL 1 25.15% 25.53% 26.83% 27.60% 30.21% As of and for the Quarter ended 1 FFCH began reporting regulatory capital information at March 31, 2012. All prior periods are pro forma calculations. Credit Metrics
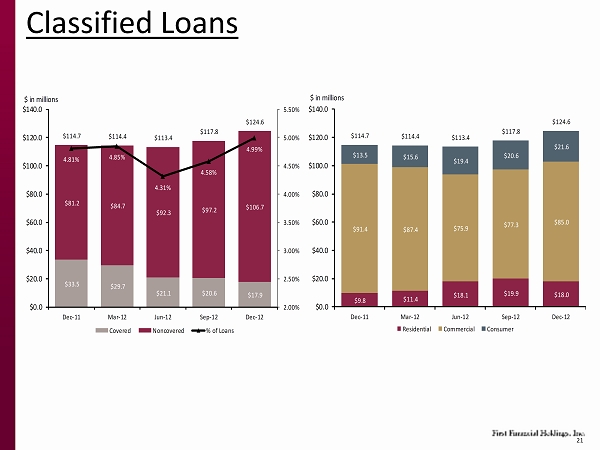
21 Classified Loans $9.8 $11.4 $18.1 $19.9 $18.0 $91.4 $87.4 $75.9 $77.3 $85.0 $13.5 $15.6 $19.4 $20.6 $21.6 $114.7 $114.4 $113.4 $117.8 $124.6 $0.0 $20.0 $40.0 $60.0 $80.0 $100.0 $120.0 $140.0 Dec-11 Mar-12 Jun-12 Sep-12 Dec-12 $ in millions Residential Commercial Consumer $33.5 $29.7 $21.1 $20.6 $17.9 $81.2 $84.7 $92.3 $97.2 $106.7 $114.7 $114.4 $113.4 $117.8 $124.6 4.81% 4.85% 4.31% 4.58% 4.99% 2.00% 2.50% 3.00% 3.50% 4.00% 4.50% 5.00% 5.50% $0.0 $20.0 $40.0 $60.0 $80.0 $100.0 $120.0 $140.0 Dec-11 Mar-12 Jun-12 Sep-12 Dec-12 $ in millions Covered Noncovered % of Loans
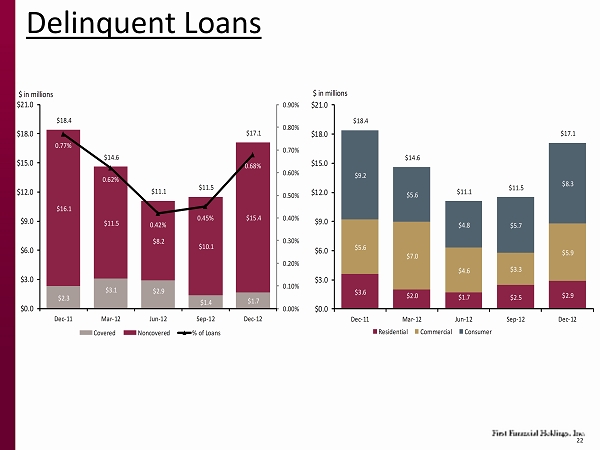
22 Delinquent Loans $3.6 $2.0 $1.7 $2.5 $2.9 $5.6 $7.0 $4.6 $3.3 $5.9 $9.2 $5.6 $4.8 $5.7 $8.3 $18.4 $14.6 $11.1 $11.5 $17.1 $0.0 $3.0 $6.0 $9.0 $12.0 $15.0 $18.0 $21.0 Dec-11 Mar-12 Jun-12 Sep-12 Dec-12 Thousands $ in millions Residential Commercial Consumer $2.3 $3.1 $2.9 $1.4 $1.7 $16.1 $11.5 $8.2 $10.1 $15.4 $18.4 $14.6 $11.1 $11.5 $17.1 0.77% 0.62% 0.42% 0.45% 0.68% 0.00% 0.10% 0.20% 0.30% 0.40% 0.50% 0.60% 0.70% 0.80% 0.90% $0.0 $3.0 $6.0 $9.0 $12.0 $15.0 $18.0 $21.0 Dec-11 Mar-12 Jun-12 Sep-12 Dec-12 Thousands $ in millions Covered Noncovered % of Loans
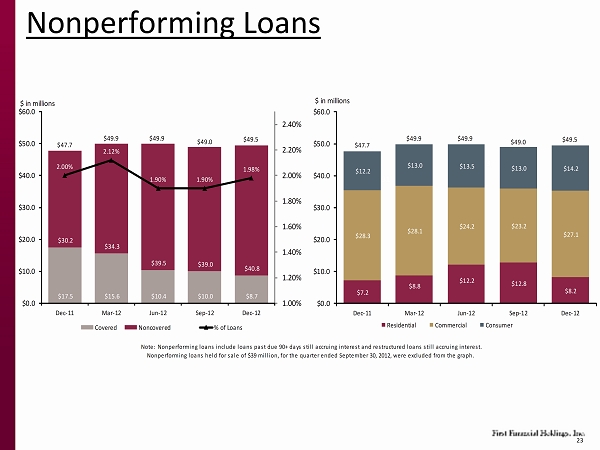
23 $143 $131 7 Nonperforming Loans Note: Nonperforming loans include loans past due 90+ days still accruing interest and restructured loans still accruing interest. Nonperforming loans held for sale of $39 million, for the quarter ended September 30, 2012, were excluded from the graph. $7.2 $8.8 $12.2 $12.8 $8.2 $28.3 $28.1 $24.2 $23.2 $27.1 $12.2 $13.0 $13.5 $13.0 $14.2 $47.7 $49.9 $49.9 $49.0 $49.5 $0.0 $10.0 $20.0 $30.0 $40.0 $50.0 $60.0 Dec-11 Mar-12 Jun-12 Sep-12 Dec-12 $ in millions Residential Commercial Consumer $17.5 $15.6 $10.4 $10.0 $8.7 $30.2 $34.3 $39.5 $39.0 $40.8 $47.7 $49.9 $49.9 $49.0 $49.5 2.00% 2.12% 1.90% 1.90% 1.98% 1.00% 1.20% 1.40% 1.60% 1.80% 2.00% 2.20% 2.40% $0.0 $10.0 $20.0 $30.0 $40.0 $50.0 $60.0 Dec-11 Mar-12 Jun-12 Sep-12 Dec-12 $ in millions Covered Noncovered % of Loans
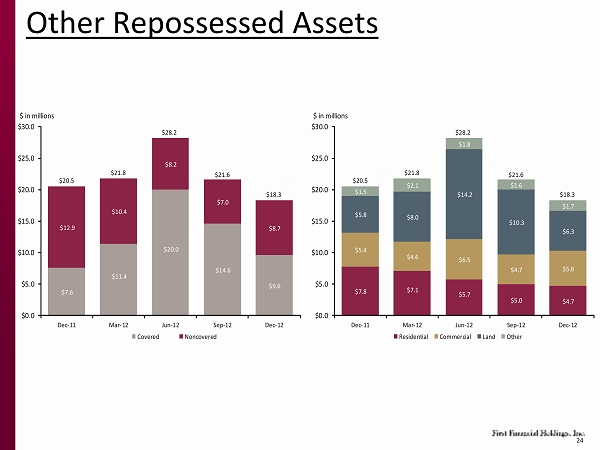
24 $143 $128 $123 $131 7 Other Repossessed Assets $7.8 $7.1 $5.7 $5.0 $4.7 $5.4 $4.6 $6.5 $4.7 $5.6 $5.8 $8.0 $14.2 $10.3 $6.3 $1.5 $2.1 $1.8 $1.6 $1.7 $20.5 $21.8 $28.2 $21.6 $18.3 $0.0 $5.0 $10.0 $15.0 $20.0 $25.0 $30.0 Dec-11 Mar-12 Jun-12 Sep-12 Dec-12 $ in millions Residential Commercial Land Other $7.6 $11.4 $20.0 $14.6 $9.6 $12.9 $10.4 $8.2 $7.0 $8.7 $20.5 $21.8 $28.2 $21.6 $18.3 $0.0 $5.0 $10.0 $15.0 $20.0 $25.0 $30.0 Dec-11 Mar-12 Jun-12 Sep-12 Dec-12 $ in millions Covered Noncovered
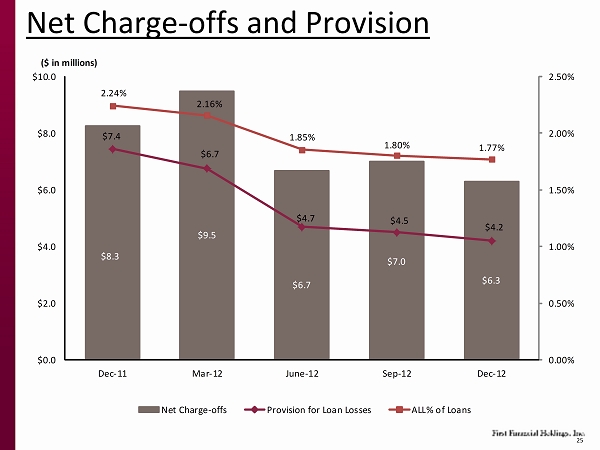
25 Net Charge-offs and Provision $8.3 $9.5 $6.7 $7.0 $6.3 $7.4 $6.7 $4.7 $4.5 $4.2 2.24% 2.16% 1.85% 1.80% 1.77% 0.00% 0.50% 1.00% 1.50% 2.00% 2.50% $0.0 $2.0 $4.0 $6.0 $8.0 $10.0 Dec-11 Mar-12 June-12 Sep-12 Dec-12 ($ in millions) Net Charge-offs Provision for Loan Losses ALL% of Loans

26 APPENDIX
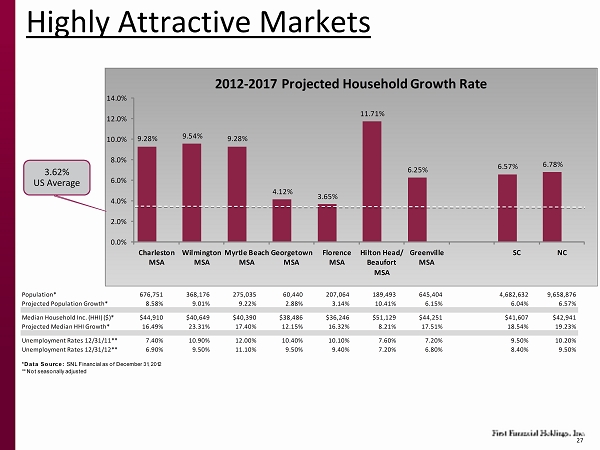
27 Population* 676,751 368,176 275,035 60,440 207,064 189,493 645,404 4,682,632 9,658,876 Projected Population Growth* 8.58% 9.01% 9.22% 2.88% 3.14% 10.41% 6.15% 6.04% 6.57% Median Household Inc. (HHI) ($)* $44,910 $40,649 $40,390 $38,486 $36,246 $51,129 $44,251 $41,607 $42,941 Projected Median HHI Growth* 16.49% 23.31% 17.40% 12.15% 16.32% 8.21% 17.51% 18.54% 19.23% Unemployment Rates 12/31/11** 7.40% 10.90% 12.00% 10.40% 10.10% 7.60% 7.20% 9.50% 10.20% Unemployment Rates 12/31/12** 6.90% 9.50% 11.10% 9.50% 9.40% 7.20% 6.80% 8.40% 9.50% *Data Source: SNL Financial as of December 31, 2012 ** Not seasonally adjusted 9.28% 9.54% 9.28% 4.12% 3.65% 11.71% 6.25% 6.57% 6.78% 0.0% 2.0% 4.0% 6.0% 8.0% 10.0% 12.0% 14.0% Charleston MSA Wilmington MSA Myrtle Beach MSA Georgetown MSA Florence MSA Hilton Head/ Beaufort MSA Greenville MSA SC NC 2012 - 2017 Projected Household Growth Rate 3.62% US Average Highly Attractive Markets
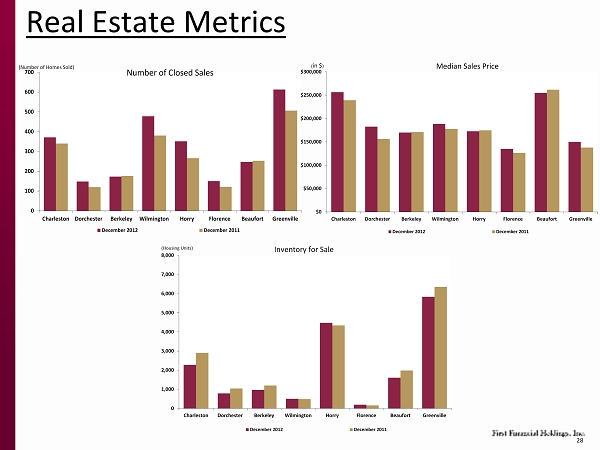
28 Real Estate Metrics 0 100 200 300 400 500 600 700 Charleston Dorchester Berkeley Wilmington Horry Florence Beaufort Greenville December 2012 December 2011 Number of Closed Sales (Number of Homes Sold) $0 $50,000 $100,000 $150,000 $200,000 $250,000 $300,000 Charleston Dorchester Berkeley Wilmington Horry Florence Beaufort Greenville December 2012 December 2011 Median Sales Price ( in $ ) 0 1,000 2,000 3,000 4,000 5,000 6,000 7,000 8,000 Charleston Dorchester Berkeley Wilmington Horry Florence Beaufort Greenville December 2012 December 2011 Inventory for Sale (Housing Units)
29 • Aerospace/Aviation – Boeing plant completed and Dreamliner production in process • First 787 rolled off the assembly line in April 2012; first delivery in October 2012 • Anticipate 3,800 direct jobs; opportunity to double with suppliers – In excess of $66 million in investment and over 700 jobs in the aerospace-related sector announced for SC in 2011 – TIGHITCO, an industry leader in the design, fabrication and repair of engineered components and integrated systems for aerospace, locating a new $30 million manufacturing facility in Charleston, creating 350 jobs in 2012 • Alternative Energy – Clemson University Restoration Institute (CURI), created a 97-acre campus in Charleston for experts and researchers in design, planning and constructionto advance global restoration methods and technologies – World’s largest, and one of only three, wind turbine drivetrain test facility; fully operational by end of 2012, offering simultaneous testing of 7.5and 15 megawatt power train components – Potential for 20,000 jobs statewide with manufacturing contract Economic Highlights Charleston Market Targeted Industries
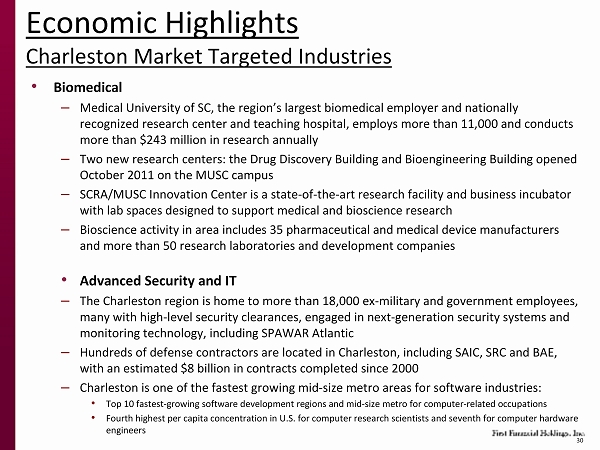
30 • Biomedical – Medical University of SC, the region’s largest biomedical employer and nationally recognized research center and teaching hospital, employs more than 11,000 and conducts more than $243 million in research annually – Two new research centers: the Drug Discovery Building and Bioengineering Building opened October 2011 on the MUSC campus – SCRA/MUSC Innovation Center is a state-of-the-art research facility and business incubator with lab spaces designed to support medical and bioscience research – Bioscience activity in area includes 35 pharmaceutical and medical device manufacturers and more than 50 research laboratories and development companies • Advanced Security and IT – The Charleston region is home to more than 18,000 ex-military and government employees, many with high-level security clearances, engaged in next-generation security systems and monitoring technology, including SPAWAR Atlantic – Hundreds of defense contractors are located in Charleston, including SAIC, SRC and BAE, with an estimated $8 billion in contracts completed since 2000 – Charleston is one of the fastest growing mid-size metro areas for software industries: • Top 10 fastest-growing software development regions and mid-size metro for computer-related occupations • Fourth highest per capita concentration in U.S. for computer research scientists and seventh for computer hardware engineers Economic Highlights Charleston Market Targeted Industries
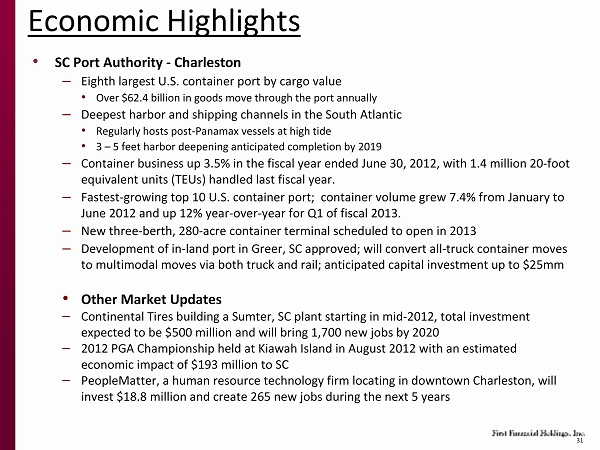
31 • SC Port Authority -Charleston – Eighth largest U.S. container port by cargo value • Over $62.4 billion in goods move through the port annually – Deepest harbor and shipping channels in the South Atlantic • Regularly hosts post-Panamax vessels at high tide • 3 –5 feet harbor deepening anticipated completion by 2019 – Container business up 3.5% in the fiscal year ended June 30, 2012, with 1.4 million 20-foot equivalent units (TEUs) handled last fiscal year. – Fastest-growing top 10 U.S. container port; container volume grew 7.4% from January to June 2012 and up 12% year-over-year for Q1 of fiscal 2013. – New three-berth, 280-acre container terminal scheduled to open in 2013 – Development of in-land port in Greer, SC approved; will convert all-truck container moves to multimodal moves via both truck and rail; anticipated capitalinvestment up to $25mm • Other Market Updates – Continental Tires building a Sumter, SC plant starting in mid-2012, total investment expected to be $500 million and will bring 1,700 new jobs by 2020 – 2012 PGA Championship held at Kiawah Island in August 2012 with an estimated economic impact of $193 million to SC – PeopleMatter, a human resource technology firm locating in downtown Charleston, will invest $18.8 million and create 265 new jobs during the next 5 years Economic Highlights
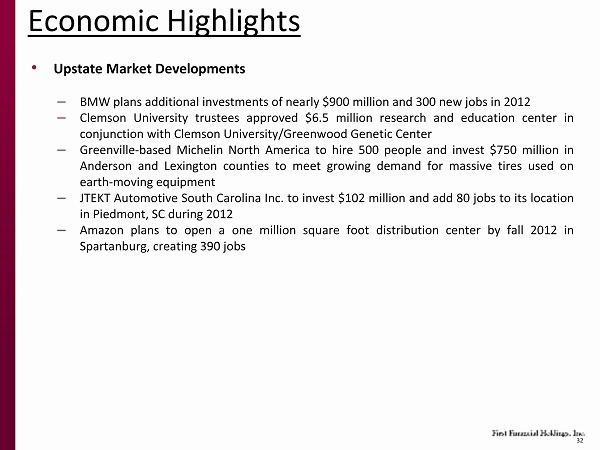
32 • Upstate Market Developments – BMW plans additional investments of nearly $900 million and 300 new jobs in 2012 – Clemson University trustees approved $6.5 million research and e ducation center in conjunction with Clemson University/Greenwood Genetic Center – Greenville-based Michelin North America to hire 500 people and invest $750 million in Anderson and Lexington counties to meet growing demand for massi ve tires used on earth-moving equipment – JTEKT Automotive South Carolina Inc. to invest $102 million and add 80 jobs to its location in Piedmont, SC during 2012 – Amazon plans to open a one million square foot distribution cent er by fall 2012 in Spartanburg, creating 390 jobs Economic Highlights

33 Residential Mortgage Loans 93% 7% Residential Mortgage Loan Portfolio As of December 31, 2012 Residential 1-4 family Residential construction and land $- $500 $1,000 $1,500 $2,000 $2,500 $3,000 $3,500 Dec-11 Mar-12 Jun-12 Sep-12 Dec-12 Delinquent Loans Residential 1-4 family Residential construction and land ($ in thousands) $- $2,000 $4,000 $6,000 $8,000 $10,000 $12,000 Dec-11 Mar-12 Jun-12 Sep-12 Dec-12 Nonperforming Loans Residential 1-4 family Residential construction and land ($ in thousands) $- $500 $1,000 $1,500 $2,000 $2,500 $3,000 Dec-11 Mar-12 Jun-12 Sep-12 Dec-12 Net Charge - Offs Residential 1-4 family Residential construction and land ($ in thousands )
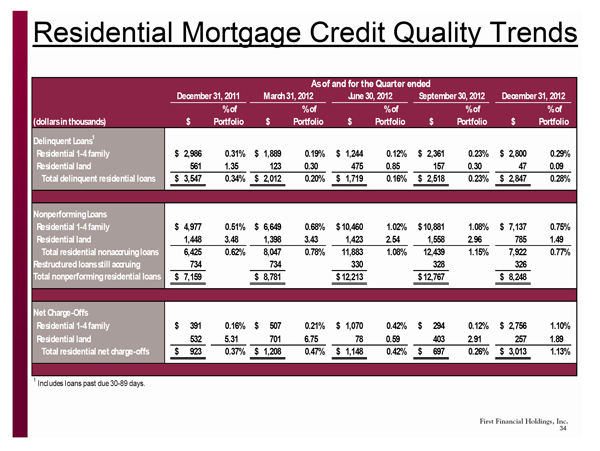
34 $22,685 Residential Mortgage Credit Quality Trends (dollars in thousands) $ % of Portfolio $ % of Portfolio $ % of Portfolio $ % of Portfolio $ % of Portfolio Delinquent Loans 1 Residential 1-4 family 2,986$ 0.31% 1,889$ 0.19% 1,244$ 0.12% 2,361$ 0.23% 2,800$ 0.29% Residential land 561 1.35 123 0.30 475 0.85 157 0.30 47 0.09 Total delinquent residential loans 3,547$ 0.34% 2,012$ 0.20% 1,719$ 0.16% 2,518$ 0.23% 2,847$ 0.28% Nonperforming Loans Residential 1-4 family 4,977$ 0.51% 6,649$ 0.68% 10,460$ 1.02% 10,881$ 1.08% 7,137$ 0.75% Residential land 1,448 3.48 1,398 3.43 1,423 2.54 1,558 2.96 785 1.49 Total residential nonaccruing loans 6,425 0.62% 8,047 0.78% 11,883 1.08% 12,439 1.15% 7,922 0.77% Restructured loans still accruing 734 734 330 328 326 Total nonperforming residential loans 7,159$ 8,781$ 12,213$ 12,767$ 8,248$ Net Charge-Offs Residential 1-4 family 391$ 0.16% 507$ 0.21% 1,070$ 0.42% 294$ 0.12% 2,756$ 1.10% Residential land 532 5.31 701 6.75 78 0.59 403 2.91 257 1.89 Total residential net charge-offs 923$ 0.37% 1,208$ 0.47% 1,148$ 0.42% 697$ 0.26% 3,013$ 1.13% 1 Includes loans past due 30-89 days. As of and for the Quarter ended June 30, 2012 September 30, 2012 December 31, 2012March 31, 2012December 31, 2011
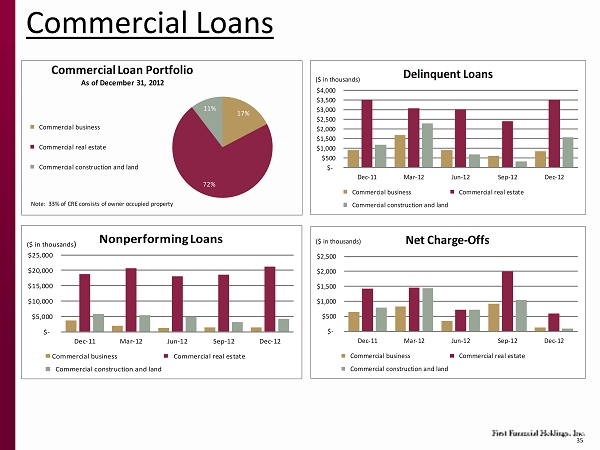
35 Commercial Loans 17% 72% 11% Commercial Loan Portfolio As of December 31, 2012 Commercial business Commercial real estate Commercial construction and land Note: 33% of CRE consists of owner occupied property $- $500 $1,000 $1,500 $2,000 $2,500 $3,000 $3,500 $4,000 Dec-11 Mar-12 Jun-12 Sep-12 Dec-12 Delinquent Loans Commercial business Commercial real estate Commercial construction and land ($ in thousands) $- $5,000 $10,000 $15,000 $20,000 $25,000 Dec-11 Mar-12 Jun-12 Sep-12 Dec-12 Nonperforming Loans Commercial business Commercial real estate Commercial construction and land ($ in thousands ) $- $500 $1,000 $1,500 $2,000 $2,500 Dec-11 Mar-12 Jun-12 Sep-12 Dec-12 Net Charge - Offs Commercial business Commercial real estate Commercial construction and land ($ in thousands)

36 $22,685 Commercial Credit Quality Trends (dollars in thousands) $ % of Portfolio $ % of Portfolio $ % of Portfolio $ % of Portfolio $ % of Portfolio Delinquent Loans 1 Commercial business 908$ 1.08% 1,677$ 1.90% 903$ 0.84% 582$ 0.46% 847$ 0.72% Commercial real estate 3,514 0.77 3,065 0.69 3,014 0.54 2,397 0.46 3,492 0.71 Commercial construction --- --- --- --- --- --- --- --- --- --- Commercial land 1,185 1.94 2,271 4.15 675 0.87 318 0.43 1,573 2.24 Total commercial delinquent loans 5,607$ 0.91% 7,013$ 1.16% 4,592$ 0.61% 3,297$ 0.46% 5,912$ 0.87% Nonperforming Loans Commercial business 3,666$ 4.37% 1,931$ 2.19% 1,198$ 1.11% 1,407$ 1.12% 1,460$ 1.23% Commercial real estate 17,127 3.76 18,474 4.13 15,918 2.87 15,853 3.05 18,386 3.74 Commercial construction 605 3.67 261 1.60 261 1.52 247 13.71 247 23.21 Commercial land 5,232 8.54 5,240 9.56 4,577 5.87 2,990 4.02 4,058 5.79 Total commercial nonaccrual loans 26,630 4.31% 25,906 4.27% 21,954 2.89% 20,497 2.84% 24,151 3.55% Restructured loans still accruing 1,677 2,228 2,214 2,700 2,899 Total commercial nonperforming 28,307$ 28,134$ 24,168$ 23,197$ 27,050$ Net Charge-Offs Commercial business 640$ 3.22% 825$ 3.60% 334$ 1.34% 924$ 3.22% 126$ 0.42% Commercial real estate 1,417 1.22 1,462 1.30 714 0.54 1,994 1.47 588 0.46 Commercial construction (3) (0.07) (2) (0.05) (2) (0.05) 11 0.56 (1) (0.41) Commercial land 804 4.94 1,439 9.87 723 4.00 1,037 5.43 89 0.48 Total net commercial charge-offs 2,858$ 1.83% 3,724$ 2.41% 1,769$ 0.99% 3,966$ 2.14% 802$ 0.46% 1 Includes loans past due 30-89 days. June 30, 2012March 31, 2012 December 31, 2012 As of and for the Quarter ended September 30, 2012December 31, 2011
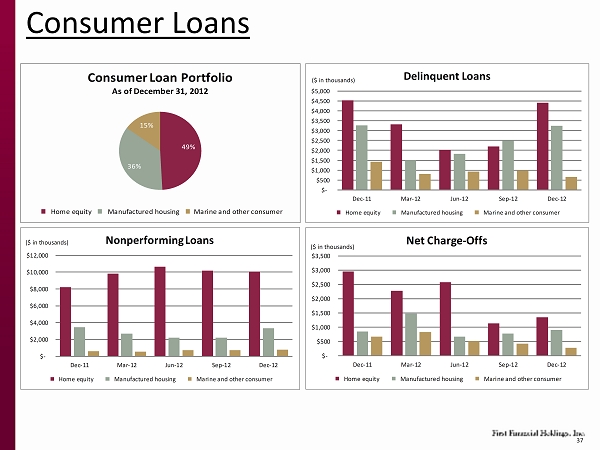
37 Consumer Loans 49% 36% 15% Consumer Loan Portfolio As of December 31, 2012 Home equity Manufactured housing Marine and other consumer $- $500 $1,000 $1,500 $2,000 $2,500 $3,000 $3,500 $4,000 $4,500 $5,000 Dec-11 Mar-12 Jun-12 Sep-12 Dec-12 Delinquent Loans Home equity Manufactured housing Marine and other consumer ($ in thousands) $- $2,000 $4,000 $6,000 $8,000 $10,000 $12,000 Dec-11 Mar-12 Jun-12 Sep-12 Dec-12 Nonperforming Loans Home equity Manufactured housing Marine and other consumer ($ in thousands) $- $500 $1,000 $1,500 $2,000 $2,500 $3,000 $3,500 Dec-11 Mar-12 Jun-12 Sep-12 Dec-12 Net Charge - Offs Home equity Manufactured housing Marine and other consumer ($ in thousands)

38 $22,685 Consumer Credit Quality Trends December 31, 2011 March 31, 2012 (dollars in thousands) $ % of Portfolio $ % of Portfolio $ % of Portfolio $ % of Portfolio $ % of Portfolio Delinquent Loans 1 Home equity 4,525 1.27% 3,315 0.95% 2,017 0.52% 2,204 0.58% 4,414 1.15% Manufactured housing 3,267 1.19 1,502 0.54 1,835 0.66 2,506 0.90 3,241 1.16 Marine 597 1.14 358 0.71 300 0.50 227 0.33 284 0.37 Other consumer 831 1.66 445 0.97 626 1.26 742 1.64 384 0.91 Total delinquent loans 9,220$ 1.25% 5,620$ 0.78% 4,778$ 0.62% 5,679$ 0.74% 8,323$ 1.06% Nonperforming Loans Home equity 8,192 2.29% 9,779 2.81% 10,636 2.74% 10,145 2.67% 10,049 2 2.61% Manufactured housing 3,461 1.26 2,648 0.96 2,197 0.79 2,221 0.80 3,355 1.20 Marine 246 0.47 63 0.12 29 0.05 90 0.13 139 0.18 Other consumer 224 0.45 131 0.29 306 0.62 228 0.50 275 0.65 Total consumer nonaccrual loans 12,123 1.65% 12,621 1.75% 13,168 1.70% 12,684 1.64% 13,818 1.77% Loans 90+ days still accruing 121 51 75 74 43 Restructured loans still accruing --- 314 313 312 311 Total consumer nonperforming loans 12,244$ 12,986$ 13,556$ 13,070$ 14,172$ Net Charge-Offs Home equity 2,955$ 3.26% 2,264$ 2.57% 2,580$ 2.71% 1,125$ 1.17% 1,343$ 1.44% Manufactured housing 845 1.23 1,467 2.13 666 0.97 778 1.12 899 1.29 Marine 142 1.05 361 2.83 82 0.60 146 0.88 (19) (0.11) Other consumer 531 4.09 469 3.90 428 3.48 269 2.22 295 2.51 Total consumer net charge-offs 4,473$ 2.41% 4,561$ 2.51% 3,756$ 1.98% 2,318$ 1.20% 2,518$ 1.31% 1 Includes loans past due 30-89 days. 2 Of the $10,049 of nonperforming home equity loans, $4,930 are in first position, $2,362 are in second position where First Federal owns or services the first and $2,757 are in second position where another bank holds the first June 30, 2012 December 31, 2012 As of and for the Quarter ended September 30, 2012
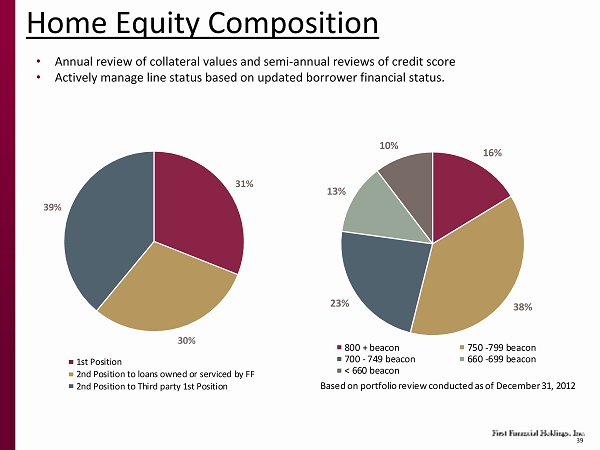
39 • Annual review of collateral values and semi-annual reviews of credit score • Actively manage line status based on updated borrower financial status. Home Equity Composition 31% 30% 39% 1st Position 2nd Position to loans owned or serviced by FF 2nd Position to Third party 1st Position 16% 38% 23% 13% 10% 800 + beacon 750 -799 beacon 700 - 749 beacon 660 -699 beacon < 660 beacon Based on portfolio review conducted as of December 31, 2012
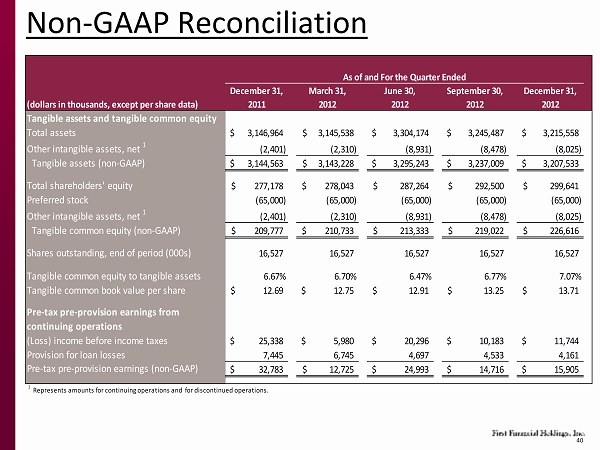
40 Non-GAAP Reconciliation (dollars in thousands, except per share data) December 31, 2011 March 31, 2012 June 30, 2012 September 30, 2012 December 31, 2012 Tangible assets and tangible common equity Total assets 3,146,964$ 3,145,538$ 3,304,174$ 3,245,487$ 3,215,558$ Other intangible assets, net 1 (2,401) (2,310) (8,931) (8,478) (8,025) Tangible assets (non-GAAP) 3,144,563$ 3,143,228$ 3,295,243$ 3,237,009$ 3,207,533$ Total shareholders' equity 277,178$ 278,043$ 287,264$ 292,500$ 299,641$ Preferred stock (65,000) (65,000) (65,000) (65,000) (65,000) Other intangible assets, net 1 (2,401) (2,310) (8,931) (8,478) (8,025) Tangible common equity (non-GAAP) 209,777$ 210,733$ 213,333$ 219,022$ 226,616$ Shares outstanding, end of period (000s) 16,527 16,527 16,527 16,527 16,527 Tangible common equity to tangible assets 6.67% 6.70% 6.47% 6.77% 7.07% Tangible common book value per share 12.69$ 12.75$ 12.91$ 13.25$ 13.71$ Pre-tax pre-provision earnings from continuing operations (Loss) income before income taxes 25,338$ 5,980$ 20,296$ 10,183$ 11,744$ Provision for loan losses 7,445 6,745 4,697 4,533 4,161 Pre-tax pre-provision earnings (non-GAAP) 32,783$ 12,725$ 24,993$ 14,716$ 15,905$ 1 Represents amounts for continuing operations and for discontinued operations. As of and For the Quarter Ended

First Financial Holdings, Inc. Nasdaq: FFCH www.firstfinancialholdings.com R. Wayne Hall Blaise B. Bettendorf President & CEO EVP & Chief Financial Officer whall@firstfederal.com bbettendorf@firstfederal.com 843.529.5907 843.529.5456