Exhibit 99.3

Link to searchable text of slide shown above
Link to searchable text of slide shown above
Link to searchable text of slide shown above
Link to searchable text of slide shown above
Link to searchable text of slide shown above

Link to searchable text of slide shown above
Link to searchable text of slide shown above
Link to searchable text of slide shown above
Link to searchable text of slide shown above
Link to searchable text of slide shown above
Link to searchable text of slide shown above
Link to searchable text of slide shown above
Link to searchable text of slide shown above

Link to searchable text of slide shown above
Link to searchable text of slide shown above
Link to searchable text of slide shown above
Link to searchable text of slide shown above
Link to searchable text of slide shown above

Link to searchable text of slide shown above
Link to searchable text of slide shown above
Link to searchable text of slide shown above
Searchable text section of graphics shown above
[LOGO]
Notice Regarding Forward Looking Statements
Certain statements contained in this discussion are “forward-looking statements” within the meaning of the Private Securities Litigation Reform Act of 1995. Matters discussed in this report which relate to events or developments that are expected to occur in the future, including management’s expectations, strategic objectives, business prospects, anticipated economic performance and financial condition and other similar matters constitute forward-looking statements. Forward-looking statements are based on management’s beliefs, assumptions and expectation of the Company’s future economic performance, taking into account the information currently available to management. These statements are not statements of historical fact. Such forward-looking statements are subject to risks and uncertainties and investors are cautioned that outcomes and results may vary materially from those projected due to various factors beyond the control of DPL Inc. or The Dayton Power and Light Company (“DPL”, “DP&L” or the “Company”), including but not limited to: abnormal or severe weather; unusual maintenance or repair requirements; changes in fuel costs, changes in electricity, coal, environmental emissions, gas and other commodity prices; increased competition; regulatory changes and decisions; changes in accounting rules; financial market condition; and general economic conditions. Forward-looking statements speak only as of the date of the document in which they are made. We disclaim any obligation or undertaking to provide any updates or revisions to any forward-looking statement to reflect any change in our expectations or any change in events, conditions or circumstances on which the forward-looking statement is based.
[LOGO]
[LOGO]
2004 Significant Events and Accomplishments
• New management team
• Reconstituted Board of Directors
• Filed long awaited SEC filings and resumed dividend payments
• Hired a new CFO
• Recorded expected utility results in 2004 notwithstanding increased cost pressures
• Completed a comprehensive review of the financial asset portfolio
[LOGO]
Solid Sales with a Good Customer Base
• Low cost power, low number of outages and rapid restoration times  insignificant customer attrition
• 700 MW of large “target” customers are under contract
• Electric Revenue
[CHART]
• 87% of revenue from regulated customer base
• 13% of revenue from “market” transactions”
• Sales Growth: 1.3% per year 2002-2004 (weather normalized)
• Residential is the driver
• For 2004: 1.4% organic growth; despite:
• Despite cooling degree days being 16% below normal
• 94% of total retail load is served from DP&L’s low cost coal units
Clarifications About
“Wholesale Sales” and “Purchased Power”
• “Wholesale Sales Revenue” down by 13% in ‘04 vs. ‘03
• Revenue from selling our “Excess” and “Purchase Power” for resale
• ‘04 scheduled maintenance periods were longer than past periods
• NOX allowance costs raised “Clearing Price” for mid-merit unit (Hutchings)
• “Purchased Power Costs” increased by $25 MIL in ‘04 vs. ‘03
• Primarily: PJM charges for ancillary services
• 65% of all purchased power was transacted for resale → margin motivated
• PJM settlement process blurs the distinction between retail and wholesale “contract” paths
• In future earnings releases, we will report “electric revenue” as a composite
Power Production
Maintaining a Sharp Focus
• Coal units performed at high availability
• For 2003: DPL units were 1.6% above industry average
• For 2004: Base load coal units increase another 1%
• Valuable resources for the larger PJM region
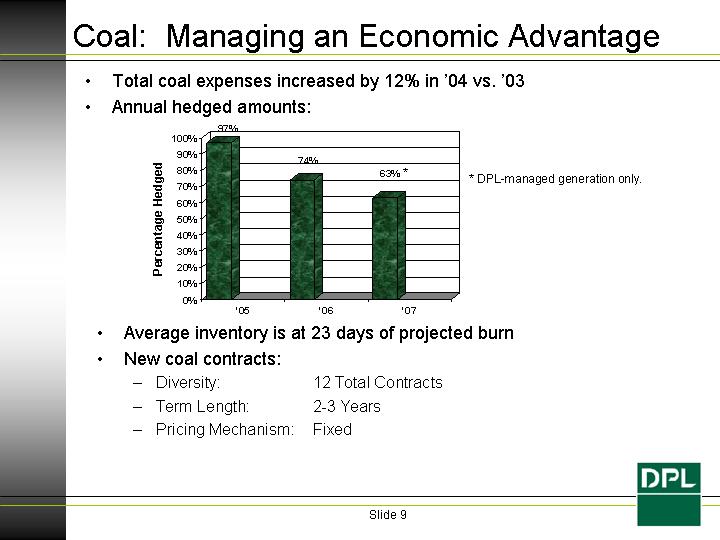
Coal: Managing an Economic Advantage
• Total coal expenses increased by 12% in ‘04 vs. ‘03
• Annual hedged amounts:
[CHART]
* DPL-managed generation only.
• Average inventory is at 23 days of projected burn
• New coal contracts:
• Diversity: | | 12 Total Contracts |
• Term Length: | | 2-3 Years |
• Pricing Mechanism: | | Fixed |
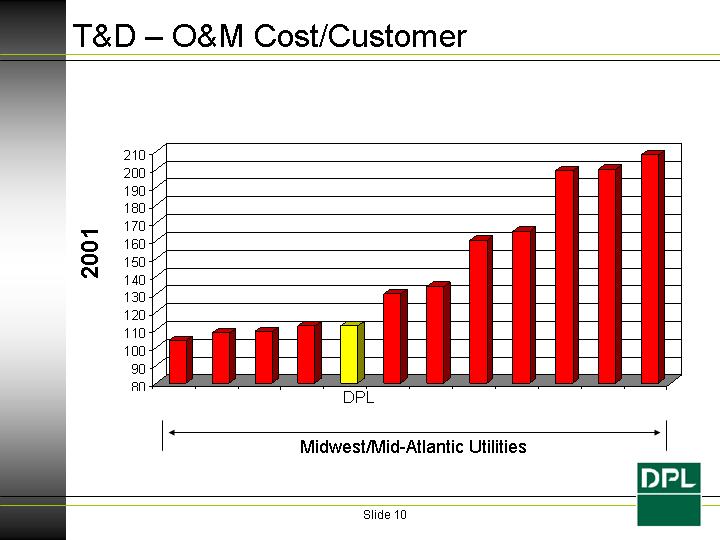
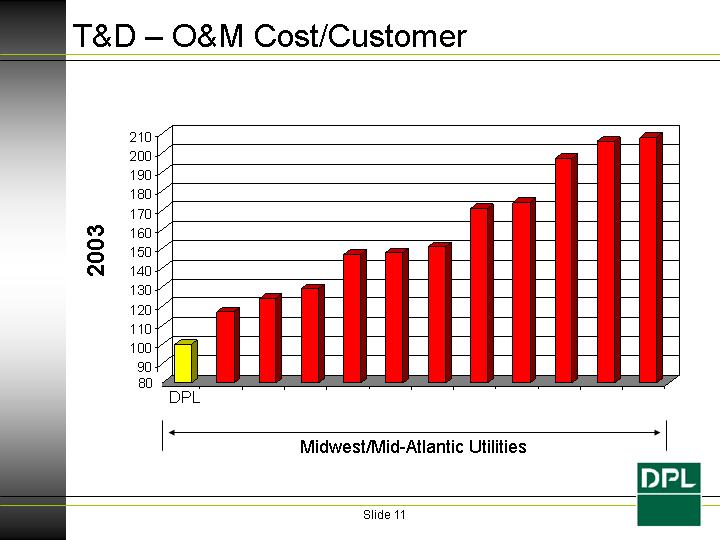
T&D – O&M Cost/Customer
[CHART]
[CHART]
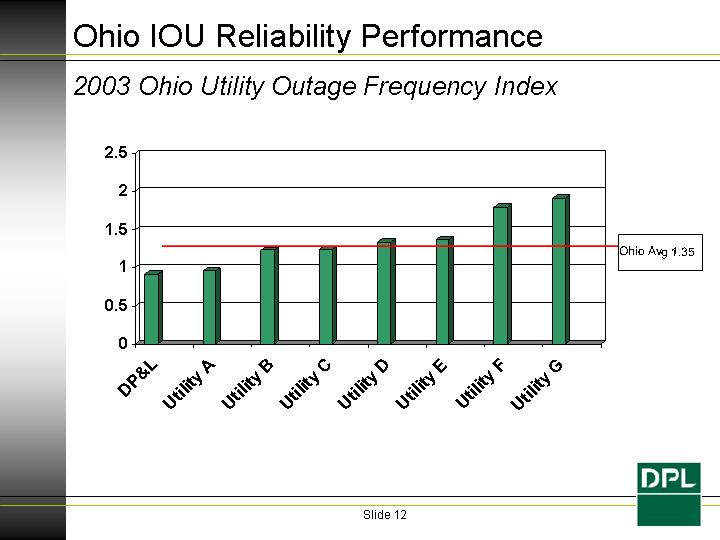
Ohio IOU Reliability Performance
2003 Ohio Utility Outage Frequency Index
[CHART]
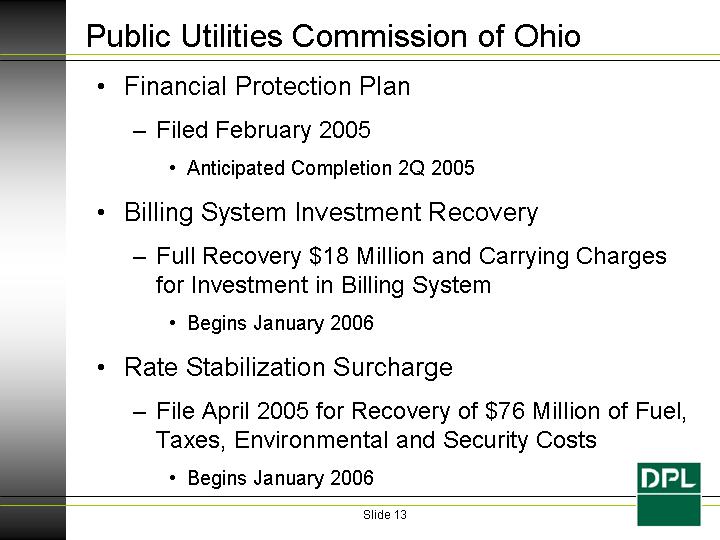
Public Utilities Commission of Ohio
• Financial Protection Plan
• Filed February 2005
• Anticipated Completion 2Q 2005
• Billing System Investment Recovery
• Full Recovery $18 Million and Carrying Charges for Investment in Billing System
• Begins January 2006
• Rate Stabilization Surcharge
• File April 2005 for Recovery of $76 Million of Fuel, Taxes, Environmental and Security Costs
• Begins January 2006
Comparison of 2004 vs. 2003
($ million, except per share amounts) | | Y/E 2004 | | Y/E 2003 | |
| | | | | |
Revenues | | $ | 1,200.0 | | $ | 1,191.0 | |
| | | | | |
Net Electric Margins | | 823.7 | | 868.5 | |
| | | | | |
Operating & Maintenance | | 237.1 | | 199.8 | |
| | | | | |
Operating Income | | 336.5 | | 371.9 | |
| | | | | |
Investment Income | | 184.9 | | 75.8 | |
| | | | | |
Other Income (expense) | | (18.3 | ) | (51.0 | ) |
| | | | | |
Interest Expense | | 160.2 | | 181.7 | |
| | | | | |
Net Income(1) | | 217.3 | | 148.5 | |
| | | | | |
Earnings Per Share(1) | | $ | 1.81 | | $ | 1.10 | |
| | | | | |
Utility Only Earnings Per Share(2) | | $ | 0.99 | | $ | 0.95 | |
(1) Excluding cumulative effect of accounting change in 2003.
(2) Reflects net income, less after tax financial asset portfolio income net of fees.
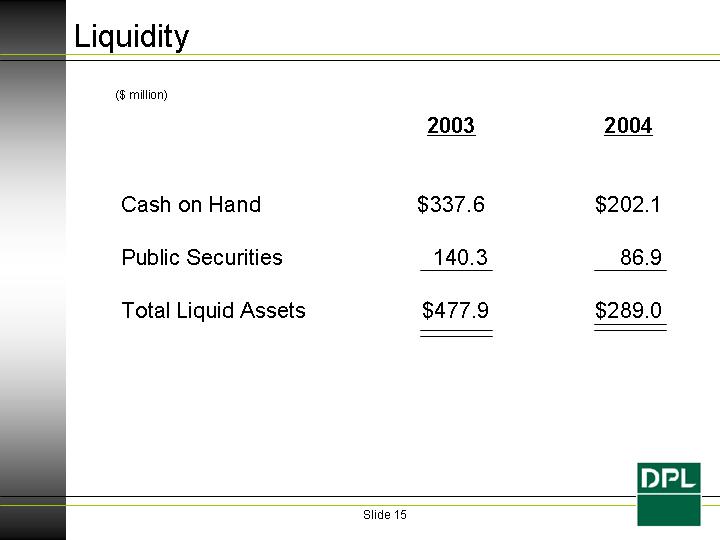
Liquidity
($ million) | | 2003 | | 2004 | |
| | | | | |
Cash on Hand | | $ | 337.6 | | $ | 202.1 | |
| | | | | |
Public Securities | | 140.3 | | 86.9 | |
| | | | | |
Total Liquid Assets | | $ | 477.9 | | $ | 289.0 | |
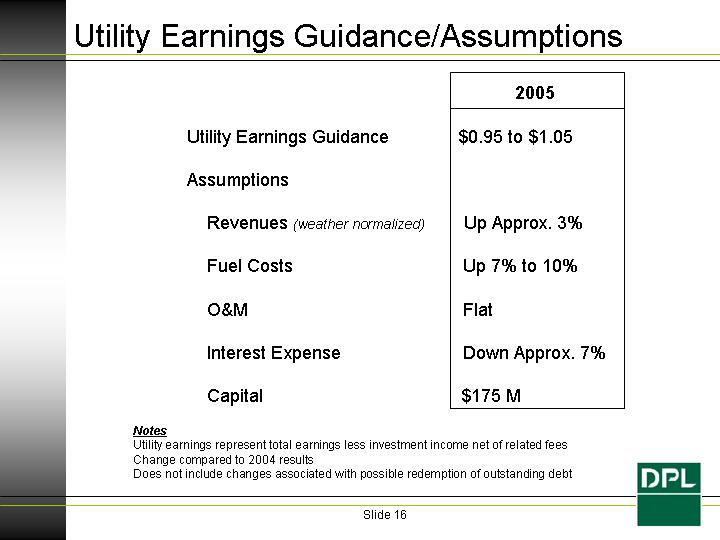
Utility Earnings Guidance/Assumptions
| | 2005 | |
| | | |
Utility Earnings Guidance | | $0.95 to $1.05 | |
| | | |
Assumptions | | | |
| | | |
Revenues (weather normalized) | | Up Approx. 3% | |
| | | |
Fuel Costs | | Up 7% to 10% | |
| | | |
O&M | | Flat | |
| | | |
Interest Expense | | Down Approx. 7% | |
| | | |
Capital | | $175 M | |
Notes
Utility earnings represent total earnings less investment income net of related fees
Change compared to 2004 results
Does not include changes associated with possible redemption of outstanding debt
[LOGO]
Sale of Private Equity Investments
• Current market conditions favorable for sale
• Positive financial impacts
• Reduces DPL’s risk profile
• Positive impact on credit ratings
• Supports core business strategies
Transaction Execution Overview
• Transfer and sale of each fund occurs upon GP approval – Rolling Closings
• Sales price has been allocated to individual funds as negotiated upon signing
• Sales price is adjusted for Capital Calls and Distributions
• Buyer pays adjusted price at each “closing”
• Possibility that not all of the funds may transfer
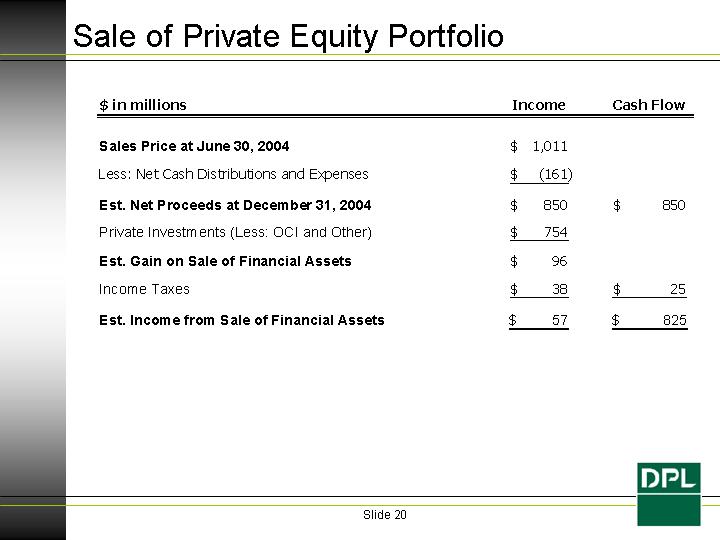
Sale of Private Equity Portfolio
$ in millions | | Income | | Cash Flow | |
| | | | | |
Sales Price at June 30, 2004 | | $ | 1,011 | | | |
| | | | | |
Less: Net Cash Distributions and Expenses | | $ | (161 | ) | | |
| | | | | |
Est. Net Proceeds at December 31, 2004 | | $ | 850 | | $ | 850 | |
| | | | | |
Private Investments (Less: OCI and Other) | | $ | 754 | | | |
| | | | | |
Est. Gain on Sale of Financial Assets | | $ | 96 | | | |
| | | | | |
Income Taxes | | $ | 38 | | $ | 25 | |
| | | | | |
Est. Income from Sale of Financial Assets | | $ | 57 | | $ | 825 | |
[LOGO]