Searchable text section of graphics shown above
STRENGTHENING THE COMPANY
SHARPENING OUR FOCUS
[DPL
LOGO]
Year-End 2005 Earnings
February 16, 2006
Notice Regarding Forward Looking Statements
Certain statements contained in this discussion are “forward-looking statements” within the meaning of the Private Securities Litigation Reform Act of 1995. Matters discussed in this report which relate to events or developments that are expected to occur in the future, including management’s expectations, strategic objectives, business prospects, anticipated economic performance and financial condition and other similar matters constitute forward-looking statements. Forward-looking statements are based on management’s beliefs, assumptions and expectation of the Company’s future economic performance, taking intoaccount the information currently available to management. These statements are not statements of historical fact. Such forward-looking statements are subject to risks and uncertainties and investors are cautioned that outcomes and results may vary materially from those projected due to various factors beyond the control of DPL Inc. or The Dayton Power and Light Company (“DPL”, “DP&L” or the “Company”), including but not limited to: abnormal or severe weather; unusual maintenance or repair requirements; changes in fuel costs, changes in electricity, coal, environmental emissions, gas and other commodity prices; increased competition; regulatory changes and decisions; changes in accounting rules; financial market condition; and general economic conditions. Forward-looking statements speak only as of the date of the document in which they are made. We disclaim any obligation or undertaking to provide any updates or revisions to any forward-looking statement to reflect any change in our expectations or any change in events, conditions or circumstances on which the forward-looking statement is based.
DPL | Year-End 2005 Earnings | Safe Harbor Statement | | 2 |
| February 16, 2006 | | | |
Today’s Agenda
Bob Biggs, Executive Chairman
• Introduction & Overview
John Gillen, Senior V.P. & CFO
• 2005 Financial Results
Jim Mahoney, President & CEO
• 2005 Operational Results
• 2006, 2007 Forecast
DPL | Year-End 2005 Earnings | | | 3 |
| February 16, 2006 | | | |
2005 Accomplishments
Regulatory:
• Resolved favorably a FERC Code of Conduct audit.
• Successfully concluded a PUCO COI.
• Received PUCO approval of Rate Stabilization Plan that we believe will provide five years of income and earnings growth.
• Substantially improved relationship with shareholder groups, regulators, rating agencies and financial analysts.
DPL | Year-End 2005 Earnings | | | 4 |
| February 16, 2006 | | | |
2005 Accomplishments
Operational:
• 2005 generation output second highest in the last 10 years.
• Significant heat rate improvements.
• Significant improvement in plant safety.
• Successfully integrated into the PJM RTO and negotiated ability to deliver generation into either PJM or MISO.
DPL | Year-End 2005 Earnings | | | 5 |
| February 16, 2006 | | | |
2005 Accomplishments
Financial:
• Sold private equity portfolio at a gain.
• Reduced debt by $450 million.
• Refinanced $200 million in pollution control bonds at significant interest savings.
• Strengthened balance sheet, improved financial flexibility & received upgrades from all ratings agencies.
• Initiated a $400 million stock buyback program.
• Finished year at high end of earnings guidance.
DPL | Year-End 2005 Earnings | | | 6 |
| February 16, 2006 | | | |
Current Focus and Initiatives
• Support movement in Ohio toward quasi-regulation.
• Complete integrated resource plan, including peaker analysis.
• Execute stock buyback program.
• Improve base load coal plant availability and heat rate.
• Improve fuel management processes.
• Steadily grow income and dividends.
DPL | Year-End 2005 Earnings | | | 7 |
| February 16, 2006 | | | |
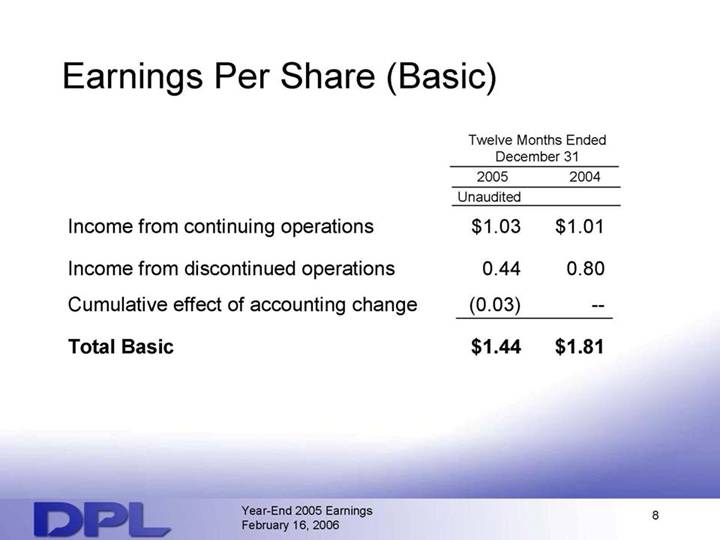
Earnings Per Share (Basic)
| | Twelve Months Ended
December 31 | |
| | 2005 | | 2004 | |
| | Unaudited | | | |
Income from continuing operations | | $ | 1.03 | | $ | 1.01 | |
Income from discontinued operations | | 0.44 | | 0.80 | |
Cumulative effect of accounting change | | (0.03 | ) | — | |
Total Basic | | $ | 1.44 | | $ | 1.81 | |
DPL | Year-End 2005 Earnings | | | 8 |
| February 16, 2006 | | | |
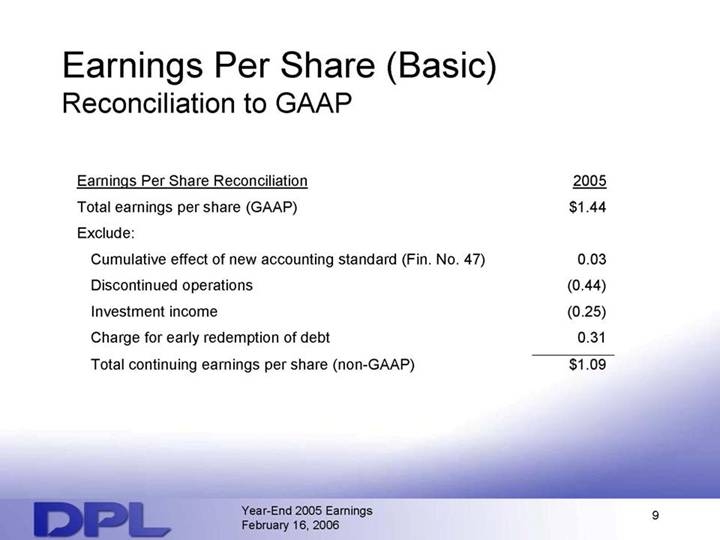
Earnings Per Share (Basic)
Reconciliation to GAAP
Earnings Per Share Reconciliation | | 2005 | |
Total earnings per share (GAAP) | | $ | 1.44 | |
Exclude: | | | |
Cumulative effect of new accounting standard (Fin. No. 47) | | 0.03 | |
Discontinued operations | | (0.44 | ) |
Investment income | | (0.25 | ) |
Charge for early redemption of debt | | 0.31 | |
Total continuing earnings per share (non-GAAP) | | $ | 1.09 | |
DPL | Year-End 2005 Earnings | | | 9 |
| February 16, 2006 | | | |
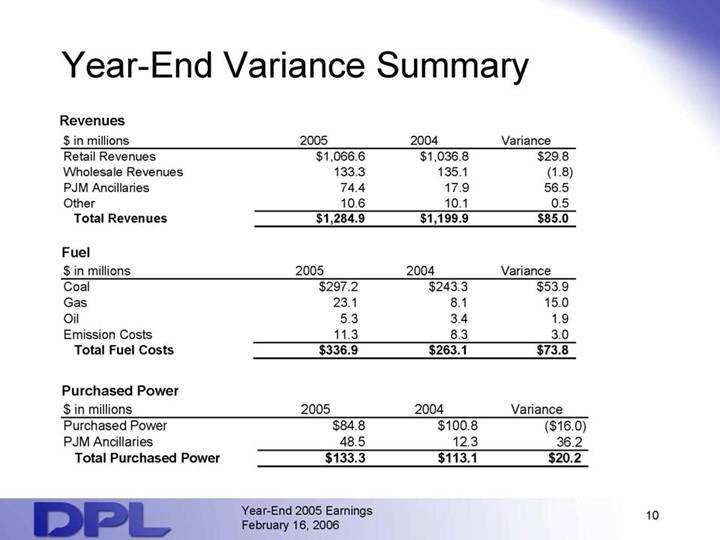
Year-End Variance Summary
Revenues $ in millions | | 2005 | | 2004 | | Variance | |
Retail Revenues | | $ | 1,066.6 | | $ | 1,036.8 | | $ | 29.8 | |
Wholesale Revenues | | 133.3 | | 135.1 | | (1.8 | ) |
PJM Ancillaries | | 74.4 | | 17.9 | | 56.5 | |
Other | | 10.6 | | 10.1 | | 0.5 | |
Total Revenues | | $ | 1,284.9 | | $ | 1,199.9 | | $ | 85.0 | |
| | | | | | | |
| | | | | | | |
Fuel | | | | | | | |
| | | | | | | |
$ in millions | | 2005 | | 2004 | | Variance | |
Coal | | $ | 297.2 | | $ | 243.3 | | $ | 53.9 | |
Gas | | 23.1 | | 8.1 | | 15.0 | |
Oil | | 5.3 | | 3.4 | | 1.9 | |
Emission Costs | | 11.3 | | 8.3 | | 3.0 | |
Total Fuel Costs | | $ | 336.9 | | $ | 263.1 | | $ | 73.8 | |
| | | | | | | |
| | | | | | | |
Purchased Power | | | | | | | |
| | | | | | | |
$ in millions | | 2005 | | 2004 | | Variance | |
Purchased Power | | $ | 84.8 | | $ | 100.8 | | $ | (16.0 | ) |
PJM Ancillaries | | 48.5 | | 12.3 | | 36.2 | |
Total Purchased Power | | $ | 133.3 | | $ | 113.1 | | $ | 20.2 | |
DPL | Year-End 2005 Earnings | | | 10 |
| February 16, 2006 | | | |
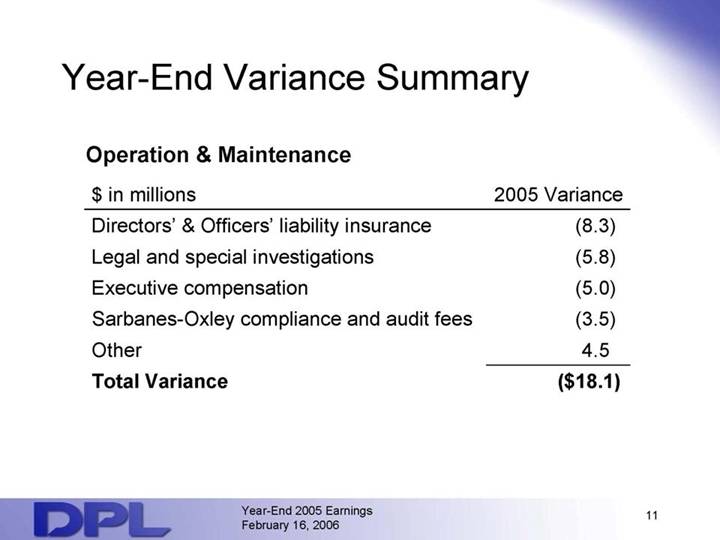
Year-End Variance Summary
Operation & Maintenance $ in millions | | 2005 Variance | |
Directors’ & Officers’ liability insurance | | (8.3 | ) |
Legal and special investigations | | (5.8 | ) |
Executive compensation | | (5.0 | ) |
Sarbanes-Oxley compliance and audit fees | | (3.5 | ) |
Other | | 4.5 | |
Total Variance | | $ | (18.1 | ) |
| | | | |
DPL | Year-End 2005 Earnings | | | 11 |
| February 16, 2006 | | | |
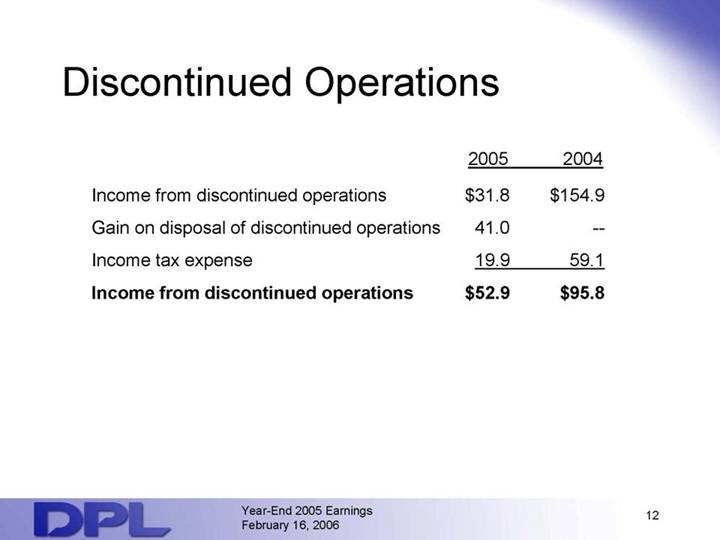
Discontinued Operations
| | 2005 | | 2004 | |
Income from discontinued operations | | $ | 31.8 | | $ | 154.9 | |
Gain on disposal of discontinued operations | | 41.0 | | — | |
Income tax expense | | 19.9 | | 59.1 | |
| | $ | 52.9 | | $ | 95.8 | |
DPL | Year-End 2005 Earnings | | | 12 |
| February 16, 2006 | | | |
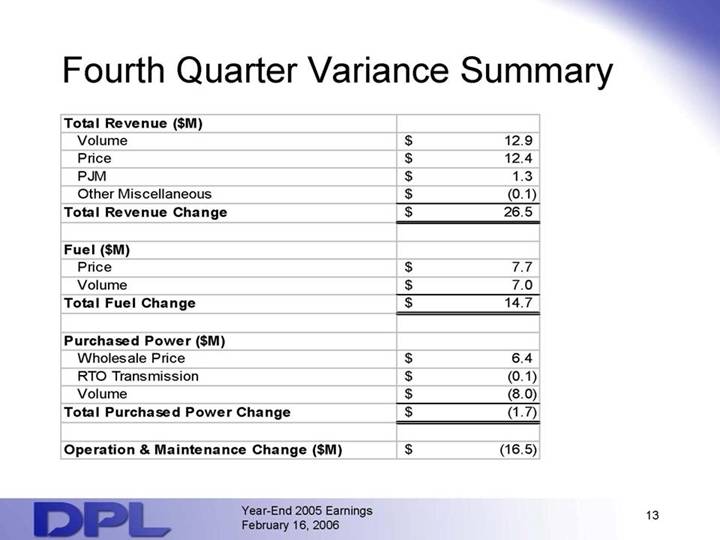
Fourth Quarter Variance Summary
Total Revenue ($M) | | | |
Volume | | $ | 12.9 | |
Price | | $ | 12.4 | |
PJM | | $ | 1.3 | |
Other Miscellaneous | | $ | (0.1 | ) |
Total Revenue Change | | $ | 26.5 | |
| | | |
Fuel ($M) | | | |
Price | | $ | 7.7 | |
Volume | | $ | 7.0 | |
Total Fuel Change | | $ | 14.7 | |
| | | |
Purchased Power ($M) | | | |
Wholesale Price | | $ | 6.4 | |
RTO Transmission | | $ | (0.1 | ) |
Volume | | $ | (8.0 | ) |
Total Purchased Power Change | | $ | (1.7 | ) |
| | | |
Operation & Maintenance Change ($M) | | $ | (16.5 | ) |
DPL | Year-End 2005 Earnings | | | 13 |
| February 16, 2006 | | | |
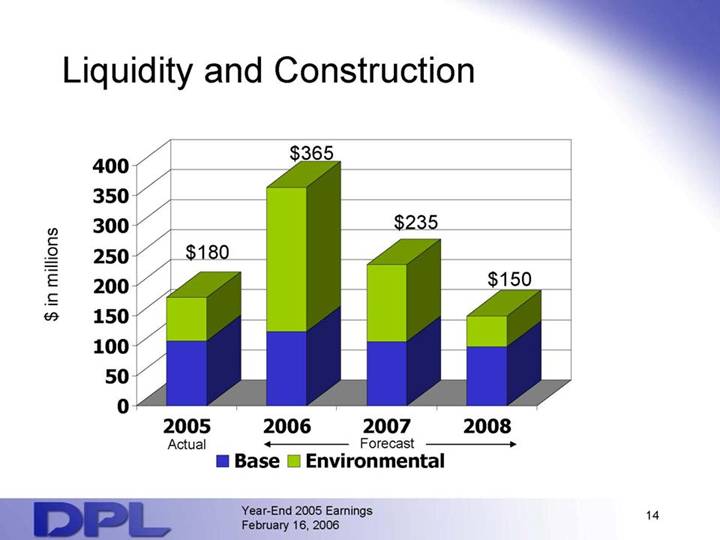
Liquidity and Construction
[LINE GRAPH]
DPL | Year-End 2005 Earnings | | | 14 |
| February 16, 2006 | | | |
The Landscape, As We Entered 2005
• Increasing Coal & Natural Gas Prices
• Significant Environmental CapEx
• Increasing RTO Fees
• Significant Regulatory Costs
• Uncertainty — Long-Term Commitment to Retail Customer Choice
DPL | Year-End 2005 Earnings | | | 15 |
| February 16, 2006 | | | |
2005 Accomplishments
Fuel
• Assessed potential cost savings related to FGD
• Improved monitoring of coal deliveries
• Improved tracking of fuel positions at all co-owned plants
Generation
• Improved output — second highest in last decade
• Improved efficiency 1% over 2004
• Maintained operation and maintenance cost 15% below ECAR average
DPL | Year-End 2005 Earnings | | | 16 |
| February 16, 2006 | | | |
2005 Accomplishments
Transmission & Distribution
• Met or exceeded all PUCO reliability standards
• Re-engineered call center
• Strengthened emergency response commitment
Negotiated New 3-Year Labor Contract
DPL | Year-End 2005 Earnings | | | 17 |
| February 16, 2006 | | | |
Sustained Continuous Improvement
• Capital Investments: Dense Pack, Turbine Upgrades
• Critical Component Benchmarking Program
• Union Incentives for Preventive Maintenance, Unit Operations and Efficiency
• Comprehensive Long-Term Resource Planning
DPL | Year-End 2005 Earnings | | | 18 |
| February 16, 2006 | | | |
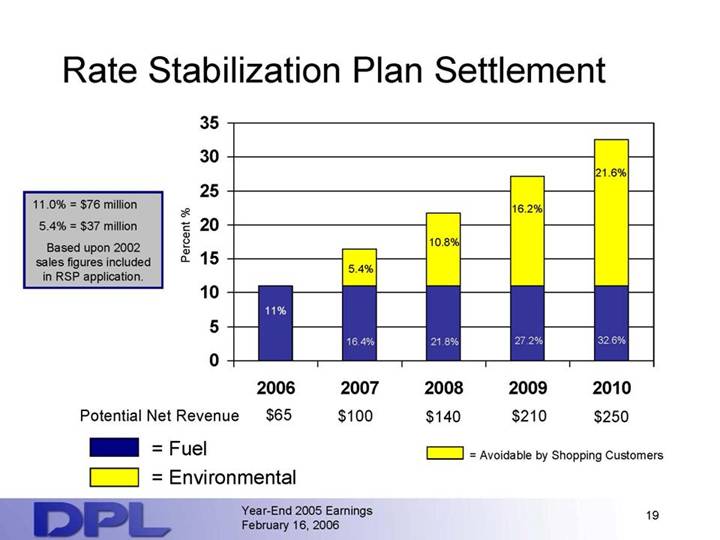
Rate Stabilization Plan Settlement
[LINE GRAPH]
DPL | Year-End 2005 Earnings | | | 19 |
| February 16, 2006 | | | |
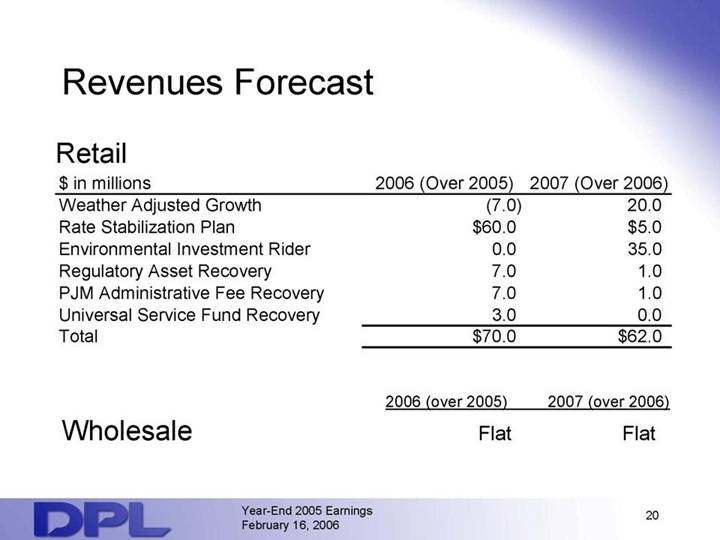
Revenues Forecast
Retail
$ in millions | | 2006 (Over 2005) | | 2007 (Over 2006) | |
Weather Adjusted Growth | | (7.0 | ) | 20.0 | |
Rate Stabilization Plan | | $ | 60.0 | | $ | 5.0 | |
Environmental Investment Rider | | 0.0 | | 35.0 | |
Regulatory Asset Recovery | | 7.0 | | 1.0 | |
PJM Administrative Fee Recovery | | 7.0 | | 1.0 | |
Universal Service Fund Recovery Total | | 3.0 | | 0.0 | |
Total | | $ | 70.0 | | $ | 62.0 | |
| | | | | |
| | | | | |
| | 2006 (over 2005) | | 2007 (over 2006) | |
| | | | | |
Wholesale | | Flat | | Flat | |
DPL | Year-End 2005 Earnings | | | 20 |
| February 16, 2006 | | | |
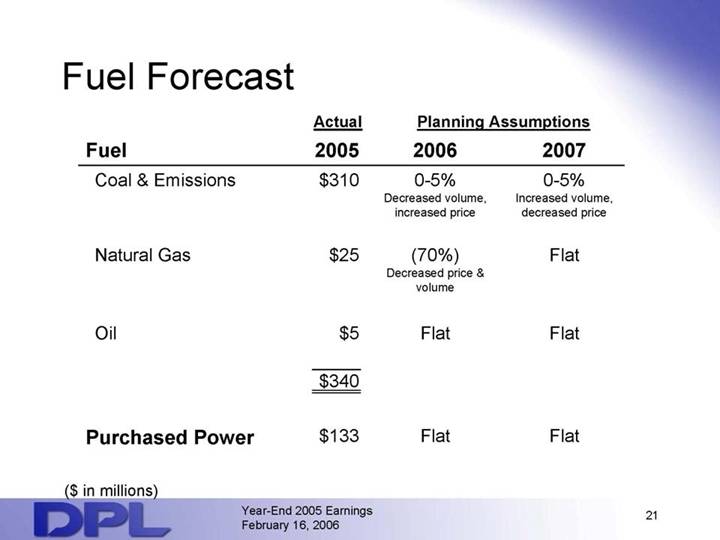
Fuel Forecast
| | Actual | | Planning Assumptions | |
Fuel | | 2005 | | 2007 | | 2006 | |
Coal & Emissions | | $ | 310 | | 0-5 | % | 0-5 | % |
| | | | Decreased volume, increased price | | Increased volume, decreased price | |
| | | | | | | |
Natural Gas | | $ | 25 | | (70 | )% | Flat | |
| | | | Decreased price & volume | | | |
| | | | | | | |
Oil | | $ | 5 | | Flat | | Flat | |
| | | | | | | |
| | $ | 340 | | | | | |
| | | | | | | |
Purchased Power | | $ | 133 | | Flat | | Flat | |
| | | | | | | |
($ in millions) | | | | | | | |
DPL | Year-End 2005 Earnings | | | 21 |
| February 16, 2006 | | | |
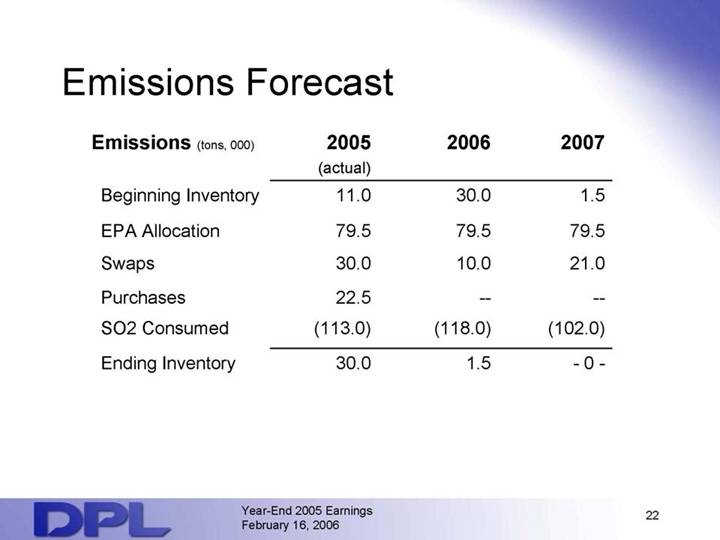
Emissions Forecast
Emissions (tons, 000) | | 2005 | | 2006 | | 2007 | |
| | (actual) | | | | | |
Beginning Inventory | | 11.0 | | 30.0 | | 1.5 | |
EPA Allocation | | 79.5 | | 79.5 | | 79.5 | |
Swaps | | 30.0 | | 10.0 | | 21.0 | |
Purchases | | 22.5 | | — | | — | |
SO2 Consumed | | (113.0 | ) | (118.0 | ) | (102.0 | ) |
Ending Inventory | | 30.0 | | 1.5 | | -0 - | |
DPL | Year-End 2005 Earnings | | | 22 |
| February 16, 2006 | | | |
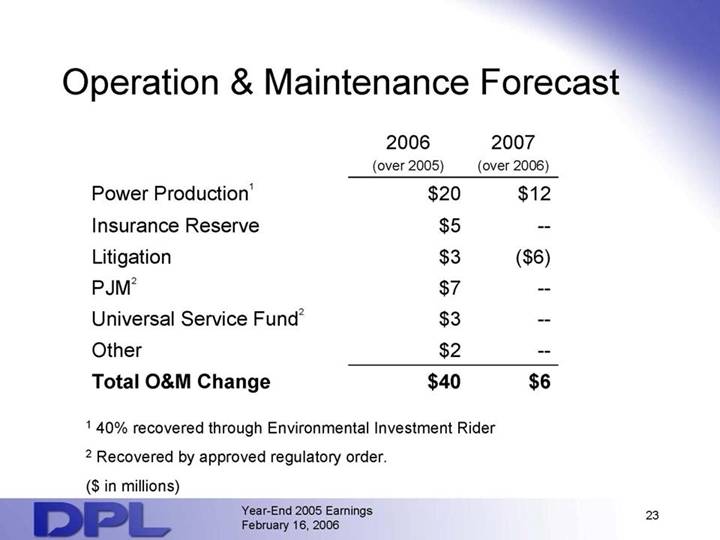
Operation & Maintenance Forecast
| | 2006 | | 2007 | |
| | (over 2005) | | (over 2006) | |
Power Production(1) | | $ | 20 | | $ | 12 | |
Insurance Reserve | | $ | 5 | | — | |
Litigation | | $ | 3 | | $ | (6 | ) |
PJM(2) | | $ | 7 | | — | |
Universal Service Fund2 | | $ | 3 | | — | |
Other | | $ | 2 | | — | |
Total O&M Change | | $ | 40 | | $ | 6 | |
| | | | | |
| | | | | |
(1) 40% recovered through Environmental Investment Rider (2) Recovered by approved regulatory order. ($ in millions) |
DPL | Year-End 2005 Earnings | | | 23 |
| February 16, 2006 | | | |
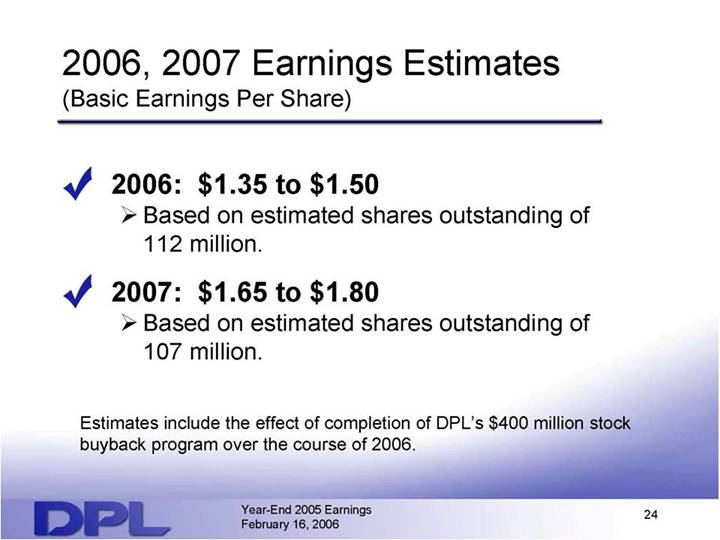
2006, 2007 Earnings Estimates
(Basic Earnings Per Share)
• 2006: $1.35 to $1.50
• Based on estimated shares outstanding of 112 million.
• 2007: $1.65 to $1.80
• Based on estimated shares outstanding of 107 million.
Estimates include the effect of completion of DPL’s $400 million stock buyback program over the course of 2006.
DPL | Year-End 2005 Earnings | | | 24 |
| February 16, 2006 | | | |
STRENGTHENING THE COMPANY
SHARPENING OUR FOCUS
Year-End 2005 Earnings
February 16, 2006