Exhibit 99.1
| February 22, 2007 Year-End Earnings Ohio Power Forum Presentation March 21, 2007 |

| Notice Regarding Forward-Looking Statements Certain statements contained in this presentation are “forward-looking statements” within the meaning of the Private Securities Litigation Reform Act of 1995. Matters discussed that relate to events or developments that are expected to occur in the future, including management’s expectations, strategic objectives, business prospects, anticipated economic performance and financial condition and other similar matters constitute forward-looking statements. Forward-looking statements are based on management’s beliefs, assumptions and expectations of future economic performance, taking into account the information currently available to management. These statements are not statements of historical fact and are typically identified by terms and phrases such as “anticipate,” “believe,” “intend,” “estimate,” “expect,” “continue,” “should,” “could,” “may,” “plan,” “project,” “predict,” “will” and similar expressions. Such forward-looking statements are subject to risks and uncertainties, and investors are cautioned that outcomes and results may vary materially from those projected due to various factors beyond DPL’s control, including but not limited to: abnormal or severe weather and catastrophic weather-related damage; unusual maintenance or repair requirements; changes in fuel costs and purchased power, coal, environmental emissions, gas and other commodity prices; volatility and changes in markets for electricity and other energy-related commodities; increased competition and deregulation in the electric utility industry; increased competition in the retail generation market; changes in interest rates; state, federal and foreign legislative and regulatory initiatives that affect cost and investment recovery, emission levels, rate structures or tax laws; changes in federal and/or state environmental compliance costs, laws and regulations to which DPL and its subsidiaries are subject; the development of Regional Transmission Organizations, including the PJM to which DPL’s operating subsidiary has given control of its transmission functions; changes in DPL’s purchasing processes, delays and supplier availability; significant delays associated with large construction projects; growth in DPL’s service territory and changes in demand and demographic patterns; changes in accounting rules and the effect of accounting pronouncements issued periodically by accounting standard-setting bodies; financial market conditions; the outcomes of litigation and regulatory investigations, proceedings or inquiries; general economic conditions; and the risks and other factors discussed in DPL’s filings with the Securities and Exchange Commission. Forward-looking statements speak only as of the date of the document in which they are made. We disclaim any obligation or undertaking to provide any updates or revisions to any forward-looking statement to reflect any change in our expectations or any change in events, conditions or circumstances on which the forward-looking statement is based. |
| Presentation Outline Welcome and Overview Paul Barbas, President and Chief Executive Officer 2006 Earnings Joe Boni, Treasurer Fuel and FGD Update Paul Barbas, President and Chief Executive Officer 2007 Guidance Joe Boni, Treasurer |
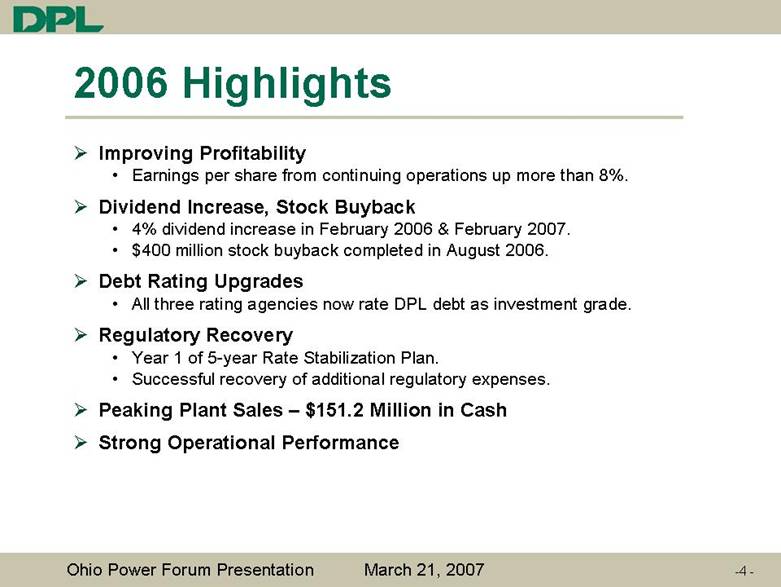
| 2006 Highlights Improving Profitability Earnings per share from continuing operations up more than 8%. Dividend Increase, Stock Buyback 4% dividend increase in February 2006 & February 2007. $400 million stock buyback completed in August 2006. Debt Rating Upgrades All three rating agencies now rate DPL debt as investment grade. Regulatory Recovery Year 1 of 5-year Rate Stabilization Plan. Successful recovery of additional regulatory expenses. Peaking Plant Sales – $151.2 Million in Cash Strong Operational Performance |
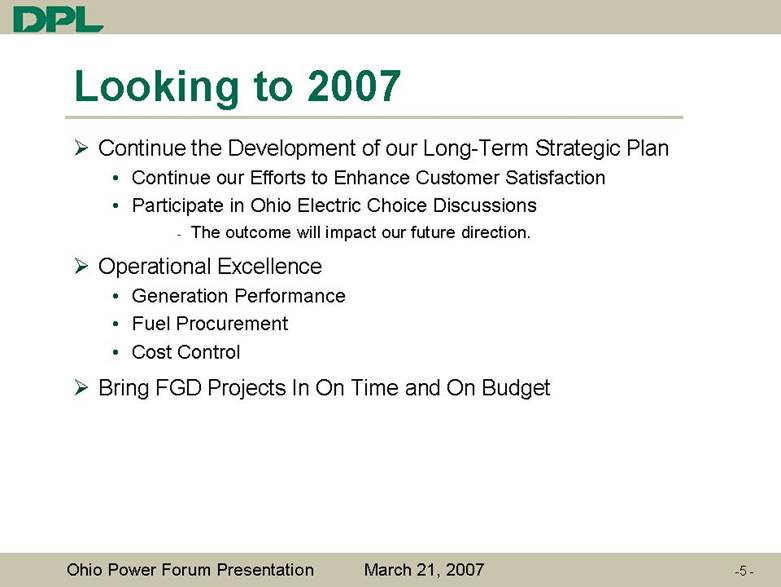
| Looking to 2007 Continue the Development of our Long-Term Strategic Plan Continue our Efforts to Enhance Customer Satisfaction Participate in Ohio Electric Choice Discussions The outcome will impact our future direction. Operational Excellence Generation Performance Fuel Procurement Cost Control Bring FGD Projects In On Time and On Budget |
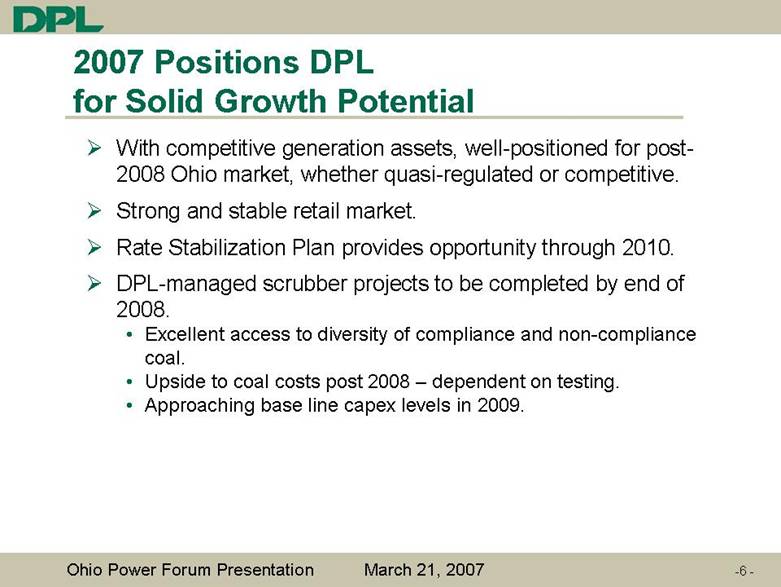
| 2007 Positions DPL for Solid Growth Potential With competitive generation assets, well-positioned for post-2008 Ohio market, whether quasi-regulated or competitive. Strong and stable retail market. Rate Stabilization Plan provides opportunity through 2010. DPL-managed scrubber projects to be completed by end of 2008. Excellent access to diversity of compliance and non-compliance coal. Upside to coal costs post 2008 – dependent on testing. Approaching base line capex levels in 2009. |
| 2006 Earnings 2006 Earnings |
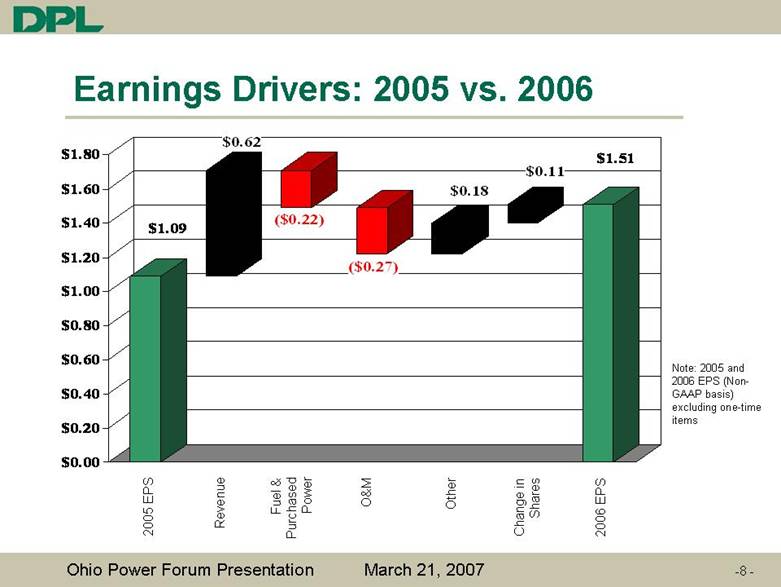
| -8 - Earnings Drivers: 2005 vs. 2006 Note: 2005 and 2006 EPS (Non-GAAP basis) excluding one-time items 2005 EPS Revenue Fuel & Purchased Power O&M Other Change in Shares 2006 EPS $1.09 $0.62 ($0.22) ($0.27) $0.18 $0.11 $1.51 $0.00 $0.20 $0.40 $0.60 $0.80 $1.00 $1.20 $1.40 $1.60 $1.80 |
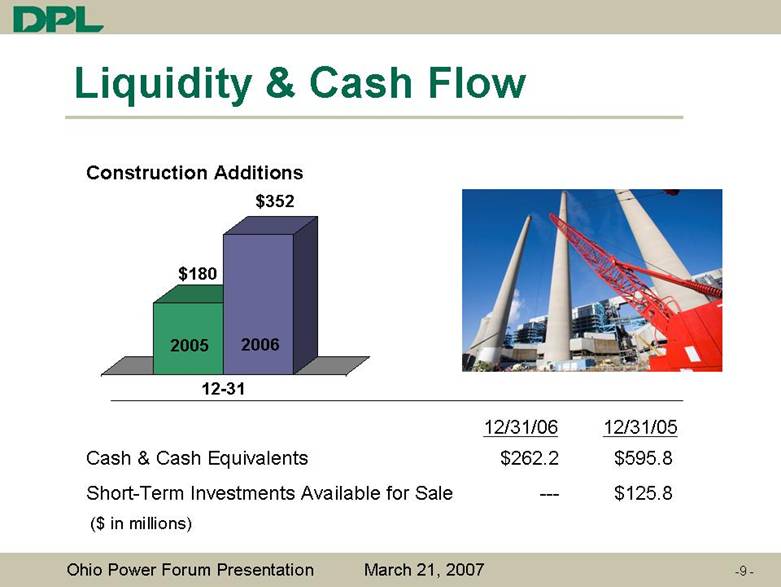
| Liquidity & Cash Flow Cash & Cash Equivalents $262.2 $595.8 Short-Term Investments Available for Sale --- $125.8 $180 2005 2006 12-31 Construction Additions $352 ($ in millions) 12/31/06 12/31/05 |
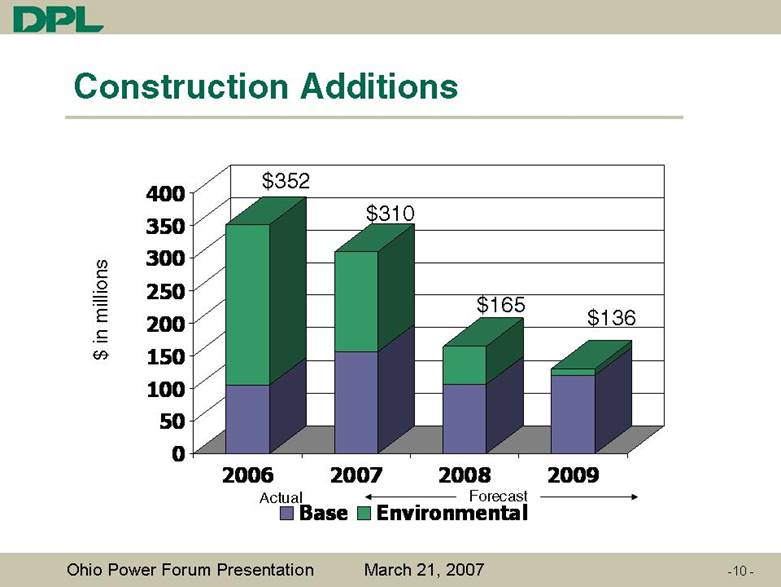
| $ in millions Construction Additions Actual Forecast $352 $310 $165 $136 0 50 100 150 200 250 300 350 400 2006 2007 2008 2009 Base Environmental |
| Fuel and FGD Update |
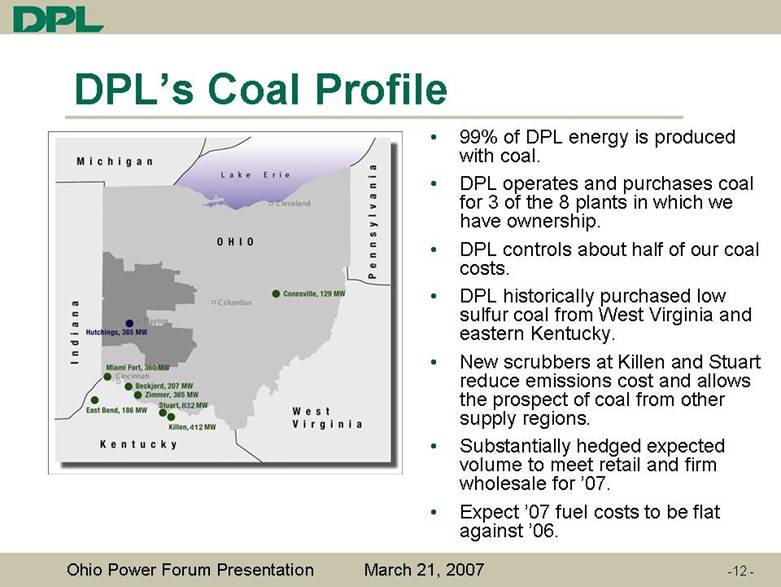
| DPL’s Coal Profile 99% of DPL energy is produced with coal. DPL operates and purchases coal for 3 of the 8 plants in which we have ownership. DPL controls about half of our coal costs. DPL historically purchased low sulfur coal from West Virginia and eastern Kentucky. New scrubbers at Killen and Stuart reduce emissions cost and allows the prospect of coal from other supply regions. Substantially hedged expected volume to meet retail and firm wholesale for ’07. Expect ’07 fuel costs to be flat against ’06. |
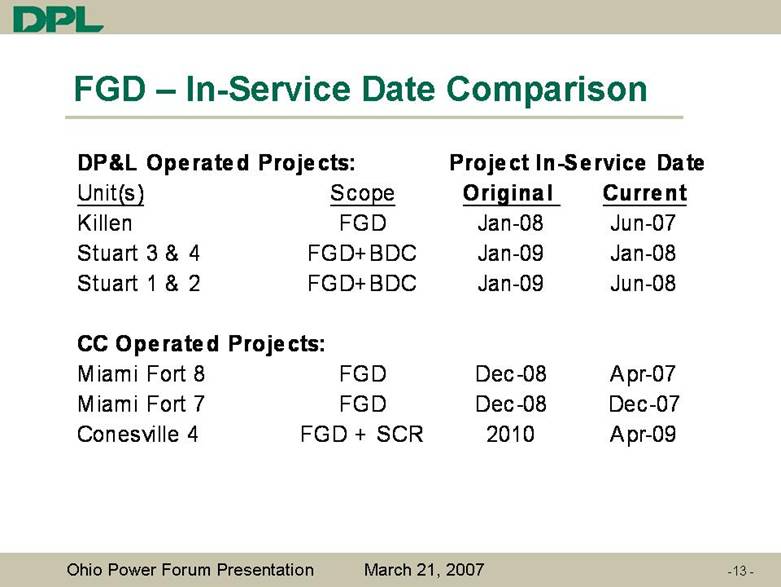
| FGD – In-Service Date Comparison DP&L Operated Projects: Unit(s) Scope Original Current Killen FGD Jan-08 Jun-07 Stuart 3 & 4 FGD+BDC Jan-09 Jan-08 Stuart 1 & 2 FGD+BDC Jan-09 Jun-08 CC Operated Projects: Miami Fort 8 FGD Dec-08 Apr-07 Miami Fort 7 FGD Dec-08 Dec-07 Conesville 4 FGD + SCR 2010 Apr-09 Project In-Service Date |
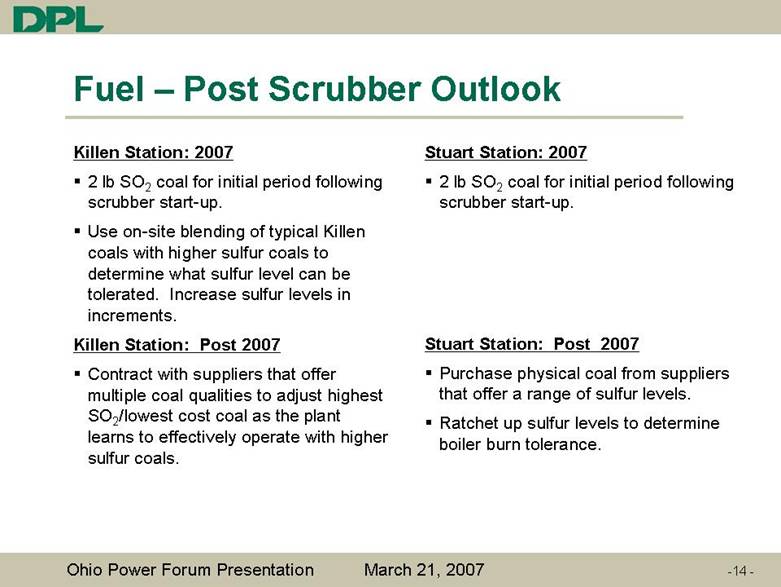
| Fuel: Post-Scrubber Outlook Killen Station: 2007 2 lb SO2 coal for initial period following scrubber start-up. Use on-site blending of typical Killen coals with higher sulfur coals to determine what sulfur level can be tolerated. Increase sulfur levels in increments. Killen Station: Post 2007 Contract with suppliers that offer multiple coal qualities to adjust highest SO2/lowest cost coal as the plant learns to effectively operate with higher sulfur coals. Stuart Station: 2007 2 lb SO2 coal for initial period following scrubber start-up. Stuart Station: Post 2007 Purchase physical coal from suppliers that offer a range of sulfur levels. Ratchet up sulfur levels to determine boiler burn tolerance. Fuel – Post Scrubber Outlook |
| 2007 Guidance |

| 2007 Guidance Basic Earnings Per Share from Continuing Operations: $1.60 to $1.75. Guidance includes the expected completion of peaking plant sales in 2007. Estimate based on 108 million shares outstanding. |
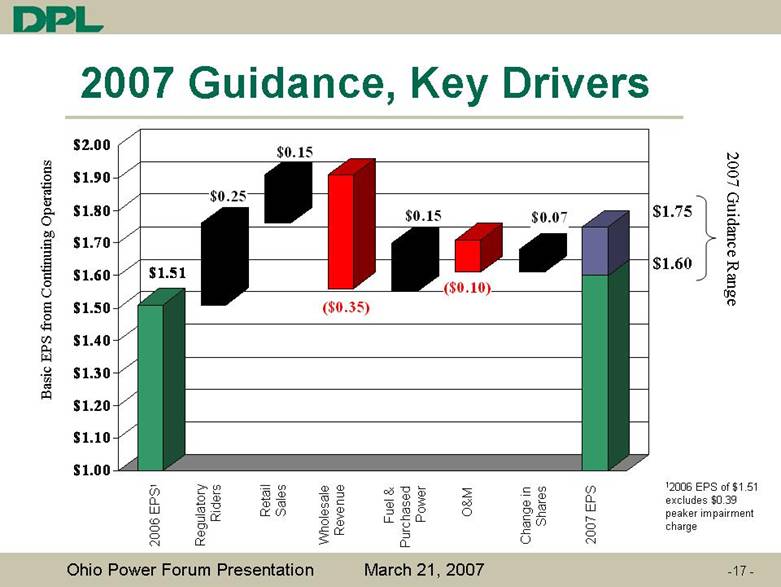
| -17 - 2007 Guidance, Key Drivers $1.60 $1.75 2007 Guidance Range Basic EPS from Continuing Operations 2006 EPS1 Regulatory Riders Retail Sales Wholesale Revenue Fuel & Purchased Power O&M Change in Shares 2007 EPS 12006 EPS of $1.51 excludes $0.39 peaker impairment charge $1.51 $0.25 $0.15 ($0.35) $0.15 ($0.10) $0.07 $1.00 $1.10 $1.20 $1.30 $1.40 $1.50 $1.60 $1.70 $1.80 $1.90 $2.00 |
| February 22, 2007 Year-End Earnings Appendix |
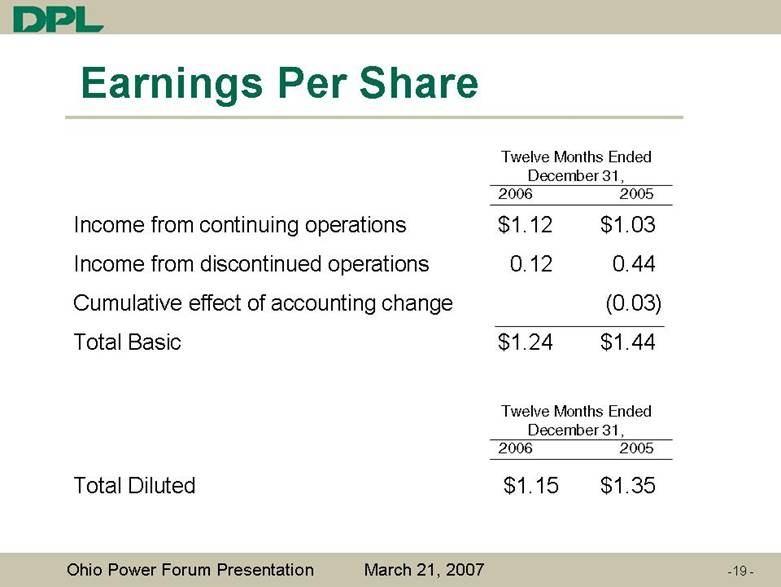
| Earnings Per Share Income from continuing operations $1.12 $1.03 Income from discontinued operations 0.12 0.44 Cumulative effect of accounting change (0.03) Total Basic $1.24 $1.44 Total Diluted $1.15 $1.35 Twelve Months Ended December 31, 2006 2005 Twelve Months Ended December 31, 2006 2005 |
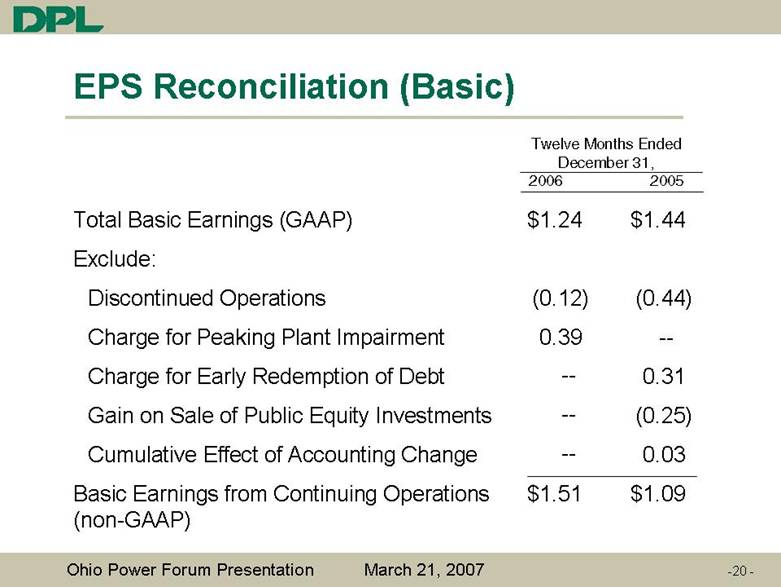
| EPS Reconciliation (Basic) Twelve Months Ended December 31, 2006 2005 Total Basic Earnings (GAAP) $1.24 $1.44 Exclude: Discontinued Operations (0.12) (0.44) Charge for Peaking Plant Impairment 0.39 Charge for Early Redemption of Debt 0.31 Gain on Sale of Public Equity Investments (0.25) Cumulative Effect of Accounting Change 0.03 Basic Earnings from Continuing Operations $1.51 $1.09 (non-GAAP) -- -- -- -- |
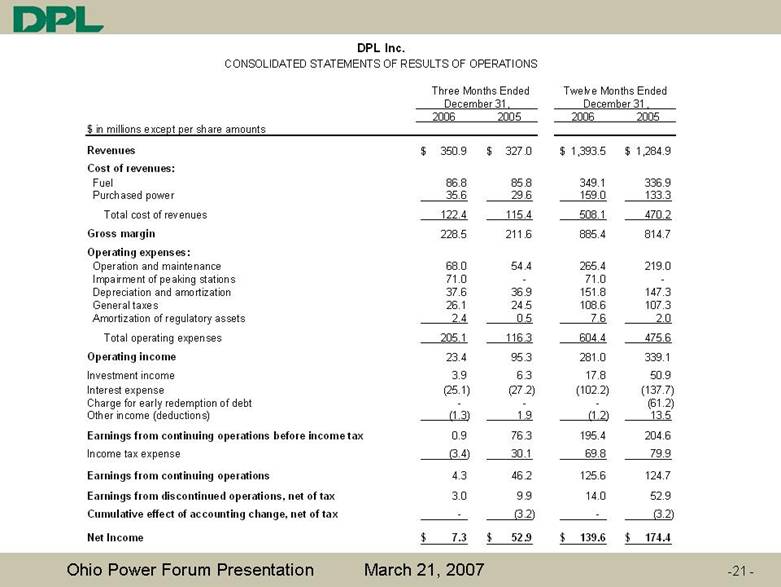
| Three Months Ended Twelve Months Ended December 31, December 31, 2006 2005 2006 2005 $ in millions except per share amounts Revenues 350.9 $ 327.0 $ 1,393.5 $ 1,284.9 $ Cost of revenues: 86.8 85.8 349.1 336.9 35.6 29.6 159.0 133.3 122.4 115.4 508.1 470.2 Gross margin 228.5 211.6 885.4 814.7 Operating expenses: 68.0 54.4 265.4 219.0 71.0 - 71.0 - 37.6 36.9 151.8 147.3 26.1 24.5 108.6 107.3 2.4 0.5 7.6 2.0 205.1 116.3 604.4 475.6 Operating income 23.4 95.3 281.0 339.1 Investment income 3.9 6.3 17.8 50.9 Interest expense (25.1) (27.2) (102.2) (137.7) Charge for early redemption of debt - - - (61.2) Other income (deductions) (1.3) 1.9 (1.2) 13.5 Earnings from continuing operations before income tax 0.9 76.3 195.4 204.6 Income tax expense (3.4) 30.1 69.8 79.9 Earnings from continuing operations 4.3 46.2 125.6 124.7 Earnings from discontinued operations, net of tax 3.0 9.9 14.0 52.9 Cumulative effect of accounting change, net of tax - (3.2) - (3.2) Net Income 7.3 $ 52.9 $ 139.6 $ 174.4 $ DPL Inc. CONSOLIDATED STATEMENTS OF RESULTS OF OPERATIONS Total operating expenses Amortization of regulatory assets General taxes Depreciation and amortization Impairment of peaking stations Operation and maintenance Total cost of revenues Purchased power Fuel |
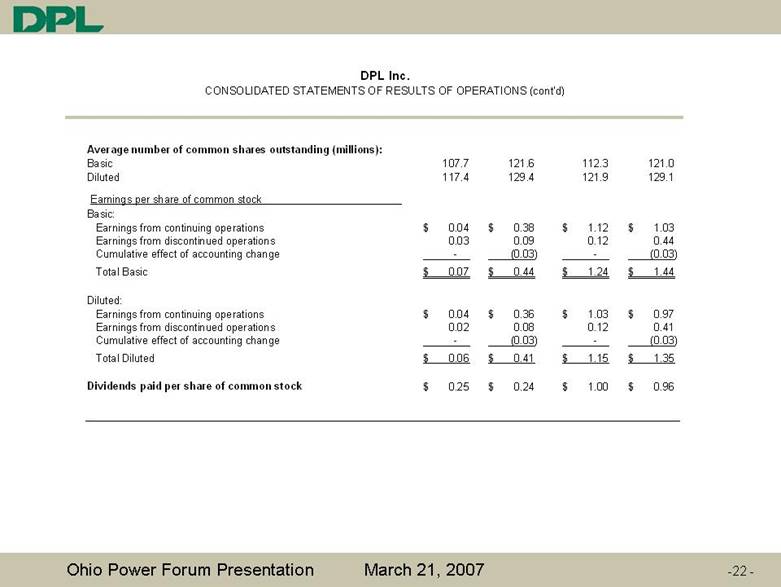
| Average number of common shares outstanding (millions): Basic 107.7 121.6 112.3 121.0 Diluted 117.4 129.4 121.9 129.1 Earnings per share of common stock Basic: 0.04 $ 0.38 $ 1.12 $ 1.03 $ 0.03 0.09 0.12 0.44 - (0.03) - (0.03) 0.07 $ 0.44 $ 1.24 $ 1.44 $ Diluted: 0.04 $ 0.36 $ 1.03 $ 0.97 $ 0.02 0.08 0.12 0.41 - (0.03) - (0.03) 0.06 $ 0.41 $ 1.15 $ 1.35 $ Dividends paid per share of common stock 0.25 $ 0.24 $ 1.00 $ 0.96 $ DPL Inc. CONSOLIDATED STATEMENTS OF RESULTS OF OPERATIONS (cont'd) Total Diluted Cumulative effect of accounting change Earnings from discontinued operations Earnings from continuing operations Total Basic Cumulative effect of accounting change Earnings from discontinued operations Earnings from continuing operations |
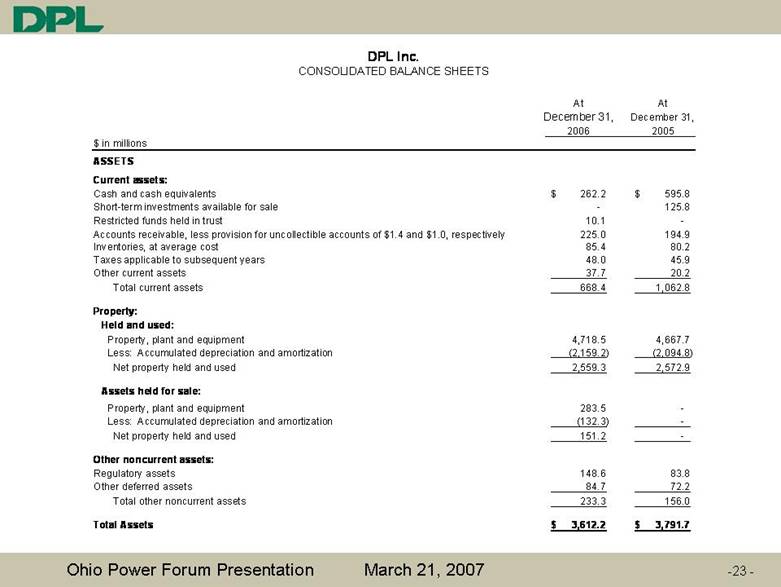
| At At December 31, December 31, 2006 2005 $ in millions ASSETS Current assets: Cash and cash equivalents 262.2 $ 595.8 $ Short-term investments available for sale - 125.8 Restricted funds held in trust 10.1 - Accounts receivable, less provision for uncollectible accounts of $1.4 and $1.0, respectively 225.0 194.9 Inventories, at average cost 85.4 80.2 Taxes applicable to subsequent years 48.0 45.9 Other current assets 37.7 20.2 668.4 1,062.8 Property: 4,718.5 4,667.7 (2,159.2) (2,094.8) 2,559.3 2,572.9 283.5 - (132.3) - 151.2 - Other noncurrent assets: Regulatory assets 148.6 83.8 Other deferred assets 84.7 72.2 233.3 156.0 Total Assets 3,612.2 $ 3,791.7 $ DPL Inc. CONSOLIDATED BALANCE SHEETS Total other noncurrent assets Net property held and used Less: Accumulated depreciation and amortization Property, plant and equipment Assets held for sale: Net property held and used Less: Accumulated depreciation and amortization Property, plant and equipment Held and used: Total current assets |
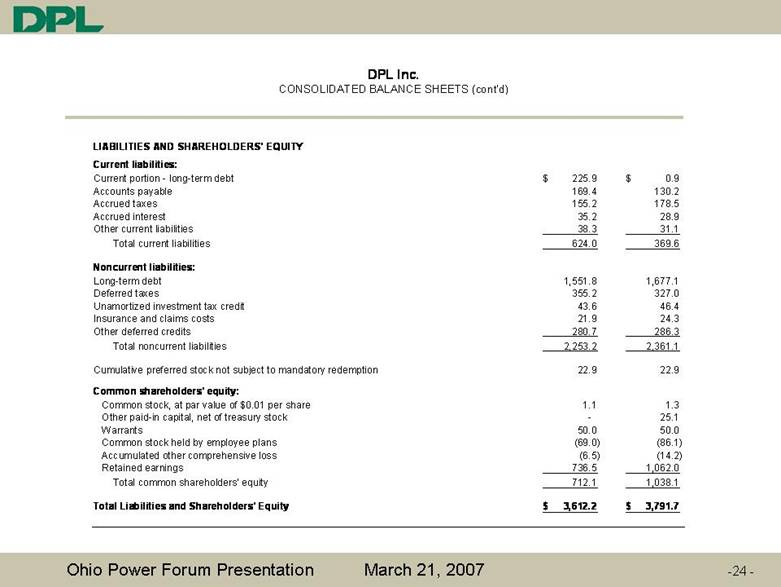
| LIABILITIES AND SHAREHOLDERS' EQUITY Current liabilities: Current portion - long-term debt 225.9 $ 0.9 $ Accounts payable 169.4 130.2 Accrued taxes 155.2 178.5 Accrued interest 35.2 28.9 Other current liabilities 38.3 31.1 624.0 369.6 Noncurrent liabilities: Long-term debt 1,551.8 1,677.1 Deferred taxes 355.2 327.0 Unamortized investment tax credit 43.6 46.4 Insurance and claims costs 21.9 24.3 Other deferred credits 280.7 286.3 2,253.2 2,361.1 Cumulative preferred stock not subject to mandatory redemption 22.9 22.9 Common shareholders' equity: 1.1 1.3 - 25.1 50.0 50.0 (69.0) (86.1) (6.5) (14.2) 736.5 1,062.0 712.1 1,038.1 Total Liabilities and Shareholders' Equity 3,612.2 $ 3,791.7 $ DPL Inc. CONSOLIDATED BALANCE SHEETS (cont'd) Total common shareholders' equity Retained earnings Accumulated other comprehensive loss Common stock held by employee plans Warrants Other paid-in capital, net of treasury stock Common stock, at par value of $0.01 per share Total noncurrent liabilities Total current liabilities |
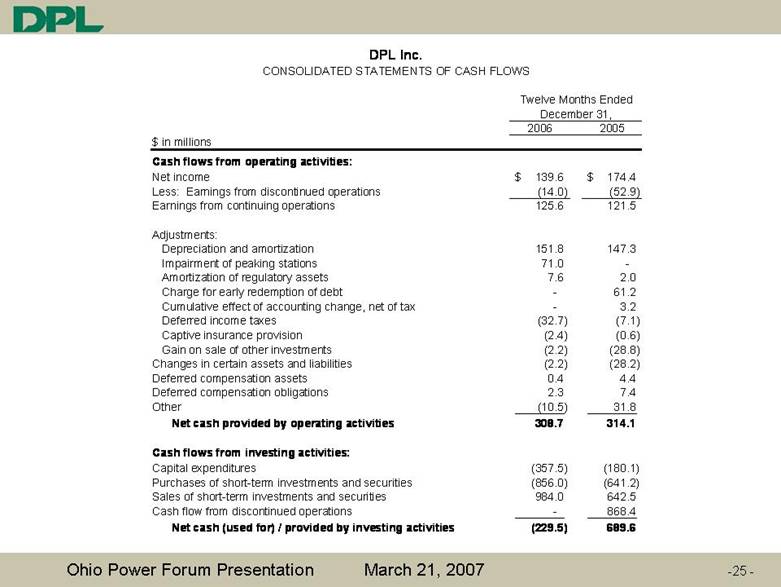
| Twelve Months Ended December 31, 2006 2005 $ in millions Cash flows from operating activities: Net income 139.6 $ 174.4 $ Less: Earnings from discontinued operations (14.0) (52.9) Earnings from continuing operations 125.6 121.5 Adjustments: 151.8 147.3 71.0 - 7.6 2.0 - 61.2 - 3.2 (32.7) (7.1) (2.4) (0.6) (2.2) (28.8) Changes in certain assets and liabilities (2.2) (28.2) Deferred compensation assets 0.4 4.4 Deferred compensation obligations 2.3 7.4 Other (10.5) 31.8 308.7 314.1 Cash flows from investing activities: Capital expenditures (357.5) (180.1) Purchases of short-term investments and securities (856.0) (641.2) Sales of short-term investments and securities 984.0 642.5 Cash flow from discontinued operations - 868.4 (229.5) 689.6 DPL Inc. CONSOLIDATED STATEMENTS OF CASH FLOWS Net cash (used for) / provided by investing activities Net cash provided by operating activities Gain on sale of other investments Captive insurance provision Deferred income taxes Cumulative effect of accounting change, net of tax Charge for early redemption of debt Amortization of regulatory assets Impairment of peaking stations Depreciation and amortization |
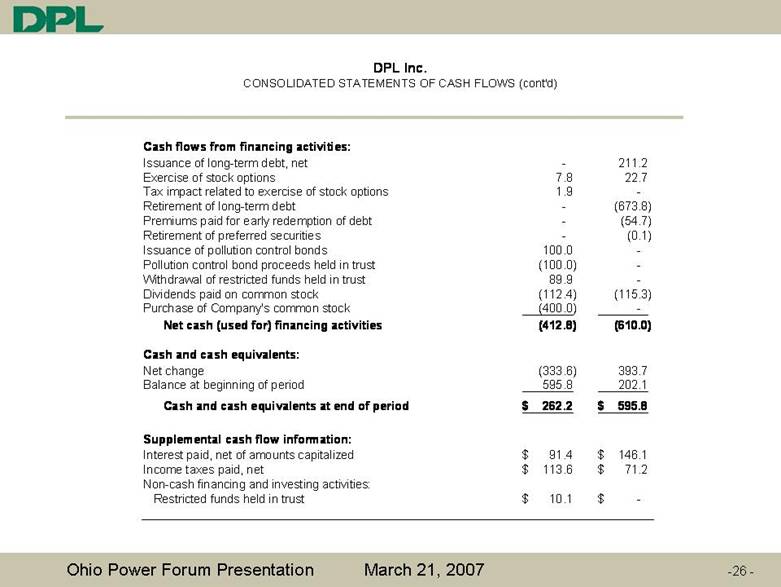
| Cash flows from financing activities: Issuance of long-term debt, net - 211.2 Exercise of stock options 7.8 22.7 Tax impact related to exercise of stock options 1.9 - Retirement of long-term debt - (673.8) Premiums paid for early redemption of debt - (54.7) Retirement of preferred securities - (0.1) Issuance of pollution control bonds 100.0 - Pollution control bond proceeds held in trust (100.0) - Withdrawal of restricted funds held in trust 89.9 - Dividends paid on common stock (112.4) (115.3) Purchase of Company's common stock (400.0) - (412.8) (610.0) Cash and cash equivalents: Net change (333.6) 393.7 Balance at beginning of period 595.8 202.1 262.2 $ 595.8 $ Supplemental cash flow information: Interest paid, net of amounts capitalized 91.4 $ 146.1 $ Income taxes paid, net 113.6 $ 71.2 $ Non-cash financing and investing activities: 10.1 $ - $ DPL Inc. CONSOLIDATED STATEMENTS OF CASH FLOWS (cont'd) Restricted funds held in trust Cash and cash equivalents at end of period Net cash (used for) financing activities |
| February 22, 2007 Year-End Earnings Ohio Power Forum Presentation March 21, 2007 |