
INVESTOR PRESENTATION Q4 and Full Fiscal Year 2024
Forward-looking Statements & Non-GAAP Financial Information Forward-Looking Language This presentation contains “forward-looking statements” within the meaning of the safe harbor provisions of the U.S. Private Securities Litigation Reform Act of 1995. Forward-looking statements can be identified by words such as: “anticipate,” “intend,” “plan,” “goal,” “seek,” “believe,” “project,” “estimate,” “expect,” “strategy,” “future,” “likely,” “may,” “should,” “will” and similar references to future periods. Examples of forward-looking statements include, among others, our revenue, subscription revenue and Adjusted EBITDA guidance for the 2024 fiscal year and statements we make regarding expected property management room growth. Forward-looking statements are neither historical facts nor assurances of future performance. Instead, they are based only on our current beliefs, expectations and assumptions regarding the future of our business, future plans and strategies, projections, anticipated events and trends, the economy and other future conditions. Because forward-looking statements relate to the future, they are subject to inherent uncertainties, risks and changes in circumstances that are difficult to predict and many of which are outside of our control. Our actual results and financial condition may differ materially from those indicated in the forward-looking statements. Therefore, you should not rely on any of these forward-looking statements. Important factors that could cause our actual results and financial condition to differ materially from those indicated in the forward-looking statements include, among others, the effect of the COVID-19 pandemic on our business and the success of any measures we have taken or may take in the future in response thereto; and the risks described in the Company’s filings with the Securities and Exchange Commission, including the Company’s reports on Form 10-K and Form 10-Q. Any forward-looking statement made by us in this press release is based only on information currently available to us and speaks only as of the date on which it is made. We undertake no obligation to publicly update any forward-looking statement that may be made from time to time, whether written or oral, whether as a result of new information, future developments or otherwise. Use of Non-GAAP Financial Information To supplement the unaudited consolidated financial statements presented in accordance with U.S. GAAP in this press release, certain non-GAAP financial measures as defined by the SEC rules are used. These non-GAAP financial measures include EBITDA, Adjusted EBITDA, adjusted net income, adjusted basic earnings per share, adjusted diluted earnings per share and free cash flow. Management believes that such information can enhance investors’ understanding of the Company’s ongoing operations.

Thank You For your partnership and �your business Our Mission Helping Our Customers Improve Employee & Guest Experiences, With Dedication To Past, Present & Future Customer Investments �In Our Products And Services.
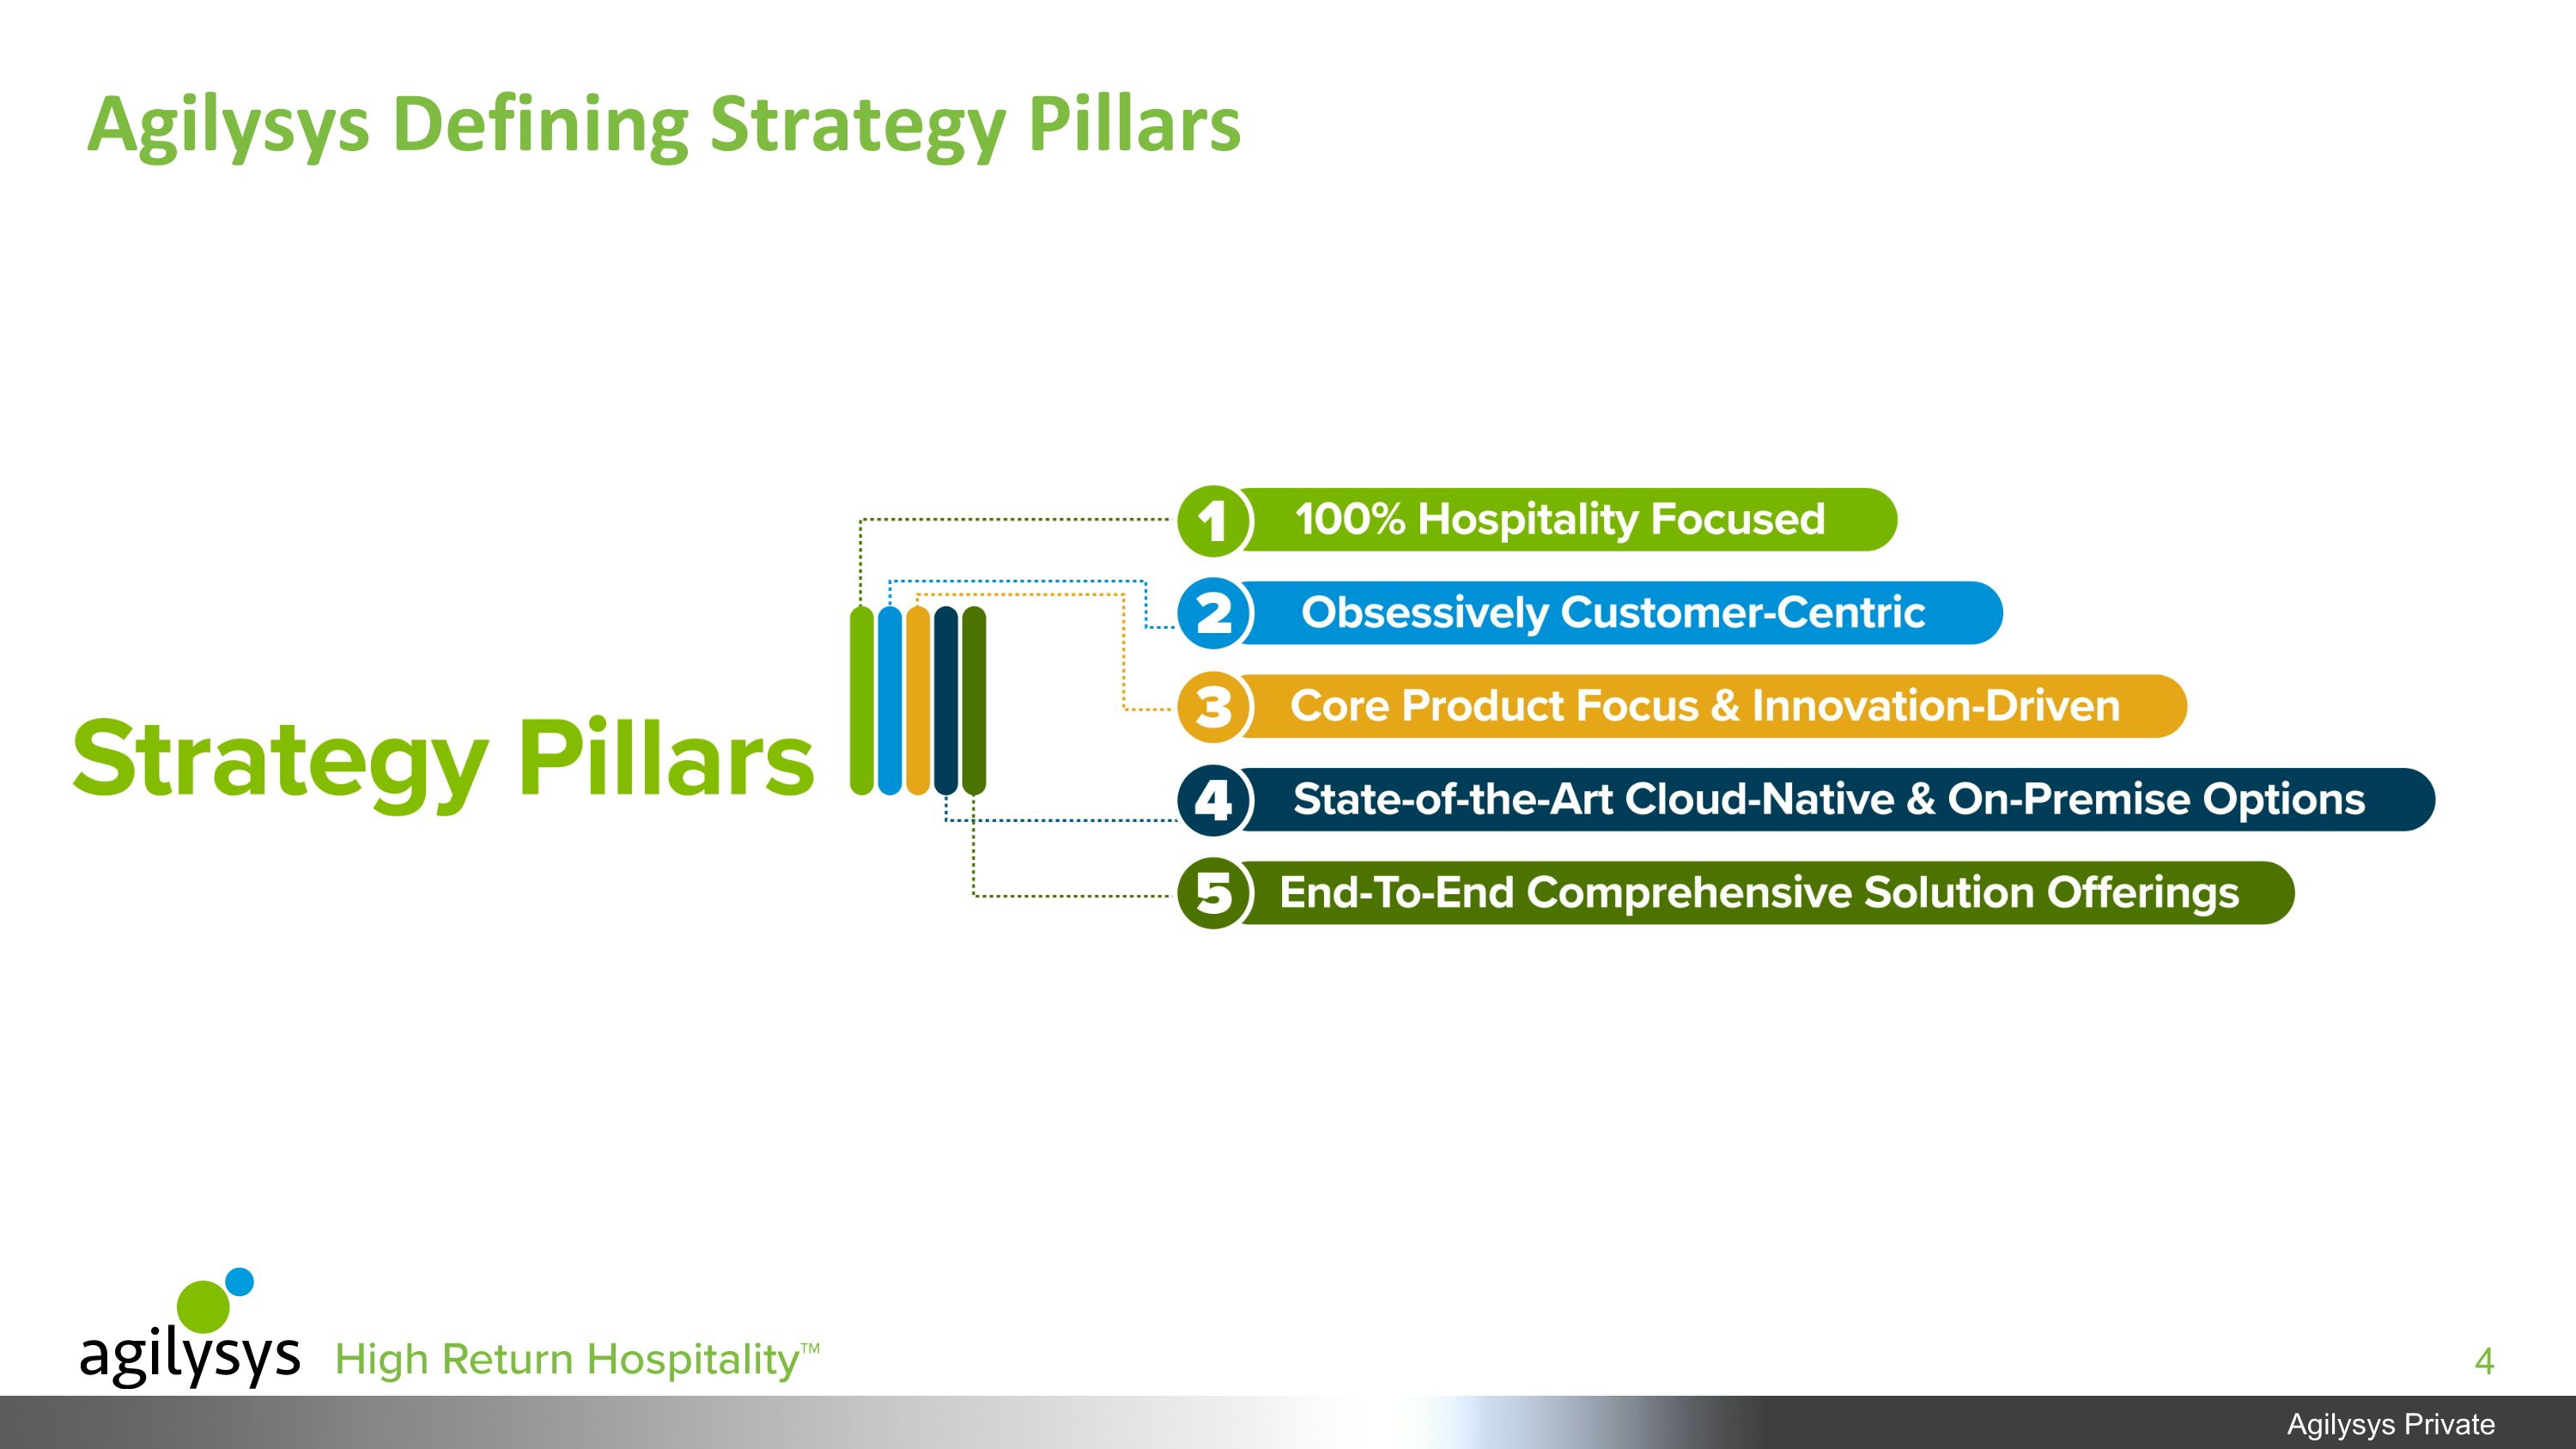
Agilysys Defining Strategy Pillars
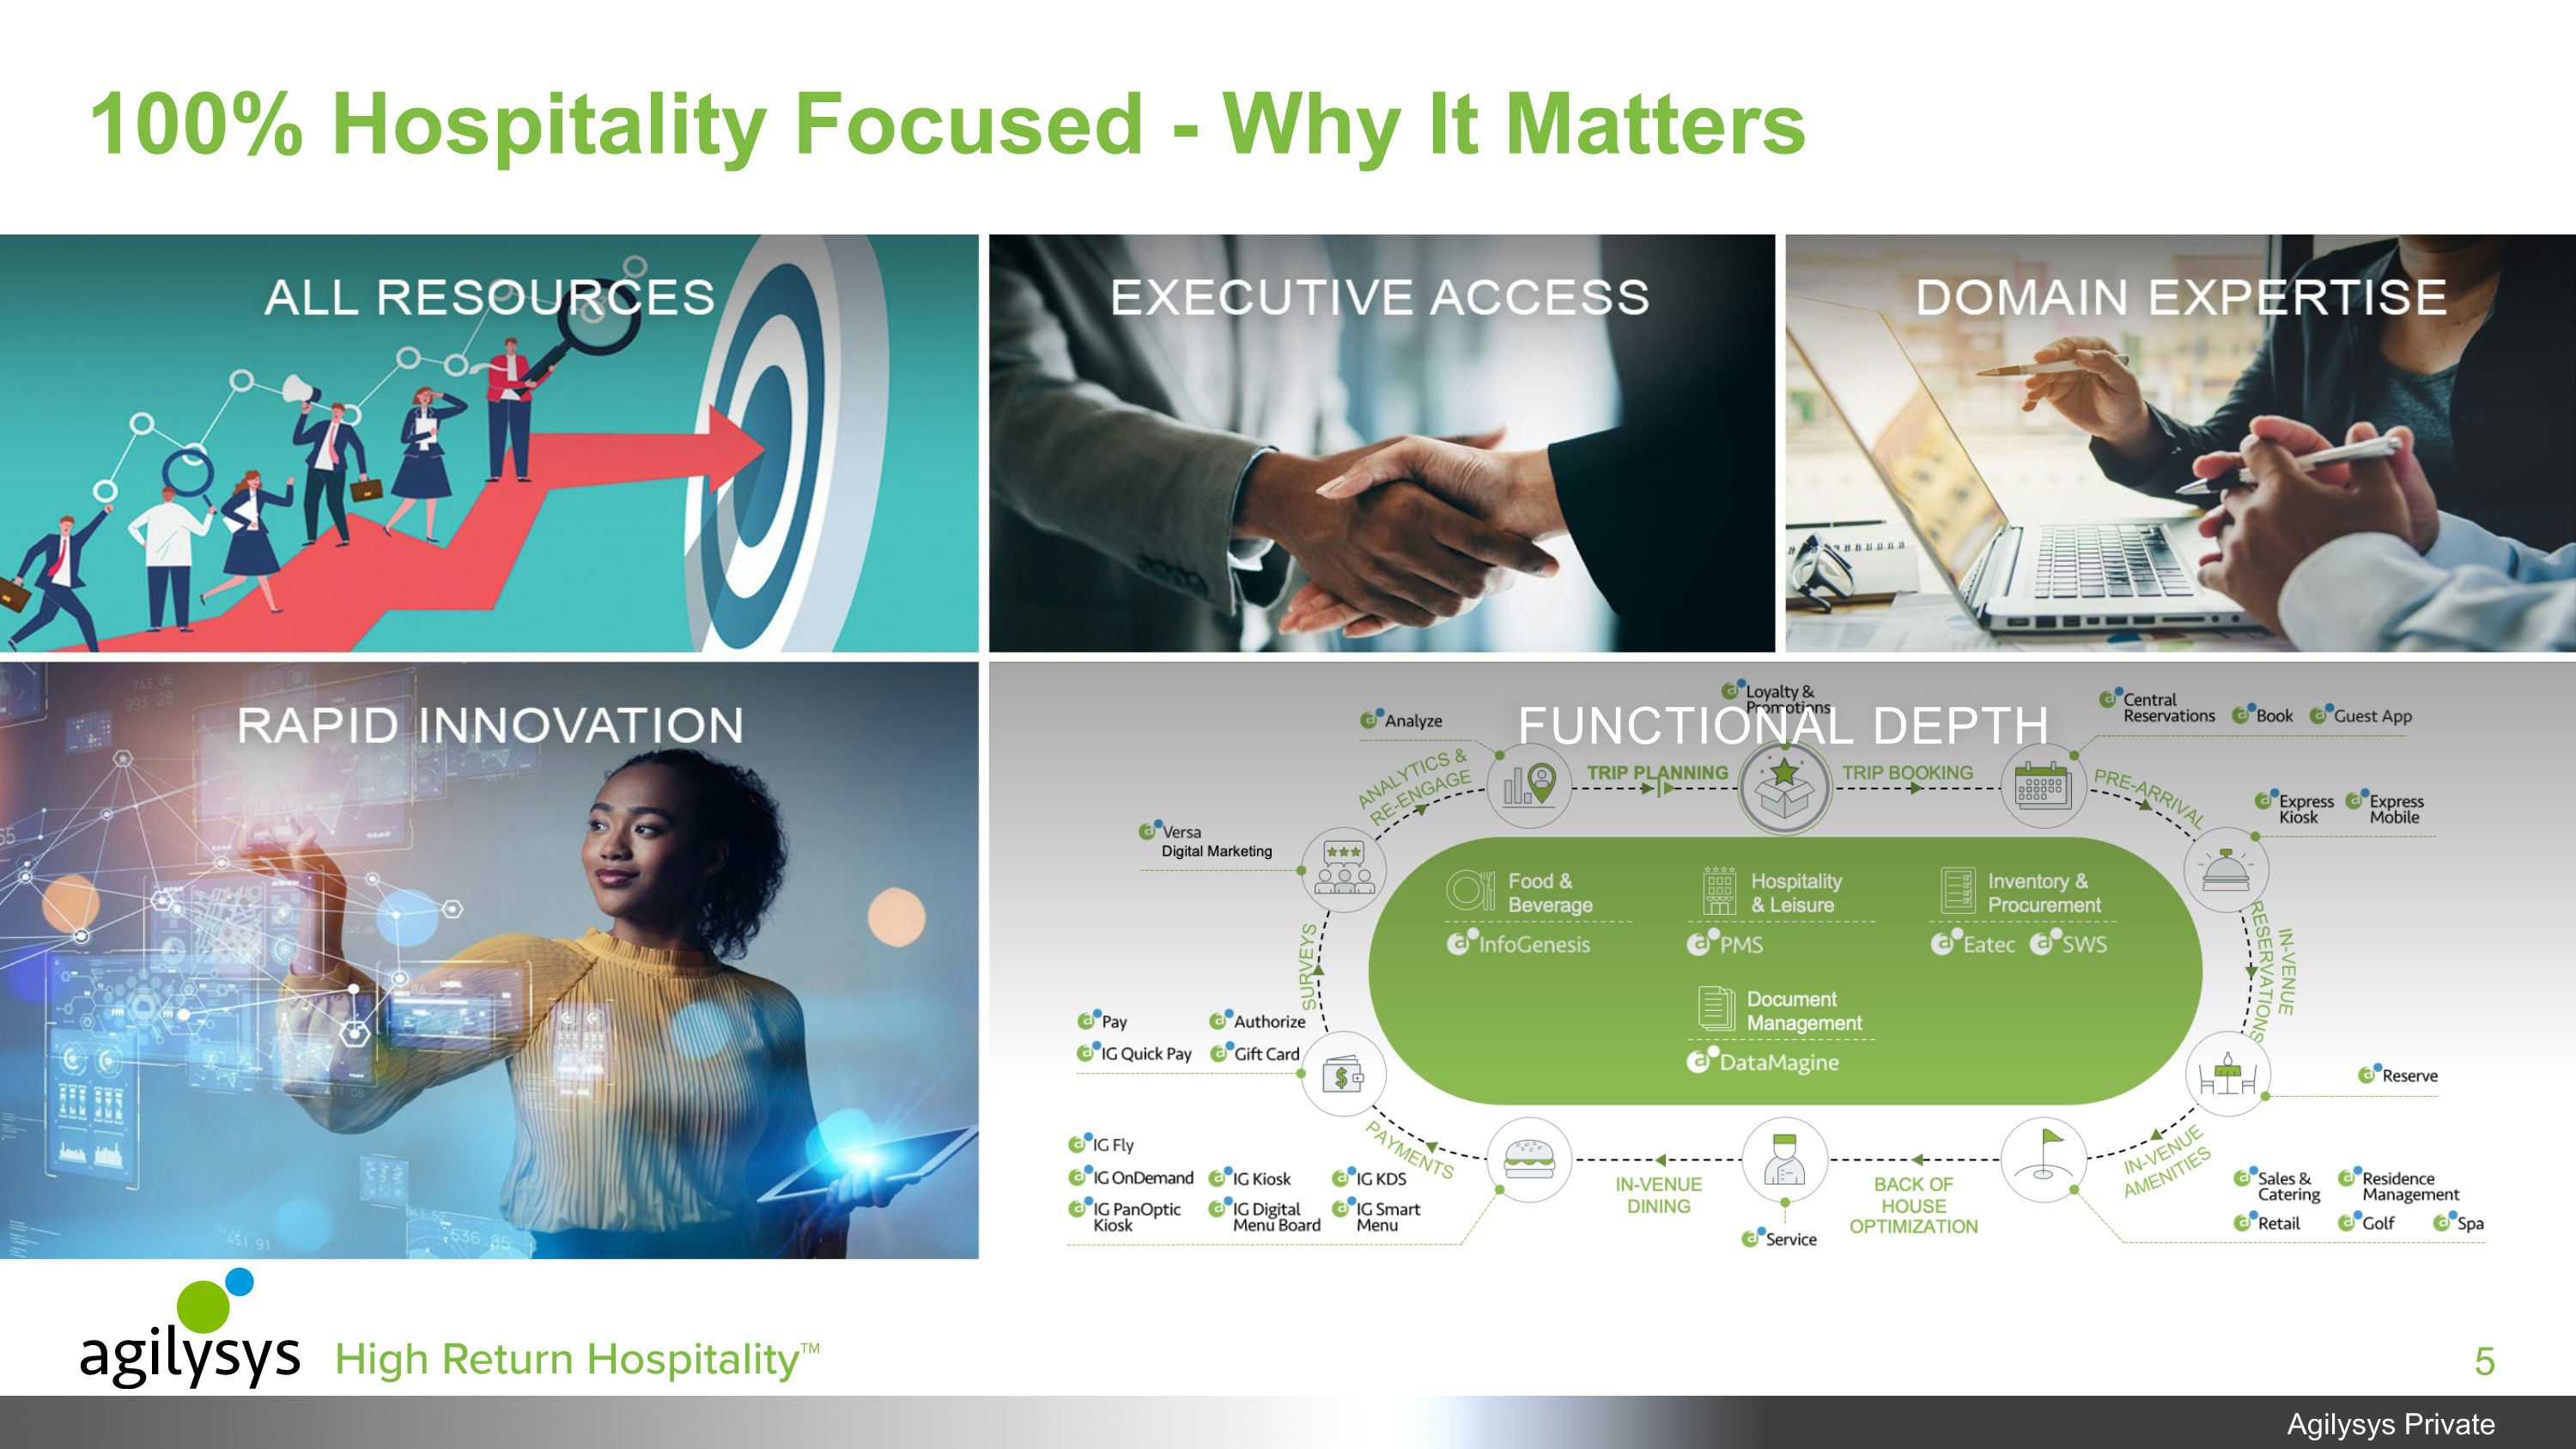
100% Hospitality Focused - Why It Matters FUNCTIONAL DEPTH

Obsessively Customer-Centric - Why It Matters
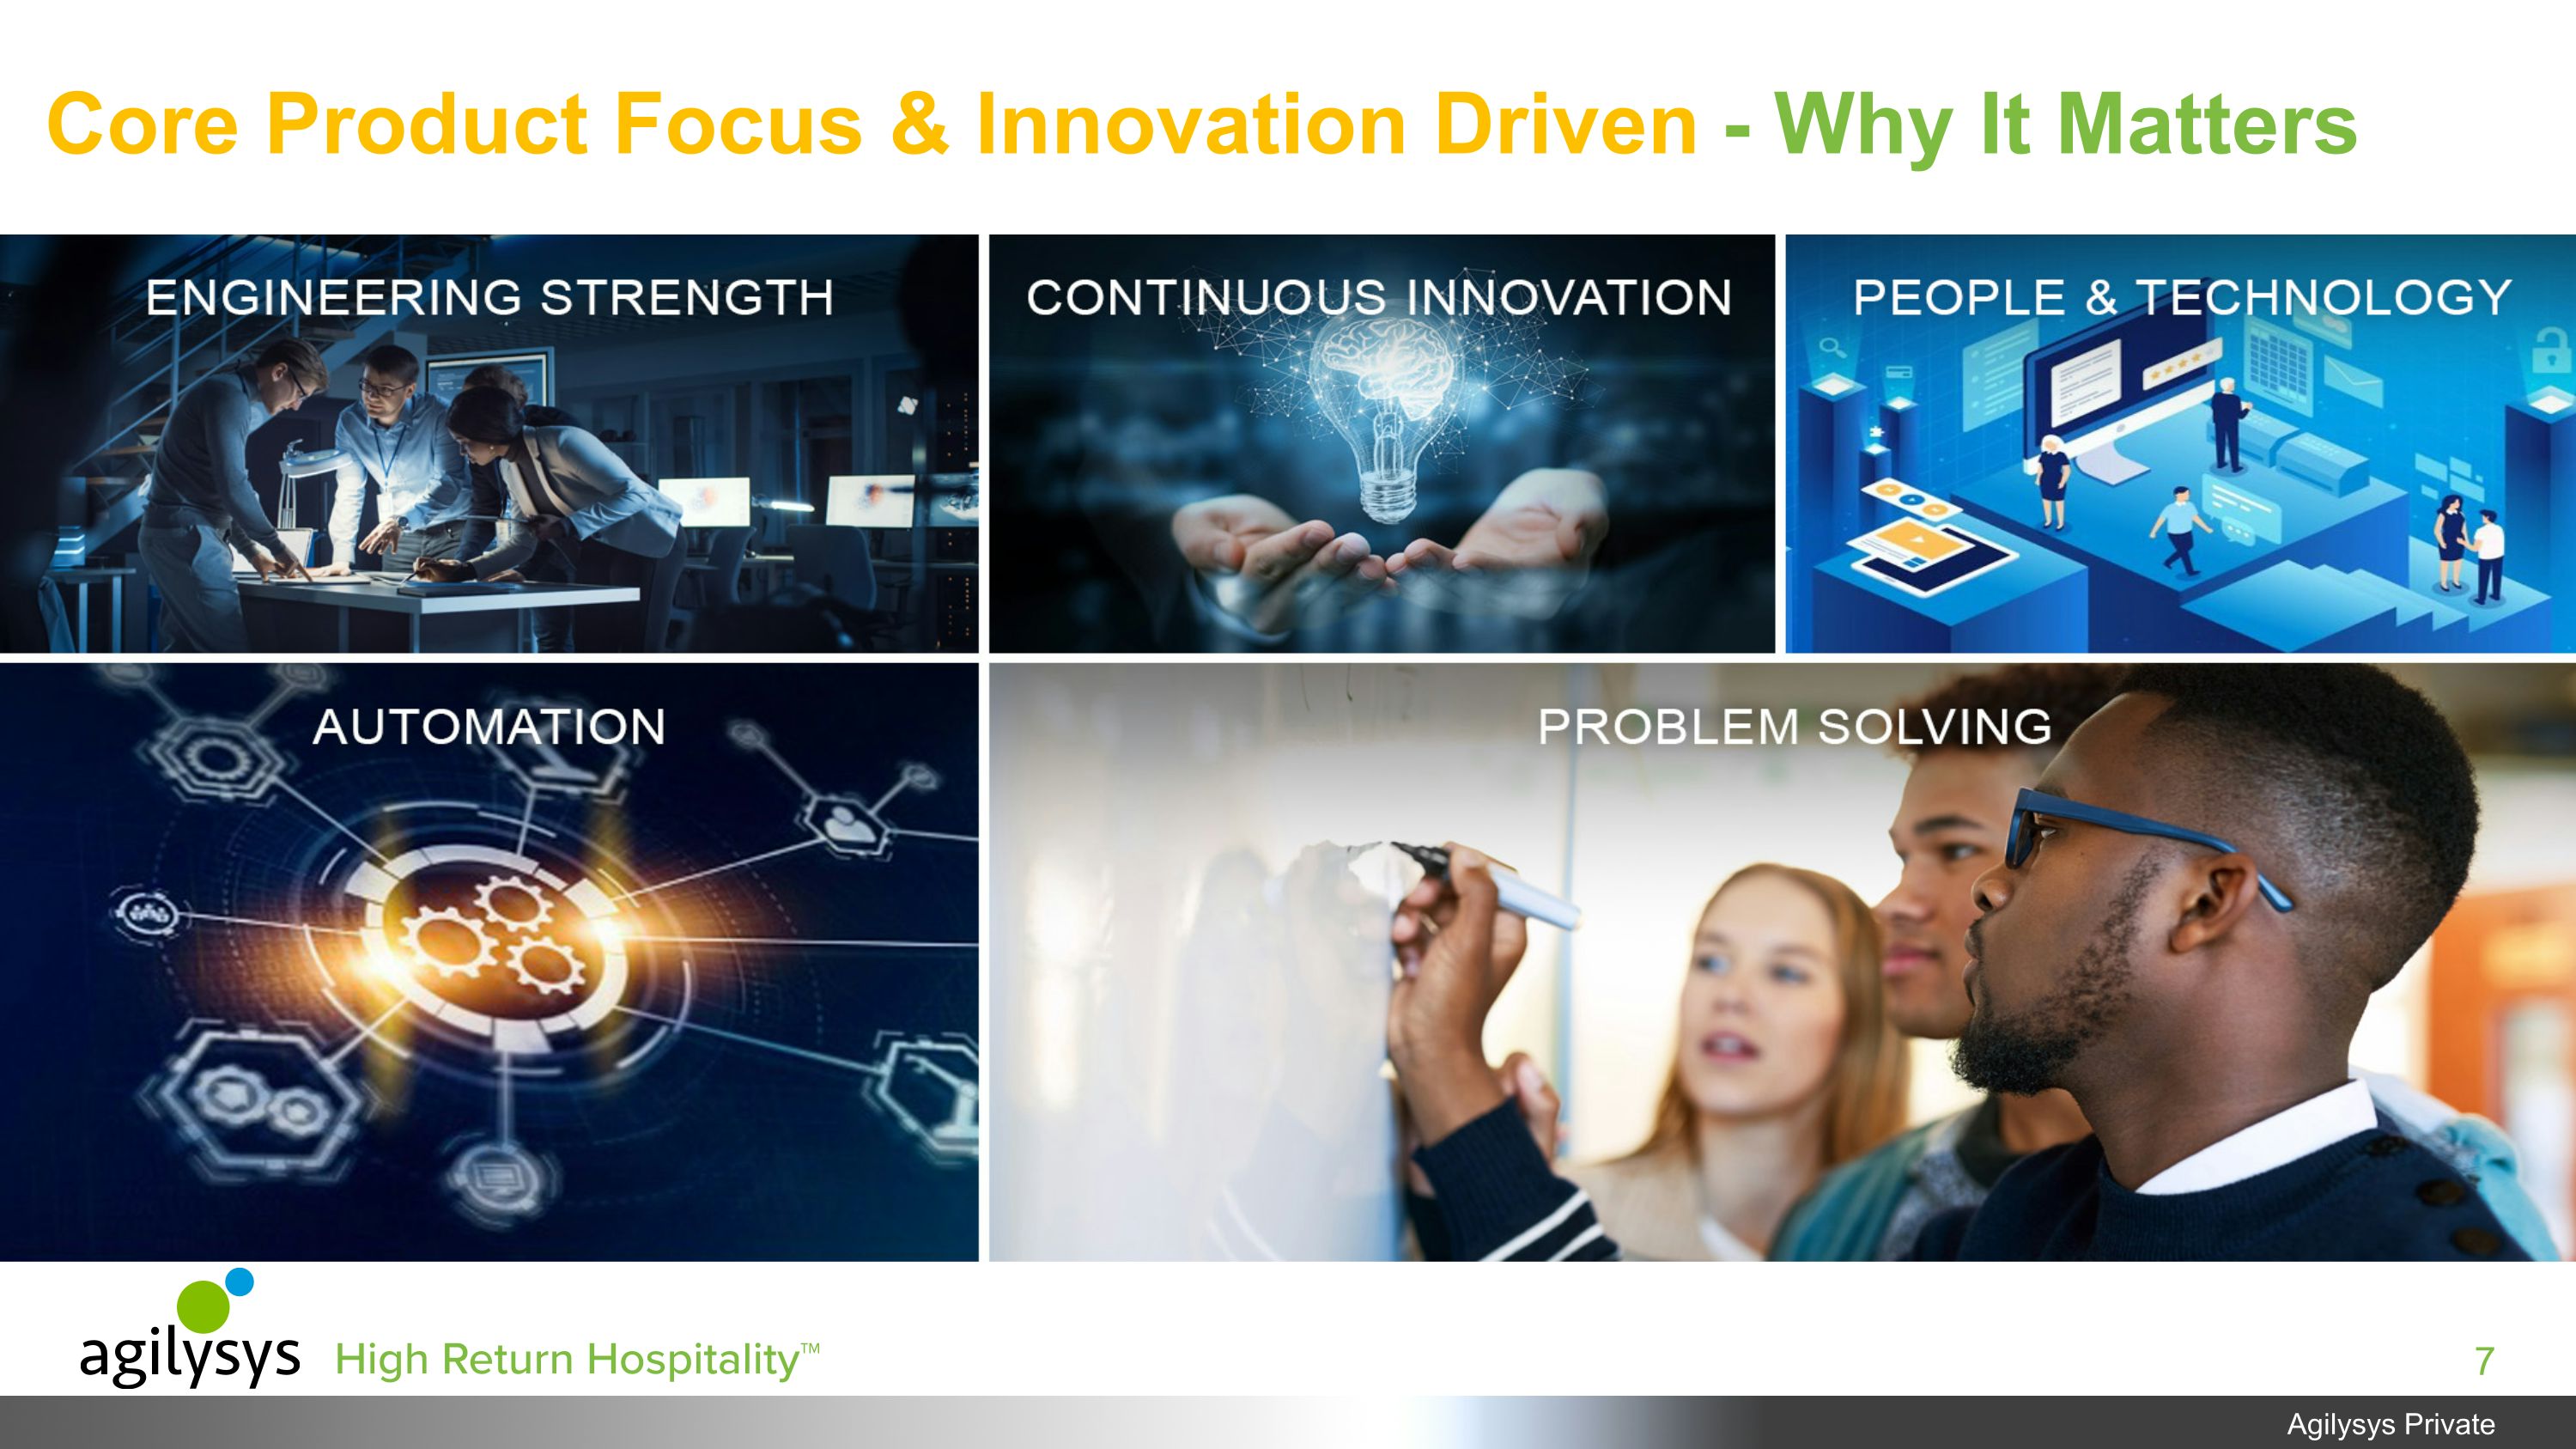
Core Product Focus & Innovation Driven - Why It Matters
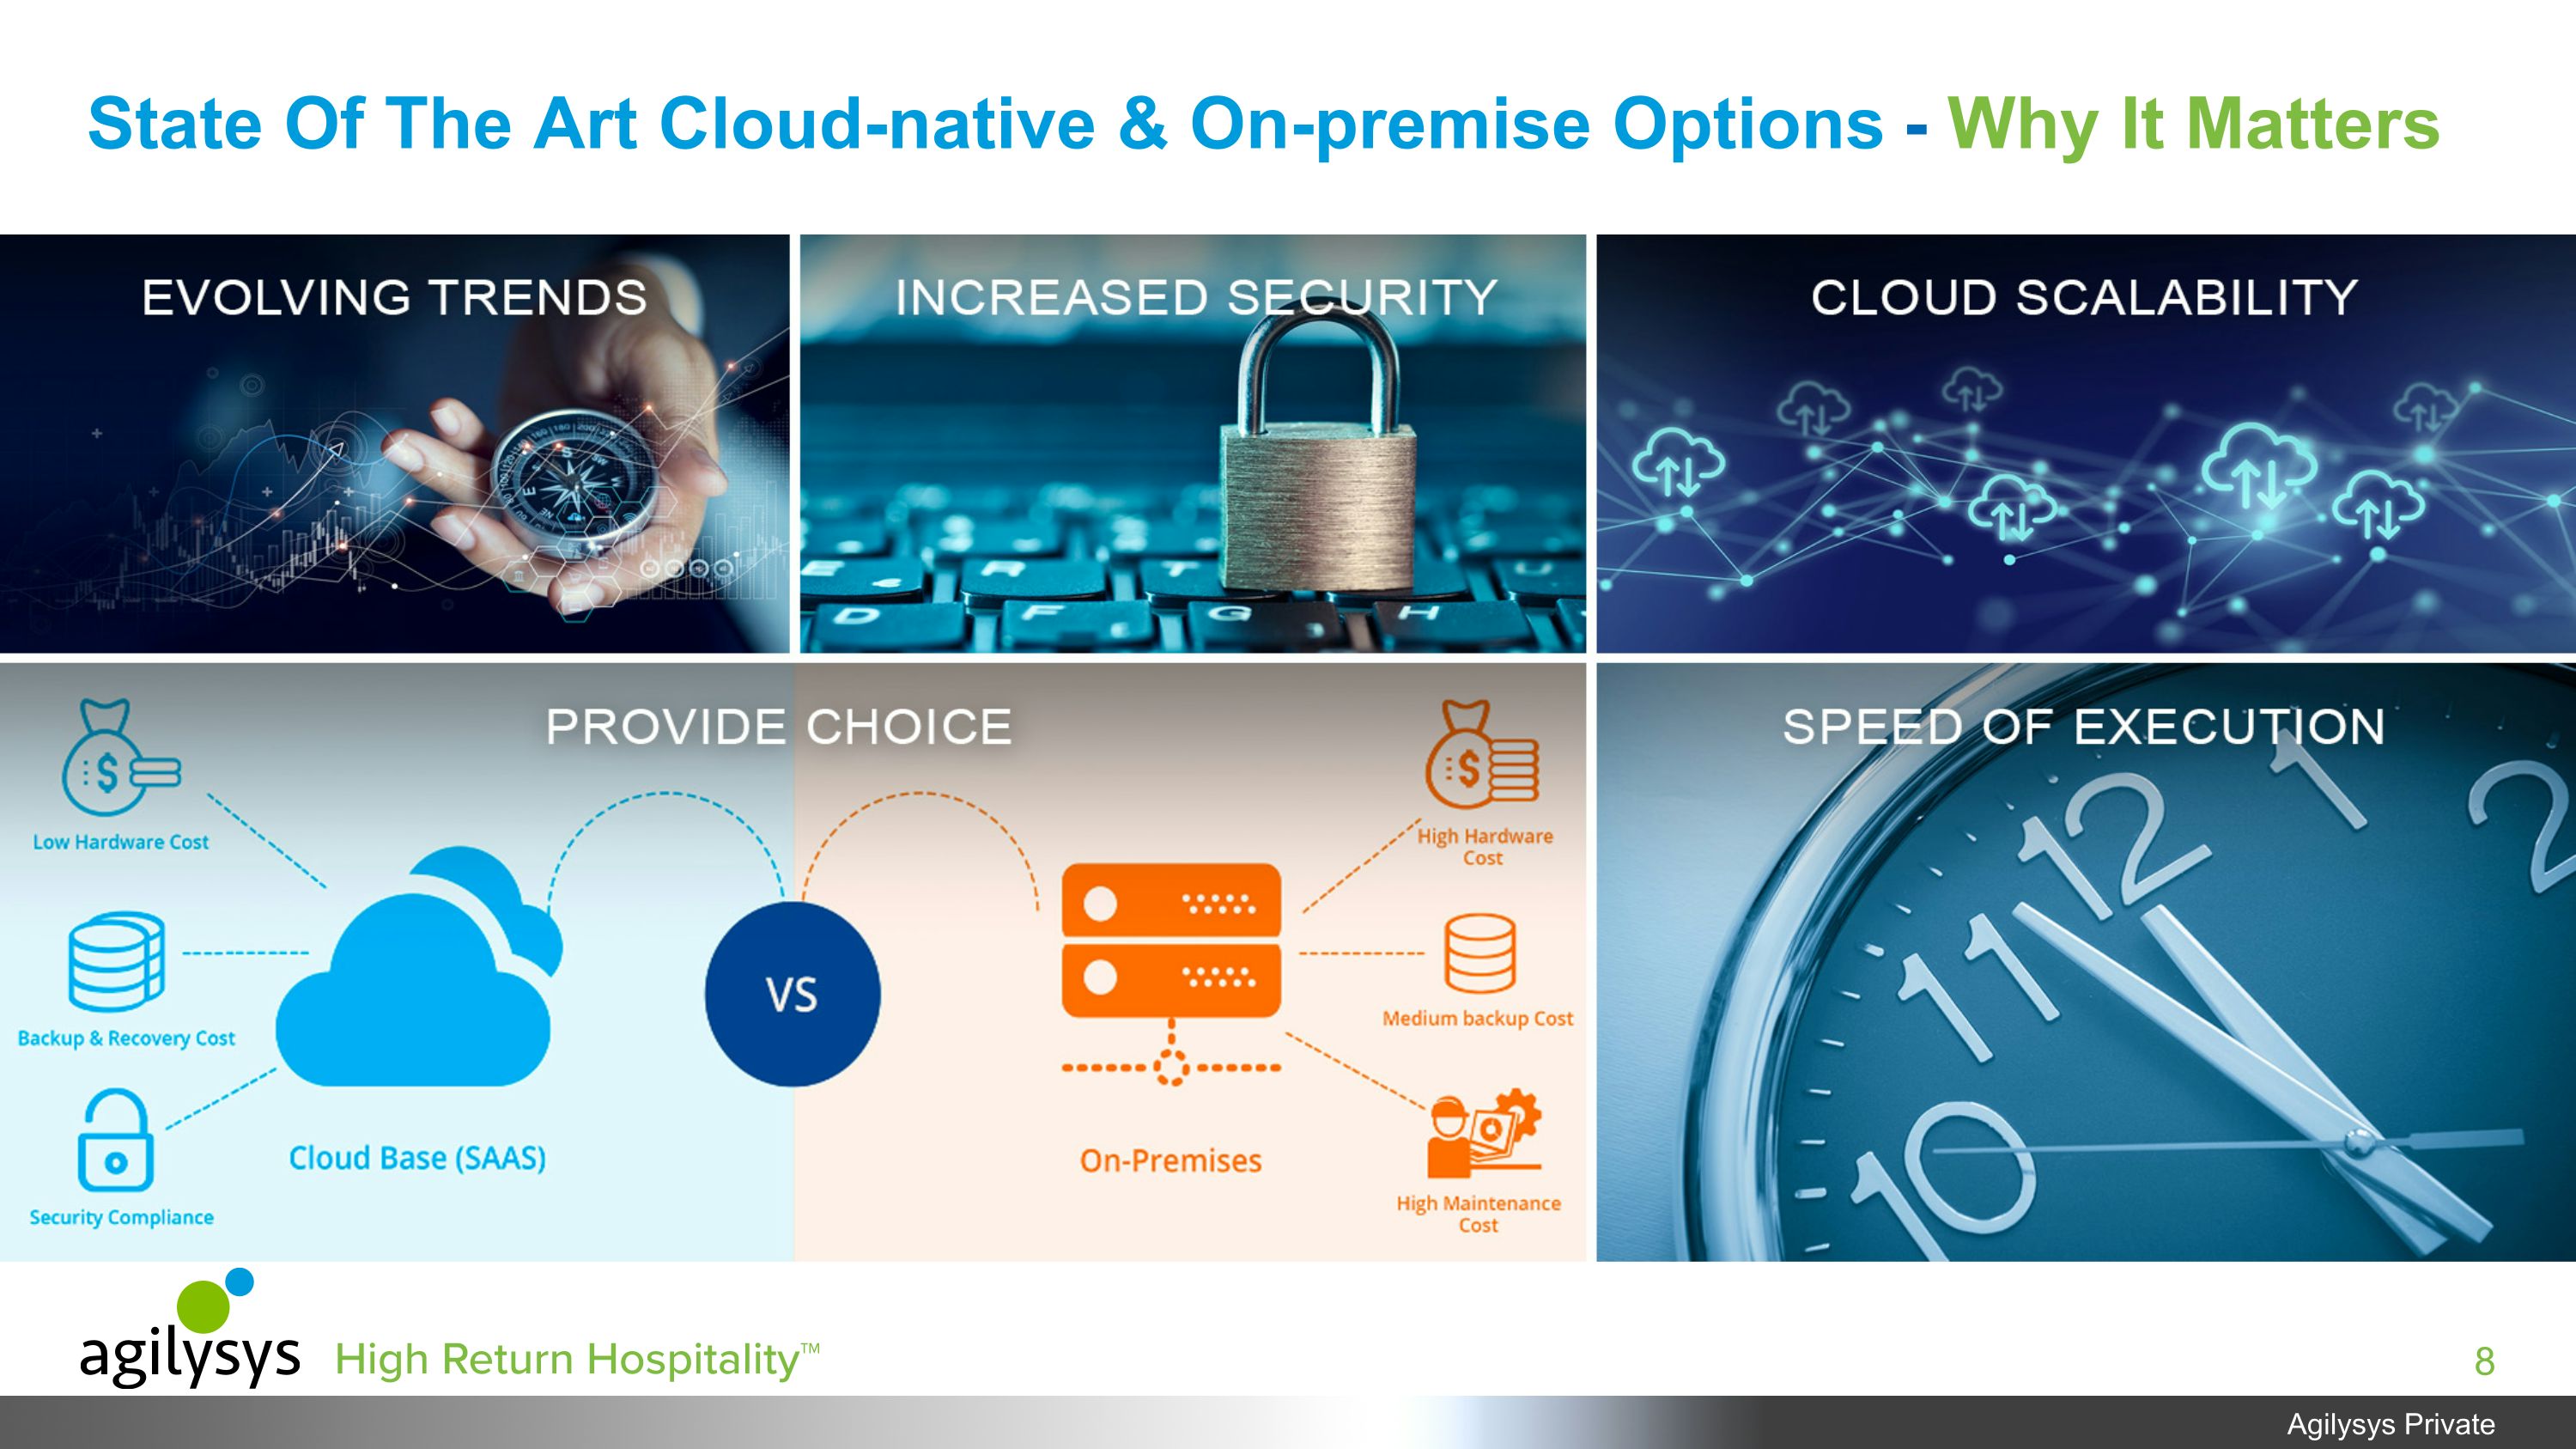
State Of The Art Cloud-native & On-premise Options - Why It Matters
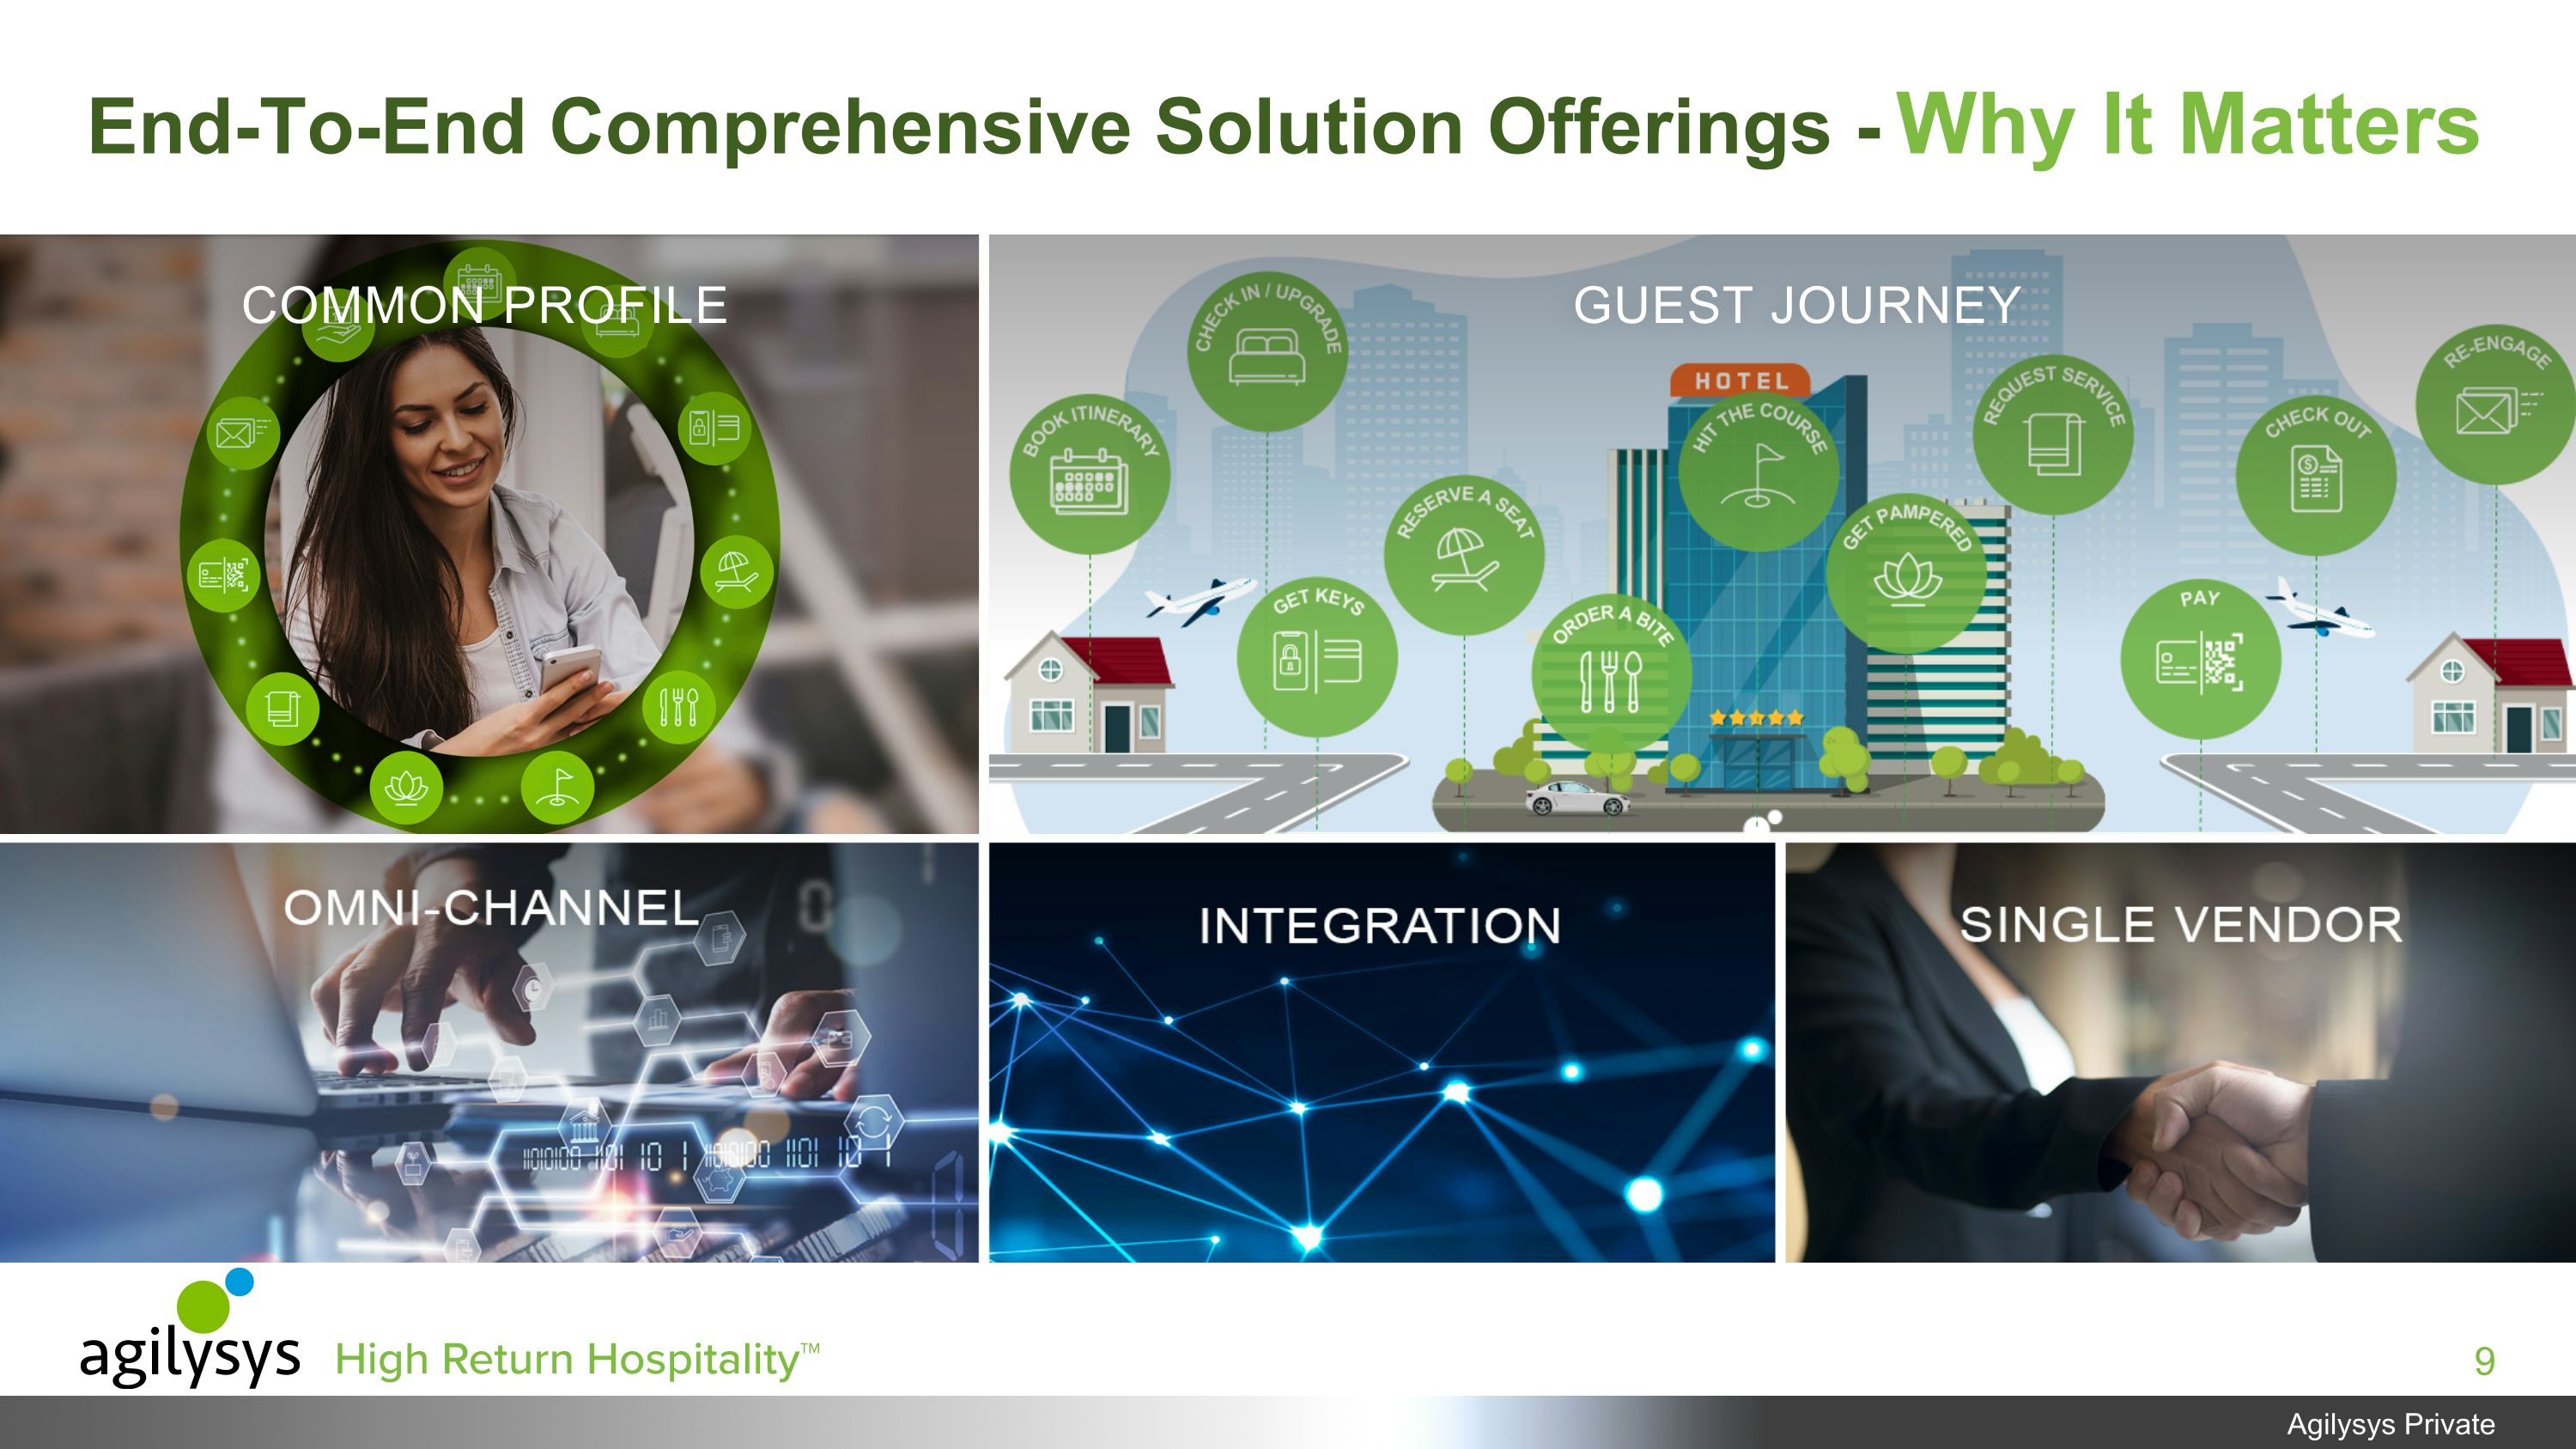
End-To-End Comprehensive Solution Offerings - Why It Matters GUEST JOURNEY COMMON PROFILE
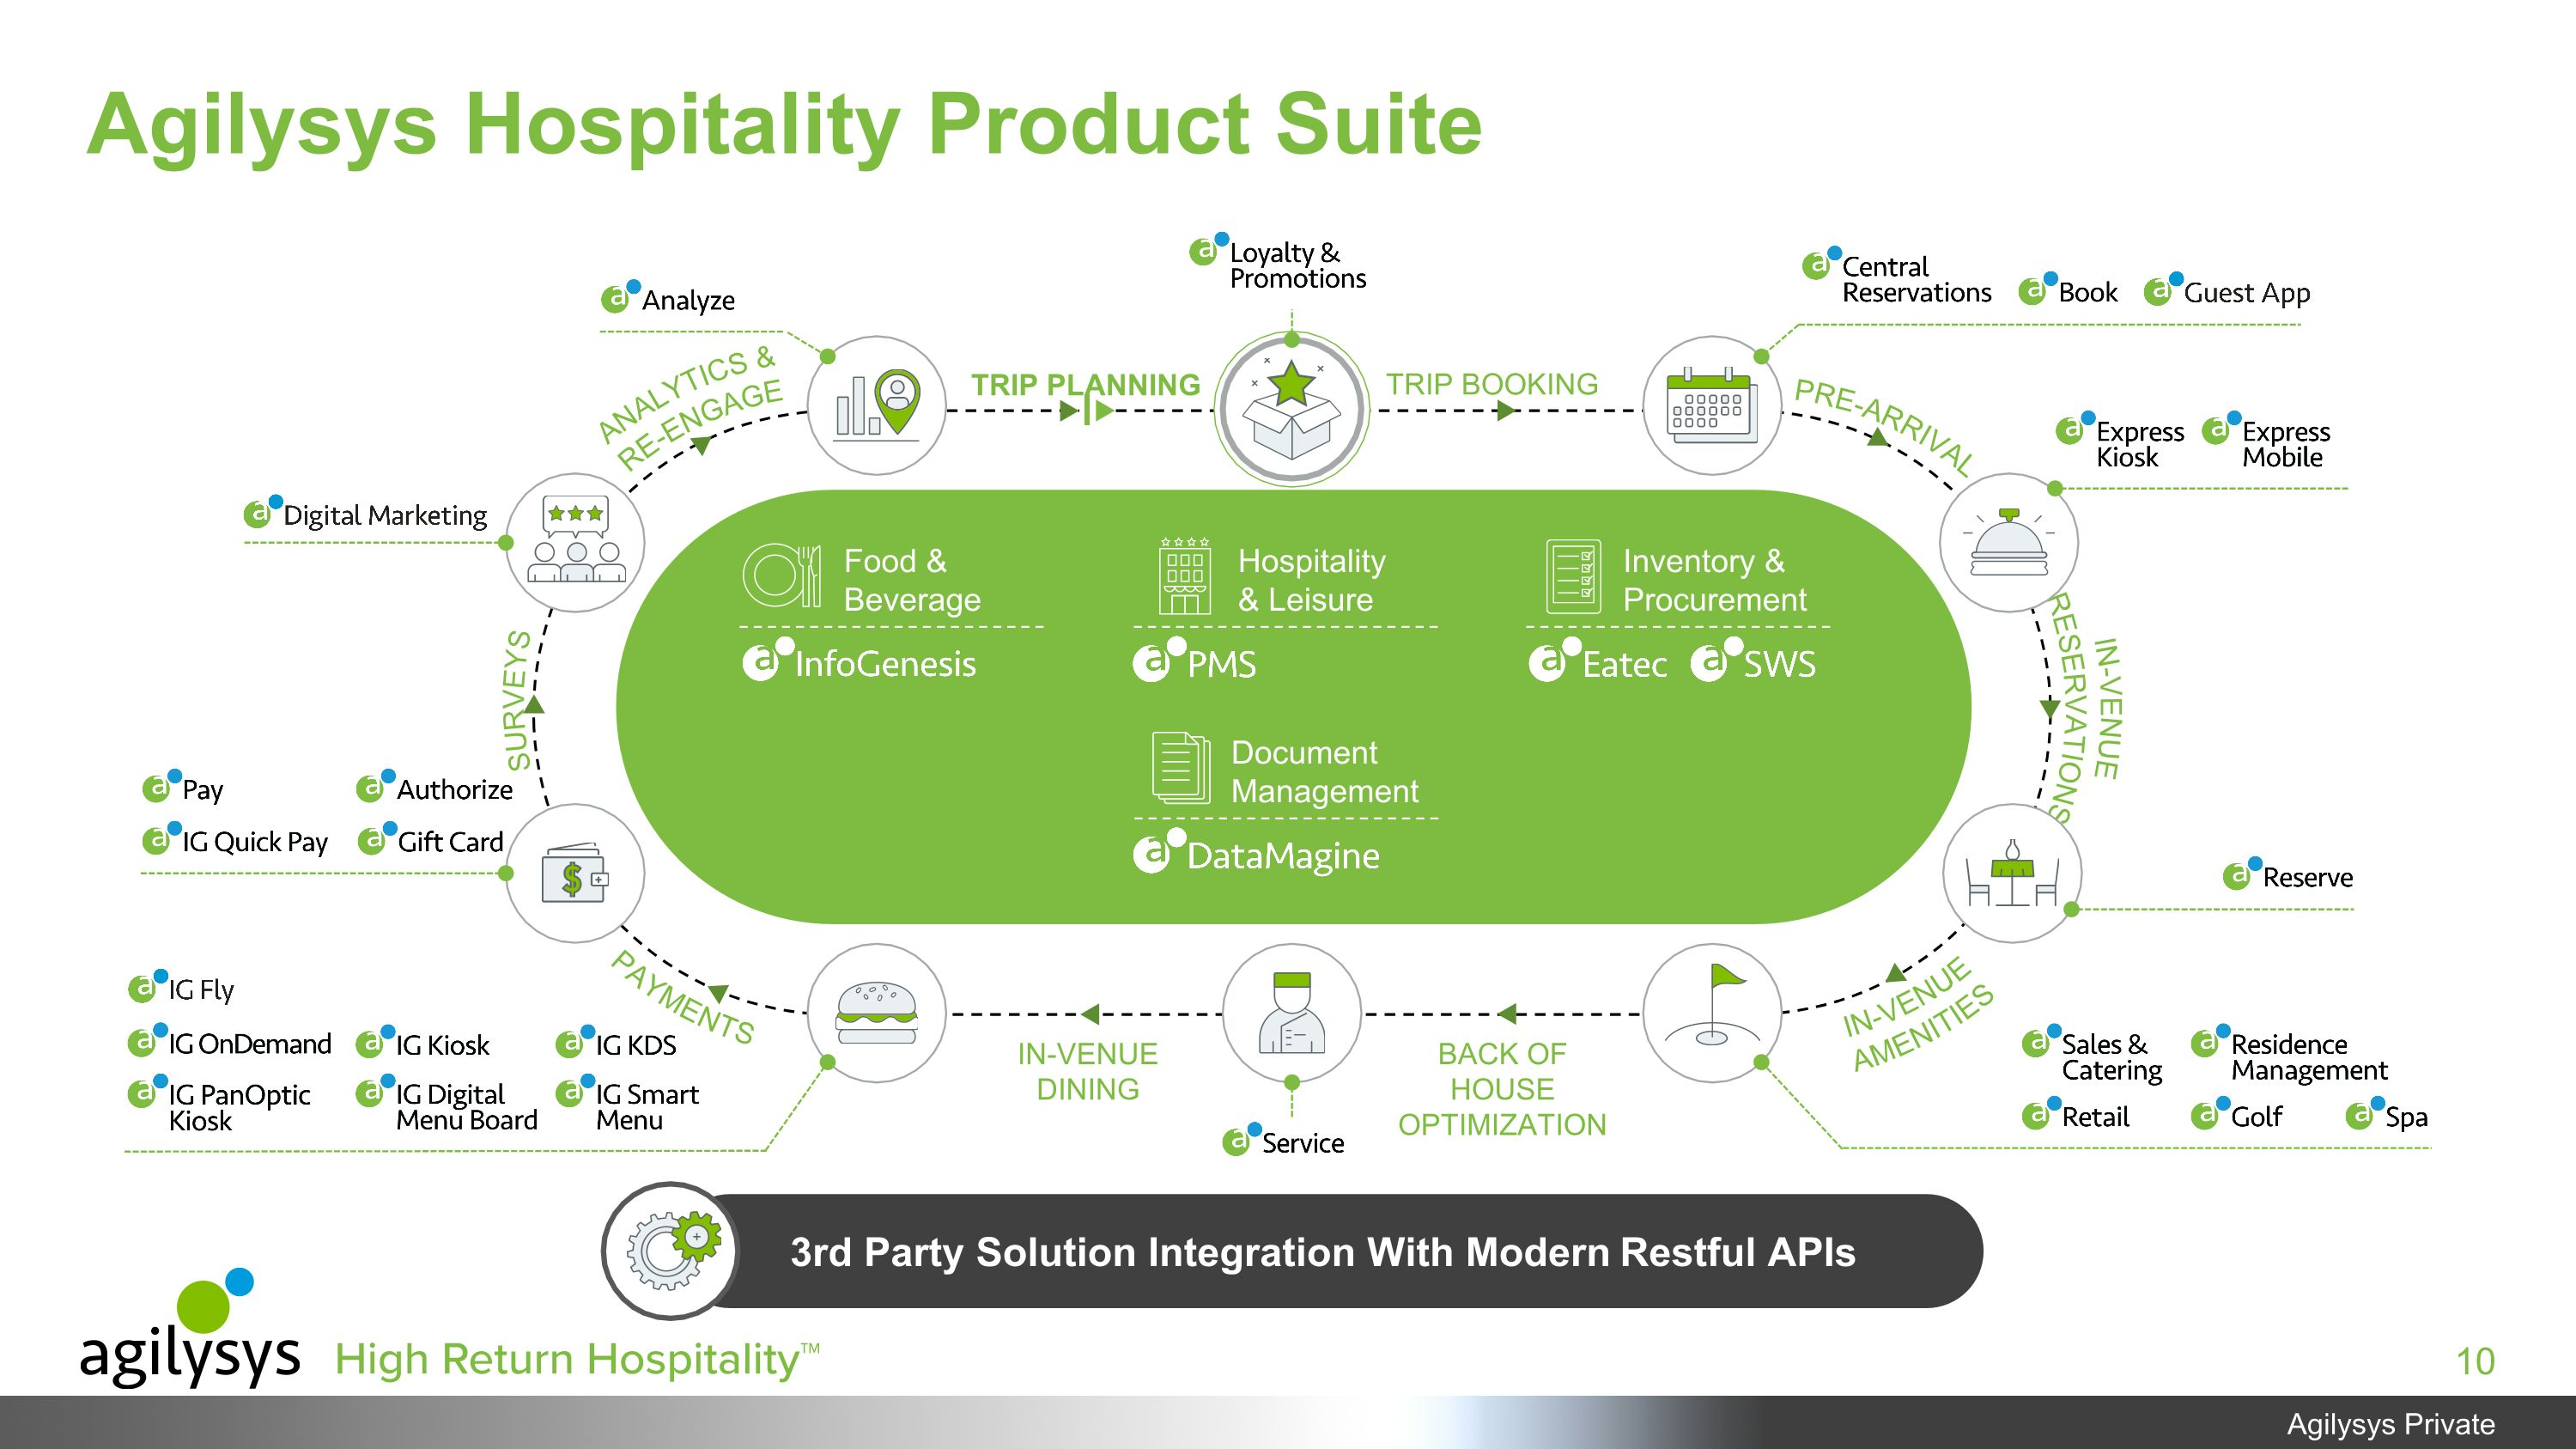
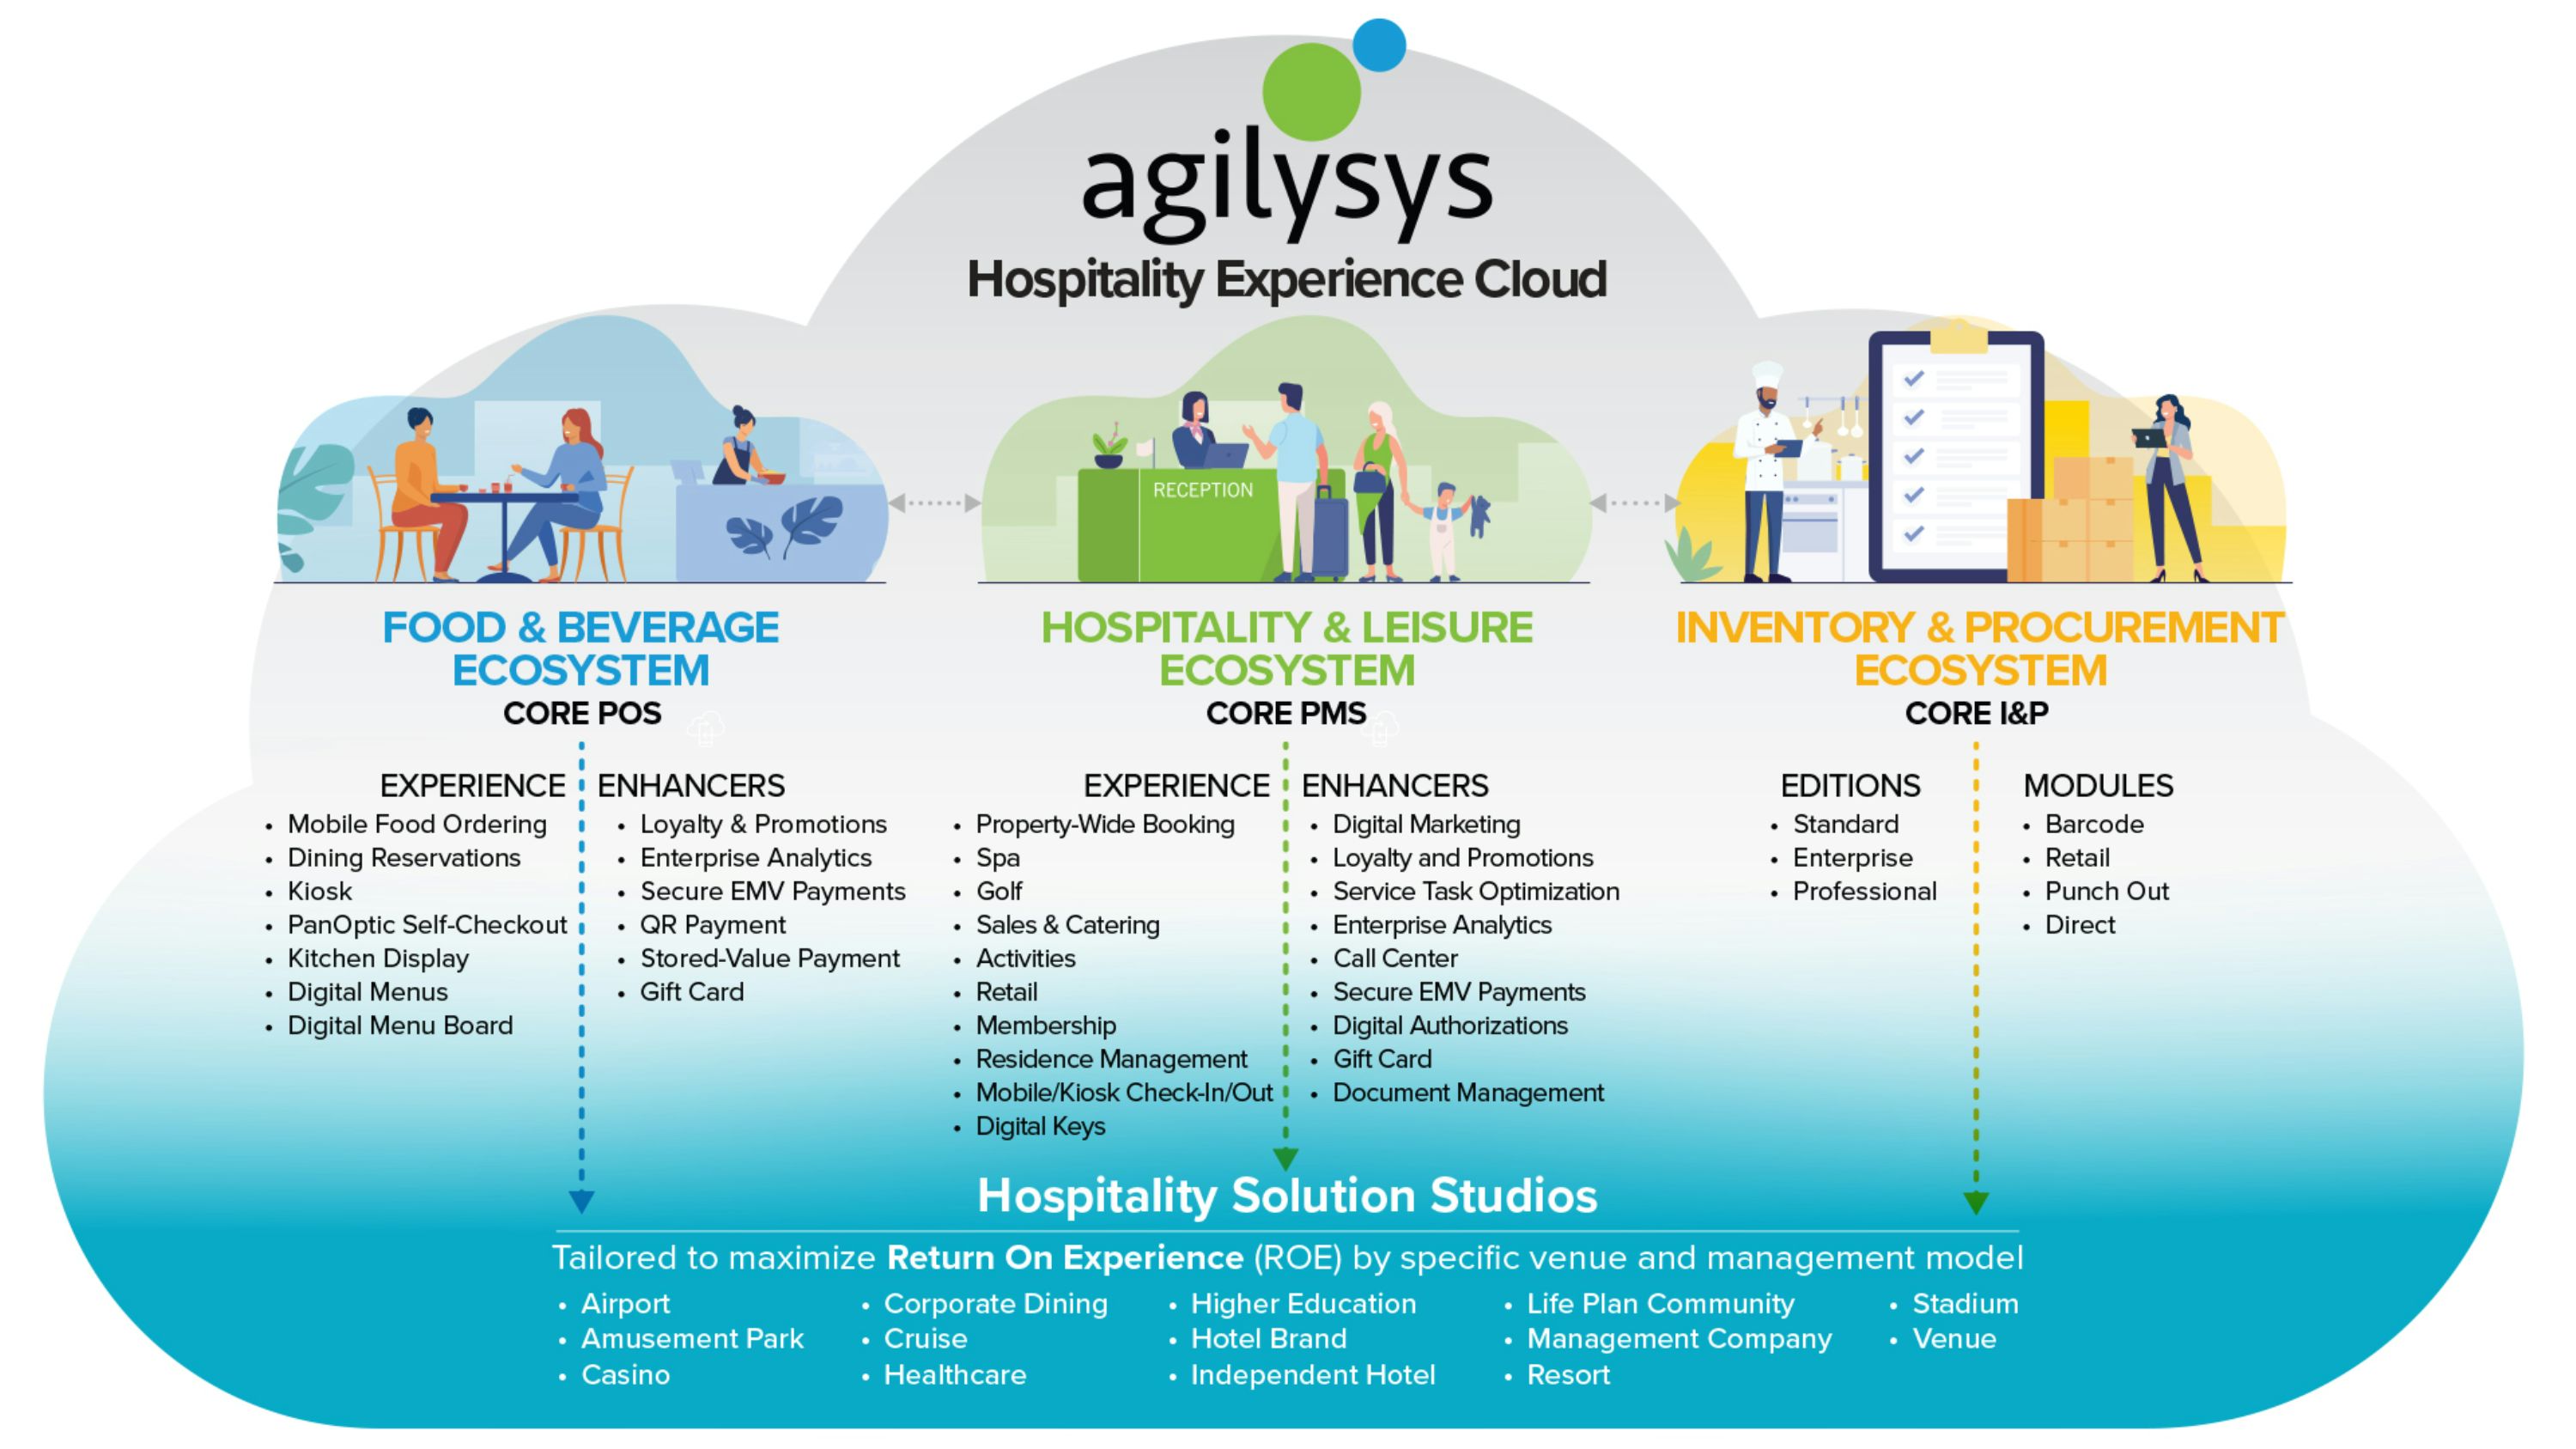
Agilysys Hospitality Product Suite IN-VENUE RESERVATIONS IN-VENUE�AMENITIES SURVEYS PAYMENTS PRE-ARRIVAL ANALYTICS &�RE-ENGAGE TRIP BOOKING IN-VENUE DINING BACK OF HOUSE�OPTIMIZATION TRIP PLANNING Food & Beverage Hospitality & Leisure Inventory &�Procurement Document Management 3rd Party Solution Integration With Modern Restful APIs
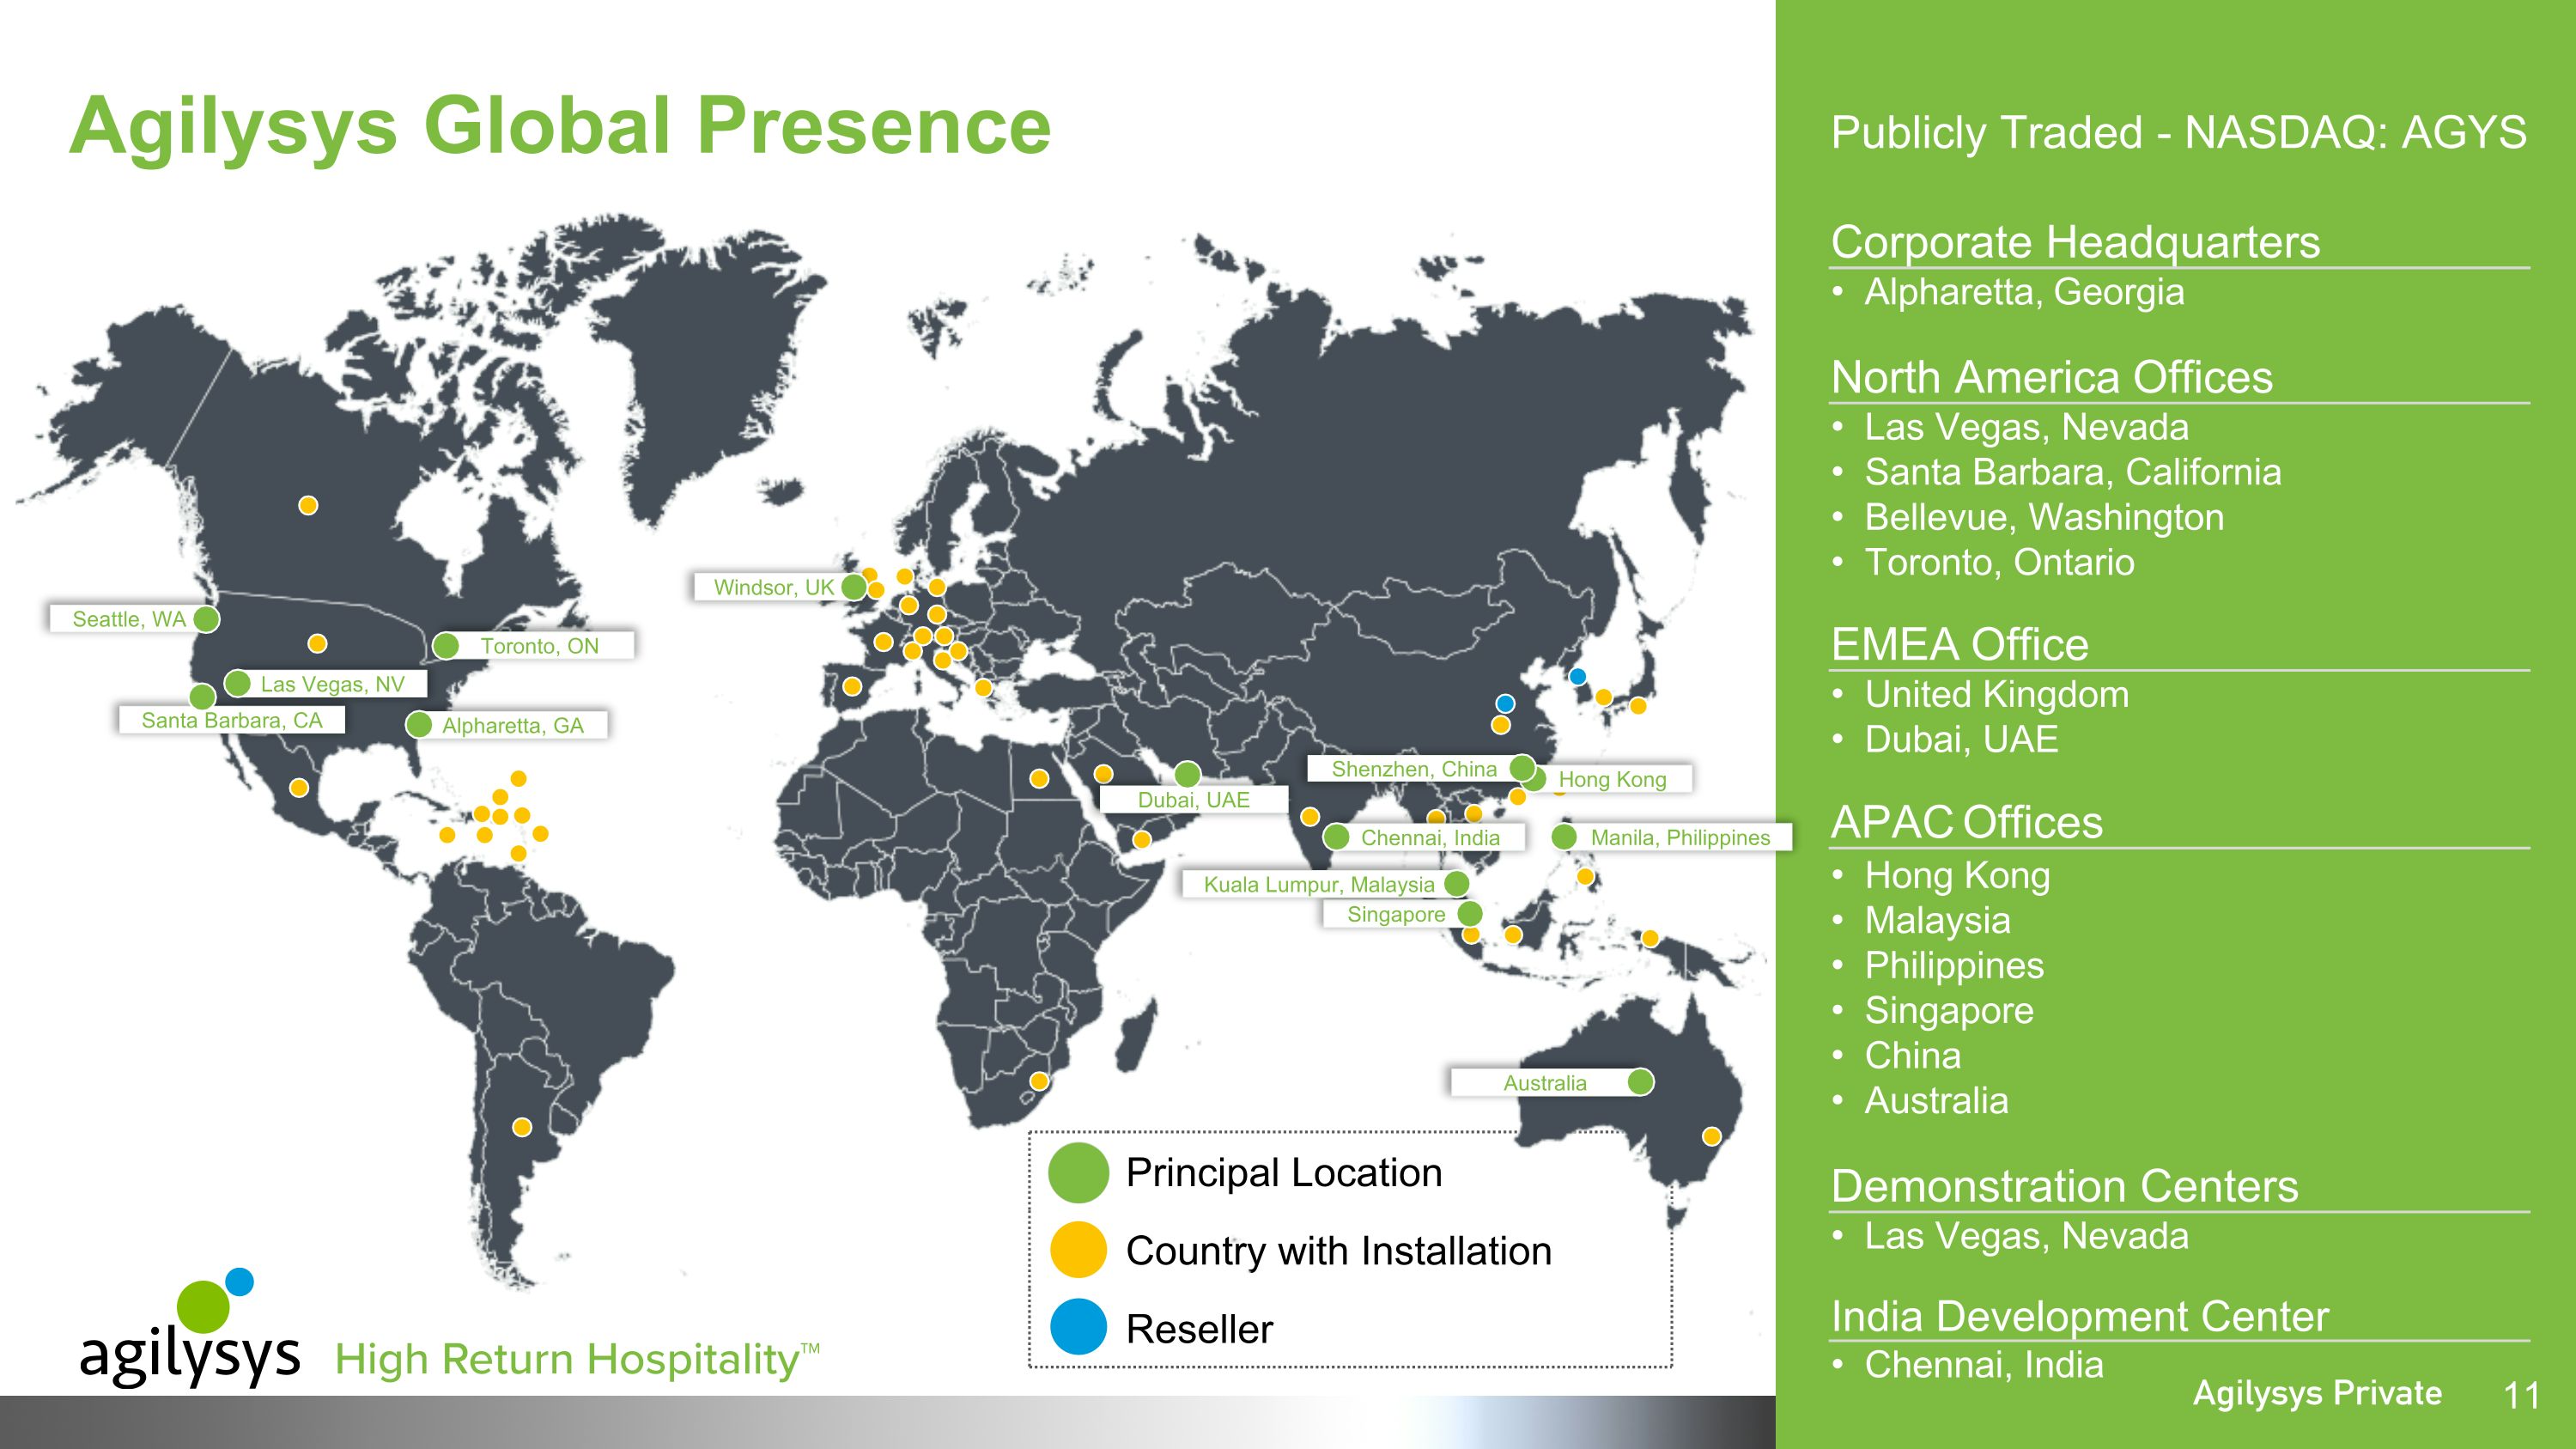
Agilysys Global Presence Principal Location Country with Installation Reseller Santa Barbara, CA Seattle, WA Las Vegas, NV Alpharetta, GA Windsor, UK Hong Kong Manila, Philippines Singapore Kuala Lumpur, Malaysia Chennai, India Shenzhen, China Australia Toronto, ON Publicly Traded - NASDAQ: AGYS Corporate Headquarters Alpharetta, Georgia North America Offices Las Vegas, Nevada Santa Barbara, California Bellevue, Washington Toronto, Ontario EMEA Office United Kingdom Dubai, UAE APAC Offices Hong Kong Malaysia Philippines Singapore China Australia Demonstration Centers Las Vegas, Nevada India Development Center Chennai, India Dubai, UAE
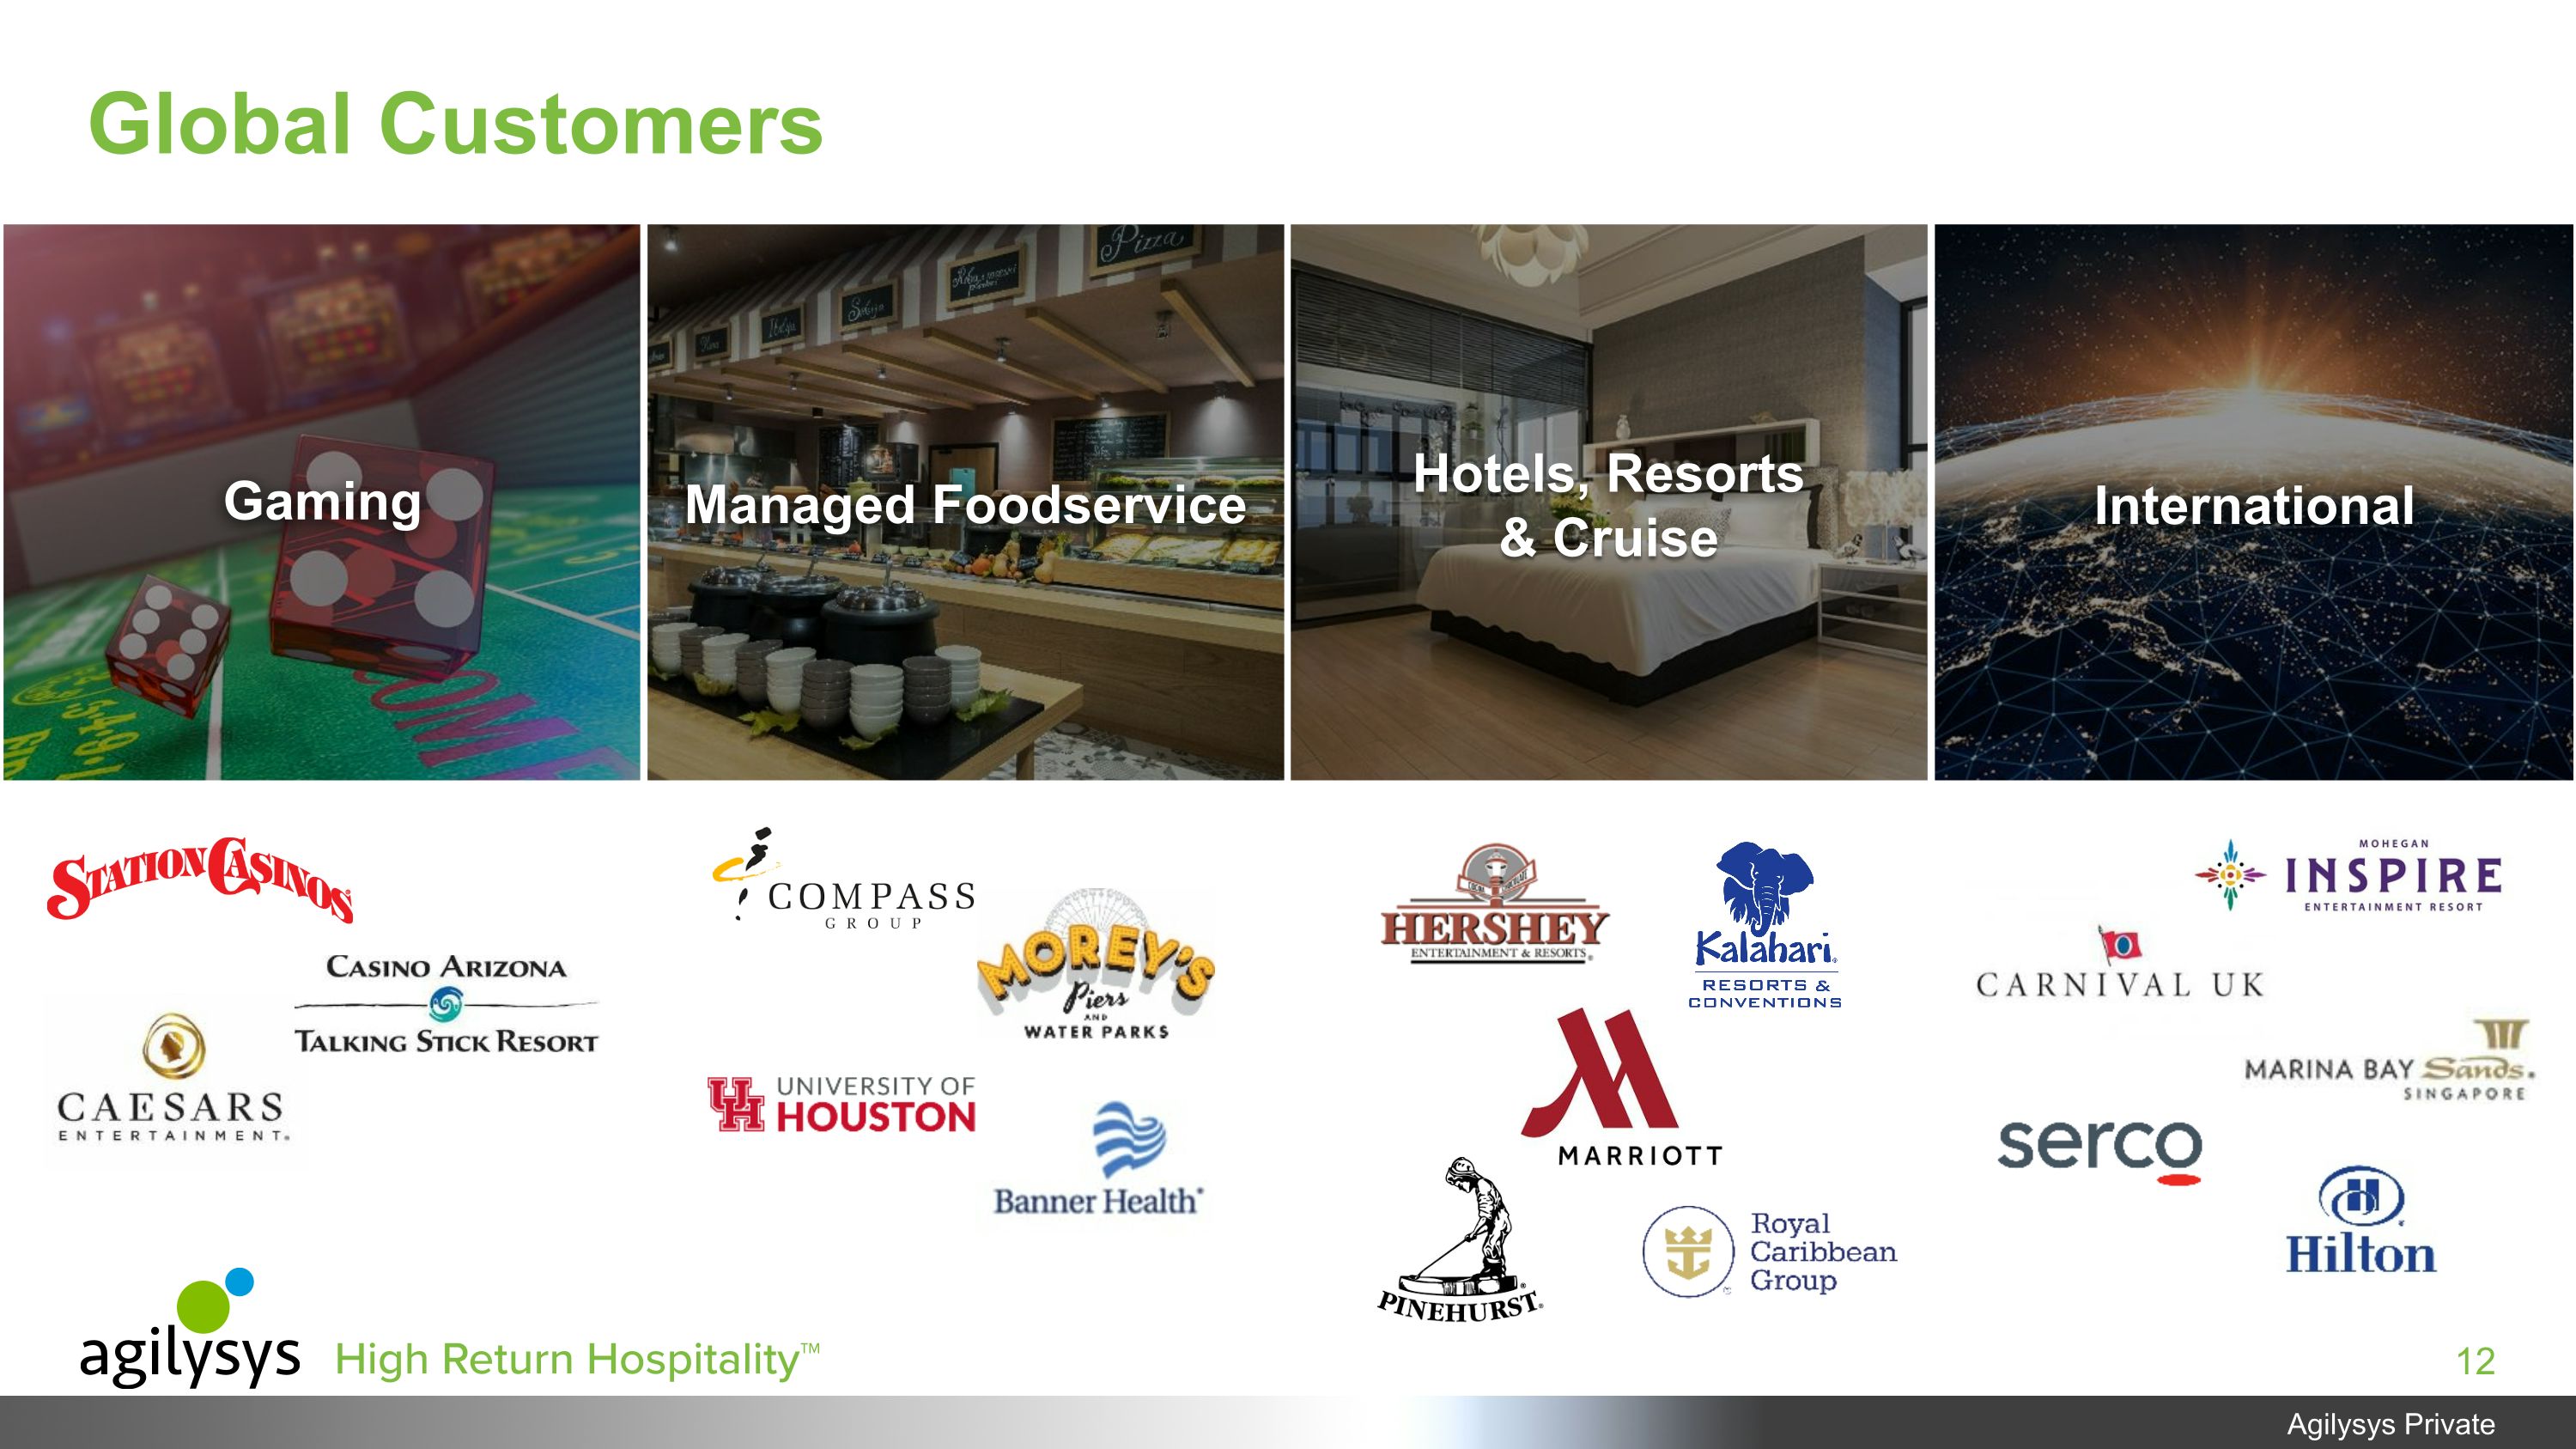
Global Customers Managed Foodservice Gaming Hotels, Resorts �& Cruise International
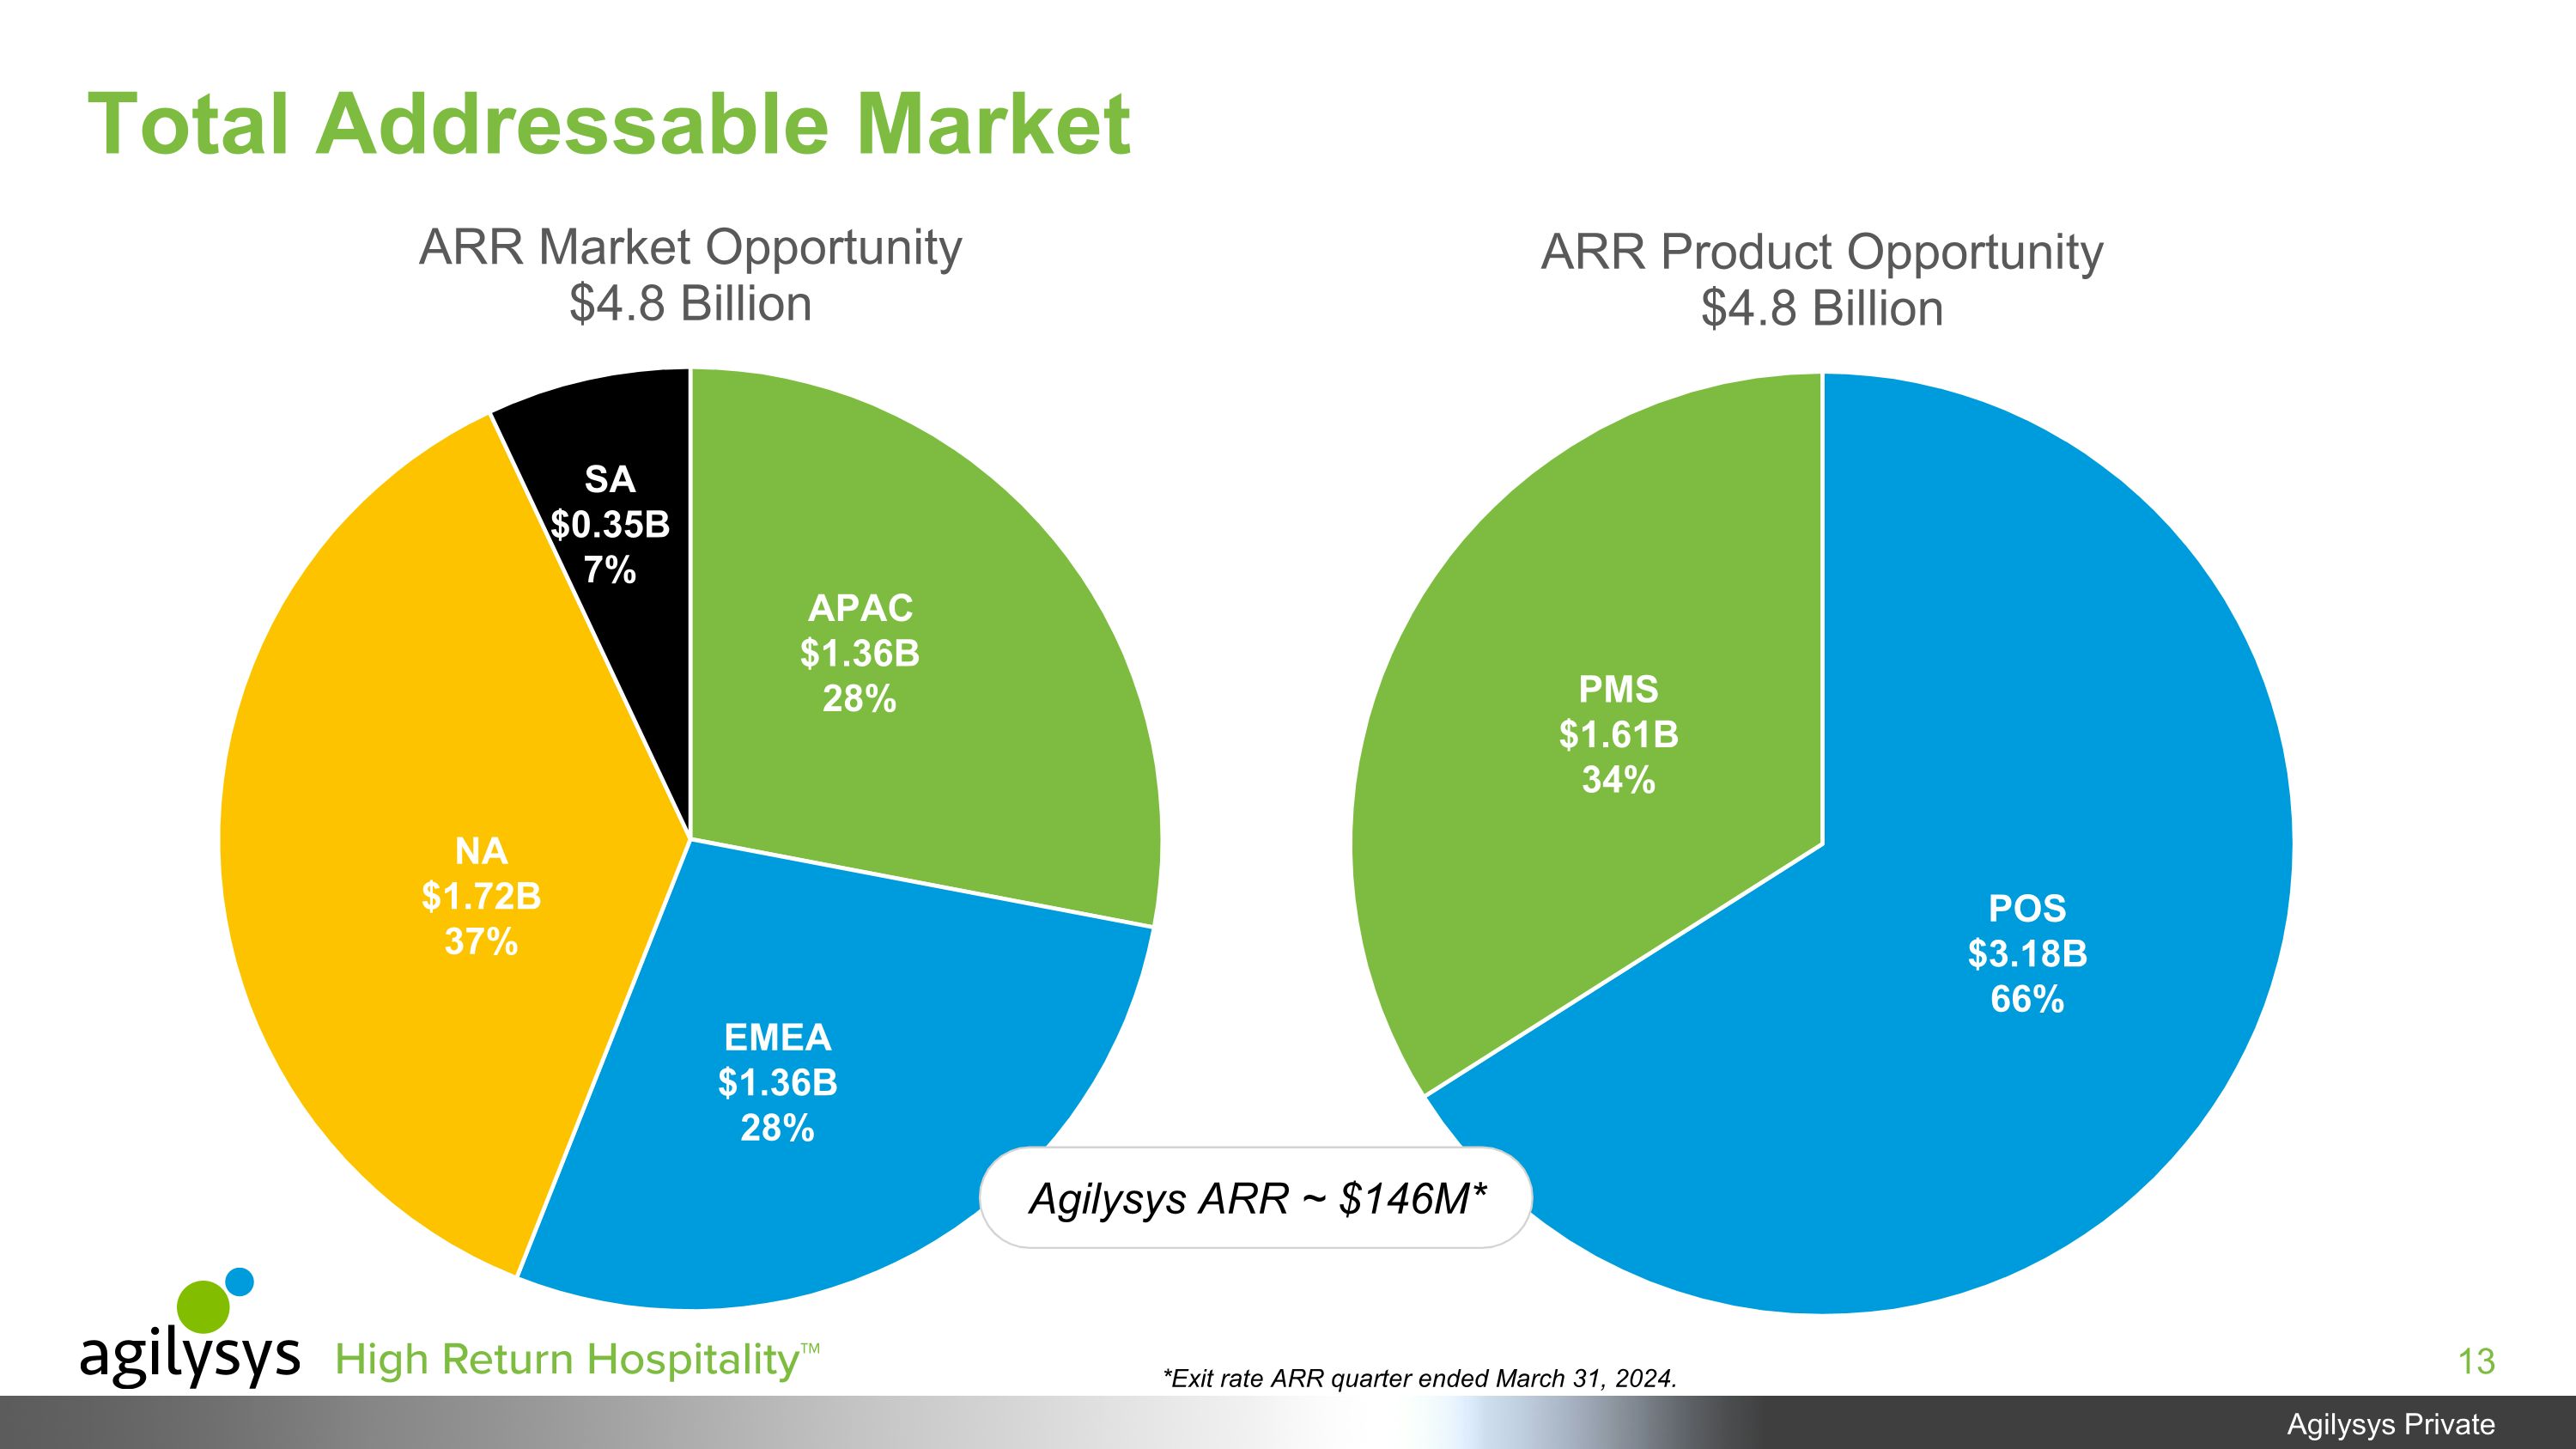
*Exit rate ARR quarter ended March 31, 2024. Total Addressable Market SA $0.35B 7% APAC $1.36B 28% NA $1.72B 37% EMEA $1.36B 28% PMS $1.61B 34% POS $3.18B 66% Agilysys ARR ~ $146M*
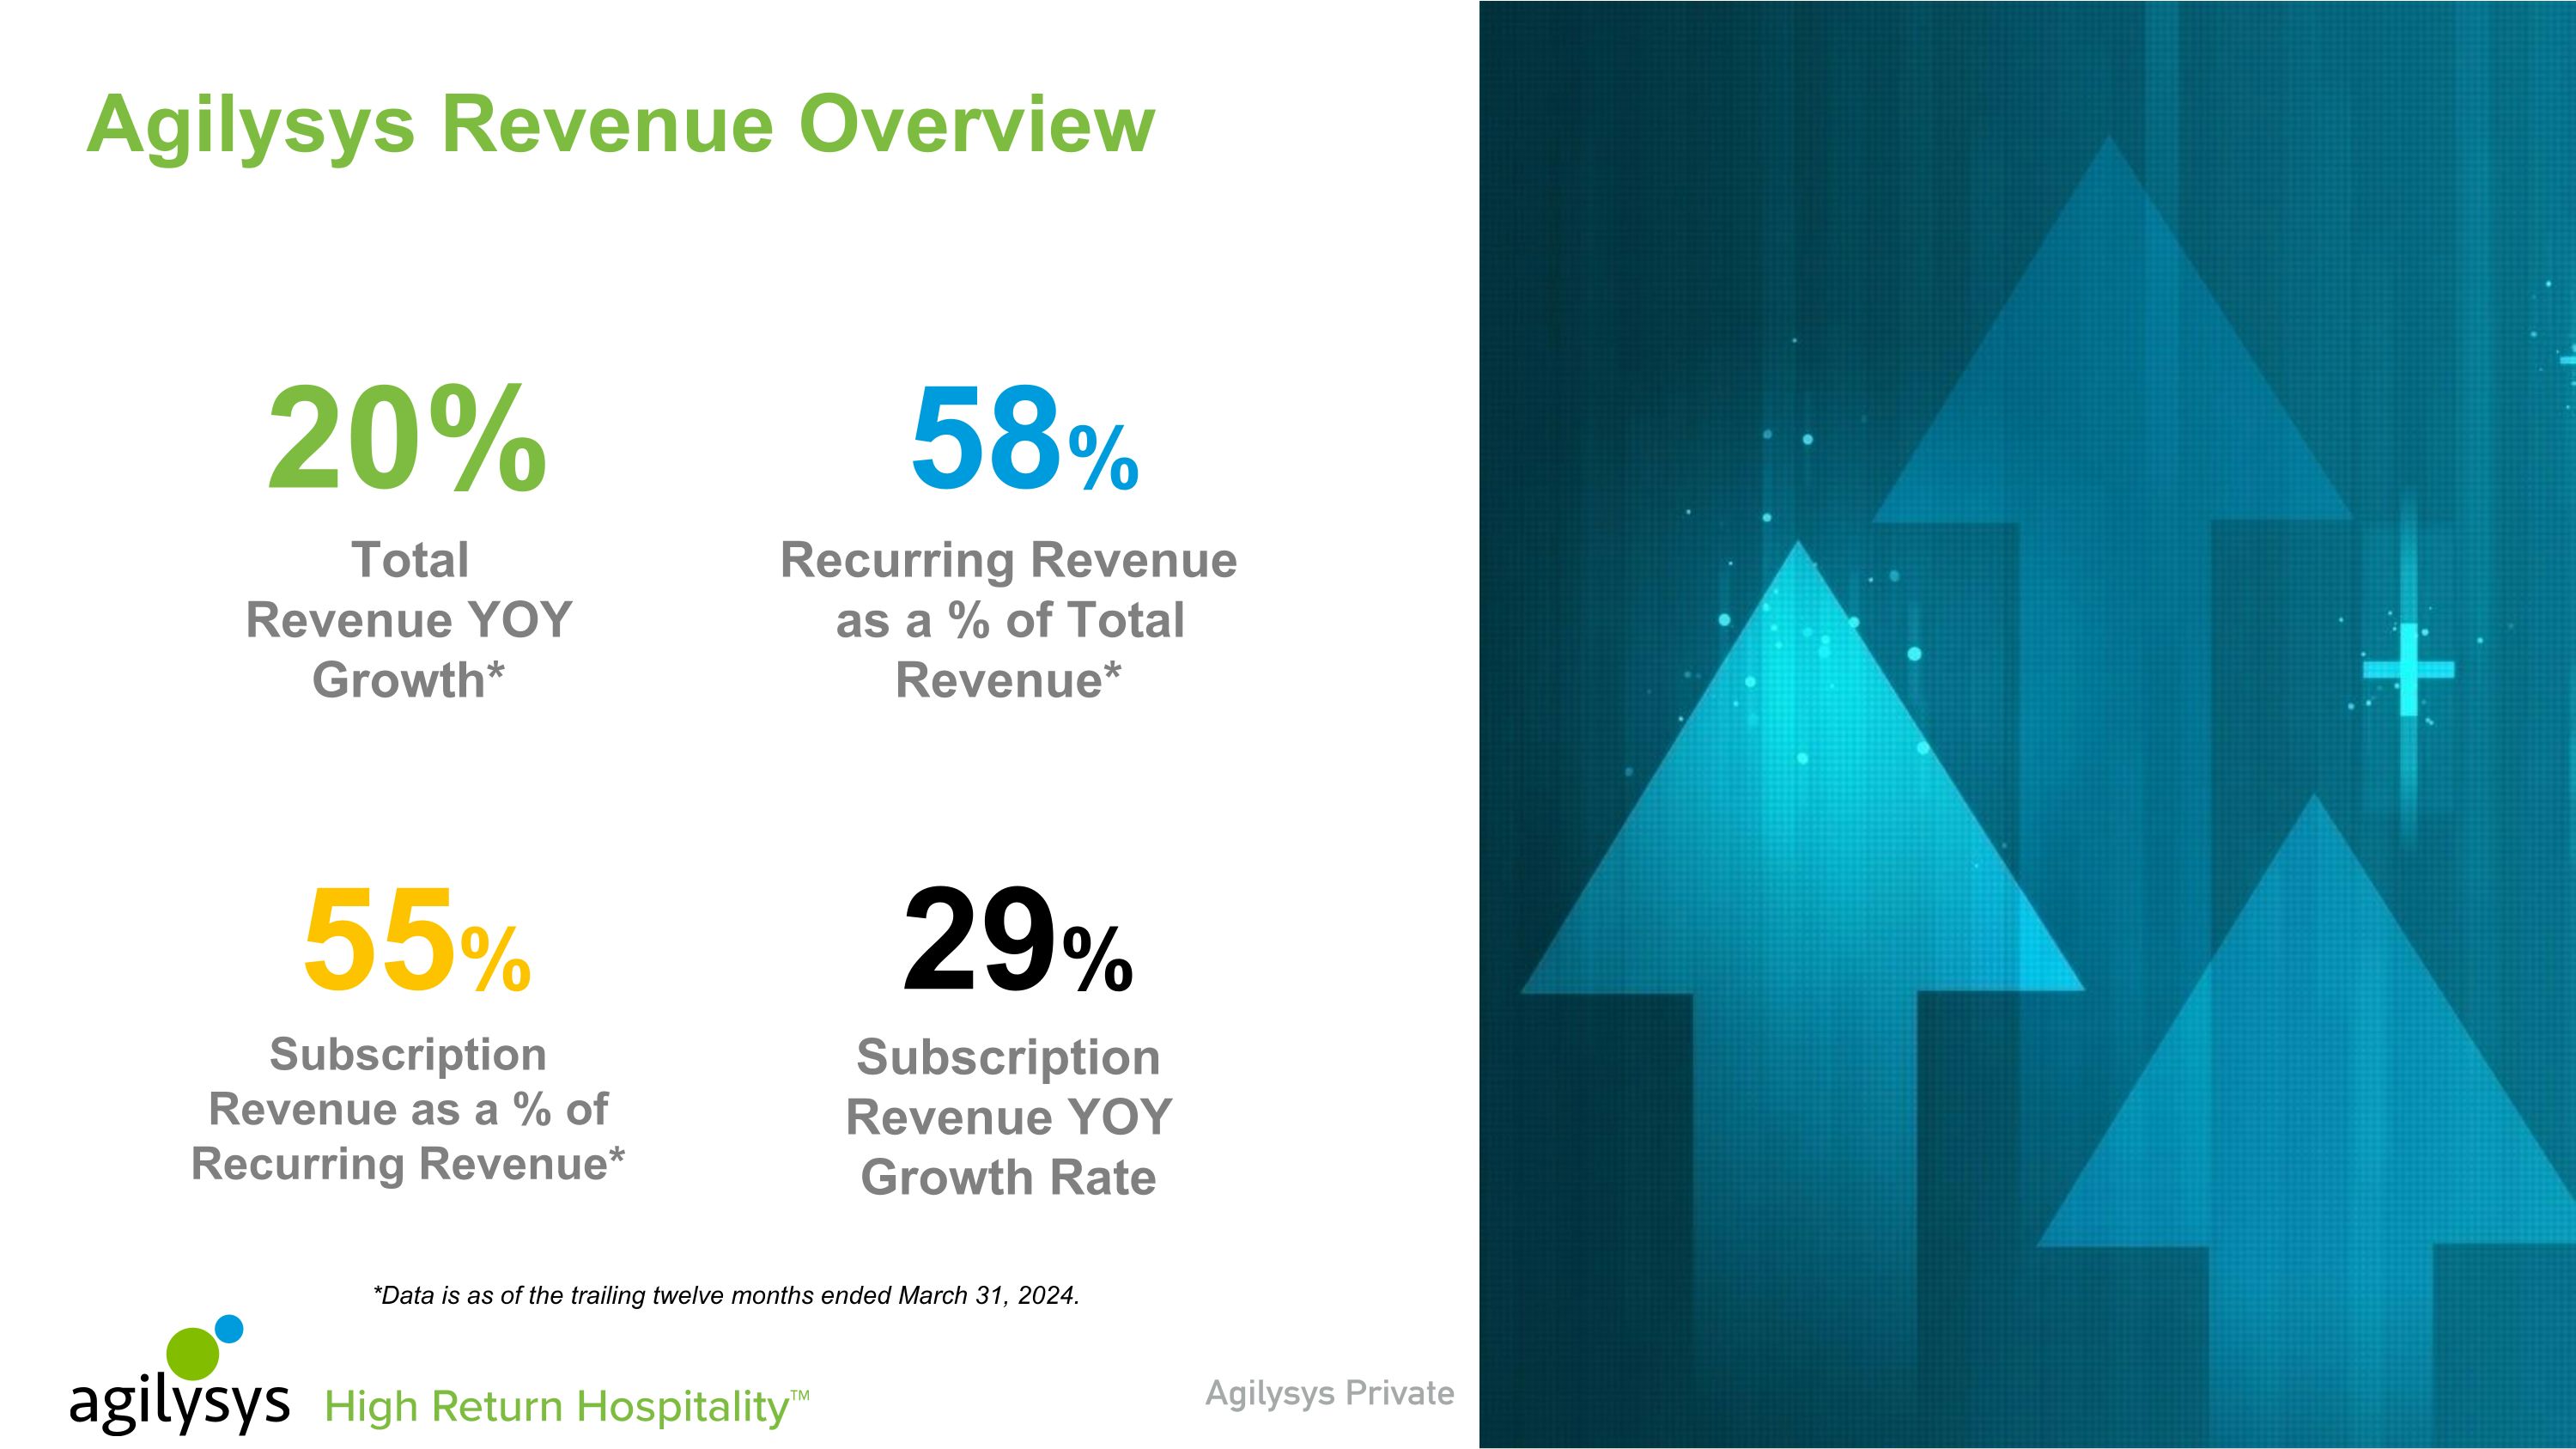
*Data is as of the trailing twelve months ended March 31, 2024. Subscription Revenue as a % of Recurring Revenue* Subscription Revenue YOY Growth Rate Total �Revenue YOY Growth* Recurring Revenue as a % of Total Revenue* 20% 58% 55% 29% Agilysys Revenue Overview
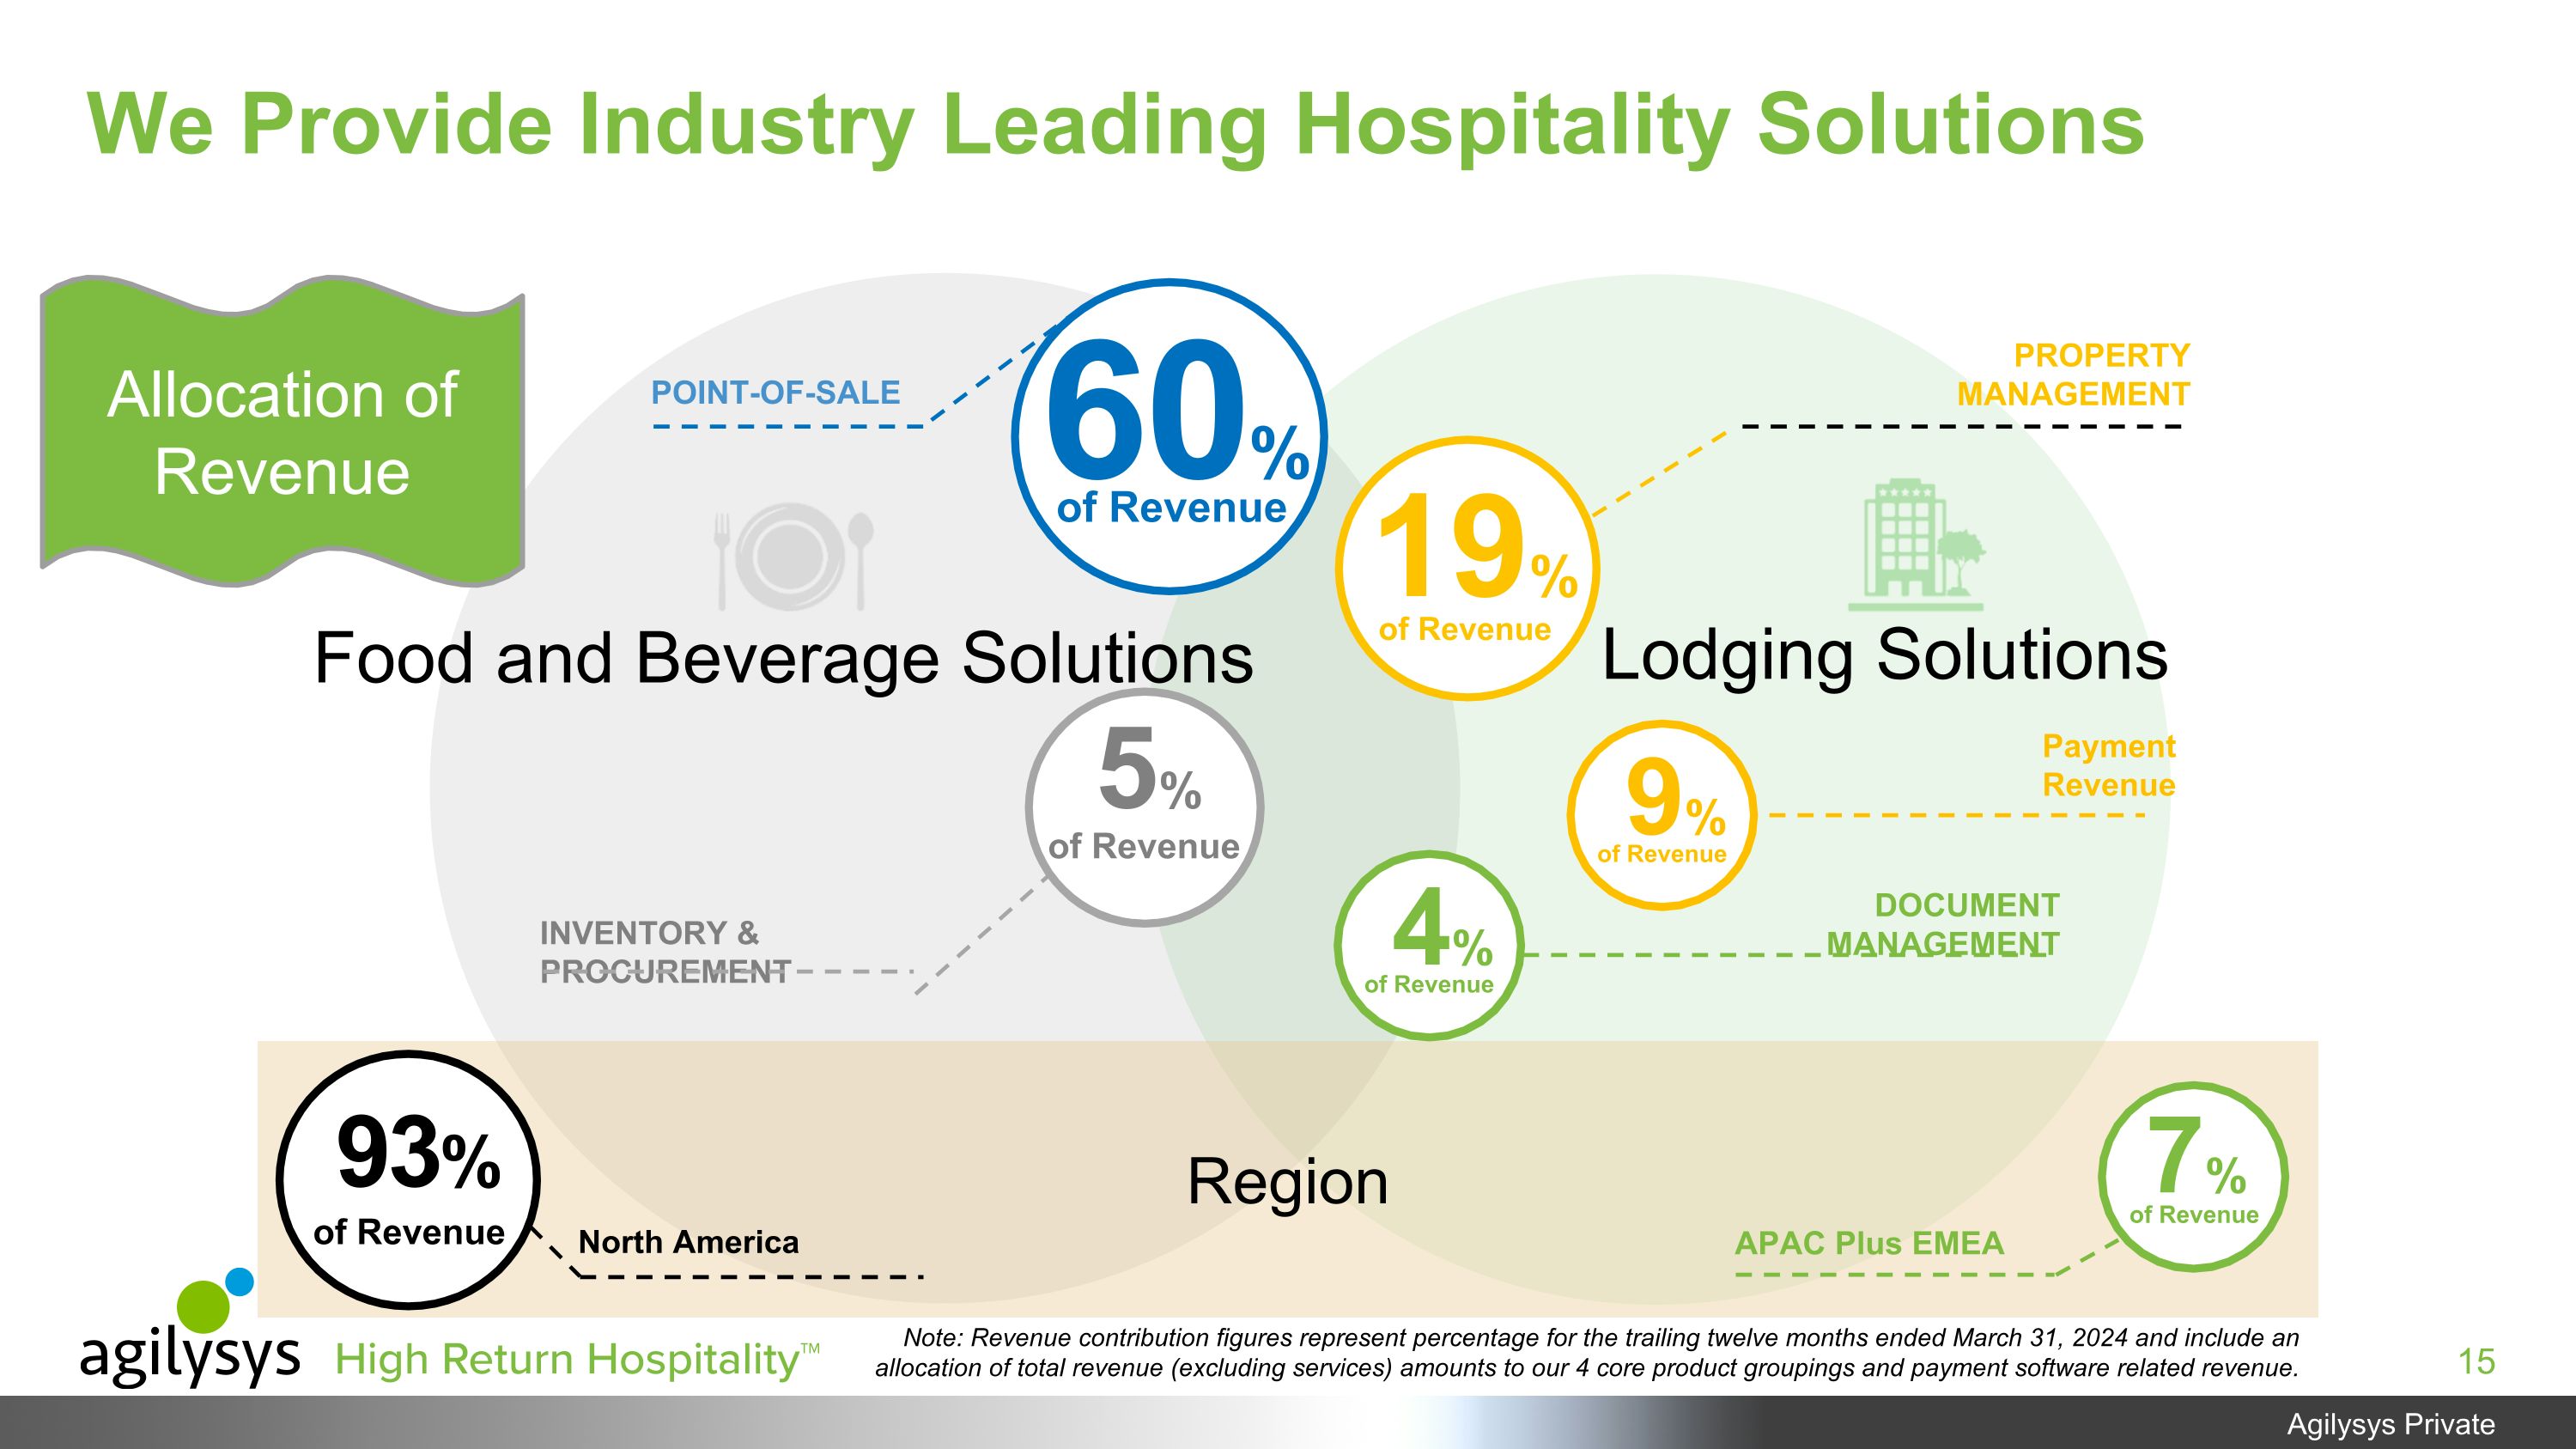
We Provide Industry Leading Hospitality Solutions Lodging Solutions Food and Beverage Solutions 60% of Revenue 19% of Revenue 5% of Revenue INVENTORY & PROCUREMENT 4% of Revenue DOCUMENT MANAGEMENT PROPERTY MANAGEMENT POINT-OF-SALE Note: Revenue contribution figures represent percentage for the trailing twelve months ended March 31, 2024 and include an allocation of total revenue (excluding services) amounts to our 4 core product groupings and payment software related revenue. Region 93% of Revenue North America 7% of Revenue APAC Plus EMEA Allocation of Revenue 9% of Revenue Payment Revenue
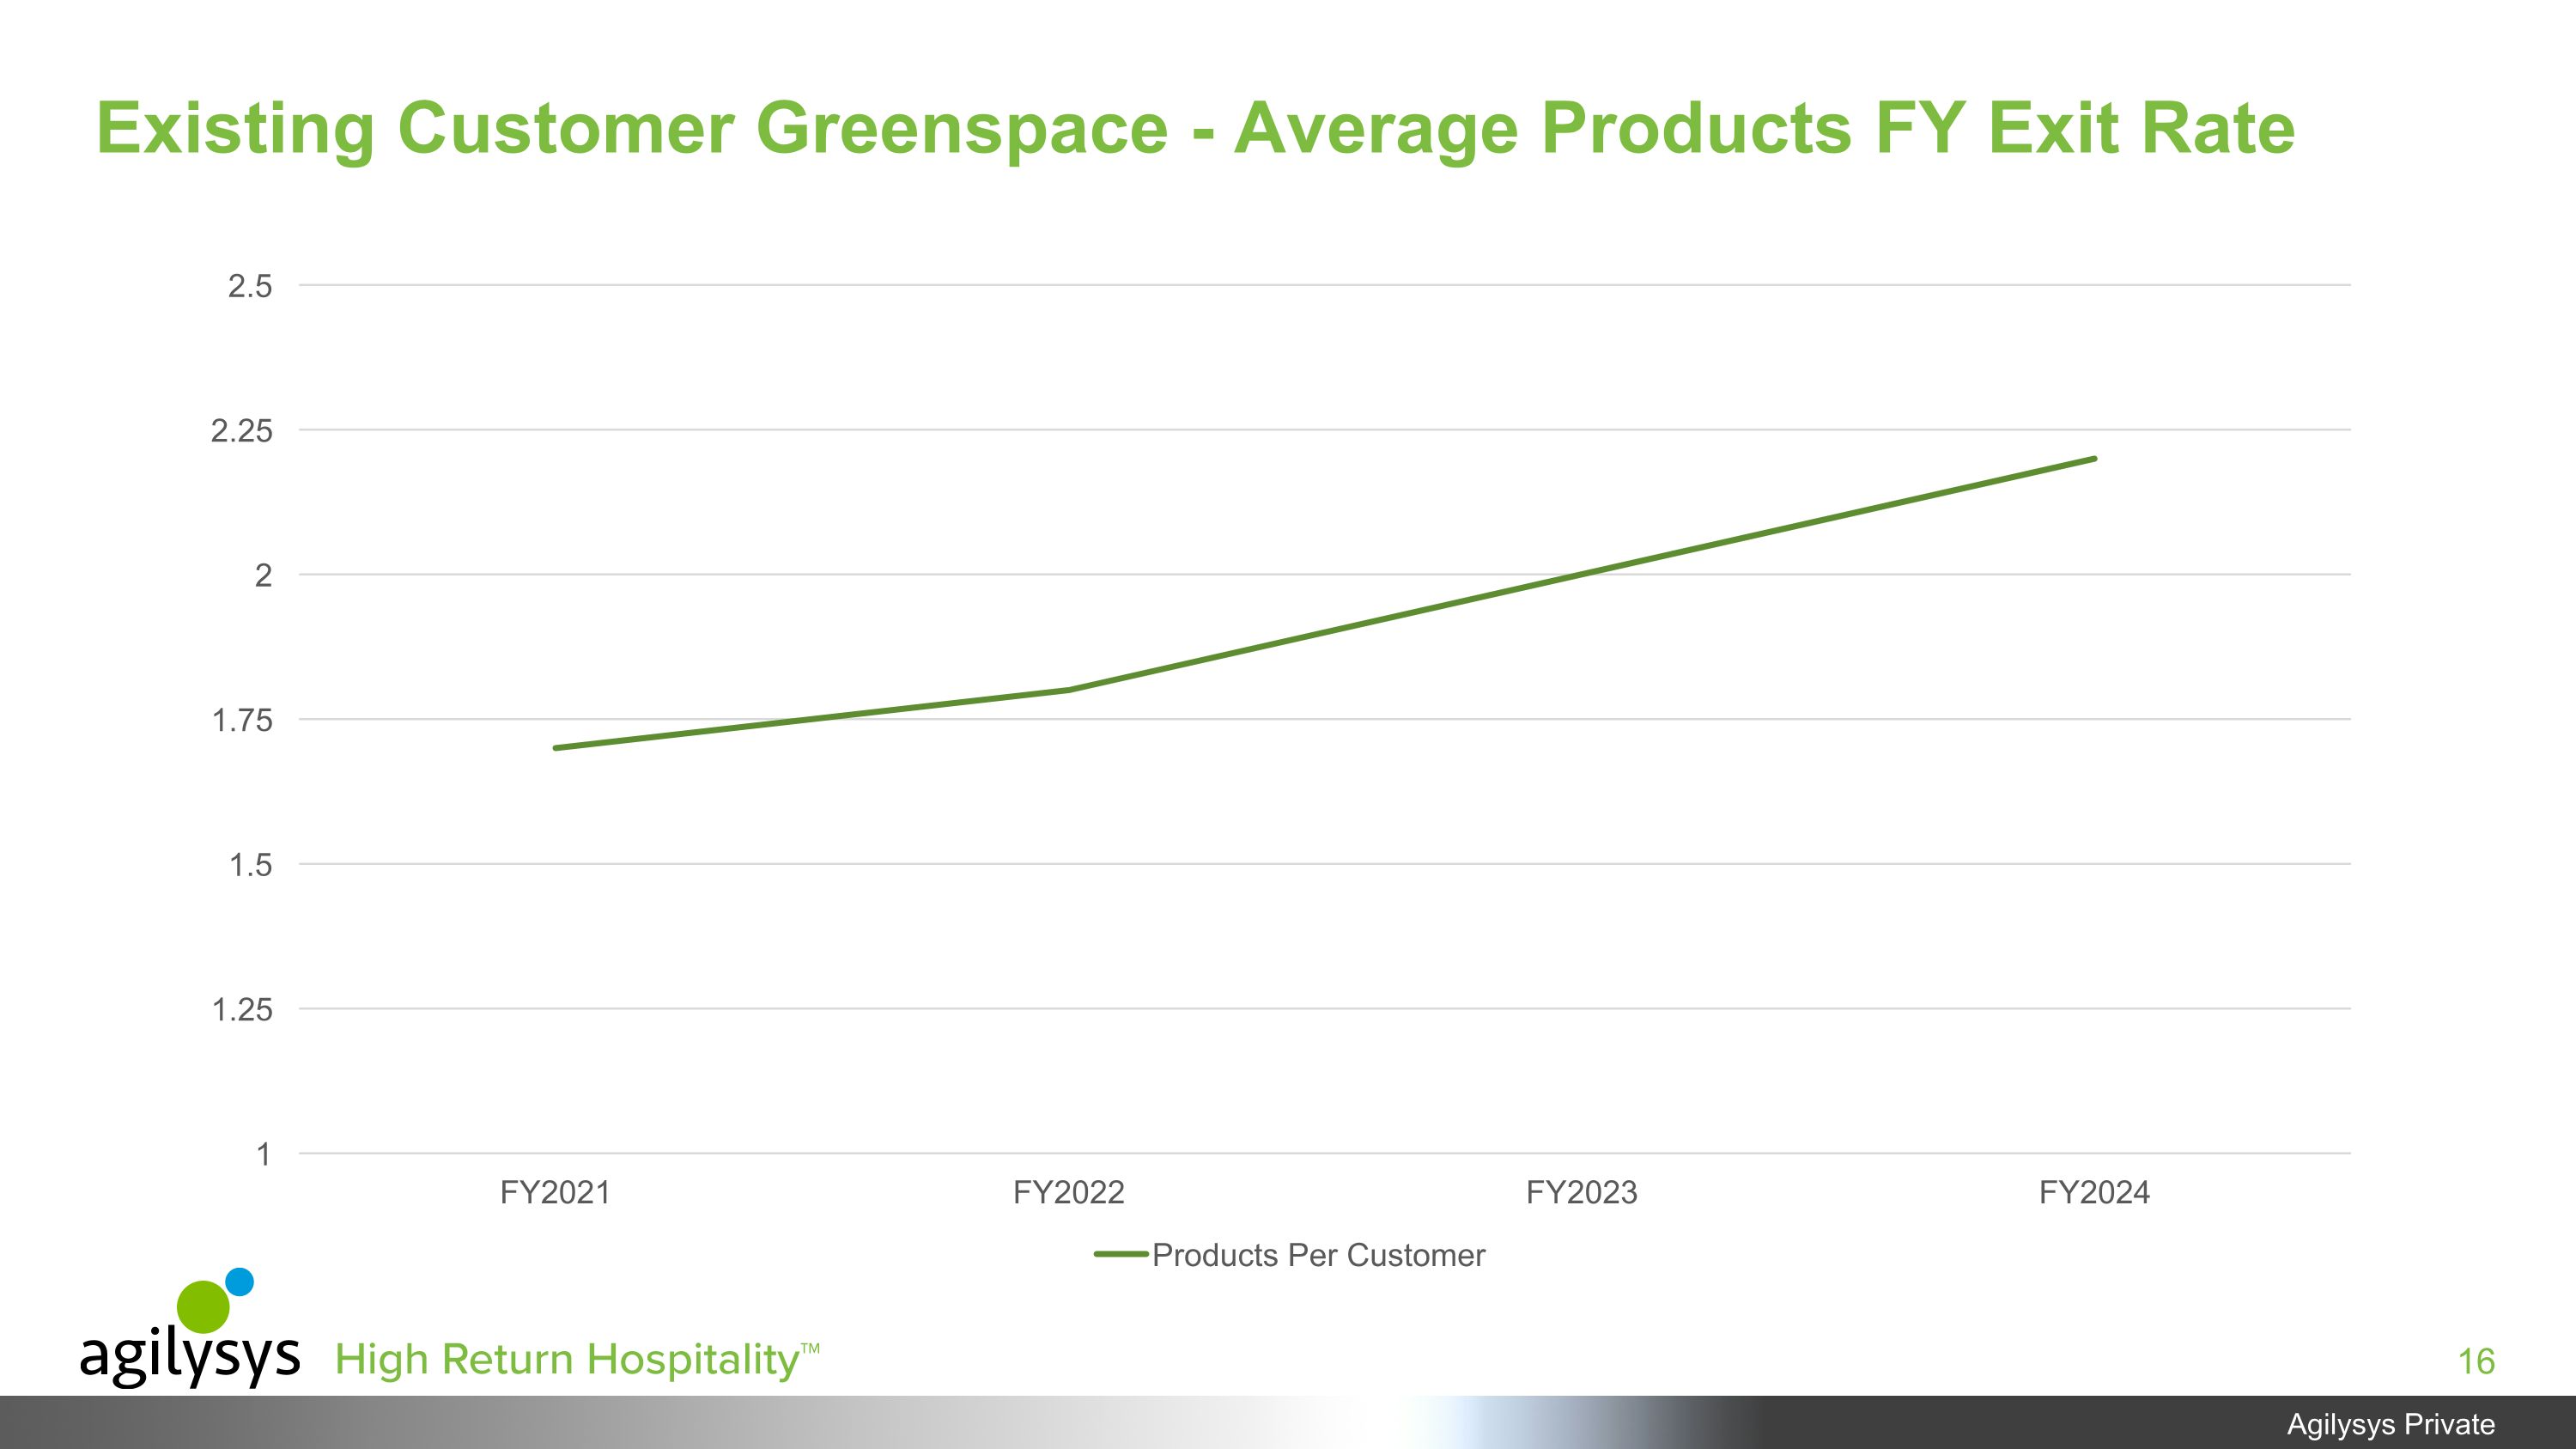
Existing Customer Greenspace - Average Products FY Exit Rate
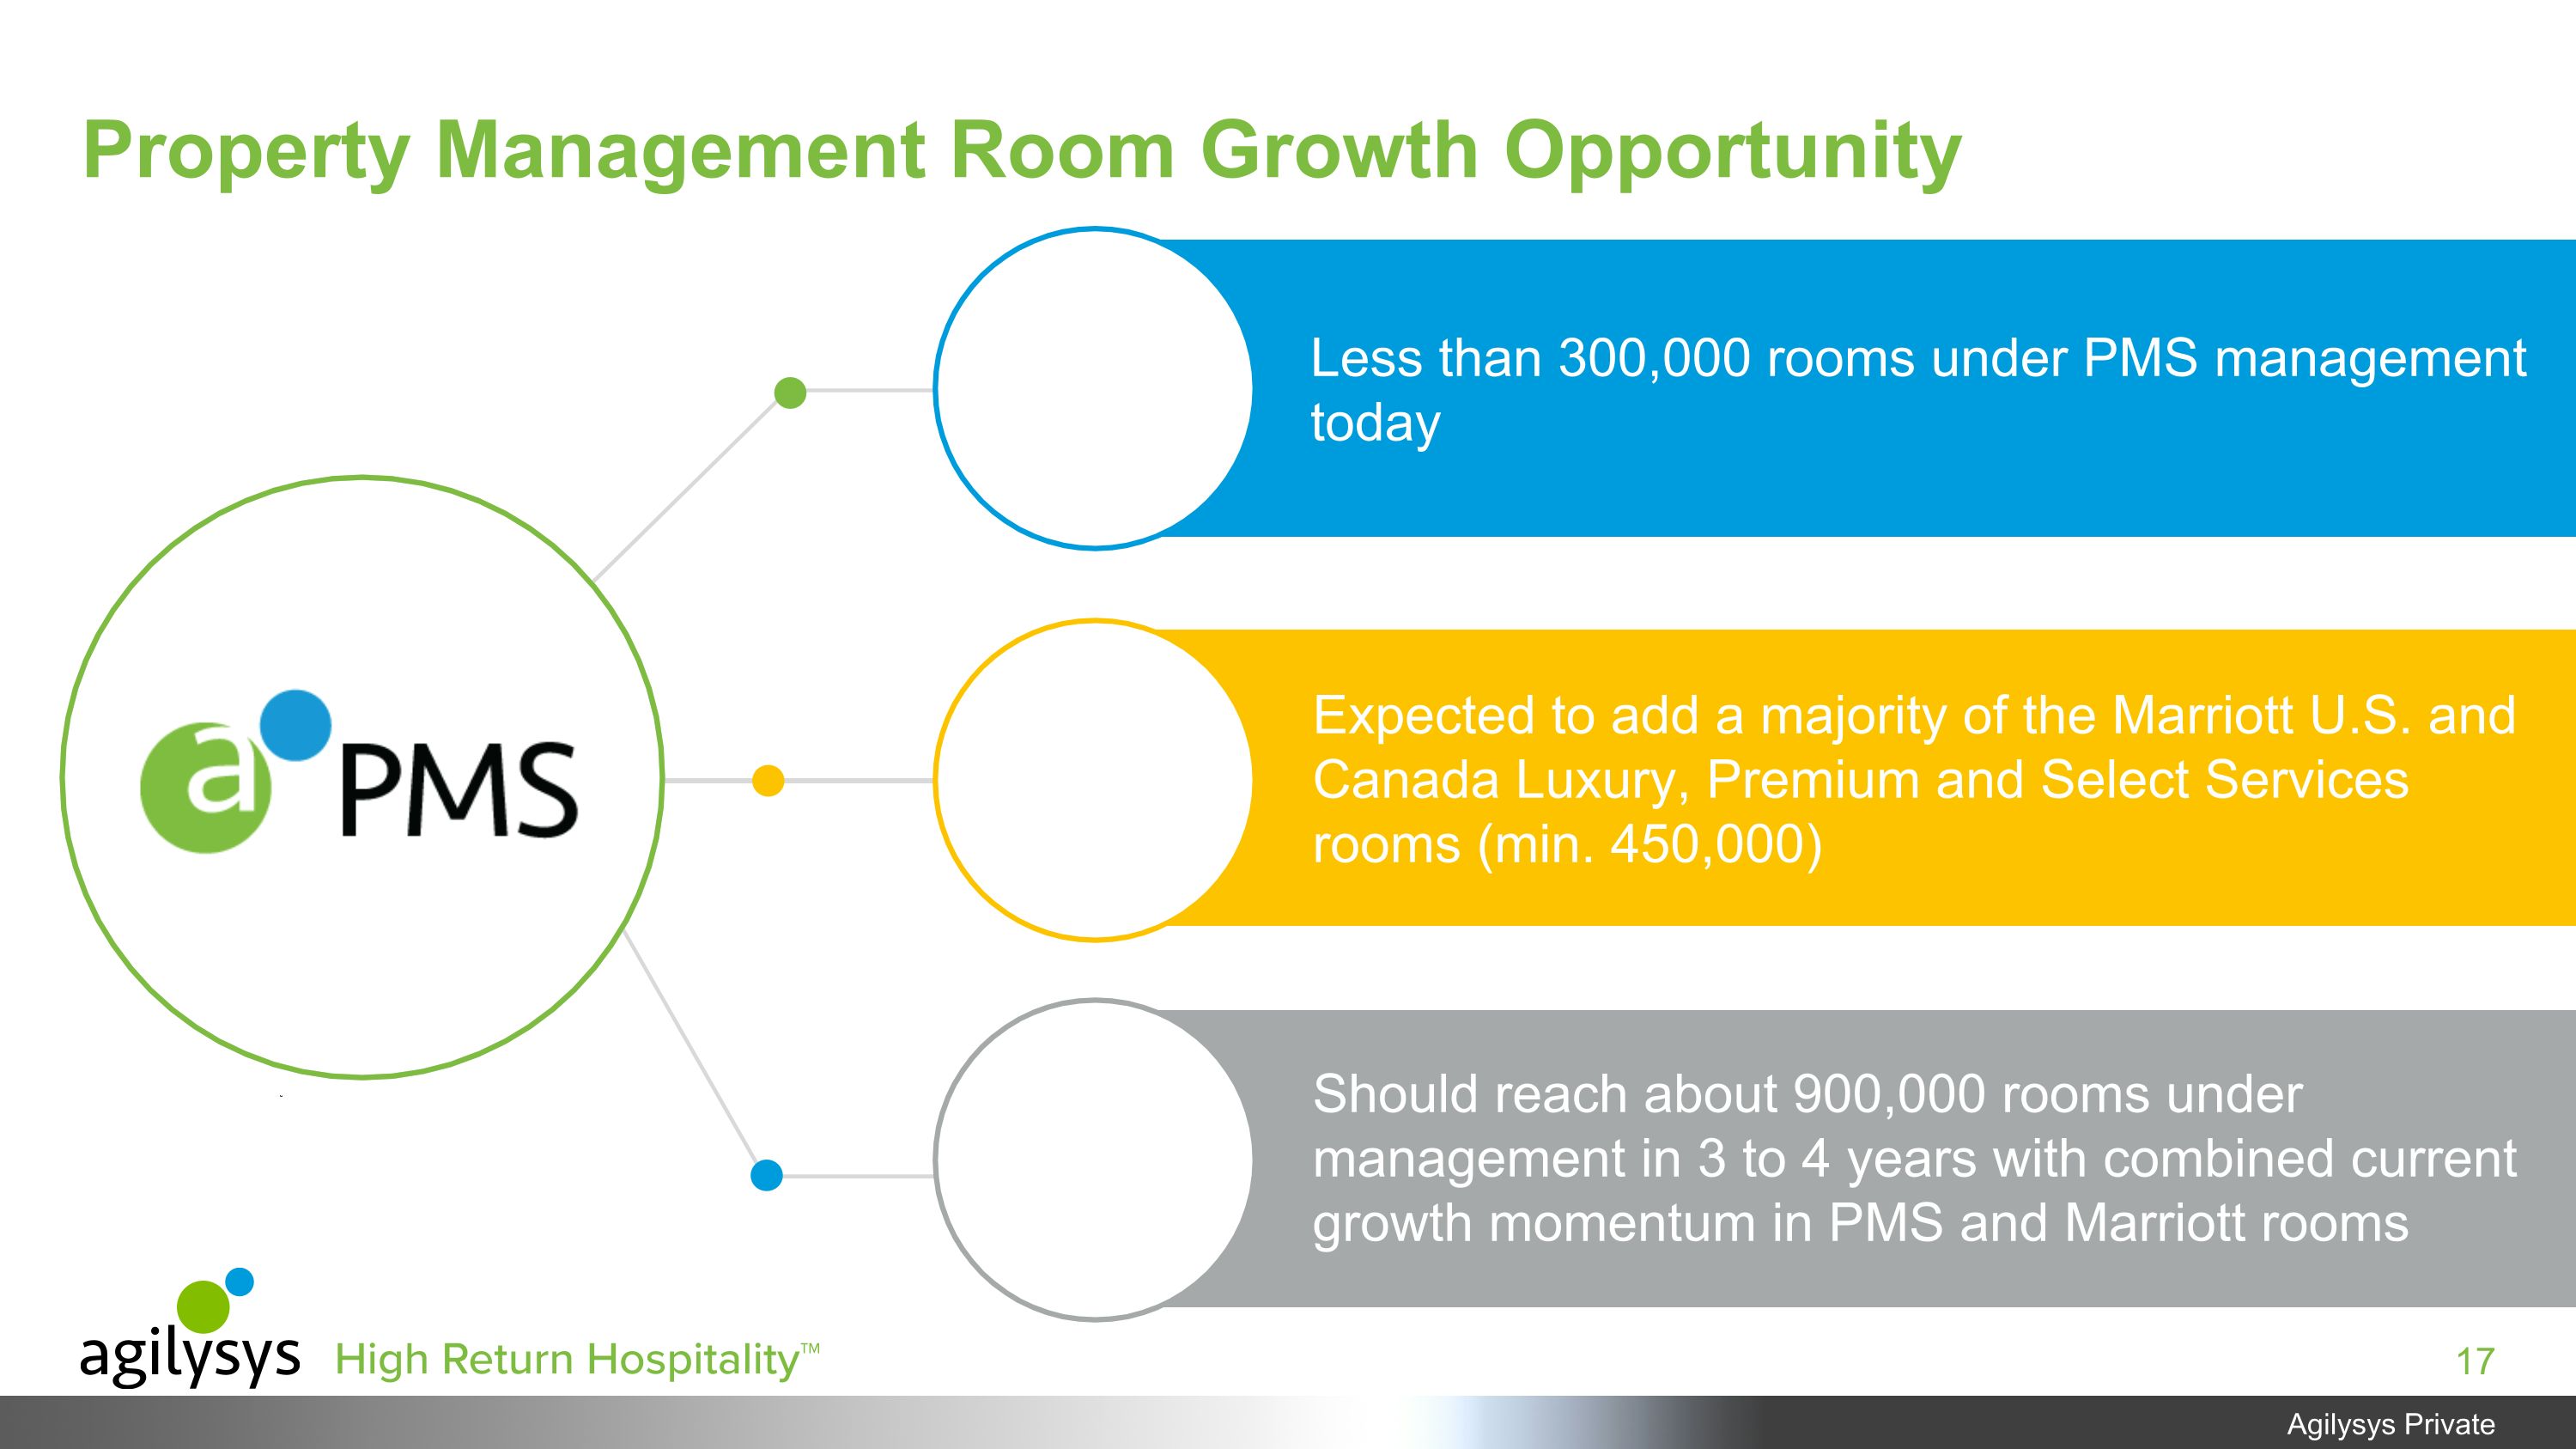
Property Management Room Growth Opportunity Less than 300,000 rooms under PMS management today Should reach about 900,000 rooms under management in 3 to 4 years with combined current growth momentum in PMS and Marriott rooms Expected to add a majority of the Marriott U.S. and Canada Luxury, Premium and Select Services rooms (min. 450,000)
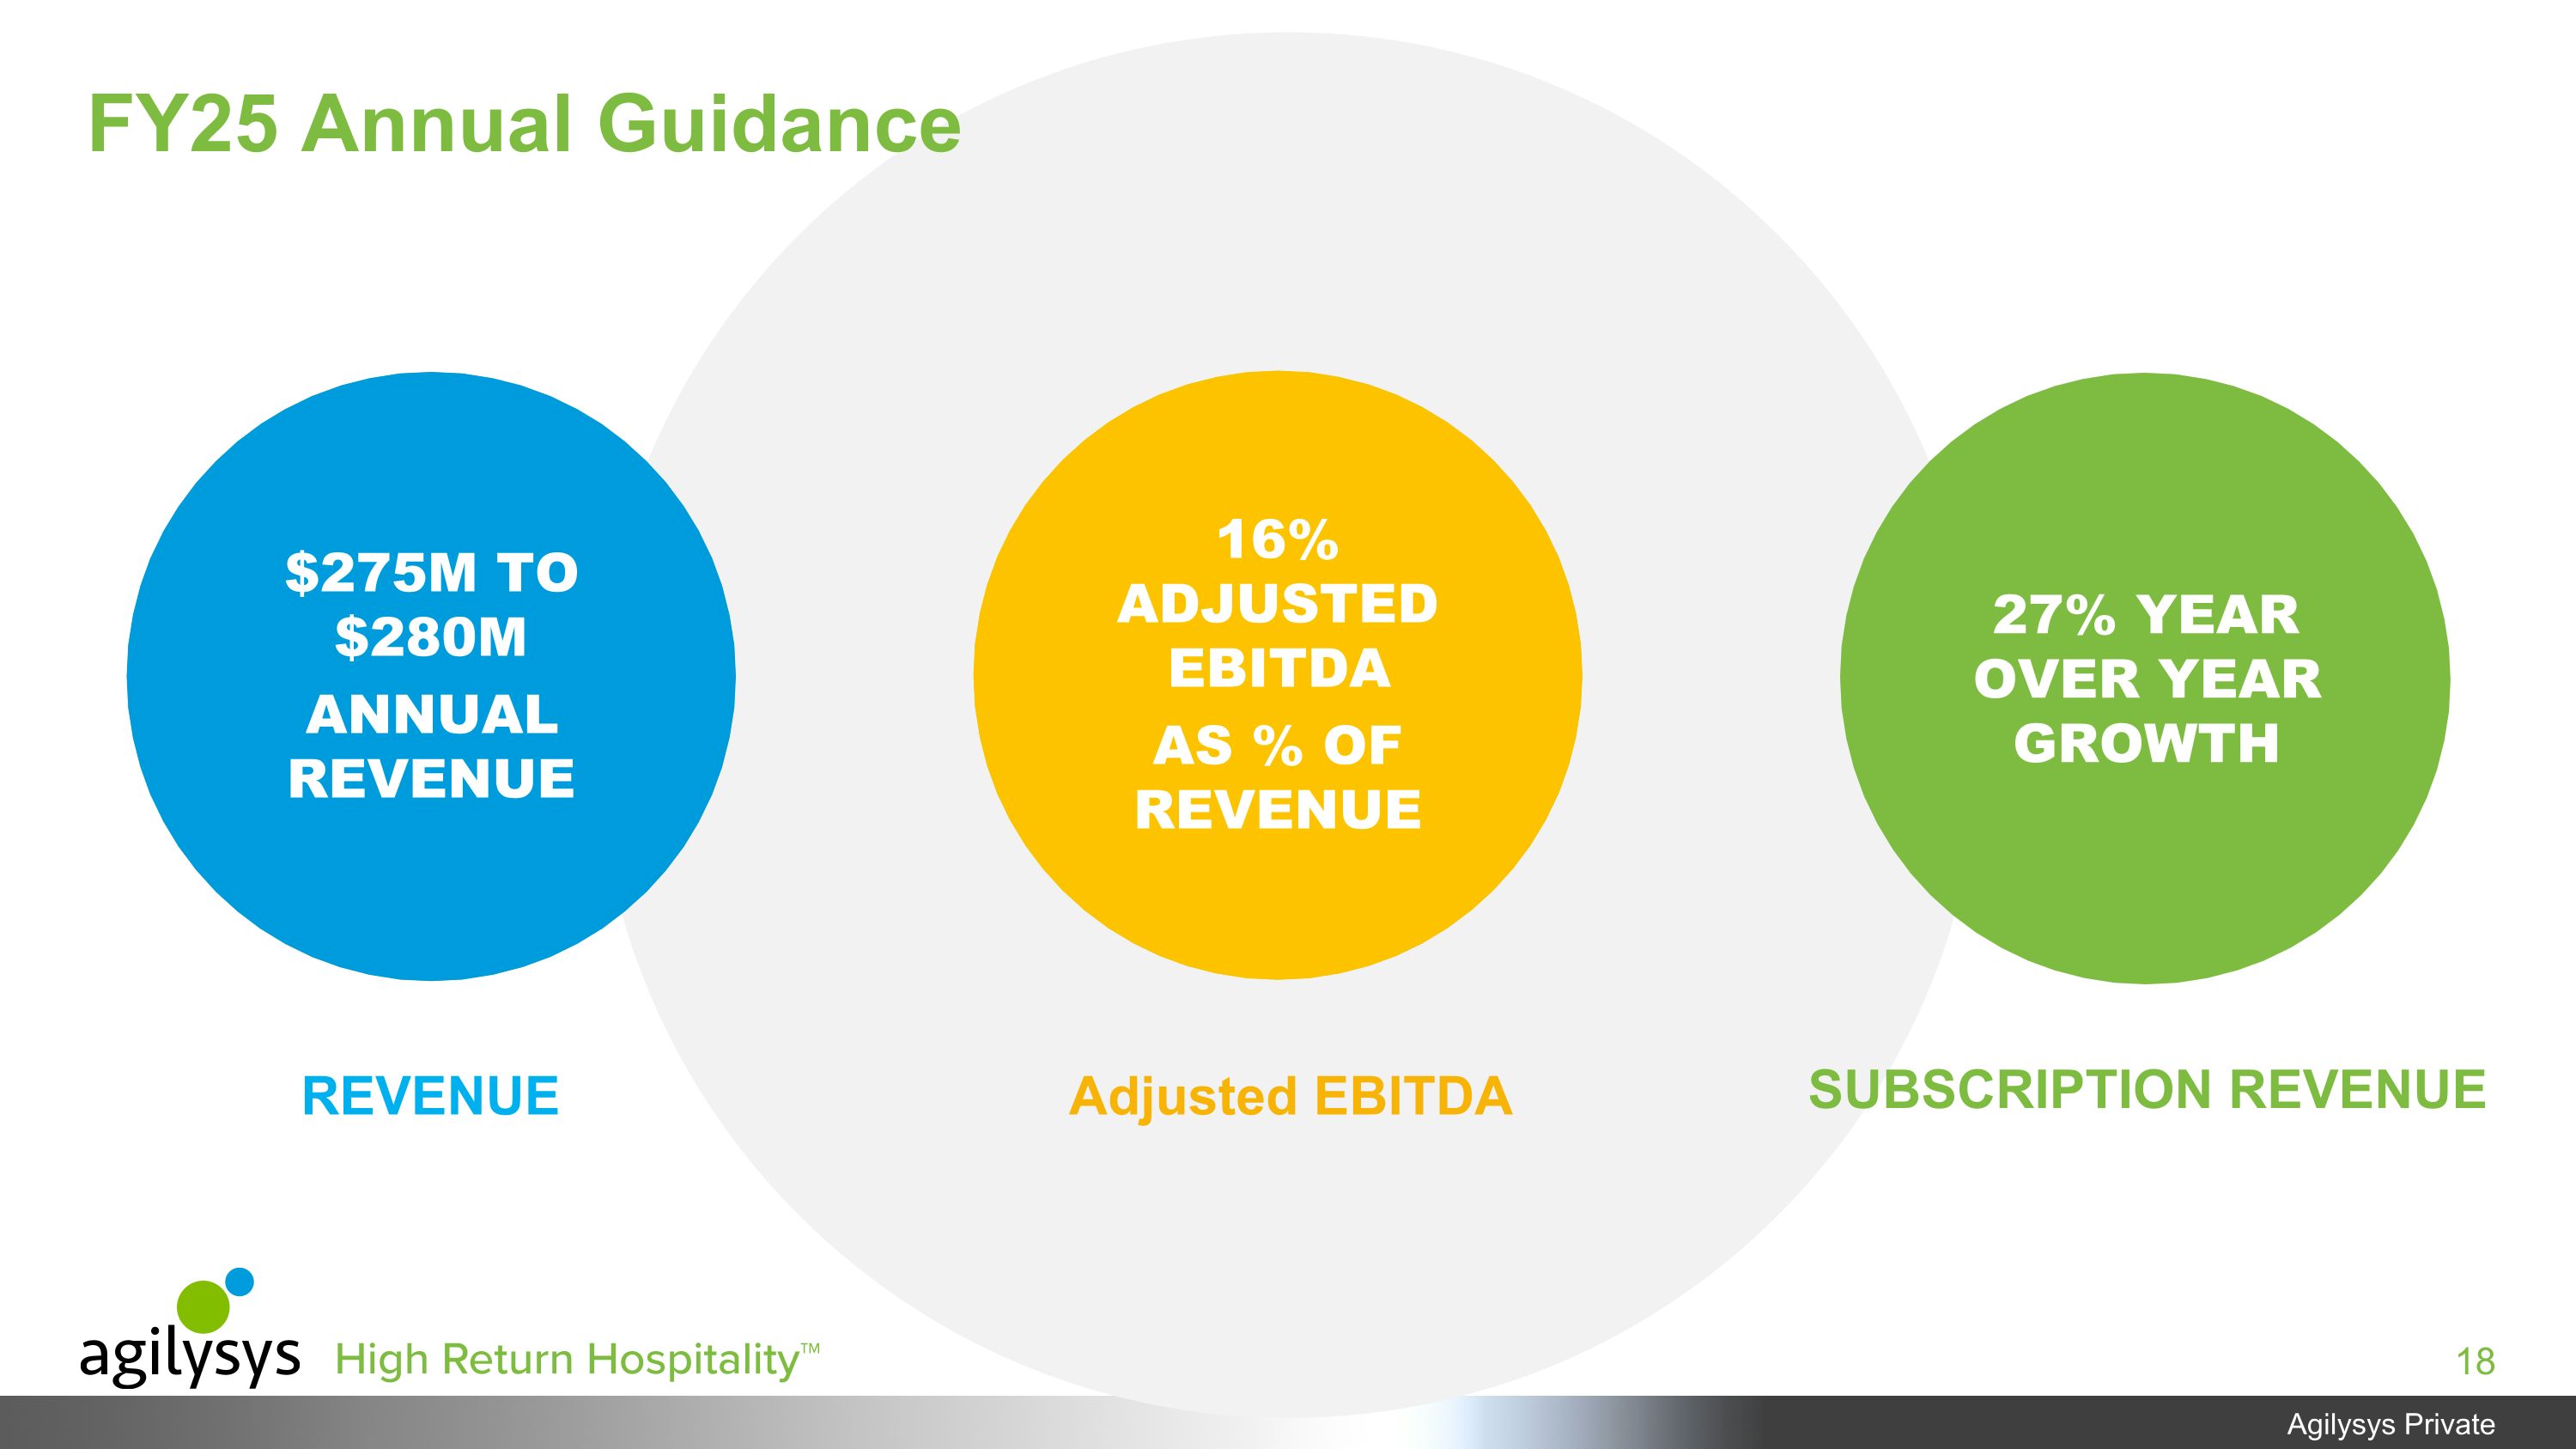
$275M TO $280M ANNUAL REVENUE 16% ADJUSTED EBITDA AS % OF REVENUE 27% YEAR OVER YEAR GROWTH REVENUE Adjusted EBITDA SUBSCRIPTION REVENUE FY25 Annual Guidance

FINANCIAL OVERVIEW
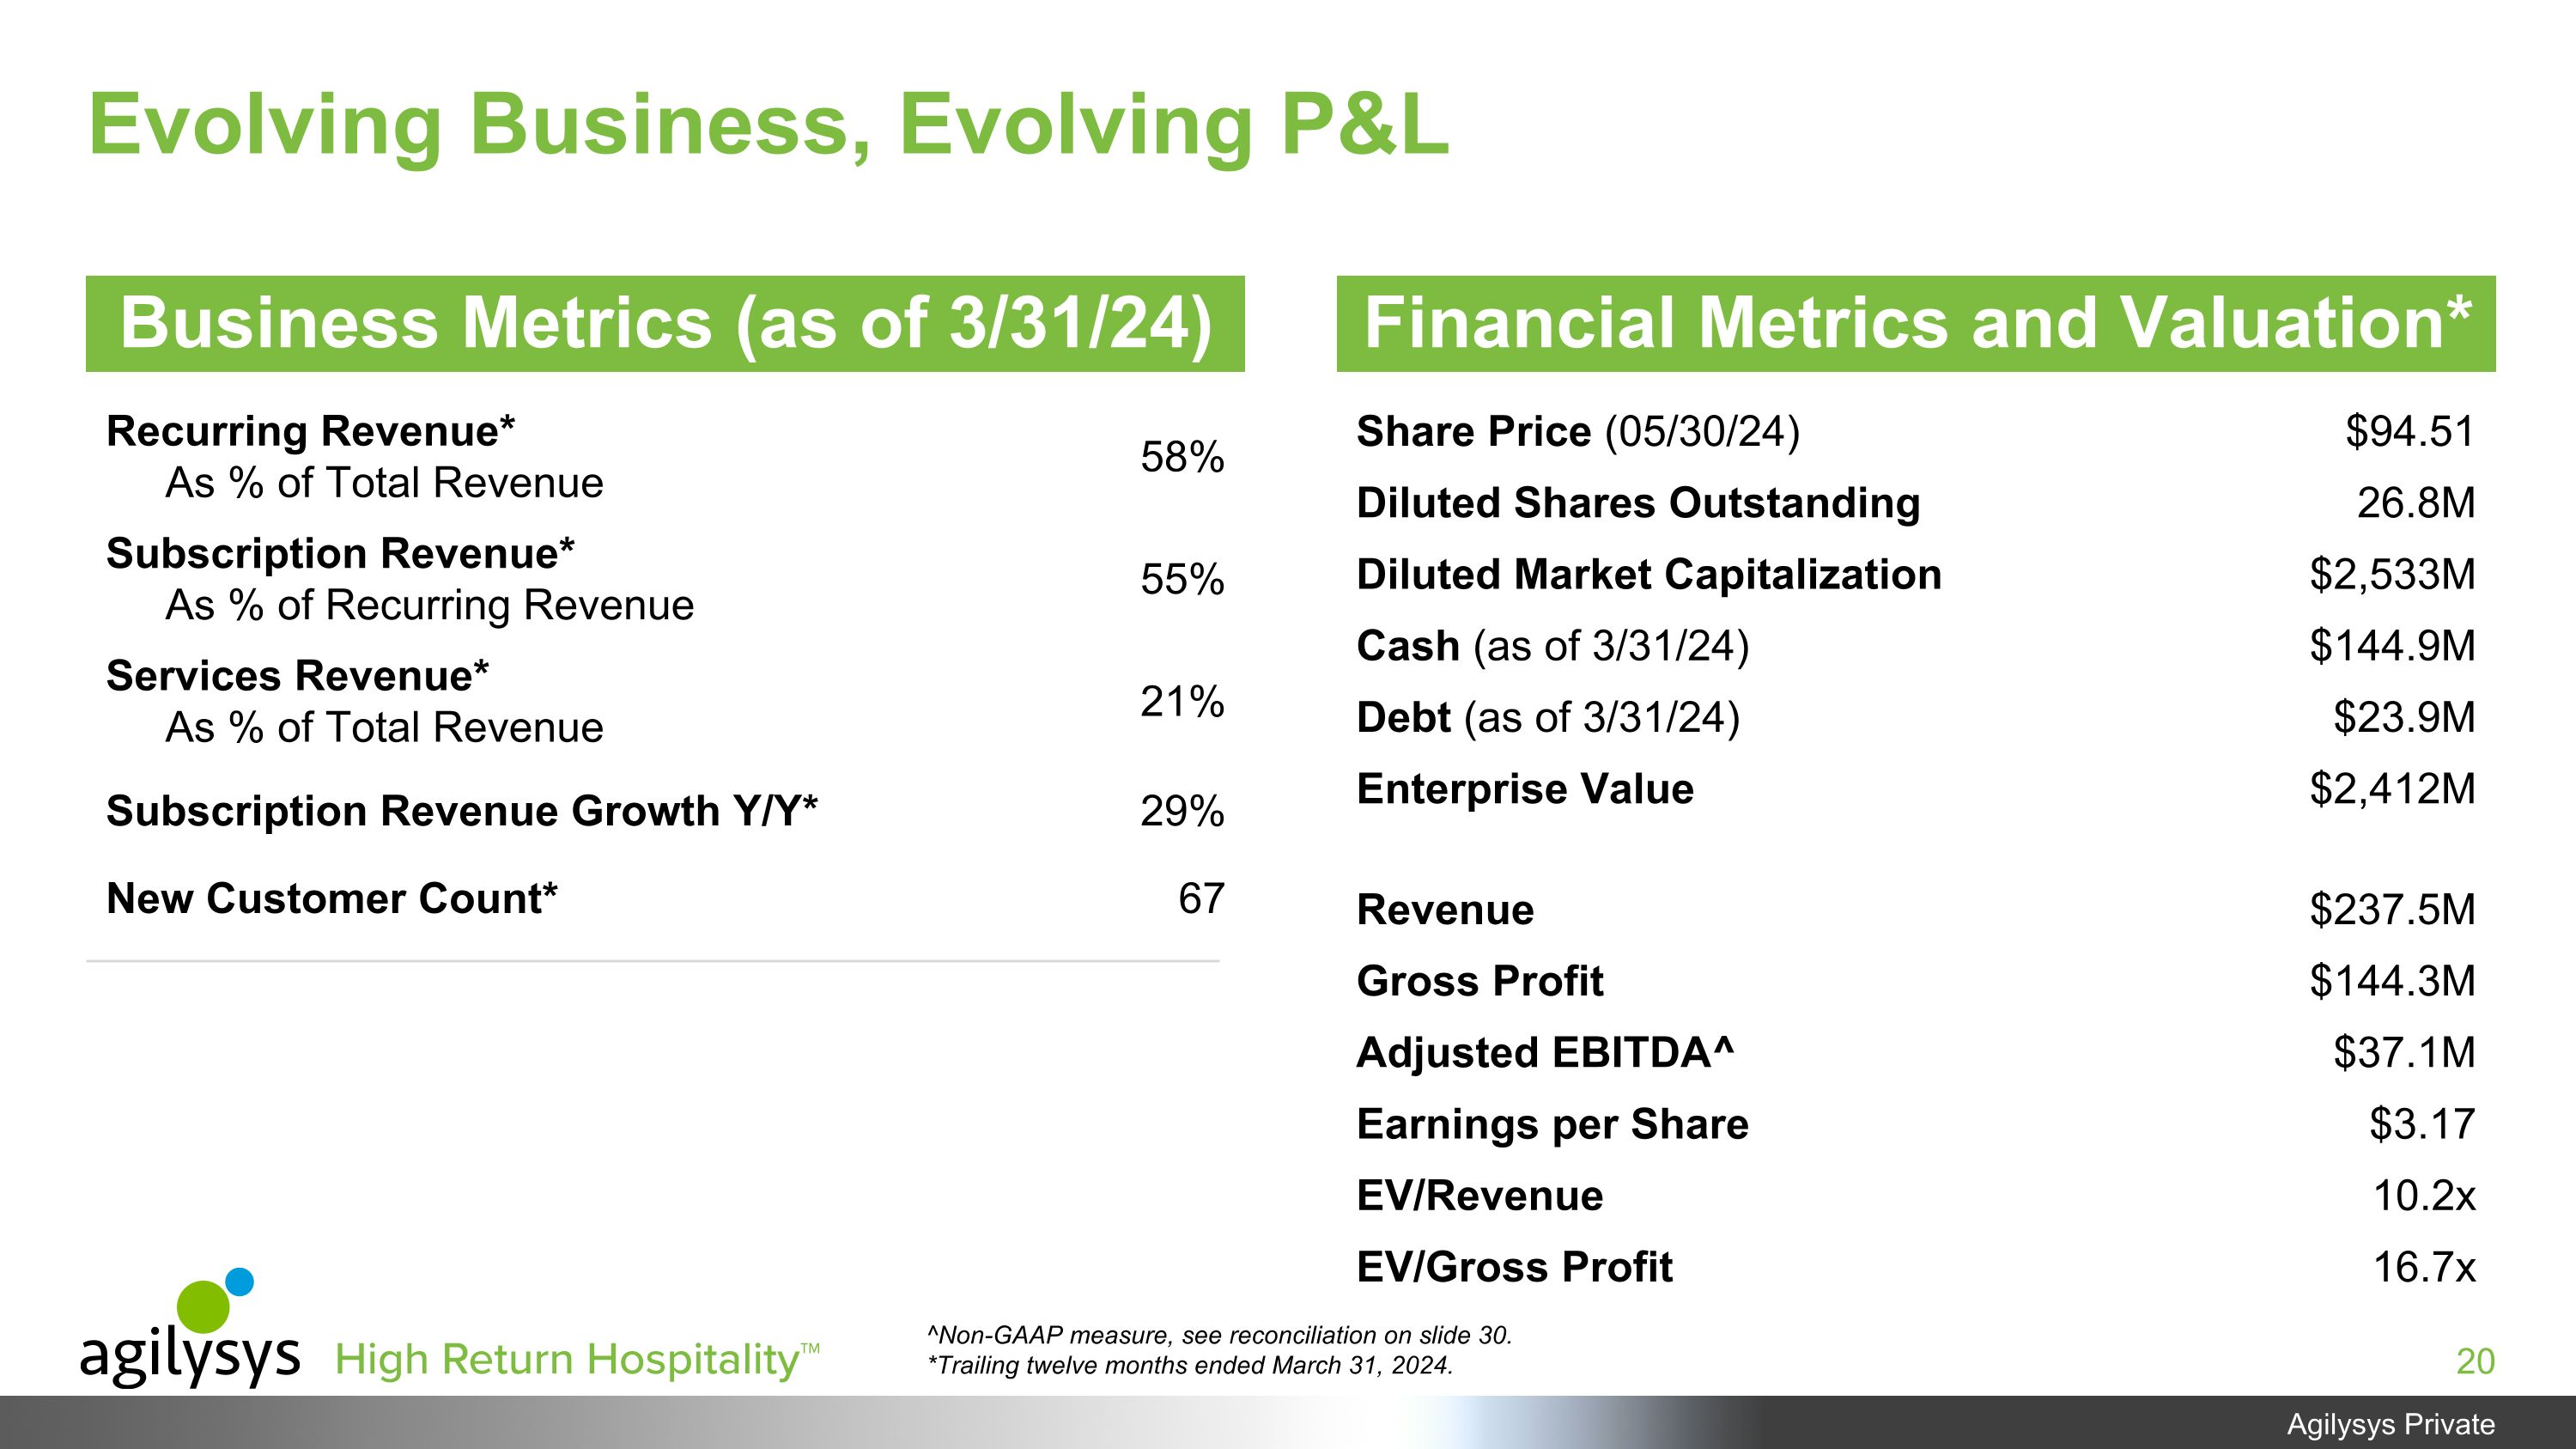
Share Price (05/30/24) $94.51 Diluted Shares Outstanding 26.8M Diluted Market Capitalization $2,533M Cash (as of 3/31/24) $144.9M Debt (as of 3/31/24) $23.9M Enterprise Value $2,412M Revenue $237.5M Gross Profit $144.3M Adjusted EBITDA^ $37.1M Earnings per Share $3.17 EV/Revenue 10.2x EV/Gross Profit 16.7x Recurring Revenue* As % of Total Revenue 58% Subscription Revenue* As % of Recurring Revenue 55% Services Revenue* As % of Total Revenue 21% Subscription Revenue Growth Y/Y* 29% New Customer Count* 67 Financial Metrics and Valuation* Business Metrics (as of 3/31/24) Evolving Business, Evolving P&L ^Non-GAAP measure, see reconciliation on slide 30. *Trailing twelve months ended March 31, 2024.
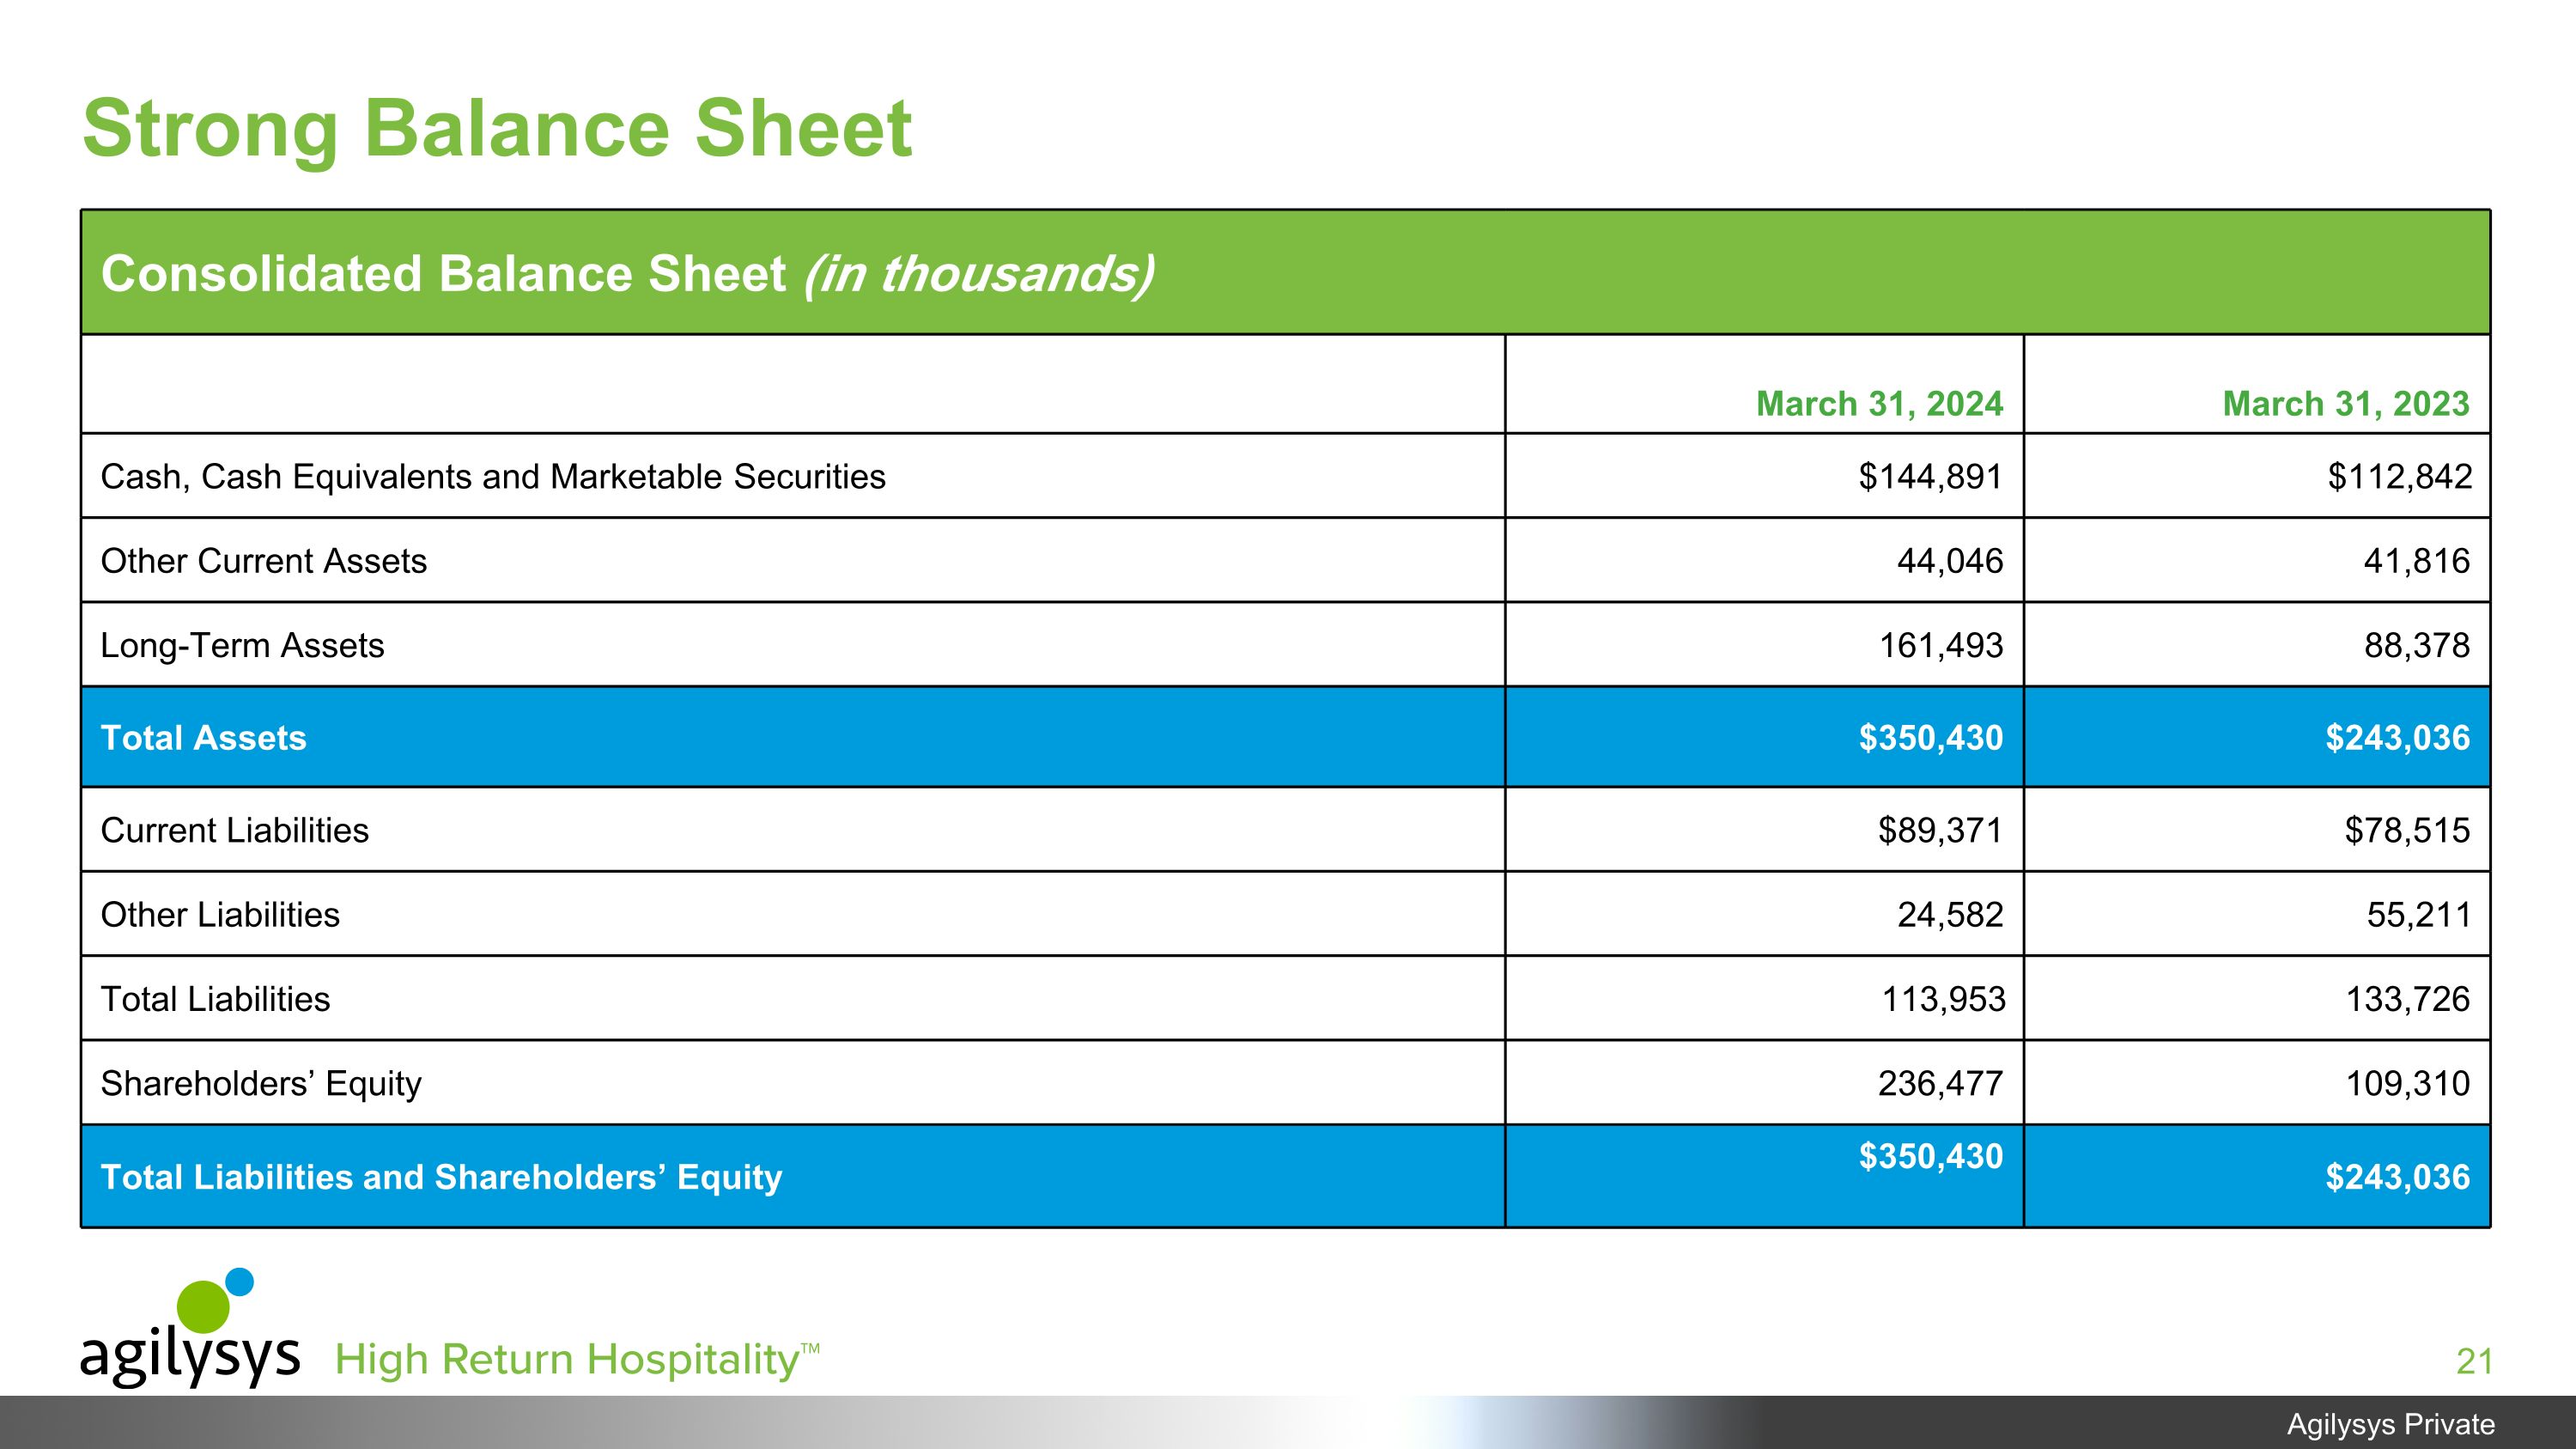
Strong Balance Sheet Consolidated Balance Sheet (in thousands) March 31, 2024 March 31, 2023 Cash, Cash Equivalents and Marketable Securities $144,891 $112,842 Other Current Assets 44,046 41,816 Long-Term Assets 161,493 88,378 Total Assets $350,430 $243,036 Current Liabilities $89,371 $78,515 Other Liabilities 24,582 55,211 Total Liabilities 113,953 133,726 Shareholders’ Equity 236,477 109,310 Total Liabilities and Shareholders’ Equity $350,430 $243,036
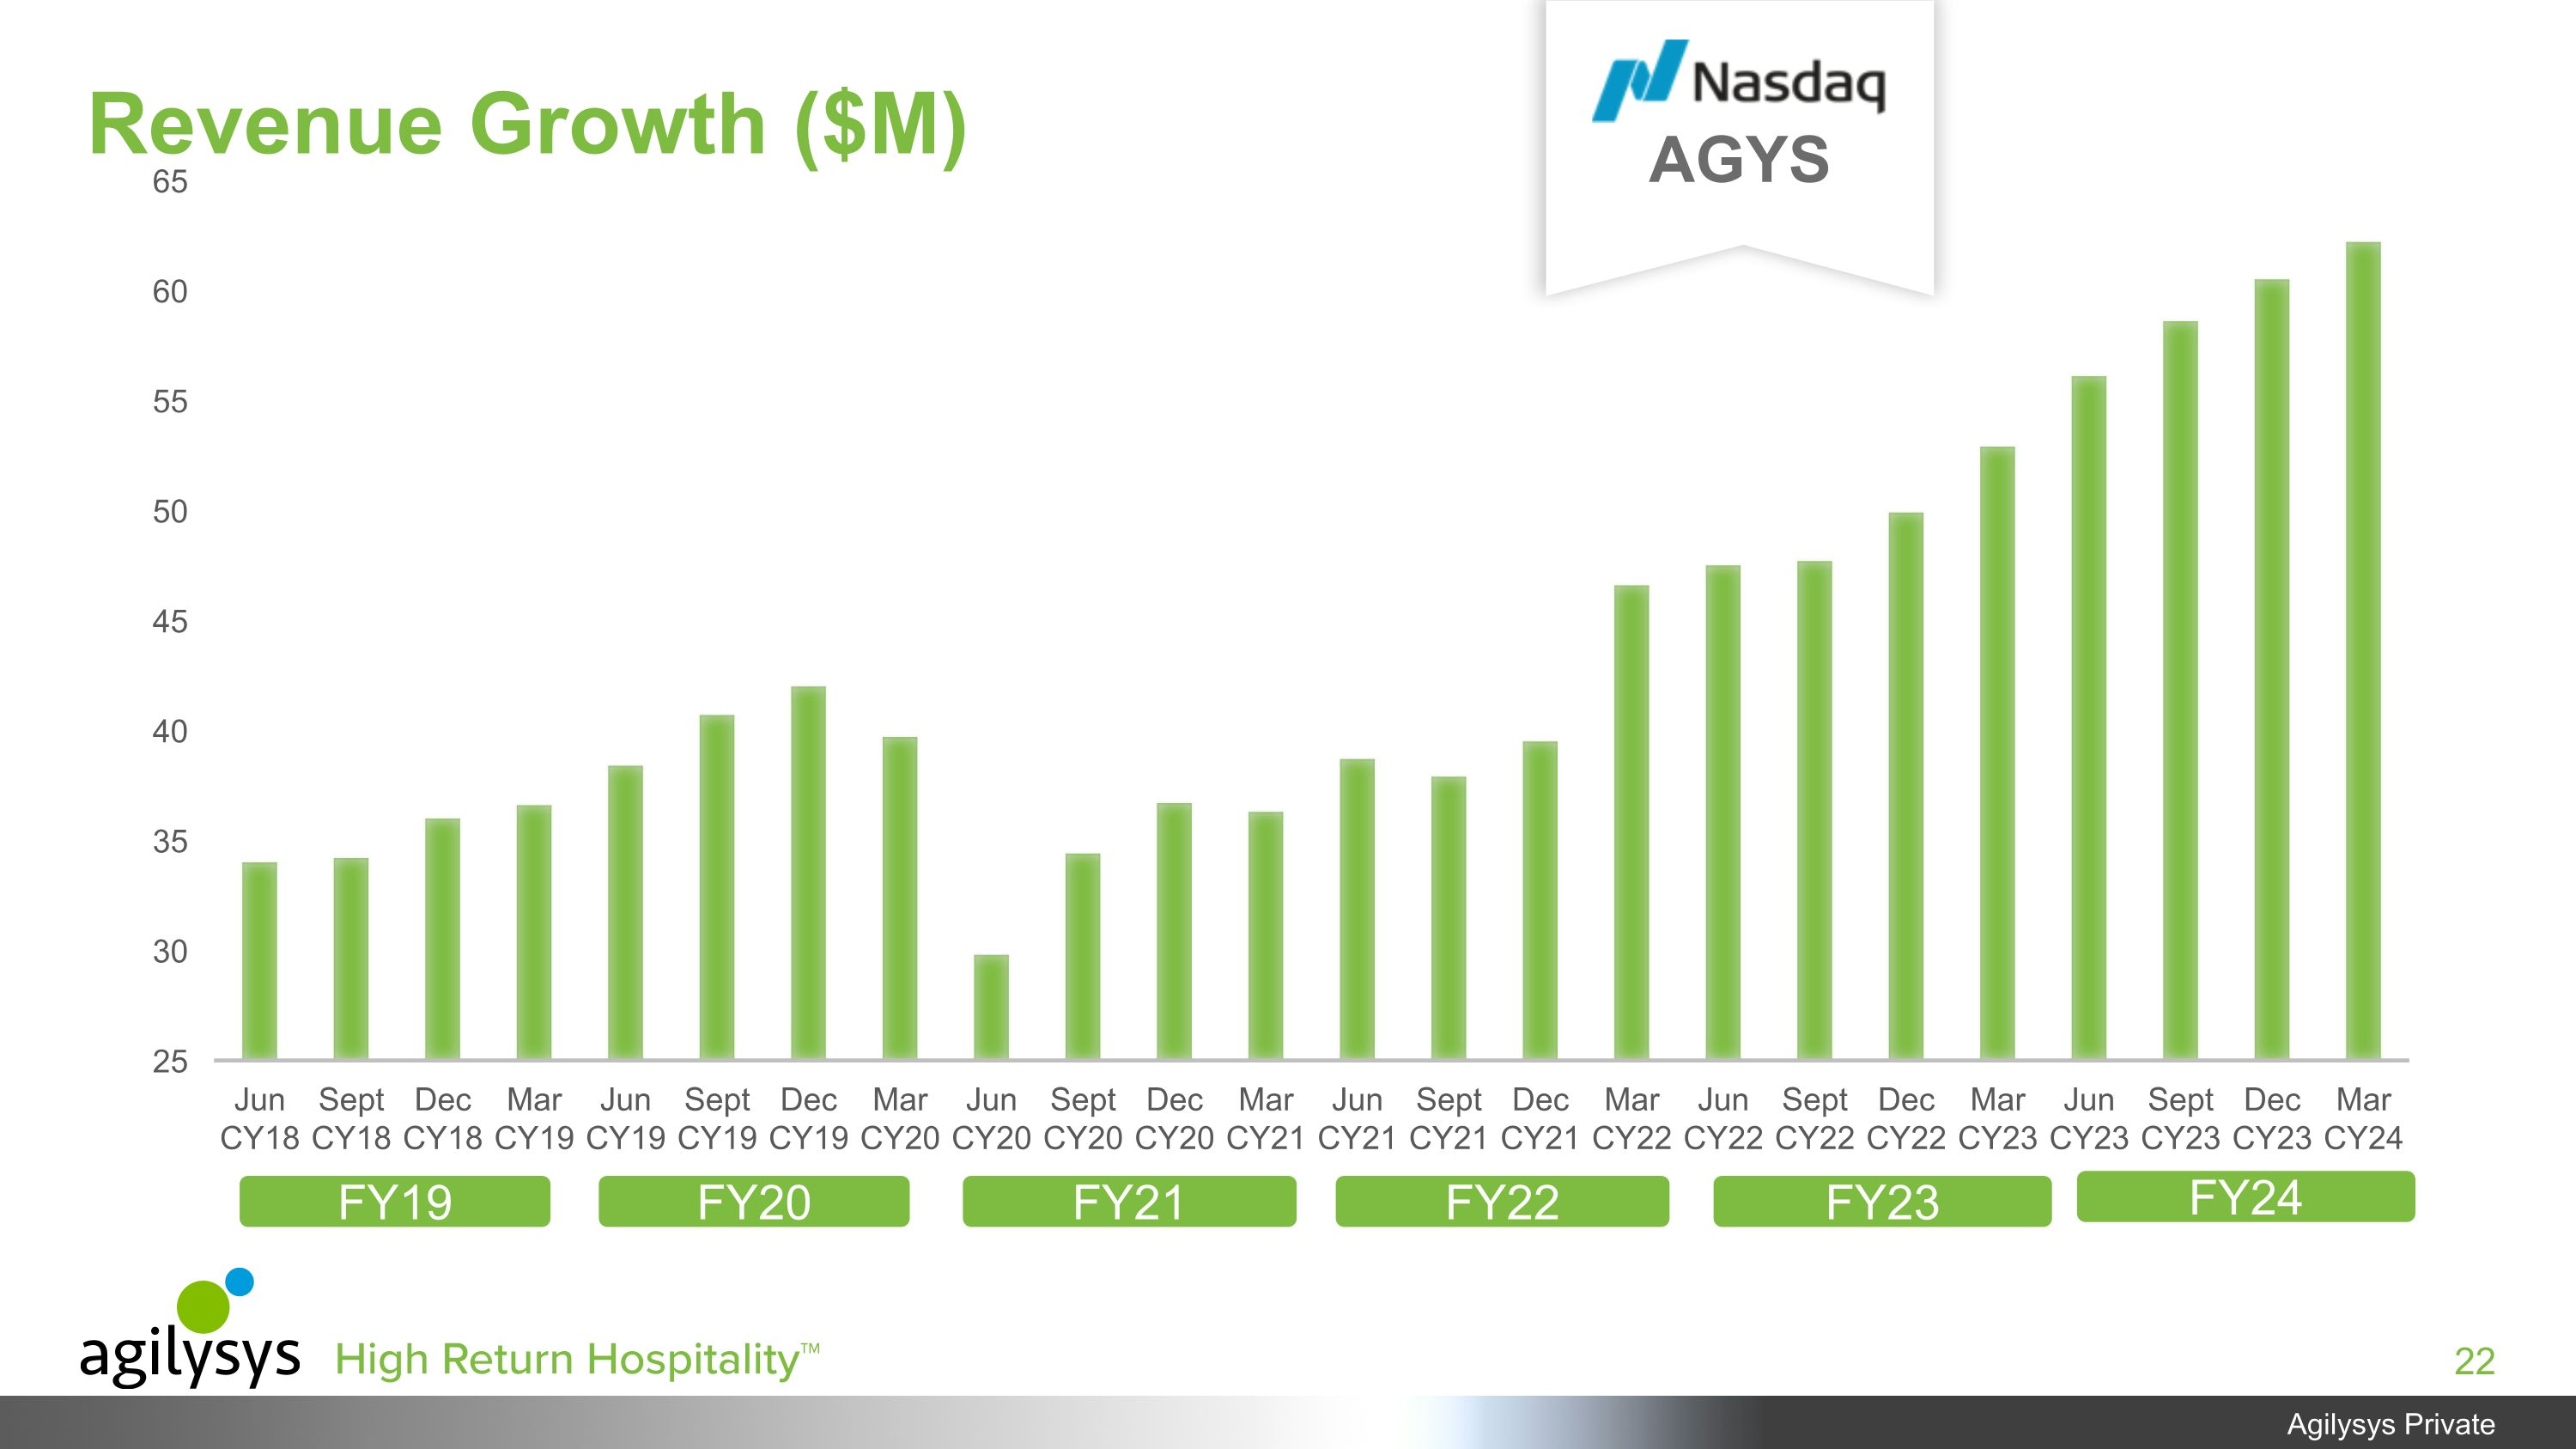
Revenue Growth ($M) FY24 FY20 FY21 FY22 AGYS FY23 FY19
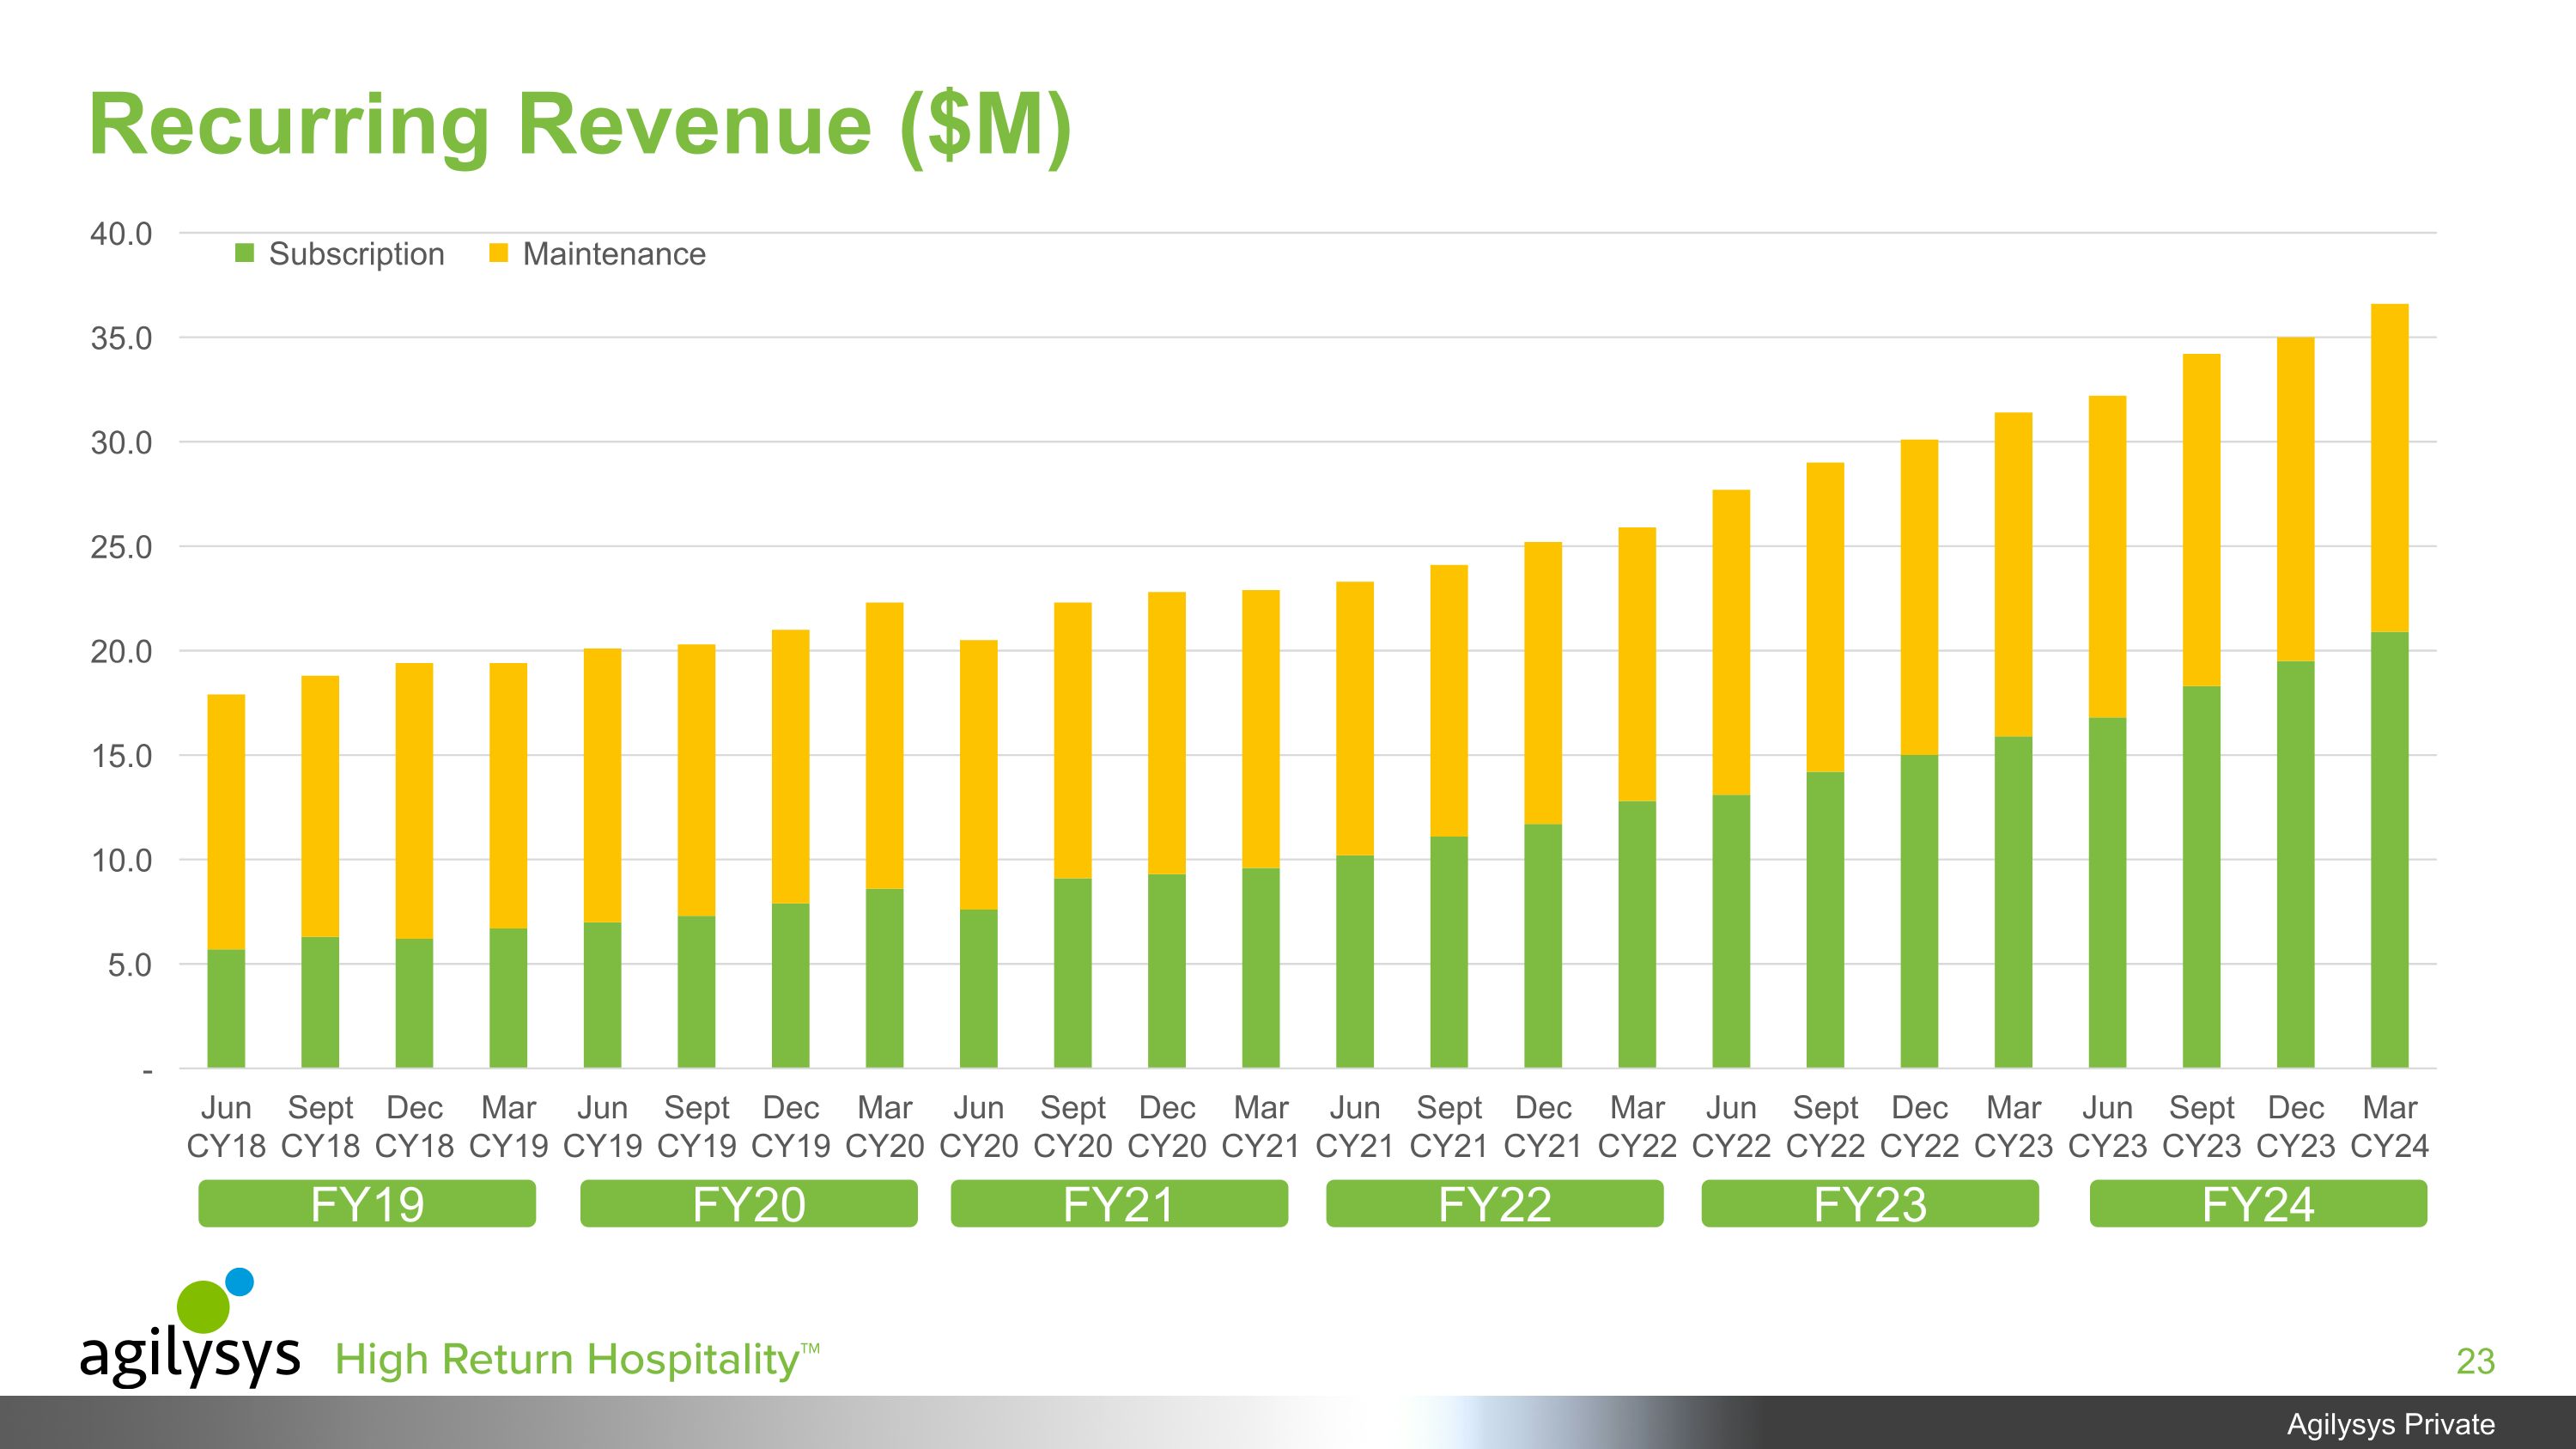
FY19 Recurring Revenue ($M) FY24 FY20 FY21 FY22 FY23
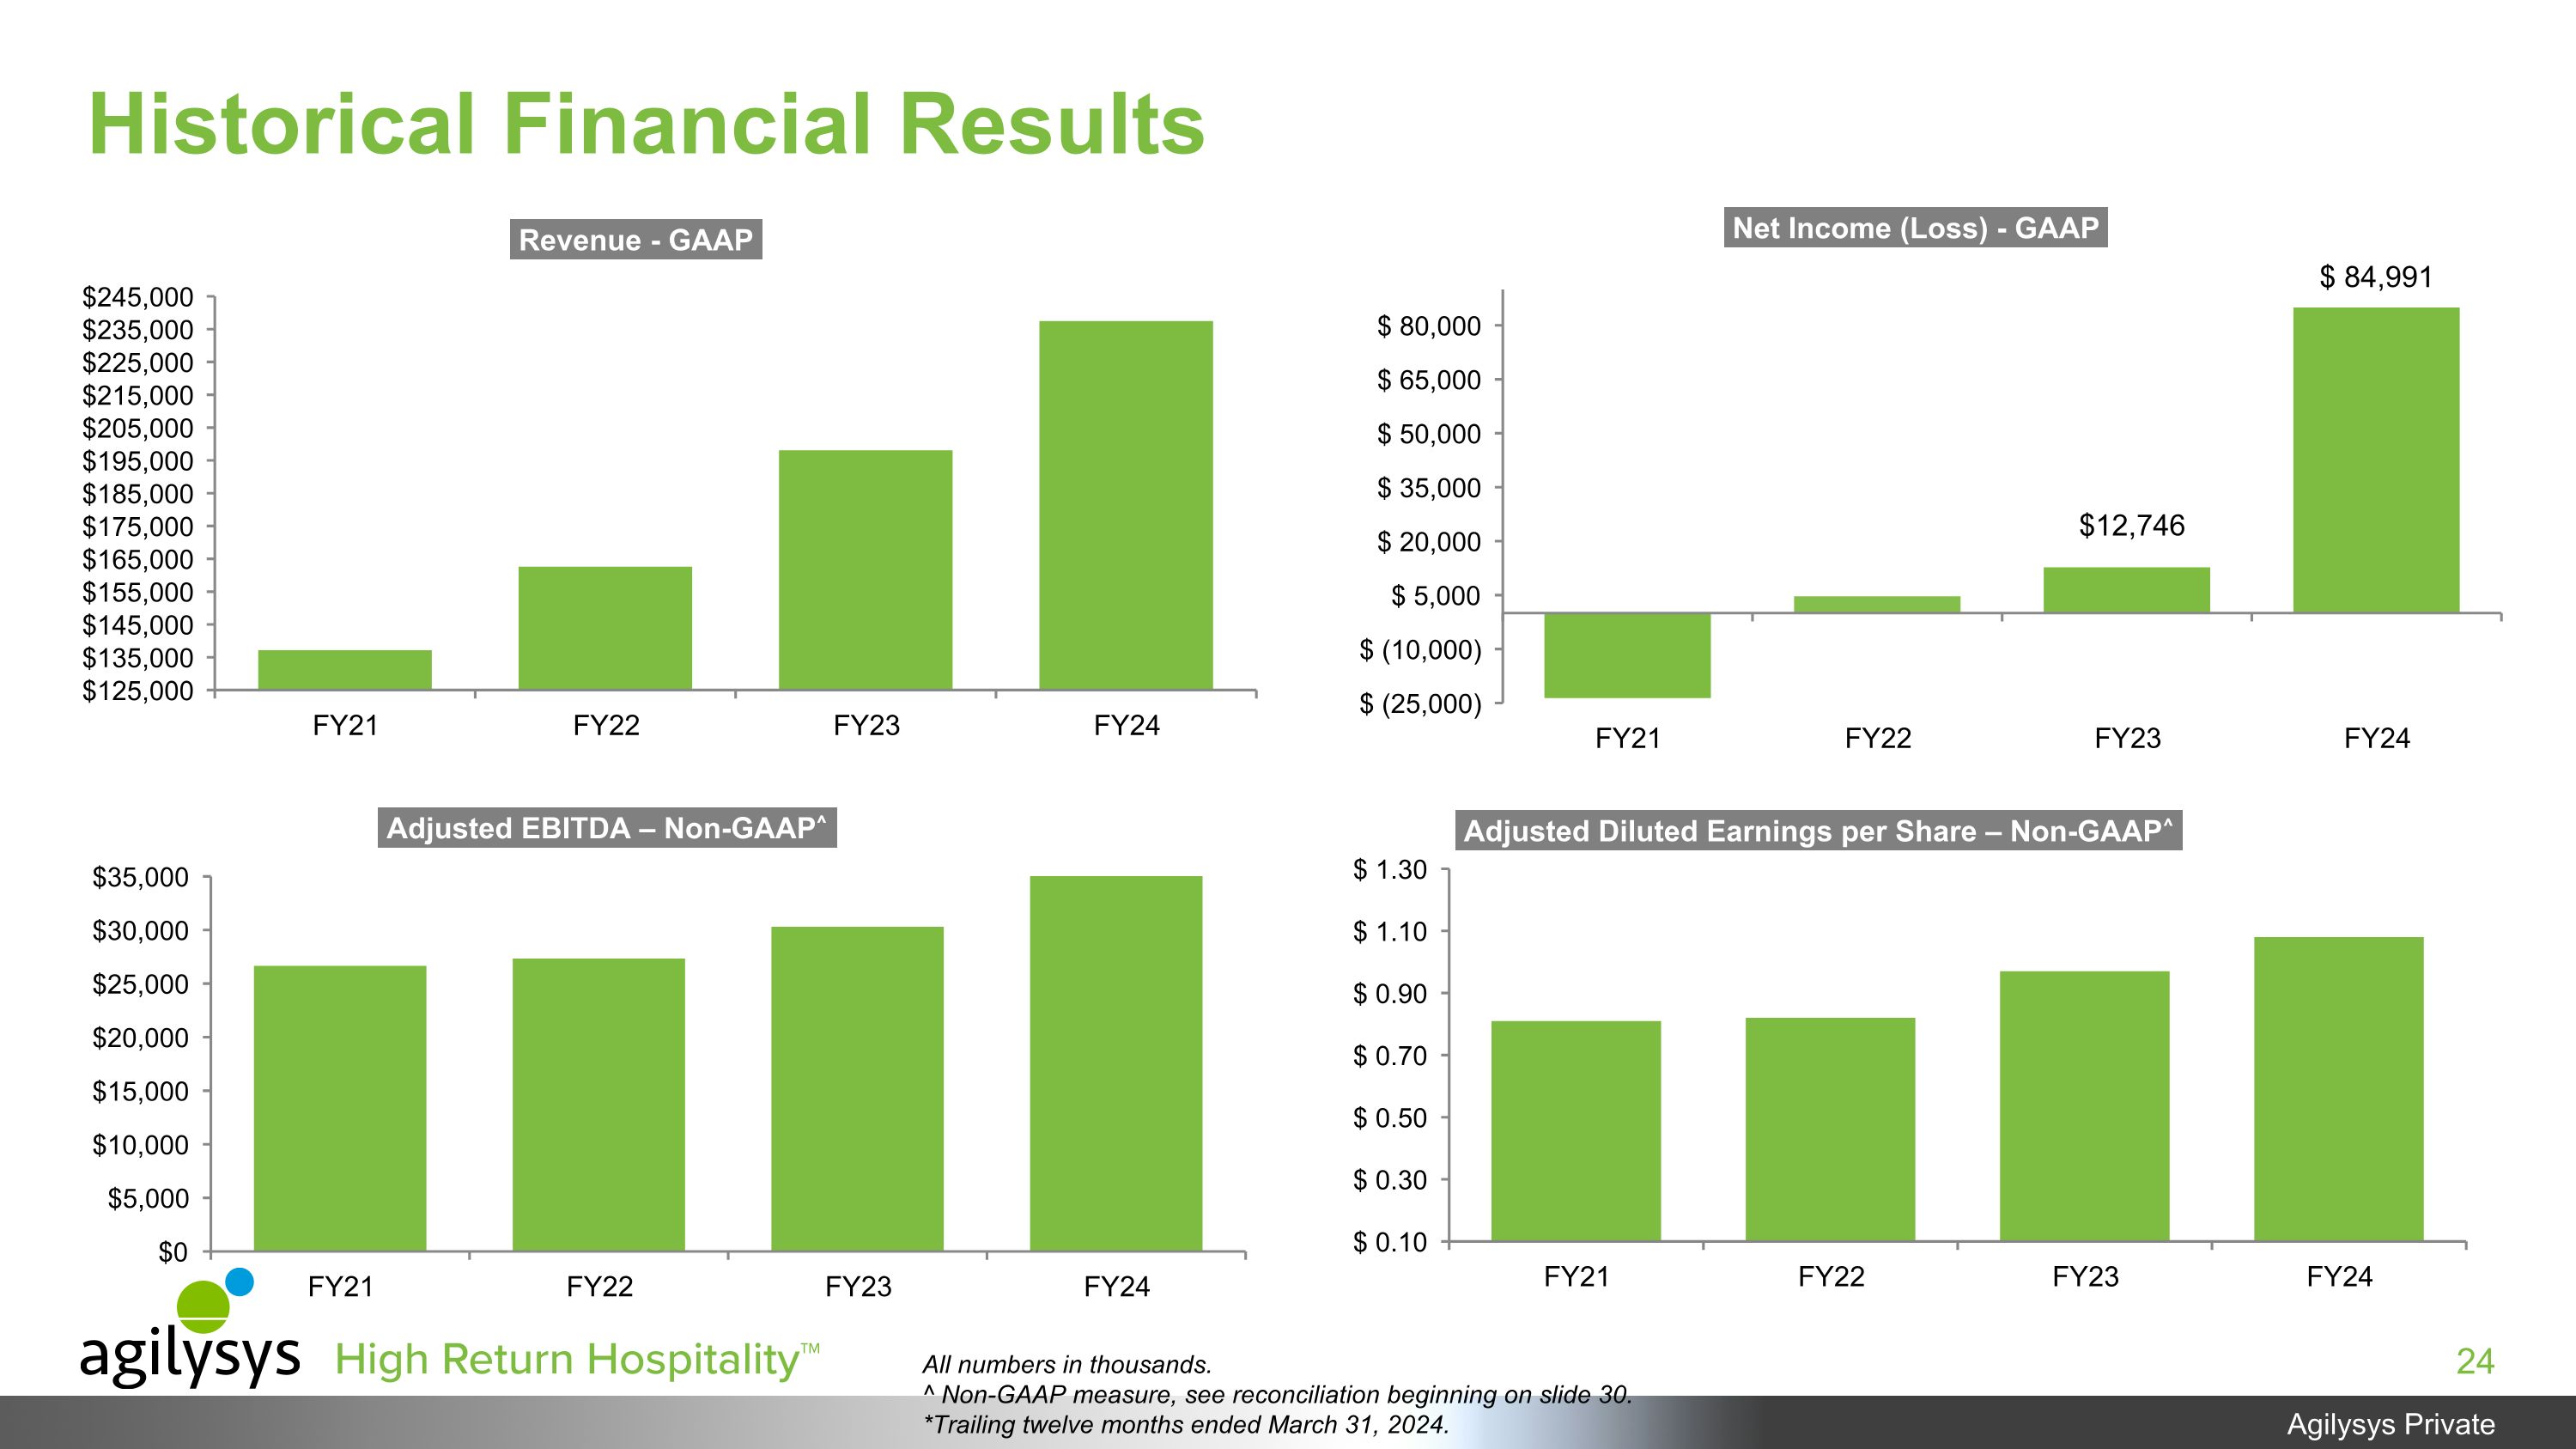
Historical Financial Results All numbers in thousands. ^ Non-GAAP measure, see reconciliation beginning on slide 30. *Trailing twelve months ended March 31, 2024.

APPENDIX
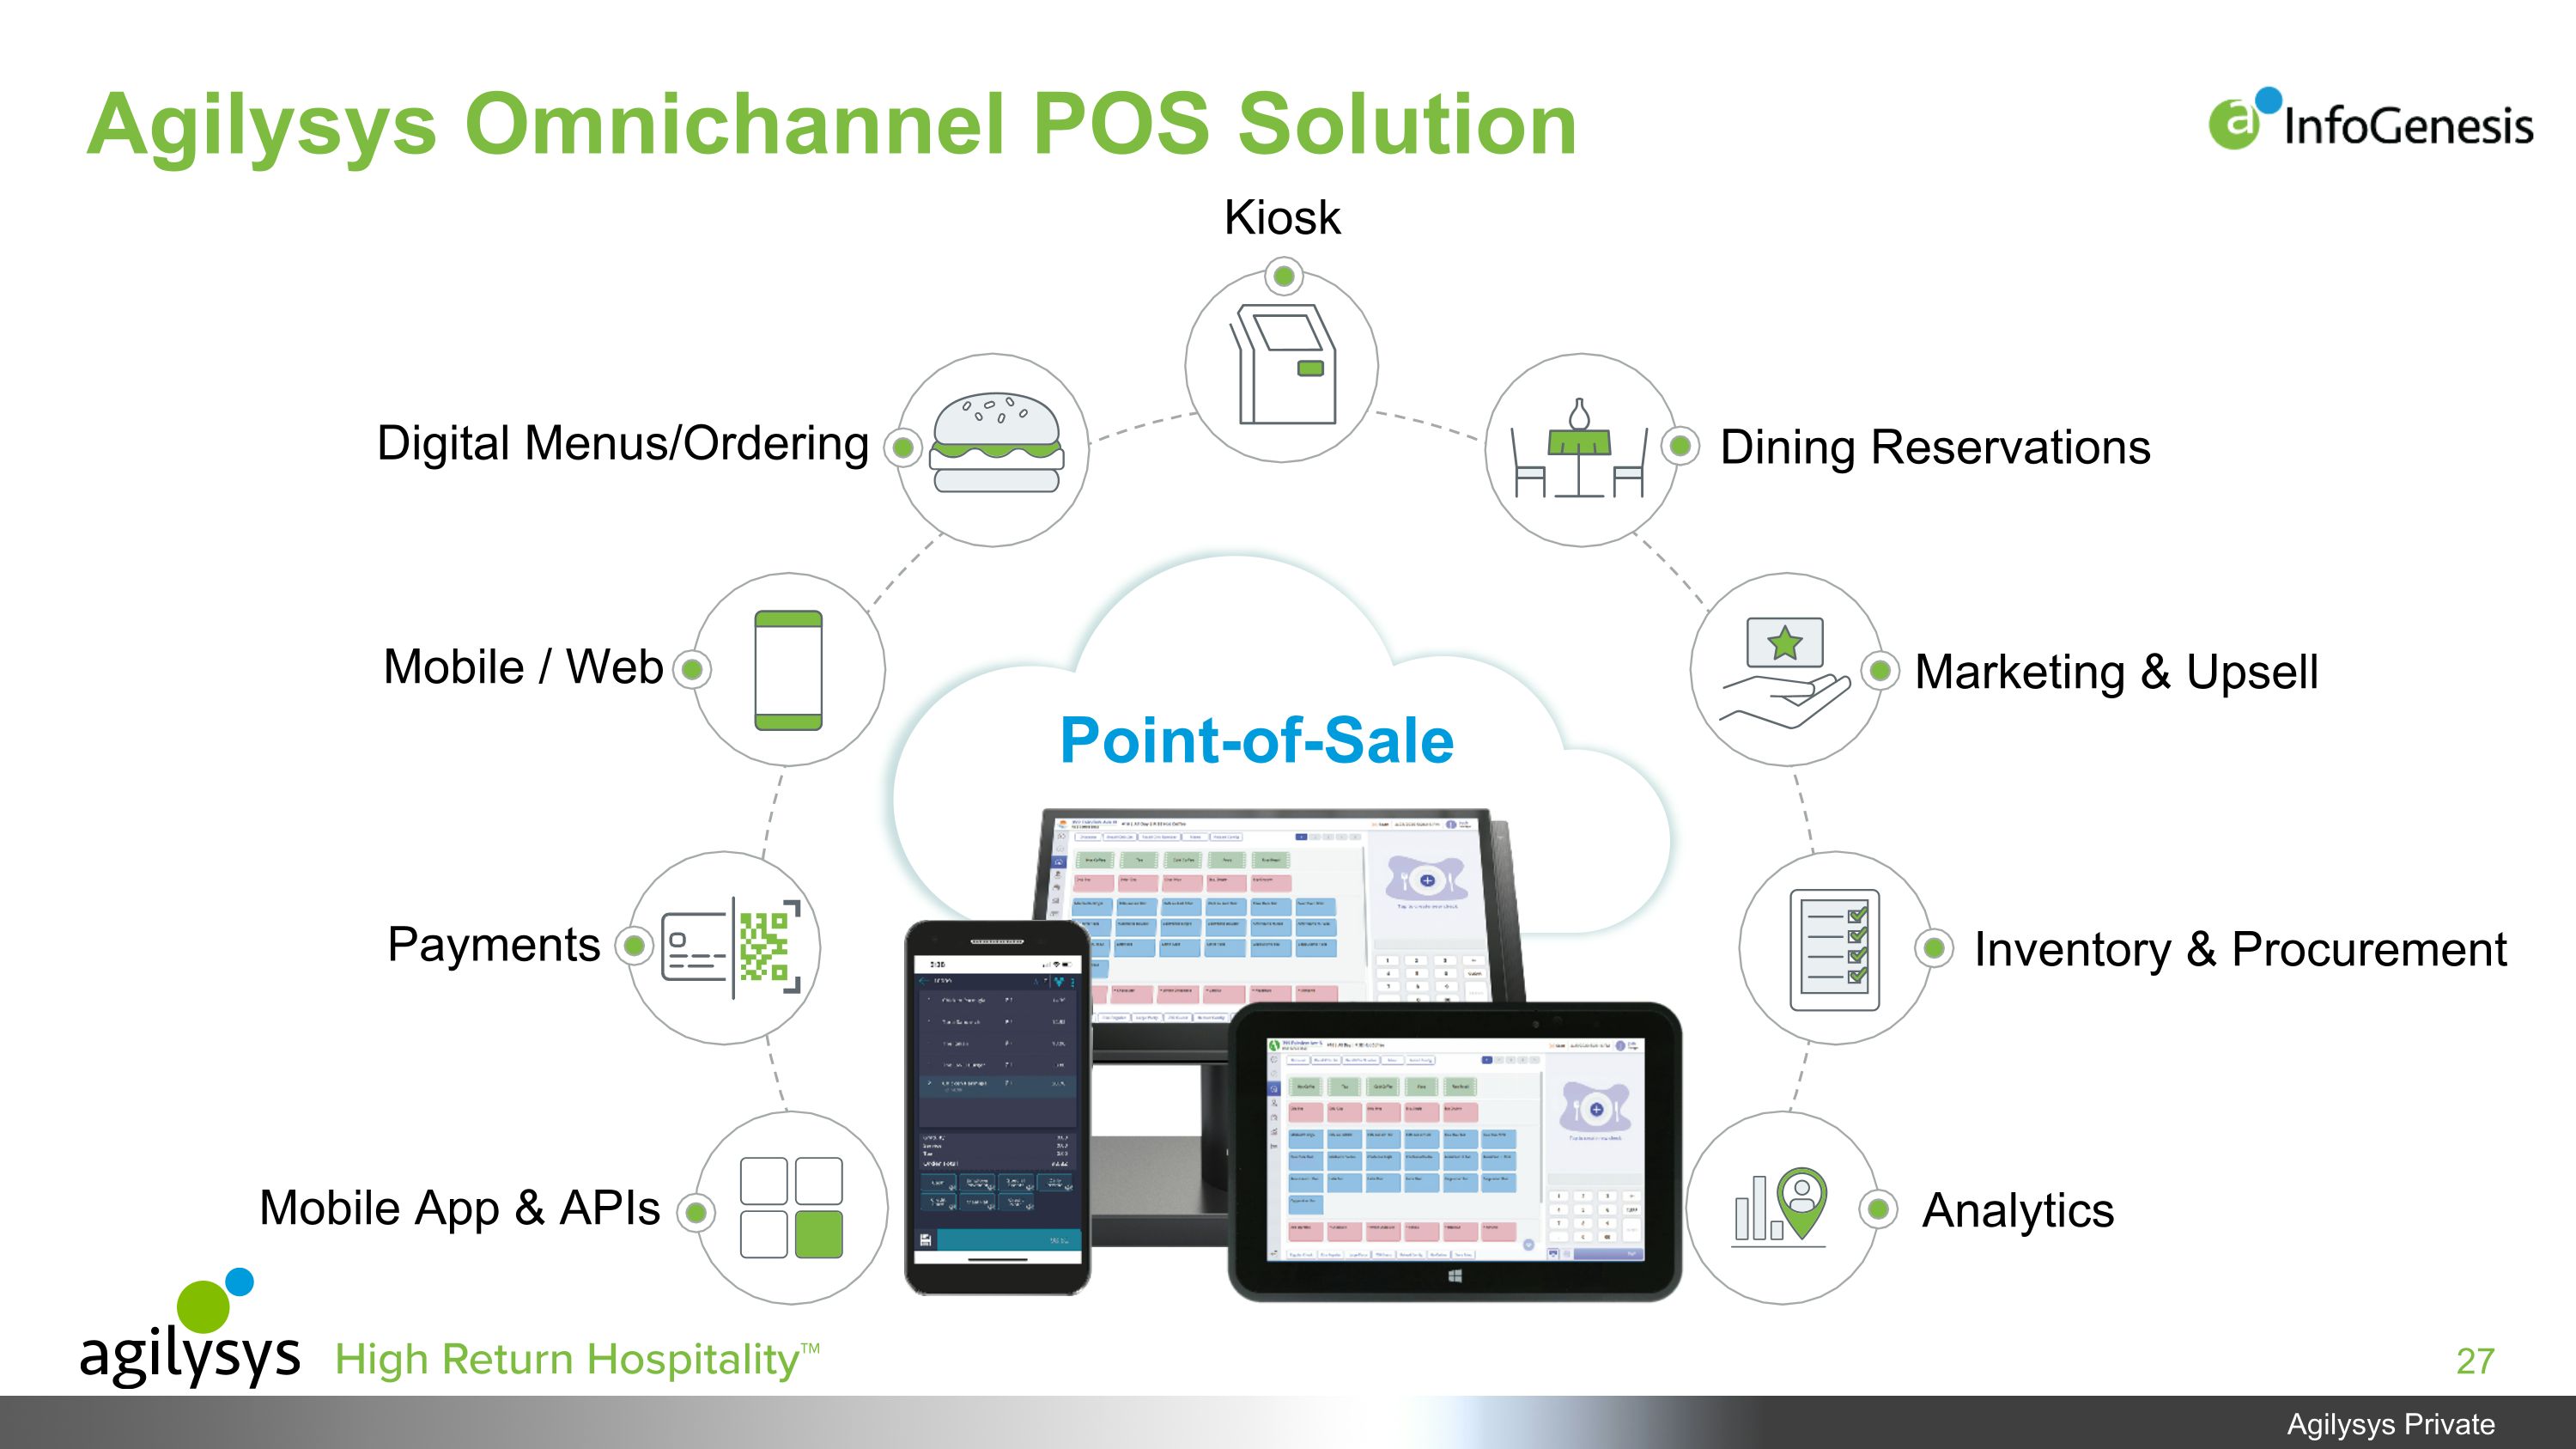
Agilysys Omnichannel POS Solution Payments Mobile App & APIs Marketing & Upsell Mobile / Web Analytics Kiosk Digital Menus/Ordering Dining Reservations Inventory & Procurement Point-of-Sale
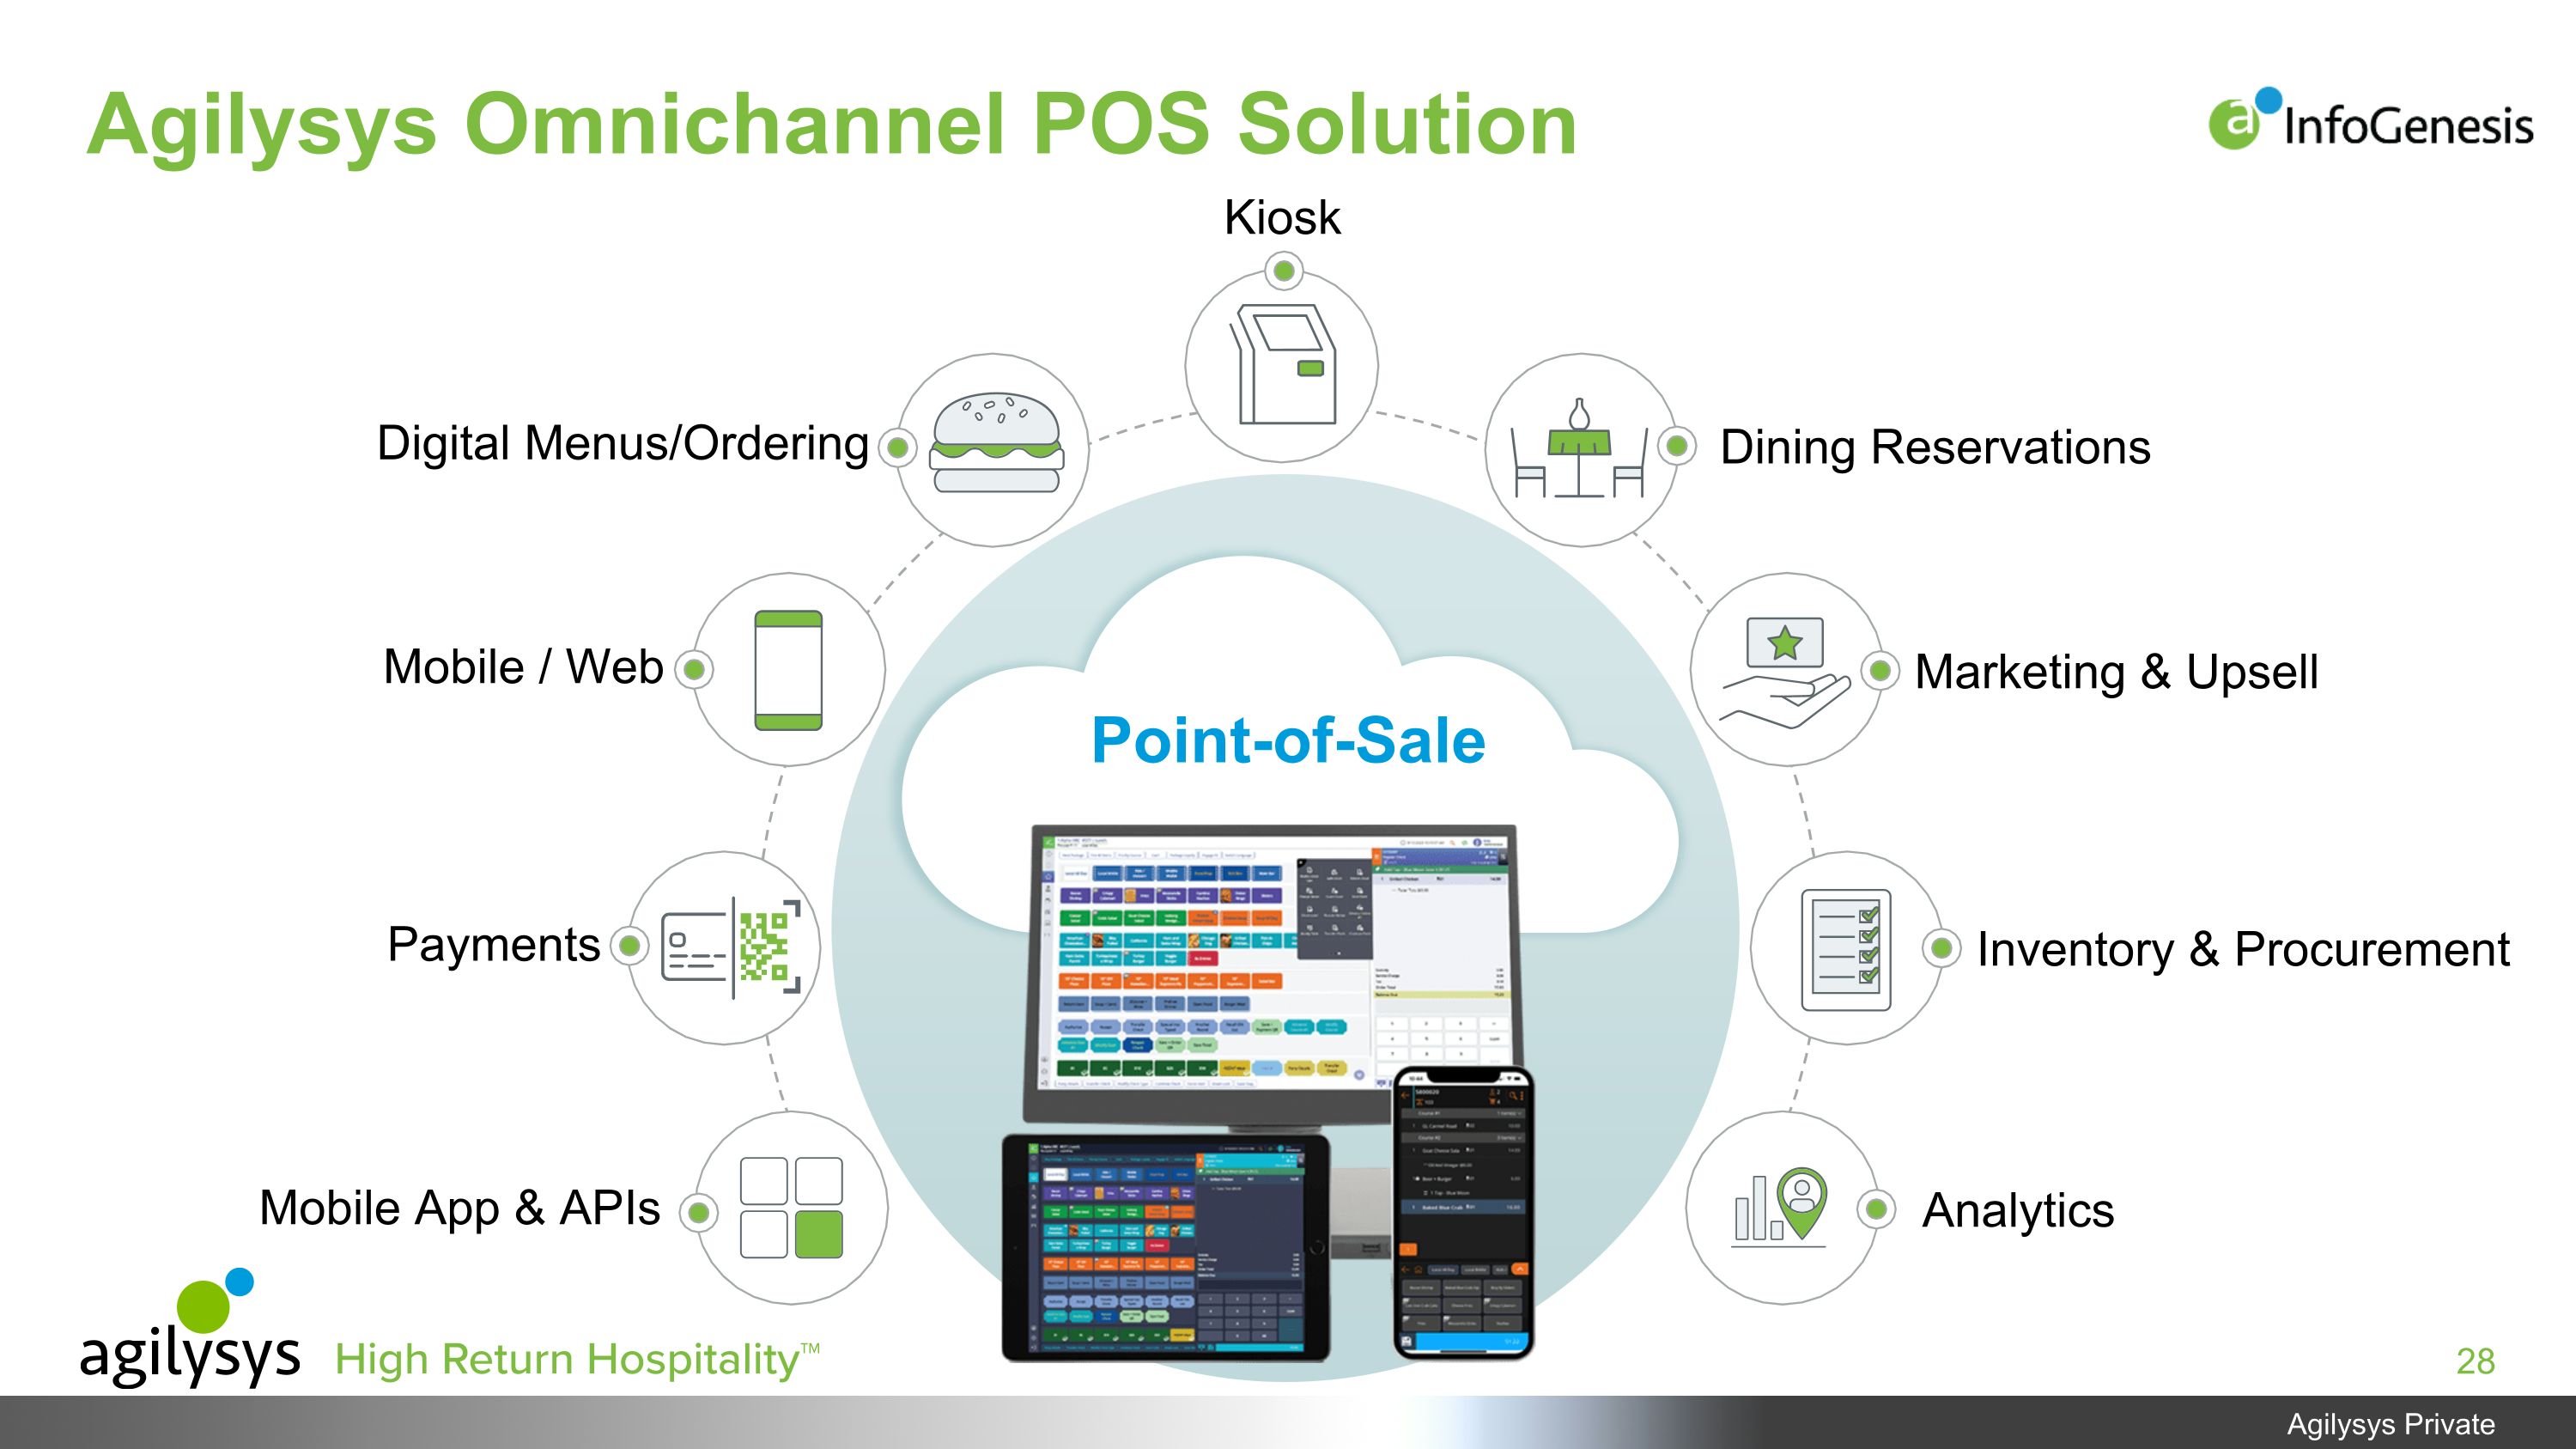
Agilysys Omnichannel POS Solution Payments Mobile App & APIs Marketing & Upsell Mobile / Web Analytics Kiosk Digital Menus/Ordering Dining Reservations Point-of-Sale Inventory & Procurement
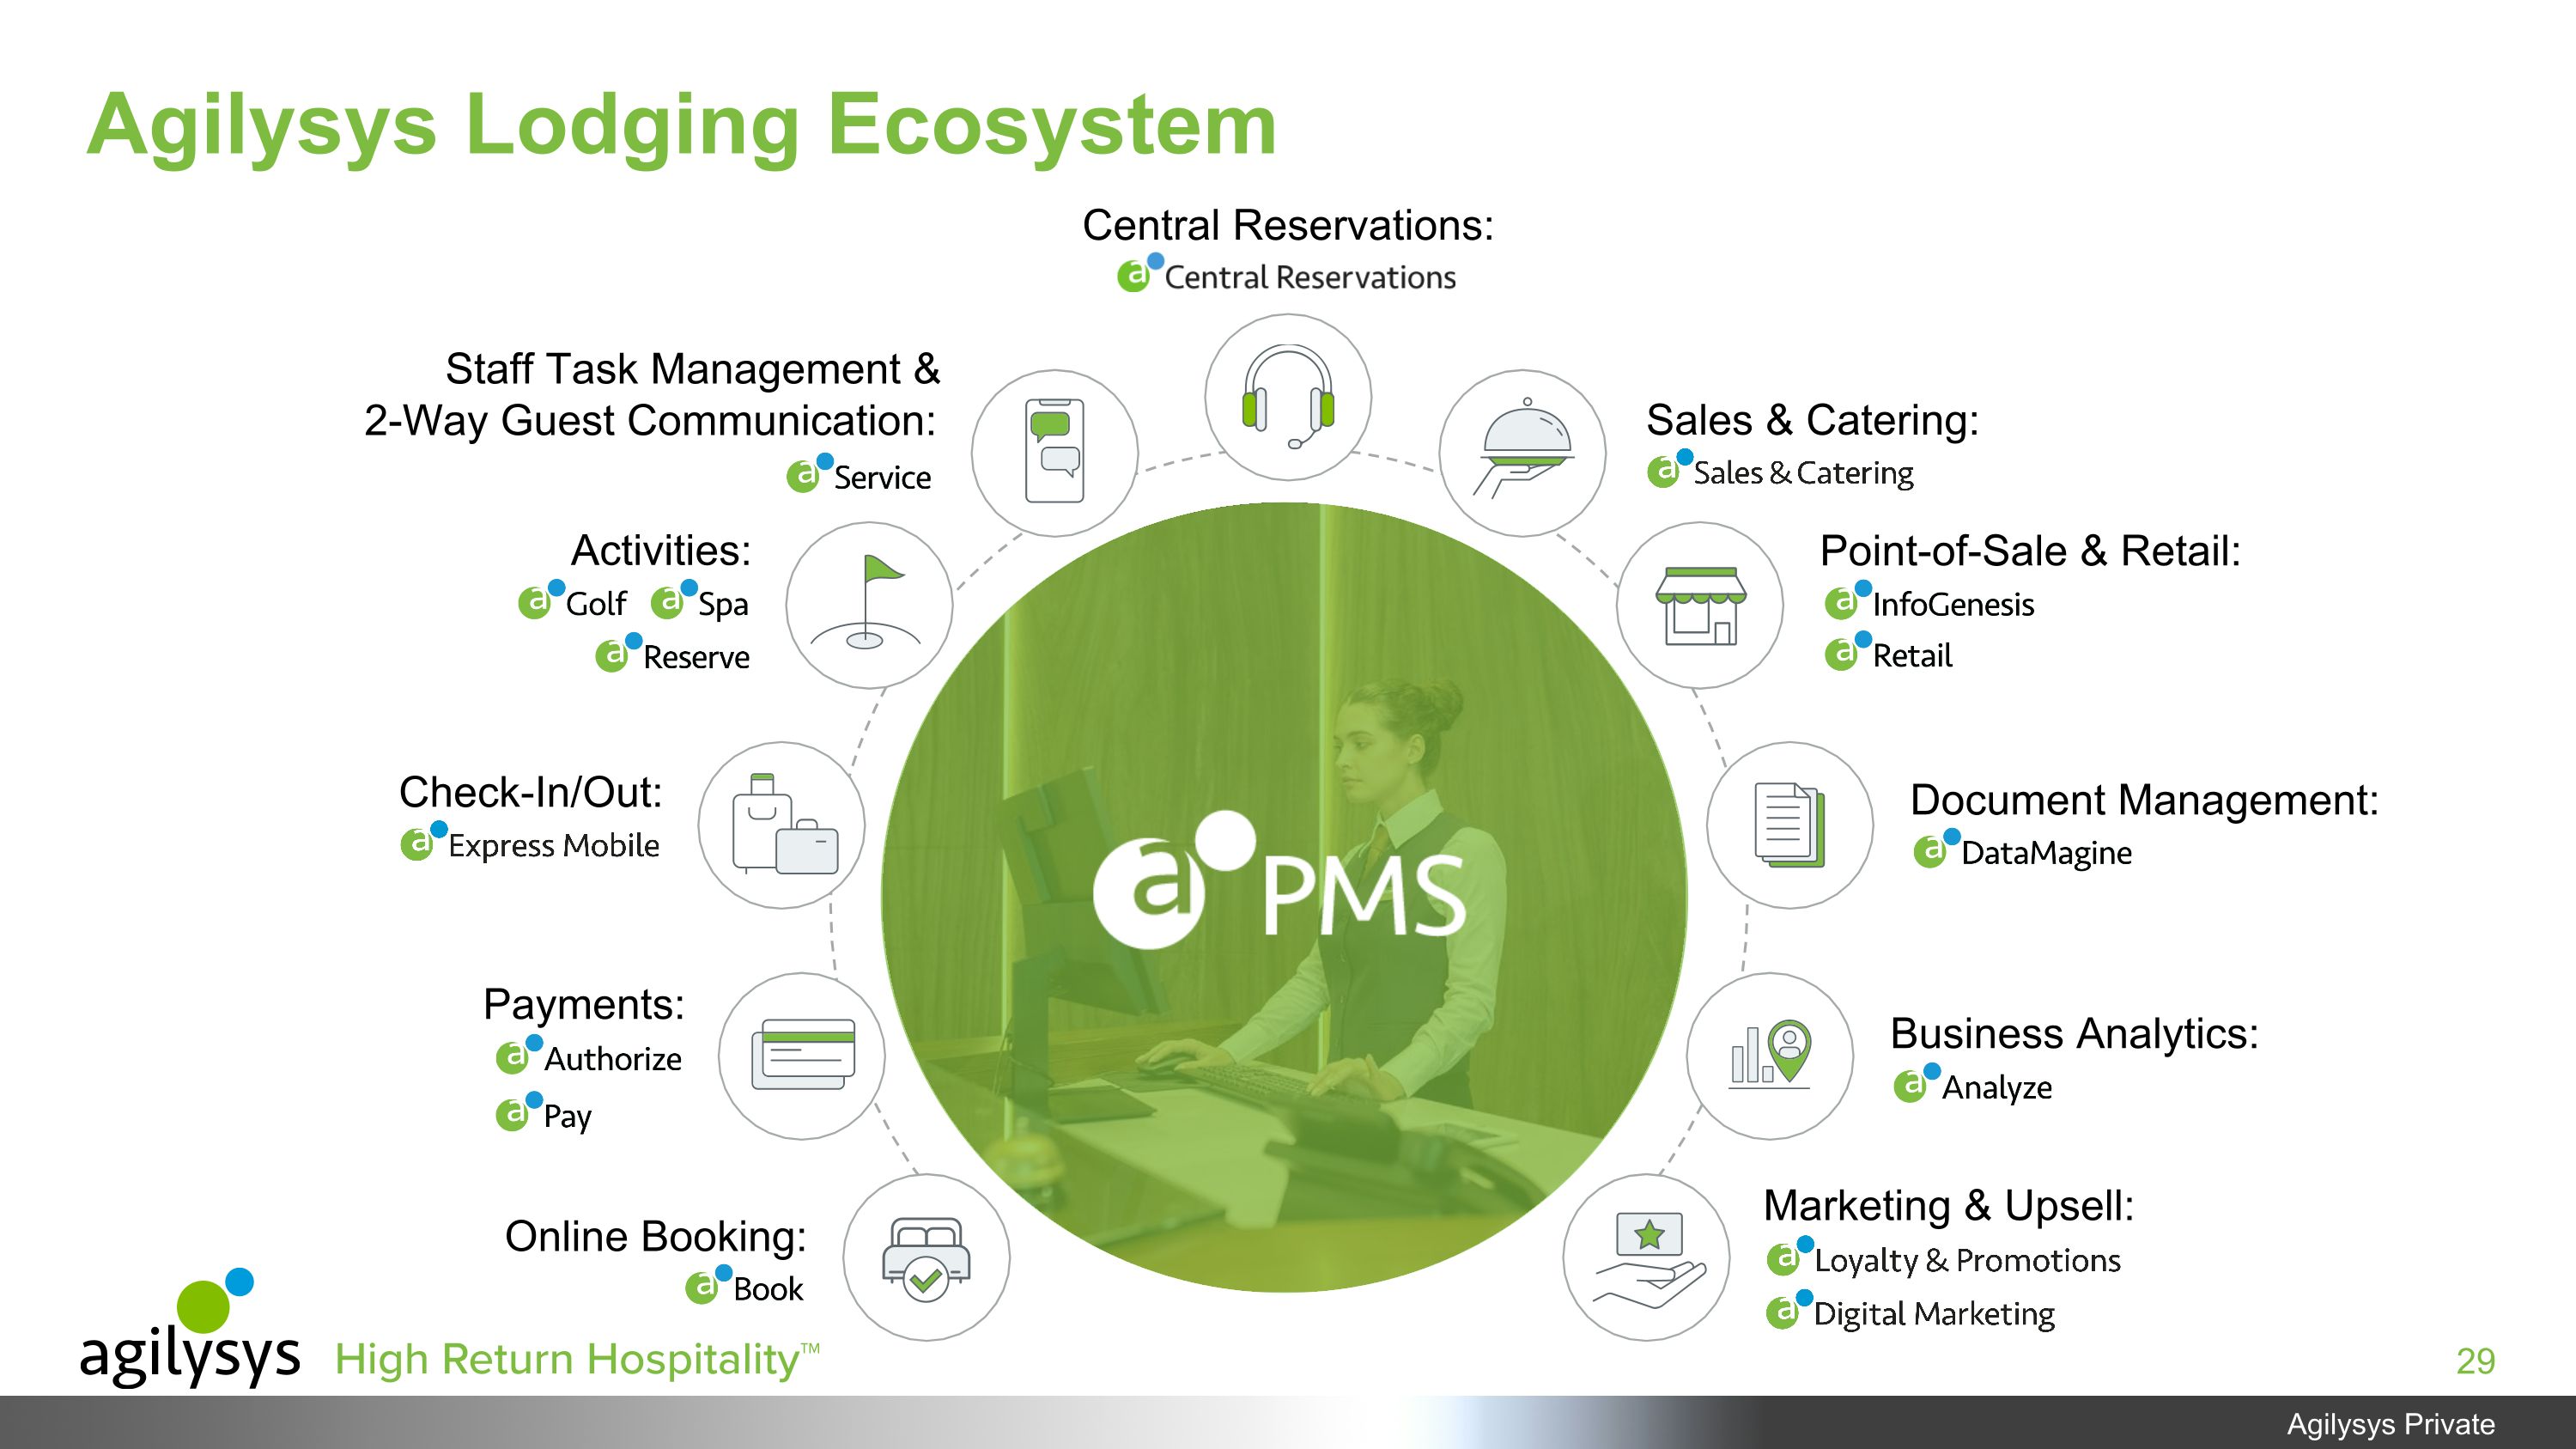
Agilysys Lodging Ecosystem Staff Task Management & 2-Way Guest Communication: Payments: Online Booking: Sales & Catering: Document Management: Business Analytics: Marketing & Upsell: Central Reservations: Activities: Check-In/Out: Point-of-Sale & Retail:
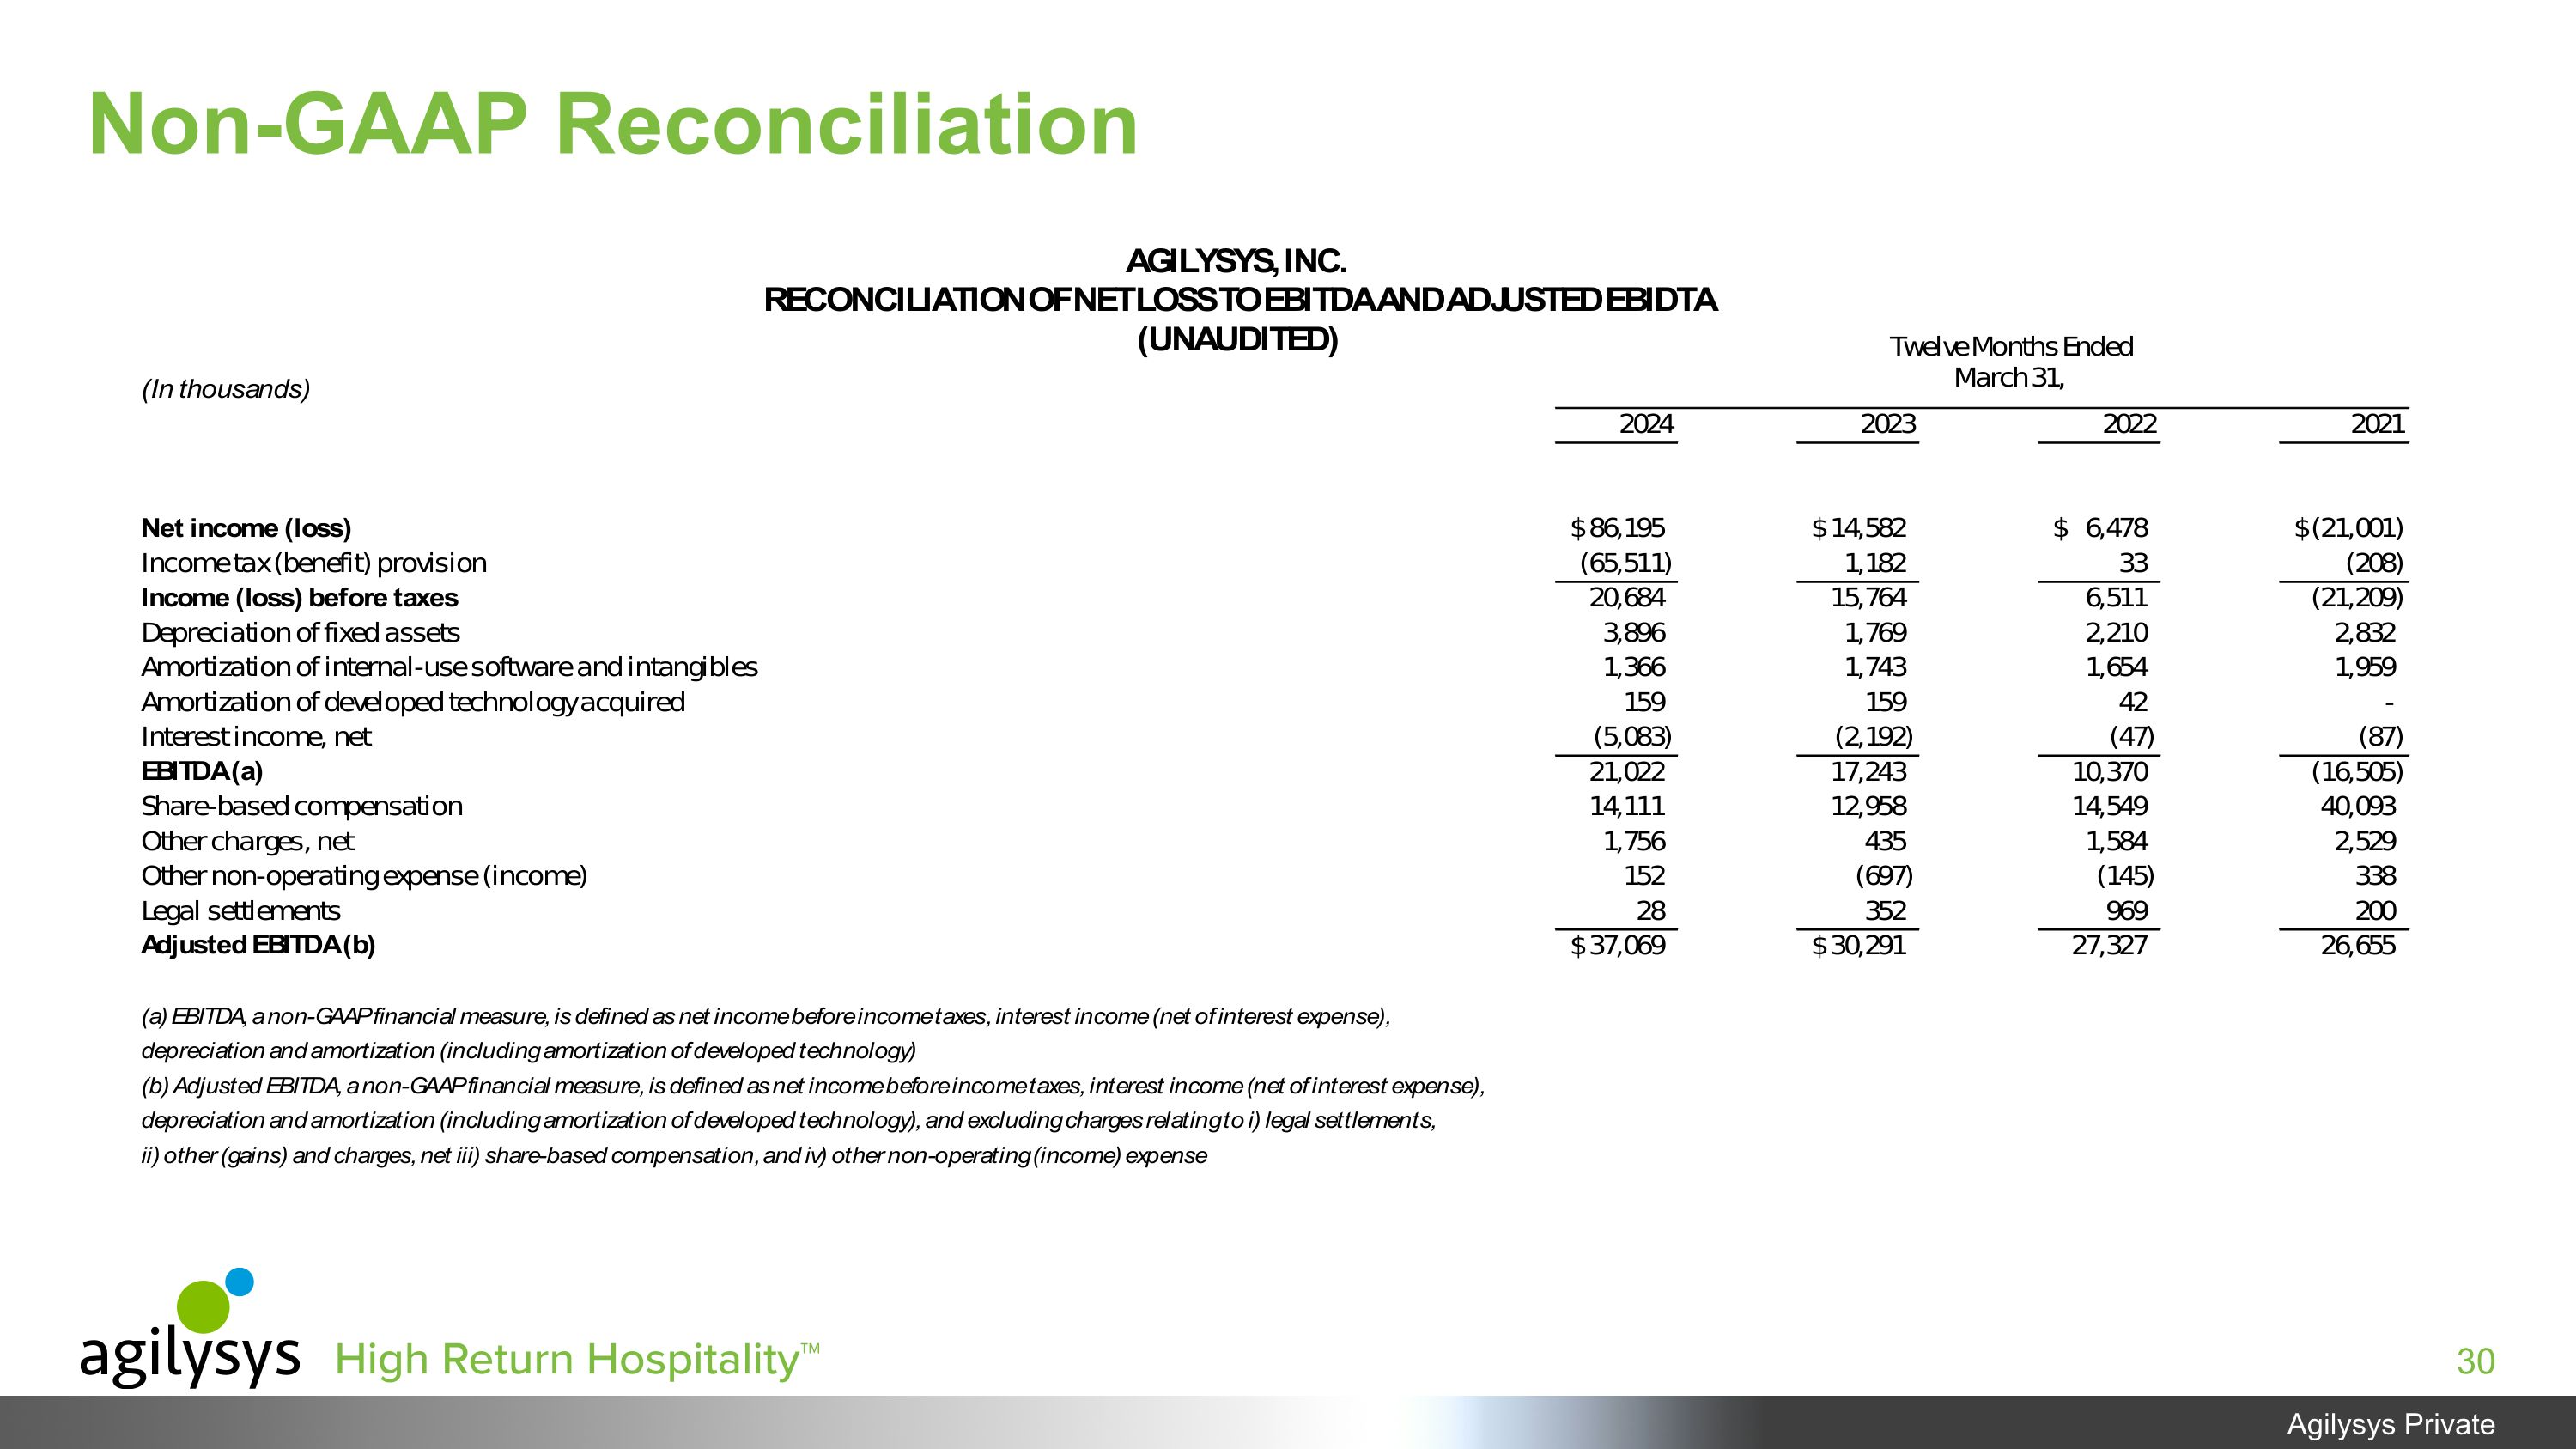
Non-GAAP Reconciliation
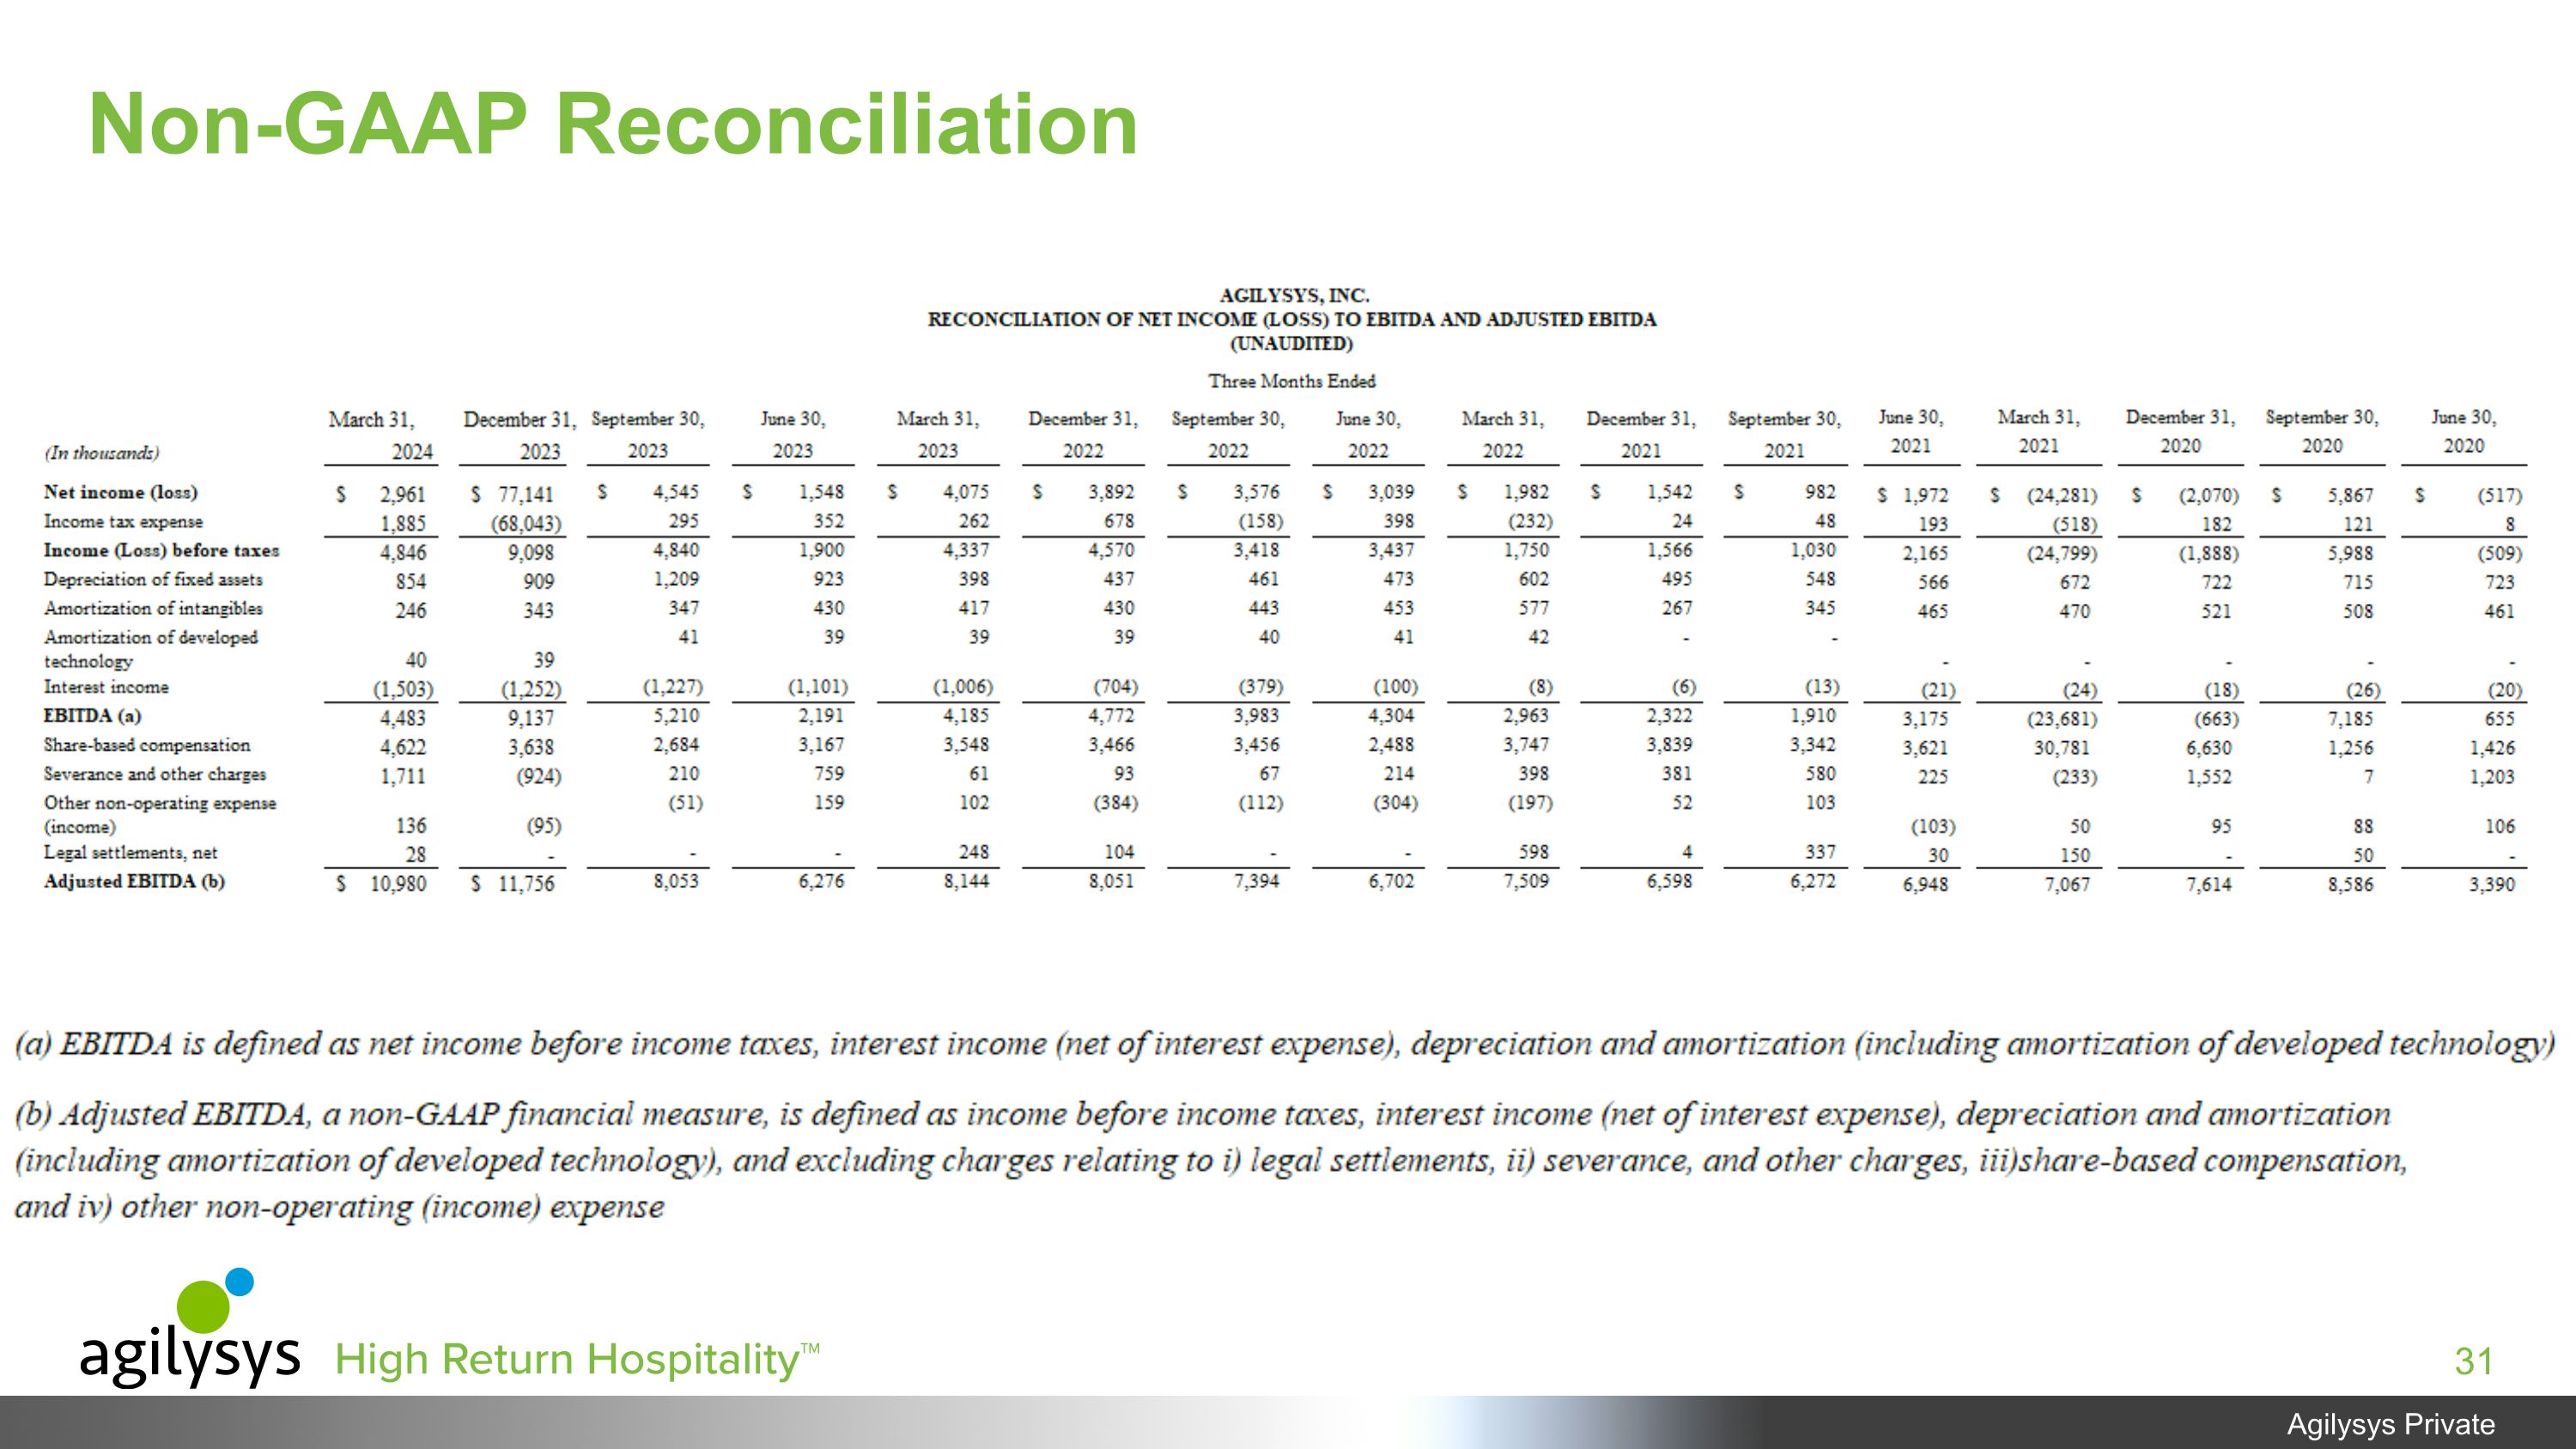
Non-GAAP Reconciliation
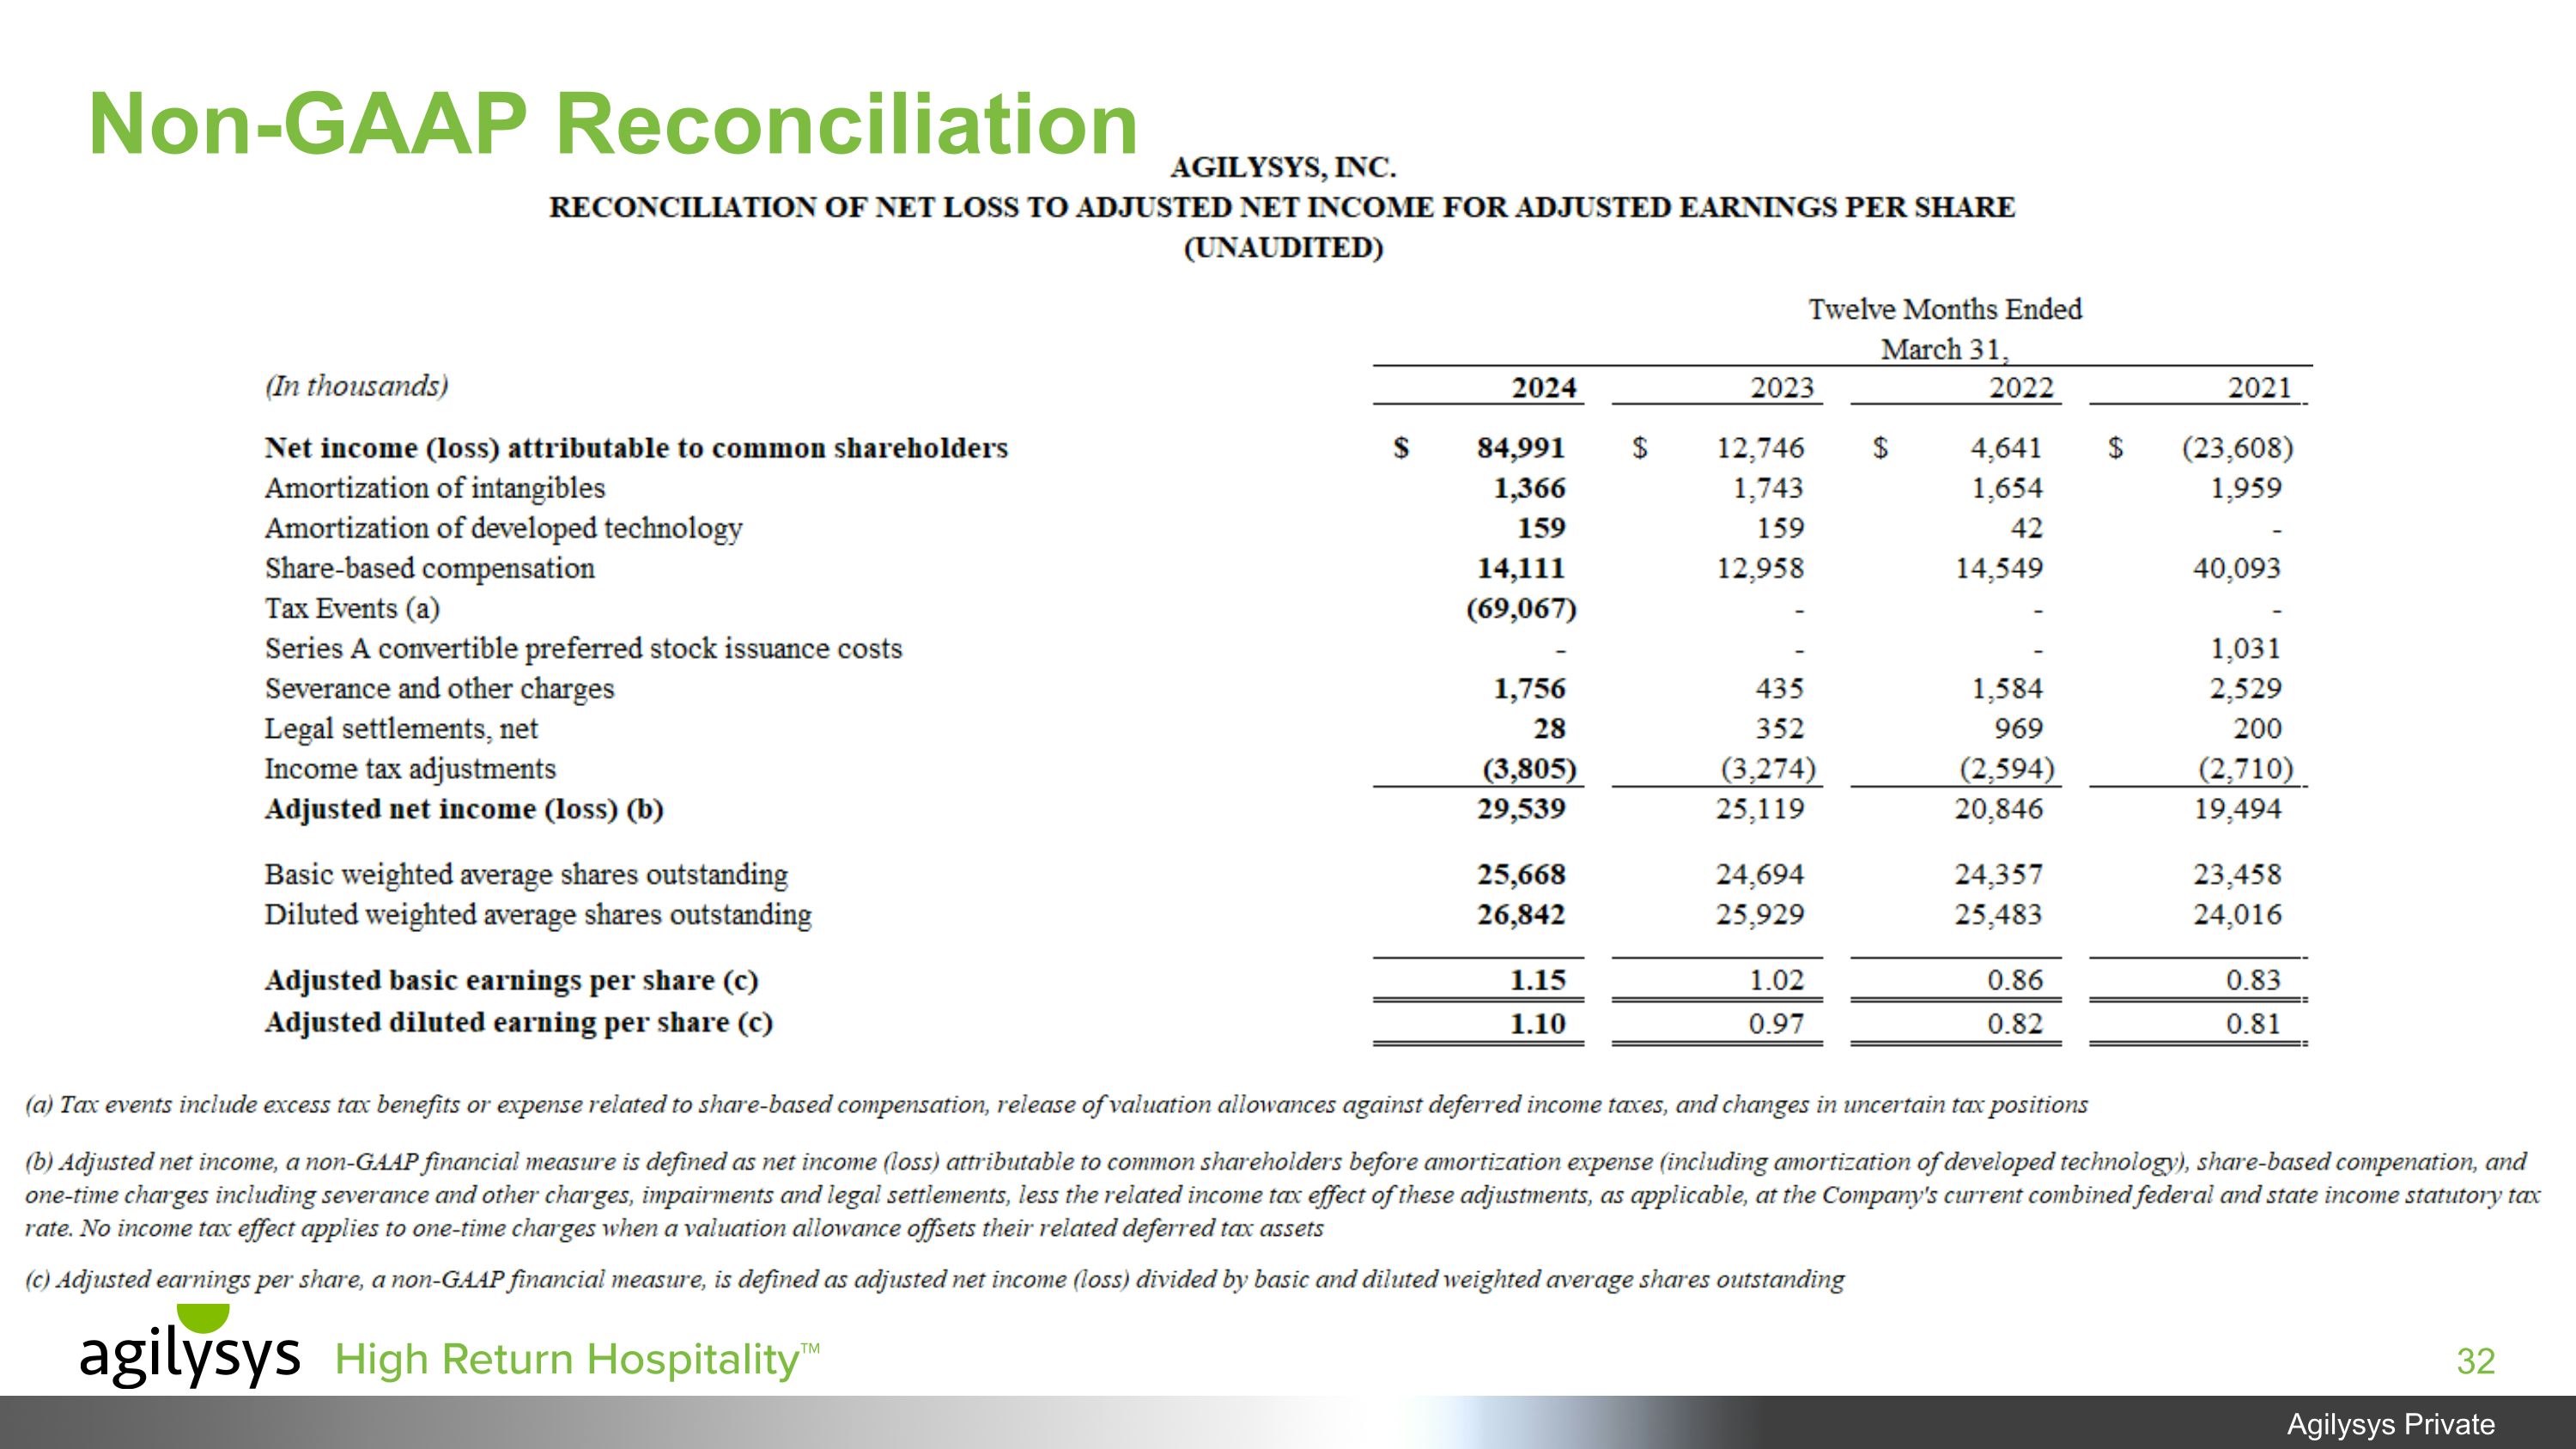
Non-GAAP Reconciliation
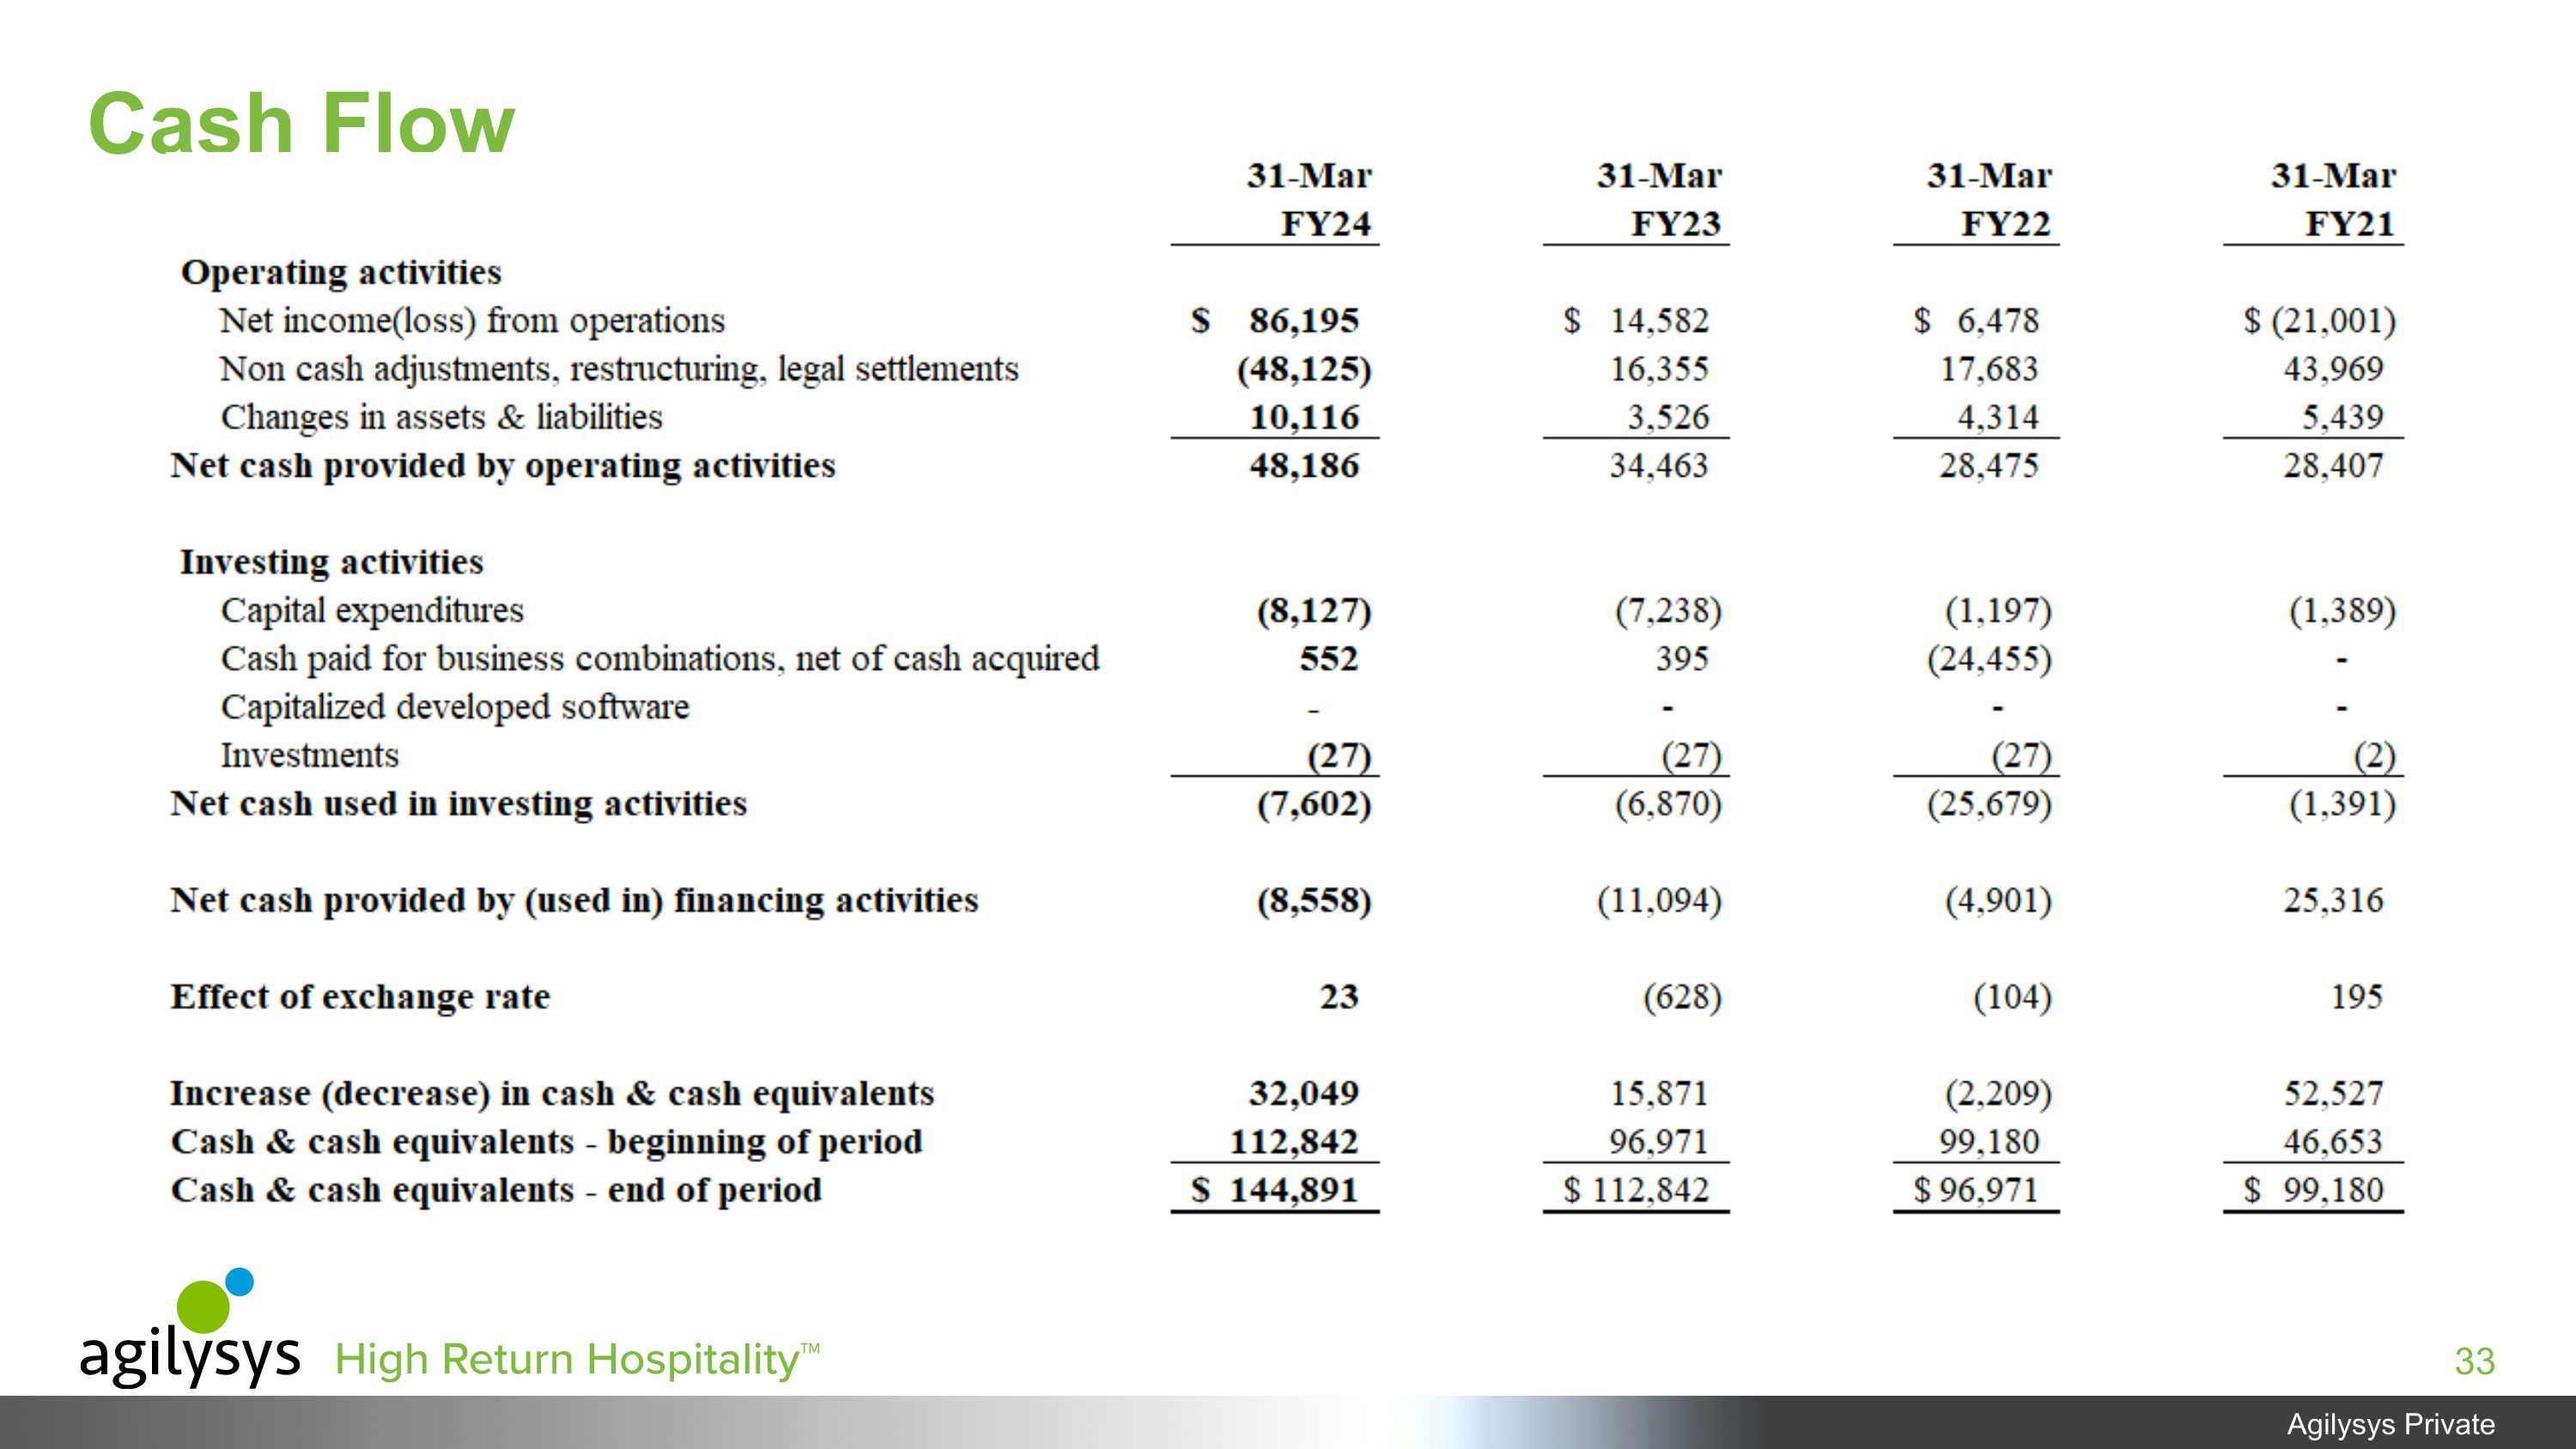
Cash Flow
Jessica Hennessy Senior Director Corporate Strategy and Investor Relations (770) 810-6116 InvestorRelations@agilysys.com


