Pioneer Core
Equity Fund
| | |
| Semiannual Report | June 30, 2020 |
|
| Ticker Symbols: |
Class A | PIOTX |
Class C | PCOTX |
Class K | PCEKX |
Class R | CERPX |
Class Y | PVFYX |
Beginning in February 2021, as permitted by regulations adopted by the Securities and Exchange Commission, paper copies of the Fund’s shareholder reports like this one will no longer be sent by mail, unless you specifically request paper copies of the reports from the Fund or from your financial intermediary, such as a broker-dealer, bank or insurance company. Instead, the reports will be made available on the Fund’s website, and you will be notified by mail each time a report is posted and provided with a website link to access the report.
If you already elected to receive shareholder reports electronically, you will not be affected by this change and you need not take any action. You may elect to receive shareholder reports and other communications electronically by contacting your financial intermediary or, if you invest directly with the Fund, by calling 1-800-225-6292.
You may elect to receive all future reports in paper free of charge. If you invest directly with the Fund, you can inform the Fund that you wish to continue receiving paper copies of your shareholder reports by calling 1-800-225-6292. If you invest through a financial intermediary, you can contact your financial intermediary to request that you continue to receive paper copies of your shareholder reports. Your election to receive reports in paper will apply to all funds held in your account if you invest through your financial intermediary or all funds held within the Pioneer Fund complex if you invest directly.
visit us: www.amundipioneer.com/us
Pioneer Core Equity Fund | Semiannual Report | 6/30/20 1
Dear Shareholders,
The new decade has arrived delivering a half-year that will go down in the history books. The beginning of 2020 seemed to extend the positive market environment of 2019. Then, March roared in like a lion and the COVID-19 pandemic became a global crisis impacting lives and life as we know it. The long-term impact on the global economy from the COVID-19 virus pandemic, while currently unknown, is likely to be considerable. It is clear that several industries have already felt greater effects than others. And the markets, which do not thrive on uncertainty, have been volatile, delivering significantly negative performance in the first quarter, and then staging a strong rally in the opening weeks of the second quarter. Our business continuity plan was implemented given the new COVID-19 guidelines, and most of our employees are working remotely. To date, our operating environment has faced no interruption. I am proud of the careful planning that has taken place and confident we can maintain this environment for as long as is prudent. History in the making for a company that first opened its doors way back in 1928.
Since 1928, Amundi Pioneer’s investment process has been built on a foundation of fundamental research and active management, principles which have guided our investment decisions for more than 90 years. We believe active management – that is, making active investment decisions – can help mitigate the potential risks during periods of market volatility. As the first several months of 2020 have reminded us, investment risk can arise from a number of factors in today’s global economy, including slower or stagnating growth, changing U.S. Federal Reserve policy, oil price shocks, political and geopolitical factors and, unfortunately, major public health concerns such as a viral pandemic.
At Amundi Pioneer, active management begins with our own fundamental, bottom-up research process. Our team of dedicated research analysts and portfolio managers analyzes each security under consideration, communicating directly with the management teams of the companies issuing the securities and working together to identify those securities that best meet our investment criteria for our family of funds. Our risk management approach begins with each and every security, as we strive to carefully understand the potential opportunity, while considering any and all risk factors.
2 Pioneer Core Equity Fund | Semiannual Report | 6/30/20
Today, as investors, we have many options. It is our view that active management can serve shareholders well, not only when markets are thriving, but also during periods of market stress. As you consider your long-term investment goals, we encourage you to work with your financial advisor to develop an investment plan that paves the way for you to pursue both your short-term and long-term goals.
We remain confident that the current crisis, like others in human history, will pass, and we greatly appreciate the trust you have placed in us and look forward to continuing to serve you in the future.
Sincerely,
Lisa M. Jones
Head of the Americas, President and CEO of U.S.
Amundi Pioneer Asset Management USA, Inc.
June 30, 2020
Any information in this shareowner report regarding market or economic trends or the factors influencing the Fund’s historical or future performance are statements of opinion as of the date of this report. Past performance is no guarantee of future results.
Pioneer Core Equity Fund | Semiannual Report | 6/30/20 3
Portfolio Management Discussion |
6/30/20 In the following interview, Craig D. Sterling discusses the market environment and the factors that influenced the performance of Pioneer Core Equity Fund during the six-month period ended June 30, 2020. Mr. Sterling, Managing Director, Director of Core Equity and Head of Equity Research, U.S., and a portfolio manager at Amundi Pioneer Asset Management, Inc. (Amundi Pioneer), is responsible for the day-to-day management of the Fund’s investment portfolio, along with Ashesh “Ace” Savla, Team Leader of U.S. Equity Quantitative Research, a vice president, and a portfolio manager at Amundi Pioneer.
Q How did the Fund perform during the six-month period ended June 30, 2020?
A Pioneer Core Equity Fund’s Class A shares returned -2.46% at net asset value during the six-month period ended June 30, 2020, while the Fund’s benchmark, the Standard & Poor’s 500 Index (the S&P 500), returned -3.08%.
During the same period, the average return of the 1,414 mutual funds in Morningstar’s Large Blend Funds category was -5.48%.
Q How would you describe the investment backdrop in the equity market over the six-month period ended June 30, 2020?
A U.S. equities, as measured by the Fund’s benchmark, the S&P 500, posted a negative return in the first half of 2020, but nonetheless closed the six-month period with a solid rally off the lows experienced in March. After beginning the calendar year on a positive note, with healthy gains in January and mid-February, U.S. stocks suffered a large, protracted slump as efforts to contain the spread of the COVID-19 virus in the United States brought much of the domestic economy to a near standstill. The virus-mitigation efforts included social-distancing guidelines implemented by governments at all levels, which resulted in the cancellation of all professional sporting events and large public gatherings, such as concerts, and the shuttering of most businesses deemed non-essential by various state and local officials, particularly in the areas most affected by the initial wave of COVID-19 cases. The economic damage was deep and immediate, with the travel and restaurant industries hit hardest as people stayed at home and worked remotely.
Stocks hit their low on March 23, while fixed-income markets experienced a “liquidity freeze” that led to significant volatility. After that point, the markets began to regain ground thanks to the combined stimulus efforts of
4 Pioneer Core Equity Fund | Semiannual Report | 6/30/20
monetary and fiscal policy makers. The U.S. Federal Reserve (Fed) reduced the target range of the federal funds rate effectively to zero, re-launched its 2008/2009 financial-crisis facilities, and implemented new bond-purchase programs in an effort to boost liquidity and provide support for the financial markets. In addition, the U.S. Congress and the White House approved $2 trillion in fiscal stimulus designed to provide financial assistance to individuals and businesses in need, then added further stimulus during the second quarter. The market rally continued through the second calendar quarter of 2020, as the unprecedented level of stimulus generated a sense of optimism among investors that the economic pain, while severe, would be short-lived. As a result, the S&P 500 Index closed the six-month period with only a narrow loss, despite expectations for a sharp decline in domestic economic growth for the second quarter.
The top five stocks in the S&P 500, all of which are stocks of “big tech” or technology-related companies, drove much of the second-quarter rally. Those mega-cap technology companies feature above-average growth rates and have benefited from the stay-at-home environment that has predominated since the COVID-19 lockdowns began. At the end of June, those five mega-cap tech stocks accounted for 21% of the value of the S&P 500 – a record level of concentration for the Fund’s benchmark.
Q What were the most important factors driving the Fund’s benchmark-relative performance during the six-month period ended June 30, 2020?
A Stock selection was the primary driver of the Fund’s benchmark-relative outperformance during the six-month period, as positive selection results helped to cushion the impact of the February-March market downturn.
The Fund delivered its widest margin of stock-selection outperformance relative to the S&P 500 in financials, as positions in stocks of companies with lower sensitivity to interest-rate movements, such as Progressive, Discover Financial Services, and IntercontinentalExchange, each delivered returns that outpaced the broader financials sector within the benchmark.
With that said, the Fund’s overweight to financials detracted from benchmark-relative performance, as the sector generated the second-worst returns among sectors within the S&P 500 over the six-month period. In addition, a portfolio position in Bank of America (BofA) detracted from the Fund’s benchmark-relative results. The stock underperformed during the six-month period as investors grew concerned about BofA’s future credit
Pioneer Core Equity Fund | Semiannual Report | 6/30/20 5
quality and net-interest margins at a time of slower economic growth and a flattening yield curve. We have retained the Fund’s position in BofA, however, on the belief that the company has less risk exposure than it had a decade ago, and that its scale advantages could result in lower funding costs and reduced operating expenses over time.
The Fund’s positioning in the information technology sector also detracted from benchmark-relative performance. Although the portfolio’s holdings in the sector delivered an overall gain for the six-month period, the returns did not keep pace with the performance of the benchmark’s information technology components. An underweight allocation to Apple, one of the five “big tech” stocks within the S&P 500 we mentioned earlier, was the primary driver of the Fund’s shortfall versus the benchmark in the sector. While we appreciate the company’s many positive attributes, we are also aware that it appears on track to generate only moderately more operating profit than it earned in 2018, even if the economy recovers. We therefore view the increase in Apple’s market value over the past two years as potentially excessive.
Individual portfolio positions that benefited the Fund’s benchmark-relative performance over the six-month period included Amazon.com and Digital Realty Trust. Amazon.com, another of those five “big tech” stocks that currently represent one-fifth of the benchmark, was the top-performing individual position for the Fund over the six-month period. The portfolio had an overweight allocation to Amazon.com, which aided relative returns as the company’s shares surged to a series of record highs. The company has continued to take market share from traditional retailers as increasing numbers of consumers have turned to online shopping in the COVID-19 stay-at-home environment. A position in Digital Realty Trust, a real estate investment trust (REIT), outpaced the broader real estate sector by a wide margin and was another notable positive contributor to the Fund’s relative returns over the six-month period. Digital Realty Trust owns a portfolio of properties focused on the needs of technology-driven clients such as online retailers and operators of “cloud based” data centers. As such, the company appears well positioned to capitalize on the rising demand for cloud-based storage brought about by the increase in the number of people working from home due to COVID-19. We sold the Fund’s position in Digital Realty prior to the end of the six-month period, based on valuation concerns.
Aside from BofA and Apple, which we discussed earlier, individual portfolio positions that detracted from the Fund’s benchmark-relative performance over the six-month period included shares of certain companies heavily affected by the economic disruptions associated with COVID-19. Food distributor Sysco was a key detractor from the Fund’s relative returns in the consumer staples sector as the company struggled
6 Pioneer Core Equity Fund | Semiannual Report | 6/30/20
during the six-month period due to the evaporation of demand for its products from restaurants and large institutions. Energy proved to be another challenging sector for the Fund, as concerns about falling demand led to elevated volatility in oil prices, which cratered to historic lows in March and April before rebounding over the final two months of the six-month period. Within the sector, the Fund’s positions in Schlumberger and EOG Resources were both among the top detractors from benchmark-relative results for the six-month period. We have retained the portfolio’s position in EOG, but we chose to sell the shares of Sysco and Schlumberger.
Q Did the Fund have any exposure to derivative securities during the six-month period ended June 30, 2020? If so, did the investments have a material impact on benchmark-relative results?
A No, the Fund had no exposure to derivatives during the six-month period.
Q How would you characterize the Fund’s positioning and your broader view on the markets as of June 30, 2020?
A There has remained a tremendous amount of economic uncertainty resulting from the COVID-19 pandemic and the virtual shutdown of the global economy. While there have been signs of increased hope as the U.S. economy recovers from its March/April low point, there is also a lack of visibility as to the scope of the pandemic. In particular, rising infection rates in states that saw fewer cases at the beginning of the pandemic have refueled fears of a significant second wave. Moreover, it is unclear what the ongoing COVID-19 situation and the need for continued social-distancing measures could mean for consumer behavior, industrial production, and overall corporate decision-making. With such uncertainty, most corporations have withdrawn earnings guidance for 2020.
We have responded to the current situation by using our analytical process to forecast a broad array of fundamental and valuation outcomes, including an extended recession and permanent changes in consumer and corporate behavior due to COVID-19, and/or a faster recovery and fewer sustained, negative effects resulting from the pandemic.
Our process has centered on investing the portfolio in areas where we have identified what we believe are the most attractive relative values, based on the range of potential outcomes in the wake of COVID-19. We believe our process has helped us to find relative value in shares of both reasonably priced growth and high-quality value companies. Conversely, the process has generally led us to avoid owning shares of unprofitable growth and deep-value companies, where we think valuations have not significantly priced in the risks associated with investing in such stocks.
Pioneer Core Equity Fund | Semiannual Report | 6/30/20 7
Areas of the market where we believe we have identified relative value include platform technology companies, such as Amazon, Alphabet, and Facebook, all of which are among the ten-largest positions in the portfolio. We believe those companies can sustain their competitive leadership positions in an economy that seems likely to struggle to achieve growth, at least in the near term.
Similarly, we have continued to identify high-quality relative values in companies that we think could benefit from the growing need for communications, wireless, and broadband services. We view such companies as relative “safe havens” now that more people are working from home due to COVID-19. At the end of June, the portfolio was overweight relative to the benchmark in the communication services sector, which is where many of those companies reside.
Industrials is another sector featuring high-quality value stocks, in our opinion. Within industrials, we have focused on investing the Fund in companies with strong and improving business models, attractive valuations and, in our view, the ability to hold up well in a time of weak economic conditions. Moreover, we prefer industrials to other non-consumer cyclical areas of the economy such as financials, energy, and materials, because we feel that certain industrials firms could potentially generate solid returns throughout the business cycle. The portfolio was overweight in industrials versus the S&P 500 at period-end.
We have begun to identify more investment ideas in the consumer staples and utilities sectors, where the Fund had been underweight versus the benchmark in recent years, based on valuations. We believe those areas have begun to emerge as a source of opportunity given the low-interest-rate environment, the uncertain economic outlook, a lack of earnings visibility for the overall market, and the potential for increased market volatility ahead of November’s U.S. elections.
We have continued to rely on the combination of our experienced fundamental analyst team and a proprietary corporate performance and valuation framework grounded in business-model economics, or economic value added (“EVA”), in managing the portfolio. We believe those two key components are critical to the Fund’s performance, given the evolving secular and cyclical shifts taking place in nearly every industry and the unstable and always evolving political and economic environments.
8 Pioneer Core Equity Fund | Semiannual Report | 6/30/20
Please refer to the Schedule of Investments on pages 19–23 for a full listing of Fund securities.
All investments are subject to risk, including the possible loss of principal. In the past several years, financial markets have experienced increased volatility and heightened uncertainty. The market prices of securities may go up or down, sometimes rapidly or unpredictably, due to general market conditions, such as real or perceived adverse economic, political, or regulatory conditions, recessions, inflation, changes in interest or currency rates, lack of liquidity in the bond markets, the spread of infectious illness or other public health issues or adverse investor sentiment. These conditions may continue, recur, worsen or spread.
At times, the Fund’s investments may represent industries or industry sectors that are interrelated or have common risks, making the Fund more susceptible to any economic, political, or regulatory developments or other risks affecting those industries and sectors.
Investing in foreign and/or emerging markets securities involves risks relating to interest rates, currency exchange rates, economic, and political conditions.
These risks may increase share price volatility.
Before investing, consider the product’s investment objectives, risks, charges and expenses. Contact your advisor or Amundi Pioneer Asset Management, Inc., for a prospectus or summary prospectus containing this information. Read it carefully.
Any information in this shareholder report regarding market or economic trends or the factors influencing the Fund’s historical or future performance are statements of opinion as of the date of this report. Past performance is no guarantee of future results.
Pioneer Core Equity Fund | Semiannual Report | 6/30/20 9
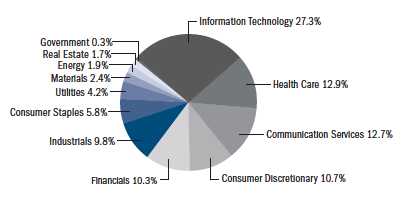
Portfolio Summary |
6/30/20Sector Distribution
(As a percentage of total investments)*
10 Largest Holdings
(As a percentage of total investments)*| | | |
| 1. | Amazon.com, Inc. | 5.66% |
| 2. | Alphabet, Inc. | 5.14 |
| 3. | Bank of America Corp. | 4.17 |
| 4. | Microsoft Corp. | 3.81 |
| 5. | Facebook, Inc. | 3.31 |
| 6. | Adobe, Inc. | 2.83 |
| 7. | PepsiCo., Inc. | 2.76 |
| 8. | Visa, Inc. | 2.44 |
| 9. | Merck & Co., Inc. | 2.15 |
| 10. | Comcast Corp. | 2.07 |
* Excludes temporary cash investments and all derivative contracts except for options purchased. The Fund is actively managed, and current holdings may be different. The holdings listed should not be considered recommendations to buy or sell any securities.
10 Pioneer Core Equity Fund | Semiannual Report | 6/30/20
Prices and Distributions |
6/30/20Net Asset Value per Share
| | | |
| Class | 6/30/20 | 12/31/19 |
| A | $19.80 | $20.30 |
| C | $17.00 | $17.51 |
| K | $19.81 | $20.28 |
| R | $19.67 | $20.20 |
| Y | $20.10 | $20.59 |
Distributions per Share: 1/1/20 – 6/30/20
| | | | |
| Net Investment | Short-Term | Long-Term |
| Class | Income | Capital Gains | Capital Gains |
| A | $ — | $ — | $ — |
| C | $ — | $ — | $ — |
| K | $ — | $ — | $ — |
| R | $ — | $ — | $ — |
| Y | $ — | $ — | $ — |
Index Definition
The Standard & Poor’s 500 Index is an unmanaged, commonly used measure of the broad U.S. stock market. Index returns are calculated monthly, assume reinvestment of dividends and, unlike Fund returns, do not reflect any fees, expenses or sales charges. It is not possible to invest directly in an index.
The index defined here pertains to the “Value of $10,000 Investment” and “Value of $5 Million Investment” charts on pages 12–16.
Pioneer Core Equity Fund | Semiannual Report | 6/30/20 11
| | |
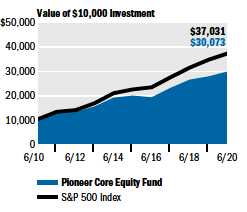
Performance Update | 6/30/20 | Class A Shares |
Investment Returns
The mountain chart on the right shows the change in value of a $10,000 investment made in Class A shares of Pioneer Core Equity Fund at public offering price during the periods shown, compared to that of the Standard & Poor’s 500 Index.
| | | | |
| Average Annual Total Returns | |
(As of June 30, 2020) |
| Net | Public | |
| Asset | Offering | S&P |
| Value | Price | 500 |
| Period | (NAV) | (POP) | Index |
10 years | 12.61% | 11.94% | 13.99% |
5 years | 9.18 | 7.89 | 10.73 |
1 year | 7.92 | 1.71 | 7.51 |
|
|
| Expense Ratio | | |
(Per prospectus dated May 1, 2020) |
| Gross | | | |
0.90% | | | |
Call 1-800-225-6292 or visit www.amundipioneer.com/us for the most recent month-end performance results. Current performance may be lower or higher than the performance data quoted.
The performance data quoted represents past performance, which is no guarantee of future results. Investment return and principal value will fluctuate, and shares, when redeemed, may be worth more or less than their original cost.
NAV results represent the percent change in net asset value per share. NAV returns would have been lower had sales charges been reflected. POP returns reflect deduction of maximum 5.75% sales charge. All results are historical and assume the reinvestment of dividends and capital gains. Other share classes are available for which performance and expenses will differ.
Performance results reflect any applicable expense waivers in effect during the periods shown. Without such waivers Fund performance would be lower. Waivers may not be in effect for all funds. Certain fee waivers are contractual through a specified period. Otherwise, fee waivers can be rescinded at any time. See the prospectus and financial statements for more information.
The performance table and graph do not reflect the deduction of fees and taxes that a shareowner would pay on Fund distributions or the redemption of Fund shares.
The Fund acquired the assets and liabilities of Pioneer Research Fund (“the predecessor fund”) on June 7, 2013. As a result of the reorganization, the predecessor fund’s performance and financial history became the performance and financial history of the Fund. The performance of Class A shares of the Fund is the performance of Class A shares of the predecessor fund for periods prior to the reorganization, and has not been restated to reflect any differences in expenses.
Please refer to the financial highlights for a more current expense ratio.
12 Pioneer Core Equity Fund | Semiannual Report | 6/30/20
| | |
Performance Update | 6/30/20 | Class C Shares |
Investment Returns
The mountain chart on the right shows the change in value of a $10,000 investment made in Class C shares of Pioneer Core Equity Fund for the periods shown, compared to that of the Standard & Poor’s 500 Index.
| | | | |
| Average Annual Total Returns |
(As of June 30, 2020) |
| | | S&P |
| If | If | 500 |
| Period | Held | Redeemed | Index |
10 years | 11.64% | 11.64%
| 13.99% |
5 years | 8.30 | 8.30 | 10.73 |
1 year | 7.03 | 7.03 | 7.51 |
|
|
| Expense Ratio | | |
(Per prospectus dated May 1, 2020) |
| Gross | | | |
1.69% | | | |
Call 1-800-225-6292 or visit www.amundipioneer.com/us for the most recent month-end performance results. Current performance may be lower or higher than the performance data quoted.
The performance data quoted represents past performance, which is no guarantee of future results. Investment return and principal value will fluctuate, and shares, when redeemed, may be worth more or less than their original cost.
Class C shares held for less than one year are also subject to a 1% contingent deferred sales charge (CDSC). If you paid a 1% sales charge, your returns would be lower than those shown above. “If Held” results represent the percent change in net asset value per share. NAV returns would have been lower had sales charges been reflected. All results are historical and assume the reinvestment of dividends and capital gains. Other share classes are available for which performance and expenses will differ.
Performance results reflect any applicable expense waivers in effect during the periods shown. Without such waivers Fund performance would be lower. Waivers may not be in effect for all funds. Certain fee waivers are contractual through a specified period. Otherwise, fee waivers can be rescinded at any time. See the prospectus and financial statements for more information.
The performance table and graph do not reflect the deduction of fees and taxes that a shareowner would pay on Fund distributions or the redemption of Fund shares.
The Fund acquired the assets and liabilities of Pioneer Research Fund (“the predecessor fund”) on June 7, 2013. As a result of the reorganization, the predecessor fund’s performance and financial history became the performance and financial history of the Fund. The performance of Class C shares of the Fund is the performance of Class C shares of the predecessor fund for periods prior to the reorganization, and has not been restated to reflect any differences in expenses.
Please refer to the financial highlights for a more current expense ratio.
Pioneer Core Equity Fund | Semiannual Report | 6/30/20 13
| | |
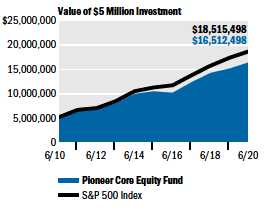
Performance Update | 6/30/20 | Class K Shares |
Investment Returns
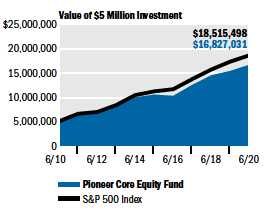
The mountain chart on the right shows the change in value of a $5 million investment made in Class K shares of Pioneer Core Equity Fund during the periods shown, compared to that of the Standard & Poor’s 500 Index.
| | | |
| Average Annual Total Returns |
(As of June 30, 2020) |
| Net | |
| Asset | S&P |
| Value | 500 |
| Period | (NAV) | Index |
10 years | 12.69% | 13.99% |
5 years | 9.33 | 10.73 |
1 year | 8.25 | 7.51 |
|
|
| Expense Ratio | |
(Per prospectus dated May 1, 2020) |
| Gross | | |
0.56% | | |
Call 1-800-225-6292 or visit www.amundipioneer.com/us for the most recent month-end performance results. Current performance may be lower or higher than the performance data quoted.
The performance data quoted represents past performance, which is no guarantee of future results. Investment return and principal value will fluctuate, and shares, when redeemed, may be worth more or less than their original cost.
The performance shown for Class K shares for the period prior to the commencement of operations of Class K shares on May 4, 2018, is the net asset value performance of the Fund’s Class A shares, which has not been restated to reflect any differences in expenses, including Rule 12b-1 fees applicable to Class A shares. Since fees for Class A shares generally are higher than those of Class K shares, the performance of Class K shares prior to their inception would have been higher than the performance shown. For the period beginning May 4, 2018, the actual performance of Class K shares is reflected. Class K shares are not subject to sales charges and are available for limited groups of eligible investors, including institutional investors. All results are historical and assume the reinvestment of dividends and capital gains. Other share classes are available for which performance and expenses will differ.
Performance results reflect any applicable expense waivers in effect during the periods shown. Without such waivers Fund performance would be lower. Waivers may not be in effect for all funds. Certain fee waivers are contractual through a specified period. Otherwise, fee waivers can be rescinded at any time. See the prospectus and financial statements for more information.
The Fund acquired the assets and liabilities of Pioneer Research Fund (“the predecessor fund”) on June 7, 2013. As a result of the reorganization, the predecessor fund’s performance and financial history became the performance and financial history of the Fund. The performance of Class A shares of the Fund is the performance of Class A shares of the predecessor fund for periods prior to the reorganization, and has not been restated to reflect any differences in expenses.
The performance table and graph do not reflect the deduction of fees and taxes that a shareowner would pay on Fund distributions or the redemption of Fund shares.
Please refer to the financial highlights for a more current expense ratio.
14 Pioneer Core Equity Fund | Semiannual Report | 6/30/20
| | |
Performance Update | 6/30/20 | Class R Shares |
Investment Returns
The mountain chart on the right shows the change in value of a $10,000 investment made in Class R shares of Pioneer Core Equity Fund for the periods shown, compared to that of the Standard & Poor’s 500 Index.
| | | |
| Average Annual Total Returns |
(As of June 30, 2020) |
| Net | |
| Asset | S&P |
| Value | 500 |
| Period | (NAV) | Index |
10 years | 12.54% | 13.99% |
5 years | 9.04 | 10.73 |
1 year | 7.51 | 7.51 |
|
|
| Expense Ratio | |
(Per prospectus dated May 1, 2020) |
| Gross | | |
1.25% | | |
Call 1-800-225-6292 or visit www.amundipioneer.com/us for the most recent month-end performance results. Current performance may be lower or higher than the performance data quoted.
The performance data quoted represents past performance, which is no guarantee of future results. Investment return and principal value will fluctuate, and shares, when redeemed, may be worth more or less than their original cost.
The performance shown for Class R shares for the period prior to the commencement of operations of Class R shares on June 29, 2018, is the net asset value performance of the Fund’s Class A shares, reduced to reflect the higher distribution and service fees of Class R shares. For the period beginning June 29, 2018, the actual performance of Class R shares is reflected. Class R shares are not subject to sales charges and are available for limited groups of eligible investors, including institutional investors. All results are historical and assume the reinvestment of dividends and capital gains. Other share classes are available for which performance and expenses will differ.
Performance results reflect any applicable expense waivers in effect during the periods shown. Without such waivers Fund performance would be lower. Waivers may not be in effect for all funds. Certain fee waivers are contractual through a specified period. Otherwise, fee waivers can be rescinded at any time. See the prospectus and financial statements for more information.
The Fund acquired the assets and liabilities of Pioneer Research Fund (“the predecessor fund”) on June 7, 2013. As a result of the reorganization, the predecessor fund’s performance and financial history became the performance and financial history of the Fund. The performance of Class A shares of the Fund is the performance of Class A shares of the predecessor fund for periods prior to the reorganization, and has not been restated to reflect any differences in expenses.
The performance table and graph do not reflect the deduction of fees and taxes that a shareowner would pay on Fund distributions or the redemption of Fund shares.
Please refer to the financial highlights for a more current expense ratio.
Pioneer Core Equity Fund | Semiannual Report | 6/30/20 15
| | |
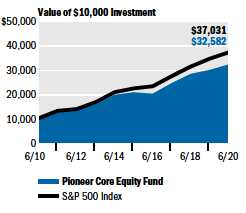
Performance Update | 6/30/20 | Class Y Shares |
Investment Returns
The mountain chart on the right shows the change in value of a $5 million investment made in Class Y shares of Pioneer Core Equity Fund during the periods shown, compared to that of the Standard & Poor’s 500 Index.
| | | |
| Average Annual Total Returns |
(As of June 30, 2020) |
| Net | |
| Asset | S&P |
| Value | 500 |
| Period | (NAV) | Index |
10 years | 12.90% | 13.99% |
5 years | 9.46 | 10.73 |
1 year | 8.16 | 7.51 |
|
|
| Expense Ratio | |
(Per prospectus dated May 1, 2020) |
| Gross | | |
0.66% | | |
Call 1-800-225-6292 or visit www.amundipioneer.com/us for the most recent month-end performance results. Current performance may be lower or higher than the performance data quoted.
The performance data quoted represents past performance, which is no guarantee of future results. Investment return and principal value will fluctuate, and shares, when redeemed, may be worth more or less than their original cost.
The Fund acquired the assets and liabilities of Pioneer Research Fund (“the predecessor fund”) on June 7, 2013. As a result of the reorganization, the predecessor fund’s performance and financial history became the performance and financial history of the Fund. The performance of Class Y shares of the Fund is the performance of Class Y shares of the predecessor fund for periods prior to the reorganization, and has not been restated to reflect any differences in expenses.
Class Y shares are not subject to sales charges and are available for limited groups of eligible investors, including institutional investors. All results are historical and assume the reinvestment of dividends and capital gains. Other share classes are available for which performance and expenses will differ.
Performance results reflect any applicable expense waivers in effect during the periods shown. Without such waivers Fund performance would be lower. Waivers may not be in effect for all funds. Certain fee waivers are contractual through a specified period. Otherwise, fee waivers can be rescinded at any time. See the prospectus and financial statements for more information.
The performance table and graph do not reflect the deduction of fees and taxes that a shareowner would pay on Fund distributions or the redemption of Fund shares.
Please refer to the financial highlights for a more current expense ratio.
16 Pioneer Core Equity Fund | Semiannual Report | 6/30/20
Comparing Ongoing Fund Expenses
As a shareowner in the Fund, you incur two types of costs:
(1) ongoing costs, including management fees, distribution and/or service (12b-1) fees, and other Fund expenses; and
(2) transaction costs, including sales charges (loads) on purchase payments.
This example is intended to help you understand your ongoing expenses (in dollars) of investing in the Fund and to compare these costs with the ongoing costs of investing in other mutual funds. The example is based on an investment of $1,000 at the beginning of the Fund’s latest six-month period and held throughout the six months.
Using the Tables
Actual Expenses
The first table below provides information about actual account values and actual expenses. You may use the information in this table, together with the amount you invested, to estimate the expenses that you paid over the period as follows:
(1) Divide your account value by $1,000
Example: an $8,600 account value ÷ $1,000 = 8.6
(2) Multiply the result in (1) above by the corresponding share class’s number in the third row under the heading entitled “Expenses Paid During Period” to estimate the expenses you paid on your account during this period.
Expenses Paid on a $1,000 Investment in Pioneer Core Equity Fund
Based on actual returns from January 1, 2020 through June 30, 2020.
| | | | | | |
| Share Class | A | C | K | R | Y |
Beginning Account Value | $1,000.00 | $1,000.00 | $1,000.00 | $1,000.00 | $1,000.00 |
on 1/1/20 | | | | | |
Ending Account Value | $975.40 | $970.90 | $976.80 | $973.80 | $976.20 |
on 6/30/20 | | | | | |
Expenses Paid | $4.47
| $8.23 | $2.75 | $6.13 | $3.29 |
During Period* | | | | | |
* Expenses are equal to the Fund’s annualized expense ratio of 0.91%, 1.68%, 0.56%, 1.25%, and 0.67% for Class A, Class C, Class K, Class R, and Class Y, respectively, multiplied by the average account value over the period, multiplied by 182/366 (to reflect the one-half year period).
Pioneer Core Equity Fund | Semiannual Report | 6/30/20 17
Hypothetical Example for Comparison Purposes
The table below provides information about hypothetical account values and hypothetical expenses based on the Fund’s actual expense ratio and an assumed rate of return of 5% per year before expenses, which is not the Fund’s actual return. The hypothetical account values and expenses may not be used to estimate the actual ending account balance or expenses you paid for the period.
You may use this information to compare the ongoing costs of investing in the Fund and other funds. To do so, compare this 5% hypothetical example with the 5% hypothetical examples that appear in the shareholder reports of the other funds.
Please note that the expenses shown in the tables are meant to highlight your ongoing costs only and do not reflect any transaction costs, such as sales charges (loads) that are charged at the time of the transaction. Therefore, the table below is useful in comparing ongoing costs only and will not help you determine the relative total costs of owning different funds. In addition, if these transaction costs were included, your costs would have been higher.
Expenses Paid on a $1,000 Investment in Pioneer Core Equity Fund
Based on a hypothetical 5% per year return before expenses, reflecting the period from January 1, 2020 through June 30, 2020.
| | | | | | |
| Share Class | A | C | K | R | Y |
Beginning Account Value | $1,000.00 | $1,000.00 | $1,001.00 | $1,002.00 | $1,003.00 |
on 1/1/20 | | | | | |
Ending Account Value | $1,020.34
| $1,016.51 | $1,022.08 | $1,018.65 | $1,021.53 |
on 6/30/20 | | | | | |
Expenses Paid | $4.57
| $8.42 | $2.82 | $6.27 | $3.37 |
During Period* | | | | | |
* Expenses are equal to the Fund’s annualized expense ratio of 0.91%, 1.68%, 0.56%, 1.25%, and 0.67% for Class A, Class C, Class K, Class R, and Class Y, respectively, multiplied by the average account value over the period, multiplied by 182/366 (to reflect the one-half year period).
18 Pioneer Core Equity Fund | Semiannual Report | 6/30/20
Schedule of Investments |
6/30/20 (unaudited) | | | | |
| Shares | | | Value |
| | UNAFFILIATED ISSUERS — 98.8% | |
| | COMMON STOCKS — 98.5% of Net Assets | |
| | Auto Components — 1.5% | |
| 303,429 | | Aptiv Plc | $ 23,643,188 |
| | Total Auto Components | $ 23,643,188 |
| | Banks — 4.6% | |
| 2,788,970 | | Bank of America Corp. | $ 66,238,037 |
| 73,932 | | Signature Bank/New York NY | 7,904,809 |
| | Total Banks | $ 74,142,846 |
| | Beverages — 3.0% | |
| 74,765 | | Brown-Forman Corp., Class B | $ 4,759,540 |
| 331,083 | | PepsiCo., Inc. | 43,789,038 |
| | Total Beverages | $ 48,548,578 |
| | Biotechnology — 1.7% | |
| 281,839 | | AbbVie, Inc. | $ 27,670,953 |
| | Total Biotechnology | $ 27,670,953 |
| | Capital Markets — 2.3% | |
| 645,394 | | Charles Schwab Corp. | $ 21,775,594 |
| 43,499 | | S&P Global, Inc. | 14,332,051 |
| | Total Capital Markets | $ 36,107,645 |
| | Chemicals — 2.4% | |
| 390,373 | | DuPont de Nemours, Inc. | $ 20,740,517 |
| 173,974 | | FMC Corp. | 17,331,290 |
| | Total Chemicals | $ 38,071,807 |
| | Communications Equipment — 3.1% | |
| 89,890(a) | | Arista Networks, Inc. | $ 18,879,597 |
| 218,844 | | Motorola Solutions, Inc. | 30,666,610 |
| | Total Communications Equipment | $ 49,546,207 |
| | Consumer Finance — 1.6% | |
| 274,102 | | American Express Co. | $ 26,094,510 |
| | Total Consumer Finance | $ 26,094,510 |
| | Diversified Telecommunication Services — 2.2% | |
| 638,171 | | CenturyLink, Inc. | $ 6,400,855 |
| 518,980 | | Verizon Communications, Inc. | 28,611,367 |
| | Total Diversified Telecommunication Services | $ 35,012,222 |
| | Electric Utilities — 4.1% | |
| 225,209 | | American Electric Power Co., Inc. | $ 17,935,645 |
| 112,186 | | NextEra Energy, Inc. | 26,943,712 |
| 830,876 | | PPL Corp. | 21,469,836 |
| | Total Electric Utilities | $ 66,349,193 |
The accompanying notes are an integral part of these financial statements.
Pioneer Core Equity Fund | Semiannual Report | 6/30/20 19
Schedule of Investments | 6/30/20 (unaudited) (continued)
| | | | |
| Shares | | | Value |
| | Electrical Equipment — 3.0% | |
| 305,622 | | Eaton Corp. Plc | $ 26,735,813 |
| 97,813 | | Rockwell Automation, Inc. | 20,834,169 |
| | Total Electrical Equipment | $ 47,569,982 |
| | Electronic Equipment, Instruments & Components — 2.8% | |
| 278,069 | | Amphenol Corp. | $ 26,641,791 |
| 164,239 | | CDW Corp. | 19,081,287 |
| | Total Electronic Equipment, Instruments & Components | $ 45,723,078 |
| | Equity Real Estate Investment Trust (REIT) — 1.7% | |
| 121,030 | | Essex Property Trust, Inc. | $ 27,736,445 |
| | Total Equity Real Estate Investment Trust (REIT) | $ 27,736,445 |
| | Health Care Equipment & Supplies — 4.8% | |
| 43,621(a) | | ABIOMED, Inc. | $ 10,537,089 |
| 35,080(a) | | Align Technology, Inc. | 9,627,355 |
| 215,840(a) | | Hologic, Inc. | 12,302,880 |
| 257,844 | | Medtronic Plc | 23,644,295 |
| 174,230 | | Zimmer Biomet Holdings, Inc. | 20,796,093 |
| | Total Health Care Equipment & Supplies | $ 76,907,712 |
| | Health Care Providers & Services — 1.3% | |
| 77,516 | | Anthem, Inc. | $ 20,385,158 |
| | Total Health Care Providers & Services | $ 20,385,158 |
| | Household Products — 2.7% | |
| 79,198 | | Kimberly-Clark Corp. | $ 11,194,637 |
| 264,606 | | Procter & Gamble Co. | 31,638,939 |
| | Total Household Products | $ 42,833,576 |
| | Insurance — 1.7% | |
| 340,568 | | Progressive Corp. | $ 27,282,902 |
| | Total Insurance | $ 27,282,902 |
| | Interactive Media & Services — 8.3% | |
| 57,616(a) | | Alphabet, Inc. | $ 81,702,369 |
| 231,410(a) | | Facebook, Inc. | 52,546,269 |
| | Total Interactive Media & Services | $ 134,248,638 |
| | Internet & Direct Marketing Retail — 6.5% | |
| 32,614(a) | | Amazon.com, Inc. | $ 89,976,155 |
| 9,478(a) | | Booking Holdings, Inc. | 15,092,198 |
| | Total Internet & Direct Marketing Retail | $ 105,068,353 |
The accompanying notes are an integral part of these financial statements.
20 Pioneer Core Equity Fund | Semiannual Report | 6/30/20
| | | | |
| Shares | | | Value |
| | | IT Services — 5.4% | |
| 120,791 | | Accenture Plc | $ 25,936,244 |
| 392,348 | | Cognizant Technology Solutions Corp. | 22,293,213 |
| 201,052 | | Visa, Inc. | 38,837,215 |
| | | Total IT Services | $ 87,066,672 |
| | | Machinery — 4.4% | |
| 226,515 | | Caterpillar, Inc. | $ 28,654,148 |
| 111,035 | | Illinois Tool Works, Inc. | 19,414,470 |
| 165,412 | | Stanley Black & Decker, Inc. | 23,055,124 |
| | | Total Machinery | $ 71,123,742 |
| | | Media — 2.0% | |
| 842,406 | | Comcast Corp. | $ 32,836,986 |
| | | Total Media | $ 32,836,986 |
| | | Oil, Gas & Consumable Fuels — 1.9% | |
| 371,760 | | EOG Resources, Inc. | $ 18,833,362 |
| 232,969 | | Hess Corp. | 12,070,124 |
| | | Total Oil, Gas & Consumable Fuels | $ 30,903,486 |
| | | Pharmaceuticals — 4.9% | |
| 151,460 | | Eli Lilly & Co. | $ 24,866,703 |
| 442,234 | | Merck & Co., Inc. | 34,197,955 |
| 119,216 | | Novo Nordisk AS (A.D.R.) | 7,806,264 |
| 286,843 | | Roche Holding AG (A.D.R.) | 12,443,249 |
| | | Total Pharmaceuticals | $ 79,314,171 |
| | | Road & Rail — 1.7% | |
| 151,242 | | Norfolk Southern Corp. | $ 26,553,558 |
| | | Total Road & Rail | $ 26,553,558 |
| | | Semiconductors & Semiconductor Equipment — 2.9% | |
| 91,822 | | Lam Research Corp. | $ 29,700,744 |
| 319,895(a) | | Micron Technology, Inc. | 16,480,991 |
| | | Total Semiconductors & Semiconductor Equipment | $ 46,181,735 |
| | | Software — 10.4% | |
| 103,350(a) | | Adobe, Inc. | $ 44,989,288 |
| 49,959(a) | | Autodesk, Inc. | 11,949,693 |
| 82,752(a) | | Guidewire Software, Inc. | 9,173,059 |
| 297,026 | | Microsoft Corp. | 60,447,761 |
| 167,724(a) | | salesforce.com, Inc. | 31,419,737 |
| 104,365(a) | | Zendesk, Inc. | 9,239,433 |
| | | Total Software | $ 167,218,971 |
The accompanying notes are an integral part of these financial statements.
Pioneer Core Equity Fund | Semiannual Report | 6/30/20 21
Schedule of Investments | 6/30/20 (unaudited) (continued)
| | | | |
| Shares | | | Value |
| | | Specialty Retail — 1.6% | |
| 68,823 | | Home Depot, Inc. | $ 17,240,850 |
| 38,463(a) | | Ulta Beauty, Inc. | 7,824,143 |
| | | Total Specialty Retail | $ 25,064,993 |
| | | Technology Hardware, Storage & Peripherals — 2.4% | |
| 70,355 | | Apple, Inc. | $ 25,665,504 |
| 288,181 | | NetApp, Inc. | 12,786,591 |
| | | Total Technology Hardware, Storage & Peripherals | $ 38,452,095 |
| | | Textiles, Apparel & Luxury Goods — 1.0% | |
| 254,727 | | VF Corp. | $ 15,523,063 |
| | | Total Textiles, Apparel & Luxury Goods | $ 15,523,063 |
| | | Trading Companies & Distributors — 0.6% | |
| 69,567(a) | | United Rentals, Inc. | $ 10,368,266 |
| | | Total Trading Companies & Distributors | $ 10,368,266 |
| | | TOTAL COMMON STOCKS | |
| | | (Cost $1,372,423,929) | $ 1,583,550,731 |
| Principal | | | |
| Amount | | | |
| USD ($) | | | |
| | | U.S. GOVERNMENT AND AGENCY OBLIGATION — 0.3% | |
| | | of Net Assets | |
| 5,000,000(b) | | U.S. Treasury Floating Rate Notes, 0.304% (3 Month U.S. | |
| | | Treasury Bill Money Market Yield + 15 bps), 1/31/22 | $ 5,006,536 |
| | | TOTAL U.S. GOVERNMENT AND AGENCY OBLIGATION | |
| | | (Cost $5,004,361) | $ 5,006,536 |
| | | TOTAL INVESTMENTS IN UNAFFILIATED ISSUERS — 98.8% | |
| | | (Cost $1,377,428,290) | $ 1,588,557,267 |
| | | OTHER ASSETS AND LIABILITIES — 1.2% | $ 19,542,702 |
| | | NET ASSETS — 100.0% | $ 1,608,099,969 |
| | |
REIT | Real Estate Investment Trust. |
(A.D.R.) | American Depositary Receipts. |
(a) | Non-income producing security. |
(b) | Floating rate note. Coupon rate, reference index and spread shown at June 30, 2020. |
Purchases and sales of securities (excluding temporary cash investments) for the six months ended June 30, 2020 were as follows:
| | | | | | | |
| | Purchases | | | Sales | |
Long-Term U.S. Government Securities | | $ | 5,005,331 | | | $ | — | |
Other Long-Term Securities | | $ | 769,073,204 | | | $ | 801,403,527 | |
The accompanying notes are an integral part of these financial statements.
22 Pioneer Core Equity Fund | Semiannual Report | 6/30/20
The Fund is permitted to engage in purchase and sale transactions (“cross trades”) with certain funds and accounts for Amundi Pioneer Asset Management, Inc., (the “Adviser”) serves as the Fund’s investment adviser, as set forth in Rule 17a-7 under the Investment Company Act of 1940, pursuant to procedures adopted by the Board of Trustees. Under these procedures, cross trades are effected at current market prices. During the six months ended June 30, 2020, the Fund did not engage in any cross trade activity.
At June 30, 2020, the net unrealized appreciation on investments based on cost for federal tax purposes of $1,381,964,121 was as follows:
| | | | |
| Aggregate gross unrealized appreciation for all investments in which | | | |
| there is an excess of value over tax cost | | $ | 297,856,634 | |
| Aggregate gross unrealized depreciation for all investments in which | | | | |
| there is an excess of tax cost over value | | | (91,263,488 | ) |
| Net unrealized appreciation | | $ | 206,593,146 | |
Various inputs are used in determining the value of the Fund’s investments. These inputs are summarized in the three broad levels below.
Level 1 – quoted prices in active markets for identical securities.
Level 2 – other significant observable inputs (including quoted prices for similar securities, interest rates, prepayment speeds, credit risks, etc.). See Notes to Financial Statements — Note 1A.
Level 3 – significant unobservable inputs (including the Fund’s own assumptions in determining fair value of investments). See Notes to Financial Statements — Note 1A.
The following is a summary of the inputs used as of June 30, 2020, in valuing the Fund’s investments:
| | | | | | | | | | | | | |
| | Level 1 | | | Level 2 | | | Level 3 | | | Total | |
Common Stocks | | $ | 1,583,550,731 | | | $ | — | | | $ | — | | | $ | 1,583,550,731 | |
U.S. Government and | | | | | | | | | | | | | | | | |
| Agency Obligation | | | — | | | | 5,006,536 | | | | — | | | | 5,006,536 | |
| Total Investments | | | | | | | | | | | | | | | | |
| in Securities | | $ | 1,583,550,731 | | | $ | 5,006,536 | | | $ | — | | | $ | 1,588,557,267 | |
During the six months ended June 30, 2020, there were no transfers between Levels 1, 2 and 3.
The accompanying notes are an integral part of these financial statements.
Pioneer Core Equity Fund | Semiannual Report | 6/30/20 23
Statement of Assets and Liabilities |
6/30/20 (unaudited) | | | | |
| ASSETS: | | | |
| Investments in unaffiliated issuers, at value (cost $1,377,428,290) | | $ | 1,588,557,267 | |
| Cash | | | 5,530,929 | |
| Receivables — | | | | |
| Investment securities sold | | | 18,294,822 | |
| Fund shares sold | | | 126,433 | |
| Dividends | | | 1,449,241 | |
| Interest | | | 86,394 | |
| Other assets | | | 67,263 | |
| Total assets | | $ | 1,614,112,349 | |
| LIABILITIES: | | | | |
| Payables — | | | | |
| Investment securities purchased | | | 4,709,235 | |
| Fund shares repurchased | | | 605,850 | |
| Distributions | | | 46,677 | |
| Transfer agent fees | | | 228,268 | |
| Due to affiliates | | | 152,641 | |
| Accrued expenses | | | 269,709 | |
| Total liabilities | | $ | 6,012,380 | |
| NET ASSETS: | | | | |
| Paid-in capital | | $ | 1,301,012,046 | |
| Distributable earnings | | | 307,087,923 | |
| Net assets | | $ | 1,608,099,969 | |
| NET ASSET VALUE PER SHARE: | | | | |
No par value (unlimited number of shares authorized) | | | | |
| Class A (based on $1,544,079,225/77,992,882 shares) | | $ | 19.80 | |
| Class C (based on $9,620,905/565,868 shares) | | $ | 17.00 | |
| Class K (based on $32,849,457/1,657,970 shares) | | $ | 19.81 | |
| Class R (based on $277,208/14,093 shares) | | $ | 19.67 | |
| Class Y (based on $21,273,174/1,058,472 shares) | | $ | 20.10 | |
| MAXIMUM OFFERING PRICE PER SHARE: | | | | |
| Class A (based on $19.80 net asset value per share/100%-5.75% | | | | |
| maximum sales charge) | | $ | 21.01 | |
The accompanying notes are an integral part of these financial statements.
24 Pioneer Core Equity Fund | Semiannual Report | 6/30/20
Statement of Operations
FOR THE SIX MONTHS ENDED 6/30/20 (unaudited)
| | | | | | | |
| INVESTMENT INCOME: | | | | | | |
| Dividends from unaffiliated issuers (net of foreign taxes | | | | | | |
| withheld $(83,850)) | | $ | 14,238,565 | | | | |
| Interest from unaffiliated issuers | | | 146,892 | | | | |
| Total investment income | | | | | | $ | 14,385,457 | |
| EXPENSES: | | | | | | | | |
| Management fees | | $ | 3,910,501 | | | | | |
| Administrative expense | | | 261,430 | | | | | |
| Transfer agent fees | | | | | | | | |
| Class A | | | 571,733 | | | | | |
| Class C | | | 4,262 | | | | | |
| Class K | | | 27 | | | | | |
| Class R | | | 109 | | | | | |
| Class Y | | | 12,366 | | | | | |
| Distribution fees | | | | | | | | |
| Class A | | | 1,873,659 | | | | | |
| Class C | | | 49,399 | | | | | |
| Class R | | | 484 | | | | | |
| Shareowner communications expense | | | 145,040 | | | | | |
| Custodian fees | | | 14,506 | | | | | |
| Registration fees | | | 38,624 | | | | | |
| Professional fees | | | 49,768 | | | | | |
| Printing expense | | | 22,982 | | | | | |
| Trustees’ fees | | | 41,422 | | | | | |
| Miscellaneous | | | 40,976 | | | | | |
| Total expenses | | | | | | $ | 7,037,288 | |
| Net investment income | | | | | | $ | 7,348,169 | |
| REALIZED AND UNREALIZED GAIN (LOSS) ON INVESTMENTS: | | | | | | | | |
| Net realized gain (loss) on: | | | | | | | | |
| Investments in unaffiliated issuers | | | | | | $ | 41,324,802 | |
| Change in net unrealized appreciation (depreciation) on: | | | | | | | | |
| Investments in unaffiliated issuers | | | | | | $ | (94,741,795 | ) |
| Net realized and unrealized gain (loss) on investments | | | | | | $ | (53,416,993 | ) |
| Net decrease in net assets resulting from operations | | | | | | $ | (46,068,824 | ) |
The accompanying notes are an integral part of these financial statements.
Pioneer Core Equity Fund | Semiannual Report | 6/30/20 25
Statements of Changes in Net Assets
| | | | | | | |
| | Six Months | | | | |
| | Ended | | | | |
| | 6/30/20 | | | Year Ended | |
| | (unaudited) | | | 12/31/19 | |
| FROM OPERATIONS: | | | | | | |
Net investment income (loss) | | $ | 7,348,169 | | | $ | 12,909,135 | |
Net realized gain (loss) on investments | | | 41,324,802 | | | | 119,060,708 | |
Change in net unrealized appreciation (depreciation) | | | | | | | | |
| on investments | | | (94,741,795 | ) | | | 301,272,613 | |
| Net increase (decrease) in net assets resulting | | | | | | | | |
| from operations | | $ | (46,068,824 | ) | | $ | 433,242,456 | |
| DISTRIBUTIONS TO SHAREOWNERS: | | | | | | | | |
| Class A ($— and $0.62 per share, respectively) | | $ | — | | | $ | (49,515,192 | ) |
| Class C ($— and $0.50 per share, respectively) | | | — | | | | (312,029 | ) |
| Class K ($— and $0.68 per share, respectively) | | | — | | | | (1,262,342 | ) |
| Class R ($— and $0.60 per share, respectively) | | | — | | | | (3,107 | ) |
| Class Y ($— and $0.67 per share, respectively) | | | — | | | | (821,419 | ) |
| Total distributions to shareowners | | $ | — | | | $ | (51,914,089 | ) |
| FROM FUND SHARE TRANSACTIONS: | | | | | | | | |
Net proceeds from sales of shares | | $ | 23,061,973 | | | $ | 32,472,258 | |
Reinvestment of distributions | | | — | | | | 49,118,209 | |
Cost of shares repurchased | | | (89,840,342 | ) | | | (174,228,583 | ) |
| Net decrease in net assets resulting from Fund | | | | | | | | |
| share transactions | | $ | (66,778,369 | ) | | $ | (92,638,116 | ) |
| Net increase (decrease) in net assets | | $ | (112,847,193 | ) | | $ | 288,690,251 | |
| NET ASSETS: | | | | | | | | |
Beginning of period | | $ | 1,720,947,162 | | | $ | 1,432,256,911 | |
End of period | | $ | 1,608,099,969 | | | $ | 1,720,947,162 | |
The accompanying notes are an integral part of these financial statements.
26 Pioneer Core Equity Fund | Semiannual Report | 6/30/20
| | | | | | | | | | | | | |
| | Six Months | | | Six Months | | | | | | | |
| | Ended | | | Ended | | | | | | | |
| | 6/30/20 | | | 6/30/20 | | | Year Ended | | | Year Ended | |
| | Shares | | | Amount | | | 12/31/19 | | | 12/31/19 | |
| | (unaudited) | | | (unaudited) | | | Shares | | | Amount | |
| Class A | | | | | | | | | | | | |
Shares sold | | | 570,639 | | | $ | 10,632,250 | | | | 834,735 | | | $ | 15,565,764 | |
Reinvestment of distributions | | | — | | | | — | | | | 2,375,773 | | | | 47,483,048 | |
Less shares repurchased | | | (3,709,943 | ) | | | (70,714,505 | ) | | | (7,686,195 | ) | | | (144,032,558 | ) |
| Net decrease | | | (3,139,304 | ) | | $ | (60,082,255 | ) | | | (4,475,687 | ) | | $ | (80,983,746 | ) |
| Class C | | | | | | | | | | | | | | | | |
Shares sold | | | 63,987 | | | $ | 1,001,242 | | | | 84,055 | | | $ | 1,360,402 | |
Reinvestment of distributions | | | — | | | | — | | | | 17,672 | | | | 301,852 | |
Less shares repurchased | | | (138,336 | ) | | | (2,238,887 | ) | | | (142,905 | ) | | | (2,291,000 | ) |
| Net decrease | | | (74,349 | ) | | $ | (1,237,645 | ) | | | (41,178 | ) | | $ | (628,746 | ) |
| Class K | | | | | | | | | | | | | | | | |
Shares sold | | | 262,583 | | | $ | 4,776,497 | | | | 348,095 | | | $ | 6,733,606 | |
Reinvestment of distributions | | | — | | | | — | | | | 32,395 | | | | 648,818 | |
Less shares repurchased | | | (389,679 | ) | | | (7,188,722 | ) | | | (1,218,952 | ) | | | (22,255,809 | ) |
| Net decrease | | | (127,096 | ) | | $ | (2,412,225 | ) | | | (838,462 | ) | | $ | (14,873,385 | ) |
| Class R | | | | | | | | | | | | | | | | |
Shares sold | | | 8,915 | | | $ | 160,922 | | | | 6,472 | | | $ | 119,876 | |
Reinvestment of distributions | | | — | | | | — | | | | 155 | | | | 3,075 | |
Less shares repurchased | | | (1,820 | ) | | | (36,130 | ) | | | (2,430 | ) | | | (45,340 | ) |
| Net increase | | | 7,095 | | | $ | 124,792 | | | | 4,197 | | | $ | 77,611 | |
| Class Y | | | | | | | | | | | | | | | | |
Shares sold | | | 323,863 | | | $ | 6,491,062 | | | | 447,310 | | | $ | 8,692,610 | |
Reinvestment of distributions | | | — | | | | — | | | | 33,520 | | | | 681,416 | |
Less shares repurchased | | | (541,570 | ) | | | (9,662,098 | ) | | | (295,253 | ) | | | (5,603,876 | ) |
| Net increase (decrease) | | | (217,707 | ) | | $ | (3,171,036 | ) | | | 185,577 | | | $ | 3,770,150 | |
The accompanying notes are an integral part of these financial statements.
Pioneer Core Equity Fund | Semiannual Report | 6/30/20 27
Financial Highlights
| | | | | | | | | | | | | | | | | | | |
| | Six Months | | | | | | | | | | | | | | | | |
| | Ended | | | Year | | | Year | | | Year | | | Year | | | Year | |
| | 6/30/20 | | | Ended | | | Ended | | | Ended | | | Ended | | | Ended | |
| | (unaudited) | | | 12/31/19 | | | 12/31/18 | | | 12/31/17 | | | 12/31/16* | | | 12/31/15* | |
| Class A | | | | | | | | | | | | | | | | | | |
Net asset value, beginning of period | | $ | 20.30 | | | $ | 15.93 | | | $ | 20.58 | | | $ | 18.01 | | | $ | 16.80 | | | $ | 17.18 | |
Increase (decrease) from investment operations: | | | | | | | | | | | | | | | | | | | | | | | | |
| Net investment income (loss) (a) | | $ | 0.09 | | | $ | 0.15 | | | $ | 0.17 | | | $ | 0.17 | | | $ | 0.19 | | | $ | 0.13 | |
| Net realized and unrealized gain (loss) on investments | | | (0.59 | ) | | | 4.84 | | | | (1.68 | ) | | | 4.26 | | | | 1.22 | | | | (0.39 | ) |
Net increase (decrease) from investment operations | | $ | (0.50 | ) | | $ | 4.99 | | | $ | (1.51 | ) | | $ | 4.43 | | | $ | 1.41 | | | $ | (0.26 | ) |
Distributions to shareowners: | | | | | | | | | | | | | | | | | | | | | | | | |
| Net investment income | | $ | — | | | $ | (0.15 | ) | | $ | (0.14 | ) | | $ | (0.16 | ) | | $ | (0.20 | ) | | $ | (0.12 | ) |
| Net realized gain | | | — | | | | (0.47 | ) | | | (3.00 | ) | | | (1.70 | ) | | | — | | | | — | |
Total distributions | | $ | — | | | $ | (0.62 | ) | | $ | (3.14 | ) | | $ | (1.86 | ) | | $ | (0.20 | ) | | $ | (0.12 | ) |
Net increase (decrease) in net asset value | | $ | (0.50 | ) | | $ | 4.37 | | | $ | (4.65 | ) | | $ | 2.57 | | | $ | 1.21 | | | $ | (0.38 | ) |
Net asset value, end of period | | $ | 19.80 | | | $ | 20.30 | | | $ | 15.93 | | | $ | 20.58 | | | $ | 18.01 | | | $ | 16.80 | |
Total return (b) | | | (2.46 | )%(c) | | | 31.41 | % | | | (8.70 | )%(d) | | | 24.77 | % | | | 8.39 | % | | | (1.49 | )%(e) |
Ratio of net expenses to average net assets | | | 0.91 | %(f) | | | 0.90 | % | | | 0.90 | % | | | 0.89 | % | | | 0.94 | % | | | 0.93 | % |
Ratio of net investment income (loss) to average net assets | | | 0.93 | %(f) | | | 0.80 | % | | | 0.82 | % | | | 0.85 | % | | | 1.15 | % | | | 0.75 | % |
Portfolio turnover rate | | | 50 | %(c) | | | 93 | % | | | 114 | % | | | 81 | % | | | 80 | % | | | 100 | % |
Net assets, end of period (in thousands) | | $ | 1,544,079 | | | $ | 1,647,120 | | | $ | 1,363,460 | | | $ | 1,629,908 | | | $ | 1,436,208 | | | $ | 1,450,815 | |
* The Fund was audited by an independent registered public accounting firm other than Ernst & Young LLP.
(a) The per-share data presented above is based on the average shares outstanding for the period presented.
(b) Assumes initial investment at net asset value at the beginning of each period, reinvestment of all distributions, the complete redemption of the investment at net asset value at the end of each period and no sales charges. Total return would be reduced if sales charges were taken into account.
(c) Not annualized.
(d) If the Fund had not recognized gains in settlement of class action lawsuits during the year ended December 31, 2018, the total return would have been (8.74)%.
(e) If the Fund had not recognized gains in settlement of class action lawsuits during the year ended December 31, 2015, the total return would have been (1.55)%.
(f) Annualized.
The accompanying notes are an integral part of these financial statements.
28 Pioneer Core Equity Fund | Semiannual Report | 6/30/20
| | | | | | | | | | | | | | | | | | | |
| | Six Months | | | | | | | | | | | | | | | | |
| | Ended | | | Year | | | Year | | | Year | | | Year | | | Year | |
| | 6/30/20 | | | Ended | | | Ended | | | Ended | | | Ended | | | Ended | |
| | (unaudited) | | | 12/31/19 | | | 12/31/18 | | | 12/31/17 | | | 12/31/16* | | | 12/31/15* | |
| Class C | | | | | | | | | | | | | | | | | | |
Net asset value, beginning of period | | $ | 17.51 | | | $ | 13.82 | | | $ | 18.26 | | | $ | 16.17 | | | $ | 15.11 | | | $ | 15.48 | |
Increase (decrease) from investment operations: | | | | | | | | | | | | | | | | | | | | | | | | |
| Net investment income (loss) (a) | | $ | 0.01 | | | $ | 0.00 | † | | $ | 0.00 | † | | $ | 0.01 | | | $ | 0.05 | | | $ | (0.01 | )(b) |
| Net realized and unrealized gain (loss) on investments | | | (0.52 | ) | | | 4.19 | | | | (1.44 | ) | | | 3.80 | | | | 1.10 | | | | (0.35 | ) |
Net increase (decrease) from investment operations | | $ | (0.51 | ) | | $ | 4.19 | | | $ | (1.44 | ) | | $ | 3.81 | | | $ | 1.15 | | | $ | (0.36 | ) |
Distributions to shareowners: | | | | | | | | | | | | | | | | | | | | | | | | |
| Net investment income | | $ | — | | | $ | (0.03 | ) | | $ | — | | | $ | (0.02 | ) | | $ | (0.09 | ) | | $ | (0.01 | ) |
| Net realized gain | | | — | | | | (0.47 | ) | | | (3.00 | ) | | | (1.70 | ) | | | — | | | | — | |
Total distributions | | $ | — | | | $ | (0.50 | ) | | $ | (3.00 | ) | | $ | (1.72 | ) | | $ | (0.09 | ) | | $ | (0.01 | ) |
Net increase (decrease) in net asset value | | $ | (0.51 | ) | | $ | 3.69 | | | $ | (4.44 | ) | | $ | 2.09 | | | $ | 1.06 | | | $ | (0.37 | ) |
Net asset value, end of period | | $ | 17.00 | | | $ | 17.51 | | | $ | 13.82 | | | $ | 18.26 | | | $ | 16.17 | | | $ | 15.11 | |
Total return (c) | | | (2.91 | )%(d) | | | 30.42 | %(e) | | | (9.45 | )%(f) | | | 23.74 | % | | | 7.58 | % | | | (2.34 | )%(g) |
Ratio of net expenses to average net assets | | | 1.68 | %(h) | | | 1.69 | % | | | 1.69 | % | | | 1.71 | % | | | 1.76 | % | | | 1.74 | % |
Ratio of net investment income (loss) to average net assets | | | 0.16 | %(h) | | | 0.01 | % | | | 0.02 | % | | | 0.04 | % | | | 0.33 | % | | | (0.06 | )% |
Portfolio turnover rate | | | 50 | %(d) | | | 93 | % | | | 114 | % | | | 81 | % | | | 80 | % | | | 100 | % |
Net assets, end of period (in thousands) | | $ | 9,621 | | | $ | 11,208 | | | $ | 9,416 | | | $ | 13,961 | | | $ | 13,016 | | | $ | 14,106 | |
* The Fund was audited by an independent registered public accounting firm other than Ernst & Young LLP.
(a) The per-share data presented above is based on the average shares outstanding for the period presented.
(b) The amount shown for a share outstanding does not correspond with the net investment gain on the Statement of Operations for the period due to timing of the sales and repurchase of sales.
(c) Assumes initial investment at net asset value at the beginning of each period, reinvestment of all distributions, the complete redemption of the investment at net asset value at the end of each period and no sales charges. Total return would be reduced if sales charges were taken into account.
(d) Not annualized.
(e) If the Fund had not recognized gains in settlement of class action lawsuits during the year ended December 31, 2019, the total return would have been 30.35%.
(f) If the Fund had not recognized gains in settlement of class action lawsuits during the year ended December 31, 2018, the total return would have been (9.50)%.
(g) If the Fund had not recognized gains in settlement of class action lawsuits during the year ended December 31, 2015, the total return would have been (2.40)%.
(h) Annualized.
† Amount rounds to less than 0.01%.
The accompanying notes are an integral part of these financial statements.
Pioneer Core Equity Fund | Semiannual Report | 6/30/20 29
Financial Highlights (continued)
| | | | | | | | | | |
| | Six Months | | | | | | | |
| | Ended | | | Year | | | | |
| | 6/30/20 | | | Ended | | | 5/4/18* to | |
| | (unaudited) | | | 12/31/19 | | | 12/31/18 | |
| Class K | | | | | | | | | |
Net asset value, beginning of period | | $ | 20.28 | | | $ | 15.91 | | | $ | 20.82 | |
Increase (decrease) from investment operations: | | | | | | | | | | | | |
| Net investment income (loss) (a) | | $ | 0.12 | | | $ | 0.21 | | | $ | 0.16 | |
| Net realized and unrealized gain (loss) on investments | | | (0.59 | ) | | | 4.84 | | | | (1.86 | ) |
Net increase (decrease) from investment operations | | $ | (0.47 | ) | | $ | 5.05 | | | $ | (1.70 | ) |
Distributions to shareowners: | | | | | | | | | | | | |
| Net investment income | | $ | — | | | $ | (0.21 | ) | | $ | (0.21 | ) |
| Net realized gain | | | — | | | | (0.47 | ) | | | (3.00 | ) |
Total distributions | | $ | — | | | $ | (0.68 | ) | | $ | (3.21 | ) |
Net increase (decrease) in net asset value | | $ | (0.47 | ) | | $ | 4.37 | | | $ | (4.91 | ) |
Net asset value, end of period | | $ | 19.81 | | | $ | 20.28 | | | $ | 15.91 | |
Total return (b) | | | (2.32 | )%(c) | | | 31.85 | % | | | (8.47 | )%(c)(d) |
Ratio of net expenses to average net assets | | | 0.56 | %(e) | | | 0.56 | % | | | 0.57 | %(e) |
Ratio of net investment income (loss) to average net assets | | | 1.28 | %(e) | | | 1.15 | % | | | 1.17 | %(e) |
Portfolio turnover rate | | | 50 | %(c) | | | 93 | % | | | 114 | %(c) |
Net assets, end of period (in thousands) | | $ | 32,849 | | | $ | 36,206 | | | $ | 41,733 | |
* Class K shares commenced operations on May 4, 2018.
(a) The per-share data presented above is based on the average shares outstanding for the period presented.
(b) Assumes initial investment at net asset value at the beginning of each period, reinvestment of all distributions and the complete redemption of the investment at net asset value at the end of each period.
(c) Not annualized.
(d) If the Fund had not recognized gains in settlement of class action lawsuits during the year ended December 31, 2018, the total return would have been (8.51)%.
(e) Annualized.
The accompanying notes are an integral part of these financial statements.
30 Pioneer Core Equity Fund | Semiannual Report | 6/30/20
| | | | | | | | | | |
| | Six Months | | | | | | | |
| | Ended | | | Year | | | | |
| | 6/30/20 | | | Ended | | | 6/29/18* to | |
| | (unaudited) | | | 12/31/19 | | | 12/31/18 | |
| Class R | | | | | | | | | |
Net asset value, beginning of period | | $ | 20.20 | | | $ | 15.90 | | | $ | 21.08 | |
Increase (decrease) from investment operations: | | | | | | | | | | | | |
| Net investment income (loss) (a) | | $ | 0.05 | | | $ | 0.08 | | | $ | 0.06 | |
| Net realized and unrealized gain (loss) on investments | | | (0.58 | ) | | | 4.82 | | | | (2.08 | ) |
Net increase (decrease) from investment operations | | $ | (0.53 | ) | | $ | 4.90 | | | $ | (2.02 | ) |
Distributions to shareowners: | | | | | | | | | | | | |
| Net investment income | | $ | — | | | $ | (0.13 | ) | | $ | (0.16 | ) |
| Net realized gain | | | — | | | | (0.47 | ) | | | (3.00 | ) |
Total distributions | | $ | — | | | $ | (0.60 | ) | | $ | (3.16 | ) |
Net increase (decrease) in net asset value | | $ | (0.53 | ) | | $ | 4.30 | | | $ | (5.18 | ) |
Net asset value, end of period | | $ | 19.67 | | | $ | 20.20 | | | $ | 15.90 | |
Total return (b) | | | (2.62 | )%(c) | | | 30.90 | % | | | (8.76 | )%(c)(d) |
Ratio of net expenses to average net assets | | | 1.25 | %(e) | | | 1.25 | % | | | 1.06 | %(e) |
Ratio of net investment income (loss) to average net assets | | | 0.54 | %(e) | | | 0.43 | % | | | 0.62 | %(e) |
Portfolio turnover rate | | | 50 | %(c) | | | 93 | % | | | 114 | %(c) |
Net assets, end of period (in thousands) | | $ | 277 | | | $ | 141 | | | $ | 45 | |
* Class R shares commenced operations on June 29, 2018.
(a) The per-share data presented above is based on the average shares outstanding for the period presented.
(b) Assumes initial investment at net asset value at the beginning of each period, reinvestment of all distributions and the complete redemption of the investment at net asset value at the end of each period.
(c) Not annualized.
(d) If the Fund had not recognized gains in settlement of class action lawsuits during the year ended December 31, 2018, the total return would have been (8.80)%.
(e) Annualized.
The accompanying notes are an integral part of these financial statements.
Pioneer Core Equity Fund | Semiannual Report | 6/30/20 31
Financial Highlights (continued)
| | | | | | | | | | | | | | | | | | | |
| | Six Months | | | | | | | | | | | | | | | | |
| | Ended | | | Year | | | Year | | | Year | | | Year | | | Year | |
| | 6/30/20 | | | Ended | | | Ended | | | Ended | | | Ended | | | Ended | |
| | (unaudited) | | | 12/31/19 | | | 12/31/18 | | | 12/31/17 | | | 12/31/16* | | | 12/31/15* | |
| Class Y | | | | | | | | | | | | | | | | | | |
Net asset value, beginning of period | | $ | 20.59 | | | $ | 16.14 | | | $ | 20.80 | | | $ | 18.18 | | | $ | 16.95 | | | $ | 17.34 | |
Increase (decrease) from investment operations: | | | | | | | | | | | | | | | | | | | | | | | | |
| Net investment income (loss) (a) | | $ | 0.11 | | | $ | 0.20 | | | $ | 0.22 | | | $ | 0.22 | | | $ | 0.25 | | | $ | 0.19 | |
| Net realized and unrealized gain (loss) on investments | | | (0.60 | ) | | | 4.92 | | | | (1.71 | ) | | | 4.32 | | | | 1.23 | | | | (0.40 | ) |
Net increase (decrease) from investment operations | | $ | (0.49 | ) | | $ | 5.12 | | | $ | (1.49 | ) | | $ | 4.54 | | | $ | 1.48 | | | $ | (0.21 | ) |
Distributions to shareowners: | | | | | | | | | | | | | | | | | | | | | | | | |
| Net investment income | | $ | — | | | $ | (0.20 | ) | | $ | (0.17 | ) | | $ | (0.22 | ) | | $ | (0.25 | ) | | $ | (0.18 | ) |
| Net realized gain | | | — | | | | (0.47 | ) | | | (3.00 | ) | | | (1.70 | ) | | | — | | | | — | |
Total distributions | | $ | — | | | $ | (0.67 | ) | | $ | (3.17 | ) | | $ | (1.92 | ) | | $ | (0.25 | ) | | $ | (0.18 | ) |
Net increase (decrease) in net asset value | | $ | (0.49 | ) | | $ | 4.45 | | | $ | (4.66 | ) | | $ | 2.62 | | | $ | 1.23 | | | $ | (0.39 | ) |
Net asset value, end of period | | $ | 20.10 | | | $ | 20.59 | | | $ | 16.14 | | | $ | 20.80 | | | $ | 18.18 | | | $ | 16.95 | |
Total return (b) | | | (2.38 | )%(c) | | | 31.80 | %(d) | | | (8.53 | )%(e) | | | 25.10 | % | | | 8.73 | % | | | (1.21 | )%(f) |
Ratio of net expenses to average net assets | | | 0.67 | %(g) | | | 0.66 | % | | | 0.64 | % | | | 0.63 | % | | | 0.63 | % | | | 0.62 | % |
Ratio of net investment income (loss) to average net assets | | | 1.17 | %(g) | | | 1.03 | % | | | 1.05 | % | | | 1.11 | % | | | 1.47 | % | | | 1.07 | % |
Portfolio turnover rate | | | 50 | %(c) | | | 93 | % | | | 114 | % | | | 81 | % | | | 80 | % | | | 100 | % |
Net assets, end of period (in thousands) | | $ | 21,273 | | | $ | 26,272 | | | $ | 17,603 | | | $ | 58,788 | | | $ | 44,915 | | | $ | 62,206 | |
* The Fund was audited by an independent registered public accounting firm other than Ernst & Young LLP.
(a) The per-share data presented above is based on the average shares outstanding for the period presented.
(b) Assumes initial investment at net asset value at the beginning of each period, reinvestment of all distributions and the complete redemption of the investment at net asset value at the end of each period.
(c) Not annualized.
(d) If the Fund had not recognized gains in settlement of class action lawsuits during the year ended December 31, 2019, the total return would have been 31.74%.
(e) If the Fund had not recognized gains in settlement of class action lawsuits during the year ended December 31, 2018, the total return would have been (8.60)%.
(f) If the Fund had not recognized gains in settlement of class action lawsuits during the year ended December 31, 2015, the total return would have been (1.27)%.
(g) Annualized.
The accompanying notes are an integral part of these financial statements.
32 Pioneer Core Equity Fund | Semiannual Report | 6/30/20
Notes to Financial Statements |
6/30/20 (unaudited) 1. Organization and Significant Accounting Policies
Pioneer Core Equity Fund (the “Fund”) is a series of Pioneer Series Trust XI (the “Trust”), a Delaware statutory trust. The Fund is registered under the Investment Company Act of 1940 as a diversified, open-end management investment company. The investment objective of the Fund is to seek long-term capital growth.
The Fund offers five classes of shares designated as Class A, Class C, Class K, Class R and Class Y shares. Class K and Class R commenced operations on May 4, 2018, and June 29, 2018, respectively. Each class of shares represents an interest in the same portfolio of investments of the Fund and has identical rights (based on relative net asset values) to assets and liquidation proceeds. Share classes can bear different rates of class-specific fees and expenses, such as transfer agent and distribution fees. Differences in class-specific fees and expenses will result in differences in net investment income and, therefore, the payment of different dividends from net investment income earned by each class. The Amended and Restated Declaration of Trust of the Fund gives the Board of Trustees the flexibility to specify either per-share voting or dollar-weighted voting when submitting matters for shareowner approval. Under per-share voting, each share of a class of the Fund is entitled to one vote. Under dollar-weighted voting, a shareowner’s voting power is determined not by the number of shares owned, but by the dollar value of the shares on the record date. Each share class has exclusive voting rights with respect to matters affecting only that class, including with respect to the distribution plan for that class. There is no distribution plan for Class K and Class Y shares.
Amundi Pioneer Asset Management, Inc., an indirect, wholly owned subsidiary of Amundi and Amundi’s wholly owned subsidiary, Amundi USA, Inc., serves as the Fund’s investment adviser (the “Adviser”). Amundi Pioneer Distributor, Inc., an affiliate of Amundi Pioneer Asset Management, Inc., serves as the Fund’s distributor (the “Distributor”).
In August 2018, the Securities and Exchange Commission (“SEC”) released a Disclosure Update and Simplification Final Rule. The Final Rule amends Regulation S-X disclosures requirements to conform them to U.S. Generally Accepted Accounting Principles (“U.S. GAAP”) for investment companies. The Fund’s financial statements were prepared in compliance with the new amendments to Regulation S-X.
Pioneer Core Equity Fund | Semiannual Report | 6/30/20 33
The Fund is an investment company and follows investment company accounting and reporting guidance under U.S. GAAP. U.S. GAAP requires the management of the Fund to make estimates and assumptions that affect the reported amounts of assets and liabilities, the disclosure of contingent assets and liabilities at the date of the financial statements, and the reported amounts of income, expenses and gain or loss on investments during the reporting period. Actual results could differ from those estimates.
The following is a summary of significant accounting policies followed by the Fund in the preparation of its financial statements:
A. Security Valuation
The net asset value of the Fund is computed once daily, on each day the New York Stock Exchange (“NYSE”) is open, as of the close of regular trading on the NYSE.
Equity securities that have traded on an exchange are valued by using the last sale price on the principal exchange where they are traded. Equity securities that have not traded on the date of valuation, or securities for which sale prices are not available, generally are valued using the mean between the last bid and asked prices or, if both last bid and asked prices are not available, at the last quoted bid price. Last sale and bid and asked prices are provided by independent third party pricing services. In the case of equity securities not traded on an exchange, prices are typically determined by independent third party pricing services using a variety of techniques and methods.
Fixed-income securities are valued by using prices supplied by independent pricing services, which consider such factors as market prices, market events, quotations from one or more brokers, Treasury spreads, yields, maturities and ratings, or may use a pricing matrix or other fair value methods or techniques to provide an estimated value of the security or instrument. A pricing matrix is a means of valuing a debt security on the basis of current market prices for other debt securities, historical trading patterns in the market for fixed-income securities and/or other factors. Non-U.S. debt securities that are listed on an exchange will be valued at the bid price obtained from an independent third party pricing service. When independent third party pricing services are unable to supply prices, or when prices or market quotations are considered to be unreliable, the value of that security may be determined using quotations from one or more broker-dealers.
Repurchase agreements are valued at par. Cash may include overnight time deposits at approved financial institutions.
Securities for which independent pricing services or broker-dealers are unable to supply prices or for which market prices and/or quotations are not readily available or are considered to be unreliable are valued by a fair
34 Pioneer Core Equity Fund | Semiannual Report | 6/30/20
valuation team comprised of certain personnel of the Adviser pursuant to procedures adopted by the Fund’s Board of Trustees. The Adviser’s fair valuation team uses fair value methods approved by the Valuation Committee of the Board of Trustees. The Adviser’s fair valuation team is responsible for monitoring developments that may impact fair valued securities and for discussing and assessing fair values on an ongoing basis, and at least quarterly, with the Valuation Committee of the Board of Trustees.
Inputs used when applying fair value methods to value a security may include credit ratings, the financial condition of the company, current market conditions and comparable securities. The Fund may use fair value methods if it is determined that a significant event has occurred after the close of the exchange or market on which the security trades and prior to the determination of the Fund’s net asset value. Examples of a significant event might include political or economic news, corporate restructurings, natural disasters, terrorist activity or trading halts. Thus, the valuation of the Fund’s securities may differ significantly from exchange prices, and such differences could be material.
At June 30, 2020, no securities were valued using fair value methods (other than securities valued using prices supplied by independent pricing services, broker-dealers or using a third party insurance industry pricing model).
B. Investment Income and Transactions
Dividend income is recorded on the ex-dividend date, except that certain dividends from foreign securities where the ex-dividend date may have passed are recorded as soon as the Fund becomes aware of the ex-dividend data in the exercise of reasonable diligence.
Interest income, including interest on income-bearing cash accounts, is recorded on the accrual basis. Dividend and interest income are reported net of unrecoverable foreign taxes withheld at the applicable country rates and net of income accrued on defaulted securities.
Interest and dividend income payable by delivery of additional shares is reclassified as PIK (payment-in-kind) income upon receipt and is included in interest and dividend income, respectively.
Security transactions are recorded as of trade date. Gains and losses on sales of investments are calculated on the identified cost method for both financial reporting and federal income tax purposes.
C. Federal Income Taxes
It is the Fund’s policy to comply with the requirements of the Internal Revenue Code applicable to regulated investment companies and to distribute all of its net taxable income and net realized capital gains, if any, to
Pioneer Core Equity Fund | Semiannual Report | 6/30/20 35
its shareowners. Therefore, no provision for federal income taxes is required. As of December 31, 2019, the Fund did not accrue any interest or penalties with respect to uncertain tax positions, which, if applicable, would be recorded as an income tax expense on the Statement of Operations. Tax returns filed within the prior three years remain subject to examination by federal and state tax authorities.
The amount and character of income and capital gain distributions to shareowners are determined in accordance with federal income tax rules, which may differ from U.S. GAAP. Distributions in excess of net investment income or net realized gains are temporary over distributions for financial statement purposes resulting from differences in the recognition or classification of income or distributions for financial statement and tax purposes. Capital accounts within the financial statements are adjusted for permanent book/tax differences to reflect tax character, but are not adjusted for temporary differences.
The tax character of current year distributions payable will be determined at the end of the current taxable year. The tax character of distributions paid during the year ended December 31, 2019 was as follows:
| | | | |
| | 2019 | |
| Distributions paid from: | | | |
| Ordinary income | | $ | 12,723,309 | |
| Long-term capital gain | | | 39,190,780 | |
| Total | | $ | 51,914,089 | |
The following shows the components of distributable earnings (losses) on a federal income tax basis at December 31, 2019:
| | | | |
| | 2019 | |
| Distributable earnings: | | | |
| Undistributed ordinary income | | $ | 579,260 | |
| Undistributed long-term capital gain | | | 51,242,546 | |
| Net unrealized appreciation | | | 301,334,941 | |
| Total | | $ | 353,156,747 | |
The difference between book basis and tax basis unrealized appreciation is attributable to the tax deferral of losses on wash sales.
D. Fund Shares
The Fund records sales and repurchases of its shares as of trade date. The Distributor earned $21,499 in underwriting commissions on the sale of Class A shares during the six months ended June 30, 2020.
36 Pioneer Core Equity Fund | Semiannual Report | 6/30/20
E. Class Allocations
Income, common expenses and realized and unrealized gains and losses are calculated at the Fund level and allocated daily to each class of shares based on its respective percentage of adjusted net assets at the beginning of the day.
Distribution fees are calculated based on the average daily net asset value attributable to Class A, Class C and Class R shares of the Fund, respectively (see Note 4). Class K and Class Y shares do not pay distribution fees. All expenses and fees paid to the Fund’s transfer agent for its services are allocated among the classes of shares based on the number of accounts in each class and the ratable allocation of related out-of-pocket expenses (see Note 3).
Distributions to shareowners are recorded as of the ex-dividend date. Distributions paid by the Fund with respect to each class of shares are calculated in the same manner and at the same time, except that net investment income dividends to Class A, Class C, Class K, Class R and Class Y shares can reflect different transfer agent and distribution expense rates.
F. Risks
The value of securities held by the Fund may go up or down, sometimes rapidly or unpredictably, due to general market conditions, such as real or perceived adverse economic, political or regulatory conditions, recessions, the spread of infectious illness or other public health issues, inflation, changes in interest rates, lack of liquidity in the bond markets or adverse investor sentiment. In the past several years, financial markets have experienced increased volatility, depressed valuations, decreased liquidity and heightened uncertainty. These conditions may continue, recur, worsen or spread. A general rise in interest rates could adversely affect the price and liquidity of fixed-income securities and could also result in increased redemptions from the Fund.
At times, the Fund’s investments may represent industries or industry sectors that are interrelated or have common risks, making the Fund more susceptible to any economic, political, or regulatory developments or other risks affecting those industries and sectors. The Fund’s investments in foreign markets and countries with limited developing markets may subject the Fund to a greater degree of risk than investments in a developed market. These risks include disruptive political or economic conditions and the imposition of adverse governmental laws or currency exchange restrictions.
With the increased use of technologies such as the Internet to conduct business, the Fund is susceptible to operational, information security and related risks. While the Fund’s Adviser has established business continuity plans in the event of, and risk management systems to prevent, limit or
Pioneer Core Equity Fund | Semiannual Report | 6/30/20 37
mitigate, such cyber-attacks, there are inherent limitations in such plans and systems, including the possibility that certain risks have not been identified. Furthermore, the Fund cannot control the cybersecurity plans and systems put in place by service providers to the Fund such as Brown Brothers Harriman & Co., the Fund’s custodian and accounting agent, and DST Asset Manager Solutions, Inc., the Fund’s transfer agent. In addition, many beneficial owners of Fund shares hold them through accounts at broker-dealers, retirement platforms and other financial market participants over which neither the Fund nor Amundi Pioneer exercises control. Each of these may in turn rely on service providers to them, which are also subject to the risk of cyber-attacks. Cybersecurity failures or breaches at Amundi Pioneer or the Fund’s service providers or intermediaries have the ability to cause disruptions and impact business operations, potentially resulting in financial losses, interference with the Fund’s ability to calculate its net asset value, impediments to trading, the inability of Fund shareowners to effect share purchases, redemptions or exchanges or receive distributions, loss of or unauthorized access to private shareowner information and violations of applicable privacy and other laws, regulatory fines, penalties, reputational damage, or additional compliance costs. Such costs and losses may not be covered under any insurance. In addition, maintaining vigilance against cyber-attacks may involve substantial costs over time, and system enhancements may themselves be subject to cyber-attacks.
COVID-19
The respiratory illness COVID-19 caused by a novel coronavirus has resulted in a global pandemic and major disruption to economies and markets around the world, including the United States. Global financial markets have experienced extreme volatility and severe losses, and trading in many instruments has been disrupted. Liquidity for many instruments has been greatly reduced for periods of time. Some interest rates are very low and in some cases yields are negative. Some sectors of the economy and individual issuers have experienced particularly large losses. These circumstances may continue for an extended period of time, and may continue to affect adversely the value and liquidity of the Fund’s investments. The ultimate economic fallout from the pandemic, and the long-term impact on economies, markets, industries and individual issuers, are not known. Governments and central banks, including the Federal Reserve in the U.S., have taken extraordinary and unprecedented actions to support local and global economies and the financial markets. These actions have resulted in significant expansion of public debt, including in the U.S. The impact of these measures, and whether they will be effective to mitigate the economic and market disruption, will not be known for some time. The consequences of high public debt, including its future impact on the economy and securities markets, likewise may not be known for some time.
38 Pioneer Core Equity Fund | Semiannual Report | 6/30/20
The Fund’s prospectus contains unaudited information regarding the Fund’s principal risks. Please refer to that document when considering the Fund’s principal risks.
G. Repurchase Agreements
Repurchase agreements are arrangements under which the Fund purchases securities from a broker-dealer or a bank, called the counterparty, upon the agreement of the counterparty to repurchase the securities from the Fund at a later date, and at a specific price, which is typically higher than the purchase price paid by the Fund. The securities purchased serve as the Fund’s collateral for the obligation of the counterparty to repurchase the securities. The value of the collateral, including accrued interest, is required to be equal to or in excess of the repurchase price. The collateral for all repurchase agreements is held in safekeeping in the customer-only account of the Fund’s custodian or a sub-custodian of the Fund. The Adviser is responsible for determining that the value of the collateral remains at least equal to the repurchase price. In the event of a default by the counterparty, the Fund is entitled to sell the securities, but the Fund may not be able to sell them for the price at which they were purchased, thus causing a loss to the Fund. Additionally, if the counterparty becomes insolvent, there is some risk that the Fund will not have a right to the securities, or the immediate right to sell the securities.
As of and for the six months ended June 30, 2020, the Fund had no open repurchase agreements.
2. Management Agreement
The Adviser manages the Fund’s portfolio. Management fees are calculated daily and paid monthly at the annual rate of 0.50% of the Fund’s average daily net assets up to $5 billion and 0.45% of the Fund’s average daily net assets over $5 billion. For the six months ended June 30, 2020, the effective management fee was equivalent to 0.50% (annualized) of the Fund’s average daily net assets.
In addition, under the management and administration agreements, certain other services and costs, including accounting, regulatory reporting and insurance premiums, are paid by the Fund as administrative reimbursements. Included in “Due to affiliates” reflected on the Statement of Assets and Liabilities is $99,675 in management fees, administrative costs and certain other reimbursements payable to the Adviser at June 30, 2020.
3. Transfer Agent
DST Asset Manager Solutions, Inc. serves as the transfer agent to the Fund at negotiated rates. Transfer agent fees and payables shown on the Statement of Operations and the Statement of Assets and Liabilities, respectively, include sub-transfer agent expenses incurred through the Fund’s omnibus relationship contracts.
Pioneer Core Equity Fund | Semiannual Report | 6/30/20 39
In addition, the Fund reimbursed the transfer agent for out-of-pocket expenses incurred by the transfer agent related to shareowner communications activities such as proxy and statement mailings, and outgoing phone calls. For the six months ended June 30, 2020, such out-of-pocket expenses by class of shares were as follows:
| | | | |
| Shareowner Communications: | | | |
Class A | | $ | 142,532 | |
Class C | | | 1,868 | |
Class K | | | 27 | |
Class R | | | 70 | |
Class Y | | | 543 | |
| Total | | $ | 145,040 | |
4. Distribution and Service Plans
The Fund has adopted a distribution plan (the “Plan”) pursuant to Rule 12b-1 of the Investment Company Act of 1940 with respect to its Class A, Class C and Class R shares. Pursuant to the Plan, the Fund pays the Distributor 0.25% of the average daily net assets attributable to Class A shares as compensation for personal services and/or account maintenance services or distribution services with regard to Class A shares. Pursuant to the Plan, the Fund also pays the Distributor 1.00% of the average daily net assets attributable to Class C shares. The fee for Class C shares consists of a 0.25% service fee and a 0.75% distribution fee paid as compensation for personal services and/or account maintenance services or distribution services with regard to Class C shares. Pursuant to the Plan, the Fund also pays the Distributor 0.50% of the average daily net assets attributable to Class R shares for distribution services. Included in “Due to affiliates” reflected on the Statement of Assets and Liabilities is $52,966 in distribution fees payable to the Distributor at June 30, 2020.
The Fund also has adopted a separate service plan for Class R shares (the “Service Plan”). The Service Plan authorizes the Fund to pay securities dealers, plan administrators or other service organizations that agree to provide certain services to retirement plans or plan participants holding shares of the Fund a service fee of up to 0.25% of the Fund’s average daily net assets attributable to Class R shares held by such plans.
In addition, redemptions of Class A and Class C shares may be subject to a contingent deferred sales charge (“CDSC”). A CDSC of 1.00% may be imposed on redemptions of certain net asset value purchases of Class A shares within 12 months of purchase. Redemptions of Class C shares within 12 months of purchase are subject to a CDSC of 1.00%, based on the lower of cost or market value of shares being redeemed. Shares purchased as part of an
40 Pioneer Core Equity Fund | Semiannual Report | 6/30/20
exchange remain subject to any CDSC that applied to the original purchase of those shares. There are no CDSCs for Class K, Class R and Class Y shares. Proceeds from the CDSCs are paid to the Distributor. For the six months ended June 30, 2020, CDSCs in the amount of $786 were paid to the Distributor.
5. Line of Credit Facility
The Fund, along with certain other funds in the Pioneer Family of Funds (the “Funds”), participates in a committed, unsecured revolving line of credit facility. Borrowings are used solely for temporary or emergency purposes. The Fund may borrow up to the lesser of the amount available under the credit facility or the limits set for borrowing by the Fund’s prospectus and the 1940 Act. Effective March 11, 2020, the Fund participates in a facility in the amount of $300 million. Prior to March 11, 2020, the Fund participated in a facility in the amount of $250 million. Under such facility, depending on the type of loan, interest on borrowings is payable at the London Interbank Offered Rate (“LIBOR”) plus a credit spread. The Fund also pays an annual commitment fee to participate in a credit facility. The commitment fee is allocated among participating Funds based on an allocation schedule set forth in the credit agreement. For the six months ended June 30, 2020, the Fund had no borrowings under the credit facility.
Pioneer Core Equity Fund | Semiannual Report | 6/30/20 41
Statement Regarding Liquidity Risk Management Program
As required by law, the Fund has adopted and implemented a liquidity risk management program (the “Program”) that is designed to assess and manage liquidity risk. Liquidity risk is the risk that the Fund could not meet requests to redeem its shares without significant dilution of remaining investors’ interests in the Fund. The Fund’s Board of Trustees designated a liquidity risk management committee (the “Committee”) consisting of employees of Amundi Pioneer Asset Management, Inc. (the “Adviser”) to administer the Program.
The Committee provided the Board of Trustees with a report that addressed the operation of the Program and assessed its adequacy and effectiveness of implementation (the “Report”). The Report covered the period from December 1, 2018 through March 31, 2020 (the “Reporting Period”).
The Report confirmed that, throughout the Reporting Period, the Committee had monitored the Fund’s portfolio liquidity and liquidity risk on an ongoing basis, as described in the Program and in Board reporting throughout the Reporting Period.
The Report discussed the Committee’s annual review of the Program, which addressed, among other things, the following elements of the Program:
The Committee reviewed the Fund’s investment strategy and liquidity of portfolio investments during both normal and reasonably foreseeable stressed conditions. The Committee noted that the Fund’s investment strategy continues to be appropriate for an open-end fund, taking into account, among other things, whether and to what extent the Fund held less liquid and illiquid assets and the extent to which any such investments affected the Fund’s ability to meet redemption requests. In managing and reviewing the Fund’s liquidity risk, the Committee also considered the extent to which the Fund’s investment strategy involves a relatively concentrated portfolio or large positions in particular issuers, the extent to which the Fund uses borrowing for investment purposes, and the extent to which the Fund uses derivatives (including for hedging purposes). The Committee also reviewed the Fund’s short-term and long-term cash flow projections during both normal and reasonably foreseeable stressed conditions. In assessing the Fund’s cash flow projections, the Committee considered, among other factors, historical net redemption activity, redemption policies, ownership concentration, distribution channels, and the degree of certainty associated with the Fund’s short-term and long-term cash flow projections. The Committee also considered the Fund’s holdings of cash and cash equivalents, as well as borrowing arrangements and other funding sources, including, if applicable, the Fund’s participation in a credit
42 Pioneer Core Equity Fund | Semiannual Report | 6/30/20
facility, as components of the Fund’s ability to meet redemption requests. The Fund has adopted an in-kind redemption policy which may be utilized to meet larger redemption requests.
The Committee reviewed the Program’s liquidity classification methodology for categorizing the Fund’s investments into one of four liquidity buckets. In reviewing the Fund’s investments, the Committee considered, among other factors, whether trading varying portions of a position in a particular portfolio investment or asset class in sizes the Fund would reasonably anticipate trading, would be reasonably expected to significantly affect liquidity.
The Committee performed an analysis to determine whether the Fund is required to maintain a Highly Liquid Investment Minimum, and determined that no such minimum is required because the Fund primarily holds highly liquid investments.
The Report stated that the Committee concluded the Program operates adequately and effectively, in all material respects, to assess and manage the Fund’s liquidity risk throughout the Reporting Period.
Pioneer Core Equity Fund | Semiannual Report | 6/30/20 43
Trustees, Officers and Service Providers
| | |
| Trustees | Officers |
Thomas J. Perna, Chairman | Lisa M. Jones, President and |
John E. Baumgardner, Jr. | Chief Executive Officer |
Diane Durnin | Mark E. Bradley, Treasurer and |
Benjamin M. Friedman | Chief Financial and |
Lisa M. Jones | Accounting Officer |
Lorraine H. Monchak | Christopher J. Kelley, Secretary and |
Marguerite A. Piret | Chief Legal Officer |
Fred J. Ricciardi | |
Kenneth J. Taubes | |
Investment Adviser and Administrator
Amundi Pioneer Asset Management, Inc.
Custodian and Sub-Administrator
Brown Brothers Harriman & Co.
Principal Underwriter
Amundi Pioneer Distributor, Inc.
Legal Counsel
Morgan, Lewis & Bockius LLP
Transfer Agent
DST Asset Manager Solutions, Inc.
Proxy Voting Policies and Procedures of the Fund are available without charge, upon request, by calling our toll free number (1-800-225-6292). Information regarding how the Fund voted proxies relating to portfolio securities during the most recent 12-month period ended June 30 is publicly available to shareowners at www.amundipioneer.com/us. This information is also available on the Securities and Exchange Commission’s web site at www.sec.gov.
44 Pioneer Core Equity Fund | Semiannual Report | 6/30/20
How to Contact Amundi Pioneer
We are pleased to offer a variety of convenient ways for you to contact us for assistance or information.
| | | |
| Call us for: | | |
Account Information, including existing accounts, | |
new accounts, prospectuses, applications | |
and service forms | | 1-800-225-6292 |
| | | |
FactFoneSM for automated fund yields, prices, | |
account information and transactions | 1-800-225-4321 |
| | |
| Retirement plans information | 1-800-622-0176 |
|
| Write to us: | | |
Amundi Pioneer | | |
P.O. Box 219427 | | |
Kansas City, MO 64121-9427 | | |
| | | |
| Our toll-free fax | | 1-800-225-4240 |
| | | |
| Our internet e-mail address | us.askamundipioneer@amundipioneer.com |
(for general questions about Amundi Pioneer only) | |
|
| Visit our web site: www.amundipioneer.com/us | |
This report must be preceded or accompanied by a prospectus.
The Fund files a complete schedule of portfolio holdings with the Securities and Exchange Commission for the first and third quarters of each fiscal year as an exhibit to its reports on Form N-PORT. Shareholders may view the filed Form N-PORT by visiting the Commission’s web site at https://www.sec.gov.
Amundi Pioneer Asset Management, Inc.
60 State Street
Boston, MA 02109
www.amundipioneer.com/us
Securities offered through Amundi Pioneer Distributor, Inc.
60 State Street, Boston, MA 02109
Underwriter of Pioneer Mutual Funds, Member SIPC
© 2020 Amundi Pioneer Asset Management 19408-14-0820
ITEM 2. CODE OF ETHICS.
(a) Disclose whether, as of the end of the period covered by the report, the registrant has adopted a code of ethics that applies to the registrant’s principal executive officer, principal financial officer, principal accounting officer or controller, or persons performing similar functions, regardless of whether these individuals are employed by the registrant or a third party. If the registrant has not adopted such a code of ethics, explain why it has not done so.
The registrant has adopted, as of the end of the period covered by this report, a code of ethics that applies to the registrant’s principal executive officer, principal financial officer, principal accounting officer and controller.
(b) For purposes of this Item, the term “code of ethics” means written standards that are reasonably designed to deter wrongdoing and to promote:
(1) Honest and ethical conduct, including the ethical handling of actual or apparent conflicts of interest between personal and professional relationships;
(2) Full, fair, accurate, timely, and understandable disclosure in reports and documents that a registrant files with, or submits to, the Commission and in other public communications made by the registrant;
(3) Compliance with applicable governmental laws, rules, and regulations;
(4) The prompt internal reporting of violations of the code to an appropriate person or persons identified in the code; and
(5) Accountability for adherence to the code.
(c) The registrant must briefly describe the nature of any amendment, during the period covered by the report, to a provision of its code of ethics that applies to the registrant’s principal executive officer, principal financial officer, principal accounting officer or controller, or persons performing similar functions, regardless of whether these individuals are employed by the registrant or a third party, and that relates to any element of the code of ethics definition enumerated in paragraph (b) of this Item. The registrant must file a copy of any such amendment as an exhibit pursuant to Item 10(a), unless the registrant has elected to satisfy paragraph (f) of this Item by posting its code of ethics on its website pursuant to paragraph (f)(2) of this Item, or by undertaking to provide its code of ethics to any person without charge, upon request, pursuant to paragraph (f)(3) of this Item.
The registrant has made no amendments to the code of ethics during the period covered by this report.
(d) If the registrant has, during the period covered by the report, granted a waiver, including an implicit waiver, from a provision of the code of ethics to the registrant’s principal executive officer, principal financial officer, principal accounting officer or controller, or persons performing similar functions, regardless of whether these individuals are employed by the registrant or a third party, that relates to one or more of the items set forth in paragraph (b) of this Item, the registrant must briefly describe the nature of the waiver, the name of the person to whom the waiver was granted, and the date of the waiver.
Not applicable.
(e) If the registrant intends to satisfy the disclosure requirement under paragraph (c) or (d) of this Item regarding an amendment to, or a waiver from, a provision of its code of ethics that applies to the registrant’s principal executive officer, principal financial officer, principal accounting officer or controller, or persons performing similar functions and that relates to any element of the code of ethics definition enumerated in paragraph (b) of this Item by posting such information on its Internet website, disclose the registrant’s Internet address and such intention.
Not applicable.
(f) The registrant must:
(1) File with the Commission, pursuant to Item 12(a)(1), a copy of its code of ethics that applies to the registrant’s principal executive officer, principal financial officer, principal accounting officer or controller, or persons performing similar functions, as an exhibit to its annual report on this Form N-CSR (see attachment);
(2) Post the text of such code of ethics on its Internet website and disclose, in its most recent report on this Form N-CSR, its Internet address and the fact that it has posted such code of ethics on its Internet website; or
(3) Undertake in its most recent report on this Form N-CSR to provide to any person without charge, upon request, a copy of such code of ethics and explain the manner in which such request may be made. See Item 10(2)
ITEM 3. AUDIT COMMITTEE FINANCIAL EXPERT.
(a) (1) Disclose that the registrant’s board of trustees has determined that the registrant either:
(i) Has at least one audit committee financial expert serving on its audit committee; or
(ii) Does not have an audit committee financial expert serving on its audit committee.
The registrant’s Board of Trustees has determined that the registrant has at least one audit committee financial expert.
(2) If the registrant provides the disclosure required by paragraph (a)(1)(i) of this Item, it must disclose the name of the audit committee financial expert and whether that person is “independent.” In order to be considered “independent” for purposes of this Item, a member of an audit committee may not, other than in his or her capacity as a member of the audit committee, the board of trustees, or any other board committee:
(i) Accept directly or indirectly any consulting, advisory, or other compensatory fee from the issuer; or
(ii) Be an “interested person” of the investment company as defined in Section 2(a)(19) of the Act (15 U.S.C. 80a-2(a)(19)).
Mr. Fred J. Ricciardi, an independent trustee, is such an audit committee financial expert.
(3) If the registrant provides the disclosure required by paragraph (a)(1) (ii) of this Item, it must explain why it does not have an audit committee financial expert.
Not applicable.
ITEM 4. PRINCIPAL ACCOUNTANT FEES AND SERVICES.
(a) Disclose, under the caption AUDIT FEES, the aggregate fees billed for each of the last two fiscal years for professional services rendered by the principal accountant for the audit of the registrant’s annual financial statements or services that are normally provided by the accountant in connection with statutory and regulatory filings or engagements for those fiscal years.
N/A
(b) Disclose, under the caption AUDIT-RELATED FEES, the aggregate fees billed in each of the last two fiscal years for assurance and related services by the principal accountant that are reasonably related to the performance of the audit of the registrant’s financial statements and are not reported under paragraph (a) of this Item. Registrants shall describe the nature of the services comprising the fees disclosed under this category.
N/A
(c) Disclose, under the caption TAX FEES, the aggregate fees billed in each of the last two fiscal years for professional services rendered by the principal accountant for tax compliance, tax advice, and tax planning. Registrants shall describe the nature of the services comprising the fees disclosed under this category.
N/A
(d) Disclose, under the caption ALL OTHER FEES, the aggregate fees billed in each of the last two fiscal years for products and services provided by the principal accountant, other than the services reported in paragraphs (a) through (c) of this Item. Registrants shall describe the nature of the services comprising the fees disclosed under this category.
N/A
(e) (1) Disclose the audit committee’s pre-approval policies and procedures described in paragraph (c)(7) of Rule 2-01 of Regulation S-X.
PIONEER FUNDS
APPROVAL OF AUDIT, AUDIT-RELATED, TAX AND OTHER SERVICES
PROVIDED BY THE INDEPENDENT AUDITOR
SECTION I - POLICY PURPOSE AND APPLICABILITY
The Pioneer Funds recognize the importance of maintaining the independence of their outside auditors. Maintaining independence is a shared responsibility involving Amundi Pioneer Asset Management, Inc, the audit committee and the independent auditors.
The Funds recognize that a Fund’s independent auditors: 1) possess knowledge of the Funds, 2) are able to incorporate certain services into the scope of the audit, thereby avoiding redundant work, cost and disruption of Fund personnel and processes, and 3) have expertise that has value to the Funds. As a result, there are situations where it is desirable to use the Fund’s independent auditors for services in addition to the annual audit and where the potential for conflicts of interests are minimal. Consequently, this policy, which is intended to comply with Rule 210.2-01(C)(7), sets forth guidelines and procedures to be followed by the Funds when retaining the independent audit firm to perform audit, audit-related tax and other services under those circumstances, while also maintaining independence.
Approval of a service in accordance with this policy for a Fund shall also constitute approval for any other Fund whose pre-approval is required pursuant to Rule 210.2-01(c)(7)(ii).
In addition to the procedures set forth in this policy, any non-audit services that may be provided consistently with Rule 210.2-01 may be approved by the Audit Committee itself and any pre-approval that may be waived in accordance with Rule 210.2-01(c)(7)(i)(C) is hereby waived.
Selection of a Fund’s independent auditors and their compensation shall be determined by the Audit Committee and shall not be subject to this policy.
| | | |
| SECTION II - POLICY |
| |
SERVICE CATEGORY | SERVICE CATEGORY DESCRIPTION | SPECIFIC PRE-APPROVED SERVICE SUBCATEGORIES |
| | | |
I. AUDIT SERVICES | Services that are directly | o Accounting research assistance |
| | related to performing the | o SEC consultation, registration |
| | independent audit of the Funds | statements, and reporting |
| | | o Tax accrual related matters |
| | | o Implementation of new accounting standards |
| | | o Compliance letters (e.g. rating agency letters) |
| | | o Regulatory reviews and assistance |
| | | regarding financial matters |
| | | o Semi-annual reviews (if requested) |
| | | o Comfort letters for closed end offerings |
II. AUDIT-RELATED | Services which are not | o AICPA attest and agreed-upon procedures |
SERVICES | prohibited under Rule | o Technology control assessments |
| | 210.2-01(C)(4) (the “Rule”) | o Financial reporting control assessments |
| | and are related extensions of | o Enterprise security architecture |
| | the audit services support the | assessment |
| | audit, or use the knowledge/expertise | |
| | gained from the audit procedures as a | |
| | foundation to complete the project. | |
| | In most cases, if the Audit-Related | |
| | Services are not performed by the | |
| | Audit firm, the scope of the Audit | |
| | Services would likely increase. | |
| | The Services are typically well-defined | |
| | and governed by accounting | |
| | professional standards (AICPA, | |
| | SEC, etc.) | |
| | |
AUDIT COMMITTEE APPROVAL POLICY | AUDIT COMMITTEE REPORTING POLICY |
| o “One-time” pre-approval | o A summary of all such |
| for the audit period for all | services and related fees |
| pre-approved specific service | reported at each regularly |
| subcategories. Approval of the | scheduled Audit Committee |
| independent auditors as | meeting. |
| auditors for a Fund shall | |
| constitute pre approval for | |
| these services. | |
| |
| o “One-time” pre-approval | o A summary of all such |
| for the fund fiscal year within | services and related fees |
| a specified dollar limit | (including comparison to |
| for all pre-approved | specified dollar limits) |
| specific service subcategories | reported quarterly. |
| |
| o Specific approval is | |
| needed to exceed the | |
| pre-approved dollar limit for | |
| these services (see general | |
Audit Committee approval policy | |
| below for details on obtaining | |
| specific approvals) | |
| |
| o Specific approval is | |
| needed to use the Fund’s | |
| auditors for Audit-Related | |
| Services not denoted as | |
| “pre-approved”, or | |
| to add a specific service | |
| subcategory as “pre-approved” | |
SECTION III - POLICY DETAIL, CONTINUED
| | |
SERVICE CATEGORY | SERVICE CATEGORY DESCRIPTION | SPECIFIC PRE-APPROVED SERVICE |
| | | SUBCATEGORIES |
III. TAX SERVICES | Services which are not | o Tax planning and support |
| | prohibited by the Rule, | o Tax controversy assistance |
| | if an officer of the Fund | o Tax compliance, tax returns, excise |
| | determines that using the | tax returns and support |
| | Fund’s auditor to provide | o Tax opinions |
| | these services creates | |
| | significant synergy in | |
| | the form of efficiency, | |
| | minimized disruption, or | |
| | the ability to maintain a | |
| | desired level of | |
| | confidentiality. | |
| | |
| AUDIT COMMITTEE APPROVAL POLICY | AUDIT COMMITTEE REPORTING POLICY |
o “One-time” pre-approval | o A summary of |
for the fund fiscal year | all such services and |
within a specified dollar limit | related fees |
| | (including comparison |
| | to specified dollar |
| | limits) reported |
| | quarterly. |
| |
o Specific approval is | |
| needed to exceed the | |
| pre-approved dollar limits for | |
| these services (see general | |
| Audit Committee approval policy | |
| below for details on obtaining | |
| specific approvals) | |
| |
o Specific approval is | |
| needed to use the Fund’s | |
| auditors for tax services not | |
| denoted as pre-approved, or to | |
add a specific service subcategory as | |
| “pre-approved” | |
SECTION III - POLICY DETAIL, CONTINUED
| |
SERVICE CATEGORY | SERVICE CATEGORY DESCRIPTION | SPECIFIC PRE-APPROVED SERVICE |
| | | SUBCATEGORIES |
IV. OTHER SERVICES | Services which are not | o Business Risk Management support |
| | prohibited by the Rule, | o Other control and regulatory |
A. SYNERGISTIC, | if an officer of the Fund | compliance projects |
UNIQUE QUALIFICATIONS | determines that using the | |
| | Fund’s auditor to provide | |
| | these services creates | |
| | significant synergy in | |
| | the form of efficiency, | |
| | minimized disruption, | |
| | the ability to maintain a | |
| | desired level of | |
| | confidentiality, or where | |
| | the Fund’s auditors | |
| | posses unique or superior | |
| | qualifications to provide | |
| | these services, resulting | |
| | in superior value and | |
| | results for the Fund. | |
| | |
AUDIT COMMITTEE APPROVAL POLICY | AUDIT COMMITTEE REPORTING POLICY |
o “One-time” pre-approval | o A summary of |
| for the fund fiscal year within | all such services and |
| a specified dollar limit | related fees |
| | (including comparison |
| | to specified dollar |
| | limits) reported |
| | quarterly. |
o Specific approval is | |
| needed to exceed the | |
| pre-approved dollar limits for | |
| these services (see general | |
| Audit Committee approval policy | |
| below for details on obtaining | |
| specific approvals) | |
| |
o Specific approval is | |
| needed to use the Fund’s | |
| auditors for “Synergistic” or | |
| “Unique Qualifications” Other | |
| Services not denoted as | |
| pre-approved to the left, or to | |
| add a specific service | |
| subcategory as “pre-approved” | |
SECTION III - POLICY DETAIL, CONTINUED
| |
SERVICE CATEGORY | SERVICE CATEGORY DESCRIPTION | SPECIFIC PROHIBITED SERVICE |
| | | SUBCATEGORIES |
PROHIBITED SERVICES | Services which result | 1. Bookkeeping or other services |
| | in the auditors losing | related to the accounting records or |
| | independence status | financial statements of the audit |
| | under the Rule. | client* |
| | | 2. Financial information systems design |
| | | and implementation* |
| | | 3. Appraisal or valuation services, |
| | | fairness* opinions, or |
| | | contribution-in-kind reports |
| | | 4. Actuarial services (i.e., setting |
| | | actuarial reserves versus actuarial |
| | | audit work)* |
| | | 5. Internal audit outsourcing services* |
| | | 6. Management functions or human |
| | | resources |
| | | 7. Broker or dealer, investment |
| | | advisor, or investment banking services |
| | | 8. Legal services and expert services |
| | | unrelated to the audit |
| | | 9. Any other service that the Public |
| | | Company Accounting Oversight Board |
| | | determines, by regulation, is |
| | | impermissible |
| | |
AUDIT COMMITTEE APPROVAL POLICY | AUDIT COMMITTEE REPORTING POLICY |
o These services are not to be | o A summary of all |
| performed with the exception of the(*) | services and related |
| services that may be permitted | fees reported at each |
| if they would not be subject to audit | regularly scheduled |
| procedures at the audit client (as | Audit Committee meeting |
| defined in rule 2-01(f)(4)) level | will serve as continual |
| the firm providing the service. | confirmation that has |
| | not provided any |
| | restricted services. |
GENERAL AUDIT COMMITTEE APPROVAL POLICY:
o For all projects, the officers of the Funds and the Fund’s auditors will each make an assessment to determine that any proposed projects will not impair independence.
o Potential services will be classified into the four non-restricted service categories and the “Approval of Audit, Audit-Related, Tax and Other Services” Policy above will be applied. Any services outside the specific pre-approved service subcategories set forth above must be specifically approved by the Audit Committee.
o At least quarterly, the Audit Committee shall review a report summarizing the services by service category, including fees, provided by the Audit firm as set forth in the above policy.
(2) Disclose the percentage of services described in each of paragraphs (b) through (d) of this Item that were approved by the audit committee pursuant to paragraph (c)(7)(i)(C) of Rule 2-01 of Regulation S-X.
N/A
(f) If greater than 50 percent, disclose the percentage of hours expended on the principal accountants engagement to audit the registrant’s financial statements for the most recent fiscal year that were attributed to work performed by persons other than the principal accountant’s full-time, permanent employees.
N/A
(g) Disclose the aggregate non-audit fees billed by the registrants accountant for services rendered to the registrant, and rendered to the registrants investment adviser (not including any sub-adviser whose role is primarily portfolio management and is subcontracted with or overseen by another investment adviser), and any entity controlling, controlled by, or under common control with the adviser that provides ongoing services to the registrant for each of the last two fiscal years of the registrant.
N/A
(h) Disclose whether the registrants audit committee of the board of trustees has considered whether the provision of non-audit services that were rendered to the registrants investment adviser (not including any subadviser whose role is primarily portfolio management and is subcontracted with or overseen by another investment adviser), and any entity controlling, controlled by, or under common control with the investment adviser that provides ongoing services to the registrant that were not pre-approved pursuant to paragraph (c)(7)(ii) of Rule 2-01 of Regulation S-X is compatible with maintaining the principal accountant’s independence.
The Fund’s audit committee of the Board of Trustees has considered whether the provision of non-audit services that were rendered to the Affiliates (as defined) that were not pre- approved pursuant to paragraph (c)(7)(ii) of Rule 2-01 of Regulation S-X is compatible with maintaining the principal accountant’s independence.
ITEM 5. AUDIT COMMITTEE OF LISTED REGISTRANTS
(a) If the registrant is a listed issuer as defined in Rule 10A-3 under the Exchange Act (17 CFR 240.10A-3), state whether or not the registrant has a separately-designated standing audit committee established in accordance with Section 3(a)(58)(A) of the Exchange Act (15 U.S.C. 78c(a)(58)(A)). If the registrant has such a committee, however designated, identify each committee member. If the entire board of directors is acting as the registrant’s audit committee as specified in Section 3(a)(58)(B) of the Exchange Act (15 U.S.C. 78c(a)(58)(B)), so state.
N/A
(b) If applicable, provide the disclosure required by Rule 10A-3(d) under the Exchange Act (17 CFR 240.10A-3(d)) regarding an exemption from the listing standards for audit committees.
N/A
ITEM 6. SCHEDULE OF INVESTMENTS.
File Schedule of Investments in securities of unaffiliated issuers as of the close of the reporting period as set forth in 210.1212 of Regulation S-X [17 CFR 210.12-12], unless the schedule is included as part of the report to shareholders filed under Item 1 of this Form.
Included in Item 1
ITEM 7. DISCLOSURE OF PROXY VOTING POLICIES AND PROCEDURES FOR CLOSED-END MANAGEMENT INVESTMENT COMPANIES.
A closed-end management investment company that is filing an annual report on this Form N-CSR must, unless it invests exclusively in non-voting securities, describe the policies and procedures that it uses to determine how to vote proxies relating to portfolio securities, including the procedures that the company uses when a vote presents a conflict between the interests of its shareholders, on the one hand, and those of the company’s investment adviser; principal underwriter; or any affiliated person (as defined in Section 2(a)(3) of the Investment Company Act of 1940 (15 U.S.C. 80a-2(a)(3)) and the rules thereunder) of the company, its investment adviser, or its principal underwriter, on the other. Include any policies and procedures of the company’s investment adviser, or any other third party, that the company uses, or that are used on the company’s behalf, to determine how to vote proxies relating to portfolio securities.
N/A
ITEM 8. PORTFOLIO MANAGERS OF CLOSED-END MANAGEMENT INVESTMENT COMPANIES.
(a) If the registrant is a closed-end management investment company that is filing an annual report on this Form N-CSR, provide the following information:
(1) State the name, title, and length of service of the person or persons employed by or associated with the registrant or an investment adviser of the registrant who are primarily responsible for the day-to-day management of the registrant’s portfolio (“Portfolio Manager”). Also state each Portfolio Manager’s business experience during the past 5 years.
N/A
ITEM 9. PURCHASES OF EQUITY SECURITIES BY CLOSED-END MANAGEMENT INVESTMENT COMPANY AND AFFILIATED PURCHASERS.
(a) If the registrant is a closed-end management investment company, in the following tabular format, provide the information specified in paragraph (b) of this Item with respect to any purchase made by or on behalf of the registrant or any affiliated purchaser, as defined in Rule 10b-18(a)(3) under the Exchange Act (17 CFR 240.10b-18(a)(3)), of shares or other units of any class of the registrant’s equity securities that is registered by the registrant pursuant to Section 12 of the Exchange Act (15 U.S.C. 781).
N/A
ITEM 10. SUBMISSION OF MATTERS TO A VOTE OF SECURITY HOLDERS.
Describe any material changes to the procedures by which shareholders may recommend nominees to the registrant’s board of directors, where those changes were implemented after the registrant last provided disclosure in response to the requirements of Item 407(c)(2)(iv) of Regulation S-R(17 CFR 229.407)(as required by Item 22(b)(15)) of Schedule 14A (17 CFR 240.14a-101), or this Item.
There have been no material changes to the procedures by which the shareholders may recommend nominees to the registrant’s board of directors since the registrant last provided disclosure in response to the requirements of Item 407(c)(2)(iv) of Regulation S-R of Schedule 14(A) in its definitive proxy statement, or this item.
ITEM 11. CONTROLS AND PROCEDURES.
(a) Disclose the conclusions of the registrant’s principal executive and principal financials officers, or persons performing similar functions, regarding the effectiveness of the registrant’s disclosure controls and procedures (as defined in Rule 30a-3(c) under the Act (17 CFR 270.30a-3(c))) as of a date within 90 days of the filing date of the report that includes the disclosure required by this paragraph, based on the evaluation of these controls and procedures required by Rule 30a-3(b) under the Act (17 CFR 270.30(a)-3(b) and Rules 13a-15(b) or 15d-15(b) under the Exchange Act (17 CFR 240.13a-15(b) or 240.15d-15(b)).
The registrant’s principal executive officer and principal financial officer have concluded that the registrant’s disclosure controls and procedures are effective based on the evaluation of these controls and procedures as of a date within 90 days of the filing date of this report.
(b) Disclose any change in the registrant’s internal control over financial reporting (as defined in Rule 30a-3(d) under the Act (17CFR 270.30a-3(d)) that occured during the second fiscal quarter of the period covered by this report that has materially affected, or is reasonably likely to materially affect, the registrant’s internal control over financial reporting.
There were no significant changes in the registrant’s internal control over financial reporting that occurred during the second fiscal quarter of the period covered by this report that have materially affected, or are reasonably likely to materially affect, the registrant’s internal control over financial reporting.
Item 12. Disclosure of Securities Lending Activities for Closed-End Management Investment Companies.
(a) If the registrant is a closed-end management investment company, provide the following dollar amounts of income and compensation related to the securities lending activities of the registrant during its most recent fiscal year:
N/A
(1) Gross income from securities lending activities;
N/A
(2) All fees and/or compensation for each of the following securities lending activities and related services: any share of revenue generated by the securities lending program paid to the securities lending agent(s) (revenue split); fees paid for cash collateral management services (including fees deducted from a pooled cash collateral reinvestment vehicle) that are not included in the revenue split; administrative fees that are not included in the revenue split; fees for indemnification that are not included in the revenue split; rebates paid to borrowers; and any other fees relating to the securities lending program that are not included in the revenue split, including a description of those other fees;
N/A
(3) The aggregate fees/compensation disclosed pursuant to paragraph (2); and
N/A
(4) Net income from securities lending activities (i.e., the dollar amount in paragraph (1) minus the dollar amount in paragraph (3)).
If a fee for a service is included in the revenue split, state that the fee is included in the revenue split.
N/A
(b) If the registrant is a closed-end management investment company, describe the services provided to the registrant by the securities lending agent in the registrants most recent fiscal year.
N/A
ITEM 13. EXHIBITS.
(a) File the exhibits listed below as part of this Form. Letter or number the exhibits in the sequence indicated.
SIGNATURES
[See General Instruction F]
Pursuant to the requirements of the Securities Exchange Act of 1934 and the Investment Company Act of 1940, the registrant has duly caused this report to be signed on its behalf by the undersigned, thereunto duly authorized.
(Registrant) Pioneer Series Trust XI
By (Signature and Title)* /s/ Lisa M. Jones
Lisa M. Jones, President & Chief Executive Officer
Date September 4, 2020
Pursuant to the requirements of the Securities Exchange Act of 1934 and the Investment Company Act of 1940, this report has been signed below by the following persons on behalf of the registrant and in the capacities and on the dates indicated.
By (Signature and Title)* /s/ Lisa M. Jones
Lisa M. Jones, President & Chief Executive Officer
Date September 4, 2020
By (Signature and Title)* /s/ Mark E. Bradley
Mark E. Bradley, Treasurer & Chief Accounting & Financial Officer
Date September 4, 2020
* Print the name and title of each signing officer under his or her signature.