Securities Act File No. [ ]
As filed with the Securities and Exchange Commission on October 13, 2016
SECURITIES AND EXCHANGE COMMISSION
WASHINGTON, D.C. 20549
FORM N-14
REGISTRATION STATEMENT
UNDER
| | |
| THE SECURITIES ACT OF 1933 | | ☒ |
| Pre-Effective Amendment No. [ ] | | ☐ |
| PEA | | ☐ |
TRANSAMERICA FUNDS
(Exact Name of Registrant as Specified in Charter)
1801 California Street, Suite 5200, Denver, Colorado 80202
(Address of Principal Executive Offices) (Zip Code)
Registrant’s Telephone Number, including Area Code: (720) 493-4256
Tané T. Tyler, Esq., 1801 California Street, Suite 5200, Denver, Colorado 80202
(Name and Address of Agent for Service)
Approximate Date of Proposed Public Offering: As soon as practicable after this Registration Statement becomes effective.
It is proposed that this filing will become effective on November 14, 2016 pursuant to Rule 488 under the Securities Act of 1933.
No filing fee is required because an indefinite number of shares has previously been registered pursuant to Rule 24f-2 under the Investment Company Act of 1940, as amended
The information in this Proxy Statement/Prospectus is not complete and may be changed. We may not sell these securities until the registration statement filed with the Securities and Exchange Commission is effective. This Proxy Statement/ Prospectus is not an offer to sell these securities and it is not soliciting an offer to buy these securities in any state where the offer or sale is not permitted.
TRANSAMERICA PARTNERS FUNDS GROUP
TRANSAMERICA PARTNERS FUNDS GROUP II
TRANSAMERICA PARTNERS PORTFOLIOS
1801 California Street, Ste. 5200
Denver, Colorado 80202
(Toll free) 1-888-233-4339
[ ], 2016
Dear Holder:
You are being asked to vote on a proposed reorganization of your Transamerica Partners fund into another mutual fund also managed by Transamerica Asset Management, Inc. (“TAM”). Detailed information about the proposal is contained in the enclosed combined proxy statement/prospectus.
The Board of Trustees of your Transamerica Partners fund has called a Special Meeting of Holders of the fund to be held at [the offices of TAM, 1801 California Street, Suite 5200, Denver, Colorado 80202], on February 10, 2017 at [10:00 a.m.], Mountain Time, to consider and vote on an Agreement and Plan of Reorganization pursuant to which your fund would reorganize into the corresponding destination fund.
The proposed reorganization of your fund is part of an initiative designed to streamline the Transamerica fund family and to promote operating efficiencies. The Transamerica Partners funds were initially established primarily for retirement and benefit plan investors. Separate funds managed by TAM, branded Transamerica Funds, are offered more broadly. In a number of instances, funds in both groups overlap, and TAM believes that investors could benefit from the fund groups being combined and consolidated. The Transamerica Partners fund group has been experiencing net outflows for some time while the Transamerica Funds fund family has been growing. If approved by holders, the Transamerica Partners funds would reorganize into destination funds which are part of Transamerica Funds, which had net assets of approximately $19.9 billion as of June 30, 2016. The Transamerica Partners fund reorganizations would ultimately result in the elimination of the Transamerica Partners funds.
We have enclosed the combined proxy statement/prospectus seeking holder approval of certain of the Transamerica Partners fund reorganizations. These are reorganizations into certain existing destination funds. The approval of additional Transamerica Partners fund reorganizations into new destination funds is being sought via a separate combined proxy statement/prospectus.
After careful consideration, the Board of your Transamerica Partners fund unanimously approved your fund’s reorganization, and recommends that you vote “FOR” the proposal to reorganize your fund. Holders of record of the Transamerica Partners funds at the close of business on October 14, 2016 are entitled to vote at the meeting and any adjournments or postponements thereof.
Your vote is very important to us regardless of the number of shares you own. Whether or not you plan to attend the meeting in person, please read the combined proxy statement/prospectus and cast your vote promptly. To cast your vote, follow the instructions on the enclosed proxy card to vote by telephone or on the internet or complete, sign and return the proxy card in the enclosed postage-paid envelope.
If you have any questions, please call [ ] at [ ].
Sincerely,
Marijn P. Smit
Chairman of the Board. President
and Chief Executive Officer
TRANSAMERICA PARTNERS FUNDS GROUP
TRANSAMERICA PARTNERS FUNDS GROUP II
TRANSAMERICA PARTNERS PORTFOLIOS
1801 California Street, Ste. 5200
Denver, Colorado 80202
(Toll free) 1-888-233-4339
NOTICE OF SPECIAL MEETING OF HOLDERS
Scheduled for February 10, 2017
Special meetings of the holders of the funds identified below (for each fund, a “Special Meeting”) will be held at the offices of Transamerica Asset Management, Inc., 1801 California Street, Suite 5200, Denver, Colorado 80202, on February 10, 2017 at [10:00 a.m.], Mountain Time, to consider and vote on the following:
GROUP 1 - CORE BOND FUNDS
| | |
| PROPOSAL 1A: | | To approve an Agreement and Plan of Reorganization, providing for (i) Transamerica Intermediate Bond’s acquisition of all of the assets of Transamerica Partners Core Bond, in exchange for Transamerica Intermediate Bond’s assumption of all of the liabilities of Transamerica Partners Core Bond and Class R shares of Transamerica Intermediate Bond, and the distribution of the Class R shares of Transamerica Intermediate Bond to the holders of the shares of Transamerica Partners Core Bond in complete redemption of their Transamerica Partners Core Bond shares, and (ii) the dissolution of Transamerica Partners Core Bond; |
| |
| PROPOSAL 1B: | | To approve an Agreement and Plan of Reorganization, providing for (i) Transamerica Intermediate Bond’s acquisition of all of the assets of Transamerica Partners Institutional Core Bond, in exchange for Transamerica Intermediate Bond’s assumption of all of the liabilities of Transamerica Partners Institutional Core Bond and Class R4 shares of Transamerica Intermediate Bond, and the distribution of the Class R4 shares of Transamerica Intermediate Bond to the holders of the shares of Transamerica Partners Institutional Core Bond in complete redemption of their Transamerica Partners Institutional Core Bond shares, and (ii) the dissolution of Transamerica Partners Institutional Core Bond; |
| |
| PROPOSAL 1C: | | To approve an Agreement and Plan of Reorganization, providing for (i) Transamerica Intermediate Bond’s acquisition of all of the assets of Transamerica Partners Core Bond Portfolio, in exchange for Transamerica Intermediate Bond’s assumption of all of the liabilities of Transamerica Partners Core Bond Portfolio and Class I3 shares of Transamerica Intermediate Bond, and the distribution of the Class I3 shares of Transamerica Intermediate Bond to the holders of the beneficial interests in Transamerica Partners Core Bond Portfolio in complete redemption of their Transamerica Partners Core Bond Portfolio beneficial interests, and (ii) the dissolution of Transamerica Partners Core Bond Portfolio; |
|
| GROUP 2 - GOVERNMENT MONEY MARKET FUNDS |
| PROPOSAL 2A: | | To approve an Agreement and Plan of Reorganization, providing for (i) Transamerica Government Money Market’s acquisition of all of the assets of Transamerica Partners Government Money Market, in exchange for Transamerica Government Money Market’s assumption of all of the liabilities of Transamerica Partners Government Money Market and Class R shares of Transamerica Government Money Market, and the distribution of the Class R shares of Transamerica Government Money Market to the holders of the shares of Transamerica Partners Government Money Market in complete redemption of their Transamerica Partners Government Money Market shares, and (ii) the dissolution of Transamerica Partners Government Money Market; |
- 2 -
| | |
| |
| PROPOSAL 2B: | | To approve an Agreement and Plan of Reorganization, providing for (i) Transamerica Government Money Market’s acquisition of all of the assets of Transamerica Partners Institutional Government Money Market, in exchange for Transamerica Government Money Market’s assumption of all of the liabilities of Transamerica Partners Institutional Government Money Market and Class R4 shares of Transamerica Government Money Market, and the distribution of the Class R4 shares of Transamerica Government Money Market to the holders of the shares of Transamerica Partners Institutional Government Money Market in complete redemption of their Transamerica Partners Institutional Government Money Market shares, and (ii) the dissolution of Transamerica Partners Institutional Government Money Market; |
| |
| PROPOSAL 2C: | | To approve an Agreement and Plan of Reorganization, providing for (i) Transamerica Government Money Market’s acquisition of all of the assets of Transamerica Partners Government Money Market Portfolio, in exchange for Transamerica Government Money Market’s assumption of all of the liabilities of Transamerica Partners Government Money Market Portfolio and Class I3 shares of Transamerica Government Money Market, and the distribution of the Class I3 shares of Transamerica Government Money Market to the holders of the beneficial interests in Transamerica Partners Government Money Market Portfolio in complete redemption of their Transamerica Partners Government Money Market Portfolio beneficial interests, and (ii) the dissolution of Transamerica Partners Government Money Market Portfolio; |
|
| GROUP 3 - HIGH YIELD BOND FUNDS |
| PROPOSAL 3A: | | To approve an Agreement and Plan of Reorganization, providing for (i) Transamerica High Yield Bond’s acquisition of all of the assets of Transamerica Partners High Yield Bond, in exchange for Transamerica High Yield Bond’s assumption of all of the liabilities of Transamerica Partners High Yield Bond and Class R shares of Transamerica High Yield Bond, and the distribution of the Class R shares of Transamerica High Yield Bond to the holders of the shares of Transamerica Partners High Yield Bond in complete redemption of their Transamerica Partners High Yield Bond shares, and (ii) the dissolution of Transamerica Partners High Yield Bond; |
| |
| PROPOSAL 3B: | | To approve an Agreement and Plan of Reorganization, providing for (i) Transamerica High Yield Bond’s acquisition of all of the assets of Transamerica Partners Institutional High Yield Bond, in exchange for Transamerica High Yield Bond’s assumption of all of the liabilities of Transamerica Partners Institutional High Yield Bond and Class R4 shares of Transamerica High Yield Bond, and the distribution of the Class R4 shares of Transamerica High Yield Bond to the holders of the shares of Transamerica Partners Institutional High Yield Bond in complete redemption of their Transamerica Partners Institutional High Yield Bond shares, and (ii) the dissolution of Transamerica Partners Institutional High Yield Bond; |
| |
| PROPOSAL 3C: | | To approve an Agreement and Plan of Reorganization, providing for (i) Transamerica High Yield Bond’s acquisition of all of the assets of Transamerica Partners High Yield Bond Portfolio, in exchange for Transamerica High Yield Bond’s assumption of all of the liabilities of Transamerica Partners High Yield Bond Portfolio and Class I3 shares of Transamerica High Yield Bond, and the distribution of the Class I3 shares of Transamerica High Yield Bond to the holders of the beneficial interests in Transamerica Partners High Yield Bond Portfolio in complete redemption of their Transamerica Partners High Yield Bond Portfolio beneficial interests, and (ii) the dissolution of Transamerica Partners High Yield Bond Portfolio; |
- 3 -
GROUP 4 - INTERNATIONAL EQUITY FUNDS
| | |
| PROPOSAL 4A: | | To approve an Agreement and Plan of Reorganization, providing for (i) Transamerica International Equity’s acquisition of all of the assets of Transamerica Partners International Equity, in exchange for Transamerica International Equity’s assumption of all of the liabilities of Transamerica Partners International Equity and Class R shares of Transamerica International Equity, and the distribution of the Class R shares of Transamerica International Equity to the holders of the shares of Transamerica Partners International Equity in complete redemption of their Transamerica Partners International Equity shares, and (ii) the dissolution of Transamerica Partners International Equity; |
| |
| PROPOSAL 4B: | | To approve an Agreement and Plan of Reorganization, providing for (i) Transamerica International Equity’s acquisition of all of the assets of Transamerica Partners Institutional International Equity, in exchange for Transamerica International Equity’s assumption of all of the liabilities of Transamerica Partners Institutional International Equity and Class R4 shares of Transamerica International Equity, and the distribution of the Class R4 shares of Transamerica International Equity to the holders of the shares of Transamerica Partners Institutional International Equity in complete redemption of their Transamerica Partners Institutional International Equity shares, and (ii) the dissolution of Transamerica Partners Institutional International Equity; |
| |
| PROPOSAL 4C: | | To approve an Agreement and Plan of Reorganization, providing for (i) Transamerica International Equity’s acquisition of all of the assets of Transamerica Partners International Equity Portfolio, in exchange for Transamerica International Equity’s assumption of all of the liabilities of Transamerica Partners International Equity Portfolio and Class I3 shares of Transamerica International Equity, and the distribution of the Class I3 shares of Transamerica International Equity to the holders of the beneficial interests in Transamerica Partners International Equity Portfolio in complete redemption of their Transamerica Partners International Equity Portfolio beneficial interests, and (ii) the dissolution of Transamerica Partners International Equity Portfolio; |
GROUP 5 - MID GROWTH FUNDS
| | |
| PROPOSAL 5A: | | To approve an Agreement and Plan of Reorganization, providing for (i) Transamerica Mid Cap Growth’s acquisition of all of the assets of Transamerica Partners Mid Growth, in exchange for Transamerica Mid Cap Growth’s assumption of all of the liabilities of Transamerica Partners Mid Growth and Class R shares of Transamerica Mid Cap Growth, and the distribution of the Class R shares of Transamerica Mid Cap Growth to the holders of the shares of Transamerica Partners Mid Growth in complete redemption of their Transamerica Partners Mid Growth shares, and (ii) the dissolution of Transamerica Partners Mid Growth; |
| |
| PROPOSAL 5B: | | To approve an Agreement and Plan of Reorganization, providing for (i) Transamerica Mid Cap Growth’s acquisition of all of the assets of Transamerica Partners Institutional Mid Growth, in exchange for Transamerica Mid Cap Growth’s assumption of all of the liabilities of Transamerica Partners Institutional Mid Growth and Class R4 shares of Transamerica Mid Cap Growth, and the distribution of the Class R4 shares of Transamerica Mid Cap Growth to the holders of the shares of Transamerica Partners Institutional Mid Growth in complete redemption of their Transamerica Partners Institutional Mid Growth shares, and (ii) the dissolution of Transamerica Partners Institutional Mid Growth; |
| |
| PROPOSAL 5C: | | To approve an Agreement and Plan of Reorganization, providing for (i) Transamerica Mid Cap Growth’s acquisition of all of the assets of Transamerica Partners Mid Growth Portfolio, in exchange for Transamerica Mid Cap Growth’s assumption of all of the liabilities of Transamerica Partners Mid Growth Portfolio and Class I3 shares of Transamerica Mid Cap Growth, and the distribution of the Class I3 shares of Transamerica Mid Cap Growth to the holders of the beneficial interests in Transamerica Partners Mid Growth Portfolio in complete redemption of their Transamerica Partners Mid Growth Portfolio beneficial interests, and (ii) the dissolution of Transamerica Partners Mid Growth Portfolio; |
- 4 -
GROUP 6 - MID VALUE FUNDS
| | |
| PROPOSAL 6A: | | To approve an Agreement and Plan of Reorganization, providing for (i) Transamerica Mid Cap Value Opportunities’ acquisition of all of the assets of Transamerica Partners Mid Value, in exchange for Transamerica Mid Cap Value Opportunities’ assumption of all of the liabilities of Transamerica Partners Mid Value and Class R shares of Transamerica Mid Cap Value Opportunities, and the distribution of the Class R shares of Transamerica Mid Cap Value Opportunities to the holders of the shares of Transamerica Partners Mid Value in complete redemption of their Transamerica Partners Mid Value shares, and (ii) the dissolution of Transamerica Partners Mid Value; |
| |
| PROPOSAL 6B: | | To approve an Agreement and Plan of Reorganization, providing for (i) Transamerica Mid Cap Value Opportunities’ acquisition of all of the assets of Transamerica Partners Institutional Mid Value, in exchange for Transamerica Mid Cap Value Opportunities’ assumption of all of the liabilities of Transamerica Partners Institutional Mid Value and Class R4 shares of Transamerica Mid Cap Value Opportunities, and the distribution of the Class R4 shares of Transamerica Mid Cap Value Opportunities to the holders of the shares of Transamerica Partners Institutional Mid Value in complete redemption of their Transamerica Partners Institutional Mid Value shares, and (ii) the dissolution of Transamerica Partners Institutional Mid Value; |
| |
| PROPOSAL 6C: | | To approve an Agreement and Plan of Reorganization, providing for (i) Transamerica Mid Cap Value Opportunities’ acquisition of all of the assets of Transamerica Partners Mid Value Portfolio, in exchange for Transamerica Mid Cap Value Opportunities’ assumption of all of the liabilities of Transamerica Partners Mid Value Portfolio and Class I3 shares of Transamerica Mid Cap Value Opportunities, and the distribution of the Class I3 shares of Transamerica Mid Cap Value Opportunities to the holders of the beneficial interests in Transamerica Partners Mid Value Portfolio in complete redemption of their Transamerica Partners Mid Value Portfolio beneficial interests, and (ii) the dissolution of Transamerica Partners Mid Value Portfolio; |
GROUP 7 - SMALL CORE FUNDS
| | |
| PROPOSAL 7A: | | To approve an Agreement and Plan of Reorganization, providing for (i) Transamerica Small Cap Core’s acquisition of all of the assets of Transamerica Partners Small Core, in exchange for Transamerica Small Cap Core’s assumption of all of the liabilities of Transamerica Partners Small Core and Class R shares of Transamerica Small Cap Core, and the distribution of the Class R shares of Transamerica Small Cap Core to the holders of the shares of Transamerica Partners Small Core in complete redemption of their Transamerica Partners Small Core shares, and (ii) the dissolution of Transamerica Partners Small Core; |
| |
| PROPOSAL 7B: | | To approve an Agreement and Plan of Reorganization, providing for (i) Transamerica Small Cap Core’s acquisition of all of the assets of Transamerica Partners Institutional Small Core, in exchange for Transamerica Small Cap Core’s assumption of all of the liabilities of Transamerica Partners Institutional Small Core and Class R4 shares of Transamerica Small Cap Core, and the distribution of the Class R4 shares of Transamerica Small Cap Core to the holders of the shares of Transamerica Partners Institutional Small Core in complete redemption of their Transamerica Partners Institutional Small Core shares, and (ii) the dissolution of Transamerica Partners Institutional Small Core; |
| |
| PROPOSAL 7C: | | To approve an Agreement and Plan of Reorganization, providing for (i) Transamerica Small Cap Core’s acquisition of all of the assets of Transamerica Partners Small Core Portfolio, in exchange for Transamerica Small Cap Core’s assumption of all of the liabilities of Transamerica Partners Small Core Portfolio and Class I3 shares of Transamerica Small Cap Core, and the distribution of the Class I3 shares of Transamerica Small Cap Core to the holders of the beneficial interests in Transamerica Partners Small Core Portfolio in complete redemption of their Transamerica Partners Small Core Portfolio beneficial interests, and (ii) the dissolution of Transamerica Partners Small Core Portfolio; |
- 5 -
GROUP 8 - SMALL GROWTH FUNDS
| | |
| PROPOSAL 8A: | | To approve an Agreement and Plan of Reorganization, providing for (i) Transamerica Small Cap Growth’s acquisition of all of the assets of Transamerica Partners Small Growth, in exchange for Transamerica Small Cap Growth’s assumption of all of the liabilities of Transamerica Partners Small Growth and Class R shares of Transamerica Small Cap Growth, and the distribution of the Class R shares of Transamerica Small Cap Growth to the holders of the shares of Transamerica Partners Small Growth in complete redemption of their Transamerica Partners Small Growth shares, and (ii) the dissolution of Transamerica Partners Small Growth; |
| |
| PROPOSAL 8B: | | To approve an Agreement and Plan of Reorganization, providing for (i) Transamerica Small Cap Growth’s acquisition of all of the assets of Transamerica Partners Institutional Small Growth, in exchange for Transamerica Small Cap Growth’s assumption of all of the liabilities of Transamerica Partners Institutional Small Growth and Class R4 shares of Transamerica Small Cap Growth, and the distribution of the Class R4 shares of Transamerica Small Cap Growth to the holders of the shares of Transamerica Partners Institutional Small Growth in complete redemption of their Transamerica Partners Institutional Small Growth shares, and (ii) the dissolution of Transamerica Partners Institutional Small Growth; |
| |
| PROPOSAL 8C: | | To approve an Agreement and Plan of Reorganization, providing for (i) Transamerica Small Cap Growth’s acquisition of all of the assets of Transamerica Partners Small Growth Portfolio, in exchange for Transamerica Small Cap Growth’s assumption of all of the liabilities of Transamerica Partners Small Growth Portfolio and Class I3 shares of Transamerica Small Cap Growth, and the distribution of the Class I3 shares of Transamerica Small Cap Growth to the holders of the beneficial interests in Transamerica Partners Small Growth Portfolio in complete redemption of their Transamerica Partners Small Growth Portfolio beneficial interests, and (ii) the dissolution of Transamerica Partners Small Growth Portfolio; |
GROUP 9 - SMALL VALUE FUNDS
| | |
| PROPOSAL 9A: | | To approve an Agreement and Plan of Reorganization, providing for (i) Transamerica Small Cap Value’s acquisition of all of the assets of Transamerica Partners Small Value, in exchange for Transamerica Small Cap Value’s assumption of all of the liabilities of Transamerica Partners Small Value and Class R shares of Transamerica Small Cap Value, and the distribution of the Class R shares of Transamerica Small Cap Value to the holders of the shares of Transamerica Partners Small Value in complete redemption of their Transamerica Partners Small Value shares, and (ii) the dissolution of Transamerica Partners Small Value; |
| |
| PROPOSAL 9B: | | To approve an Agreement and Plan of Reorganization, providing for (i) Transamerica Small Cap Value’s acquisition of all of the assets of Transamerica Partners Institutional Small Value, in exchange for Transamerica Small Cap Value’s assumption of all of the liabilities of Transamerica Partners Institutional Small Value and Class R4 shares of Transamerica Small Cap Value, and the distribution of the Class R4 shares of Transamerica Small Cap Value to the holders of the shares of Transamerica Partners Institutional Small Value in complete redemption of their Transamerica Partners Institutional Small Value shares, and (ii) the dissolution of Transamerica Partners Institutional Small Value; |
| |
| PROPOSAL 9C: | | To approve an Agreement and Plan of Reorganization, providing for (i) Transamerica Small Cap Value’s acquisition of all of the assets of Transamerica Partners Small Value Portfolio, in exchange for Transamerica Small Cap Value’s assumption of all of the liabilities of Transamerica Partners Small Value Portfolio and Class I3 shares of Transamerica Small Cap |
- 6 -
| | |
| |
| | Value, and the distribution of the Class I3 shares of Transamerica Small Cap Value to the holders of the beneficial interests in Transamerica Partners Small Value Portfolio in complete redemption of their Transamerica Partners Small Value Portfolio beneficial interests, and (ii) the dissolution of Transamerica Partners Small Value Portfolio; and |
| |
| PROPOSAL 10: | | To transact such other business as may properly come before the Special Meeting and any adjournments and postponements thereof. |
The Board of each fund recommends that holders vote “FOR” in favor of the fund’s reorganization.
Holders of record of the funds at the close of business on October 14, 2016 are entitled to vote at the Special Meeting and any adjournments or postponements thereof.
By Order of the Boards of Trustees,
Tané T. Tyler
Vice President, Associate General Counsel and Secretary
[ ], 2016
Your vote is very important regardless of the number of votes that you hold. Holders who do not expect to attend the Special Meeting are requested to complete, sign, date and return the accompanying proxy card in the enclosed envelope, which needs no postage if mailed in the United States. It is important that your proxy card be returned promptly. For your convenience, you may also authorize your proxy by telephone or via the internet by following the enclosed instructions. If you authorize your proxy by telephone or via the internet, please do not return your proxy card unless you elect to change your vote.
If holders do not return their proxies in sufficient numbers, the funds may be required to make additional solicitations.
Funds Holding Special Meetings on February 10, 2017
Transamerica Partners Funds Group
Transamerica Partners Core Bond
Transamerica Partners Government Money Market
Transamerica Partners High Yield Bond
Transamerica Partners International Equity
Transamerica Partners Mid Growth
Transamerica Partners Mid Value
Transamerica Partners Small Core
Transamerica Partners Small Growth
Transamerica Partners Small Value
Transamerica Partners Funds Group II
Transamerica Partners Institutional Core Bond
Transamerica Partners Institutional Government Money Market
Transamerica Partners Institutional High Yield Bond
Transamerica Partners Institutional International Equity
Transamerica Partners Institutional Mid Growth
Transamerica Partners Institutional Mid Value
Transamerica Partners Institutional Small Core
Transamerica Partners Institutional Small Growth
Transamerica Partners Institutional Small Value
- 7 -
Transamerica Partners Portfolios
Transamerica Partners Core Bond Portfolio
Transamerica Partners Government Money Market Portfolio
Transamerica Partners High Yield Bond Portfolio
Transamerica Partners International Equity Portfolio
Transamerica Partners Mid Growth Portfolio
Transamerica Partners Mid Value Portfolio
Transamerica Partners Small Core Portfolio
Transamerica Partners Small Growth Portfolio
Transamerica Partners Small Value Portfolio
- 8 -
COMBINED PROXY STATEMENT
OF
| | |
TRANSAMERICA PARTNERS FUNDS GROUP on behalf of its Series: TRANSAMERICA PARTNERS CORE BOND TRANSAMERICA PARTNERS GOVERNMENT MONEY MARKET TRANSAMERICA PARTNERS HIGH YIELD BOND TRANSAMERICA PARTNERS INTERNATIONAL EQUITY TRANSAMERICA PARTNERS MID GROWTH TRANSAMERICA PARTNERS MID VALUE TRANSAMERICA PARTNERS SMALL CORE TRANSAMERICA PARTNERS SMALL GROWTH TRANSAMERICA PARTNERS SMALL VALUE (referred to as “Investor Target Feeder Funds”) | | TRANSAMERICA PARTNERS FUNDS GROUP II on behalf of its Series TRANSAMERICA PARTNERS INSTITUTIONAL CORE BOND TRANSAMERICA PARTNERS INSTITUTIONAL GOVERNMENT MONEY MARKET TRANSAMERICA PARTNERS INSTITUTIONAL HIGH YIELD BOND TRANSAMERICA PARTNERS INSTITUTIONAL INTERNATIONAL EQUITY TRANSAMERICA PARTNERS INSTITUTIONAL MID GROWTH TRANSAMERICA PARTNERS INSTITUTIONAL MID VALUE TRANSAMERICA PARTNERS INSTITUTIONAL SMALL CORE TRANSAMERICA PARTNERS INSTITUTIONAL SMALL GROWTH TRANSAMERICA PARTNERS INSTITUTIONAL SMALL VALUE (referred to as “Institutional Target Feeder Funds”) |
AND
TRANSAMERICA PARTNERS PORTFOLIOS
on behalf of its Series:
TRANSAMERICA PARTNERS CORE BOND PORTFOLIO
TRANSAMERICA PARTNERS GOVERNMENT MONEY MARKET PORTFOLIO
TRANSAMERICA PARTNERS HIGH YIELD BOND PORTFOLIO
TRANSAMERICA PARTNERS INTERNATIONAL EQUITY PORTFOLIO
TRANSAMERICA PARTNERS MID GROWTH PORTFOLIO
TRANSAMERICA PARTNERS MID VALUE PORTFOLIO
TRANSAMERICA PARTNERS SMALL CORE PORTFOLIO
TRANSAMERICA PARTNERS SMALL GROWTH PORTFOLIO
TRANSAMERICA PARTNERS SMALL VALUE PORTFOLIO
(referred to as “Target Master Portfolios”)
(each, a “Target Fund” and together, the “Target Funds”)
AND
PROSPECTUS
OF
TRANSAMERICA FUNDS
on behalf of its Series:
TRANSAMERICA INTERMEDIATE BOND
TRANSAMERICA GOVERNMENT MONEY MARKET
TRANSAMERICA HIGH YIELD BOND
TRANSAMERICA INTERNATIONAL EQUITY
TRANSAMERICA MID CAP GROWTH
TRANSAMERICA MID CAP VALUE OPPORTUNITIES
TRANSAMERICA SMALL CAP CORE
TRANSAMERICA SMALL CAP GROWTH
TRANSAMERICA SMALL CAP VALUE
(each, a “Destination Fund” and together, the “Destination Funds”)
The address and telephone number of each fund is:
1801 California Street,
Suite 5200
Denver, Colorado 80202
(Toll free) 1-888-233-4339
Shares of the Destination Funds have not been approved or disapproved by the Securities and Exchange Commission (the “SEC”). The SEC has not passed upon the accuracy or adequacy of this Proxy Statement/Prospectus. Any representation to the contrary is a criminal offense.
- 9 -
An investment in any Target Fund or Destination Fund (each sometimes referred to herein as a “Fund”) is not a bank deposit and is not insured or guaranteed by the Federal Deposit Insurance Corporation or any other government agency.
This Proxy Statement/Prospectus sets forth information about the Destination Funds that an investor needs to know before investing. Please read this Proxy Statement/Prospectus carefully before investing and keep it for future reference.
- 10 -
TABLE OF CONTENTS
[TO BE INCLUDED IN SUBSEQUENT AMENDMENT.]
- 11 -
INTRODUCTION
This combined proxy statement/prospectus, dated [ ], 2016 (this “Proxy Statement/Prospectus”), is being furnished to holders of the Target Funds in connection with the solicitation by the Board of Trustees (each, a “Board”) of each Target Fund of proxies to be used at a Special Meeting of Holders of each Target Fund (for each Target Fund, a “Special Meeting”) to be held at [the offices of Transamerica Asset Management, Inc. (“TAM”), 1801 California Street, Suite 5200, Denver, Colorado 80202], on February 10, 2017 at [10:00 a.m.], Mountain Time. This Proxy Statement/Prospectus is being mailed to holders of the Target Funds on or about [ ], 2016.
Each Target Fund is a series of the trust noted on the cover page. Transamerica Partners Funds Group (“TPFG”) and Transamerica Partners Funds Group II (“TPFG II”) are each organized as a Massachusetts business trust. Transamerica Partners Portfolios is a trust governed by New York law (“TPP”). For purposes of this Proxy Statement/Prospectus, each of TPFG, TPFG II and TPP is sometimes referred to as a “Target Trust.” Each Target Trust is an open-end management investment company. Each Destination Fund is a series of Transamerica Funds, an open-end management investment company organized as a Delaware statutory trust (the “Destination Trust”).
The Target Funds operate in a master-feeder structure. Those Target Funds which are series of TPFG (Investors Target Feeder Funds) and TPFG II (Institutional Target Feeder Funds) (collectively, the “Target Feeder Funds”) invest in securities through underlying Target Master Portfolios. The underlying Target Master Portfolios are series of TPP. Beneficial interests of each Target Master Portfolio are also held by insurance company separate account feeder funds and collective investment trust feeder funds (collectively, the “Non-Mutual Fund Feeder Funds”). The reorganizations described herein involve each Target Master Portfolio and its Target Feeder Funds reorganizing into a Destination Fund. The Non-Mutual Fund Feeder Funds would remain in place and hold shares of the applicable Destination Fund following the reorganizations.
This Proxy Statement/Prospectus contains information you should know before voting on the applicable Agreement and Plan of Reorganization (each, a “Plan”) that provide for the reorganization of your Target Fund into a corresponding Destination Fund (each, a “Reorganization”). A copy of the form of Plan is attached to this Proxy Statement/Prospectus as Exhibit A.
The proposals contained in this Proxy Statement/Prospectus are grouped such that proposals for a Target Master Portfolio and its Target Feeder Funds are discussed together. Assuming requisite holder approval, a Target Master Portfolio and its Target Feeder Funds would reorganize into the corresponding Destination Fund on the same closing date.
It is possible that your Target Fund may approve its Reorganization but the Reorganization of another Target Fund in its Reorganization grouping does not receive the requisite approval. In such a case, while the consummation of one Reorganization is not contingent on the consummation of any other Reorganization, the Board of your Target Fund would evaluate whether to consummate the Reorganization or take other steps.
You are entitled to vote at the Special Meeting of each Target Fund of which you are a holder as of the close of business on October 14, 2016 (the “Record Date”). You may be receiving these materials if you are a holder of a Non-Mutual Fund Feeder Fund that invests in a Target Master Portfolio and for which you are entitled to provide voting instructions with respect to that Target Master Portfolio. For purposes of convenience in this Proxy Statement/Prospectus, shareholders and interest holders are sometimes referred to as “holders” and the shares and beneficial interests they hold in the Target Funds are sometimes referred to as “shares.”
When a Target Feeder Fund holder votes with respect to a Reorganization proposal, that vote will also constitute instructions for the Target Feeder Fund to vote in the same manner on the corresponding Reorganization proposal for the Target Master Portfolio in which it invests. Please note that, as the Target Master Portfolios have holders besides the Target Feeder Funds, it is possible that the Reorganization of a Target Master Portfolio may not be approved by the Target Master Portfolio, even if it is approved by the corresponding Target Feeder Fund holders. It is also possible that the Reorganization of a Target Master Portfolio may be approved by the Target Master Portfolio, even if it is not approved by the corresponding Target Feeder Fund holders. For many of the Target Master Portfolios, the Target Feeder Funds represent a significant portion of the Target Master Portfolio’s assets. As a result, in voting on the proposed Reorganization of a Target Master Portfolio, the Non-Mutual Fund Feeder Funds may be outvoted by the Target Feeder Funds.
- 12 -
The following table indicates (a) which proposal relates to which Target Fund, (b) the Destination Fund that corresponds to each Target Fund, (c) the class of shares of the corresponding Destination Fund that holders of shares in each Target Fund would receive if the Plan relating to such Target Fund is approved, and (d) the page of this Proxy Statement/Prospectus on which the discussion regarding each group of proposals begins. The Target Funds do not have share classes. The proposals are grouped, numbered and lettered for convenience.
| | | | | | | | |
Group | | Proposal | | Target Fund | | Destination Fund and Shares | | Page |
| Group 1 | | | | | | | | [ ] |
| | Proposal 1A | | Transamerica Partners Core Bond | | Transamerica Intermediate Bond
Class R | | |
| | Proposal 1B | | Transamerica Partners Institutional Core Bond | | Transamerica Intermediate Bond
Class R4 | | |
| | Proposal 1C | | Transamerica Partners Core Bond Portfolio | | Transamerica Intermediate Bond
Class I3 | | |
| Group 2 | | | | | | | | [ ] |
| | Proposal 2A | | Transamerica Partners Government Money Market | | Transamerica Government Money Market
Class R | | |
| | Proposal 2B | | Transamerica Partners Institutional Government Money Market | | Transamerica Government Money Market
Class R4 | | |
| | Proposal 2C | | Transamerica Partners Government Money Market Portfolio | | Transamerica Government Money Market
Class I3 | | |
| Group 3 | | | | | | | | [ ] |
| | Proposal 3A | | Transamerica Partners High Yield Bond | | Transamerica High Yield Bond
Class R | | |
| | Proposal 3B | | Transamerica Partners Institutional High Yield Bond | | Transamerica High Yield Bond
Class R4 | | |
| | Proposal 3C | | Transamerica Partners High Yield Bond Portfolio | | Transamerica High Yield Bond
Class I3 | | |
| Group 4 | | | | | | | | [ ] |
| | Proposal 4A | | Transamerica Partners International Equity | | Transamerica International Equity
Class R | | |
| | Proposal 4B | | Transamerica Partners Institutional International Equity | | Transamerica International Equity
Class R4 | | |
| | Proposal 4C | | Transamerica Partners International Equity Portfolio | | Transamerica International Equity
Class I3 | | |
| Group 5 | | | | | | | | [ ] |
| | Proposal 5A | | Transamerica Partners Mid Growth | | Transamerica Mid Cap Growth
Class R | | |
| | Proposal 5B | | Transamerica Partners Institutional Mid Growth | | Transamerica Mid Cap Growth
Class R4 | | |
| | Proposal 5C | | Transamerica Partners Mid Growth Portfolio | | Transamerica Mid Cap Growth
Class I3 | | |
| Group 6 | | | | | | | | [ ] |
| | Proposal 6A | | Transamerica Partners Mid Value | | Transamerica Mid Cap Value Opportunities
Class R | | |
| | Proposal 6B | | Transamerica Partners Institutional Mid Value | | Transamerica Mid Cap Value Opportunities
Class R4 | | |
| | Proposal 6C | | Transamerica Partners Mid Value Portfolio | | Transamerica Mid Cap Value Opportunities
Class I3 | | |
| Group 7 | | | | | | | | [ ] |
| | Proposal 7A | | Transamerica Partners Small Core | | Transamerica Small Cap Core
Class R | | |
| | Proposal 7B | | Transamerica Partners Institutional Small Core | | Transamerica Small Cap Core
Class R4 | | |
| | Proposal 7C | | Transamerica Partners Small Core Portfolio | | Transamerica Small Cap Core
Class I3 | | |
| Group 8 | | | | | | | | [ ] |
| | Proposal 8A | | Transamerica Partners Small Growth | | Transamerica Small Cap Growth
Class R | | |
| | Proposal 8B | | Transamerica Partners Institutional Small Growth | | Transamerica Small Cap Growth
Class R4 | | |
| | Proposal 8C | | Transamerica Partners Small Growth Portfolio | | Transamerica Small Cap Growth
Class I3 | | |
- 13 -
| | | | | | | | |
| Group 9 | | | | | | | | [ ] |
| | Proposal 9A | | Transamerica Partners Small Value | | Transamerica Small Cap Value
Class R | | |
| | Proposal 9B | | Transamerica Partners Institutional Small Value | | Transamerica Small Cap Value
Class R4 | | |
| | Proposal 9C | | Transamerica Partners Small Value Portfolio | | Transamerica Small Cap Value
Class I3 | | |
Please read this Proxy Statement/Prospectus, including Exhibit A, carefully. Although each Reorganization is similar in structure, you should read carefully the specific discussion regarding your Target Fund’s Reorganization.
The date of this Proxy Statement/Prospectus is [ ], 2016.
For more complete information about each Fund, please read the Fund’s summary prospectus, prospectus and statement of additional information (or Part A and Part B with respect to a Target Master Portfolio), as they may be amended and/or supplemented. Each Fund’s summary prospectus, prospectus and statement of additional information (or Part A and Part B), and other additional information about each Fund, has been filed with the SEC (http://www.sec.gov) and is available upon request and without charge by calling the toll-free numbers shown below.
| | |
| Where to get More Information |
| |
| Each Fund’s current summary prospectus, prospectus and statement of additional information (or Part A and Part B), including any applicable supplements thereto. | | On file with the SEC (http://www.sec.gov) and available at no charge by calling the Funds’ toll-free number: 1-888-233-4339 or by visiting the Target Funds’ website at http://www.transamericapartners.com/content/prospectus.aspx and the Destination Funds’ website at https://www.transamerica.com/individual/products/mutual-funds/prospectus/. |
| |
| Each Fund’s most recent annual and semi-annual reports to shareholders. | | On file with the SEC (http://www.sec.gov) and available at no charge by calling the Funds’ toll-free number: 1-888-233-4339 or by visiting the Target Funds’ website at http://www.transamericapartners.com/content/prospectus.aspx and the Destination Funds’ website at https://www.transamerica.com/individual/products/mutual-funds/prospectus/. See “Available Information.” |
| |
| A statement of additional information for this Proxy Statement/Prospectus, dated [ ], 2016 (the “SAI”). The SAI contains additional information about the Target Funds and the Destination Funds. | | On file with the SEC (http://www.sec.gov) and available at no charge by calling the Funds’ toll-free number: 1-888-233-4339 or by visiting the Target Funds’ website at http://www.transamericapartners.com/content/prospectus.aspx and the Destination Funds’ website at https://www.transamerica.com/individual/products/mutual-funds/prospectus/. The SAI is incorporated by reference into this Proxy Statement/Prospectus. |
| |
| To ask questions about this Proxy Statement/Prospectus. | | Call the following toll-free telephone number: 1-888-233-4339. |
Beneficial interests in the Target Master Portfolios are not registered under the Securities Act of 1933, as amended (the “1933 Act”), and are issued solely in private placement transactions that do not involve any “public offering” within the meaning of Section 4(2) of the 1933 Act. Only investment companies, insurance company separate accounts, common or commingled trust funds or similar organizations or entities that are “accredited investors” within the meaning of Regulation D under the 1933 Act may make investments in the Target Master Portfolios. This Proxy Statement/Prospectus is not an offer to sell, or the solicitation of an offer to buy, any beneficial interests in the Portfolios.
- 14 -
Each Target Fund’s prospectus and statement of additional information (or Part A and Part B), each dated May 1, 2016, as supplemented, are incorporated by reference into this Proxy Statement/Prospectus.
SUMMARY
This Summary section is qualified in its entirety by reference to the additional information contained elsewhere in this Proxy Statement/Prospectus and the Plan relating to each Reorganization. Holders should read the entire Proxy Statement/Prospectus, including Exhibit A, carefully.
Why are the Reorganizations being proposed?
The proposed Reorganizations are part of an initiative designed to streamline the Transamerica fund family and to promote operating efficiencies. The Reorganizations would combine the Transamerica Partners funds into Transamerica Funds, a larger and growing fund complex. The initiative would also eliminate certain redundancies in product offerings as, in a number of instances, funds in both groups overlap. If approved, the Reorganizations would ultimately result in the elimination of the Transamerica Partners funds.
Your Target Fund is part of the Transamerica Partners funds. The Transamerica Partners funds were initially established primarily for retirement and benefit plan investors. A separate group of mutual funds managed by TAM, branded Transamerica Funds, are offered more broadly. In a number of instances, funds in both groups overlap. The Transamerica Partners funds have been experiencing net outflows for a number of years. These outflows have resulted in certain diseconomies, including fixed costs representing an increasing percentage of a smaller asset base and the funds losing the benefit of previously attained fee breakpoints. The Target Funds appear to have limited distribution opportunities and prospects for future asset growth. In addition, the Target Funds’ current contractual expense limitations expire on May 1, 2017, and TAM does not currently expect to maintain the expense limitations for many of the Target Funds at their current levels beyond May 1, 2017 should the Reorganizations not occur. On the other hand, Transamerica Funds is growing, with net assets of approximately $19.9 billion as of June 30, 2016. TAM believes that investors could benefit from the fund groups being combined.
It is proposed that each Target Fund reorganize into an existing Destination Fund in Transamerica Funds. Transamerica Funds offers increased distribution capabilities and greater potential for asset growth and efficiencies, including the potential for lower expense ratios. The larger asset bases resulting from the Reorganizations are expected to give each reorganized Destination Fund the ability to better diversify its holdings and effect larger portfolio transactions while also spreading fixed costs across a larger asset base.
Each Target Fund would reorganize into a Destination Fund with the same or compatible investment objectives and strategies. With one exception, each Target Feeder Fund and its related Target Master Portfolio would reorganize into a Destination Fund with the same sub-adviser(s) as the applicable Target Master Portfolio.1 While the fees of the Target Funds and Destination Funds may differ in structure and amount, it is currently expected that the total expenses for the Target Funds would in most cases be lower or stay the same following the Reorganizations. In a limited number of cases, the total expenses of certain Target Master Portfolios are estimated to increase, but those expenses are expected to remain at the current expense limitations of those Target Master Portfolios.
How will the Reorganizations work?
| | • | | On the applicable closing date, each Target Fund will transfer all of its property and assets to the corresponding Destination Fund. In exchange, the applicable Destination Fund will assume all of the liabilities of the applicable Target Fund and issue shares to that Target Fund, as described below. |
| 1 | The Transamerica Partners Mid Value Portfolio, a Target Master Portfolio, is sub-advised by Thompson, Siegel and Walmsley LLC (“TS&W”) and J.P. Morgan Investment Management Inc. Transamerica Mid Cap Value Opportunities, the corresponding Destination Fund, is sub-advised only by TS&W. |
- 15 -
| | • | | In each Reorganization, the applicable Destination Fund will issue shares of the applicable class to the applicable Target Fund with an aggregate net asset value equal to the aggregate net asset value of the Target Feeder Fund’s shares (or beneficial interests in the case of the Target Master Portfolios). Holders of shares of Investor Target Feeder Funds will receive Class R shares. Holders of shares of Institutional Target Feeder Funds will receive Class R4 shares. Holders of beneficial interests in the Target Master Portfolios will receive Class I3 shares. |
| | • | | Shares of the applicable class of the applicable Destination Fund will then be distributed by the applicable Target Fund to holders of shares (or beneficial interests) in the Target Fund on a pro rata basis in complete redemption of the holders’ shares (or beneficial interests) and in complete liquidation of the Target Fund. Therefore, on the closing date, upon completion of the applicable Reorganization, each holder of shares (or beneficial interests) in the applicable Target Fund will hold shares of the applicable class of the corresponding Destination Fund with an aggregate net asset value equal to the aggregate net asset value of the holder’s shares (or beneficial interests) in the applicable Target Fund immediately prior to the Reorganization. The net asset value attributable to each Target Fund will be determined using the Target Fund’s valuation policies and procedures, and the net asset value attributable to a class of shares of each Destination Fund will be determined using the Destination Fund’s valuation policies and procedures. The portfolio assets of each Target Fund and corresponding Destination Fund are valued using the same valuation policies and procedures. |
| | • | | For each Reorganization grouping, the Target Master Portfolio and the Target Feeder Funds that invest in the Target Master Portfolio will reorganize into the corresponding Destination Fund on the same closing date. In terms of mechanics, prior to the applicable Reorganization, each Target Feeder Fund will redeem its interest in the applicable Target Master Portfolio in kind, subject to its pro rata share of liabilities, and then complete its Reorganization into the applicable Destination Fund. The Reorganizations of the Target Feeder Funds will occur prior to the Reorganization of the relevant Target Master Portfolio. Following completion of the Reorganizations of the Target Feeder Funds, the related Target Master Portfolio will complete its Reorganization with the applicable Destination Fund. At the time of each Target Master Portfolio Reorganization, the applicable Non-Mutual Fund Feeder Funds will be the only holders of the Target Master Portfolio. |
| | • | | Each Target Fund will be terminated after the consummation of its Reorganization. |
| | • | | No sales load, contingent deferred sales charge, commission, redemption fee or other transactional fee will be charged as a result of the Reorganizations. |
| | • | | Following the Reorganizations, TAM will continue to act as investment manager to each Destination Fund and the relevant sub-advisers will continue to serve as sub-advisers to the Destination Funds. |
What are the federal income tax consequences of the Reorganizations?
For each Reorganization involving a Target Feeder Fund, for federal income tax purposes, no gain or loss is expected to be recognized by holders or, generally, the Target Feeder Fund as a result of the Reorganization.
The Reorganization of each Target Master Portfolio may be a taxable transaction. The exchange of each Target Master Portfolio’s assets for the applicable class of shares of the corresponding Destination Fund and the Destination Fund’s assumption of the Target Master Portfolio’s liabilities is expected, in most cases, to be a taxable exchange for federal income tax purposes, in which the Target Master Portfolio will recognize gains and losses. In such a case, holders of beneficial interests in the applicable Target Master Portfolio will be required to take into account their allocable shares of the gains and losses recognized by the Target Master Portfolio. Holders of beneficial interests in a Target Master Portfolio may also recognize gain or loss in connection with the applicable Destination Fund’s assumption of the Target Master Portfolio’s liabilities or the distribution of the applicable
- 16 -
Destination Fund’s shares in liquidation of the Target Master Portfolio. As noted above, the only holders of the Target Master Portfolios at the time of the Reorganization of the Target Master Portfolio will be the applicable Non-Mutual Fund Feeder Funds. For more information, please see “Information about the Proposed Reorganizations — Certain Federal Income Tax Consequences,” below.
Who bears the expenses associated with the Reorganizations?
The costs of the Reorganizations will be shared equally by TAM, on the one hand, and, subject to certain limits, the Target Funds and Destination Funds (and ultimately holders of the Target Funds and Destination Funds) on the other. Costs will be allocated among the Target Funds and Destination Funds based on, among other factors, the expected benefits of the Reorganization to each Target Fund.
Why did the Boards approve the Reorganizations?
The Board of your Target Fund, including all of the Trustees who are not “interested” persons (as defined in the Investment Company Act of 1940, as amended (the “1940 Act”)) of the Funds, TAM or Transamerica Capital, Inc. (“TCI”), the Funds’ distributor (the “Independent Trustees”), after careful consideration, has determined that the Reorganization is in the best interest of your Target Fund and will not dilute the interests of the existing holders of your Target Fund. The Board has made this determination based on various factors, which include those that are discussed in this Proxy Statement/Prospectus under the discussion of each Reorganization in the section entitled “Reasons for the Proposed Reorganization.”
Similarly, the Board of each corresponding Destination Fund, including all of the Independent Trustees, has approved the Reorganization with respect to the Destination Fund. The Board has determined that the Reorganization is in the best interest of each Destination Fund and that the interests of the Destination Fund’s shareholders will not be diluted as a result of the Reorganization.
What happens if a Reorganization is not approved?
If the required holder approval of your Target Fund is not obtained, the Special Meeting may be adjourned as more fully described in this Proxy Statement/Prospectus. If your Target Fund’s Reorganization is not approved, you will remain a holder of your Target Fund, and the Board of your Target Fund will consider what further action may be appropriate.
It is possible that your Target Fund may approve its Reorganization but the Reorganization of another Target Fund in its Reorganization grouping does not receive the requisite approval. In such a case, while the consummation of one Reorganization is not contingent on the consummation of any other Reorganization, the Board of your Target Fund would evaluate whether to consummate the Reorganization or take other steps.
Please also note that, as the Target Master Portfolios have holders besides the Target Feeder Funds, it is possible that the Reorganization of a Target Master Portfolio may not be approved by the Target Master Portfolio, even if it is approved by Target Feeder Fund holders. It is also possible that the Reorganization of a Target Master Portfolio may be approved by the Target Master Portfolio, even if it is not approved by Target Feeder Fund holders.
Who is eligible to vote?
Holders of record of a Target Fund at the close of business on the Record Date are entitled to be present and to vote at the Special Meeting of the Target Fund or any adjournment or postponement thereof. Shares represented by properly executed proxies, unless revoked before or at the Special Meeting, will be voted according to holders’ instructions. If you sign a proxy but do not fill in a vote, your shares will not be voted to approve the applicable Plan. If any other business comes before the Special Meeting, your shares will be voted at the discretion of the persons named as proxies.
- 17 -
How do I vote my shares?
You can provide voting instructions by telephone by calling the toll-free number on the enclosed proxy card by going to internet address providing on the proxy card and following the instructions. Alternatively, you can vote your shares by signing and dating the enclosed proxy card, and mailing it in the enclosed postage-paid envelope.
You can also attend the Special Meeting in person. However, even if you intend to do so, we encourage you to provide voting instructions by one of the methods described above.
It is important that you vote promptly.
- 18 -
GROUP 1 - CORE BOND FUNDS
TRANSAMERICA PARTNERS CORE BOND
TRANSAMERICA PARTNERS INSTITUTIONAL CORE BOND
TRANSAMERICA PARTNERS CORE BOND PORTFOLIO
(each, a “Target Fund” and together, the “Target Funds”)
AND
TRANSAMERICA INTERMEDIATE BOND
(the “Destination Fund”)
PROPOSALS 1A, 1B AND 1C
APPROVAL OF AGREEMENT AND PLAN OF REORGANIZATION
SUMMARY
The following is a summary of more complete information appearing later in this Proxy Statement/Prospectus or incorporated herein. You should read carefully the entire Proxy Statement/Prospectus, including the form of Plan attached as Exhibit A, which includes additional information that is not included in the summary and is a part of this Proxy Statement/Prospectus. For a discussion of the terms of the Plan, please see the section entitled “Terms of Each Agreement and Plan of Reorganization” in the back of this Proxy Statement/Prospectus, after the discussion of the proposals.
In each proposed Reorganization, the Target Fund would be reorganized into the Destination Fund, with that Target Fund receiving shares of the applicable class of the Destination Fund as shown in the following table. The Target Funds, which operate in a master-feeder structure, do not have share classes.
| | | | |
Proposal | | Target Fund | | Destination Fund and Shares |
| | |
| Proposal 1A | | Transamerica Partners Core Bond | | Transamerica Intermediate Bond Class R |
| | |
| Proposal 1B | | Transamerica Partners Institutional Core Bond | | Transamerica Intermediate Bond Class R4 |
| | |
| Proposal 1C | | Transamerica Partners Core Bond Portfolio | | Transamerica Intermediate Bond Class I3 |
Transamerica Partners Core Bond would reorganize first, Transamerica Partners Institutional Core Bond would reorganize next and Transamerica Partners Core Bond Portfolio would reorganize last. All Reorganizations would occur on the same closing date.
The Target Funds and the Destination Fund are managed by Transamerica Asset Management, Inc. (“TAM”) and have the same investment objective and principal investment strategies and substantially similar related risks. The tables below provide a comparison of certain features of the Funds. Unless otherwise noted, the information is the same for each Target Fund. In the tables below, if a row extends across the entire table, the information applies to the Destination Fund and the Target Funds.
Comparison of Target Funds and Destination Fund
| | | | |
| | | Target Funds | | Destination Fund |
| Investment objective | | Seeks to achieve maximum total return. |
| |
| Principal investment strategies1 | | Under normal circumstances, the fund invests primarily in investment grade debt securities, which may include: investment grade corporate securities, U.S. government obligations, mortgage-backed securities guaranteed by U.S. government agencies and instrumentalities, and private residential mortgage-backed securities. Under normal circumstances, the fund invests at least 80% of its net assets (plus the amount of borrowings, if any, for investment purposes) in fixed income securities. The fund’s portfolio weighted average duration will |
- 19 -
| | |
| | typically range from 3 to 10 years. The fund may also invest in U.S. Treasury and agency securities, municipal bonds, asset-backed securities (including collateralized loan obligations (“CLO”s), collateralized bond obligations (“CBO”s) and collateralized debt obligations (“CDO”s)), commercial mortgage-backed securities (“CMBS”), high quality short-term debt obligations and repurchase agreements. The fund’s investments may include debt securities of foreign issuers, including emerging market debt securities. The fund may invest in securities that are denominated in U.S. dollars and in foreign currencies. The fund may invest up to 10% of its net assets in emerging market debt securities and up to 10% of its net assets in high-yield debt securities (commonly referred to as “junk” bonds), but may invest no more than 15% of its net assets in emerging market debt securities and high-yield debt securities combined. Investment grade debt securities carry a rating of at least BBB from Standard & Poor’s or Fitch or Baa from Moody’s or are of comparable quality as determined by the fund’s sub-adviser. In managing the fund’s assets, the sub-adviser uses a combination of a global “top down” analysis of the macroeconomic and interest rate environment and proprietary “bottom up” research of corporate and government debt, and other debt instruments. In the sub-adviser’s qualitative “top down” approach, the sub-adviser analyzes various fundamental, technical, sentiment and valuation factors that affect the movement of markets and securities prices worldwide. In its proprietary “bottom up” research, the sub-adviser considers various fundamental and other factors, such as creditworthiness, capital structure, covenants, cash flows and, as applicable, collateral. The sub-adviser uses this combined approach to determine sector, security, yield curve positioning, and duration positions for the fund. The fund may, but is not required to, engage in certain investment strategies involving derivatives, such as options, futures, forward currency contracts and swaps, including, but not limited to, interest rate, total return and credit default swaps. These investment strategies may be employed as a hedging technique, as a means of altering investment characteristics of the fund’s portfolio (such as shortening or lengthening duration), in an attempt to enhance returns or for other purposes. The fund may purchase securities on a when-issued, delayed delivery or forward commitment basis. |
| |
| Investment manager | | TAM |
| |
| Sub-adviser | | Aegon USA Investment Management, LLC |
| |
| Portfolio managers | | Brian W. Westhoff, CFA: Portfolio Manager of the Funds since 2014; Portfolio Manager with Aegon USA Investment Management, LLC since 2011; Portfolio Manager with Transamerica Investment Management, LLC from 2005 – 2011 Doug Weih, CFA: Portfolio Manager of the Funds since 2014; Portfolio Manager with Aegon USA Investment Management, LLC since 2003; Director of Public Securitized Bonds since 2009 Matthew Q. Buchanan, CFA: Portfolio Manager of the Funds since 2015; Portfolio Manager with Aegon USA Investment Management, LLC since 2012; Co-Head of Investment Grade Credit; Bond Trader, Logan Circle Partners 2007-2012 Bradley D. Doyle, CFA: Portfolio Manager of the Funds since 2015; Portfolio Manager with Aegon USA Investment Management, LLC since 2004; Co-Head of Investment Grade Credit Tyler A. Knight, CFA: Portfolio Manager of the Funds since 2015; Portfolio Manager with Aegon USA Investment Management, LLC since 2008 |
- 20 -
| | | | |
| Business | | Transamerica Partners Core Bond is a diversified series of TPFG, an open-end management investment company organized as a Massachusetts business trust. Transamerica Partners Institutional Core Bond is a diversified series of TPFG II, an open-end management investment company organized as a Massachusetts business trust. Transamerica Partners Core Bond Portfolio is a diversified series of TPP, an open-end management investment company and a trust governed by New York law. | | The Destination Fund is a diversified series of the Destination Trust, an open-end management investment company organized as a Delaware statutory trust. |
| | |
| Net assets (as of June 30, 2016) | | Transamerica Partners Core Bond = $381,773,422 Transamerica Partners Institutional Core Bond = $373,802,374 Transamerica Partners Core Bond Portfolio (excluding the Target Feeder Funds) = $1,255,792,456 | | $1,272,057,362 |
| | |
| Management fees | | TAM receives compensation for investment advisory services from the Target Funds at an annual rate of 0.35%. TAM also receives compensation for administrative services from Transamerica Partners Core Bond and Transamerica Partners Institutional Core Bond at annual rates of 0.30% and 0.05%, respectively. Transamerica Partners Core Bond Portfolio pays no separate administrative services fees. The applicable fee(s) are based upon average daily net assets and are accrued daily and paid monthly. | | TAM receives compensation for investment management services, which include investment advisory and administrative services, from the Destination Fund at annual rates of 0.38% of the first $2 billion; and 0.365% in excess of $2 billion. The fee is based upon average daily net assets and is accrued daily and paid monthly. |
| | |
| Distribution and service (12b-1) fees | | Transamerica Partners Core Bond is subject to a distribution and service (12b-1) fee of up to 0.25% of average daily net assets. Transamerica Partners Institutional Core Bond is subject to a distribution and service (12b-1) fee of up to 0.25% of average daily net assets. Transamerica Partners Core Bond Portfolio is not subject to a distribution and service (12b-1) fee. | | Class R shares of the Destination Fund are subject to a distribution and service (12b-1) fee of up to 0.50% of average daily net assets. Class R4 shares of the Destination Fund are subject to a distribution and service (12b-1) fee of up to 0.25% of average daily net assets. Class I3 shares of the Destination Fund are not subject to a distribution and service (12b-1) fee. |
| | |
| Sales charges | | Shares of the Target Funds are offered without a sales charge and are not subject to a contingent deferred sales charge. | | Class R, Class R4, and Class I3 shares of the Destination Fund are offered without a sales charge and are not subject to a contingent deferred sales charge. |
- 21 -
| | | | |
| Fee waiver and expense reimbursement | | Contractual arrangements have been made with TAM through May 1, 2017 to waive fees and/or reimburse fund expenses to the extent that the total operating expenses exceed: • 1.00% for Transamerica Partners Core Bond; and • 0.65% for Transamerica Partners Institutional Core Bond. The expense limitation excludes, as applicable, acquired fund fees and expenses, interest, taxes, brokerage commissions, dividend and interest expenses on securities sold short, extraordinary expenses and other expenses not incurred in the ordinary course of the fund’s business. These arrangements cannot be terminated prior to May 1, 2017 without the Board of Trustees’ consent. TAM has agreed to waive fees and reimburse expenses to limit the total operating expenses of Transamerica Partners Core Bond Portfolio to 0.40%. This arrangement is voluntary and may be terminated by TAM at any time. | | Contractual arrangements have been made with TAM through May 1, 2018 to waive fees and/or reimburse fund expenses to the extent that the Destination Fund’s total operating expenses exceed: • 1.00% for Class R shares; • 0.65% for Class R4 shares; and • 0.40% for Class I3 shares. The expense limitation excludes, as applicable, acquired fund fees and expenses, interest, taxes, brokerage commissions, dividend and interest expenses on securities sold short, extraordinary expenses and other expenses not incurred in the ordinary course of the fund’s business. These arrangements cannot be terminated prior to May 1, 2018 without the Board of Trustees’ consent. TAM is entitled to reimbursement by the Destination Fund of fees waived or expenses reduced during any of the previous 36 months if on any day or month the estimated annualized fund operating expenses are less than the cap. |
| |
| Gross and net expenses | | For a comparison of the gross and net expenses of the Funds, please see the class fee tables in the “The Funds’ Fees and Expenses” section. |
| 1 | Transamerica Partners Core Bond and Transamerica Partners Institutional Core Bond are feeder funds and invest in securities through Transamerica Partners Core Bond Portfolio, an underlying master fund having the same investment goals and strategies. |
Comparison of Principal Risks of Investing in the Funds
Because the Funds have the same investment objective and principal investment strategies, they are subject to substantially similar principal risks. Risk is inherent in all investing. The value of your investment in a Fund, as well as the amount of return you receive on your investment, may fluctuate significantly from day to day and over time. You may lose part or all of your investment in a Fund or your investment may not perform as well as other similar investments.
Each Fund is subject to the following principal risks (in alphabetical order) of investing in the Fund:
Active Trading – The fund is actively managed and may purchase and sell securities without regard to the length of time held. Active trading may have a negative impact on performance by increasing transaction costs and may generate greater amounts of net short-term capital gains, which, for shareholders holding shares in taxable accounts, would generally be subject to tax at ordinary income tax rates upon distribution.
Counterparty – The fund will be subject to credit risk (meaning the risk of adverse changes in an issuer’s real or perceived financial strength) with respect to counterparties to derivatives, repurchase agreements and other financial contracts entered into by the fund or held by special purpose or structured vehicles. Adverse changes to counterparties may cause the value of financial contracts to go down. If a counterparty becomes bankrupt or otherwise fails to perform its obligations due to financial difficulties, the value of your investment in the fund may decline.
Credit – If an issuer or other obligor (such as a party providing insurance or other credit enhancement) of a security held by the fund or a counterparty to a financial contract with the fund defaults or is downgraded, or is perceived to be less creditworthy, or if the value of any underlying assets declines, the value of your investment will typically decline. Below investment grade, high-yield debt securities (commonly known as “junk” bonds) have a higher risk of default and are considered speculative. Subordinated securities are more likely to suffer a credit loss than non-subordinated securities of the same issuer and will be disproportionately affected by a default, downgrade or perceived decline in creditworthiness.
- 22 -
Currency – The value of investments in securities denominated in foreign currencies increases or decreases as the rates of exchange between those currencies and the U.S. dollar change. Currency conversion costs and currency fluctuations could reduce or eliminate investment gains or add to investment losses. Currency exchange rates can be volatile, and are affected by factors such as general economic conditions, the actions of the U.S. and foreign governments or central banks, the imposition of currency controls, and speculation.
Currency Hedging – The fund may hedge its currency risk using currency futures, forwards or options. However, these instruments may not always work as intended, and a fund may be worse off than if it had not used a hedging instrument.
Derivatives – Using derivatives exposes the fund to additional risks and can increase fund losses and reduce opportunities for gains when market prices, interest rates, currencies, or the derivatives themselves, behave in a way not anticipated by the fund. Using derivatives also can have a leveraging effect and increase fund volatility. Certain derivatives have the potential for unlimited loss, regardless of the size of the initial investment. Derivatives may be difficult to sell, unwind or value, and the counterparty may default on its obligations to the fund. Use of derivatives may have different tax consequences for the fund than an investment in the underlying security, and those differences may affect the amount, timing and character of income distributed to shareholders. The U.S. government and foreign governments are in the process of adopting and implementing regulations governing derivatives markets, including mandatory clearing of certain derivatives, margin and reporting requirements. The ultimate impact of the regulations remains unclear. Additional regulation of derivatives may make derivatives more costly, limit their availability or utility, otherwise adversely affect their performance or disrupt markets. For additional information regarding derivatives, see “More on Risks of Investing in the Funds—More on Principal Risks: Derivatives” in this prospectus. In addition, the SEC has proposed a new rule that would change the regulation of the use of derivatives by registered investment companies, such as the fund. If the proposed rule takes effect, it could limit the ability of the fund to invest in derivatives.
Dollar Rolls – The use of dollar rolls is a speculative technique involving leverage, and can have an economic effect similar to borrowing money for investment purposes. Dollar roll transactions involve the risk that the market value of the securities the fund is required to purchase may decline below the agreed upon repurchase price of those securities. If the broker/dealer to whom the fund sells securities becomes insolvent, the fund’s right to purchase or repurchase securities may be restricted.
Emerging Markets – Investments in the securities of issuers located in or principally doing business in emerging markets are subject to foreign investments risks. These risks are greater for investments in issuers in emerging market countries. Emerging market countries tend to have economic, political and legal systems that are less fully developed and are less stable than those of more developed countries. Emerging market securities are often particularly sensitive to market movements because their market prices tend to reflect speculative expectations. Low trading volumes may result in a lack of liquidity and in extreme price volatility.
Extension – When interest rates rise, repayments of fixed income securities, particularly asset- and mortgage-backed securities, may occur more slowly than anticipated, extending the effective duration of these fixed income securities at below market interest rates and causing their market prices to decline more than they would have declined due to the rise in interest rates alone. This may cause the fund’s share price to be more volatile.
Fixed-Income Securities – The market prices of fixed-income securities may go up or down, sometimes rapidly and unpredictably, due to general market conditions, such as real or perceived adverse economic or political conditions, inflation, changes in interest rates, lack of liquidity in the bond markets or adverse investor sentiment. In addition, the market value of a fixed income security may decline if the issuer or other obligor of the security fails to pay principal and/or interest, otherwise defaults or has its credit rating downgraded or is perceived to be less creditworthy, or the credit quality or value of any underlying assets declines. When market prices fall, the value of your investment will go down. The value of your investment will generally go down when interest rates rise. Interest rates have been at historically low levels, so the fund faces a heightened risk that interest rates may rise. A rise in rates tends to have a greater impact on the prices of longer term or duration securities.
- 23 -
Foreign Investments – Investing in securities of foreign issuers or issuers with significant exposure to foreign markets involves additional risk. Foreign countries in which the fund may invest may have markets that are less liquid, less regulated and more volatile than U.S. markets. The value of the fund’s investments may decline because of factors affecting the particular issuer as well as foreign markets and issuers generally, such as unfavorable or unsuccessful government actions, reduction of government or central bank support, political or financial instability or other adverse economic or political developments. Lack of information and weaker accounting standards also may affect the value of these securities.
Hedging – The fund may buy and sell futures contracts, put and call options, and forward contracts as a hedge. Some hedging strategies could hedge the fund’s portfolio against price fluctuations. Other hedging strategies would tend to increase the fund’s exposure to the securities market. Forward contracts could be used to try to manage foreign currency risks on the fund’s foreign investments. The fund’s hedging strategies may not work as intended, and the fund may be in a less favorable position than if it had not used a hedging instrument.
High-Yield Debt Securities – High-yield debt securities, commonly referred to as “junk” bonds, are securities that are rated below “investment grade” or, if unrated, determined to be below investment grade by the sub-adviser. Changes in interest rates, the market’s perception of the issuers and the creditworthiness of the issuers may significantly affect the value of these bonds. Junk bonds are considered speculative, have a higher risk of default, tend to be less liquid and may be more difficult to value than higher grade securities. Junk bonds tend to be volatile and more susceptible to adverse events and negative sentiments.
Inflation-Protected Securities – Inflation-protected debt securities may react differently from other types of debt securities and tend to react to changes in “real” interest rates. Real interest rates represent nominal (stated) interest rates reduced by the expected impact of inflation. In general, the price of an inflation-protected debt security can fall when real interest rates rise, and can rise when real interest rates fall. Interest payments on inflation-protected debt securities can be unpredictable and will vary as the principal and/or interest is adjusted for inflation. Also, the inflation index utilized by a particular inflation-protected security may not accurately reflect the true rate of inflation, in which case the market value of the security could be adversely affected.
Interest Rate – Interest rates in the U.S. have been at historically low levels, so the fund faces a heightened risk that interest rates may rise. The value of fixed income securities generally goes down when interest rates rise, and therefore the value of your investment in the fund may also go down. Debt securities have varying levels of sensitivity to changes in interest rates. A rise in rates tends to have a greater impact on the prices of longer term or duration securities. A general rise in interest rates may cause investors to move out of fixed income securities on a large scale, which could adversely affect the price and liquidity of fixed income securities and could also result in increased redemptions from the fund.
Legal and Regulatory – Legal and regulatory changes could occur that may adversely affect the fund, its investments, and its ability to pursue its investment strategies and/or increase the costs of implementing such strategies. Certain changes have already been proposed and additional changes are expected. New or revised laws or regulations may be imposed by the U.S. Securities and Exchange Commission, the U.S. Commodity Futures Trading Commission, the Internal Revenue Service, the U.S. Federal Reserve or other governmental regulatory authorities or self-regulatory organizations that could adversely affect the fund. The fund also may be adversely affected by changes in the enforcement or interpretation of existing statutes and rules by governmental regulatory authorities or self-regulatory organizations.
Leveraging – The value of your investment may be more volatile to the extent that the fund borrows or uses derivatives or other investments that have a leveraging effect on the fund. Other risks also will be compounded. This is because leverage generally magnifies the effect of a change in the value of an asset and creates a risk of loss of value on a larger pool of assets than the fund would otherwise have had. The use of leverage is considered to be a speculative investment practice and may result in the loss of a substantial amount, and possibly all, of the fund’s assets. The fund also may have to sell assets at inopportune times to satisfy its obligations.
- 24 -
Liquidity – The fund may make investments that are illiquid or that become illiquid after purchase. Investments may become illiquid due to the lack of an active market, a reduced number of traditional market participants, or reduced capacity of traditional market participants to make a market in securities. The liquidity and value of investments can deteriorate rapidly and those investments may be difficult or impossible for the fund to sell, particularly during times of market turmoil. These illiquid investments can be difficult to value. If the fund is forced to sell an illiquid investment to meet redemption requests or other cash needs, the fund may be forced to sell at a loss. The fund may not receive its proceeds from the sale of certain securities for an extended period (for example, several weeks or even longer).
Loans – Loans are subject to the credit risk of nonpayment of principal or interest. Economic downturns or increases in interest rates may cause an increase in defaults, interest rate risk and liquidity risk. Loans may or may not be collateralized at the time of acquisition, and any collateral may be relatively illiquid or lose all or substantially all of its value subsequent to investment. In the eventof bankruptcy of a borrower, the fund could experience delays or limitations with respect to its ability to realize the benefits of any collateral securing a loan. Junior loans, which have a lower place in the borrower’s capital structure than senior loans and may be unsecured, involve a higher degree of overall risk than senior loans of the same borrower. The fund’s investments in loans are also subject to prepayment or call risk. Loans may have settlement periods in excess of seven days. Failure to receive sales proceeds on a timely basis may constrain the fund’s ability to meet its obligations (including obligations to redeeming shareholders).
Market – The market prices of the fund’s securities may go up or down, sometimes rapidly or unpredictably, due to general market conditions, such as real or perceived adverse economic or political conditions, inflation, changes in interest rates or currency rates, lack of liquidity in the markets or adverse investor sentiment. Adverse market conditions may be prolonged and may not have the same impact on all types of securities. Market prices of securities also may go down due to events or conditions that affect particular sectors, industries or issuers. When market prices fall, the value of your investment will go down. The fund may experience a substantial or complete loss on any individual security.
In the past several years, financial markets, such as those in the United States, Europe, Asia and elsewhere, have experienced increased volatility, depressed valuations, decreased liquidity and heightened uncertainty. Governmental and non-governmental issuers defaulted on, or were forced to restructure, their debts. These market conditions may continue, worsen or spread.
The U.S. government and the Federal Reserve, as well as certain foreign governments and central banks have taken steps to support financial markets, including keeping interest rates at historically low levels. This and other government intervention may not work as intended, particularly if the efforts are perceived by investors as being unlikely to achieve the desired results. The Federal Reserve recently has reduced its market support activities. Further reduction or withdrawal of Federal Reserve or other U.S. or non-U.S. governmental or central bank support, including interest rate increases, could negatively affect financial markets generally, increase market volatility and reduce the value and liquidity of securities in which the fund invests.
Policy and legislative changes in the United States and in other countries are affecting many aspects of financial regulation, and may in some instances contribute to decreased liquidity and increased volatility in the financial markets. The impact of these changes on the markets, and the practical implications for market participants, may not be fully known for some time.
Economies and financial markets throughout the world are becoming increasingly interconnected. As a result, whether or not the fund invests in securities of issuers located in or with significant exposure to countries experiencing economic and financial difficulties, the value and liquidity of the fund’s investments may be negatively affected.
Mortgage-Related and Asset-Backed Securities – The value of mortgage-related and asset-backed securities will be influenced by factors affecting the housing market and the assets underlying such securities. As a result, during periods of declining asset values, difficult or frozen credit markets, swings in interest rates, or deteriorating
- 25 -
economic conditions, mortgage-related and asset-backed securities may decline in value, face valuation difficulties, become more volatile and/or become illiquid. Mortgage-backed securities may be issued by private issuers, by government-sponsored entities such as Fannie Mae or Freddie Mac or by agencies of the U.S. government, such as Ginnie Mae. Mortgage-backed securities represent direct or indirect participations in, or are collateralized by and payable from, mortgage loans secured by real property. Unlike mortgage-related securities issued or guaranteed by agencies of the U.S. government or government-sponsored entities, mortgage-related securities issued by private issuers do not have a government or government-sponsored entity guarantee (but may have other credit enhancement), and may, and frequently do, have less favorable collateral, credit risk or other underwriting characteristics. Asset-backed securities represent participations in, or are secured by and payable from, assets such as installment sales or loan contracts, leases, credit card receivables and other categories of receivables. The value of mortgage-backed and asset-backed securities may be affected by changes in credit quality or value of the mortgage loans or other assets that support the securities. Mortgage-backed and asset-backed securities are subject to prepayment or call and extension risks. Some of these securities may receive little or no collateral protection from the underlying assets. The risk of default is generally higher in the case of mortgage-backed investments that include so-called “sub-prime” mortgages. The structure of some of these securities may be complex and there may be less information available than for other types of debt securities. Upon the occurrence of certain triggering events or defaults, the fund may become the holder of underlying assets at a time when those assets may be difficult to sell or may be sold only at a loss.
Municipal Securities – Municipal issuers may be adversely affected by rising health care costs, increasing unfunded pension liabilities, and by the phasing out of federal programs providing financial support. Unfavorable conditions and developments relating to projects financed with municipal securities can result in lower revenues to issuers of municipal securities, potentially resulting in defaults. The value of municipal securities can also be adversely affected by changes in the financial condition of one or more individual municipal issuers or insurers of municipal issuers, regulatory and political developments, tax law changes or other legislative actions, and by uncertainties and public perceptions concerning these and other factors. To the extent the fund invests significantly in a single state or in securities the payments on which are dependent upon a single project or source of revenues, or that relate to a sector or industry, the fund will be more susceptible to associated risks and developments. In recent periods an increasing number of municipal issuers have defaulted on obligations, commenced insolvency proceedings, or suffered credit downgrading. Financial difficulties of municipal issuers may continue or worsen.
Prepayment or Call – Many issuers have a right to prepay their securities. If interest rates fall, an issuer may exercise this right. If this happens, the fund will not benefit from the rise in market price that normally accompanies a decline in interest rates, and will be forced to reinvest prepayment proceeds at a time when yields on securities available in the market are lower than the yield on the prepaid security. The fund also may lose any premium it paid on the security.
Repurchase Agreements – If the other party to a repurchase agreement defaults on its obligation, the fund may suffer delays and incur costs or lose money in exercising its rights under the agreement. If the seller fails to repurchase the security and the market value declines, the fund could lose money. If the seller becomes insolvent and subject to liquidation or reorganization under applicable bankruptcy or other laws, the fund’s ability to dispose of the underlying securities may be restricted.
Sovereign Debt – Sovereign debt instruments are subject to the risk that the governmental entity may delay or fail to pay interest or repay principal on its sovereign debt. If a governmental entity defaults, it may ask for more time in which to pay or for further loans. There may be no established legal process for collecting sovereign debt that a government does not pay, nor are there bankruptcy proceedings through which all or part of the sovereign debt that a governmental entity has not repaid may be collected.
U.S. Government Agency Obligations – Government agency obligations have different levels of credit support and, therefore, different degrees of credit risk. Securities issued by agencies and instrumentalities of the U.S. government that are supported by the full faith and credit of the U.S. generally present a lesser degree of credit risk than securities issued by agencies and instrumentalities sponsored by the U.S. government that are supported only by the issuer’s right to borrow from the U.S. Treasury and securities issued by agencies and instrumentalities sponsored by the U.S. government that are supported only by the credit of the issuing agencies.
- 26 -
Valuation – The sales price the fund could receive for any particular portfolio investment may differ from the fund’s valuation of the investment, particularly for securities that trade in thin or volatile markets, that are priced based upon valuations provided by third-party pricing services that use matrix or evaluated pricing systems, or that are valued using a fair value methodology. The fund’s ability to value its investments may be impacted by technological issues and/or errors by pricing services or other third party service providers.
Yield – The amount of income received by the fund will go up or down depending on day-to-day variations in short-term interest rates, and when interest rates are very low the fund’s expenses could absorb all or a significant portion of the fund’s income.
Each Fund is subject to similar management related risks. The Target Funds are subject to the following related principal risk:
Management – The fund is subject to the risk that the Investment Manager’s or sub-adviser’s judgments and decisions may be incorrect or otherwise may not produce the desired results. The value of your investment may decrease if the sub-adviser’s judgment about the quality, relative yield or value of, or market trends affecting, a particular security or issuer, industry, sector, region or market segment, or about the economy or interest rates, is incorrect. The fund may also suffer losses if there are imperfections, errors or limitations in the tools, resources, information and data used, or the analyses employed or relied on, by the sub-adviser, or if the sub-adviser’s investment style is out of favor or otherwise fails to produce the desired results. The fund’s investment strategies designed by the investment manager may not work as intended. In addition, the fund’s investment strategies or policies may change from time to time. Those changes may not lead to the results intended by the investment manager and could have an adverse effect on the value or performance of the fund. Any of these things could cause the fund to lose value or its results to lag relevant benchmarks or other funds with similar objectives.
The Destination Fund is subject to the following related principal risks:
Manager – The fund is subject to the risk that the sub-adviser’s judgments and investment decisions, as well as the methods, tools, resources, information and data, and the analyses employed or relied on by the sub-adviser to make those judgments and decisions may be incorrect or otherwise may not produce the desired results. This could cause the fund to lose value or its results to lag relevant benchmarks or other funds with similar objectives.
Portfolio Management – The value of your investment may decrease if the sub-adviser’s judgment about the quality, relative yield, value or market trends affecting a particular security orissuer, industry, sector, region or market segment, or about the economy or interest rates is incorrect, or if there are imperfections, errors or limitations in the tools and data used by the sub-adviser or manager. In addition, the fund’s investment strategies or policies may change from time to time. Those changes may not lead to the results intended by the sub-adviser and could have an adverse effect on the value or performance of the fund.
The Funds’ Past Performance
Set forth below is performance information for each Fund. The bar charts and tables below provide some indication of the risks of investing in each Fund by showing you how the performance of the Target Funds and Class I2 shares of the Destination Fund has varied from year to year for 10 years or since inception, as applicable, and how the average total returns of each Target Fund and the applicable class of shares of the Destination Fund for different periods compare to the returns of one or more broad measures of market performance. The performance shown below for Transamerica Partners Core Bond Portfolio reflects only master portfolio level expenses, and does not include the expenses of any of the applicable Non-Mutual Fund Feeder Funds. If those expenses were reflected, the performance would be lower. Absent any applicable limitation of or cap on the Funds’ expenses, performance would have been lower. No performance information is presented for the Class R, Class R4 and Class I3 shares of the Destination Fund because those share classes are newly offered. Class R, Class R4 and Class I3 shares of the
- 27 -
Destination Fund would have different performance because they have different expenses. A Fund’s past performance (before and after taxes) is not necessarily an indication of how the Fund will perform in the future. Following the Reorganizations, Transamerica Partners Institutional Core Bond will be the surviving fund for performance purposes.
Prior to May 1, 2014, the Target Funds had a different sub-adviser. The performance set forth below for the Target Funds prior to that date is attributable to the previous sub-adviser.
Transamerica Partners Core Bond Annual Returns
Annual Total Returns (calendar years ended December 31)
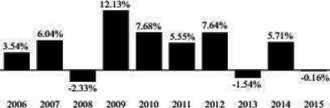
| | | | | | | | |
| | | Quarter Ended | | | Return | |
Best Quarter: | | | 9/30/2009 | | | | 5.26 | % |
Worst Quarter: | | | 9/30/2008 | | | | -3.88 | % |
Year-to-date return as of September 30, 2016: 5.76%
Transamerica Partners Core Bond Average Annual Total Returns
Average Annual Total Returns (periods ended December 31, 2015)
| | | | | | | | | | | | | | | | |
| | | 1 Year | | | 5 Years | | | 10 Years | | | Inception Date | |
Transamerica Partners Core Bond | | | -0.16 | % | | | 3.38 | % | | | 4.34 | % | | | 07/05/1994 | |
Barclays U.S. Aggregate Bond Index (reflects no deduction for fees, expenses or taxes) | | | 0.55 | % | | | 3.25 | % | | | 4.51 | % | | | | |
Transamerica Partners Institutional Core Bond Annual Returns
Annual Total Returns (calendar years ended December 31)
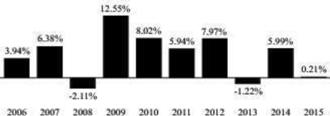
| | | | | | | | |
| | | Quarter Ended | | | Return | |
Best Quarter: | | | 9/30/2009 | | | | 5.44 | % |
Worst Quarter: | | | 9/30/2008 | | | | -3.77 | % |
Year-to-date return as of September 30, 2016: 5.99%
- 28 -
Transamerica Partners Institutional Core Bond Average Annual Total Returns
Average Annual Total Returns (periods ended December 31, 2015)
| | | | | | | | | | | | | | | | |
| | | 1 Year | | | 5 Years | | | 10 Years | | | Inception Date | |
Transamerica Partners Institutional Core Bond | | | 0.21 | % | | | 3.72 | % | | | 4.67 | % | | | 09/11/2000 | |
Barclays U.S. Aggregate Bond Index (reflects no deduction for fees, expenses or taxes) | | | 0.55 | % | | | 3.25 | % | | | 4.51 | % | | | | |
Transamerica Partners Core Bond Portfolio Annual Returns
Annual Total Returns (calendar years ended December 31)
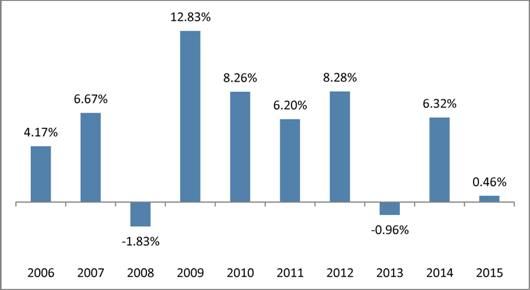
The highest and lowest quarterly returns for the periods reflected in the table above are:
| | | | | | | | |
| | | Quarter Ended | | | Return | |
Best Quarter: | | | 9/30/2009 | | | | 5.44 | % |
Worst Quarter: | | | 9/30/2008 | | | | -3.66 | % |
Year-to-date return as of September 30, 2016: 5.81%
Transamerica Partners Core Bond Portfolio Average Annual Total Returns
(for periods ended 12/31/2015)
| | | | | | | | | | | | | | | | |
| | | 1 Year | | | 5 Years | | | 10 Years | | | Inception
Date | |
Transamerica Partners Core Bond Portfolio | | | 0.46 | % | | | 4.00 | % | | | 4.95 | % | | | 01/01/2002 | |
Barclays U.S. Aggregate Bond Index (reflects no deduction for fees, expenses or taxes) | | | 0.55 | % | | | 3.25 | % | | | 4.51 | % | | | | |
- 29 -
Transamerica Intermediate Bond Annual Returns
Annual Total Returns (calendar years ended December 31) - Class I2

| | | | | | | | |
| | | Quarter Ended | | | Return | |
Best Quarter: | | | 3/31/2015 | | | | 1.66 | % |
Worst Quarter: | | | 6/30/2015 | | | | -1.61 | % |
Year-to-date return as of September 30, 2016: 5.65%
Transamerica Intermediate Bond Average Annual Total Returns
Average Annual Total Returns (periods ended December 31, 2015)
| | | | | | | | | | | | |
| | | 1 Year | | | Since
Inception | | | Inception Date | |
Class I2 | | | | 03/01/2014 | |
Return before taxes | | | 0.51 | % | | | 1.99 | % | | | | |
Return after taxes on distributions | | | -0.40 | % | | | 1.10 | % | | | | |
Return after taxes on distributions and sale of fund shares | | | 0.29 | % | | | 1.12 | % | | | | |
Barclays U.S. Aggregate Bond Index (reflects no deduction for fees, expenses or taxes) | | | 0.55 | % | | | 2.39 | % | | | | |
The after-tax returns are calculated using the historic highest individual federal marginal income tax rates and do not reflect the impact of state and local taxes. Actual after-tax returns may depend on the investor’s individual tax situation and may differ from those shown. After-tax returns may not be relevant if the investment is made through a tax-exempt or tax-deferred account, such as a 401(k) plan.
The Funds’ Fees and Expenses
Shareholders of the Target Funds and the Destination Fund pay various fees and expenses, either directly or indirectly. The tables below show the fees and expenses that you would pay if you were to buy and hold shares of each Fund. The fees and expenses in the tables appearing below are based on the expenses of the Funds for the twelve-month period ended June 30, 2016. The tables also show the pro forma expenses of the combined Destination Fund after giving effect to all Group 1 Reorganizations based on pro forma net assets as of June 30, 2016. Pro forma numbers are estimated in good faith and are hypothetical. Actual expenses may vary significantly. The fees and expenses shown in the table and Example below for Transamerica Partners Core Bond Portfolio reflect only master portfolio level fees and expenses, and do not include the fees and expenses of any of the applicable Non-Mutual Fund Feeder Funds. For financial statement purposes, Transamerica Partners Institutional Core Bond will be the accounting survivor of the Reorganizations. As the accounting survivor, Transamerica Partners Institutional Core Bond’s operating history will be used for financial reporting purposes.
- 30 -
Transamerica Partners Core Bond
| | | | | | | | | | | | |
| | | Transamerica
Partners Core
Bond1 | | | Transamerica
Intermediate
Bond | | | Combined
Transamerica
Intermediate
Bond
(Pro Forma) | |
| | | | | | Class R | | | Class R | |
Shareholder Fees (fees paid directly from your investment) | | | | | | | | | | | | |
Maximum sales charge (load) imposed on purchases (as a % of offering price) | | | None | | | | None | | | | None | |
Maximum deferred sales charge (load) (as a % of offering price) | | | None | | | | None | | | | None | |
Redemption fee (as a % of amount redeemed) | | | None | | | | None | | | | None | |
| | | |
Annual Fund Operating Expenses (expenses that you pay each year as a % of the value of your investment) | | | | | | | | | | | | |
Management fees2 | | | 0.35 | % | | | 0.38 | % | | | 0.38 | % |
Distribution and service (12b-1) fees | | | 0.25 | % | | | 0.50 | % | | | 0.50 | % |
Other expenses3 | | | 0.36 | % | | | 0.03 | %4 | | | 0.03 | %4 |
Total annual fund operating expenses | | | 0.96 | % | | | 0.91 | % | | | 0.91 | % |
Fee waiver and/or expense reimbursement | | | 0.00 | %5 | | | 0.00 | %6 | | | 0.00 | %6 |
Total annual fund operating expenses after fee waiver and/or expense reimbursement | | | 0.96 | % | | | 0.91 | % | | | 0.91 | % |
Transamerica Partners Institutional Core Bond
| | | | | | | | | | | | |
| | | Transamerica
Partners
Institutional
Core Bond1 | | | Transamerica
Intermediate
Bond | | | Combined
Transamerica
Intermediate
Bond
(Pro Forma) | |
| | | | | | Class R4 | | | Class R4 | |
Shareholder Fees (fees paid directly from your investment) | | | | | | | | | | | | |
Maximum sales charge (load) imposed on purchases (as a % of offering price) | | | None | | | | None | | | | None | |
Maximum deferred sales charge (load) (as a % of offering price) | | | None | | | | None | | | | None | |
Redemption fee (as a % of amount redeemed) | | | None | | | | None | | | | None | |
| | | |
Annual Fund Operating Expenses (expenses that you pay each year as a % of the value of your investment) | | | | | | | | | | | | |
Management fees2 | | | 0.35 | % | | | 0.38 | % | | | 0.38 | % |
Distribution and service (12b-1) fees | | | 0.25 | % | | | 0.25 | % | | | 0.25 | % |
Other expenses3 | | | 0.10 | % | | | 0.03 | %4 | | | 0.03 | %4 |
Total annual fund operating expenses | | | 0.70 | % | | | 0.66 | % | | | 0.66 | % |
Fee waiver and/or expense reimbursement | | | 0.05 | %7 | | | 0.01 | %6 | | | 0.01 | %6 |
Total annual fund operating expenses after fee waiver and/or expense reimbursement | | | 0.65 | % | | | 0.65 | % | | | 0.65 | % |
- 31 -
Transamerica Partners Core Bond Portfolio
| | | | | | | | | | | | |
| | | Transamerica
Partners Core
Bond Portfolio | | | Transamerica
Intermediate
Bond | | | Combined
Transamerica
Intermediate
Bond
(Pro Forma) | |
| | | | | | Class I3 | | | Class I3 | |
Shareholder Fees (fees paid directly from your investment) | | | | | | | | | | | | |
Maximum sales charge (load) imposed on purchases (as a % of offering price) | | | None | | | | None | | | | None | |
Maximum deferred sales charge (load) (as a % of offering price) | | | None | | | | None | | | | None | |
Redemption fee (as a % of amount redeemed) | | | None | | | | None | | | | None | |
| | | |
Annual Fund Operating Expenses (expenses that you pay each year as a % of the value of your investment) | | | | | | | | | | | | |
Management fees2 | | | 0.35 | % | | | 0.38 | % | | | 0.38 | % |
Distribution and service (12b-1) fees | | | None | | | | None | | | | None | |
Other expenses3 | | | 0.02 | % | | | 0.03 | %4 | | | 0.03 | %4 |
Total annual fund operating expenses | | | 0.37 | % | | | 0.41 | % | | | 0.41 | % |
Fee waiver and/or expense reimbursement | | | N/A | | | | 0.01 | %6 | | | 0.01 | %6 |
Total annual fund operating expenses after fee waiver and/or expense reimbursement | | | 0.37 | % | | | 0.40 | % | | | 0.40 | % |
| 1 | The Target Feeder Fund invests in securities through an underlying Target Master Portfolio, Transamerica Partners Core Bond Portfolio. The information in this table and in the Example below concerning the Target Feeder Fund reflects the direct fees and expenses of the Target Feeder Fund and its allocated share of the fees and expenses of the Target Master Portfolio. |
| 2 | The Destination Fund receives investment advisory and administrative services under one agreement with the Destination Fund’s investment manager, Transamerica Asset Management, Inc. (“TAM”), and pays a single management fee to TAM. Transamerica Partners Core Bond and Transamerica Partners Institutional Core Bond receive investment advisory and administrative services from TAM under separate agreements and pay separate advisory fees and administrative services fees to TAM. The administrative services fees of 0.30% for Transamerica Partners Core Bond and 0.05% for Transamerica Partners Institutional Core Bond are included in “Other expenses.” Transamerica Partners Core Bond Portfolio receives investment advisory services from TAM and pays advisory fees to TAM. Transamerica Partners Core Bond Portfolio pays no separate administrative services fees. |
| 3 | Other expenses do not include the costs of the Reorganization to be borne by the Target Funds and the Destination Fund. These costs are considered extraordinary expenses and are not covered by the applicable expense limitation arrangements. The basis point impact of such costs is 0.00% for Transamerica Partners Core Bond, 0.03% for Transamerica Partners Institutional Core Bond, 0.01% for Transamerica Partners Core Bond Portfolio and 0.00% for Transamerica Intermediate Bond. |
| 4 | Other expenses are based on estimates for the current fiscal year. Actual expenses may differ from estimates. |
| 5 | Contractual arrangements have been made with TAM through May 1, 2017 to waive fees and/or reimburse fund expenses to the extent that the fund’s total operating expenses exceed 1.00%, excluding, as applicable, acquired fund fees and expenses, interest, taxes, brokerage commissions, dividend and interest expenses on securities sold short, extraordinary expenses and other expenses not incurred in the ordinary course of the fund’s business. |
| 6 | Contractual arrangements have been made with TAM through May 1, 2018 to waive fees and/or reimburse fund expenses to the extent that the fund’s total operating expenses exceed 1.00% for Class R shares, 0.65% for Class R4 shares and 0.40% for Class I3 shares, excluding, as applicable, acquired fund fees and expenses, interest, taxes, brokerage commissions, dividend and interest expenses on securities sold short, extraordinary expenses and other expenses not incurred in the ordinary course of the fund’s business. These arrangements cannot be terminated prior to May 1, 2018 without the Board of Trustees’ consent. TAM is entitled to reimbursement by the fund of fees waived or expenses reduced during any of the previous 36 months if on any day or month the estimated annualized fund operating expenses are less than the cap. |
| 7 | Contractual arrangements have been made with TAM through May 1, 2017 to waive fees and/or reimburse fund expenses to the extent that the fund’s total operating expenses exceed 0.65%, excluding, as applicable, acquired fund fees and expenses, interest, taxes, brokerage commissions, dividend and interest expenses on securities sold short, extraordinary expenses and other expenses not incurred in the ordinary course of the fund’s business. |
The hypothetical examples below help you compare the cost of investing in each Fund. Each example assumes that:
| | • | | you invest $10,000 in each Fund; |
| | • | | you reinvest all dividends and distributions without a sales charge; |
| | • | | your investment has a 5% annual return (this assumption is required by the SEC and is not a prediction of the Fund’s future performance); and |
| | • | | each Fund’s operating expenses remain the same. |
- 32 -
Each example also assumes no fees for IRA accounts, if applicable. Costs are the same whether you redeem at the end of any period or not. Pro forma expenses are included assuming the consummation of all Group 1 Reorganizations. The examples are for comparison purposes only and do not represent the Funds’ actual expenses or returns, either past or future. Because actual return and expenses will be different, the examples are for comparison only.
Transamerica Partners Core Bond
| | | | | | | | | | | | |
Number of years you own your shares | | Transamerica
Partners Core
Bond | | | Transamerica
Intermediate Bond | | | Combined
Transamerica
Intermediate Bond
(Pro Forma) | |
| | | | | | Class R | | | Class R | |
Year 1 | | $ | 98 | | | $ | 93 | | | $ | 93 | |
Year 3 | | $ | 306 | | | $ | 290 | | | $ | 290 | |
Year 5 | | $ | 531 | | | $ | 504 | | | $ | 504 | |
Year 10 | | $ | 1,178 | | | $ | 1,120 | | | $ | 1,120 | |
Transamerica Partners Institutional Core Bond
| | | | | | | | | | | | |
Number of years you own your shares | | Transamerica
Partners
Institutional Core
Bond | | | Transamerica
Intermediate Bond | | | Combined
Transamerica
Intermediate Bond
(Pro Forma) | |
| | | | | | Class R4 | | | Class R4 | |
Year 1 | | $ | 66 | | | $ | 66 | | | $ | 66 | |
Year 3 | | $ | 219 | | | $ | 210 | | | $ | 210 | |
Year 5 | | $ | 385 | | | $ | 367 | | | $ | 367 | |
Year 10 | | $ | 866 | | | $ | 822 | | | $ | 822 | |
Transamerica Partners Core Bond Portfolio
| | | | | | | | | | | | |
Number of years you own your shares | | Transamerica
Partners Core
Bond Portfolio | | | Transamerica
Intermediate Bond | | | Combined
Transamerica
Intermediate Bond
(Pro Forma) | |
| | | | | | Class I3 | | | Class I3 | |
Year 1 | | $ | 38 | | | $ | 41 | | | $ | 41 | |
Year 3 | | $ | 119 | | | $ | 131 | | | $ | 131 | |
Year 5 | | $ | 208 | | | $ | 229 | | | $ | 229 | |
Year 10 | | $ | 468 | | | $ | 517 | | | $ | 517 | |
CAPITALIZATION
The following tables set forth the capitalization of each Target Fund and the Destination Fund as of September 30, 2016 and the pro forma combined capitalization of the combined Destination Fund as if the Reorganizations had occurred on that date. If the Reorganizations are consummated, the actual exchange ratios on the closing date may vary from the exchange ratios used in the computation below. This is due to changes in the market value of the portfolio securities of the Funds between September 30, 2016 and the closing date, changes in the amount of undistributed net investment income and net realized capital gains of the Funds during that period resulting from income and distributions, and changes in the accrued liabilities of the Funds during the same period.
- 33 -
Transamerica Partners Core Bond Funds
| | | | | | | | | | | | |
| | | Transamerica
Partners Core
Bond | | | Transamerica
Partners
Institutional Core
Bond | | | Transamerica
Partners Core
Bond Portfolio | |
Net Assets | | $ | 379,274,297 | | | $ | 373,097,431 | | | $ | 476,960,162 | |
| | | |
Net Asset Value Per Share | | $ | 13.33 | | | $ | 11.03 | | | $ | 10.39 | |
| | | |
Shares Outstanding | | | 28,458,455 | | | | 33,836,349 | | | | 45,905,694 | |
Transamerica Intermediate Bond
| | | | | | | | |
| | | Transamerica
Intermediate
Bond | | | Transamerica
Intermediate
Bond
Pro Forma | |
Net Assets | | | | | | | | |
Class I2 | | $ | 1,900,566,734 | | | $ | 3,129,809,136 | |
Advisor Class | | | — | | | | — | |
Class R | | | — | | | $ | 379,274,297 | |
Class R4 | | | — | | | $ | 373,097,431 | |
Class I3 | | | — | | | $ | 476,870,674 | |
Net Asset Value Per Share | | | | | | | | |
Class I2 | | $ | 10.39 | | | $ | 10.39 | |
Advisor Class | | | — | | | | — | |
Class R | | | 10.39 | | | $ | 10.39 | |
Class R4 | | | 10.39 | | | $ | 10.39 | |
Class I3 | | | 10.39 | | | $ | 10.39 | |
Shares Outstanding | | | | | | | | |
Class I2 | | | 182,849,533 | | | | 182,849,533 | |
Advisor Class | | | — | | | | — | |
Class R | | | — | | | | 36,503,782 | |
Class R4 | | | — | | | | 35,909,281 | |
Class I3 | | | — | | | | 45,905,694 | |
It is impossible to predict with any certainty how many shares of the Destination Fund will actually be received and distributed by a Target Fund on the closing date. The foregoing table should not be relied upon to determine the amount of Destination Fund shares that will actually be received and distributed.
ADDITIONAL INFORMATION
For information relating to each Fund and its Reorganization, including tax capital loss carryforwards, the tax status of the Reorganization, a comparison of the fundamental investment policies of the Funds, how to buy, sell or exchange Fund shares, how each Fund values its securities, financial highlights information for each Fund and ownership of shares of the Funds, please see the sections immediately following the discussion of the Group 9 Reorganizations.
- 34 -
TARGET FUND BOARD’S EVALUATION AND RECOMMENDATION
With respect to each Target Fund, the Board of the Target Fund, including its Independent Trustees, after careful consideration, unanimously determined that the Reorganization is in the best interest of the Target Fund and will not dilute the interests of the existing holders of the Target Fund. Each Board made this determination based on various factors, which include those that are discussed in the section entitled “Reasons for the Proposed Reorganizations” in the back of this Proxy Statement/Prospectus following the discussion of the proposals.
Similarly, the Board of the Destination Fund, including all its Independent Trustees, has approved the Reorganization with respect to the Destination Fund. The Board has determined that the Reorganization is in the best interest of the Destination Fund and that the interests of the Destination Fund’s holders will not be diluted as a result of the Reorganization.
THE BOARD OF YOUR TARGET FUND RECOMMENDS THAT YOU VOTE “FOR” PROPOSAL 1A, 1B OR 1C, AS APPLICABLE, TO APPROVE THE PLAN.
- 35 -
GROUP 2 – GOVERNMENT MONEY MARKET FUNDS
TRANSAMERICA PARTNERS GOVERNMENT MONEY MARKET
TRANSAMERICA PARTNERS INSTITUTIONAL GOVERNMENT MONEY MARKET
TRANSAMERICA PARTNERS GOVERNMENT MONEY MARKET PORTFOLIO
(each, a “Target Fund” and together, the “Target Funds”)
AND
TRANSAMERICA GOVERNMENT MONEY MARKET
(the “Destination Fund”)
PROPOSALS 2A, 2B AND 2C
APPROVAL OF AGREEMENT AND PLAN OF REORGANIZATION
SUMMARY
The following is a summary of more complete information appearing later in this Proxy Statement/Prospectus or incorporated herein. You should read carefully the entire Proxy Statement/Prospectus, including the form of Plan attached as Exhibit A, which includes additional information that is not included in the summary and is a part of this Proxy Statement/Prospectus. For a discussion of the terms of the Plan, please see the section entitled “Terms of Each Agreement and Plan of Reorganization” in the back of this Proxy Statement/Prospectus, after the discussion of the proposals.
In each proposed Reorganization, the Target Fund would be reorganized into the Destination Fund, with that Target Fund receiving shares of the applicable class of the Destination Fund as shown in the following table. The Target Funds, which operate in a master-feeder structure, do not have share classes.
| | | | |
Proposal | | Target Fund | | Destination Fund and Shares |
| Proposal 2A | | Transamerica Partners Government Money Market | | Transamerica Government Money Market
Class R |
| | |
| Proposal 2B | | Transamerica Partners Institutional Government Money Market | | Transamerica Government Money Market
Class R4 |
| | |
| Proposal 2C | | Transamerica Partners Government Money Market Portfolio | | Transamerica Government Money Market
Class I3 |
Transamerica Partners Government Money Market would reorganize first, Transamerica Partners Institutional Government Money Market would reorganize next and Transamerica Partners Government Money Market Portfolio would reorganize last. All Reorganizations would occur on the same closing date.
The Target Funds and the Destination Fund are managed by Transamerica Asset Management, Inc. (“TAM”) and have the same investment objectives and substantially similar principal investment strategies and related risks. The tables below provide a comparison of certain features of the Funds. Unless otherwise noted, the information is the same for each Target Fund. In the tables below, if a row extends across the entire table, the information applies to the Destination Fund and the Target Funds.
Comparison of Target Funds and Destination Fund
| | | | |
| | | Target Funds | | Destination Fund |
Investment objective | | Seeks as high a level of current income as is consistent with preservation of capital and liquidity. |
| | |
| Principal investment strategies1 | | The fund is a government money market fund. The fund seeks to maintain a stable net asset value of $1.00 per share by investing in: • high quality, U.S. dollar-denominated short-term money market securities issued or guaranteed as to principal or interest by the U.S. government or its agencies or instrumentalities; | | The fund is a government money market fund. The fund seeks to maintain a stable net asset value of $1.00 per share by investing in: • High-quality, U.S. dollar-denominated short-term money market securities issued or guaranteed as to principal or interest by the U.S. government or its agencies or instrumentalities; |
- 36 -
| | | | |
| | |
| | • repurchase agreements that are fully collateralized by U.S. government securities or cash; and • cash. | | • repurchase agreements that are fully collateralized by U.S. government securities or cash; and • cash. |
| | |
| | The fund invests at least 99.5% of its total assets in U.S. government securities, cash, and/or repurchase agreements that are fully collateralized as described above. Under normal circumstances, the fund invests at least 80% of its net assets in U.S. government securities and/or repurchase agreements that are fully collateralized by U.S. government securities. U.S. government securities in which the fund may invest include obligations of, or guaranteed by, the U.S. federal government, its agencies, instrumentalities or sponsored enterprises. Some U.S. government securities are supported by the full faith and credit of the U.S. government. These include U.S. Treasury obligations and securities issued by Ginnie Mae. A second category of U.S. government securities are those supported by the right of the agency, instrumentality or sponsored enterprise to borrow from the U.S. government to meet its obligations. These include securities issued by Federal Home Loan Banks. A third category of U.S. government securities are those supported by only the credit of the issuing agency, instrumentality or sponsored enterprise. These include securities issued by Fannie Mae and Freddie Mac. The fund will enter into repurchase agreements only with financial institutions that the sub-adviser determines are creditworthy. A financial institution must furnish collateral to the fund at least equal in value to the amount of its repurchase obligation. This collateral must consist of U.S. government securities or cash. The sub-adviser is responsible for ensuring that each repurchase agreement is eligible for purchase by the fund. In managing the fund’s assets, the sub-adviser starts with a global “top down” analysis and then considers various fundamental factors, such as creditworthiness, duration, yield, interest rate and liquidity. | | The fund’s sub-adviser, Aegon USA Investment Management, LLC (the “sub-adviser”), invests at least 99.5% of the fund’s total assets in U.S. government securities, cash, and/or repurchase agreements that are fully collateralized as described above. Under normal circumstances, the fund invests at least 80% of its net assets in U.S. government securities and/or repurchase agreements that are fully collateralized by U.S. government securities. U.S. government securities in which the fund may invest include obligations of, or guaranteed by, the U.S. federal government, its agencies, instrumentalities or sponsored enterprises. Some U.S. government securities are supported by the full faith and credit of the U.S. government. These include U.S. Treasury obligations and securities issued by Ginnie Mae. A second category of U.S. government securities are those supported by the right of the agency, instrumentality or sponsored enterprise to borrow from the U.S. government to meet its obligations. These include securities issued by Federal Home Loan Banks. A third category of U.S. government securities are those supported by only the credit of the issuing agency, instrumentality or sponsored enterprise. These include securities issued by Fannie Mae and Freddie Mac. The fund will enter into repurchase agreements only with financial institutions that the sub-adviser determines are creditworthy. A financial institution must furnish collateral to the fund at least equal in value to the amount of its repurchase obligation. This collateral must consist of U.S. government securities or cash. The sub-adviser is responsible for ensuring that each repurchase agreement is eligible for purchase by the fund. In managing the fund’s assets, the sub-adviser starts with a global “top down” analysis and then considers various fundamental factors, such as creditworthiness, duration, yield, interest rate and liquidity. |
- 37 -
| | | | |
| | |
| | The fund invests in accordance with the credit quality, maturity, liquidity and diversification requirements applicable to money market funds. The fund invests in securities that, at the time of purchase, are rated in the highest short-term rating category for short-term debt by a nationally recognized statistical rating organization or, if unrated, determined to be of equivalent credit quality by the fund’s sub-adviser. Where required by applicable regulations, the fund’s sub-adviser or Board of Trustees will decide whether the security should be held or sold in the event of credit downgrades or certain other events occurring after purchase. The fund invests exclusively in securities with a maximum remaining maturity of 397 days and maintains a dollar-weighted average portfolio maturity of 60 days or less. The fund may invest in other government money market funds to the extent permitted by law. As prevailing market conditions warrant, and at the discretion of the sub-adviser, the fund may hold cash uninvested and, if so, may be subject to risk with respect to the depository institution holding the cash. Cash assets are not income-generating and would impact the fund’s current yield. If the fund takes a temporary defensive position, it will be more difficult for the fund to achieve its investment objective. Although the sub-adviser has the ability to take defensive positions, it may choose not to do so for a variety of reasons, even during volatile market conditions. | | The fund invests in accordance with the credit quality, maturity, liquidity and diversification requirements applicable to money market funds. The fund invests in securities that, at the time of purchase, are rated in the highest short-term rating category for short-term debt by a nationally recognized statistical rating organization or, if unrated, determined to be of equivalent credit quality by the fund’s sub-adviser. Where required by applicable regulations, the fund’s sub-adviser or Board of Trustees will decide whether the security should be held or sold in the event of credit downgrades or certain other events occurring after purchase. The fund invests exclusively in securities with a maximum remaining maturity of 397 days and maintains a dollar-weighted average fund maturity of 60 days or less. The fund may invest in other government money market funds to the extent permitted by law. As prevailing market conditions warrant, and at the discretion of the sub-adviser, the fund may hold cash uninvested and, if so, may be subject to risk with respect to the depository institution holding the cash. Cash assets are not income-generating and would impact the fund’s current yield. If the fund takes a temporary defensive position, it will be more difficult for the fund to achieve its investment objective. Although the sub-adviser has the ability to take defensive positions, it may choose not to do so for a variety of reasons, even during volatile market conditions. |
| |
| Investment manager | | TAM |
| |
| Sub-adviser | | Aegon USA Investment Management, LLC |
| | |
| Business | | Transamerica Partners Government Money Market is a diversified series of TPFG, an open-end management investment company organized as a Massachusetts business trust. Transamerica Partners Institutional Government Money Market is a diversified series of TPFG II, an open-end management investment company organized as a Massachusetts business trust. Transamerica Partners Government Money Market Portfolio is a diversified series of TPP, an open-end management investment company and a trust governed by New York law. | | The Destination Fund is a diversified series of the Destination Trust, an open-end management investment company organized as a Delaware statutory trust. |
- 38 -
| | | | |
| | |
| Net assets (as of June 30, 2016) | | Transamerica Partners Government Money Market = $557,013,666 Transamerica Partners Institutional Government Money Market = $223,776,767 Transamerica Partners Government Money Market Portfolio (excluding the Target Feeder Funds) = $894,826,425 | | $244,860,827 |
| | |
| Management fees | | TAM receives compensation for investment advisory services from the Target Funds at annual rates of 0.25% of the first $1 billion; 0.24% over $1 billion up to $3 billion; and 0.23% in excess of $3 billion. TAM also receives compensation for administrative services from Transamerica Partners Government Money Market and Transamerica Partners Institutional Government Money Market at annual rates of 0.30% and 0.05%, respectively. Transamerica Partners Government Money Market Portfolio pays no separate administrative services fees. The applicable fee(s) are based upon average daily net assets and are accrued daily and paid monthly. | | TAM receives compensation for investment management services, which include investment advisory and administrative services, from the Destination Fund at annual rates of 0.28% of the first $1 billion; 0.27% over $1 billion up to $3 billion; and 0.26% in excess of $3 billion. The fee is based upon average daily net assets and is accrued daily and paid monthly. |
| | |
| Distribution and service (12b-1) fees | | Transamerica Partners Government Money Market is subject to a distribution and service (12b-1) fee of up to 0.25% of average daily net assets. Transamerica Partners Institutional Government Money Market is subject to a distribution and service (12b-1) fee of up to 0.25% of average daily net assets. Transamerica Partners Government Money Market Portfolio is not subject to a distribution and service (12b-1) fee. | | Class R shares of the Destination Fund are subject to a distribution and service (12b-1) fee of up to 0.50% of average daily net assets. Class R4 shares of the Destination Fund are subject to a distribution and service (12b-1) fee of up to 0.25% of average daily net assets. Class I3 shares of the Destination Fund are not subject to a distribution and service (12b-1) fee. |
| | |
| Sales charges | | Shares of the Target Funds are offered without a sales charge and are not subject to a contingent deferred sales charge. | | Class R, Class R4, and Class I3 shares of the Destination Fund are offered without a sales charge and are not subject to a contingent deferred sales charge. |
| | |
| Fee waiver and expense reimbursement | | Contractual arrangements have been made with TAM through May 1, 2017 to waive fees and/or reimburse fund expenses to the extent that the total operating expenses exceed: • 0.80% for Transamerica Partners Government Money Market; and • 0.50% for Transamerica Partners Institutional Government Money Market. | | Contractual arrangements have been made with TAM through May 1, 2018 to waive fees and/or reimburse fund expenses to the extent that the Destination Fund’s total operating expenses exceed: • 0.80% for Class R shares; • 0.50% for Class R4 shares; and • 0.30% for Class I3 shares. |
- 39 -
| | | | |
| | |
| | The expense limitation excludes, as applicable, acquired fund fees and expenses, interest, taxes, brokerage commissions, dividend and interest expenses on securities sold short, extraordinary expenses and other expenses not incurred in the ordinary course of the fund’s business. These arrangements cannot be terminated prior to May 1, 2017 without the Board of Trustees’ consent. TAM has agreed to waive fees and reimburse expenses to limit the total operating expenses of Transamerica Partners Government Money Market Portfolio to 0.30%. This arrangement is voluntary and may be terminated by TAM at any time. | | The expense limitation excludes, as applicable, acquired fund fees and expenses, interest, taxes, brokerage commissions, dividend and interest expenses on securities sold short, extraordinary expenses and other expenses not incurred in the ordinary course of the fund’s business. These arrangements cannot be terminated prior to May 1, 2018 without the Board of Trustees’ consent. TAM is entitled to reimbursement by the Destination Fund of fees waived or expenses reduced during any of the previous 36 months if on any day or month the estimated annualized fund operating expenses are less than the cap. |
| |
| Gross and net expenses | | For a comparison of the gross and net expenses of the Funds, please see the class fee tables in the “The Funds’ Fees and Expenses” section. |
| 1 | Transamerica Partners Government Money Market and Transamerica Partners Institutional Government Money Market are feeder funds and invest in securities through Transamerica Partners Government Money Market Portfolio, an underlying master fund having the same investment goals and strategies. |
Comparison of Principal Risks of Investing in the Funds
Because the Funds have the same investment objective and substantially principal investment strategies, they are subject to substantially similar principal risks. Risk is inherent in all investing. The value of your investment in a Fund, as well as the amount of return you receive on your investment, may fluctuate significantly from day to day and over time. You may lose part or all of your investment in a Fund or your investment may not perform as well as other similar investments.
An investment in a Fund is not a bank deposit and is not insured or guaranteed by the Federal Deposit Insurance Corporation (“FDIC”) or any other government agency. Although each Fund seeks to preserve the value of your investment at $1.00 per share, it is possible to lose money by investing in the Fund.
You should be aware that money market funds have, in the past, “broken the buck,” which means that investors did not receive $1.00 per share for their investment in those funds, and this could happen again. If a money market fund breaks the buck or if money market funds are perceived to be likely to do so, there could be significant redemptions from money market funds, driving market prices of securities down and making it more difficult for a Fund to maintain a $1.00 per share net asset value.
You should also be aware that TAM and its affiliates are under no obligation to provide financial support to a Fund or take other measures to ensure that you do not lose money on your investment in a Fund. You should not invest in a Fund with the expectation that any such action will be taken.
As a government money market fund, each Fund is not required to impose a fee upon sale of your shares (liquidity fees) or temporarily suspend your ability to sell shares if the Fund’s liquidity falls below required minimums (redemption gates), and has no current intention to voluntarily impose such liquidity fees or redemption gates. However, the Board of each Fund reserves the right to impose liquidity fees and/or redemption gates in the future.
- 40 -
There is no assurance that a Fund will meet its investment objective. Each Fund could underperform short-term debt instruments or other money market funds, or you could lose money, as a result of risks (in alphabetical order) such as:
Credit – An issuer or other obligor (such as a party providing insurance or other credit enhancement) of a security held by the fund or a counterparty to a financial contract with the fund may default or its credit may be downgraded, or the value of assets underlying a security may decline.
Interest Rate – The interest rates on short-term obligations held in the fund will vary, rising or falling with short-term interest rates generally. Interest rates in the United States have recently been at historically low levels. The fund’s yield will tend to lag behind general changes in interest rates. The ability of the fund’s yield to reflect current market rates will depend on how quickly the obligations in its portfolio mature and how much money is available for investment at current market rates. A general rise in interest rates may cause investors to move out of fixed income securities on a large scale, which could adversely affect the price and liquidity of fixed income securities and could also result in increased redemptions from the fund.
Legal and Regulatory – Legal and regulatory changes could occur that may adversely affect the fund, its investments, and its ability to pursue its investment strategies and/or increase the costs of implementing such strategies. Certain changes have already been proposed and additional changes are expected. New or revised laws or regulations may be imposed by the U.S. Securities and Exchange Commission, the U.S. Commodity Futures Trading Commission, the Internal Revenue Service, the U.S. Federal Reserve or other governmental regulatory authorities or self-regulatory organizations that could adversely affect the fund. The fund also may be adversely affected by changes in the enforcement or interpretation of existing statutes and rules by governmental regulatory authorities or self-regulatory organizations.
Liquidity – The fund may make investments that are illiquid or that become illiquid after purchase. Investments may become illiquid due to the lack of an active market, a reduced number of traditional market participants, or reduced capacity of traditional market participants to make a market in securities. The liquidity and value of investments can deteriorate rapidly and those investments may be difficult or impossible for the fund to sell, particularly during times of market turmoil. These illiquid investments can be difficult to value. If the fund is forced to sell an illiquid investment to meet redemption requests or other cash needs, the fund may be forced to sell at a loss. The fund may not receive its proceeds from the sale of certain securities for an extended period (for example, several weeks or even longer).
Management – The fund is subject to the risk that the Investment Manager’s or sub-adviser’s judgments and decisions may be incorrect or otherwise may not produce the desired results. The sub-adviser’s judgment about the quality, relative yield or value of, or market trends affecting, a particular security or issuer, industry or sector, or about the economy or interest rates, may be incorrect. The fund is also subject to the risk of imperfections, errors or limitations in the tools, resources, information and data used, or the analyses employed or relied on, by the sub-adviser, or if the sub-adviser’s investment style fails to produce the desired results. The fund’s investment strategies designed by the investment manager may not work as intended. In addition, the fund’s investment strategies or policies may change from time to time. Those changes may not lead to the results intended by the investment manager and could have an adverse effect on the performance of the fund. Any of these things could cause the fund to lag relevant benchmarks or other funds with similar objectives.
Market – A change in interest rates or a decline in the market value of a fund investment, lack of liquidity in the bond markets, real or perceived adverse economic or political conditions, inflation, or other market events could cause the value of your investment in the fund, or its yield, to decline.
In the past several years financial markets, such as those in the United States, Europe, Asia and elsewhere, have experienced increased volatility, depressed valuations, decreased liquidity and heightened uncertainty. These market conditions may continue, worsen or spread.
- 41 -
The U.S. government and the Federal Reserve, as well as certain foreign governments and central banks, have taken steps to support financial markets, including keeping interest rates at historically low levels. This and other government intervention may not work as intended, particularly if the efforts are perceived by investors as being unlikely to achieve the desired results. The Federal Reserve recently has reduced its market support activities. Further reduction or withdrawal of Federal Reserve or other U.S. or non-U.S. governmental or central bank support, including interest rate increases, could negatively affect financial markets generally, increase market volatility and reduce the value and liquidity of securities in which the fund invests.
Policy and legislative changes in the United States and in other countries are affecting many aspects of financial regulation, and may in some instances contribute to decreased liquidity and increased volatility in the financial markets. The impact of these changes on the markets, and the practical implications for market participants, may not be fully known for some time.
Economies and financial markets throughout the world are becoming increasingly interconnected. As a result, whether or not the fund invests in securities of issuers located in or with significant exposure to countries experiencing economic and financial difficulties, the value and liquidity of the fund’s investments may be negatively affected.
Money Market Fund Reform – The fund operates as a “government” money market fund under new federal regulations. The fund continues to use the special pricing and valuation conventions that currently facilitate a stable share price of $1.00, although there is no guarantee that the fund will be able to maintain a $1.00 share price. The fund does not currently intend to avail itself of the ability to impose “liquidity fees” and/or “gates” on fund redemptions, as permitted under the new regulations. However, the Board reserves the right, with notice to shareholders, to change this policy, thereby permitting the fund to impose such fees and gates in the future.
Mortgage-Related Securities – The value of mortgage-related securities will be influenced by factors affecting the housing market. As a result, during periods of declining asset values, difficult or frozen credit markets, swings in interest rates, or deteriorating economic conditions, mortgage-related securities may decline in value, face valuation difficulties, become more volatile and/or become illiquid. Mortgage-backed securities may be issued by government-sponsored entities such as Fannie Mae or Freddie Mac or by agencies of the U.S. government, such as Ginnie Mae. Mortgage-backed securities represent direct or indirect participations in, or are collateralized by and payable from, mortgage loans secured by real property. The value of mortgage-backed securities may be affected by changes in credit quality or value of the mortgage loans. Mortgage-backed securities are subject to prepayment or call and extension risks. Some of these securities may receive little or no collateral protection from the underlying assets. The structure of some of these securities may be complex and there may be less information available than for other types of debt securities. Upon the occurrence of certain triggering events or defaults, the fund may become the holder of underlying assets at a time when those assets may be difficult to sell or may be sold only at a loss.
Redemption – The fund may experience periods of heavy redemptions that could cause the fund to liquidate its assets at inopportune times or at a loss or depressed value particularly during periods of declining or illiquid markets. Redemption risk is greater to the extent that the fund has investors with large shareholdings, short investment horizons, or unpredictable cash flow needs. The redemption by one or more large shareholders oftheir holdings in the fund could have an adverse impact on the remaining shareholders in the fund. In addition, the fund may suspend redemptions when permitted by applicable regulations.
Repurchase Agreements – If the other party to a repurchase agreement defaults on its obligation, the fund may suffer delays and incur costs or lose money in exercising its rights under the agreement. If the seller fails to repurchase the security and the market value declines, the fund could lose money. If the seller becomes insolvent and subject to liquidation or reorganization under applicable bankruptcy or other laws, the fund’s ability to dispose of the underlying securities may be restricted.
Underlying Government Money Market Funds – The underlying masterfund may invest in other government money market funds. Each of the underlying government money market funds in which the portfolio may invest
- 42 -
has its own investment risks. There can be no assurance that the investment objective of any underlying government money market fund will be achieved. In addition, the underlying master fund will bear a pro rata portion of the operating expenses of the underlying government money market funds in which it invests.
U.S. Government Agency Obligations – Government agency obligations have different levels of credit support and, therefore, different degrees of credit risk. Securities issued by agencies and instrumentalities of the U.S. government that are supported by the full faith and credit of the U.S. generally present a lesser degree of credit risk than securities issued by agencies and instrumentalities sponsored by the U.S. government that are supported only by the issuer’s right to borrow from the U.S. Treasury and securities issued by agencies and instrumentalities sponsored by the U.S. government that are supported only by the credit of the issuing agencies.
Yield – The amount of income received by the fund will go up or down depending on day-to-day variations in short-term interest rates, and when interest rates are very low the fund’s expenses could absorb all or a significant portion of the fund’s income. If interest rates increase, the fund’s yield may not increase proportionately. For example, Transamerica Asset Management, Inc. (“TAM” or the “Investment Manager”) or any of its affiliates may voluntarily waive fees or reimburse expenses of one or more classes of the fund in order to avoid a negative yield, and TAM or its affiliates may discontinue any temporary voluntary fee limitation or recoup expenses previously foregone or reimbursed. There is no guarantee that the fund will be able to avoid a negative yield. In addition, the recent adoption of more stringent regulations governing the management of money market funds could have a negative effect on yields.
The Target Funds are subject to the following related principal risks:
Counterparty – The fund will be subject to credit risk (meaning the risk of adverse changes in an issuer’s real or perceived financial strength) with respect to counterparties to derivatives, repurchase agreements and other financial contracts entered into by the fund or held by special purpose or structured vehicles. Adverse changes to counterparties may cause the value of financial contracts to go down. If a counterparty becomes bankrupt or otherwise fails to perform its obligations due to financial difficulties, the value of your investment in the fund may decline.
Fixed-Income Securities – The market prices of fixed-income securities may go up or down, sometimes rapidly and unpredictably, due to general market conditions, such as real or perceived adverse economic or political conditions, inflation, changes in interest rates, lack of liquidity in the bond markets or adverse investor sentiment. In addition, the market value of a fixed income security may decline if the issuer or other obligor of the security fails to pay principal and/or interest, otherwise defaults or has its credit rating downgraded or is perceived to be less creditworthy, or the credit quality or value of any underlying assets declines. When market prices fall, the value of your investment will go down. The value of your investment will generally go down when interest rates rise. Interest rates have been at historically low levels, so the fund faces a heightened risk that interest rates may rise. A rise in rates tends to have a greater impact on the prices of longer term or duration securities.
Prepayment or Call – Many issuers have a right to prepay their securities. If interest rates fall, an issuer may exercise this right. If this happens, the fund will not benefit from the rise in market price that normally accompanies a decline in interest rates, and will be forced to reinvest prepayment proceeds at a time when yields on securities available in the market are lower than the yield on the prepaid security. The fund also may lose any premium it paid on the security.
The Funds’ Past Performance
Set forth below is performance information for each Fund. The bar charts and tables below provide some indication of the risks of investing in each Fund by showing you how the performance of the Target Funds and Class A shares of the Destination Fund has varied from year to year for 10 years or since inception, as applicable, and how the average total returns of each Target Fund and the applicable class of shares of the Destination Fund for different periods compare to the returns of one or more broad measures of market performance. The performance shown below for Transamerica Partners Government Money Market Portfolio reflects only master portfolio level
- 43 -
expenses, and does not include the expenses of any of the applicable Non-Mutual Fund Feeder Funds. If those expenses were reflected, the performance would be lower. Absent any applicable limitation of or cap on the Funds’ expenses, performance would have been lower. No performance information is presented for the Class R, Class R4 and Class I3 shares of the Destination Fund because those share classes are newly offered. Class R, Class R4 and Class I3 shares of the Destination Fund would have different performance because they have different expenses. A Fund’s past performance (before and after taxes) is not necessarily an indication of how the Fund will perform in the future. Following the Reorganizations, Transamerica Government Money Market will be the surviving fund for performance purposes.
Prior to May 1, 2013, the Target Funds had a different sub-adviser and used different investment strategies. The performance set forth below for the Target Funds prior to that date is attributable to the previous sub-adviser.
Prior to May 1, 2016, the Target Funds and the Destination Fund each operated as a “prime” money market fund and invested in certain types of securities that each Fund is no longer permitted to hold. Consequently, the performance information below for each Fund might have been different if the current investment limitations had been in effect prior to each Fund’s conversion to a government money market fund.
Transamerica Partners Government Money Market Annual Returns
Annual Total Returns (calendar years ended December 31)
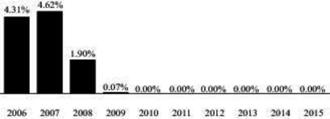
| | | | | | | | |
| | | Quarter Ended | | | Return | |
Best Quarter: | | | 9/30/2007 | | | | 1.15 | % |
Worst Quarter: | | | 9/30/2009 | | | | 0.00 | % |
Year-to-date return as of September 30, 2016: 0.00%
Transamerica Partners Government Money Market Average Annual Total Returns
Average Annual Total Returns (periods ended December 31, 2015)
| | | | | | | | | | | | | | | | |
| | | 1 Year | | | 5 Years | | | 10 Years | | | Inception Date | |
Transamerica Partners Government Money Market | | | 0.00 | % | | | 0.00 | % | | | 1.08 | % | | | 01/04/1994 | |
Citigroup 3-Month Treasury Bill Index (reflects no deduction for fees, expenses or taxes) | | | 0.03 | % | | | 0.05 | % | | | 1.17 | % | | | | |
- 44 -
Transamerica Partners Institutional Government Money Market Annual Returns
Annual Total Returns (calendar years ended December 31)
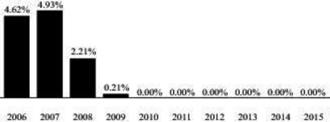
| | | | | | | | |
| | | Quarter Ended | | | Return | |
Best Quarter: | | | 9/30/2007 | | | | 1.23 | % |
Worst Quarter: | | | 12/31/2009 | | | | 0.00 | % |
Year-to-date return as of September 30, 2016: 0.00%
Transamerica Partners Institutional Government Money Market Average Annual Total Returns
Average Annual Total Returns (periods ended December 31, 2015)
| | | | | | | | | | | | | | | | |
| | | 1 Year | | | 5 Years | | | 10 Years | | | Inception Date | |
Transamerica Partners Institutional Government Money Market | | | 0.00 | % | | | 0.00 | % | | | 1.18 | % | | | 09/11/2000 | |
Citigroup 3-Month Treasury Bill Index (reflects no deduction for fees, expenses or taxes) | | | 0.03 | % | | | 0.05 | % | | | 1.17 | % | | | | |
Transamerica Partners Government Money Market Portfolio Annual Returns
Annual Total Returns (calendar years ended December 31)
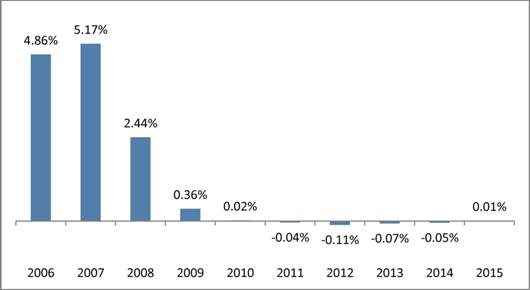
- 45 -
The highest and lowest quarterly returns for the periods reflected in the table above are:
| | | | | | | | |
| | | Quarter Ended | | | Return | |
Best Quarter: | | | 9/30/2007 | | | | 1.28 | % |
Worst Quarter: | | | 3/31/2012 | | | | -0.03 | % |
Year-to-date return as of September 30, 2016: 0.15%
Transamerica Partners Government Money Market Portfolio Average Annual Total Returns
(for periods ended 12/31/2015)
| | | | | | | | | | | | | | | | |
| | | 1 Year | | | 5 Years | | | 10 Years | | | Inception Date | |
Transamerica Partners Government Money Market Portfolio | | | 0.01 | % | | | -0.05 | % | | | 1.24 | % | | | 08/01/1993 | |
Citigroup 3-Month Treasury Bill Index (reflects no deduction for fees, expenses or taxes) | | | 0.03 | % | | | 0.05 | % | | | 1.17 | % | | | | |
Transamerica Government Money Market Annual Returns
Annual Total Returns (calendar years ended December 31) - Class A
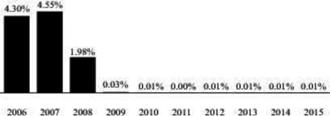
7-DAY YIELD (as of December 31, 2015)
Class A = 0.01%
| | | | | | | | |
| | | Quarter Ended | | | Return | |
Best Quarter: | | | 09/30/2007 | | | | 1.15 | % |
Worst Quarter: | | | 03/31/2013 | | | | 0.00 | % |
Year-to-date return as of September 30, 2016: 0.00%
Transamerica Government Money Market Average Annual Total Returns
Average Annual Total Returns (periods ended December 31, 2015)
| | | | | | | | | | | | | | | | |
Return before taxes | | 1 Year | | | 5 Years | | | 10 Years | | | Inception Date | |
Class A | | | 0.01 | % | | | 0.01 | % | | | 1.08 | % | | | 03/01/2002 | |
The after-tax returns are calculated using the historic highest individual federal marginal income tax rates and do not reflect the impact of state and local taxes. Actual after-tax returns may depend on the investor’s individual tax situation and may differ from those shown. After-tax returns may not be relevant if the investment is made through a tax-exempt or tax-deferred account, such as a 401(k) plan.
The Funds’ Fees and Expenses
Shareholders of the Target Funds and the Destination Fund pay various fees and expenses, either directly or indirectly. The tables below show the fees and expenses that you would pay if you were to buy and hold shares of each Fund. The fees and expenses in the tables appearing below are based on the expenses of the Funds for the twelve-month period ended June 30, 2016. The tables also show the pro forma expenses of the combined Destination Fund after giving effect to all Group 2 Reorganizations based on pro forma net assets as of June 30, 2016. Pro forma numbers are estimated in good faith and are hypothetical. Actual expenses may vary significantly.
- 46 -
The fees and expenses shown in the table and Example below for Transamerica Partners Government Money Market Portfolio reflect only master portfolio level fees and expenses, and do not include the fees and expenses of any of the applicable Non-Mutual Fund Feeder Funds. For financial statement purposes, Transamerica Government Money Market will be the accounting survivor of the Reorganizations. As the accounting survivor, Transamerica Government Money Market’s operating history will be used for financial reporting purposes.
Transamerica Partners Government Money Market
| | | | | | | | | | | | |
| | | Transamerica
Partners
Government
Money Market1 | | | Transamerica
Government
Money Market | | | Combined
Transamerica
Government
Money
Market
(Pro Forma) | |
| | | | | | Class R | | | Class R | |
Shareholder Fees (fees paid directly from your investment) | | | | | | | | | | | | |
Maximum sales charge (load) imposed on purchases (as a % of offering price) | | | None | | | | None | | | | None | |
Maximum deferred sales charge (load) (as a % of offering price) | | | None | | | | None | | | | None | |
Redemption fee (as a % of amount redeemed) | | | None | | | | None | | | | None | |
| | | |
Annual Fund Operating Expenses (expenses that you pay each year as a % of the value of your investment) | | | | | | | | | | | | |
Management fees2 | | | 0.25% | | | | 0.28% | | | | 0.28% | |
Distribution and service (12b-1) fees | | | 0.25% | | | | 0.50% | | | | 0.50% | |
Other expenses3 | | | 0.36% | | | | 0.06%4 | | | | 0.06%4 | |
Total annual fund operating expenses | | | 0.86% | | | | 0.84% | | | | 0.84% | |
Fee waiver and/or expense reimbursement | | | 0.06%5 | | | | 0.04%6 | | | | 0.04%6 | |
Total annual fund operating expenses after fee waiver and/or expense reimbursement | | | 0.80% | | | | 0.80% | | | | 0.80% | |
Transamerica Partners Institutional Government Money Market
| | | | | | | | | | | | |
| | | Transamerica
Partners
Institutional
Government
Money Market1 | | | Transamerica
Government
Money Market | | | Combined
Transamerica
Government
Money
Market
(Pro Forma) | |
| | | | | | Class R4 | | | Class R4 | |
Shareholder Fees (fees paid directly from your investment) | | | | | | | | | | | | |
Maximum sales charge (load) imposed on purchases (as a % of offering price) | | | None | | | | None | | | | None | |
Maximum deferred sales charge (load) (as a % of offering price) | | | None | | | | None | | | | None | |
Redemption fee (as a % of amount redeemed) | | | None | | | | None | | | | None | |
| | | |
Annual Fund Operating Expenses (expenses that you pay each year as a % of the value of your investment) | | | | | | | | | | | | |
Management fees2 | | | 0.25% | | | | 0.28% | | | | 0.28% | |
Distribution and service (12b-1) fees | | | 0.25% | | | | 0.25% | | | | 0.25% | |
Other expenses3 | | | 0.13% | | | | 0.06%4 | | | | 0.06%4 | |
Total annual fund operating expenses | | | 0.63% | | | | 0.59% | | | | 0.59% | |
Fee waiver and/or expense reimbursement | | | 0.13%7 | | | | 0.09%6 | | | | 0.09%6 | |
Total annual fund operating expenses after fee waiver and/or expense reimbursement | | | 0.50% | | | | 0.50% | | | | 0.50% | |
- 47 -
Transamerica Partners Government Money Market Portfolio
| | | | | | | | | | | | |
| | | Transamerica
Partners
Government
Money Market
Portfolio | | | Transamerica
Government
Money Market | | | Combined
Transamerica
Government
Money Market
(Pro Forma) | |
| | | | | | Class I3 | | | Class I3 | |
Shareholder Fees (fees paid directly from your investment) | | | | | | | | | | | | |
Maximum sales charge (load) imposed on purchases (as a % of offering price) | | | None | | | | None | | | | None | |
Maximum deferred sales charge (load) (as a % of offering price) | | | None | | | | None | | | | None | |
Redemption fee (as a % of amount redeemed) | | | None | | | | None | | | | None | |
| | | |
Annual Fund Operating Expenses (expenses that you pay each year as a % of the value of your investment) | | | | | | | | | | | | |
Management fees2 | | | 0.25% | | | | 0.28% | | | | 0.28% | |
Distribution and service (12b-1) fees | | | None | | | | None | | | | None | |
Other expenses3 | | | 0.03% | | | | 0.06%4 | | | | 0.06%4 | |
Total annual fund operating expenses | | | 0.28% | | | | 0.34% | | | | 0.34% | |
Fee waiver and/or expense reimbursement | | | N/A | | | | 0.04%6 | | | | 0.04%6 | |
Total annual fund operating expenses after fee waiver and/or expense reimbursement | | | 0.28% | | | | 0.30% | | | | 0.30% | |
| 1 | The Target Feeder Fund invests in securities through an underlying Target Master Portfolio, Transamerica Partners Government Money Market Portfolio. The information in this table and in the Example below concerning the Target Feeder Fund reflects the direct fees and expenses of the Target Feeder Fund and its allocated share of the fees and expenses of the Target Master Portfolio. |
| 2 | The Destination Fund receives investment advisory and administrative services under one agreement with the Destination Fund’s investment manager, Transamerica Asset Management, Inc. (“TAM”), and pays a single management fee to TAM. Transamerica Partners Government Money Market and Transamerica Partners Institutional Government Money Market receive investment advisory and administrative services from TAM under separate agreements and pay separate advisory fees and administrative services fees to TAM. The administrative services fees of 0.30% for Transamerica Partners Government Money Market and 0.05% for Transamerica Partners Institutional Government Money Market are included in “Other expenses.” Transamerica Partners Government Money Market Portfolio receives investment advisory services from TAM and pays advisory fees to TAM. Transamerica Partners Government Money Market Portfolio pays no separate administrative services fees. |
| 3 | Other expenses do not include the costs of the Reorganization to be borne by the Target Funds and the Destination Fund. These costs are considered extraordinary expenses and are not covered by the applicable expense limitation arrangements. The basis point impact of such costs is 0.00% for Transamerica Partners Government Money Market, 0.01% for Transamerica Partners Institutional Government Money Market, 0.00% for Transamerica Partners Government Money Market Portfolio and 0.00% for Transamerica Government Money Market. |
| 4 | Other expenses are based on estimates for the current fiscal year. Actual expenses may differ from estimates. |
| 5 | Contractual arrangements have been made with TAM through May 1, 2017 to waive fees and/or reimburse fund expenses to the extent that the fund’s total operating expenses exceed 0.80%, excluding, as applicable, acquired fund fees and expenses, interest, taxes, brokerage commissions, dividend and interest expenses on securities sold short, extraordinary expenses and other expenses not incurred in the ordinary course of the fund’s business. |
| 6 | Contractual arrangements have been made with TAM through May 1, 2018 to waive fees and/or reimburse fund expenses to the extent that the fund’s total operating expenses exceed 0.80% for Class R shares, 0.50% for Class R4 shares and 0.30% for Class I3 shares, excluding, as applicable, acquired fund fees and expenses, interest, taxes, brokerage commissions, dividend and interest expenses on securities sold short, extraordinary expenses and other expenses not incurred in the ordinary course of the fund’s business. These arrangements cannot be terminated prior to May 1, 2018 without the Board of Trustees’ consent. TAM is entitled to reimbursement by the fund of fees waived or expenses reduced during any of the previous 36 months if on any day or month the estimated annualized fund operating expenses are less than the cap. |
- 48 -
| 7 | Contractual arrangements have been made with TAM through May 1, 2017 to waive fees and/or reimburse fund expenses to the extent that the fund’s total operating expenses exceed 0.50%, excluding, as applicable, acquired fund fees and expenses, interest, taxes, brokerage commissions, dividend and interest expenses on securities sold short, extraordinary expenses and other expenses not incurred in the ordinary course of the fund’s business. |
The hypothetical examples below help you compare the cost of investing in each Fund. Each example assumes that:
| | • | | you invest $10,000 in each Fund; |
| | • | | you reinvest all dividends and distributions without a sales charge; |
| | • | | your investment has a 5% annual return (this assumption is required by the SEC and is not a prediction of the Fund’s future performance); and |
| | • | | each Fund’s operating expenses remain the same. |
Each example also assumes no fees for IRA accounts, if applicable. Costs are the same whether you redeem at the end of any period or not. Pro forma expenses are included assuming the consummation of all Group 1 Reorganizations. The examples are for comparison purposes only and do not represent the Funds’ actual expenses or returns, either past or future. Because actual return and expenses will be different, the examples are for comparison only.
Transamerica Partners Government Money Market
| | | | | | | | | | | | |
Number of years
you own your shares | | Transamerica
Partners
Government
Money Market | | | Transamerica
Government
Money Market | | | Combined
Transamerica
Government Money
Market
(Pro Forma) | |
| | | | | | Class R | | | Class R | |
Year 1 | | $ | 82 | | | $ | 82 | | | $ | 82 | |
Year 3 | | $ | 268 | | | $ | 264 | | | $ | 264 | |
Year 5 | | $ | 471 | | | $ | 462 | | | $ | 462 | |
Year 10 | | $ | 1,055 | | | $ | 1,033 | | | $ | 1,033 | |
Transamerica Partners Institutional Government Money Market
| | | | | | | | | | | | |
Number of years
you own your shares | | Transamerica
Partners
Institutional
Government
Money Market | | | Transamerica
Government
Money Market | | | Combined
Transamerica
Government Money
Market
(Pro Forma) | |
| | | | | | Class R4 | | | Class R4 | |
Year 1 | | $ | 51 | | | $ | 51 | | | $ | 51 | |
Year 3 | | $ | 189 | | | $ | 180 | | | $ | 180 | |
Year 5 | | $ | 338 | | | $ | 320 | | | $ | 320 | |
Year 10 | | $ | 774 | | | $ | 729 | | | $ | 729 | |
Transamerica Partners Government Money Market Portfolio
| | | | | | | | | | | | |
Number of years
you own your shares | | Transamerica
Partners
Government
Money Market
Portfolio | | | Transamerica
Government
Money Market | | | Combined
Transamerica
Government Money
Market
(Pro Forma) | |
| | | | | | Class I3 | | | Class I3 | |
Year 1 | | $ | 29 | | | $ | 31 | | | $ | 31 | |
Year 3 | | $ | 90 | | | $ | 105 | | | $ | 105 | |
Year 5 | | $ | 157 | | | $ | 187 | | | $ | 187 | |
Year 10 | | $ | 356 | | | $ | 427 | | | $ | 427 | |
- 49 -
CAPITALIZATION
The following tables set forth the capitalization of each Target Fund and the Destination Fund as of September 30, 2016 and the pro forma combined capitalization of the combined Destination Fund as if the Reorganizations had occurred on that date. If the Reorganizations are consummated, the actual exchange ratios on the closing date may vary from the exchange ratios used in the computation below. This is due to changes in the market value of the portfolio securities of the Funds between September 30, 2016 and the closing date, changes in the amount of undistributed net investment income and net realized capital gains of the Funds during that period resulting from income and distributions, and changes in the accrued liabilities of the Funds during the same period.
Transamerica Partners Government Money Market Funds
| | | | | | | | | | | | |
| | | Transamerica
Partners
Government
Money Market | | | Transamerica
Partners
Institutional
Government Money
Market | | | Transamerica
Partners
Government Money
Market Portfolio | |
Net Assets | | $ | 575,122,039 | | | $ | 221,323,744 | | | $ | 133,076,647 | |
| | | |
Net Asset Value Per Share | | $ | 1.00 | | | $ | 1.00 | | | $ | 1.00 | |
| | | |
Shares Outstanding | | | 575,122,036 | | | | 221,323,745 | | | | 133,076,647 | |
Transamerica Government Money Market
| | | | | | | | |
| | | Transamerica
Government
Money Market | | | Transamerica
Government Money
Market
Pro Forma | |
Net Assets | | | | | | | | |
Class A | | $ | 184,607,451 | | | $ | 184,607,451 | |
Class B | | $ | 1,433,349 | | | $ | 1,433,349 | |
Class C | | $ | 23,617,178 | | | $ | 23,617,178 | |
Class I | | $ | 21,082,437 | | | $ | 21,082,437 | |
Class I2 | | $ | 11,324,791 | | | $ | 11,324,791 | |
Class R | | | — | | | $ | 575,122,039 | |
Class R4 | | | — | | | $ | 221,323,744 | |
Class I3 | | | — | | | $ | 133,023,617 | |
Net Asset Value Per Share | | | | | | | | |
Class A | | $ | 1.00 | | | $ | 1.00 | |
Class B | | $ | 1.00 | | | $ | 1.00 | |
Class C | | $ | 1.00 | | | $ | 1.00 | |
Class I | | $ | 1.00 | | | $ | 1.00 | |
Class I2 | | $ | 1.00 | | | $ | 1.00 | |
Class R | | $ | 1.00 | | | $ | 1.00 | |
- 50 -
| | | | | | | | |
| | | Transamerica
Government
Money Market | | | Transamerica
Government Money
Market
Pro Forma | |
Class R4 | | $ | 1.00 | | | $ | 1.00 | |
Class I3 | | $ | 1.00 | | | $ | 1.00 | |
Shares Outstanding | | | | | | | | |
Class A | | | 184,607,156 | | | | 184,607,156 | |
Class B | | | 1,433,020 | | | | 1,433,020 | |
Class C | | | 23,613,667 | | | | 23,613,667 | |
Class I | | | 21,083,222 | | | | 21,083,222 | |
Class I2 | | | 1,324,406 | | | | 11,324,406 | |
Class R | | | — | | | | 575,122,039 | |
Class R4 | | | — | | | | 221,323,744 | |
Class I3 | | | — | | | | 133,076,647 | |
It is impossible to predict with any certainty how many shares of the Destination Fund will actually be received and distributed by a Target Fund on the closing date. The foregoing table should not be relied upon to determine the amount of Destination Fund shares that will actually be received and distributed.
ADDITIONAL INFORMATION
For information relating to each Fund and its Reorganization, including tax capital loss carryforwards, the tax status of the Reorganization, a comparison of the fundamental investment policies of the Funds, how to buy, sell or exchange Fund shares, how each Fund values its securities, financial highlights information for each Fund and ownership of shares of the Funds, please see the sections immediately following the discussion of the Group 9 Reorganizations.
TARGET FUND BOARD’S EVALUATION AND RECOMMENDATION
With respect to each Target Fund, the Board of the Target Fund, including its Independent Trustees, after careful consideration, unanimously determined that the Reorganization is in the best interest of the Target Fund and will not dilute the interests of the existing holders of the Target Fund. Each Board made this determination based on various factors, which include those that are discussed in the section entitled “Reasons for the Proposed Reorganizations” in the back of this Proxy Statement/Prospectus following the discussion of the proposals.
Similarly, the Board of the Destination Fund, including all its Independent Trustees, has approved the Reorganization with respect to the Destination Fund. The Board has determined that the Reorganization is in the best interest of the Destination Fund and that the interests of the Destination Fund’s holders will not be diluted as a result of the Reorganization.
THE BOARD OF YOUR TARGET FUND RECOMMENDS THAT YOU VOTE “FOR” PROPOSAL 2A, 2B OR 2C, AS APPLICABLE, TO APPROVE THE PLAN.
- 51 -
GROUP 3 - HIGH YIELD BOND FUNDS
TRANSAMERICA PARTNERS HIGH YIELD BOND
TRANSAMERICA PARTNERS INSTITUTIONAL HIGH YIELD BOND
TRANSAMERICA PARTNERS HIGH YIELD BOND PORTFOLIO
(each, a “Target Fund” and together, the “Target Funds”)
AND
TRANSAMERICA HIGH YIELD BOND
(the “Destination Fund”)
PROPOSALS 3A, 3B AND 3C
APPROVAL OF AGREEMENT AND PLAN OF REORGANIZATION
SUMMARY
The following is a summary of more complete information appearing later in this Proxy Statement/Prospectus or incorporated herein. You should read carefully the entire Proxy Statement/Prospectus, including the form of Plan attached as Exhibit A, which includes additional information that is not included in the summary and is a part of this Proxy Statement/Prospectus. For a discussion of the terms of the Plan, please see the section entitled “Terms of Each Agreement and Plan of Reorganization” in the back of this Proxy Statement/Prospectus, after the discussion of the proposals.
In each proposed Reorganization, the Target Fund would be reorganized into the Destination Fund, with that Target Fund receiving shares of the applicable class of the Destination Fund as shown in the following table. The Target Funds, which operate in a master-feeder structure, do not have share classes.
| | | | |
Proposal | | Target Fund | | Destination Fund and Shares |
Proposal 3A | | Transamerica Partners High Yield Bond | | Transamerica High Yield Bond
Class R |
Proposal 3B | | Transamerica Partners Institutional High Yield Bond | | Transamerica High Yield Bond
Class R4 |
Proposal 3C | | Transamerica Partners High Yield Bond Portfolio | | Transamerica High Yield Bond
Class I3 |
Transamerica Partners High Yield Bond would reorganize first, Transamerica Partners Institutional High Yield Bond would reorganize next and Transamerica Partners High Yield Bond Portfolio would reorganize last. All Reorganizations would occur on the same closing date.
The Target Funds and the Destination Fund are managed by Transamerica Asset Management, Inc. (“TAM”) and have substantially similar investment objectives, the same principal investment strategies and substantially similar related risks. The tables below provide a comparison of certain features of the Funds. Unless otherwise noted, the information is the same for each Target Fund. In the tables below, if a row extends across the entire table, the information applies to the Destination Fund and the Target Funds.
Comparison of Target Funds and Destination Fund
| | | | |
| | | Target Funds | | Destination Fund |
| Investment objective | | Seeks to provide a high level of current income. | | Seeks a high level of current income by investing in high-yield debt securities. |
| |
Principal investment
strategies1 | | The fund’s sub-adviser, Aegon USA Investment Management, LLC (the “sub-adviser”), seeks to achieve the fund’s objective by investing, under normal circumstances, at least 80% of the fund’s net assets (plus the amount of borrowings, if any, for investment purposes) in high-yield bonds (commonly known as “junk bonds”). The fund normally invests primarily in U.S. securities. |
- 52 -
| | | | |
| | Junk bonds are high-risk debt securities rated below investment grade (that is, securities rated below BBB by Standard & Poor’s or Fitch or below Baa by Moody’s or, if unrated, determined to be of comparable quality by the fund’s sub-adviser). The sub-adviser’s strategy is to seek to achieve high returns for the fund while maintaining a reasonable risk profile. In managing the fund’s assets, the sub-adviser uses a combination of a global “top down” analysis of the macroeconomic and interest rate environment and proprietary “bottom up” research of corporate and sovereign debt, stressed and distressed securities, and other debt instruments. In the sub-adviser’s qualitative “top down” approach, the sub-adviser analyzes various fundamental, technical, sentiment, and valuation factors that affect the movement of the markets and securities prices worldwide. This “top-down” analysis assists the sub-adviser in analyzing fund risk and allocating assets among sectors, industries, and credit quality categories. In its proprietary “bottom up” research, the sub-adviser considers various fundamental and other factors, such as creditworthiness and capital structure. The fund has no maturity or duration requirements or limitations. The fund may invest in foreign securities, including up to 10% of its net asset in emerging market securities. To a lesser extent, the fund may invest in investment grade bonds, bank loans, asset backed and mortgage backed securities, preferred equity securities, common equity securities (received in connection with exchanges or restructurings) and cash equivalents. |
| |
| Investment manager | | TAM |
| |
| Sub-adviser | | Aegon USA Investment Management, LLC |
| | |
| Portfolio managers | | Kevin Bakker, CFA: Portfolio Manager of the Target Funds since 2014; Portfolio Manager with Aegon USA Investment Management, LLC since 2007; Senior Research Analyst 2003 – 2007 Benjamin D. Miller, CFA: Portfolio Manager of the Target Funds since 2014; Portfolio Manager with Aegon USA Investment Management, LLC since 2006; Research Analyst 1993 – 2006 James K. Schaeffer, Jr.: Portfolio Manager of the Target Funds since 2014; Portfolio Manager with Aegon USA Investment Management, LLC since 2004; Director of Distressed Debt since 2004 Derek Thomas: Portfolio Manager of the Target Funds since 2016; Portfolio Manager with Aegon USA Investment Management, LLC since 2013. U.S. and Global High Yield Portfolio Manager and Trader. Prior to joining AUIM, Commodities Trader for Archer Daniels Midland Company from 2002 – 2007 | | Kevin Bakker, CFA: Portfolio Manager of the Destination Fund since 2007; Portfolio Manager with Aegon USA Investment Management, LLC since 2007; Senior Research Analyst 2003 – 2007 Benjamin D. Miller, CFA: Portfolio Manager of the Destination Fund since 2006; Portfolio Manager with Aegon USA Investment Management, LLC since 2006; Research Analyst 1993 – 2006 James K. Schaeffer, Jr.: Portfolio Manager of the Destination Fund since 2011; Portfolio Manager with Aegon USA Investment Management, LLC since 2004; Director of Distressed Debt since 2004 Derek Thomas: Portfolio Manager of the Destination Fund since 2016; Portfolio Manager with Aegon USA Investment Management, LLC since 2013. U.S. and Global High Yield Portfolio Manager and Trader. Prior to joining AUIM, Commodities Trader for Archer Daniels Midland Company from 2002 – 2007 |
| | |
| Business | | Transamerica Partners High Yield Bond is a diversified series of TPFG, an open-end management investment company organized as a Massachusetts business trust. Transamerica Partners Institutional High Yield Bond is a diversified series of TPFG II, an open-end management investment company organized as a Massachusetts business trust. Transamerica Partners High Yield Bond Portfolio is a diversified series of TPP, an open-end management investment company and a trust governed by New York law. | | The Destination Fund is a diversified series of the Destination Trust, an open-end management investment company organized as a Delaware statutory trust. |
- 53 -
| | | | |
Net assets (as of
June 30, 2016) | | Transamerica Partners High Yield Bond = $116,990,610 Transamerica Partners Institutional High Yield Bond = $333,597,280 Transamerica Partners High Yield Bond Portfolio (excluding the Target Feeder Funds) = $792,530,838 | | $1,046,311,508 |
| | |
| Management fees | | TAM receives compensation for investment advisory services from the Target Funds at an annual rate of 0.55%. TAM also receives compensation for administrative services from Transamerica Partners High Yield Bond and Transamerica Partners Institutional High Yield Bond at annual rates of 0.30% and 0.05%, respectively. Transamerica Partners High Yield Bond Portfolio pays no separate administrative services fees. The applicable fee(s) are based upon average daily net assets and are accrued daily and paid monthly. | | TAM receives compensation for investment management services, which include investment advisory and administrative services, from the Destination Fund at annual rates 0.58% of the first $1.25 billion; 0.555% over $1.25 billion up to $2 billion; and 0.53% in excess of $2 billion. The fee is based upon average daily net assets and is accrued daily and paid monthly. |
| | |
Distribution and service
(12b-1) fees | | Transamerica Partners High Yield Bond is subject to a distribution and service (12b-1) fee of up to 0.25% of average daily net assets. Transamerica Partners Institutional High Yield Bond is subject to a distribution and service (12b-1) fee of up to 0.25% of average daily net assets. Transamerica Partners High Yield Bond Portfolio is not subject to a distribution and service (12b-1) fee. | | Class R shares of the Destination Fund are subject to a distribution and service (12b-1) fee of up to 0.50% of average daily net assets. Class R4 shares of the Destination Fund are subject to a distribution and service (12b-1) fee of up to 0.25% of average daily net assets. Class I3 shares of the Destination Fund are not subject to a distribution and service (12b-1) fee. |
| | |
| Sales charges | | Shares of the Target Funds are offered without a sales charge and are not subject to a contingent deferred sales charge. | | Class R, Class R4, and Class I3 shares of the Destination Fund are offered without a sales charge and are not subject to a contingent deferred sales charge. |
- 54 -
| | | | |
Fee waiver and expense
reimbursement | | Contractual arrangements have been made with TAM through May 1, 2017 to waive fees and/or reimburse fund expenses to the extent that the total operating expenses exceed: • 1.10% for Transamerica Partners High Yield Bond; and • 0.85% for Transamerica Partners Institutional High Yield Bond. The expense limitation excludes, as applicable, acquired fund fees and expenses, interest, taxes, brokerage commissions, dividend and interest expenses on securities sold short, extraordinary expenses and other expenses not incurred in the ordinary course of the fund’s business. These arrangements cannot be terminated prior to May 1, 2017 without the Board of Trustees’ consent. TAM has agreed to waive fees and reimburse expenses to limit the total operating expenses of Transamerica Partners High Yield Bond Portfolio to 0.60%. This arrangement is voluntary and may be terminated by TAM at any time. | | Contractual arrangements have been made with TAM through May 1, 2018 to waive fees and/or reimburse fund expenses to the extent that the Destination Fund’s total operating expenses exceed: • 1.10% for Class R shares; • 0.85% for Class R4 shares; and • 0.60% for Class I3 shares. The expense limitation excludes, as applicable, acquired fund fees and expenses, interest, taxes, brokerage commissions, dividend and interest expenses on securities sold short, extraordinary expenses and other expenses not incurred in the ordinary course of the fund’s business. These arrangements cannot be terminated prior to May 1, 2018 without the Board of Trustees’ consent. TAM is entitled to reimbursement by the Destination Fund of fees waived or expenses reduced during any of the previous 36 months if on any day or month the estimated annualized fund operating expenses are less than the cap. |
| |
Gross and net
expenses | | For a comparison of the gross and net expenses of the Funds, please see the class fee tables in the “The Funds’ Fees and Expenses” section. |
| 1 | Transamerica Partners High Yield Bond and Transamerica Partners Institutional High Yield Bond are feeder funds and invest in securities through Transamerica Partners High Yield Bond Portfolio, an underlying master fund having the same investment goals and strategies. |
Comparison of Principal Risks of Investing in the Funds
Because the Funds have similar investment objectives and principal investment strategies, they are subject to similar principal risks. Risk is inherent in all investing. The value of your investment in a Fund, as well as the amount of return you receive on your investment, may fluctuate significantly from day to day and over time. You may lose part or all of your investment in a Fund or your investment may not perform as well as other similar investments.
Each Fund is subject to the following principal risks (in alphabetical order) of investing in the Fund:
Active Trading – The fund is actively managed and may purchase and sell securities without regard to the length of time held. Active trading may have a negative impact on performance by increasing transaction costs and may generate greater amounts of net short-term capital gains, which, for shareholders holding shares in taxable accounts, would generally be subject to tax at ordinary income tax rates upon distribution.
Bank Obligations – To the extent the fund invests in bank obligations, the fund will be more susceptible to negative events affecting the banking industry. Banks are sensitive to changes money market and general economic conditions. Banks are highly regulated. Decisions by regulators may limit the loans banks make and the interest rates and fees they charge, and may reduce bank profitability.
Counterparty – The fund will be subject to credit risk (meaning the risk of adverse changes in an issuer’s real or perceived financial strength) with respect to counterparties to derivatives, repurchase agreements and other financial contracts entered into by the fund or held by special purpose or structured vehicles. Adverse changes to counterparties may cause the value of financial contracts to go down. If a counterparty becomes bankrupt or otherwise fails to perform its obligations due to financial difficulties, the value of your investment in the fund may decline.
Credit – If an issuer or other obligor (such as a party providing insurance or other credit enhancement) of a security held by the fund or a counterparty to a financial contract with the fund defaults or is downgraded, or is perceived to be less creditworthy, or if the value of any underlying assets declines, the value of your investment will typically decline. Below investment grade, high-yield debt securities (commonly known as “junk” bonds) have a higher risk of default and are considered speculative. Subordinated securities are more likely to suffer a credit loss than non-subordinated securities of the same issuer and will be disproportionately affected by a default, downgrade or perceived decline in creditworthiness.
Currency – The value of investments in securities denominated in foreign currencies increases or decreases as the rates of exchange between those currencies and the U.S. dollar change. Currency conversion costs and currency
- 55 -
fluctuations could reduce or eliminate investment gains or add to investment losses. Currency exchange rates can be volatile, and are affected by factors such as general economic conditions, the actions of the U.S. and foreign governments or central banks, the imposition of currency controls, and speculation.
Distressed or Defaulted Securities – Investments in defaulted securities and obligations of distressed issuers, including securities that are, or may be, involved in reorganizations or other financial restructurings, either out of court or in bankruptcy, involve substantial risks and are considered speculative. The fund may suffer significant losses if the reorganization or restructuring is not completed as anticipated. The fund will generally not receive interest payments on the distressed securities and may incur costs to protect its investment. Repayment of defaulted securities and obligations of distressed issuers is subject to significant uncertainties.
Emerging Markets – Investments in the securities of issuers located in or principally doing business in emerging markets are subject to foreign investments risks. These risks are greater for investments in issuers in emerging market countries. Emerging market countries tend to have economic, political and legal systems that are less fully developed and are less stable than those of more developed countries. Emerging market securities are often particularly sensitive to market movements because their market prices tend to reflect speculative expectations. Low trading volumes may result in a lack of liquidity and in extreme price volatility.
Equity Securities – Equity securities represent an ownership interest in an issuer, rank junior in a company’s capital structure and consequently may entail greater risk of loss than debt securities. Equity securities include common and preferred stocks. Stock markets are volatile. The price of equity securities fluctuates based on changes in a company’s financial condition and overall market and economic conditions. If the market prices of the equity securities owned by the fund fall, the value of your investment in the fund will decline.
Extension – When interest rates rise, repayments of fixed income securities, particularly asset- and mortgage-backed securities, may occur more slowly than anticipated, extending the effective duration of these fixed income securities at below market interest rates and causing their market prices to decline more than they would have declined due to the rise in interest rates alone. This may cause the fund’s share price to be more volatile.
Fixed-Income Securities – The market prices of fixed-income securities may go up or down, sometimes rapidly and unpredictably, due to general market conditions, such as real or perceived adverse economic or political conditions, inflation, changes in interest rates, lack of liquidity in the bond markets or adverse investor sentiment. In addition, the market value of a fixed income security may decline if the issuer or other obligor of the security fails to pay principal and/or interest, otherwise defaults or has its credit rating downgraded or is perceived to be less creditworthy, or the credit quality or value of any underlying assets declines. When market prices fall, the value of your investment will go down. The value of your investment will generally go down when interest rates rise. Interest rates have been at historically low levels, so the fund faces a heightened risk that interest rates may rise. A rise in rates tends to have a greater impact on the prices of longer term or duration securities.
Foreign Investments – Investing in securities of foreign issuers or issuers with significant exposure to foreign markets involves additional risk. Foreign countries in which the fund may invest may have markets that are less liquid, less regulated and more volatile than U.S. markets. The value of the fund’s investments may decline because of factors affecting the particular issuer as well as foreign markets and issuers generally, such as unfavorable or unsuccessful government actions, reduction of government or central bank support, political or financial instability or other adverse economic or political developments. Lack of information and weaker accounting standards also may affect the value of these securities.
High-Yield Debt Securities – High-yield debt securities, commonly referred to as “junk” bonds, are securities that are rated below “investment grade” or, if unrated, determined to be below investment grade by the sub-adviser. Changes in interest rates, the market’s perception of the issuers and the creditworthiness of the issuers may significantly affect the value of these bonds. Junk bonds are considered speculative, have a higher risk of default, tend to be less liquid and may be more difficult to value than higher grade securities. Junk bonds tend to be volatile and more susceptible to adverse events and negative sentiments.
- 56 -
Interest Rate – Interest rates in the U.S. have been at historically low levels, so the fund faces a heightened risk that interest rates may rise. The value of fixed income securities generally goes down when interest rates rise, and therefore the value of your investment in the fund may also go down. Debt securities have varying levels of sensitivity to changes in interest rates. A rise in rates tends to have a greater impact on the prices of longer term or duration securities. A general rise in interest rates may cause investors to move out of fixed income securities on a large scale, which could adversely affect the price and liquidity of fixed income securities and could also result in increased redemptions from the fund.
Legal and Regulatory – Legal and regulatory changes could occur that may adversely affect the fund, its investments, and its ability to pursue its investment strategies and/or increase the costs of implementing such strategies. Certain changes have already been proposed and additional changes are expected. New or revised laws or regulations may be imposed by the U.S. Securities and Exchange Commission, the U.S. Commodity Futures Trading Commission, the Internal Revenue Service, the U.S. Federal Reserve or other governmental regulatory authorities or self-regulatory organizations that could adversely affect the fund. The fund also may be adversely affected by changes in the enforcement or interpretation of existing statutes and rules by governmental regulatory authorities or self-regulatory organizations.
Liquidity – The fund may make investments that are illiquid or that become illiquid after purchase. Investments may become illiquid due to the lack of an active market, a reduced number of traditional market participants, or reduced capacity of traditional market participants to make a market in securities. The liquidity and value of investments can deteriorate rapidly and those investments may be difficult or impossible for the fund to sell, particularly during times of market turmoil. These illiquid investments can be difficult to value. If the fund is forced to sell an illiquid investment to meet redemption requests or other cash needs, the fund may be forced to sell at a loss. The fund may not receive its proceeds from the sale of certain securities for an extended period (for example, several weeks or even longer).
Loans – Loans are subject to the credit risk of nonpayment of principal or interest. Economic downturns or increases in interest rates may cause an increase in defaults, interest rate risk and liquidity risk. Loans may or may not be collateralized at the time of acquisition, and any collateral may be relatively illiquid or lose all or substantially all of its value subsequent to investment. In the event of bankruptcy of a borrower, the fund could experience delays or limitations with respect to its ability to realize the benefits of any collateral securing a loan. Junior loans, which have a lower place in the borrower’s capital structure than senior loans and may be unsecured, involve a higher degree of overall risk than senior loans of the same borrower. The fund’s investments in loans are also subject to prepayment or call risk. Loans may have settlement periods in excess of seven days. Failure to receive sales proceeds on a timely basis may constrain the fund’s ability to meet its obligations (including obligations to redeeming shareholders).
Market – The market prices of the fund’s securities may go up or down, sometimes rapidly or unpredictably, due to general market conditions, such as real or perceived adverse economic or political conditions, inflation, changes in interest rates or currency rates, lack of liquidity in the markets or adverse investor sentiment. Adverse market conditions may be prolonged and may not have the same impact on all types of securities. Market prices of securities also may go down due to events or conditions that affect particular sectors, industries or issuers. When market prices fall, the value of your investment will go down. The fund may experience a substantial or complete loss on any individual security.
In the past several years, financial markets, such as those in the United States, Europe, Asia and elsewhere, have experienced increased volatility, depressed valuations, decreased liquidity and heightened uncertainty. Governmental and non-governmental issuers defaulted on, or were forced to restructure, their debts. These market conditions may continue, worsen or spread.
The U.S. government and the Federal Reserve, as well as certain foreign governments and central banks have taken steps to support financial markets, including keeping interest rates at historically low levels. This and other
- 57 -
government intervention may not work as intended, particularly if the efforts are perceived by investors as being unlikely to achieve the desired results. The Federal Reserve recently has reduced its market support activities. Further reduction or withdrawal of Federal Reserve or other U.S. or non-U.S. governmental or central bank support, including interest rate increases, could negatively affect financial markets generally, increase market volatility and reduce the value and liquidity of securities in which the fund invests.
Policy and legislative changes in the United States and in other countries are affecting many aspects of financial regulation, and may in some instances contribute to decreased liquidity and increased volatility in the financial markets. The impact of these changes on the markets, and the practical implications for market participants, may not be fully known for some time.
Economies and financial markets throughout the world are becoming increasingly interconnected. As a result, whether or not the fund invests in securities of issuers located in or with significant exposure to countries experiencing economic and financial difficulties, the value and liquidity of the fund’s investments may be negatively affected.
Mortgage-Related and Asset-Backed Securities – The value of mortgage-related and asset-backed securities will be influenced by factors affecting the housing market and the assets underlying such securities. As a result, during periods of declining asset values, difficult or frozen credit markets, swings in interest rates, or deteriorating economic conditions, mortgage-related and asset-backed securities may decline in value, face valuation difficulties, become more volatile and/or become illiquid. Mortgage-backed securities may be issued by private issuers, by government-sponsored entities such as Fannie Mae or Freddie Mac or by agencies of the U.S. government, such as Ginnie Mae. Mortgage-backed securities represent direct or indirect participations in, or are collateralized by and payable from, mortgage loans secured by real property. Unlike mortgage-related securities issued or guaranteed by agencies of the U.S. government or government-sponsored entities, mortgage-related securities issued by private issuers do not have a government or government-sponsored entity guarantee (but may have other credit enhancement), and may, and frequently do, have less favorable collateral, credit risk or other underwriting characteristics. Asset-backed securities represent participations in, or are secured by and payable from, assets such as installment sales or loan contracts, leases, credit card receivables and other categories of receivables. The value of mortgage-backed and asset-backed securities may be affected by changes in credit quality or value of the mortgage loans or other assets that support the securities. Mortgage-backed and asset-backed securities are subject to prepayment or call and extension risks. Some of these securities may receive little or no collateral protection from the underlying assets. The risk of default is generally higher in the case of mortgage-backed investments that include so-called “sub-prime” mortgages. The structure of some of these securities may be complex and there may be less information available than for other types of debt securities. Upon the occurrence of certain triggering events or defaults, the fund may become the holder of underlying assets at a time when those assets may be difficult to sell or may be sold only at a loss.
Preferred Stock – Preferred stock’s right to dividends and liquidation proceeds is junior to the rights of a company’s debt securities. The value of preferred stock may be subject to factors that affect fixed income and equity securities, including changes in interest rates and in a company’s creditworthiness. The value of preferred stock tends to vary more with fluctuations in the underlying common stock and less with fluctuations in interest rates and tends to exhibit greater volatility. Shareholders of preferred stock may suffer a loss of value if dividends are not paid and have limited voting rights.
Prepayment or Call – Many issuers have a right to prepay their securities. If interest rates fall, an issuer may exercise this right. If this happens, the fund will not benefit from the rise in market price that normally accompanies a decline in interest rates, and will be forced to reinvest prepayment proceeds at a time when yields on securities available in the market are lower than the yield on the prepaid security. The fund also may lose any premium it paid on the security.
Sovereign Debt – Sovereign debt instruments are subject to the risk that the governmental entity may delay or fail to pay interest or repay principal on its sovereign debt. If a governmental entity defaults, it may ask for more time
- 58 -
in which to pay or for further loans. There may be no established legal process for collecting sovereign debt that a government does not pay, nor are there bankruptcy proceedings through which all or part of the sovereign debt that a governmental entity has not repaid may be collected.
Valuation – The sales price the fund could receive for any particular portfolio investment may differ from the fund’s valuation of the investment, particularly for securities that trade in thin or volatile markets, that are priced based upon valuations provided by third-party pricing services that use matrix or evaluated pricing systems, or that are valued using a fair value methodology. The fund’s ability to value its investments may be impacted by technological issues and/or errors by pricing services or other third party service providers.
Each Fund is subject to similar management related risks. The Target Funds are subject to the following related principal risk:
Management – The fund is subject to the risk that the Investment Manager’s or sub-adviser’s judgments and decisions may be incorrect or otherwise may not produce the desired results. The value of your investment may decrease if the sub-adviser’s judgment about the quality, relative yield or value of, or market trends affecting, a particular security or issuer, industry, sector, region or market segment, or about the economy or interest rates, is incorrect. The fund may also suffer losses if there are imperfections, errors or limitations in the tools, resources, information and data used, or the analyses employed or relied on, by the sub-adviser, or if the sub-adviser’s investment style is out of favor or otherwise fails to produce the desired results. The fund’s investment strategies designed by the investment manager may not work as intended. In addition, the fund’s investment strategies or policies may change from time to time. Those changes may not lead to the results intended by the investment manager and could have an adverse effect on the value or performance of the fund. Any of these things could cause the fund to lose value or its results to lag relevant benchmarks or other funds with similar objectives.
The Destination Fund is subject to the following related principal risks:
Manager – The fund is subject to the risk that the sub-adviser’s judgments and investment decisions, as well as the methods, tools, resources, information and data, and the analyses employed or relied on by the sub-adviser to make those judgments and decisions may be incorrect or otherwise may not produce the desired results. This could cause the fund to lose value or its results to lag relevant benchmarks or other funds with similar objectives.
Portfolio Management – The value of your investment may decrease if the sub-adviser’s judgment about the quality, relative yield, value or market trends affecting a particular security orissuer, industry, sector, region or market segment, or about the economy or interest rates is incorrect, or if there are imperfections, errors or limitations in the tools and data used by the sub-adviser or manager. In addition, the fund’s investment strategies or policies may change from time to time. Those changes may not lead to the results intended by the sub-adviser and could have an adverse effect on the value or performance of the fund.
The Funds’ Past Performance
Set forth below is performance information for each Fund. The bar charts and tables below provide some indication of the risks of investing in each Fund by showing you how the performance of the Target Funds and Class A shares of the Destination Fund has varied from year to year for 10 years or since inception, as applicable, and how the average total returns of each Target Fund and the applicable class of shares of the Destination Fund for different periods compare to the returns of one or more broad measures of market performance. The performance shown below for Transamerica Partners High Yield Bond Portfolio reflects only master portfolio level expenses, and does not include the expenses of any of the applicable Non-Mutual Fund Feeder Funds. If those expenses were reflected, the performance would be lower. Absent any applicable limitation of or cap on the Funds’ expenses, performance would have been lower. No performance information is presented for the Class R, Class R4 and Class I3 shares of the Destination Fund because those share classes are newly offered. Class R, Class R4 and Class I3 shares of the Destination Fund would have different performance because they have different expenses. A Fund’s past performance (before and after taxes) is not necessarily an indication of how the Fund will perform in the future.
- 59 -
Following the Reorganizations, Transamerica High Yield Bond will be the surviving fund for performance purposes.
Prior to May 1, 2014, the Target Funds had a different sub-adviser and used different investment strategies. The performance set forth below for the Target Funds prior to that date is attributable to the previous sub-adviser.
Transamerica Partners High Yield Bond Annual Returns
Annual Total Returns (calendar years ended December 31)

| | | | | | | | |
| | | Quarter Ended | | | Return | |
Best Quarter: | | | 6/30/2009 | | | | 23.07 | % |
Worst Quarter: | | | 12/31/2008 | | | | -21.98 | % |
Year-to-date return as of September 30, 2016: 12.94%
Transamerica Partners High Yield Bond Average Annual Total Returns
Average Annual Total Returns (periods ended December 31, 2015)
| | | | | | | | | | | | | | | | |
| | | 1 Year | | | 5 Years | | | 10 Years | | | Inception Date | |
Transamerica Partners High Yield Bond | | | -4.67 | % | | | 4.59 | % | | | 6.06 | % | | | 01/30/1996 | |
BofA Merrill Lynch High Yield Master II Index (reflects no deduction for fees, expenses or taxes) | | | -4.64 | % | | | 4.84 | % | | | 6.81 | % | | | | |
Transamerica Partners Institutional High Yield Bond Annual Returns
Annual Total Returns (calendar years ended December 31)
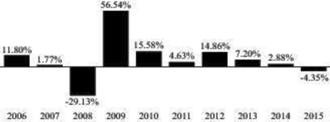
| | | | | | | | |
| | | Quarter Ended | | | Return | |
Best Quarter: | | | 6/30/2009 | | | | 23.09 | % |
Worst Quarter: | | | 12/31/2008 | | | | -21.90 | % |
Year-to-date return as of September 30, 2016: 13.06%
- 60 -
Transamerica Partners Institutional High Yield Bond Average Annual Total Returns
Average Annual Total Returns (periods ended December 31, 2015)
| | | | | | | | | | | | | | | | |
| | | 1 Year | | | 5 Years | | | 10 Years | | | Inception Date | |
Transamerica Partners Institutional High Yield Bond | | | -4.35 | % | | | 4.86 | % | | | 6.34 | % | | | 09/11/2000 | |
BofA Merrill Lynch High Yield Master II Index (reflects no deduction for fees, expenses or taxes) | | | -4.64 | % | | | 4.84 | % | | | 6.81 | % | | | | |
Transamerica Partners High Yield Bond Portfolio Annual Returns
Annual Total Returns (calendar years ended December 31)
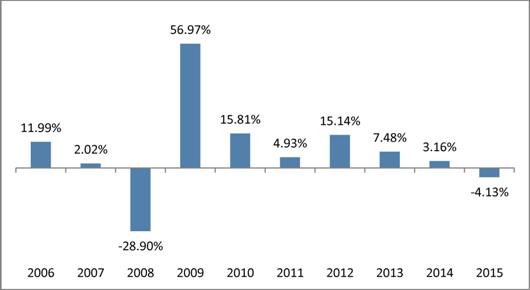
The highest and lowest quarterly returns for the periods reflected in the table above are:
| | | | | | | | |
| | | Quarter Ended | | | Return | |
Best Quarter: | | | 6/30/2009 | | | | 23.22 | % |
Worst Quarter: | | | 12/31/2008 | | | | -21.87 | % |
Year-to-date return as of September 30, 2016: 19.99%
Transamerica Partners High Yield Bond Portfolio Average Annual Total Returns (for periods ended 12/31/2015)
| | | | | | | | | | | | | | | | |
| | | 1 Year | | | 5 Years | | | 10 Years | | | Inception
Date | |
Transamerica Partners High Yield Bond Portfolio | | | -4.13 | % | | | 5.13 | % | | | 6.61 | % | | | 07/01/2000 | |
BofA Merrill Lynch High Yield Master II Index (reflects no deduction for fees, expenses or taxes) | | | -4.64 | % | | | 4.84 | % | | | 6.81 | % | | | | |
- 61 -
Transamerica High Yield Bond Annual Returns
Annual Total Returns (calendar years ended December 31) - Class A

| | | | | | | | |
| | | Quarter Ended | | | Return | |
Best Quarter: | | | 06/30/2009 | | | | 22.80 | % |
Worst Quarter: | | | 12/31/2008 | | | | -16.73 | % |
Year-to-date return as of September 30, 2016: 12.56%
Transamerica High Yield Bond Average Annual Total Returns
Average Annual Total Returns (periods ended December 31, 2015)
| | | | | | | | | | | | | | | | |
| | | 1 Year | | | 5 Years | | | 10 Years | | | Inception
Date | |
Class A | | | | | | | | | | | | | | | 06/14/1985 | |
Return before taxes | | | -9.23 | % | | | 3.95 | % | | | 6.00 | % | | | | |
Return after taxes on distributions | | | -11.34 | % | | | 1.44 | % | | | 3.32 | % | | | | |
Return after taxes on distributions and sale of fund shares | | | -5.14 | % | | | 2.06 | % | | | 3.56 | % | | | | |
Barclays U.S. Corporate High Yield 2% Issuer Capped Index (reflects no deduction for fees, expenses or taxes) | | | -4.43 | % | | | 5.03 | % | | | 6.95 | % | | | | |
The after-tax returns are calculated using the historic highest individual federal marginal income tax rates and do not reflect the impact of state and local taxes. Actual after-tax returns may depend on the investor’s individual tax situation and may differ from those shown. After-tax returns may not be relevant if the investment is made through a tax-exempt or tax-deferred account, such as a 401(k) plan.
The Funds’ Fees and Expenses
Shareholders of the Target Funds and the Destination Fund pay various fees and expenses, either directly or indirectly. The tables below show the fees and expenses that you would pay if you were to buy and hold shares of each Fund. The fees and expenses in the tables appearing below are based on the expenses of the Funds for the twelve-month period ended June 30, 2016. The tables also show the pro forma expenses of the combined Destination Fund after giving effect to all Group 3 Reorganizations based on pro forma net assets as of June 30, 2016. Pro forma numbers are estimated in good faith and are hypothetical. Actual expenses may vary significantly. The fees and expenses shown in the table and Example below for Transamerica Partners High Yield Bond Portfolio reflect only master portfolio level fees and expenses, and do not include the fees and expenses of any of the applicable Non-Mutual Fund Feeder Funds. For financial statement purposes, Transamerica High Yield Bond will be the accounting survivor of the Reorganizations. As the accounting survivor, Transamerica High Yield Bond’s operating history will be used for financial reporting purposes.
- 62 -
Transamerica Partners High Yield Bond
| | | | | | | | | | | | |
| | | Transamerica
Partners High
Yield Bond1 | | | Transamerica
High Yield
Bond | | | Combined
Transamerica
High Yield
Bond
(Pro Forma) | |
| | | | | | Class R | | | Class R | |
Shareholder Fees (fees paid directly from your investment) | | | | | | | | | | | | |
Maximum sales charge (load) imposed on purchases (as a % of offering price) | | | None | | | | None | | | | None | |
Maximum deferred sales charge (load) (as a % of offering price) | | | None | | | | None | | | | None | |
Redemption fee (as a % of amount redeemed) | | | None | | | | None | | | | None | |
| | | |
Annual Fund Operating Expenses (expenses that you pay each year as a % of the value of your investment) | | | | | | | | | | | | |
Management fees2 | | | 0.55 | % | | | 0.57 | % | | | 0.57 | % |
Distribution and service (12b-1) fees | | | 0.25 | % | | | 0.50 | % | | | 0.50 | % |
Other expenses3 | | | 0.38 | % | | | 0.04 | %4 | | | 0.04 | %4 |
Total annual fund operating expenses | | | 1.18 | % | | | 1.11 | % | | | 1.11 | % |
Fee waiver and/or expense reimbursement | | | 0.08 | %5 | | | 0.01 | %6 | | | 0.01 | %6 |
Total annual fund operating expenses after fee waiver and/or expense reimbursement | | | 1.10 | % | | | 1.10 | % | | | 1.10 | % |
Transamerica Partners Institutional High Yield Bond
| | | | | | | | | | | | |
| | | Transamerica
Partners
Institutional
High Yield
Bond1 | | | Transamerica
High Yield
Bond | | | Combined
Transamerica
High Yield
Bond
(Pro Forma) | |
| | | | | | Class R4 | | | Class R4 | |
Shareholder Fees (fees paid directly from your investment) | | | | | | | | | | | | |
Maximum sales charge (load) imposed on purchases (as a % of offering price) | | | None | | | | None | | | | None | |
Maximum deferred sales charge (load) (as a % of offering price) | | | None | | | | None | | | | None | |
Redemption fee (as a % of amount redeemed) | | | None | | | | None | | | | None | |
| | | |
Annual Fund Operating Expenses (expenses that you pay each year as a % of the value of your investment) | | | | | | | | | | | | |
Management fees2 | | | 0.55 | % | | | 0.57 | % | | | 0.57 | % |
Distribution and service (12b-1) fees | | | 0.25 | % | | | 0.25 | % | | | 0.25 | % |
Other expenses3 | | | 0.11 | % | | | 0.04 | %4 | | | 0.04 | %4 |
Total annual fund operating expenses | | | 0.91 | % | | | 0.86 | % | | | 0.86 | % |
Fee waiver and/or expense reimbursement | | | 0.06 | %7 | | | 0.01 | %6 | | | 0.01 | %6 |
Total annual fund operating expenses after fee waiver and/or expense reimbursement | | | 0.85 | % | | | 0.85 | % | | | 0.85 | % |
- 63 -
Transamerica Partners High Yield Bond Portfolio
| | | | | | | | | | | | |
| | | Transamerica
Partners High
Yield Bond
Portfolio | | | Transamerica
High Yield
Bond | | | Combined
Transamerica
High Yield
Bond
(Pro Forma) | |
| | | | | | Class I3 | | | Class I3 | |
Shareholder Fees (fees paid directly from your investment) | | | | | | | | | | | | |
Maximum sales charge (load) imposed on purchases (as a % of offering price) | | | None | | | | None | | | | None | |
Maximum deferred sales charge (load) (as a % of offering price) | | | None | | | | None | | | | None | |
Redemption fee (as a % of amount redeemed) | | | None | | | | None | | | | None | |
| | | |
Annual Fund Operating Expenses (expenses that you pay each year as a % of the value of your investment) | | | | | | | | | | | | |
Management fees2 | | | 0.55 | % | | | 0.57 | % | | | 0.57 | % |
Distribution and service (12b-1) fees | | | None | | | | None | | | | None | |
Other expenses3 | | | 0.02 | % | | | 0.04 | %4 | | | 0.04 | %4 |
Total annual fund operating expenses | | | 0.57 | % | | | 0.61 | % | | | 0.61 | % |
Fee waiver and/or expense reimbursement | | | N/A | | | | 0.01 | %6 | | | 0.01 | %6 |
Total annual fund operating expenses after fee waiver and/or expense reimbursement | | | 0.57 | % | | | 0.60 | % | | | 0.60 | % |
| 1 | The Target Feeder Fund invests in securities through an underlying Target Master Portfolio, Transamerica Partners High Yield Bond Portfolio. The information in this table and in the Example below concerning the Target Feeder Fund reflects the direct fees and expenses of the Target Feeder Fund and its allocated share of the fees and expenses of the Target Master Portfolio. |
| 2 | The Destination Fund receives investment advisory and administrative services under one agreement with the Destination Fund’s investment manager, Transamerica Asset Management, Inc. (“TAM”), and pays a single management fee to TAM. Transamerica Partners High Yield Bond and Transamerica Partners Institutional High Yield Bond receive investment advisory and administrative services from TAM under separate agreements and pay separate advisory fees and administrative services fees to TAM. The administrative services fees of 0.30% for Transamerica Partners High Yield Bond and 0.05% for Transamerica Partners Institutional High Yield Bond are included in “Other expenses.” Transamerica Partners High Yield Bond Portfolio receives investment advisory services from TAM and pays advisory fees to TAM. Transamerica Partners High Yield Bond Portfolio pays no separate administrative services fees. |
| 3 | Other expenses do not include the costs of the Reorganization to be borne by the Target Funds and the Destination Fund. These costs are considered extraordinary expenses and are not covered by the applicable expense limitation arrangements. The basis point impact of such costs is 0.00% for Transamerica Partners High Yield Bond, 0.00% for Transamerica Partners Institutional High Yield Bond, 0.00% for Transamerica Partners High Yield Bond Portfolio and 0.00% for Transamerica High Yield Bond. |
| 4 | Other expenses are based on estimates for the current fiscal year. Actual expenses may differ from estimates. |
| 5 | Contractual arrangements have been made with TAM through May 1, 2017 to waive fees and/or reimburse fund expenses to the extent that the fund’s total operating expenses exceed 1.10%, excluding, as applicable, acquired fund fees and expenses, interest, taxes, brokerage commissions, dividend and interest expenses on securities sold short, extraordinary expenses and other expenses not incurred in the ordinary course of the fund’s business. |
| 6 | Contractual arrangements have been made with TAM through May 1, 2018 to waive fees and/or reimburse fund expenses to the extent that the fund’s total operating expenses exceed 1.10% for Class R shares, 0.85% for Class R4 shares and 0.60% for Class I3 shares, excluding, as applicable, acquired fund fees and expenses, interest, taxes, brokerage commissions, dividend and interest expenses on securities sold short, extraordinary expenses and other expenses not incurred in the ordinary course of the fund’s business. These arrangements cannot be terminated prior to May 1, 2018 without the Board of Trustees’ consent. TAM is entitled to reimbursement by the fund of fees waived or expenses reduced during any of the previous 36 months if on any day or month the estimated annualized fund operating expenses are less than the cap. |
| 7 | Contractual arrangements have been made with TAM through May 1, 2017 to waive fees and/or reimburse fund expenses to the extent that the fund’s total operating expenses exceed 0.85%, excluding, as applicable, acquired fund fees and expenses, interest, taxes, brokerage commissions, dividend and interest expenses on securities sold short, extraordinary expenses and other expenses not incurred in the ordinary course of the fund’s business. |
The hypothetical examples below help you compare the cost of investing in each Fund. Each example assumes that:
| | • | | you invest $10,000 in each Fund; |
| | • | | you reinvest all dividends and distributions without a sales charge; |
- 64 -
| | • | | your investment has a 5% annual return (this assumption is required by the SEC and is not a prediction of the Fund’s future performance); and |
| | • | | each Fund’s operating expenses remain the same. |
Each example also assumes no fees for IRA accounts, if applicable. Costs are the same whether you redeem at the end of any period or not. Pro forma expenses are included assuming the consummation of all Group 1 Reorganizations. The examples are for comparison purposes only and do not represent the Funds’ actual expenses or returns, either past or future. Because actual return and expenses will be different, the examples are for comparison only.
Transamerica Partners High Yield Bond
| | | | | | | | | | | | |
Number of years
you own your shares | | Transamerica
Partners High
Yield Bond | | | Transamerica High
Yield Bond | | | Combined
Transamerica High
Yield Bond
(Pro Forma) | |
| | | | | | Class R | | | Class R | |
Year 1 | | $ | 112 | | | $ | 112 | | | $ | 112 | |
Year 3 | | $ | 367 | | | $ | 352 | | | $ | 352 | |
Year 5 | | $ | 641 | | | $ | 611 | | | $ | 611 | |
Year 10 | | $ | 1,425 | | | $ | 1,351 | | | $ | 1,351 | |
Transamerica Partners Institutional High Yield Bond
| | | | | | | | | | | | |
Number of years
you own your shares | | Transamerica
Partners
Institutional High
Yield Bond | | | Transamerica High
Yield Bond | | | Combined
Transamerica High
Yield Bond
(Pro Forma) | |
| | | | | | Class R4 | | | Class R4 | |
Year 1 | | $ | 87 | | | $ | 87 | | | $ | 87 | |
Year 3 | | $ | 284 | | | $ | 273 | | | $ | 273 | |
Year 5 | | $ | 498 | | | $ | 476 | | | $ | 476 | |
Year 10 | | $ | 1,114 | | | $ | 1,060 | | | $ | 1,060 | |
Transamerica Partners High Yield Bond Portfolio
| | | | | | | | | | | | |
Number of years
you own your shares | | Transamerica
Partners High
Yield Bond
Portfolio | | | Transamerica High
Yield Bond | | | Combined
Transamerica High
Yield Bond
(Pro Forma) | |
| | | | | | Class I3 | | | Class I3 | |
Year 1 | | $ | 58 | | | $ | 61 | | | $ | 61 | |
Year 3 | | $ | 183 | | | $ | 194 | | | $ | 194 | |
Year 5 | | $ | 318 | | | $ | 339 | | | $ | 339 | |
Year 10 | | $ | 714 | | | $ | 761 | | | $ | 761 | |
CAPITALIZATION
The following tables set forth the capitalization of each Target Fund and the Destination Fund as of September 30, 2016 and the pro forma combined capitalization of the combined Destination Fund as if the Reorganizations had occurred on that date. If the Reorganizations are consummated, the actual exchange ratios on the closing date may vary from the exchange ratios used in the computation below. This is due to changes in the market value of the portfolio securities of the Funds between September 30, 2016 and the closing date, changes in the amount of undistributed net investment income and net realized capital gains of the Funds during that period resulting from income and distributions, and changes in the accrued liabilities of the Funds during the same period.
- 65 -
Transamerica Partners High Yield Bond Funds
| | | | | | | | | | | | |
| | | Transamerica
Partners High
Yield Bond | | | Transamerica
Partners
Institutional High
Yield Bond | | | Transamerica
Partners High Yield
Bond Portfolio | |
Net Assets | | $ | 122,056,238 | | | $ | 354,031,090 | | | $ | 348,920,782 | |
| | | |
Net Asset Value Per Share | | $ | 8.57 | | | $ | 8.56 | | | $ | 9.18 | |
| | | |
Shares Outstanding | | | 14,242,730 | | | | 41,344,867 | | | | 38,008,800 | |
Transamerica High Yield Bond
| | | | | | | | |
| | | Transamerica
High Yield Bond | | | Transamerica High
Yield Bond
Pro Forma | |
Net Assets | | | | | | | | |
Class A | | $ | 115,473,754 | | | $ | 115,473,754 | |
Class B | | $ | 2,782,593 | | | $ | 2,782,593 | |
Class C | | $ | 52,769,588 | | | $ | 52,769,588 | |
Class I | | $ | 156,556,472 | | | $ | 156,556,472 | |
Class I2 | | $ | 966,026,575 | | | $ | 966,026,575 | |
Advisor Class | | | — | | | | — | |
Class R1 | | | — | | | | — | |
Class R6 | | $ | 3,672,148 | | | $ | 3,672,148 | |
Class R | | | — | | | $ | 122,056,238 | |
Class R4 | | | — | | | $ | 354,031,090 | |
Class I3 | | | — | | | $ | 348,831,293 | |
Net Asset Value Per Share | | | | | | | | |
Class A | | $ | 9.10 | | | $ | 9.10 | |
Class B | | $ | 9.10 | | | $ | 9.10 | |
Class C | | $ | 9.05 | | | $ | 9.05 | |
Class I | | $ | 9.16 | | | $ | 9.16 | |
Class I2 | | $ | 9.18 | | | $ | 9.18 | |
Advisor Class | | | — | | | | — | |
Class R1 | | | — | | | | — | |
Class R6 | | $ | 9.18 | | | $ | 9.18 | |
Class R | | $ | 9.18 | | | $ | 9.18 | |
Class R4 | | $ | 9.18 | | | $ | 9.18 | |
Class I3 | | $ | 9.18 | | | $ | 9.18 | |
Shares Outstanding | | | | | | | | |
Class A | | | 12,694,690 | | | | 12,694,690 | |
Class B | | | 305,696 | | | | 305,696 | |
Class C | | | 5,831,369 | | | | 5,831,369 | |
- 66 -
| | | | | | | | |
| | | Transamerica
High Yield Bond | | | Transamerica High
Yield Bond
Pro Forma | |
Class I | | | 17,084,538 | | | | 17,084,538 | |
Class I2 | | | 105,199,633 | | | | 105,199,633 | |
Advisor Class | | | — | | | | — | |
Class R1 | | | — | | | | — | |
Class R6 | | | 399,800 | | | | 399,800 | |
Class R | | | — | | | | 13,295,886 | |
Class R4 | | | — | | | | 38,565,478 | |
Class I3 | | | — | | | | 38,008,800 | |
It is impossible to predict with any certainty how many shares of the Destination Fund will actually be received and distributed by a Target Fund on the closing date. The foregoing table should not be relied upon to determine the amount of Destination Fund shares that will actually be received and distributed.
ADDITIONAL INFORMATION
For information relating to each Fund and its Reorganization, including tax capital loss carryforwards, the tax status of the Reorganization, a comparison of the fundamental investment policies of the Funds, how to buy, sell or exchange Fund shares, how each Fund values its securities, financial highlights information for each Fund and ownership of shares of the Funds, please see the sections immediately following the discussion of the Group 9 Reorganizations.
TARGET FUND BOARD’S EVALUATION AND RECOMMENDATION
With respect to each Target Fund, the Board of the Target Fund, including its Independent Trustees, after careful consideration, unanimously determined that the Reorganization is in the best interest of the Target Fund and will not dilute the interests of the existing holders of the Target Fund. Each Board made this determination based on various factors, which include those that are discussed in the section entitled “Reasons for the Proposed Reorganizations” in the back of this Proxy Statement/Prospectus following the discussion of the proposals.
Similarly, the Board of the Destination Fund, including all its Independent Trustees, has approved the Reorganization with respect to the Destination Fund. The Board has determined that the Reorganization is in the best interest of the Destination Fund and that the interests of the Destination Fund’s holders will not be diluted as a result of the Reorganization.
THE BOARD OF YOUR TARGET FUND RECOMMENDS THAT YOU VOTE “FOR” PROPOSAL 3A, 3B OR 3C, AS APPLICABLE, TO APPROVE THE PLAN.
- 67 -
GROUP 4 – INTERNATIONAL EQUITY FUNDS
TRANSAMERICA PARTNERS INTERNATIONAL EQUITY
TRANSAMERICA PARTNERS INSTITUTIONAL INTERNATIONAL EQUITY
TRANSAMERICA PARTNERS INTERNATIONAL EQUITY PORTFOLIO
(each, a “Target Fund” and together, the “Target Funds”)
AND
TRANSAMERICA INTERNATIONAL EQUITY
(the “Destination Fund”)
PROPOSALS 4A, 4B AND 4C
APPROVAL OF AGREEMENT AND PLAN OF REORGANIZATION
SUMMARY
The following is a summary of more complete information appearing later in this Proxy Statement/Prospectus or incorporated herein. You should read carefully the entire Proxy Statement/Prospectus, including the form of Plan attached as Exhibit A, which includes additional information that is not included in the summary and is a part of this Proxy Statement/Prospectus. For a discussion of the terms of the Plan, please see the section entitled “Terms of Each Agreement and Plan of Reorganization” in the back of this Proxy Statement/Prospectus, after the discussion of the proposals.
In each proposed Reorganization, the Target Fund would be reorganized into the Destination Fund, with that Target Fund receiving shares of the applicable class of the Destination Fund as shown in the following table. The Target Funds, which operate in a master-feeder structure, do not have share classes.
| | | | |
Proposal | | Target Fund | | Destination Fund and Shares |
Proposal 4A | | Transamerica Partners International Equity | | Transamerica International Equity
Class R |
| | |
Proposal 4B | | Transamerica Partners Institutional International Equity | | Transamerica International Equity
Class R4 |
| | |
Proposal 4C | | Transamerica Partners International Equity Portfolio | | Transamerica International Equity
Class I3 |
Transamerica Partners International Equity would reorganize first, Transamerica Partners Institutional International Equity would reorganize next and Transamerica Partners International Equity Portfolio would reorganize last. All Reorganizations would occur on the same closing date.
The Target Funds and the Destination Fund are managed by Transamerica Asset Management, Inc. (“TAM”) and have substantially similar investment objectives and substantially similar principal investment strategies and related risks. The tables below provide a comparison of certain features of the Funds. Unless otherwise noted, the information is the same for each Target Fund. In the tables below, if a row extends across the entire table, the information applies to the Destination Fund and the Target Funds.
Comparison of Target Funds and Destination Fund
| | | | |
| | | Target Funds | | Destination Fund |
| Investment objective | | Seeks long term capital appreciation. | | Seeks maximum long-term total return, consistent with reasonable risk to principal, by investing in a diversified portfolio of common stocks of primarily non-U.S. issuers. |
- 68 -
| | | | |
| | |
| Principal investment strategies1 | | Under normal circumstances, the fund invests at least 80% of its net assets (plus the amount of borrowings, if any, for investment purposes) in equity securities and other investments with similar economic characteristics. The fund’s sub-adviser, Thompson, Siegel & Walmsley LLC (the “sub-adviser”), currently anticipates investing in at least 12 countries other than the United States. The sub-adviser will emphasize established companies in individual foreign markets and will attempt to stress companies and markets that it believes are undervalued. The fund expects capital growth to be the predominant component of its total return. Generally, the fund will invest primarily in common stocks of companies listed on foreign securities exchanges, but it may also invest in depositary receipts including American Depositary Receipts (“ADRs”), Global Depositary Receipts (“GDRs”) and European Depositary Receipts (“EDRs”). Although the fund will emphasize larger, more seasoned or established companies, it may invest in companies of varying size as measured by assets, sales or market capitalization. The fund will invest primarily in securities of companies domiciled in developed countries, but may invest up to 30% of its assets in securities of companies in developing countries. It is expected that investments will be diversified through-out the world and within markets in an effort to minimize specific country and currency risks. The sub-adviser employs a relative value process utilizing a combination of quantitative and qualitative methods based on a four-factor valuation screen designed to outperform the MSCI All Country World ex-US. The sub-adviser’s analysts also perform rigorous fundamental analysis. A portfolio composed of approximately 120-160 stocks is selected as a result of this process. The sub-adviser generally limits its investment universe to those companies with a minimum of three years of operating history. The sub-adviser employs a consistent sell discipline which includes a significant negative earnings revision, a stock being sold when the catalyst is no longer valid or another stock presents a more attractive opportunity. | | Under normal circumstances, the fund seeks to achieve its investment objective by investing at least 80% of its net assets (plus the amount of borrowings, if any, for investment purposes) in equity securities of foreign companies representing at least three countries other than the United States. The fund’s sub-adviser, Thompson, Siegel & Walmsley LLC (the “sub-adviser”), currently anticipates investing in at least 12 countries other than the United States. The sub-adviser will emphasize established companies in individual foreign markets and will attempt to stress companies and markets that it believes are undervalued. The fund expects capital growth to be the predominant component of its total return. Generally, the fund will invest primarily in common stocks of companies listed on foreign securities exchanges, but it may also invest in depositary receipts including American Depositary Receipts (“ADRs”), Global Depositary Receipts (“GDRs”) and European Depositary Receipts (“EDRs”). Although the fund will emphasize larger, more seasoned or established companies, it may invest in companies of varying size as measured by assets, sales or market capitalization. The fund will invest primarily in securities of companies domiciled in developed countries, but may invest up to 10% of its assets in securities of companies in developing countries. It is expected that investments will be diversified through-out the world and within markets in an effort to minimize specific country and currency risks. The sub-adviser employs a relative value process utilizing a combination of quantitative and qualitative methods based on a four-factor valuation screen designed to outperform the MSCI Europe, Australasia and Far East (“EAFE”) Index. The sub-adviser’s analysts also perform rigorous fundamental analysis. A portfolio composed of approximately 80-110 stocks is selected as a result of this process. The sub-adviser generally limits its investment universe to those companies with a minimum of three years of operating history. The sub-adviser employs a consistent sell discipline which includes a significant negative earnings revision, a stock being sold when the catalyst is no longer valid or another stock presents a more attractive opportunity. |
| |
| Investment manager | | TAM |
| |
| Sub-adviser | | Thompson, Siegel & Walmsley LLC |
- 69 -
| | | | |
| | |
| Portfolio managers | | Brandon H. Harrell, CFA: Portfolio Manager of the Target Funds since 2013; Portfolio Manager at Thompson, Siegel & Walmsley LLC since 1996 | | Brandon H. Harrell, CFA: Portfolio Manager of the Destination Fund since 2011; Portfolio Manager at Thompson, Siegel & Walmsley LLC since 1996 |
| | |
| Business | | Transamerica Partners International Equity is a diversified series of TPFG, an open-end management investment company organized as a Massachusetts business trust. Transamerica Partners Institutional International Equity is a diversified series of TPFG II, an open-end management investment company organized as a Massachusetts business trust. Transamerica Partners International Equity Portfolio is a diversified series of TPP, an open-end management investment company and a trust governed by New York law. | | The Destination Fund is a diversified series of the Destination Trust, an open-end management investment company organized as a Delaware statutory trust. |
| | |
| Net assets (as of June 30, 2016) | | Transamerica Partners International Equity = $138,136,270 Transamerica Partners Institutional International Equity = $40,342,518 Transamerica Partners International Equity Portfolio (excluding the Target Feeder Funds) = $360,053,648 | | $2,613,765,497 |
| | |
| Management fees | | TAM receives compensation for investment advisory services from the Target Funds at annual rates of 0.74% of the first $500 million; 0.72% over $500 million up to $1 billion; 0.69% over $1 billion up to $2 billion; and 0.66% in excess of $2 billion. TAM also receives compensation for administrative services from Transamerica Partners International Equity and Transamerica Partners Institutional International Equity at annual rates of 0.30% and 0.05%, respectively. Transamerica Partners International Equity Portfolio pays no separate administrative services fees. The applicable fee(s) are based upon average daily net assets and are accrued daily and paid monthly. | | TAM receives compensation for investment management services, which include investment advisory and administrative services, from the Destination Fund at annual rates of 0.77% of the first $500 million; 0.75% over $500 million up to $1 billion; 0.72% over $1 billion up to $2 billion; and 0.69% in excess of $2 billion. The fee is based upon average daily net assets and is accrued daily and paid monthly. |
| | |
| Distribution and service (12b-1) fees | | Transamerica Partners International Equity is subject to a distribution and service (12b-1) fee of up to 0.25% of average daily net assets. Transamerica Partners Institutional International Equity is subject to a distribution and service (12b-1) fee of up to 0.25% of average daily net assets. Transamerica Partners International Equity Portfolio is not subject to a distribution and service (12b-1) fee. | | Class R shares of the Destination Fund are subject to a distribution and service (12b-1) fee of up to 0.50% of average daily net assets. Class R4 shares of the Destination Fund are subject to a distribution and service (12b-1) fee of up to 0.25% of average daily net assets. Class I3 shares of the Destination Fund are not subject to a distribution and service (12b-1) fee. |
- 70 -
| | | | |
| | |
| Sales charges | | Shares of the Target Funds are offered without a sales charge and are not subject to a contingent deferred sales charge. | | Class R, Class R4, and Class I3 shares of the Destination Fund are offered without a sales charge and are not subject to a contingent deferred sales charge. |
| | |
| Fee waiver and expense reimbursement | | Contractual arrangements have been made with TAM through May 1, 2017 to waive fees and/or reimburse fund expenses to the extent that the total operating expenses exceed: • 1.40% for Transamerica Partners International Equity; and • 1.15% for Transamerica Partners Institutional International Equity. The expense limitation excludes, as applicable, acquired fund fees and expenses, interest, taxes, brokerage commissions, dividend and interest expenses on securities sold short, extraordinary expenses and other expenses not incurred in the ordinary course of the fund’s business. These arrangements cannot be terminated prior to May 1, 2017 without the Board of Trustees’ consent. TAM has agreed to waive fees and reimburse expenses to limit the total operating expenses of Transamerica Partners International Equity Portfolio to 0.90%. This arrangement is voluntary and may be terminated by TAM at any time. | | Contractual arrangements have been made with TAM through May 1, 2018 to waive fees and/or reimburse fund expenses to the extent that the Destination Fund’s total operating expenses exceed: • 1.40% for Class R shares; • 1.15% for Class R4 shares; and • 0.90% for Class I3 shares. The expense limitation excludes, as applicable, acquired fund fees and expenses, interest, taxes, brokerage commissions, dividend and interest expenses on securities sold short, extraordinary expenses and other expenses not incurred in the ordinary course of the fund’s business. These arrangements cannot be terminated prior to May 1, 2018 without the Board of Trustees’ consent. TAM is entitled to reimbursement by the Destination Fund of fees waived or expenses reduced during any of the previous 36 months if on any day or month the estimated annualized fund operating expenses are less than the cap. |
| |
| Gross and net expenses | | For a comparison of the gross and net expenses of the Funds, please see the class fee tables in the “The Funds’ Fees and Expenses” section. |
| 1 | Transamerica Partners International Equity and Transamerica Partners Institutional International Equity are feeder funds and invest in securities through Transamerica Partners International Equity Portfolio, an underlying master fund having the same investment goals and strategies. |
Comparison of Principal Risks of Investing in the Funds
Because the Funds have substantially similar investment objectives and principal investment strategies, they are subject to similar principal risks. Risk is inherent in all investing. The value of your investment in a Fund, as well as the amount of return you receive on your investment, may fluctuate significantly from day to day and over time. You may lose part or all of your investment in a Fund or your investment may not perform as well as other similar investments.
Each Fund is subject to the following principal risks (in alphabetical order) of investing in the Fund:
Currency – The value of investments in securities denominated in foreign currencies increases or decreases as the rates of exchange between those currencies and the U.S. dollar change. Currency conversion costs and currency fluctuations could reduce or eliminate investment gains or add to investment losses. Currency exchange rates can be volatile, and are affected by factors such as general economic conditions, the actions of the U.S. and foreign governments or central banks, the imposition of currency controls, and speculation.
Depositary Receipts (ADRs) – Depositary receipts may be less liquid than the underlying shares in their primary trading market. Any distributions paid to the holders of depositary receipts are usually subject to a fee charged by the depositary. Holders of depositary receipts may have limited voting rights, and investment restrictions in certain countries may adversely impact the value of depositary receipts because such restrictions may limit the ability to convert equity shares into depositary receipts and vice versa. Such restrictions may cause equity shares of the underlying issuer to trade at a discount or premium to the market price of the depositary receipts.
- 71 -
Emerging Markets – Investments in the securities of issuers located in or principally doing business in emerging markets are subject to foreign investments risks. These risks are greater for investments in issuers in emerging market countries. Emerging market countries tend to have economic, political and legal systems that are less fully developed and are less stable than those of more developed countries. Emerging market securities are often particularly sensitive to market movements because their market prices tend to reflect speculative expectations. Low trading volumes may result in a lack of liquidity and in extreme price volatility.
Equity Securities – Equity securities represent an ownership interest in an issuer, rank junior in a company’s capital structure and consequently may entail greater risk of loss than debt securities. Equity securities include common and preferred stocks. Stock markets are volatile. The price of equity securities fluctuates based on changes in a company’s financial condition and overall market and economic conditions. If the market prices of the equity securities owned by the fund fall, the value of your investment in the fund will decline.
Focused Investing – To the extent the fund invests in a limited number of countries, regions, sectors or industries, or in a limited number of issuers, the fund will be more susceptible to negative events affecting those countries, regions, sectors, industries or issuers, and the value of its shares may be more volatile than if it invested more widely. Local events, such as political upheaval, financial troubles, or natural disasters may disrupt a country’s or region’s securities markets. Geographic risk is especially high in emerging markets.
Foreign Investments – Investing in securities of foreign issuers or issuers with significant exposure to foreign markets involves additional risk. Foreign countries in which the fund may invest may have markets that are less liquid, less regulated and more volatile than U.S. markets. The value of the fund’s investments may decline because of factors affecting the particular issuer as well as foreign markets and issuers generally, such as unfavorable or unsuccessful government actions, reduction of government or central bank support, political or financial instability or other adverse economic or political developments. Lack of information and weaker accounting standards also may affect the value of these securities.
Legal and Regulatory – Legal and regulatory changes could occur that may adversely affect the fund, its investments, and its ability to pursue its investment strategies and/or increase the costs of implementing such strategies. Certain changes have already been proposed and additional changes are expected. New or revised laws or regulations may be imposed by the U.S. Securities and Exchange Commission, the U.S. Commodity Futures Trading Commission, the Internal Revenue Service, the U.S. Federal Reserve or other governmental regulatory authorities or self-regulatory organizations that could adversely affect the fund. The fund also may be adversely affected by changes in the enforcement or interpretation of existing statutes and rules by governmental regulatory authorities or self-regulatory organizations.
Liquidity – The fund may make investments that are illiquid or that become illiquid after purchase. Investments may become illiquid due to the lack of an active market, a reduced number of traditional market participants, or reduced capacity of traditional market participants to make a market in securities. The liquidity and value of investments can deteriorate rapidly and those investments may be difficult or impossible for the fund to sell, particularly during times of market turmoil. These illiquid investments can be difficult to value. If the fund is forced to sell an illiquid investment to meet redemption requests or other cash needs, the fund may be forced to sell at a loss. The fund may not receive its proceeds from the sale of certain securities for an extended period (for example, several weeks or even longer).
Market – The market prices of the fund’s securities may go up or down, sometimes rapidly or unpredictably, due to general market conditions, such as real or perceived adverse economic or political conditions, inflation, changes in interest rates or currency rates, lack of liquidity in the markets or adverse investor sentiment. Adverse market conditions may be prolonged and may not have the same impact on all types of securities. Market prices of securities also may go down due to events or conditions that affect particular sectors, industries or issuers. When market prices fall, the value of your investment will go down. The fund may experience a substantial or complete loss on any individual security.
- 72 -
In the past several years, financial markets, such as those in the United States, Europe, Asia and elsewhere, have experienced increased volatility, depressed valuations, decreased liquidity and heightened uncertainty. Governmental and non-governmental issuers defaulted on, or were forced to restructure, their debts. These market conditions may continue, worsen or spread.
The U.S. government and the Federal Reserve, as well as certain foreign governments and central banks have taken steps to support financial markets, including keeping interest rates at historically low levels. This and other government intervention may not work as intended, particularly if the efforts are perceived by investors as being unlikely to achieve the desired results. The Federal Reserve recently has reduced its market support activities. Further reduction or withdrawal of Federal Reserve or other U.S. or non-U.S. governmental or central bank support, including interest rate increases, could negatively affect financial markets generally, increase market volatility and reduce the value and liquidity of securities in which the fund invests.
Policy and legislative changes in the United States and in other countries are affecting many aspects of financial regulation, and may in some instances contribute to decreased liquidity and increased volatility in the financial markets. The impact of these changes on the markets, and the practical implications for market participants, may not be fully known for some time.
Economies and financial markets throughout the world are becoming increasingly interconnected. As a result, whether or not the fund invests in securities of issuers located in or with significant exposure to countries experiencing economic and financial difficulties, the value and liquidity of the fund’s investments may be negatively affected.
Small and Medium Capitalization Companies – The fund will be exposed to additional risks as a result of its investments in the securities of small or medium capitalization companies. Small or medium capitalization companies may be more at risk than large capitalization companies because, among other things, they may have limited product lines, operating history, market or financial resources, or because they may depend on a limited management group. The prices of securities of small and medium capitalization companies generally are more volatile than those of large capitalization companies and are more likely to be adversely affected than large capitalization companies by changes in earnings results and investor expectations or poor economic or market conditions. Securities of small and medium capitalization companies may underperform large capitalization companies, may be harder to sell at times and at prices the portfolio managers believe appropriate and may offer greater potential for losses.
Valuation – The sales price the fund could receive for any particular portfolio investment may differ from the fund’s valuation of the investment, particularly for securities that trade in thin or volatile markets, that are priced based upon valuations provided by third-party pricing services that use matrix or evaluated pricing systems, or that are valued using a fair value methodology. The fund’s ability to value its investments may be impacted by technological issues and/or errors by pricing services or other third party service providers.
Value Investing – The prices of securities the sub-adviser believes are undervalued may not appreciate as anticipated or may go down. Value stocks as a group may be out of favor and underperform the overall equity market for a long period of time, for example, while the market favors “growth” stocks.
Each Fund is subject to similar management related risks. The Target Funds are subject to the following related principal risk:
Management – The fund is subject to the risk that the Investment Manager’s or sub-adviser’s judgments and decisions may be incorrect or otherwise may not produce the desired results. The value of your investment may decrease if the sub-adviser’s judgment about the quality, relative yield or value of, or market trends affecting, a particular security or issuer, industry, sector, region or market segment, or about the economy or interest rates, is
- 73 -
incorrect. The fund may also suffer losses if there are imperfections, errors or limitations in the tools, resources, information and data used, or the analyses employed or relied on, by the sub-adviser, or if the sub-adviser’s investment style is out of favor or otherwise fails to produce the desired results. The fund’s investment strategies designed by the investment manager may not work as intended. In addition, the fund’s investment strategies or policies may change from time to time. Those changes may not lead to the results intended by the investment manager and could have an adverse effect on the value or performance of the fund. Any of these things could cause the fund to lose value or its results to lag relevant benchmarks or other funds with similar objectives.
The Destination Fund is subject to the following related principal risks:
Manager – The fund is subject to the risk that the sub-adviser’s judgments and investment decisions, as well as the methods, tools, resources, information and data, and the analyses employed or relied on by the sub-adviser to make those judgments and decisions may be incorrect or otherwise may not produce the desired results. This could cause the fund to lose value or its results to lag relevant benchmarks or other funds with similar objectives.
Portfolio Management – The value of your investment may decrease if the sub-adviser’s judgment about the quality, relative yield, value or market trends affecting a particular security or issuer, industry, sector, region or market segment, or about the economy or interest rates is incorrect, or if there are imperfections, errors or limitations in the tools and data used by the sub-adviser or manager. In addition, the fund’s investment strategies or policies may change from time to time. Those changes may not lead to the results intended by the sub-adviser and could have an adverse effect on the value or performance of the fund.
The Funds’ Past Performance
Set forth below is performance information for each Fund. The bar charts and tables below provide some indication of the risks of investing in each Fund by showing you how the performance of the Target Funds and Class A shares of the Destination Fund has varied from year to year for 10 years or since inception, as applicable, and how the average total returns of each Target Fund and the applicable class of shares of the Destination Fund for different periods compare to the returns of one or more broad measures of market performance. The performance shown below for Transamerica Partners International Equity Portfolio reflects only master portfolio level expenses, and does not include the expenses of any of the applicable Non-Mutual Fund Feeder Funds. If those expenses were reflected, the performance would be lower. Absent any applicable limitation of or cap on the Funds’ expenses, performance would have been lower. No performance information is presented for the Class R, Class R4 and Class I3 shares of the Destination Fund because those share classes are newly offered. Class R, Class R4 and Class I3 shares of the Destination Fund would have different performance because they have different expenses. A Fund’s past performance (before and after taxes) is not necessarily an indication of how the Fund will perform in the future. Following the Reorganizations, Transamerica International Equity will be the surviving fund for performance purposes.
Prior to December 31, 2008, the Target Funds had a different sub-adviser. The performance set forth below for the Target Funds prior to that date is attributable to the previous sub-advisers. In addition, prior to December 15, 2013, the Target Funds had a different sub-adviser, a different investment objective and used different investment strategies. The performance set forth below for the Target Funds for the period between December 31, 2008 and December 14, 2013 is attributable to a previous sub-adviser.
The Destination Fund acquired the assets and assumed the liabilities of TS&W International Equity Portfolio (the “predecessor fund”) on February 28, 2011, and the predecessor fund is the accounting and performance survivor of the reorganization. This means that the predecessor fund’s performance and financial history have been adopted by the Destination Fund. In the reorganization, former shareholders of the predecessor fund received Class I shares of the Destination Fund. The performance of Class I shares of the Destination Fund shown below includes the performance of the predecessor fund prior to the reorganization. The performance of the predecessor fund has not been restated to reflect the current annual operating expenses of Class I shares of the Destination Fund. The inception date shown below in the table for Class I shares of the Destination Fund is that of the predecessor fund.
- 74 -
Transamerica Partners International Equity Annual Returns
Annual Total Returns (calendar years ended December 31)
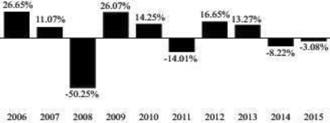
| | | | | | | | |
| | | Quarter Ended | | | Return | |
Best Quarter: | | | 6/30/2009 | | | | 23.63 | % |
Worst Quarter: | | | 12/31/2008 | | | | -24.34 | % |
Year-to-date return as of September 30, 2016: 2.85%
Transamerica Partners International Equity Average Annual Total Returns
Average Annual Total Returns (periods ended December 31, 2015)
| | | | | | | | | | | | | | | | |
| | | 1 Year | | | 5 Years | | | 10 Years | | | Inception Date | |
Transamerica Partners International Equity | | | -3.08 | % | | | 0.21 | % | | | 0.19 | % | | | 01/19/1996 | |
MSCI All Country World Index ex-U.S. (reflects no deduction for fees, expenses or taxes) | | | -5.25 | % | | | 1.51 | % | | | 3.38 | % | | | | |
Transamerica Partners Institutional International Equity Annual Returns
Annual Total Returns (calendar years ended December 31)
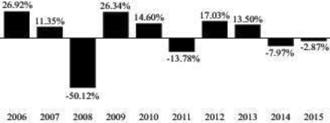
| | | | | | | | |
| | | Quarter Ended | | | Return | |
Best Quarter: | | | 6/30/2009 | | | | 23.59 | % |
Worst Quarter: | | | 12/31/2008 | | | | -24.31 | % |
Year-to-date return as of September 30, 2016: 3.09%
Transamerica Partners Institutional International Equity Average Annual Total Returns
Average Annual Total Returns (periods ended December 31, 2015)
| | | | | | | | | | | | | | | | |
| | | 1 Year | | | 5 Years | | | 10 Years | | | Inception Date | |
Transamerica Partners Institutional International Equity | | | -2.87 | % | | | 0.47 | % | | | 0.44 | % | | | 09/11/2000 | |
MSCI All Country World Index ex-U.S. (reflects no deduction for fees, expenses or taxes) | | | -5.25 | % | | | 1.51 | % | | | 3.38 | % | | | | |
- 75 -
Transamerica Partners International Equity Portfolio Annual Returns
Annual Total Returns (calendar years ended December 31)
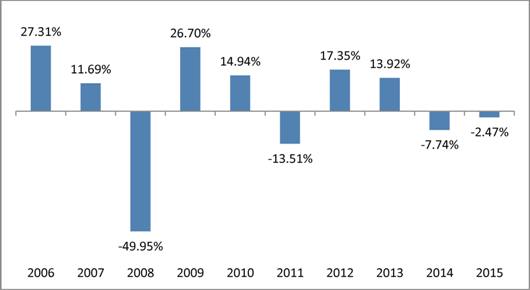
The highest and lowest quarterly returns for the periods reflected in the table above are:
| | | | | | | | |
| | | Quarter Ended | | | Return | |
Best Quarter: | | | 6/30/2009 | | | | 23.62 | % |
Worst Quarter: | | | 12/31/2008 | | | | -24.23 | % |
Year-to-date return as of September 30, 2016: 3.24%
Transamerica Partners International Equity Portfolio Average Annual Total Returns
(for periods ended 12/31/2015)
| | | | | | | | | | | | | | | | |
| | | 1 Year | | | 5 Years | | | 10 Years | | | Inception
Date | |
Transamerica Partners International Equity Portfolio | | | -2.47 | % | | | 0.80 | % | | | 0.76 | % | | | 02/25/2000 | |
MSCI All Country World Index ex-U.S. (reflects no deduction for fees, expenses or taxes) | | | -5.25 | % | | | 1.51 | % | | | 3.38 | % | | | | |
- 76 -
Transamerica International Equity Annual Returns
Annual Total Returns (calendar years ended December 31) - Class I
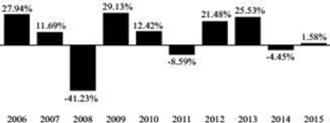
| | | | | | | | |
| | | Quarter Ended | | | Return | |
Best Quarter: | | | 06/30/2009 | | | | 24.59 | % |
Worst Quarter: | | | 09/30/2008 | | | | -21.12 | % |
Year-to-date return as of September 30, 2016: 1.86%
Transamerica International Equity Average Annual Total Returns
Average Annual Total Returns (periods ended December 31, 2015)
| | | | | | | | | | | | | | | | |
| | | 1 Year | | | 5 Years | | | 10
Years | | | Inception
Date | |
Class I | | | | 12/18/1992 | |
Return before taxes | | | 1.58 | % | | | 6.23 | % | | | 5.13 | % | | | | |
Return after taxes on distributions | | | 0.97 | % | | | 5.50 | % | | | 4.22 | % | | | | |
Return after taxes on distributions and sale of fund shares | | | 1.42 | % | | | 4.82 | % | | | 4.15 | % | | | | |
MSCI EAFE Index (reflects no deduction for fees, expenses or taxes) | | | -0.39 | % | | | 4.07 | % | | | 3.50 | % | | | | |
The after-tax returns are calculated using the historic highest individual federal marginal income tax rates and do not reflect the impact of state and local taxes. Actual after-tax returns may depend on the investor’s individual tax situation and may differ from those shown. After-tax returns may not be relevant if the investment is made through a tax-exempt or tax-deferred account, such as a 401(k) plan.
The Funds’ Fees and Expenses
Shareholders of the Target Funds and the Destination Fund pay various fees and expenses, either directly or indirectly. The tables below show the fees and expenses that you would pay if you were to buy and hold shares of each Fund. The fees and expenses in the tables appearing below are based on the expenses of the Funds for the twelve-month period ended June 30, 2016. The tables also show the pro forma expenses of the combined Destination Fund after giving effect to all Group 4 Reorganizations based on pro forma net assets as of June 30, 2016. Pro forma numbers are estimated in good faith and are hypothetical. Actual expenses may vary significantly. The fees and expenses shown in the table and Example below for Transamerica Partners International Equity Portfolio reflect only master portfolio level fees and expenses, and do not include the fees and expenses of any of the applicable Non-Mutual Fund Feeder Funds. For financial statement purposes, Transamerica International Equity will be the accounting survivor of the Reorganizations. As the accounting survivor, Transamerica International Equity’s operating history will be used for financial reporting purposes.
- 77 -
Transamerica Partners International Equity
| | | | | | | | | | | | |
| | | Transamerica
Partners
International
Equity1 | | | Transamerica
International
Equity | | | Combined
Transamerica
International
Equity
(Pro Forma) | |
| | | | | | Class R | | | Class R | |
Shareholder Fees (fees paid directly from your investment) | | | | | | | | | | | | |
Maximum sales charge (load) imposed on purchases (as a % of offering price) | | | None | | | | None | | | | None | |
Maximum deferred sales charge (load) (as a % of offering price) | | | None | | | | None | | | | None | |
Redemption fee (as a % of amount redeemed) | | | None | | | | None | | | | None | |
| | | |
Annual Fund Operating Expenses (expenses that you pay each year as a % of the value of your investment) | | | | | | | | | | | | |
Management fees2 | | | 0.74 | % | | | 0.74 | % | | | 0.74 | % |
Distribution and service (12b-1) fees | | | 0.25 | % | | | 0.50 | % | | | 0.50 | % |
Other expenses3 | | | 0.44 | % | | | 0.06 | %4 | | | 0.06 | %4 |
Total annual fund operating expenses | | | 1.43 | % | | | 1.30 | % | | | 1.30 | % |
Fee waiver and/or expense reimbursement | | | 0.03 | %5 | | | 0.00 | %6 | | | 0.00 | %6 |
Total annual fund operating expenses after fee waiver and/or expense reimbursement | | | 1.40 | % | | | 1.30 | % | | | 1.30 | % |
Transamerica Partners Institutional International Equity
| | | | | | | | | | | | |
| | | Transamerica
Partners
Institutional
International
Equity1 | | | Transamerica
International
Equity | | | Combined
Transamerica
International
Equity
(Pro Forma) | |
| | | | | | Class R4 | | | Class R4 | |
Shareholder Fees (fees paid directly from your investment) | | | | | | | | | | | | |
Maximum sales charge (load) imposed on purchases (as a % of offering price) | | | None | | | | None | | | | None | |
Maximum deferred sales charge (load) (as a % of offering price) | | | None | | | | None | | | | None | |
Redemption fee (as a % of amount redeemed) | | | None | | | | None | | | | None | |
| | | |
Annual Fund Operating Expenses (expenses that you pay each year as a % of the value of your investment) | | | | | | | | | | | | |
Management fees2 | | | 0.74 | % | | | 0.74 | % | | | 0.74 | % |
Distribution and service (12b-1) fees | | | 0.25 | % | | | 0.25 | % | | | 0.25 | % |
Other expenses3 | | | 0.26 | % | | | 0.06 | %4 | | | 0.06 | %4 |
Total annual fund operating expenses | | | 1.25 | % | | | 1.05 | % | | | 1.05 | % |
Fee waiver and/or expense reimbursement | | | 0.10 | %7 | | | 0.00 | %6 | | | 0.00 | %6 |
Total annual fund operating expenses after fee waiver and/or expense reimbursement | | | 1.15 | % | | | 1.05 | % | | | 1.05 | % |
- 78 -
Transamerica Partners International Equity Portfolio
| | | | | | | | | | | | |
| | | Transamerica
Partners
International
Equity Portfolio | | | Transamerica
International
Equity | | | Combined
Transamerica
International
Equity
(Pro Forma) | |
| | | | | | Class I3 | | | Class I3 | |
Shareholder Fees (fees paid directly from your investment) | | | | | | | | | | | | |
Maximum sales charge (load) imposed on purchases (as a % of offering price) | | | None | | | | None | | | | None | |
Maximum deferred sales charge (load) (as a % of offering price) | | | None | | | | None | | | | None | |
Redemption fee (as a % of amount redeemed) | | | None | | | | None | | | | None | |
| | | |
Annual Fund Operating Expenses (expenses that you pay each year as a % of the value of your investment) | | | | | | | | | | | | |
Management fees2 | | | 0.74 | % | | | 0.74 | % | | | 0.74 | % |
Distribution and service (12b-1) fees | | | None | | | | None | | | | None | |
Other expenses3 | | | 0.08 | % | | | 0.06 | %4 | | | 0.06 | %4 |
Total annual fund operating expenses | | | 0.82 | % | | | 0.80 | % | | | 0.80 | % |
Fee waiver and/or expense reimbursement | | | N/A | | | | 0.00 | %6 | | | 0.00 | %6 |
Total annual fund operating expenses after fee waiver and/or expense reimbursement | | | 0.82 | % | | | 0.80 | % | | | 0.80 | % |
| 1 | The Target Feeder Fund invests in securities through an underlying Target Master Portfolio, Transamerica Partners International Equity Portfolio. The information in this table and in the Example below concerning the Target Feeder Fund reflects the direct fees and expenses of the Target Feeder Fund and its allocated share of the fees and expenses of the Target Master Portfolio. |
| 2 | The Destination Fund receives investment advisory and administrative services under one agreement with the Destination Fund’s investment manager, Transamerica Asset Management, Inc. (“TAM”), and pays a single management fee to TAM. Transamerica Partners International Equity and Transamerica Partners Institutional International Equity receive investment advisory and administrative services from TAM under separate agreements and pay separate advisory fees and administrative services fees to TAM. The administrative services fees of 0.30% for Transamerica Partners International Equity and 0.05% for Transamerica Partners Institutional International Equity are included in “Other expenses.” Transamerica Partners International Equity Portfolio receives investment advisory services from TAM and pays advisory fees to TAM. Transamerica Partners International Equity Portfolio pays no separate administrative services fees. |
| 3 | Other expenses do not include the costs of the Reorganization to be borne by the Target Funds and the Destination Fund. These costs are considered extraordinary expenses and are not covered by the applicable expense limitation arrangements. The basis point impact of such costs is 0.00% for Transamerica Partners International Equity, 0.03% for Transamerica Partners Institutional International Equity, 0.00% for Transamerica Partners International Equity Portfolio and 0.02% for Transamerica International Equity. |
| 4 | Other expenses are based on estimates for the current fiscal year. Actual expenses may differ from estimates. |
| 5 | Contractual arrangements have been made with TAM through May 1, 2017 to waive fees and/or reimburse fund expenses to the extent that the fund’s total operating expenses exceed 1.40%, excluding, as applicable, acquired fund fees and expenses, interest, taxes, brokerage commissions, dividend and interest expenses on securities sold short, extraordinary expenses and other expenses not incurred in the ordinary course of the fund’s business. |
| 6 | Contractual arrangements have been made with TAM through May 1, 2018 to waive fees and/or reimburse fund expenses to the extent that the fund’s total operating expenses exceed 1.40% for Class R shares, 1.15% for Class R4 shares and 0.90% for Class I3 shares, excluding, as applicable, acquired fund fees and expenses, interest, taxes, brokerage commissions, dividend and interest expenses on securities sold short, extraordinary expenses and other expenses not incurred in the ordinary course of the fund’s business. These arrangements cannot be terminated prior to May 1, 2018 without the Board of Trustees’ consent. TAM is entitled to reimbursement by the fund of fees waived or expenses reduced during any of the previous 36 months if on any day or month the estimated annualized fund operating expenses are less than the cap. |
| 7 | Contractual arrangements have been made with TAM through May 1, 2017 to waive fees and/or reimburse fund expenses to the extent that the fund’s total operating expenses exceed 1.15%, excluding, as applicable, acquired fund fees and expenses, interest, taxes, brokerage commissions, dividend and interest expenses on securities sold short, extraordinary expenses and other expenses not incurred in the ordinary course of the fund’s business. |
The hypothetical examples below help you compare the cost of investing in each Fund. Each example assumes that:
| | • | | you invest $10,000 in each Fund; |
| | • | | you reinvest all dividends and distributions without a sales charge; |
- 79 -
| | • | | your investment has a 5% annual return (this assumption is required by the SEC and is not a prediction of the Fund’s future performance); and |
| | • | | each Fund’s operating expenses remain the same. |
Each example also assumes no fees for IRA accounts, if applicable. Costs are the same whether you redeem at the end of any period or not. Pro forma expenses are included assuming the consummation of all Group 1 Reorganizations. The examples are for comparison purposes only and do not represent the Funds’ actual expenses or returns, either past or future. Because actual return and expenses will be different, the examples are for comparison only.
Transamerica Partners International Equity
| | | | | | | | | | | | |
Number of years you own your shares | | Transamerica
Partners
International
Equity | | | Transamerica
International
Equity | | | Combined
Transamerica
International
Equity
(Pro Forma) | |
| | | | | | Class R | | | Class R | |
Year 1 | | $ | 143 | | | $ | 132 | | | $ | 132 | |
Year 3 | | $ | 449 | | | $ | 412 | | | $ | 412 | |
Year 5 | | $ | 779 | | | $ | 713 | | | $ | 713 | |
Year 10 | | $ | 1,710 | | | $ | 1,568 | | | $ | 1,568 | |
Transamerica Partners Institutional International Equity
| | | | | | | | | | | | |
Number of years you own your shares | | Transamerica
Partners
Institutional
International
Equity | | | Transamerica
International
Equity | | | Combined
Transamerica
International
Equity
(Pro Forma) | |
| | | | | | Class R4 | | | Class R4 | |
Year 1 | | $ | 117 | | | $ | 107 | | | $ | 107 | |
Year 3 | | $ | 387 | | | $ | 334 | | | $ | 334 | |
Year 5 | | $ | 677 | | | $ | 579 | | | $ | 579 | |
Year 10 | | $ | 1,502 | | | $ | 1,283 | | | $ | 1,283 | |
Transamerica Partners International Equity Portfolio
| | | | | | | | | | | | |
Number of years you own your shares | | Transamerica
Partners
International
Equity Portfolio | | | Transamerica
International
Equity | | | Combined
Transamerica
International
Equity
(Pro Forma) | |
| | | | | | Class I3 | | | Class I3 | |
Year 1 | | $ | 84 | | | $ | 82 | | | $ | 82 | |
Year 3 | | $ | 262 | | | $ | 255 | | | $ | 255 | |
Year 5 | | $ | 455 | | | $ | 444 | | | $ | 444 | |
Year 10 | | $ | 1,014 | | | $ | 990 | | | $ | 990 | |
CAPITALIZATION
The following tables set forth the capitalization of each Target Fund and the Destination Fund as of September 30, 2016 and the pro forma combined capitalization of the combined Destination Fund as if the Reorganizations had occurred on that date. If the Reorganizations are consummated, the actual exchange ratios on the closing date may
- 80 -
vary from the exchange ratios used in the computation below. This is due to changes in the market value of the portfolio securities of the Funds between September 30, 2016 and the closing date, changes in the amount of undistributed net investment income and net realized capital gains of the Funds during that period resulting from income and distributions, and changes in the accrued liabilities of the Funds during the same period.
Transamerica Partners International Equity Funds
| | | | | | | | | | | | |
| | | Transamerica
Partners
International
Equity | | | Transamerica
Partners
Institutional
International Equity | | | Transamerica
Partners
International Equity
Portfolio | |
Net Assets | | $ | 143,079,087 | | | $ | 42,052,097 | | | $ | 188,179,052 | |
| | | |
Net Asset Value Per Share | | $ | 10.24 | | | $ | 6.52 | | | $ | 16.96 | |
| | | |
Shares Outstanding | | | 13,973,525 | | | | 6,453,970 | | | | 11,095,463 | |
Transamerica International Equity
| | | | | | | | |
| | | Transamerica
International
Equity | | | Transamerica
International
Equity
Pro Forma | |
Net Assets | | | | | | | | |
Class A | | $ | 317,360,393 | | | $ | 317,360,393 | |
Class B | | | — | | | | — | |
Class C | | $ | 63,339,933 | | | $ | 63,339,933 | |
Class I | | $ | 1,574,293,389 | | | $ | 1,574,293,389 | |
Class I2 | | $ | 1,729,690,653 | | | $ | 1,729,690,653 | |
Advisor Class | | | — | | | | — | |
Class R1 | | | — | | | | — | |
Class R6 | | $ | 12,135,758 | | | $ | 12,135,758 | |
Class R | | | — | | | $ | 143,079,087 | |
Class R4 | | | — | | | $ | 42,052,097 | |
Class I3 | | | — | | | $ | 187,980,188 | |
Net Asset Value Per Share | | | | | | | | |
Class A | | $ | 16.71 | | | $ | 16.71 | |
Class B | | | — | | | | — | |
Class C | | $ | 16.45 | | | $ | 16.45 | |
Class I | | $ | 16.95 | | | $ | 16.95 | |
Class I2 | | $ | 16.96 | | | $ | 16.96 | |
Advisor Class | | | — | | | | — | |
Class R1 | | | — | | | | — | |
Class R6 | | $ | 17.12 | | | $ | 17.12 | |
Class R | | $ | 16.96 | | | $ | 16.96 | |
Class R4 | | $ | 16.96 | | | $ | 16.96 | |
Class I3 | | $ | 16.96 | | | $ | 16.94 | |
- 81 -
| | | | | | | | |
| | | Transamerica
International
Equity | | | Transamerica
International
Equity
Pro Forma | |
Shares Outstanding | | | | | | | | |
Class A | | | 18,997,309 | | | | 18,997,309 | |
Class B | | | — | | | | — | |
Class C | | | 3,851,416 | | | | 3,851,416 | |
Class I | | | 92,902,181 | | | | 92,902,181 | |
Class I2 | | | 101,956,635 | | | | 101,956,635 | |
Advisor Class | | | — | | | | — | |
Class R1 | | | — | | | | — | |
Class R6 | | | 708,848 | | | | 708,848 | |
Class R | | | — | | | | 8,436,267 | |
Class R4 | | | — | | | | 2,479,487 | |
Class I3 | | | — | | | | 11,095,463 | |
It is impossible to predict with any certainty how many shares of the Destination Fund will actually be received and distributed by a Target Fund on the closing date. The foregoing table should not be relied upon to determine the amount of Destination Fund shares that will actually be received and distributed.
ADDITIONAL INFORMATION
For information relating to each Fund and its Reorganization, including tax capital loss carryforwards, the tax status of the Reorganization, a comparison of the fundamental investment policies of the Funds, how to buy, sell or exchange Fund shares, how each Fund values its securities, financial highlights information for each Fund and ownership of shares of the Funds, please see the sections immediately following the discussion of the Group 9 Reorganizations.
TARGET FUND BOARD’S EVALUATION AND RECOMMENDATION
With respect to each Target Fund, the Board of the Target Fund, including its Independent Trustees, after careful consideration, unanimously determined that the Reorganization is in the best interest of the Target Fund and will not dilute the interests of the existing holders of the Target Fund. Each Board made this determination based on various factors, which include those that are discussed in the section entitled “Reasons for the Proposed Reorganizations” in the back of this Proxy Statement/Prospectus following the discussion of the proposals.
Similarly, the Board of the Destination Fund, including all its Independent Trustees, has approved the Reorganization with respect to the Destination Fund. The Board has determined that the Reorganization is in the best interest of the Destination Fund and that the interests of the Destination Fund’s holders will not be diluted as a result of the Reorganization.
THE BOARD OF YOUR TARGET FUND RECOMMENDS THAT YOU VOTE “FOR” PROPOSAL 4A, 4B OR 4C, AS APPLICABLE, TO APPROVE THE PLAN.
- 82 -
GROUP 5 – MID GROWTH FUNDS
TRANSAMERICA PARTNERS MID GROWTH
TRANSAMERICA PARTNERS INSTITUTIONAL MID GROWTH
TRANSAMERICA PARTNERS MID GROWTH PORTFOLIO
(each, a “Target Fund” and together, the “Target Funds”)
AND
TRANSAMERICA MID CAP GROWTH
(the “Destination Fund”)
PROPOSALS 5A, 5B AND 5C
APPROVAL OF AGREEMENT AND PLAN OF REORGANIZATION
SUMMARY
The following is a summary of more complete information appearing later in this Proxy Statement/Prospectus or incorporated herein. You should read carefully the entire Proxy Statement/Prospectus, including the form of Plan attached as Exhibit A, which includes additional information that is not included in the summary and is a part of this Proxy Statement/Prospectus. For a discussion of the terms of the Plan, please see the section entitled “Terms of Each Agreement and Plan of Reorganization” in the back of this Proxy Statement/Prospectus, after the discussion of the proposals.
In each proposed Reorganization, the Target Fund would be reorganized into the Destination Fund, with that Target Fund receiving shares of the applicable class of the Destination Fund as shown in the following table. The Target Funds, which operate in a master-feeder structure, do not have share classes.
| | | | |
Proposal | | Target Fund | | Destination Fund and Shares |
| Proposal 5A | | Transamerica Partners Mid Growth | | Transamerica Mid Cap Growth
Class R |
| Proposal 5B | | Transamerica Partners Institutional Mid Growth | | Transamerica Mid Cap Growth
Class R4 |
| Proposal 5C | | Transamerica Partners Mid Growth Portfolio | | Transamerica Mid Cap Growth
Class I3 |
Transamerica Partners Mid Growth would reorganize first, Transamerica Partners Institutional Mid Growth would reorganize next and Transamerica Partners Mid Growth Portfolio would reorganize last. All Reorganizations would occur on the same closing date.
The Target Funds and the Destination Fund are managed by Transamerica Asset Management, Inc. (“TAM”) and have the same investment objectives and substantially similar principal investment strategies and related risks. The tables below provide a comparison of certain features of the Funds. Unless otherwise noted, the information is the same for each Target Fund. In the tables below, if a row extends across the entire table, the information applies to the Destination Fund and the Target Funds.
Comparison of Target Funds and Destination Fund
| | | | |
| | | Target Funds | | Destination Fund |
| Investment objective | | Seeks long term capital appreciation. |
| | |
| Principal investment strategies1 | | The fund normally invests primarily in stocks of medium sized companies which the fund’s sub-adviser, Quantum Capital Management (the “sub-adviser”), believes have the potential to deliver earnings growth in excess of the market average, or to become market leaders. Under normal | | The fund normally invests primarily in stocks of medium sized companies which the fund’s sub-adviser believes have the potential to deliver earnings growth in excess of the market average, or to become market leaders. Under normal circumstances, the fund’s sub-adviser, |
- 83 -
| | | | |
| | circumstances, the fund invests at least 80% of its net assets (plus the amount of borrowings, if any, for investment purposes) in securities of medium sized (or mid-cap) companies and other investments with similar economic characteristics. The fund considers mid-cap companies to be companies with market capitalizations that, at the time of initial purchase, are within the range of capitalization of the companies that are included in the Russell Midcap Growth Index. As of December 31, 2015, the market capitalizations of companies in the Russell Midcap Growth Index ranged from approximately $1 billion to $30 billion. Over time, the capitalizations of the companies in the Russell Midcap Growth Index will change. As they do, the size of the companies in which the fund invests may change. The fund’s equity securities may include common stocks and preferred stocks listed on the New York Stock Exchange and on other national securities exchanges and, to a lesser extent, stocks that are traded over-the-counter. The fund emphasizes common stocks. The fund may also invest in foreign securities. The fund may also invest its assets in cash, cash equivalent securities or short-term debt securities, repurchase agreements and money market instruments. Generally, 5% or less of fund assets will be invested in cash and cash equivalents. | | Quantum Capital Management (the “sub-adviser”), invests at least 80% of the fund’s net assets (plus the amount of borrowings, if any, for investment purposes) in securities of medium sized (or mid-cap) companies and other investments with similar economic characteristics. The sub-adviser considers mid-cap companies to be companies with market capitalizations that, at the time of initial purchase, are within the range of capitalization of the companies that are included in the Russell Midcap Growth Index. As of December 31, 2015, the market capitalizations of companies in the Russell Midcap Growth Index ranged from approximately $1 billion to $30 billion. Over time, the capitalizations of the companies in the Russell Midcap Growth Index will change. As they do, the size of the companies in which the fund invests may change. The fund’s equity securities may include common stocks and preferred stocks listed on the New York Stock Exchange and on other national securities exchanges and, to a lesser extent, stocks that are traded over-the-counter. The fund emphasizes common stocks. The fund may also invest in foreign securities. The fund may also invest its assets in cash, cash equivalent securities or short-term debt securities, repurchase agreements and money market instruments. Generally, 5% or less of fund assets will be invested in cash and cash equivalents. |
| |
| Investment manager | | TAM |
| |
| Sub-adviser | | Quantum Capital Management |
| |
| Portfolio managers | | Howard B. Aschwald, CFA: Portfolio Manager of the Funds since 2013; Co- Founder, Chief Investment Officer & Director of Research with Quantum Capital Management since 1996 Timothy D. Chatard, CFA: Portfolio Manager of the Funds since 2014; Employed with Quantum Capital Management since 2013 as part of the investment research team responsible for equity analysis in several economic sectors. Prior to joining Quantum Capital Management, he was an analyst at Morgan Stanley from 1991 to 1994; Portfolio Manager at Franklin Templeton Group from 1996 to 1999; Portfolio Manager at Sterling Johnston Capital Management from 1999 to 2009; and Portfolio Manager at Tano Capital from 2010 to 2013 |
| | |
| Business | | Transamerica Partners Mid Growth is a diversified series of TPFG, an open-end management investment company organized as a Massachusetts business trust. Transamerica Partners Institutional Mid Growth is a diversified series of TPFG II, an open-end management investment company organized as a Massachusetts business trust. | | The Destination Fund is a diversified series of the Destination Trust, an open-end management investment company organized as a Delaware statutory trust. |
- 84 -
| | | | |
| | Transamerica Partners Mid Growth Portfolio is a diversified series of TPP, an open-end management investment company and a trust governed by New York law. | | |
| | |
| Net assets (as of June 30, 2016) | | Transamerica Partners Mid Growth = $48,616,233 Transamerica Partners Institutional Mid Growth = $15,773,347 Transamerica Partners Mid Growth Portfolio (excluding the Target Feeder Funds) = $97,513,472 | | $502,304,032 |
| | |
| Management fees | | TAM receives compensation for investment advisory services from the Target Funds at an annual rate of 0.72%. TAM also receives compensation for administrative services from Transamerica Partners Mid Growth and Transamerica Partners Institutional Mid Growth at annual rates of 0.30% and 0.05%, respectively. Transamerica Partners Mid Growth Portfolio pays no separate administrative services fees. The applicable fee(s) are based upon average daily net assets and are accrued daily and paid monthly. | | TAM receives compensation for investment management services, which include investment advisory and administrative services, from the Destination Fund at annual rates of 0.75% of the first $1 billion; and 0.73% in excess of $1 billion. The fee is based upon average daily net assets and is accrued daily and paid monthly. |
| | |
| Distribution and service (12b-1) fees | | Transamerica Partners Mid Growth is subject to a distribution and service (12b-1) fee of up to 0.25% of average daily net assets. Transamerica Partners Institutional Mid Growth is subject to a distribution and service (12b-1) fee of up to 0.25% of average daily net assets. Transamerica Partners Mid Growth Portfolio is not subject to a distribution and service (12b-1) fee. | | Class R shares of the Destination Fund are subject to a distribution and service (12b-1) fee of up to 0.50% of average daily net assets. Class R4 shares of the Destination Fund are subject to a distribution and service (12b-1) fee of up to 0.25% of average daily net assets. Class I3 shares of the Destination Fund are not subject to a distribution and service (12b-1) fee. |
| | |
| Sales charges | | Shares of the Target Funds are offered without a sales charge and are not subject to a contingent deferred sales charge. | | Class R, Class R4, and Class I3 shares of the Destination Fund are offered without a sales charge and are not subject to a contingent deferred sales charge. |
| | |
| Fee waiver and expense reimbursement | | Contractual arrangements have been made with TAM through May 1, 2017 to waive fees and/or reimburse fund expenses to the extent that the total operating expenses exceed: • 1.35% for Transamerica Partners Mid Growth; and • 0.95% for Transamerica Partners Institutional Mid Growth. | | Contractual arrangements have been made with TAM through May 1, 2018 to waive fees and/or reimburse fund expenses to the extent that the Destination Fund’s total operating expenses exceed: • 1.35% for Class R shares; • 0.95% for Class R4 shares; and • 0.75% for Class I3 shares. |
- 85 -
| | | | |
| | The expense limitation excludes, as applicable, acquired fund fees and expenses, interest, taxes, brokerage commissions, dividend and interest expenses on securities sold short, extraordinary expenses and other expenses not incurred in the ordinary course of the fund’s business. These arrangements cannot be terminated prior to May 1, 2017 without the Board of Trustees’ consent. TAM has agreed to waive fees and reimburse expenses to limit the total operating expenses of Transamerica Partners Mid Growth Portfolio to 0.75%. This arrangement is voluntary and may be terminated by TAM at any time. | | The expense limitation excludes, as applicable, acquired fund fees and expenses, interest, taxes, brokerage commissions, dividend and interest expenses on securities sold short, extraordinary expenses and other expenses not incurred in the ordinary course of the fund’s business. These arrangements cannot be terminated prior to May 1, 2018 without the Board of Trustees’ consent. TAM is entitled to reimbursement by the Destination Fund of fees waived or expenses reduced during any of the previous 36 months if on any day or month the estimated annualized fund operating expenses are less than the cap. |
| |
| Gross and net expenses | | For a comparison of the gross and net expenses of the Funds, please see the class fee tables in the “The Funds’ Fees and Expenses” section. |
| 1 | Transamerica Partners Mid Growth and Transamerica Partners Institutional Mid Growth are feeder funds and invest in securities through Transamerica Partners Mid Growth Portfolio, an underlying master fund having the same investment goals and strategies. |
Comparison of Principal Risks of Investing in the Funds
Because the Funds have the same investment objective and substantially similar principal investment strategies, they are subject to similar principal risks. Risk is inherent in all investing. The value of your investment in a Fund, as well as the amount of return you receive on your investment, may fluctuate significantly from day to day and over time. You may lose part or all of your investment in a Fund or your investment may not perform as well as other similar investments.
Each Fund is subject to the following principal risks (in alphabetical order) of investing in the Fund:
Active Trading – The fund is actively managed and may purchase and sell securities without regard to the length of time held. Active trading may have a negative impact on performance by increasing transaction costs and may generate greater amounts of net short-term capital gains, which, for shareholders holding shares in taxable accounts, would generally be subject to tax at ordinary income tax rates upon distribution.
Currency – The value of investments in securities denominated in foreign currencies increases or decreases as the rates of exchange between those currencies and the U.S. dollar change. Currency conversion costs and currency fluctuations could reduce or eliminate investment gains or add to investment losses. Currency exchange rates can be volatile, and are affected by factors such as general economic conditions, the actions of the U.S. and foreign governments or central banks, the imposition of currency controls, and speculation.
Equity Securities – Equity securities represent an ownership interest in an issuer, rank junior in a company’s capital structure and consequently may entail greater risk of loss than debt securities. Equity securities include common and preferred stocks. Stock markets are volatile. The price of equity securities fluctuates based on changes in a company’s financial condition and overall market and economic conditions. If the market prices of the equity securities owned by the fund fall, the value of your investment in the fund will decline.
Foreign Investments – Investing in securities of foreign issuers or issuers with significant exposure to foreign markets involves additional risk. Foreign countries in which the fund may invest may have markets that are less liquid, less regulated and more volatile than U.S. markets. The value of the fund’s investments may decline because of factors affecting the particular issuer as well as foreign markets and issuers generally, such as unfavorable or unsuccessful government actions, reduction of government or central bank support, political or financial instability or other adverse economic or political developments. Lack of information and weaker accounting standards also may affect the value of these securities.
- 86 -
Growth Stocks – Returns on growth stocks may not move in tandem with returns on other categories of stocks or the market as a whole. Growth stocks may be particularly susceptible to larger price swings or to adverse developments. Growth stocks as a group may be out of favor and underperform the overall equity market for a long period of time, for example, while the market favors “value” stocks.
Legal and Regulatory – Legal and regulatory changes could occur that may adversely affect the fund, its investments, and its ability to pursue its investment strategies and/or increase the costs of implementing such strategies. Certain changes have already been proposed and additional changes are expected. New or revised laws or regulations may be imposed by the U.S. Securities and Exchange Commission, the U.S. Commodity Futures Trading Commission, the Internal Revenue Service, the U.S. Federal Reserve or other governmental regulatory authorities or self-regulatory organizations that could adversely affect the fund. The fund also may be adversely affected by changes in the enforcement or interpretation of existing statutes and rules by governmental regulatory authorities or self-regulatory organizations.
Market – The market prices of the fund’s securities may go up or down, sometimes rapidly or unpredictably, due to general market conditions, such as real or perceived adverse economic or political conditions, inflation, changes in interest rates or currency rates, lack of liquidity in the markets or adverse investor sentiment. Adverse market conditions may be prolonged and may not have the same impact on all types of securities. Market prices of securities also may go down due to events or conditions that affect particular sectors, industries or issuers. When market prices fall, the value of your investment will go down. The fund may experience a substantial or complete loss on any individual security.
In the past several years, financial markets, such as those in the United States, Europe, Asia and elsewhere, have experienced increased volatility, depressed valuations, decreased liquidity and heightened uncertainty. Governmental and non-governmental issuers defaulted on, or were forced to restructure, their debts. These market conditions may continue, worsen or spread.
The U.S. government and the Federal Reserve, as well as certain foreign governments and central banks have taken steps to support financial markets, including keeping interest rates at historically low levels. This and other government intervention may not work as intended, particularly if the efforts are perceived by investors as being unlikely to achieve the desired results. The Federal Reserve recently has reduced its market support activities. Further reduction or withdrawal of Federal Reserve or other U.S. or non-U.S. governmental or central bank support, including interest rate increases, could negatively affect financial markets generally, increase market volatility and reduce the value and liquidity of securities in which the fund invests.
Policy and legislative changes in the United States and in other countries are affecting many aspects of financial regulation, and may in some instances contribute to decreased liquidity and increased volatility in the financial markets. The impact of these changes on the markets, and the practical implications for market participants, may not be fully known for some time.
Economies and financial markets throughout the world are becoming increasingly interconnected. As a result, whether or not the fund invests in securities of issuers located in or with significant exposure to countries experiencing economic and financial difficulties, the value and liquidity of the fund’s investments may be negatively affected.
Medium Capitalization Companies – The fund will be exposed to additional risks as a result of its investments in the securities of medium capitalization companies. Investing in medium capitalization companies involves greater risk than is customarily associated with more established companies. The prices of securities of medium capitalization companies generally are more volatile and are more likely to be adversely affected by changes in earnings results and investor expectations or poor economic or market conditions. Securities of medium capitalization companies may underperform larger capitalization companies, may be harder to sell at times and at prices the portfolio managers believe appropriate and may offer greater potential for losses.
- 87 -
Preferred Stock – Preferred stock’s right to dividends and liquidation proceeds is junior to the rights of a company’s debt securities. The value of preferred stock may be subject to factors that affect fixed income and equity securities, including changes in interest rates and in a company’s creditworthiness. The value of preferred stock tends to vary more with fluctuations in the underlying common stock and less with fluctuations in interest rates and tends to exhibit greater volatility. Shareholders of preferred stock may suffer a loss of value if dividends are not paid and have limited voting rights.
Repurchase Agreements – If the other party to a repurchase agreement defaults on its obligation, the fund may suffer delays and incur costs or lose money in exercising its rights under the agreement. If the seller fails to repurchase the security and the market value declines, the fund could lose money. If the seller becomes insolvent and subject to liquidation or reorganization under applicable bankruptcy or other laws, the fund’s ability to dispose of the underlying securities may be restricted.
Each Fund is subject to similar management related risks. The Target Funds are subject to the following related principal risk:
Management – The fund is subject to the risk that the Investment Manager’s or sub-adviser’s judgments and decisions may be incorrect or otherwise may not produce the desired results. The value of your investment may decrease if the sub-adviser’s judgment about the quality, relative yield or value of, or market trends affecting, a particular security or issuer, industry, sector, region or market segment, or about the economy or interest rates, is incorrect. The fund may also suffer losses if there are imperfections, errors or limitations in the tools, resources, information and data used, or the analyses employed or relied on, by the sub-adviser, or if the sub-adviser’s investment style is out of favor or otherwise fails to produce the desired results. The fund’s investment strategies designed by the investment manager may not work as intended. In addition, the fund’s investment strategies or policies may change from time to time. Those changes may not lead to the results intended by the investment manager and could have an adverse effect on the value or performance of the fund. Any of these things could cause the fund to lose value or its results to lag relevant benchmarks or other funds with similar objectives.
The Destination Fund is subject to the following related principal risks:
Manager – The fund is subject to the risk that the sub-adviser’s judgments and investment decisions, as well as the methods, tools, resources, information and data, and the analyses employed or relied on by the sub-adviser to make those judgments and decisions may be incorrect or otherwise may not produce the desired results. This could cause the fund to lose value or its results to lag relevant benchmarks or other funds with similar objectives.
Portfolio Management – The value of your investment may decrease if the sub-adviser’s judgment about the quality, relative yield, value or market trends affecting a particular security or issuer, industry, sector, region or market segment, or about the economy or interest rates is incorrect, or if there are imperfections, errors or limitations in the tools and data used by the sub-adviser or manager. In addition, the fund’s investment strategies or policies may change from time to time. Those changes may not lead to the results intended by the sub-adviser and could have an adverse effect on the value or performance of the fund.
The Funds’ Past Performance
Set forth below is performance information for each Fund. The bar charts and tables below provide some indication of the risks of investing in each Fund by showing you how the performance of the Target Funds and Class A shares of the Destination Fund has varied from year to year for 10 years or since inception, as applicable, and how the average total returns of each Target Fund and the applicable class of shares of the Destination Fund for different periods compare to the returns of one or more broad measures of market performance. The performance shown below for Transamerica Partners Mid Growth Portfolio reflects only master portfolio level expenses, and does not include the expenses of any of the applicable Non-Mutual Fund Feeder Funds. If those expenses were reflected, the performance would be lower. Absent any applicable limitation of or cap on the Funds’ expenses, performance would have been lower. No performance information is presented for the Class R, Class R4 and Class I3 shares of the Destination Fund because those share classes are newly offered. Class R, Class R4 and Class I3 shares of the
- 88 -
Destination Fund would have different performance because they have different expenses. A Fund’s past performance (before and after taxes) is not necessarily an indication of how the Fund will perform in the future. Following the Reorganizations, Transamerica Partners Institutional Mid Growth will be the surviving fund for performance purposes.
Prior to June 28, 2013, the Target Funds had a different sub-adviser, a different investment objective and used different investment strategies. The performance set forth below for the Target Funds prior to that date is attributable to a previous sub-adviser.
Transamerica Partners Mid Growth Annual Returns
Annual Total Returns (calendar years ended December 31)
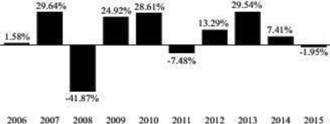
| | | | | | | | |
| | | Quarter Ended | | | Return | |
Best Quarter: | | | 12/31/2010 | | | | 17.58 | % |
Worst Quarter: | | | 12/31/2008 | | | | -25.50 | % |
Year-to-date return as of September 30, 2016: 4.11%
Transamerica Partners Mid Growth Average Annual Total Returns
Average Annual Total Returns (periods ended December 31, 2015)
| | | | | | | | | | | | | | | | |
| | | 1 Year | | | 5 Years | | | 10 Years | | | Inception Date | |
Transamerica Partners Mid Growth | | | -1.95 | % | | | 7.41 | % | | | 5.81 | % | | | 09/06/2001 | |
Russell Midcap® Growth Index (reflects no deduction for fees, expenses or taxes) | | | -0.20 | % | | | 11.54 | % | | | 8.16 | % | | | | |
Transamerica Partners Institutional Mid Growth Annual Returns
Annual Total Returns (calendar years ended December 31)
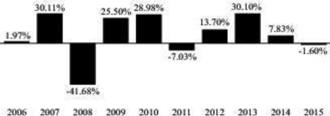
| | | | | | | | |
| | | Quarter Ended | | | Return | |
Best Quarter: | | | 12/31/2010 | | | | 17.62 | % |
Worst Quarter: | | | 12/31/2008 | | | | -25.44 | % |
Year-to-date return as of September 30, 2016: 4.45%
- 89 -
Transamerica Partners Institutional Mid Growth Average Annual Total Returns
Average Annual Total Returns (periods ended December 31, 2015)
| | | | | | | | | | | | | | | | |
| | | 1 Year | | | 5 Years | | | 10 Years | | | Inception Date | |
Transamerica Partners Institutional Mid Growth | | | -1.60 | % | | | 7.85 | % | | | 6.22 | % | | | 11/07/2001 | |
Russell Midcap® Growth Index (reflects no deduction for fees, expenses or taxes) | | | -0.20 | % | | | 11.54 | % | | | 8.16 | % | | | | |
Transamerica Partners Mid Growth Portfolio Annual Returns
Annual Total Returns (calendar years ended December 31)
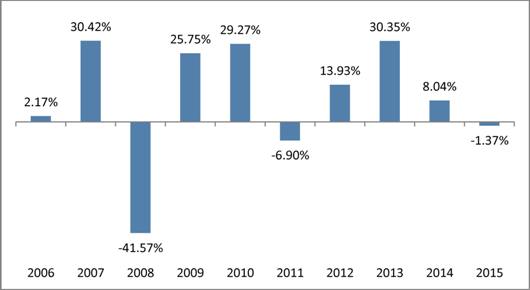
The highest and lowest quarterly returns for the periods reflected in the table above are:
| | | | | | | | |
| | | Quarter Ended | | | Return | |
Best Quarter: | | | 12/31/2010 | | | | 17.75 | % |
Worst Quarter: | | | 12/31/2008 | | | | -25.41 | % |
Year-to-date return as of September 30, 2016: 4.63%
Transamerica Partners Mid Growth Portfolio Average Annual Total Returns
(for periods ended 12/31/2015)
| | | | | | | | | | | | | | | | |
| | | 1 Year | | | 5 Years | | | 10 Years | | | Inception
Date | |
Transamerica Partners Mid Growth Portfolio | | | -1.37 | % | | | 8.06 | % | | | 6.43 | % | | | 05/01/2001 | |
Russell Midcap® Growth Index (reflects no deduction for fees, expenses or taxes) | | | -0.20 | % | | | 11.54 | % | | | 8.16 | % | | | | |
- 90 -
Transamerica Mid Cap Growth Annual Returns
Annual Total Returns (calendar years ended December 31) - Class A
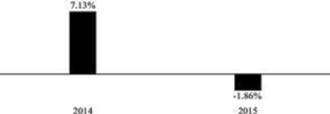
| | | | | | | | |
| | | Quarter Ended | | | Return | |
Best Quarter: | | | 03/31/2015 | | | | 7.28 | % |
Worst Quarter: | | | 09/30/2015 | | | | -11.61 | % |
Year-to-date return as of September 30, 2016: 3.71%
Transamerica Mid Cap Growth Average Annual Total Returns
Average Annual Total Returns (periods ended December 31, 2015)
| | | | | | | | | | | | |
| | | 1 Year | | | Since
Inception | | | Inception Date | |
Class A | | | | 10/31/2013 | |
Return before taxes | | | -7.29 | % | | | 2.29 | % | | | | |
Return after taxes on distributions | | | -7.29 | % | | | 2.23 | % | | | | |
Return after taxes on distributions and sale of fund shares | | | -4.13 | % | | | 1.75 | % | | | | |
Russell Midcap® Growth Index (reflects no deduction for fees, expenses or taxes) | | | -0.20 | % | | | 7.76 | % | | | | |
The after-tax returns are calculated using the historic highest individual federal marginal income tax rates and do not reflect the impact of state and local taxes. Actual after-tax returns may depend on the investor’s individual tax situation and may differ from those shown. After-tax returns may not be relevant if the investment is made through a tax-exempt or tax-deferred account, such as a 401(k) plan.
The Funds’ Fees and Expenses
Shareholders of the Target Funds and the Destination Fund pay various fees and expenses, either directly or indirectly. The tables below show the fees and expenses that you would pay if you were to buy and hold shares of each Fund. The fees and expenses in the tables appearing below are based on the expenses of the Funds for the twelve-month period ended June 30, 2016. The tables also show the pro forma expenses of the combined Destination Fund after giving effect to all Group 5 Reorganizations based on pro forma net assets as of June 30, 2016. Pro forma numbers are estimated in good faith and are hypothetical. Actual expenses may vary significantly. The fees and expenses shown in the table and Example below for Transamerica Partners Mid Growth Portfolio reflect only master portfolio level fees and expenses, and do not include the fees and expenses of any of the applicable Non-Mutual Fund Feeder Funds. For financial statement purposes, Transamerica Partners Institutional Mid Growth will be the accounting survivor of the Reorganizations. As the accounting survivor, Transamerica Partners Institutional Mid Growth’s operating history will be used for financial reporting purposes.
- 91 -
Transamerica Partners Mid Growth
| | | | | | | | | | | | |
| | | Transamerica
Partners Mid
Growth1 | | | Transamerica
Mid Cap
Growth | | | Combined
Transamerica
Mid Cap
Growth
(Pro Forma) | |
| | | | | | Class R | | | Class R | |
Shareholder Fees (fees paid directly from your investment) | | | | | | | | | | | | |
Maximum sales charge (load) imposed on purchases (as a % of offering price) | | | None | | | | None | | | | None | |
Maximum deferred sales charge (load) (as a % of offering price) | | | None | | | | None | | | | None | |
Redemption fee (as a % of amount redeemed) | | | None | | | | None | | | | None | |
| | | |
Annual Fund Operating Expenses (expenses that you pay each year as a % of the value of your investment) | | | | | | | | | | | | |
Management fees2 | | | 0.72 | % | | | 0.75 | % | | | 0.75 | % |
Distribution and service (12b-1) fees | | | 0.25 | % | | | 0.50 | % | | | 0.50 | % |
Other expenses3 | | | 0.48 | % | | | 0.04 | %4 | | | 0.04 | %4 |
Total annual fund operating expenses | | | 1.45 | % | | | 1.29 | % | | | 1.29 | % |
Fee waiver and/or expense reimbursement | | | 0.10 | %5 | | | 0.00 | %6 | | | 0.00 | %6 |
Total annual fund operating expenses after fee waiver and/or expense reimbursement | | | 1.35 | % | | | 1.29 | % | | | 1.29 | % |
Transamerica Partners Institutional Mid Growth
| | | | | | | | | | | | |
| | | Transamerica
Partners
Institutional
Mid Growth1 | | | Transamerica
Mid Cap
Growth | | | Combined
Transamerica
Mid Cap
Growth
(Pro Forma) | |
| | | | | | Class R4 | | | Class R4 | |
Shareholder Fees (fees paid directly from your investment) | | | | | | | | | | | | |
Maximum sales charge (load) imposed on purchases (as a % of offering price) | | | None | | | | None | | | | None | |
Maximum deferred sales charge (load) (as a % of offering price) | | | None | | | | None | | | | None | |
Redemption fee (as a % of amount redeemed) | | | None | | | | None | | | | None | |
| | | |
Annual Fund Operating Expenses (expenses that you pay each year as a % of the value of your investment) | | | | | | | | | | | | |
Management fees2 | | | 0.72 | % | | | 0.75 | % | | | 0.75 | % |
Distribution and service (12b-1) fees | | | 0.25 | % | | | 0.25 | % | | | 0.25 | % |
Other expenses3 | | | 0.43 | % | | | 0.04 | %4 | | | 0.04 | %4 |
Total annual fund operating expenses | | | 1.40 | % | | | 1.04 | % | | | 1.04 | % |
Fee waiver and/or expense reimbursement | | | 0.45 | %7 | | | 0.09 | %6 | | | 0.09 | %6 |
Total annual fund operating expenses after fee waiver and/or expense reimbursement | | | 0.95 | % | | | 0.95 | % | | | 0.95 | % |
- 92 -
Transamerica Partners Mid Growth Portfolio
| | | | | | | | | | | | |
| | | Transamerica
Partners Mid
Growth
Portfolio | | | Transamerica
Mid Cap
Growth | | | Combined
Transamerica
Mid Cap
Growth
(Pro Forma) | |
| | | | | | Class I3 | | | Class I3 | |
Shareholder Fees (fees paid directly from your investment) | | | | | | | | | | | | |
Maximum sales charge (load) imposed on purchases (as a % of offering price) | | | None | | | | None | | | | None | |
Maximum deferred sales charge (load) (as a % of offering price) | | | None | | | | None | | | | None | |
Redemption fee (as a % of amount redeemed) | | | None | | | | None | | | | None | |
| | | |
Annual Fund Operating Expenses (expenses that you pay each year as a % of the value of your investment) | | | | | | | | | | | | |
Management fees2 | | | 0.72 | % | | | 0.75 | % | | | 0.75 | % |
Distribution and service (12b-1) fees | | | None | | | | None | | | | None | |
Other expenses3 | | | 0.05 | % | | | 0.04 | %4 | | | 0.04 | %4 |
Total annual fund operating expenses | | | 0.77 | % | | | 0.79 | % | | | 0.79 | % |
Fee waiver and/or expense reimbursement | | | N/A | | | | 0.04 | %6 | | | 0.04 | %6 |
Total annual fund operating expenses after fee waiver and/or expense reimbursement | | | 0.77 | % | | | 0.75 | % | | | 0.75 | % |
| 1 | The Target Feeder Fund invests in securities through an underlying Target Master Portfolio, Transamerica Partners Mid Growth Portfolio. The information in this table and in the Example below concerning the Target Feeder Fund reflects the direct fees and expenses of the Target Feeder Fund and its allocated share of the fees and expenses of the Target Master Portfolio. |
| 2 | The Destination Fund receives investment advisory and administrative services under one agreement with the Destination Fund’s investment manager, Transamerica Asset Management, Inc. (“TAM”), and pays a single management fee to TAM. Transamerica Partners Mid Growth and Transamerica Partners Institutional Mid Growth receive investment advisory and administrative services from TAM under separate agreements and pay separate advisory fees and administrative services fees to TAM. The administrative services fees of 0.30% for Transamerica Partners Mid Growth and 0.05% for Transamerica Partners Institutional Mid Growth are included in “Other expenses.” Transamerica Partners Mid Growth Portfolio receives investment advisory services from TAM and pays advisory fees to TAM. Transamerica Partners Mid Growth Portfolio pays no separate administrative services fees. |
| 3 | Other expenses do not include the costs of the Reorganization to be borne by the Target Funds and the Destination Fund. These costs are considered extraordinary expenses and are not covered by the applicable expense limitation arrangements. The basis point impact of such costs is 0.00% for Transamerica Partners Mid Growth, 0.00% for Transamerica Partners Institutional Mid Growth, 0.07% for Transamerica Partners Mid Growth Portfolio and 0.00% for Transamerica Mid Cap Growth. |
| 4 | Other expenses are based on estimates for the current fiscal year. Actual expenses may differ from estimates. |
| 5 | Contractual arrangements have been made with TAM through May 1, 2017 to waive fees and/or reimburse fund expenses to the extent that the fund’s total operating expenses exceed 1.35%, excluding, as applicable, acquired fund fees and expenses, interest, taxes, brokerage commissions, dividend and interest expenses on securities sold short, extraordinary expenses and other expenses not incurred in the ordinary course of the fund’s business. |
| 6 | Contractual arrangements have been made with TAM through May 1, 2018 to waive fees and/or reimburse fund expenses to the extent that the fund’s total operating expenses exceed 1.35% for Class R shares, 0.95% for Class R4 shares and 0.75% for Class I3 shares, excluding, as applicable, acquired fund fees and expenses, interest, taxes, brokerage commissions, dividend and interest expenses on securities sold short, extraordinary expenses and other expenses not incurred in the ordinary course of the fund’s business. These arrangements cannot be terminated prior to May 1, 2018 without the Board of Trustees’ consent. TAM is entitled to reimbursement by the fund of fees waived or expenses reduced during any of the previous 36 months if on any day or month the estimated annualized fund operating expenses are less than the cap. |
| 7 | Contractual arrangements have been made with TAM through May 1, 2017 to waive fees and/or reimburse fund expenses to the extent that the fund’s total operating expenses exceed 0.95%, excluding, as applicable, acquired fund fees and expenses, interest, taxes, brokerage commissions, dividend and interest expenses on securities sold short, extraordinary expenses and other expenses not incurred in the ordinary course of the fund’s business. |
- 93 -
The hypothetical examples below help you compare the cost of investing in each Fund. Each example assumes that:
| | • | | you invest $10,000 in each Fund; |
| | • | | you reinvest all dividends and distributions without a sales charge; |
| | • | | your investment has a 5% annual return (this assumption is required by the SEC and is not a prediction of the Fund’s future performance); and |
| | • | | each Fund’s operating expenses remain the same. |
Each example also assumes no fees for IRA accounts, if applicable. Costs are the same whether you redeem at the end of any period or not. Pro forma expenses are included assuming the consummation of all Group 1 Reorganizations. The examples are for comparison purposes only and do not represent the Funds’ actual expenses or returns, either past or future. Because actual return and expenses will be different, the examples are for comparison only.
Transamerica Partners Mid Growth
| | | | | | | | | | | | |
Number of years you own your shares | | Transamerica
Partners Mid
Growth | | | Transamerica
Mid Cap Growth | | | Combined
Transamerica Mid
Cap Growth
(Pro Forma) | |
| | | | | | Class R | | | Class R | |
Year 1 | | $ | 137 | | | $ | 131 | | | $ | 131 | |
Year 3 | | $ | 449 | | | $ | 409 | | | $ | 409 | |
Year 5 | | $ | 783 | | | $ | 708 | | | $ | 708 | |
Year 10 | | $ | 1,727 | | | $ | 1,556 | | | $ | 1,556 | |
Transamerica Partners Institutional Mid Growth
| | | | | | | | | | | | |
Number of years you own your shares | | Transamerica
Partners
Institutional Mid
Growth | | | Transamerica
Mid Cap Growth | | | Combined
Transamerica Mid
Cap Growth
(Pro Forma) | |
| | | | | | Class R4 | | | Class R4 | |
Year 1 | | $ | 97 | | | $ | 97 | | | $ | 97 | |
Year 3 | | $ | 399 | | | $ | 322 | | | $ | 322 | |
Year 5 | | $ | 723 | | | $ | 565 | | | $ | 565 | |
Year 10 | | $ | 1,641 | | | $ | 1,263 | | | $ | 1,263 | |
Transamerica Partners Mid Growth Portfolio
| | | | | | | | | | | | |
Number of years you own your shares | | Transamerica
Partners Mid
Growth Portfolio | | | Transamerica
Mid Cap Growth | | | Combined
Transamerica Mid
Cap Growth
(Pro Forma) | |
| | | | | | Class I3 | | | Class I3 | |
Year 1 | | $ | 79 | | | $ | 77 | | | $ | 77 | |
Year 3 | | $ | 246 | | | $ | 248 | | | $ | 248 | |
Year 5 | | $ | 428 | | | $ | 435 | | | $ | 435 | |
Year 10 | | $ | 954 | | | $ | 974 | | | $ | 974 | |
- 94 -
CAPITALIZATION
The following tables set forth the capitalization of each Target Fund and the Destination Fund as of September 30, 2016 and the pro forma combined capitalization of the combined Destination Fund as if the Reorganizations had occurred on that date. If the Reorganizations are consummated, the actual exchange ratios on the closing date may vary from the exchange ratios used in the computation below. This is due to changes in the market value of the portfolio securities of the Funds between September 30, 2016 and the closing date, changes in the amount of undistributed net investment income and net realized capital gains of the Funds during that period resulting from income and distributions, and changes in the accrued liabilities of the Funds during the same period.
Transamerica Partners Mid Growth Funds
| | | | | | | | | | | | |
| | | Transamerica
Partners Mid
Growth | | | Transamerica
Partners
Institutional Mid
Growth | | | Transamerica
Partners Mid
Growth Portfolio | |
Net Assets | | $ | 48,584,495 | | | $ | 16,098,291 | | | $ | 32,364,184 | |
| | | |
Net Asset Value Per Share | | $ | 9.07 | | | $ | 10.24 | | | $ | 11.57 | |
| | | |
Shares Outstanding | | | 5,354,115 | | | | 1,571,472 | | | | 2,797,250 | |
Transamerica Mid Cap Growth
| | | | | | | | |
| | | Transamerica
Mid Cap
Growth | | | Transamerica Mid
Cap Growth
Pro Forma | |
Net Assets | | | | | | | | |
Class A | | $ | 5,002,635 | | | $ | 5,002,635 | |
Class C | | $ | 705,969 | | | $ | 705,969 | |
Class I | | $ | 451,439 | | | $ | 451,439 | |
Class I2 | | $ | 140,742,643 | | | $ | 140,742,643 | |
Advisor Class | | | — | | | | — | |
Class R | | | — | | | $ | 48,584,495 | |
Class R4 | | | — | | | $ | 16,098,291 | |
Class I3 | | | — | | | $ | 32,238,237 | |
Net Asset Value Per Share | | | | | | | | |
Class A | | $ | 11.47 | | | $ | 11.47 | |
Class C | | $ | 11.26 | | | $ | 11.26 | |
Class I | | $ | 11.54 | | | $ | 11.54 | |
Class I2 | | $ | 11.57 | | | $ | 11.57 | |
Advisor Class | | | — | | | | — | |
Class R | | $ | 11.57 | | | $ | 11.57 | |
Class R4 | | $ | 11.57 | | | $ | 11.57 | |
Class I3 | | $ | 11.57 | | | $ | 11.52 | |
Shares Outstanding | | | | | | | | |
Class A | | | 436,021 | | | | 436,021 | |
Class C | | | 62,680 | | | | 62,680 | |
Class I | | | 39,119 | | | | 39,119 | |
Class I2 | | | 12,162,347 | | | | 12,162,347 | |
Advisor Class | | | — | | | | — | |
Class R | | | — | | | | 4,199,178 | |
Class R4 | | | — | | | | 1,391,382 | |
Class I3 | | | — | | | | 2,797,250 | |
- 95 -
It is impossible to predict with any certainty how many shares of the Destination Fund will actually be received and distributed by a Target Fund on the closing date. The foregoing table should not be relied upon to determine the amount of Destination Fund shares that will actually be received and distributed.
ADDITIONAL INFORMATION
For information relating to each Fund and its Reorganization, including tax capital loss carryforwards, the tax status of the Reorganization, a comparison of the fundamental investment policies of the Funds, how to buy, sell or exchange Fund shares, how each Fund values its securities, financial highlights information for each Fund and ownership of shares of the Funds, please see the sections immediately following the discussion of the Group 9 Reorganizations.
TARGET FUND BOARD’S EVALUATION AND RECOMMENDATION
With respect to each Target Fund, the Board of the Target Fund, including its Independent Trustees, after careful consideration, unanimously determined that the Reorganization is in the best interest of the Target Fund and will not dilute the interests of the existing holders of the Target Fund. Each Board made this determination based on various factors, which include those that are discussed in the section entitled “Reasons for the Proposed Reorganizations” in the back of this Proxy Statement/Prospectus following the discussion of the proposals.
Similarly, the Board of the Destination Fund, including all its Independent Trustees, has approved the Reorganization with respect to the Destination Fund. The Board has determined that the Reorganization is in the best interest of the Destination Fund and that the interests of the Destination Fund’s holders will not be diluted as a result of the Reorganization.
THE BOARD OF YOUR TARGET FUND RECOMMENDS THAT YOU VOTE “FOR” PROPOSAL 5A, 5B OR 5C, AS APPLICABLE, TO APPROVE THE PLAN.
- 96 -
GROUP 6 – MID VALUE FUNDS
TRANSAMERICA PARTNERS MID VALUE
TRANSAMERICA PARTNERS INSTITUTIONAL MID VALUE
TRANSAMERICA PARTNERS MID VALUE PORTFOLIO
(each, a “Target Fund” and together, the “Target Funds”)
AND
TRANSAMERICA MID CAP VALUE OPPORTUNITIES
(the “Destination Fund”)
PROPOSALS 6A, 6B AND 6C
APPROVAL OF AGREEMENT AND PLAN OF REORGANIZATION
SUMMARY
The following is a summary of more complete information appearing later in this Proxy Statement/Prospectus or incorporated herein. You should read carefully the entire Proxy Statement/Prospectus, including the form of Plan attached as Exhibit A, which includes additional information that is not included in the summary and is a part of this Proxy Statement/Prospectus. For a discussion of the terms of the Plan, please see the section entitled “Terms of Each Agreement and Plan of Reorganization” in the back of this Proxy Statement/Prospectus, after the discussion of the proposals.
In each proposed Reorganization, the Target Fund would be reorganized into the Destination Fund, with that Target Fund receiving shares of the applicable class of the Destination Fund as shown in the following table. The Target Funds, which operate in a master-feeder structure, do not have share classes.
| | | | |
Proposal | | Target Fund | | Destination Fund and Shares |
Proposal 6A | | Transamerica Partners Mid Value | | Transamerica Mid Cap Value Opportunities
Class R |
Proposal 6B | | Transamerica Partners Institutional Mid Value | | Transamerica Mid Cap Value Opportunities
Class R4 |
Proposal 6C | | Transamerica Partners Mid Value Portfolio | | Transamerica Mid Cap Value Opportunities
Class I3 |
Transamerica Partners Mid Value would reorganize first, Transamerica Partners Institutional Mid Value would reorganize next and Transamerica Partners Mid Value Portfolio would reorganize last. All Reorganizations would occur on the same closing date.
The Target Funds and the Destination Fund are managed by Transamerica Asset Management, Inc. (“TAM”) and have substantially similar investment objectives and substantially similar principal investment strategies and related risks. The tables below provide a comparison of certain features of the Funds. Unless otherwise noted, the information is the same for each Target Fund. In the tables below, if a row extends across the entire table, the information applies to the Destination Fund and the Target Funds.
Comparison of Target Funds and Destination Fund
| | | | |
| | | Target Funds | | Destination Fund |
| Investment objective | | Seeks to provide a high total investment return. | | Seeks to provide investors with long term capital growth. |
| | |
| Principal investment strategies1 | | The fund invests primarily in stocks of medium sized companies that the fund’s sub-advisers, J.P. Morgan Investment Management Inc. and Thompson, Siegel & Walmsley LLC (the “sub-advisers”), believe have below market valuations and present | | Under normal circumstances, the fund invests at least 80% of its net assets (plus the amount of borrowings, if any, for investment purposes) in equity securities of mid cap companies. The fund’s sub-adviser, Thompson, Siegel & Walmsley LLC (the |
- 97 -
| | | | |
| | an opportunity for earnings improvement. Under normal circumstances, the fund invests at least 80% of its net assets (plus the amount of borrowings, if any, for investment purposes) in equity securities of mid cap companies. Mid cap companies are companies with market capitalizations equal to those within the universe of the Russell Midcap® Value Index and/or between $1 billion and $20 billion at the time of purchase. As of the date of the last reconstitution of the Russell Midcap® Value Index on June 26, 2015, the market capitalizations of the companies in the index ranged from $1.6 billion to $27.5 billion. Over time, the capitalizations of the companies in the index will change. As they do, the size of the companies in which the fund invests may change. The fund’s equity securities may include common stocks and preferred stocks listed on the New York Stock Exchange and on other national securities exchanges and, to a lesser extent, stocks that are traded over-the-counter. The fund emphasizes common stocks. The fund may also invest in foreign securities and real estate investment trusts (REITs). The fund may, but is not required to, engage in certain investment strategies involving derivatives, such as options, futures, forward currency contracts and swaps, including, but not limited to, interest rate, total return and credit default swaps. These investment strategies may be employed to attempt to alter investment characteristics of the fund’s portfolio (including to attempt to mitigate risk of loss in some fashion, or “hedge”), but they also may be used to generate income. | | “sub-adviser”), considers mid cap companies to be those companies with market capitalizations within the range of companies included in the Russell Midcap® Value Index (between approximately $4.3 billion and $29 billion as of its most recent reconstitution on May 30, 2015). The size of the companies in the Russell Midcap® Value Index will change with market conditions. The fund may invest in other equity and non-equity securities, including preferred stocks, convertible securities and foreign securities which may take the form of depositary receipts. The fund primarily invests in common stocks. The sub-adviser seeks to invest in companies it believes present a value or potential worth that is not recognized by prevailing market prices or that have experienced some fundamental changes and are intrinsically undervalued by the investment community. The sub-adviser’s mid cap value process uses a combination of quantitative and qualitative methods and is based on a four-factor valuation screen. Parts one and two of the screen attempt to assess a company’s discount to private market value relative to other mid cap stocks. The third factor considers the relative earnings prospects of the company. The fourth factor involves looking at the company’s recent price action. The sub-adviser’s analysts also explore numerous factors that might affect the outlook for a company. They evaluate publicly available information including, but not limited to, sell-side research, company filings, and trade periodicals. The analysts may speak with company management to hear their perspectives and outlook on the pertinent business issues. They apply a consistent and disciplined review in a team environment that encourages critical thinking and analysis for each company considered for investment. The sub-adviser generally considers selling a security when the catalyst for the investment is no longer valid, when the sub-adviser believes that another stock will have a higher expected return, or for portfolio risk management. The fund generally engages in active and frequent trading of portfolio securities as part of its principal investment strategy. |
| |
| Investment manager | | TAM |
| | |
| Sub-adviser | | Thompson, Siegel & Walmsley LLC J.P. Morgan Investment Management Inc. | | Thompson, Siegel & Walmsley LLC |
- 98 -
| | | | |
| | |
| Portfolio managers | | Brett P. Hawkins, CFA: Portfolio Manager of the Target Funds since 2014; Chief Investment Officer; Portfolio Manager at Thompson, Siegel & Walmsley LLC since 2001 Gloria Fu, CFA: Portfolio Manager of the Target Funds since 2009; Employee of J.P. Morgan Investment Management Inc. since 2002; Managing Director; Member of the U.S. Equity Value Group Lawrence Playford, CFA: Portfolio Manager of the Target Funds since 2009; Employee of J.P. Morgan Investment Management Inc. since 1993; Managing Director; Member of the U.S. Equity Value Group Jonathan K. L. Simon: Portfolio Manager of the Target Funds since 2009; Employee of J.P. Morgan Investment Management Inc. since 1980; Managing Director; Member of the U.S. Equity Value Group | | Brett P. Hawkins, CFA: Portfolio Manager of the Target Funds since 2014; Chief Investment Officer; Portfolio Manager at Thompson, Siegel & Walmsley LLC since 2001 |
| | |
| Business | | Transamerica Partners Mid Value is a diversified series of TPFG, an open-end management investment company organized as a Massachusetts business trust. Transamerica Partners Institutional Mid Value is a diversified series of TPFG II, an open-end management investment company organized as a Massachusetts business trust. Transamerica Partners Mid Value Portfolio is a diversified series of TPP, an open-end management investment company and a trust governed by New York law. | | The Destination Fund is a diversified series of the Destination Trust, an open-end management investment company organized as a Delaware statutory trust. |
| | |
| Net assets (as of June 30, 2016) | | Transamerica Partners Mid Value = $128,975,102 Transamerica Partners Institutional Mid Value = $427,931,478 Transamerica Partners Mid Value Portfolio (excluding the Target Feeder Funds) = $844,090,693 | | $1,082,005,273 |
| | |
| Management fees | | TAM receives compensation for investment advisory services from the Target Funds at annual rates of 0.67% of the first $750 million; 0.665% over $750 million up to $1.5 billion; 0.655% over $1.5 billion up to $2 billion; and 0.6475% in excess of $2 billion. TAM also receives compensation for administrative services from Transamerica | | TAM receives compensation for investment management services, which include investment advisory and administrative services, from the Destination Fund at annual rates of 0.70% of the first $750 million; 0.695% over $750 million up to $1.5 billion; 0.685% over $1.5 billion up to $2 billion; and 0.6775% in excess of $2 billion. |
- 99 -
| | | | |
| | Partners Mid Value and Transamerica Partners Institutional Mid Value at annual rates of 0.30% and 0.05%, respectively. Transamerica Partners Mid Value Portfolio pays no separate administrative services fees. The applicable fee(s) are based upon average daily net assets and are accrued daily and paid monthly. | | The fee is based upon average daily net assets and is accrued daily and paid monthly. |
| | |
| Distribution and service (12b-1) fees | | Transamerica Partners Mid Value is subject to a distribution and service (12b-1) fee of up to 0.25% of average daily net assets. Transamerica Partners Institutional Mid Value is subject to a distribution and service (12b-1) fee of up to 0.25% of average daily net assets. Transamerica Partners Mid Value Portfolio is not subject to a distribution and service (12b-1) fee. | | Class R shares of the Destination Fund are subject to a distribution and service (12b-1) fee of up to 0.50% of average daily net assets. Class R4 shares of the Destination Fund are subject to a distribution and service (12b-1) fee of up to 0.25% of average daily net assets. Class I3 shares of the Destination Fund are not subject to a distribution and service (12b-1) fee. |
| | |
| Sales charges | | Shares of the Target Funds are offered without a sales charge and are not subject to a contingent deferred sales charge. | | Class R, Class R4, and Class I3 shares of the Destination Fund are offered without a sales charge and are not subject to a contingent deferred sales charge. |
| | |
| Fee waiver and expense reimbursement | | Contractual arrangements have been made with TAM through May 1, 2017 to waive fees and/or reimburse fund expenses to the extent that the total operating expenses exceed: • 1.25% for Transamerica Partners Mid Value; and • 0.90% for Transamerica Partners Institutional Mid Value. The expense limitation excludes, as applicable, acquired fund fees and expenses, interest, taxes, brokerage commissions, dividend and interest expenses on securities sold short, extraordinary expenses and other expenses not incurred in the ordinary course of the fund’s business. These arrangements cannot be terminated prior to May 1, 2017 without the Board of Trustees’ consent. TAM has agreed to waive fees and reimburse expenses to limit the total operating expenses of Transamerica Partners Mid Value Portfolio to 0.70%. This arrangement is voluntary and may be terminated by TAM at any time. | | Contractual arrangements have been made with TAM through May 1, 2018 to waive fees and/or reimburse fund expenses to the extent that the Destination Fund’s total operating expenses exceed: • 1.25% for Class R shares; • 0.90% for Class R4 shares; and • 0.70% for Class I3 shares. The expense limitation excludes, as applicable, acquired fund fees and expenses, interest, taxes, brokerage commissions, dividend and interest expenses on securities sold short, extraordinary expenses and other expenses not incurred in the ordinary course of the fund’s business. These arrangements cannot be terminated prior to May 1, 2018 without the Board of Trustees’ consent. TAM is entitled to reimbursement by the Destination Fund of fees waived or expenses reduced during any of the previous 36 months if on any day or month the estimated annualized fund operating expenses are less than the cap. |
| |
| Gross and net expenses | | For a comparison of the gross and net expenses of the Funds, please see the class fee tables in the “The Funds’ Fees and Expenses” section. |
| 1 | Transamerica Partners Mid Value and Transamerica Partners Institutional Mid Value are feeder funds and invest in securities through Transamerica Partners Mid Value Portfolio, an underlying master fund having the same investment goals and strategies. |
- 100 -
Comparison of Principal Risks of Investing in the Funds
Because the Funds have substantially similar investment objectives and principal investment strategies, they are subject to similar principal risks. Risk is inherent in all investing. The value of your investment in a Fund, as well as the amount of return you receive on your investment, may fluctuate significantly from day to day and over time. You may lose part or all of your investment in a Fund or your investment may not perform as well as other similar investments.
Each Fund is subject to the following principal risks (in alphabetical order) of investing in the Fund:
Currency – The value of investments in securities denominated in foreign currencies increases or decreases as the rates of exchange between those currencies and the U.S. dollar change. Currency conversion costs and currency fluctuations could reduce or eliminate investment gains or add to investment losses. Currency exchange rates can be volatile, and are affected by factors such as general economic conditions, the actions of the U.S. and foreign governments or central banks, the imposition of currency controls, and speculation.
Equity Securities – Equity securities represent an ownership interest in an issuer, rank junior in a company’s capital structure and consequently may entail greater risk of loss than debt securities. Equity securities include common and preferred stocks. Stock markets are volatile. The price of equity securities fluctuates based on changes in a company’s financial condition and overall market and economic conditions. If the market prices of the equity securities owned by the fund fall, the value of your investment in the fund will decline.
Foreign Investments – Investing in securities of foreign issuers or issuers with significant exposure to foreign markets involves additional risk. Foreign countries in which the fund may invest may have markets that are less liquid, less regulated and more volatile than U.S. markets. The value of the fund’s investments may decline because of factors affecting the particular issuer as well as foreign markets and issuers generally, such as unfavorable or unsuccessful government actions, reduction of government or central bank support, political or financial instability or other adverse economic or political developments. Lack of information and weaker accounting standards also may affect the value of these securities.
Legal and Regulatory – Legal and regulatory changes could occur that may adversely affect the fund, its investments, and its ability to pursue its investment strategies and/or increase the costs of implementing such strategies. Certain changes have already been proposed and additional changes are expected. New or revised laws or regulations may be imposed by the U.S. Securities and Exchange Commission, the U.S. Commodity Futures Trading Commission, the Internal Revenue Service, the U.S. Federal Reserve or other governmental regulatory authorities or self-regulatory organizations that could adversely affect the fund. The fund also may be adversely affected by changes in the enforcement or interpretation of existing statutes and rules by governmental regulatory authorities or self-regulatory organizations.
Market – The market prices of the fund’s securities may go up or down, sometimes rapidly or unpredictably, due to general market conditions, such as real or perceived adverse economic or political conditions, inflation, changes in interest rates or currency rates, lack of liquidity in the markets or adverse investor sentiment. Adverse market conditions may be prolonged and may not have the same impact on all types of securities. Market prices of securities also may go down due to events or conditions that affect particular sectors, industries or issuers. When market prices fall, the value of your investment will go down. The fund may experience a substantial or complete loss on any individual security.
In the past several years, financial markets, such as those in the United States, Europe, Asia and elsewhere, have experienced increased volatility, depressed valuations, decreased liquidity and heightened uncertainty. Governmental and non-governmental issuers defaulted on, or were forced to restructure, their debts. These market conditions may continue, worsen or spread.
The U.S. government and the Federal Reserve, as well as certain foreign governments and central banks have taken steps to support financial markets, including keeping interest rates at historically low levels. This and other
- 101 -
government intervention may not work as intended, particularly if the efforts are perceived by investors as being unlikely to achieve the desired results. The Federal Reserve recently has reduced its market support activities. Further reduction or withdrawal of Federal Reserve or other U.S. or non-U.S. governmental or central bank support, including interest rate increases, could negatively affect financial markets generally, increase market volatility and reduce the value and liquidity of securities in which the fund invests.
Policy and legislative changes in the United States and in other countries are affecting many aspects of financial regulation, and may in some instances contribute to decreased liquidity and increased volatility in the financial markets. The impact of these changes on the markets, and the practical implications for market participants, may not be fully known for some time.
Economies and financial markets throughout the world are becoming increasingly interconnected. As a result, whether or not the fund invests in securities of issuers located in or with significant exposure to countries experiencing economic and financial difficulties, the value and liquidity of the fund’s investments may be negatively affected.
Medium Capitalization Companies – The fund will be exposed to additional risks as a result of its investments in the securities of medium capitalization companies. Investing in medium capitalization companies involves greater risk than is customarily associated with more established companies. The prices of securities of medium capitalization companies generally are more volatile and are more likely to be adversely affected by changes in earnings results and investor expectations or poor economic or market conditions. Securities of medium capitalization companies may underperform larger capitalization companies, may be harder to sell at times and at prices the portfolio managers believe appropriate and may offer greater potential for losses.
Preferred Stock – Preferred stock’s right to dividends and liquidation proceeds is junior to the rights of a company’s debt securities. The value of preferred stock may be subject to factors that affect fixed income and equity securities, including changes in interest rates and in a company’s creditworthiness. The value of preferred stock tends to vary more with fluctuations in the underlying common stock and less with fluctuations in interest rates and tends to exhibit greater volatility. Shareholders of preferred stock may suffer a loss of value if dividends are not paid and have limited voting rights.
Value Investing – The prices of securities the sub-adviser believes are undervalued may not appreciate as anticipated or may go down. Value stocks as a group may be out of favor and underperform the overall equity market for a long period of time, for example, while the market favors “growth” stocks.
Each Fund is subject to similar management related risks. The Target Funds are subject to the following related principal risk:
Counterparty – The fund will be subject to credit risk (meaning the risk of adverse changes in an issuer’s real or perceived financial strength) with respect to counterparties to derivatives, repurchase agreements and other financial contracts entered into by the fund or held by special purpose or structured vehicles. Adverse changes to counterparties may cause the value of financial contracts to go down. If a counterparty becomes bankrupt or otherwise fails to perform its obligations due to financial difficulties, the value of your investment in the fund may decline.
Derivatives – Using derivatives exposes the fund to additional risks and can increase fund losses and reduce opportunities for gains when market prices, interest rates, currencies, or the derivatives themselves, behave in a way not anticipated by the fund. Using derivatives also can have a leveraging effect and increase fund volatility. Certain derivatives have the potential for unlimited loss, regardless of the size of the initial investment. Derivatives may be difficult to sell, unwind or value, and the counterparty may default on its obligations to the fund. Use of derivatives may have different tax consequences for the fund than an investment in the underlying security, and those differences may affect the amount, timing and character of income distributed to shareholders. The U.S. government and foreign governments are in the process of adopting and implementing regulations governing derivatives markets, including mandatory clearing of certain derivatives, margin and reporting requirements. The
- 102 -
ultimate impact of the regulations remains unclear. Additional regulation of derivatives may make derivatives more costly, limit their availability or utility, otherwise adversely affect their performance or disrupt markets. For additional information regarding derivatives, see “More on Risks of Investing in the Funds—More on Principal Risks: Derivatives” in the prospectus. In addition, the SEC has proposed a new rule that would change the regulation of the use of derivatives by registered investment companies, such as the fund. If the proposed rule takes effect, it could limit the ability of the fund to invest in derivatives.
Leveraging – The value of your investment may be more volatile to the extent that the fund borrows or uses derivatives or other investments that have a leveraging effect on the fund. Other risks also will be compounded. This is because leverage generally magnifies the effect of a change in the value of an asset and creates a risk of loss of value on a larger pool of assets than the fund would otherwise have had. The use of leverage is considered to be a speculative investment practice and may result in the loss of a substantial amount, and possibly all, of the fund’s assets. The fund also may have to sell assets at inopportune times to satisfy its obligations.
Management – The fund is subject to the risk that the Investment Manager’s or sub-adviser’s judgments and decisions may be incorrect or otherwise may not produce the desired results. The value of your investment may decrease if the sub-adviser’s judgment about the quality, relative yield or value of, or market trends affecting, a particular security or issuer, industry, sector, region or market segment, or about the economy or interest rates, is incorrect. The fund may also suffer losses if there are imperfections, errors or limitations in the tools, resources, information and data used, or the analyses employed or relied on, by the sub-adviser, or if the sub-adviser’s investment style is out of favor or otherwise fails to produce the desired results. The fund’s investment strategies designed by the investment manager may not work as intended. In addition, the fund’s investment strategies or policies may change from time to time. Those changes may not lead to the results intended by the investment manager and could have an adverse effect on the value or performance of the fund. Any of these things could cause the fund to lose value or its results to lag relevant benchmarks or other funds with similar objectives.
REITs – Investing in real estate investment trusts (“REITs”) involves unique risks. When the fund invests in REITs, it is subject to risks generally associated with investing in real estate. A REIT’s performance depends on the types and locations of the properties it owns, how well it manages those properties and cash flow. REITs may have lower trading volumes and may be subject to more abrupt or erratic price movements than the overall securities markets. In addition to its own expenses, the fund will indirectly bear its proportionate share of any management and other expenses paid by REITs in which it invests. U.S. REITs are subject to a number of highly technical tax-related rules and requirements; and a U.S. REIT’s failure to qualify for the favorable U.S. federal income tax treatment generally available to U.S. REITs could result in corporate-level taxation, significantly reducing the return on an investment to the fund.
The Destination Fund is subject to the following related principal risks:
Active Trading – The fund is actively managed and may purchase and sell securities without regard to the length of time held. Active trading may have a negative impact on performance by increasing transaction costs and may generate greater amounts of net short-term capital gains, which, for shareholders holding shares in taxable accounts, would generally be subject to tax at ordinary income tax rates upon distribution.
Convertible Securities – Convertible securities share investment characteristics of both fixed income and equity securities. The value of these securities may vary more with fluctuations in the value of the underlying common stock than with fluctuations in interest rates. The value of convertible securities also may be less volatile than the underlying common stock. Convertible securities generally offer lower interest or dividend yields than non-convertible securities of similar quality. The fund could lose money if the issuer of a convertible security is unable to meet its financial obligations or goes bankrupt.
Depositary Receipts – Depositary receipts may be less liquid than the underlying shares in their primary trading market. Any distributions paid to the holders of depositary receipts are usually subject to a fee charged by the depositary. Holders of depositary receipts may have limited voting rights, and investment restrictions in certain
- 103 -
countries may adversely impact the value of depositary receipts because such restrictions may limit the ability to convert equity shares into depositary receipts and vice versa. Such restrictions may cause equity shares of the underlying issuer to trade at a discount or premium to the market price of the depositary receipts.
Manager – The fund is subject to the risk that the sub-adviser’s judgments and investment decisions, as well as the methods, tools, resources, information and data, and the analyses employed or relied on by the sub-adviser to make those judgments and decisions may be incorrect or otherwise may not produce the desired results. This could cause the fund to lose value or its results to lag relevant benchmarks or other funds with similar objectives.
Portfolio Management – The value of your investment may decrease if the sub-adviser’s judgment about the quality, relative yield, value or market trends affecting a particular security or issuer, industry, sector, region or market segment, or about the economy or interest rates is incorrect, or if there are imperfections, errors or limitations in the tools and data used by the sub-adviser or manager. In addition, the fund’s investment strategies or policies may change from time to time. Those changes may not lead to the results intended by the sub-adviser and could have an adverse effect on the value or performance of the fund.
The Funds’ Past Performance
Set forth below is performance information for each Fund. The bar charts and tables below provide some indication of the risks of investing in each Fund by showing you how the performance of the Target Funds and Class A shares of the Destination Fund has varied from year to year for 10 years or since inception, as applicable, and how the average total returns of each Target Fund and the applicable class of shares of the Destination Fund for different periods compare to the returns of one or more broad measures of market performance. The performance shown below for Transamerica Partners Mid Value Portfolio reflects only master portfolio level expenses, and does not include the expenses of any of the applicable Non-Mutual Fund Feeder Funds. If those expenses were reflected, the performance would be lower. Absent any applicable limitation of or cap on the Funds’ expenses, performance would have been lower. No performance information is presented for the Class R, Class R4 and Class I3 shares of the Destination Fund because those share classes are newly offered. Class R, Class R4 and Class I3 shares of the Destination Fund would have different performance because they have different expenses. A Fund’s past performance (before and after taxes) is not necessarily an indication of how the Fund will perform in the future. Following the Reorganizations, Transamerica Mid Cap Value Opportunities will be the surviving fund for performance purposes.
Prior to September 16, 2009, the Target Funds had a different sub-adviser. The performance set forth below for the Target Funds prior to that date is partly attributable to a previous sub-adviser.
Prior to May 1, 2014, the Target Funds had a different sub-adviser. The performance set forth below for the Target Funds for the period between September 16, 2009 and April 30, 2014 is partly attributable to a previous sub-adviser.
Transamerica Partners Mid Value Annual Returns
Annual Total Returns (calendar years ended December 31)
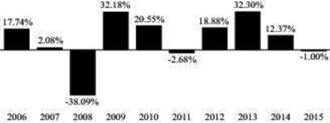
| | | | | | | | |
| | | Quarter Ended | | | Return | |
Best Quarter: | | | 6/30/2009 | | | | 17.66 | % |
Worst Quarter: | | | 12/31/2008 | | | | -24.01 | % |
Year-to-date return as of September 30, 2016: 11.00%
- 104 -
Transamerica Partners Mid Value Average Annual Total Returns
Average Annual Total Returns (periods ended December 31, 2015)
| | | | | | | | | | | | | | | | |
| | | 1 Year | | | 5 Years | | | 10 Years | | | Inception Date | |
Transamerica Partners Mid Value | | | -1.00 | % | | | 11.21 | % | | | 7.27 | % | | | 08/15/2001 | |
Russell Midcap® Value Index (reflects no deduction for fees, expenses or taxes) | | | -4.78 | % | | | 11.25 | % | | | 7.61 | % | | | | |
Transamerica Partners Institutional Mid Value Annual Returns
Annual Total Returns (calendar years ended December 31)

| | | | | | | | |
| | | Quarter Ended | | | Return | |
Best Quarter: | | | 6/30/2009 | | | | 17.83 | % |
Worst Quarter: | | | 12/31/2008 | | | | -23.99 | % |
Year-to-date return as of September 30, 2016: 11.32%
Transamerica Partners Institutional Mid Value Average Annual Total Returns
Average Annual Total Returns (periods ended December 31, 2015)
| | | | | | | | | | | | | | | | |
| | | 1 Year | | | 5 Years | | | 10 Years | | | Inception Date | |
Transamerica Partners Institutional Mid Value | | | -0.65 | % | | | 11.60 | % | | | 7.63 | % | | | 10/11/2001 | |
Russell Midcap® Value Index (reflects no deduction for fees, expenses or taxes) | | | -4.78 | % | | | 11.25 | % | | | 7.61 | % | | | | |
- 105 -
Transamerica Partners Mid Value Portfolio Annual Returns
Annual Total Returns (calendar years ended December 31)
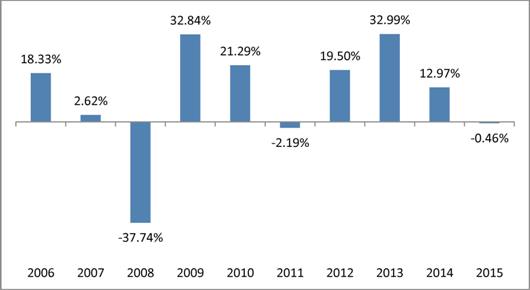
The highest and lowest quarterly returns for the periods reflected in the table above are:
| | | | | | | | |
| | | Quarter Ended | | | Return | |
Best Quarter: | | | 6/30/2009 | | | | 17.87 | % |
Worst Quarter: | | | 12/31/2008 | | | | -23.93 | % |
Year-to-date return as of September 30, 2016: 14.97%
Transamerica Partners Mid Value Portfolio Average Annual Total Returns
(for periods ended 12/31/2015)
| | | | | | | | | | | | | | | | |
| | | 1 Year | | | 5 Years | | | 10 Years | | | Inception
Date | |
Transamerica Partners Mid Value Portfolio | | | -0.46 | % | | | 11.82 | % | | | 7.85 | % | | | 05/01/2001 | |
Russell Midcap® Value Index (reflects no deduction for fees, expenses or taxes) | | | -4.78 | % | | | 11.25 | % | | | 7.61 | % | | | | |
Transamerica Mid Cap Value Opportunities Annual Returns
Annual Total Returns (calendar years ended December 31) - [Class A]

| | | | | | | | |
| | | Quarter Ended | | | Return | |
Best Quarter: | | | 03/31/2016 | | | | 3.76 | % |
Worst Quarter: | | | 09/30/2015 | | | | -2.71 | % |
Year-to-date return as of September 30, 2016: 12.16%
- 106 -
Transamerica Mid Cap Value Opportunities Average Annual Total Returns
Average Annual Total Returns (periods ended December 31, 2015)
| | | | | | | | | | | | |
| | | 1 Year | | | Since Inception | | | Inception Date | |
Class A | | | | | | | | | | | 04/30/2014 | |
Return before taxes | | | -3.68 | % | | | 3.96 | % | | | | |
Return after taxes on distributions | | | -4.88 | % | | | 2.81 | % | | | | |
Return after taxes on distributions and sale of fund shares | | | -1.75 | % | | | 2.67 | % | | | | |
Russell Midcap® Value Index (reflects no deduction for fees, expenses or taxes) | | | -4.78 | % | | | 2.39 | % | | | | |
The after-tax returns are calculated using the historic highest individual federal marginal income tax rates and do not reflect the impact of state and local taxes. Actual after-tax returns may depend on the investor’s individual tax situation and may differ from those shown. After-tax returns may not be relevant if the investment is made through a tax-exempt or tax-deferred account, such as a 401(k) plan.
The Funds’ Fees and Expenses
Shareholders of the Target Funds and the Destination Fund pay various fees and expenses, either directly or indirectly. The tables below show the fees and expenses that you would pay if you were to buy and hold shares of each Fund. The fees and expenses in the tables appearing below are based on the expenses of the Funds for the twelve-month period ended June 30, 2016. The tables also show the pro forma expenses of the combined Destination Fund after giving effect to all Group 6 Reorganizations based on pro forma net assets as of June 30, 2016. Pro forma numbers are estimated in good faith and are hypothetical. Actual expenses may vary significantly. The fees and expenses shown in the table and Example below for Transamerica Partners Mid Value Portfolio reflect only master portfolio level fees and expenses, and do not include the fees and expenses of any of the applicable Non-Mutual Fund Feeder Funds. For financial statement purposes, Transamerica Mid Cap Value Opportunities will be the accounting survivor of the Reorganizations. As the accounting survivor, Transamerica Mid Cap Value Opportunities’ operating history will be used for financial reporting purposes.
Transamerica Partners Mid Value
| | | | | | | | | | | | |
| | | Transamerica
Partners Mid
Value1 | | | Transamerica
Mid Cap
Value
Opportunities | | | Combined
Transamerica
Mid Cap
Value
Opportunities
(Pro Forma) | |
| | | | | | Class R | | | Class R | |
Shareholder Fees (fees paid directly from your investment) | | | | | | | | | | | | |
Maximum sales charge (load) imposed on purchases (as a % of offering price) | | | None | | | | None | | | | None | |
Maximum deferred sales charge (load) (as a % of offering price) | | | None | | | | None | | | | None | |
Redemption fee (as a % of amount redeemed) | | | None | | | | None | | | | None | |
| | | |
Annual Fund Operating Expenses (expenses that you pay each year as a % of the value of your investment) | | | | | | | | | | | | |
Management fees2 | | | 0.67 | % | | | 0.70 | % | | | 0.70 | % |
Distribution and service (12b-1) fees | | | 0.25 | % | | | 0.50 | % | | | 0.50 | % |
Other expenses3 | | | 0.38 | % | | | 0.03 | %4 | | | 0.03 | %4 |
Total annual fund operating expenses | | | 1.30 | % | | | 1.23 | % | | | 1.23 | % |
Fee waiver and/or expense reimbursement | | | 0.05 | %5 | | | 0.00 | %6 | | | 0.00 | %6 |
Total annual fund operating expenses after fee waiver and/or expense reimbursement | | | 1.25 | % | | | 1.23 | % | | | 1.23 | % |
- 107 -
Transamerica Partners Institutional Mid Value
| | | | | | | | | | | | |
| | | Transamerica
Partners
Institutional
Mid Value1 | | | Transamerica
Mid Cap
Value
Opportunities | | | Combined
Transamerica
Mid Cap
Value
Opportunities
(Pro Forma) | |
| | | | | | Class R4 | | | Class R4 | |
Shareholder Fees (fees paid directly from your investment) | | | | | | | | | | | | |
Maximum sales charge (load) imposed on purchases (as a % of offering price) | | | None | | | | None | | | | None | |
Maximum deferred sales charge (load) (as a % of offering price) | | | None | | | | None | | | | None | |
Redemption fee (as a % of amount redeemed) | | | None | | | | None | | | | None | |
| | | |
Annual Fund Operating Expenses (expenses that you pay each year as a % of the value of your investment) | | | | | | | | | | | | |
Management fees2 | | | 0.67 | % | | | 0.70 | % | | | 0.70 | % |
Distribution and service (12b-1) fees | | | 0.25 | % | | | 0.25 | % | | | 0.25 | % |
Other expenses3 | | | 0.10 | % | | | 0.03 | %4 | | | 0.03 | %4 |
Total annual fund operating expenses | | | 1.02 | % | | | 0.98 | % | | | 0.98 | % |
Fee waiver and/or expense reimbursement | | | 0.12 | %7 | | | 0.08 | %6 | | | 0.08 | %6 |
Total annual fund operating expenses after fee waiver and/or expense reimbursement | | | 0.90 | % | | | 0.90 | % | | | 0.90 | % |
Transamerica Partners Mid Value Portfolio
| | | | | | | | | | | | |
| | | Transamerica
Partners Mid
Value Portfolio | | | Transamerica
Mid Cap
Value
Opportunities | | | Combined
Transamerica
Mid Cap Value
Opportunities
(Pro Forma) | |
| | | | | | Class I3 | | | Class I3 | |
Shareholder Fees (fees paid directly from your investment) | | | | | | | | | | | | |
Maximum sales charge (load) imposed on purchases (as a % of offering price) | | | None | | | | None | | | | None | |
Maximum deferred sales charge (load) (as a % of offering price) | | | None | | | | None | | | | None | |
Redemption fee (as a % of amount redeemed) | | | None | | | | None | | | | None | |
| | | |
Annual Fund Operating Expenses (expenses that you pay each year as a % of the value of your investment) | | | | | | | | | | | | |
Management fees2 | | | 0.67 | % | | | 0.70 | % | | | 0.70 | % |
Distribution and service (12b-1) fees | | | None | | | | None | | | | None | |
Other expenses3 | | | 0.02 | % | | | 0.03 | %4 | | | 0.03 | %4 |
Total annual fund operating expenses | | | 0.69 | % | | | 0.73 | % | | | 0.73 | % |
Fee waiver and/or expense reimbursement | | | N/A | | | | 0.03 | %6 | | | 0.03 | %6 |
Total annual fund operating expenses after fee waiver and/or expense reimbursement | | | 0.69 | % | | | 0.70 | % | | | 0.70 | % |
| 1 | The Target Feeder Fund invests in securities through an underlying Target Master Portfolio, Transamerica Partners Mid Value Portfolio. The information in this table and in the Example below concerning the Target Feeder Fund reflects the direct fees and expenses of the Target Feeder Fund and its allocated share of the fees and expenses of the Target Master Portfolio. |
- 108 -
| 2 | The Destination Fund receives investment advisory and administrative services under one agreement with the Destination Fund’s investment manager, Transamerica Asset Management, Inc. (“TAM”), and pays a single management fee to TAM. Transamerica Partners Mid Value and Transamerica Partners Institutional Mid Value receive investment advisory and administrative services from TAM under separate agreements and pay separate advisory fees and administrative services fees to TAM. The administrative services fees of 0.30% for Transamerica Partners Mid Value and 0.05% for Transamerica Partners Institutional Mid Value are included in “Other expenses.” Transamerica Partners Mid Value Portfolio receives investment advisory services from TAM and pays advisory fees to TAM. Transamerica Partners Mid Value Portfolio pays no separate administrative services fees. |
| 3 | Other expenses do not include the costs of the Reorganization to be borne by the Target Funds and the Destination Fund. These costs are considered extraordinary expenses and are not covered by the applicable expense limitation arrangements. The basis point impact of such costs is 0.00% for Transamerica Partners Mid Value, 0.00% for Transamerica Partners Institutional Mid Value, 0.04% for Transamerica Partners Mid Value Portfolio and 0.00% for Transamerica Mid Cap Value Opportunities. |
| 4 | Other expenses are based on estimates for the current fiscal year. Actual expenses may differ from estimates. |
| 5 | Contractual arrangements have been made with TAM through May 1, 2017 to waive fees and/or reimburse fund expenses to the extent that the fund’s total operating expenses exceed 1.25%, excluding, as applicable, acquired fund fees and expenses, interest, taxes, brokerage commissions, dividend and interest expenses on securities sold short, extraordinary expenses and other expenses not incurred in the ordinary course of the fund’s business. |
| 6 | Contractual arrangements have been made with TAM through May 1, 2018 to waive fees and/or reimburse fund expenses to the extent that the fund’s total operating expenses exceed 1.25% for Class R shares, 0.90% for Class R4 shares and 0.70% for Class I3 shares, excluding, as applicable, acquired fund fees and expenses, interest, taxes, brokerage commissions, dividend and interest expenses on securities sold short, extraordinary expenses and other expenses not incurred in the ordinary course of the fund’s business. These arrangements cannot be terminated prior to May 1, 2018 without the Board of Trustees’ consent. TAM is entitled to reimbursement by the fund of fees waived or expenses reduced during any of the previous 36 months if on any day or month the estimated annualized fund operating expenses are less than the cap. |
| 7 | Contractual arrangements have been made with TAM through May 1, 2017 to waive fees and/or reimburse fund expenses to the extent that the fund’s total operating expenses exceed 0.90%, excluding, as applicable, acquired fund fees and expenses, interest, taxes, brokerage commissions, dividend and interest expenses on securities sold short, extraordinary expenses and other expenses not incurred in the ordinary course of the fund’s business. |
The hypothetical examples below help you compare the cost of investing in each Fund. Each example assumes that:
| | • | | you invest $10,000 in each Fund; |
| | • | | you reinvest all dividends and distributions without a sales charge; |
| | • | | your investment has a 5% annual return (this assumption is required by the SEC and is not a prediction of the Fund’s future performance); and |
| | • | | each Fund’s operating expenses remain the same. |
Each example also assumes no fees for IRA accounts, if applicable. Costs are the same whether you redeem at the end of any period or not. Pro forma expenses are included assuming the consummation of all Group 1 Reorganizations. The examples are for comparison purposes only and do not represent the Funds’ actual expenses or returns, either past or future. Because actual return and expenses will be different, the examples are for comparison only.
Transamerica Partners Mid Value
| | | | | | | | | | | | |
Number of years
you own your shares | | Transamerica
Partners Mid
Value | | | Transamerica
Mid Cap Value
Opportunities | | | Combined
Transamerica Mid
Cap Value
Opportunities
(Pro Forma) | |
| | | | | | Class R | | | Class R | |
Year 1 | | $ | 127 | | | $ | 125 | | | $ | 125 | |
Year 3 | | $ | 407 | | | $ | 390 | | | $ | 390 | |
Year 5 | | $ | 708 | | | $ | 676 | | | $ | 676 | |
Year 10 | | $ | 1,563 | | | $ | 1,489 | | | $ | 1,489 | |
- 109 -
Transamerica Partners Institutional Mid Value
| | | | | | | | | | | | |
Number of years
you own your shares | | Transamerica
Partners
Institutional Mid
Value | | | Transamerica
Mid Cap Value
Opportunities | | | Combined
Transamerica Mid
Cap Value
Opportunities
(Pro Forma) | |
| | | | | | Class R4 | | | Class R4 | |
Year 1 | | $ | 92 | | | $ | 92 | | | $ | 92 | |
Year 3 | | $ | 313 | | | $ | 304 | | | $ | 304 | |
Year 5 | | $ | 552 | | | $ | 534 | | | $ | 534 | |
Year 10 | | $ | 1,237 | | | $ | 1,194 | | | $ | 1,194 | |
Transamerica Partners Mid Value Portfolio
| | | | | | | | | | | | |
Number of years
you own your shares | | Transamerica
Partners Mid
Value Portfolio | | | Transamerica
Mid Cap Value
Opportunities | | | Combined
Transamerica Mid
Cap Value
Opportunities
(Pro Forma) | |
| | | | | | Class I3 | | | Class I3 | |
Year 1 | | $ | 70 | | | $ | 72 | | | $ | 72 | |
Year 3 | | $ | 221 | | | $ | 230 | | | $ | 230 | |
Year 5 | | $ | 384 | | | $ | 403 | | | $ | 403 | |
Year 10 | | $ | 859 | | | $ | 904 | | | $ | 904 | |
CAPITALIZATION
The following tables set forth the capitalization of each Target Fund and the Destination Fund as of September 30, 2016 and the pro forma combined capitalization of the combined Destination Fund as if the Reorganizations had occurred on that date. If the Reorganizations are consummated, the actual exchange ratios on the closing date may vary from the exchange ratios used in the computation below. This is due to changes in the market value of the portfolio securities of the Funds between September 30, 2016 and the closing date, changes in the amount of undistributed net investment income and net realized capital gains of the Funds during that period resulting from income and distributions, and changes in the accrued liabilities of the Funds during the same period.
Transamerica Partners Mid Value Funds
| | | | | | | | | | | | |
| | | Transamerica
Partners Mid
Value | | | Transamerica
Partners
Institutional Mid
Value | | | Transamerica
Partners Mid Value
Portfolio | |
Net Assets | | $ | 131,083,725 | | | $ | 438,445,366 | | | $ | 282,831,448 | |
Net Asset Value Per Share | | $ | 21.82 | | | $ | 18.08 | | | $ | 12.05 | |
Shares Outstanding | | | 6,007,805 | | | | 24,254,780 | | | | 23,471,489 | |
- 110 -
Transamerica Mid Cap Value Opportunities
| | | | | | | | |
| | | Transamerica
Mid Cap Value
Opportunities | | | Transamerica Mid
Cap Value
Opportunities
Pro Forma | |
Net Assets | | | | | | | | |
Class A | | $ | 76,334,233 | | | $ | 76,334,233 | |
Class C | | $ | 6,558,494 | | | $ | 6,558,494 | |
Class I | | $ | 291,012,379 | | | $ | 291,012,379 | |
Class I2 | | $ | 330,318,969 | | | $ | 330,318,969 | |
Advisor Class | | | — | | | | — | |
Class R6 | | $ | 50,785 | | | $ | 50,785 | |
Class R | | | — | | | $ | 131,083,725 | |
Class R4 | | | — | | | $ | 438,445,366 | |
Class I3 | | | — | | | $ | 282,741,960 | |
Net Asset Value Per Share | | | | | | | | |
Class A | | $ | 11.99 | | | $ | 11.99 | |
Class C | | $ | 11.90 | | | $ | 11.90 | |
Class I | | $ | 12.04 | | | $ | 12.04 | |
Class I2 | | $ | 12.05 | | | $ | 12.05 | |
Advisor Class | | | — | | | | — | |
Class R6 | | $ | 12.06 | | | $ | 12.06 | |
Class R | | $ | 12.05 | | | $ | 12.05 | |
Class R4 | | $ | 12.05 | | | $ | 12.05 | |
Class I3 | | $ | 12.05 | | | $ | 12.05 | |
Shares Outstanding | | | | | | | | |
Class A | | | 6,366,808 | | | | 6,366,808 | |
Class C | | | 551,361 | | | | 551,361 | |
Class I | | | 24,171,643 | | | | 24,171,643 | |
Class I2 | | | 27,402,001 | | | | 27,402,001 | |
Advisor Class | | | — | | | | — | |
Class R6 | | | 4,212 | | | | 4,212 | |
Class R | | | — | | | | 10,878,317 | |
Class R4 | | | — | | | | 36,385,508 | |
Class I3 | | | — | | | | 23,471,489 | |
It is impossible to predict with any certainty how many shares of the Destination Fund will actually be received and distributed by a Target Fund on the closing date. The foregoing table should not be relied upon to determine the amount of Destination Fund shares that will actually be received and distributed.
ADDITIONAL INFORMATION
For information relating to each Fund and its Reorganization, including tax capital loss carryforwards, the tax status of the Reorganization, a comparison of the fundamental investment policies of the Funds, how to buy, sell or exchange Fund shares, how each Fund values its securities, financial highlights information for each Fund and ownership of shares of the Funds, please see the sections immediately following the discussion of the Group 9 Reorganizations.
- 111 -
TARGET FUND BOARD’S EVALUATION AND RECOMMENDATION
With respect to each Target Fund, the Board of the Target Fund, including its Independent Trustees, after careful consideration, unanimously determined that the Reorganization is in the best interest of the Target Fund and will not dilute the interests of the existing holders of the Target Fund. Each Board made this determination based on various factors, which include those that are discussed in the section entitled “Reasons for the Proposed Reorganizations” in the back of this Proxy Statement/Prospectus following the discussion of the proposals.
Similarly, the Board of the Destination Fund, including all its Independent Trustees, has approved the Reorganization with respect to the Destination Fund. The Board has determined that the Reorganization is in the best interest of the Destination Fund and that the interests of the Destination Fund’s holders will not be diluted as a result of the Reorganization.
THE BOARD OF YOUR TARGET FUND RECOMMENDS THAT YOU VOTE “FOR” PROPOSAL 6A, 6B OR 6C, AS APPLICABLE, TO APPROVE THE PLAN.
- 112 -
GROUP 7 – SMALL CORE FUNDS
TRANSAMERICA PARTNERS SMALL CORE
TRANSAMERICA PARTNERS INSTITUTIONAL SMALL CORE
TRANSAMERICA PARTNERS SMALL CORE PORTFOLIO
(each, a “Target Fund” and together, the “Target Funds”)
AND
TRANSAMERICA SMALL CAP CORE
(the “Destination Fund”)
PROPOSALS 7A, 7B AND 7C
APPROVAL OF AGREEMENT AND PLAN OF REORGANIZATION
SUMMARY
The following is a summary of more complete information appearing later in this Proxy Statement/Prospectus or incorporated herein. You should read carefully the entire Proxy Statement/Prospectus, including the form of Plan attached as Exhibit A, which includes additional information that is not included in the summary and is a part of this Proxy Statement/Prospectus. For a discussion of the terms of the Plan, please see the section entitled “Terms of Each Agreement and Plan of Reorganization” in the back of this Proxy Statement/Prospectus, after the discussion of the proposals.
In each proposed Reorganization, the Target Fund would be reorganized into the Destination Fund, with that Target Fund receiving shares of the applicable class of the Destination Fund as shown in the following table. The Target Funds, which operate in a master-feeder structure, do not have share classes.
| | | | |
Proposal | | Target Fund | | Destination Fund and Shares |
| | |
| Proposal 7A | | Transamerica Partners Small Core | | Transamerica Small Cap Core
Class R |
| | |
| Proposal 7B | | Transamerica Partners Institutional Small Core | | Transamerica Small Cap Core
Class R4 |
| | |
| Proposal 7C | | Transamerica Partners Small Core Portfolio | | Transamerica Small Cap Core
Class I3 |
Transamerica Partners Small Core would reorganize first, Transamerica Partners Institutional Small Core would reorganize next and Transamerica Partners Small Core Portfolio would reorganize last. All Reorganizations would occur on the same closing date.
The Target Funds and the Destination Fund are managed by Transamerica Asset Management, Inc. (“TAM”) and have the same investment objective and substantially similar principal investment strategies and related risks. The tables below provide a comparison of certain features of the Funds. Unless otherwise noted, the information is the same for each Target Fund. In the tables below, if a row extends across the entire table, the information applies to the Destination Fund and the Target Funds.
Comparison of Target Funds and Destination Fund
| | | | |
| | | Target Funds | | Destination Fund |
| Investment objective | | Seeks long term capital appreciation. |
| | |
Principal investment strategies1 | | The fund normally invests primarily in stocks of companies with small market capitalizations which, in the opinion of the fund’s sub-adviser, Systematic Financial Management, L.P. (the “sub-adviser”), present an opportunity for significant increases in value, without consideration for | | The fund normally invests primarily in stocks of companies with small market capitalizations which, in the opinion of the fund’s sub-adviser, Systematic Financial Management, L.P. (the “sub-adviser”), present an opportunity for significant increases in value, without consideration for |
- 113 -
| | | | |
| | current income. Under normal circumstances, the fund invests at least 80% of its net assets in equity securities of small market capitalization (or small-cap companies) and other investments with similar economic characteristics. The fund considers small-cap companies to be companies with market capitalizations that, at the time of initial purchase, are within the range of capitalization of the companies that are included in the Russell 2000® Index. As of December 31, 2015, the market capitalizations of companies in the Russell 2000® Index ranged from $15 million to $5.9 billion. Over time, the capitalizations of the companies in the Russell 2000® Index will change. As they do, the size of the companies in which the fund invests may change. The fund may invest in sponsored and unsponsored American Depositary Receipts and/or foreign securities trading on U.S. exchanges, which generally stay under 10% of portfolio assets. It will not trade securities on a non-U.S. exchange. An issuer that is a Russell 3000® Index constituent shall not be considered a foreign issuer, regardless of the issuer’s domicile or headquarters. The fund may also invest in real estate investment trusts (“REITs”). Investments in derivatives, futures and swaps are not permitted. Portfolio construction and management are rules-based. Generally, securities are purchased and sold when they meet defined ranking levels. Companies in the fund are also sold if they fall outside the general market capitalization range of the Russell 2000® Index. The fund is rebalanced periodically with securities qualifying for purchase or sale added or removed at such time. The process yields the fund with exposure to all economic sectors through approximately equally weighted positions in about 250 to 400 companies. The fund may also invest its assets in cash, cash equivalent securities or short-term debt securities, repurchase agreements and money market instruments. Generally, 5% or less of fund assets will be invested in cash and cash equivalents. | | current income. Under normal circumstances, the sub-adviser invests at least 80% of the fund’s net assets (plus the amount of borrowings, if any, for investment purposes) in equity securities of companies with small market capitalization (or small-cap companies) and other investments with similar economic characteristics. The sub-adviser considers small-cap companies to be companies with market capitalizations that, at the time of initial purchase, are within the range of capitalization of the companies that are included in the Russell 2000® Index over time. On December 31, 2015, the market capitalizations of companies in the Russell 2000® Index ranged from $15 million to $5.9 billion. Over time, the capitalizations of the companies in the Russell 2000® Index will change. As they do, the size of the companies in which the fund invests may change. The fund may invest American Depositary Receipts (“ADRs”) and/or foreign securities trading on U.S. exchanges, which generally stay under 10% of portfolio assets. It will not trade securities on a non-U.S. exchange. An issuer that is a Russell 3000® Index constituent shall not be considered a foreign issuer, regardless of the issuer’s domicile or headquarters. The fund may also invest in real estate investment trusts (“REITs”). Investments in derivatives, futures and swaps are not permitted. Portfolio construction and management are rules-based. Generally, securities are purchased and sold when they meet defined ranking levels. Companies in the portfolio are also sold if they fall outside the general market capitalization range of the Russell 2000® Index. The portfolio is rebalanced periodically with securities qualifying for purchase or sale added or removed at such time. The process yields a portfolio with exposure to all economic sectors through approximately equally weighted positions in about 250 to 400 companies. The fund may also invest its assets in cash, cash equivalent securities or short-term debt securities, repurchase agreements and money market instruments. Generally, 5% or less of fund assets will be invested in cash and cash equivalents. |
| |
| Investment manager | | TAM |
| |
| Sub-adviser | | Systematic Financial Management, L.P. |
- 114 -
| | | | |
| Portfolio managers | | Eoin E. Middaugh, CFA: Portfolio Manager of the Funds since 2013; Employed by Systematic Financial Management, L.P. since 2002; Portfolio Manager since 2006; Managing Partner since 2010 D. Kevin McCreesh, CFA: Portfolio Manager of the Funds since 2013; Managing Partner of Systematic Financial Management, L.P. since 1996 |
| | |
| Business | | Transamerica Partners Small Core is a diversified series of TPFG, an open-end management investment company organized as a Massachusetts business trust. Transamerica Partners Institutional Small Core is a diversified series of TPFG II, an open-end management investment company organized as a Massachusetts business trust. Transamerica Partners Small Core Portfolio is a diversified series of TPP, an open-end management investment company and a trust governed by New York law. | | The Destination Fund is a diversified series of the Destination Trust, an open-end management investment company organized as a Delaware statutory trust. |
| | |
| Net assets (as of June 30, 2016) | | Transamerica Partners Small Core = $62,033,345 Transamerica Partners Institutional Small Core = $12,167,601 Transamerica Partners Small Core Portfolio (excluding the Target Feeder Funds) = $225,889,734 | | $90,388,236 |
| | |
| Management fees | | TAM receives compensation for investment advisory services from the Target Funds at annual rates of 0.80% of the first $300 million; and 0.77% in excess of $300 million. TAM also receives compensation for administrative services from Transamerica Partners Small Core and Transamerica Partners Institutional Small Core at annual rates of 0.30% and 0.05%, respectively. Transamerica Partners Small Core Portfolio pays no separate administrative services fees. The applicable fee(s) are based upon average daily net assets and are accrued daily and paid monthly. | | TAM receives compensation for investment management services, which include investment advisory and administrative services, from the Destination Fund at annual rates of 0.83% of the first $300 million; and 0.80% in excess of $300 million. The fee is based upon average daily net assets and is accrued daily and paid monthly. |
| | |
| Distribution and service (12b-1) fees | | Transamerica Partners Small Core is subject to a distribution and service (12b-1) fee of up to 0.25% of average daily net assets. Transamerica Partners Institutional Small Core is subject to a distribution and service (12b-1) fee of up to 0.25% of average daily net assets. Transamerica Partners Small Core Portfolio is not subject to a distribution and service (12b-1) fee. | | Class R shares of the Destination Fund are subject to a distribution and service (12b-1) fee of up to 0.50% of average daily net assets. Class R4 shares of the Destination Fund are subject to a distribution and service (12b-1) fee of up to 0.25% of average daily net assets. Class I3 shares of the Destination Fund are not subject to a distribution and service (12b-1) fee. |
- 115 -
| | | | |
| Sales charges | | Shares of the Target Funds are offered without a sales charge and are not subject to a contingent deferred sales charge. | | Class R, Class R4, and Class I3 shares of the Destination Fund are offered without a sales charge and are not subject to a contingent deferred sales charge. |
| | |
| Fee waiver and expense reimbursement | | Contractual arrangements have been made with TAM through May 1, 2017 to waive fees and/or reimburse fund expenses to the extent that the total operating expenses exceed: • 1.50% for Transamerica Partners Small Core; and • 1.10% for Transamerica Partners Institutional Small Core. The expense limitation excludes, as applicable, acquired fund fees and expenses, interest, taxes, brokerage commissions, dividend and interest expenses on securities sold short, extraordinary expenses and other expenses not incurred in the ordinary course of the fund’s business. These arrangements cannot be terminated prior to May 1, 2017 without the Board of Trustees’ consent. TAM has agreed to waive fees and reimburse expenses to limit the total operating expenses of Transamerica Partners Small Core Portfolio to 0.85%. This arrangement is voluntary and may be terminated by TAM at any time. | | Contractual arrangements have been made with TAM through May 1, 2018 to waive fees and/or reimburse fund expenses to the extent that the Destination Fund’s total operating expenses exceed: • 1.50% for Class R shares; • 1.10% for Class R4 shares; and • 0.85% for Class I3 shares. The expense limitation excludes, as applicable, acquired fund fees and expenses, interest, taxes, brokerage commissions, dividend and interest expenses on securities sold short, extraordinary expenses and other expenses not incurred in the ordinary course of the fund’s business. These arrangements cannot be terminated prior to May 1, 2018 without the Board of Trustees’ consent. TAM is entitled to reimbursement by the Destination Fund of fees waived or expenses reduced during any of the previous 36 months if on any day or month the estimated annualized fund operating expenses are less than the cap. |
| |
| Gross and net expenses | | For a comparison of the gross and net expenses of the Funds, please see the class fee tables in the “The Funds’ Fees and Expenses” section. |
| 1 | Transamerica Partners Small Core and Transamerica Partners Institutional Small Core are feeder funds and invest in securities through Transamerica Partners Small Core Portfolio, an underlying master fund having the same investment goals and strategies. |
Comparison of Principal Risks of Investing in the Funds
Because the Funds have the same investment objective and substantially similar principal investment strategies, they are subject to similar principal risks. Risk is inherent in all investing. The value of your investment in a Fund, as well as the amount of return you receive on your investment, may fluctuate significantly from day to day and over time. You may lose part or all of your investment in a Fund or your investment may not perform as well as other similar investments.
Each Fund is subject to the following principal risks (in alphabetical order) of investing in the Fund:
Active Trading – The fund is actively managed and may purchase and sell securities without regard to the length of time held. Active trading may have a negative impact on performance by increasing transaction costs and may generate greater amounts of net short-term capital gains, which, for shareholders holding shares in taxable accounts, would generally be subject to tax at ordinary income tax rates upon distribution.
Currency – The value of investments in securities denominated in foreign currencies increases or decreases as the rates of exchange between those currencies and the U.S. dollar change. Currency conversion costs and currency fluctuations could reduce or eliminate investment gains or add to investment losses. Currency exchange rates can be volatile, and are affected by factors such as general economic conditions, the actions of the U.S. and foreign governments or central banks, the imposition of currency controls, and speculation.
- 116 -
Depositary Receipts (ADRs) – Depositary receipts may be less liquid than the underlying shares in their primary trading market. Any distributions paid to the holders of depositary receipts are usually subject to a fee charged by the depositary. Holders of depositary receipts may have limited voting rights, and investment restrictions in certain countries may adversely impact the value of depositary receipts because such restrictions may limit the ability to convert equity shares into depositary receipts and vice versa. Such restrictions may cause equity shares of the underlying issuer to trade at a discount or premium to the market price of the depositary receipts.
Equity Securities – Equity securities represent an ownership interest in an issuer, rank junior in a company’s capital structure and consequently may entail greater risk of loss than debt securities. Equity securities include common and preferred stocks. Stock markets are volatile. The price of equity securities fluctuates based on changes in a company’s financial condition and overall market and economic conditions. If the market prices of the equity securities owned by the fund fall, the value of your investment in the fund will decline.
Foreign Investments – Investing in securities of foreign issuers or issuers with significant exposure to foreign markets involves additional risk. Foreign countries in which the fund may invest may have markets that are less liquid, less regulated and more volatile than U.S. markets. The value of the fund’s investments may decline because of factors affecting the particular issuer as well as foreign markets and issuers generally, such as unfavorable or unsuccessful government actions, reduction of government or central bank support, political or financial instability or other adverse economic or political developments. Lack of information and weaker accounting standards also may affect the value of these securities.
Growth Stocks – Returns on growth stocks may not move in tandem with returns on other categories of stocks or the market as a whole. Growth stocks may be particularly susceptible to larger price swings or to adverse developments. Growth stocks as a group may be out of favor and underperform the overall equity market for a long period of time, for example, while the market favors “value” stocks.
Legal and Regulatory – Legal and regulatory changes could occur that may adversely affect the fund, its investments, and its ability to pursue its investment strategies and/or increase the costs of implementing such strategies. Certain changes have already been proposed and additional changes are expected. New or revised laws or regulations may be imposed by the U.S. Securities and Exchange Commission, the U.S. Commodity Futures Trading Commission, the Internal Revenue Service, the U.S. Federal Reserve or other governmental regulatory authorities or self-regulatory organizations that could adversely affect the fund. The fund also may be adversely affected by changes in the enforcement or interpretation of existing statutes and rules by governmental regulatory authorities or self-regulatory organizations.
Market – The market prices of the fund’s securities may go up or down, sometimes rapidly or unpredictably, due to general market conditions, such as real or perceived adverse economic or political conditions, inflation, changes in interest rates or currency rates, lack of liquidity in the markets or adverse investor sentiment. Adverse market conditions may be prolonged and may not have the same impact on all types of securities. Market prices of securities also may go down due to events or conditions that affect particular sectors, industries or issuers. When market prices fall, the value of your investment will go down. The fund may experience a substantial or complete loss on any individual security.
In the past several years, financial markets, such as those in the United States, Europe, Asia and elsewhere, have experienced increased volatility, depressed valuations, decreased liquidity and heightened uncertainty. Governmental and non-governmental issuers defaulted on, or were forced to restructure, their debts. These market conditions may continue, worsen or spread.
The U.S. government and the Federal Reserve, as well as certain foreign governments and central banks have taken steps to support financial markets, including keeping interest rates at historically low levels. This and other government intervention may not work as intended, particularly if the efforts are perceived by investors as being unlikely to achieve the desired results. The Federal Reserve recently has reduced its market support activities.
- 117 -
Further reduction or withdrawal of Federal Reserve or other U.S. or non-U.S. governmental or central bank support, including interest rate increases, could negatively affect financial markets generally, increase market volatility and reduce the value and liquidity of securities in which the fund invests.
Policy and legislative changes in the United States and in other countries are affecting many aspects of financial regulation, and may in some instances contribute to decreased liquidity and increased volatility in the financial markets. The impact of these changes on the markets, and the practical implications for market participants, may not be fully known for some time.
Economies and financial markets throughout the world are becoming increasingly interconnected. As a result, whether or not the fund invests in securities of issuers located in or with significant exposure to countries experiencing economic and financial difficulties, the value and liquidity of the fund’s investments may be negatively affected.
Model and Data – If quantitative models, algorithms or calculations (whether proprietary and developed by the sub-adviser or supplied by third parties) (“Models”) or information or data supplied by third parties (“Data”) prove to be incorrect or incomplete, any decisions made, in whole or part, in reliance thereon expose the fund to additional risks. Models can be predictive in nature. The use of predictive Models has inherent risks. The success of relying on or otherwise using Models depends on a number of factors, including the validity, accuracy and completeness of the Model’s development, implementation and maintenance, the Model’s assumptions, factors, algorithms and methodologies, and the accuracy and reliability of the supplied historical or other Data. Models rely on, among other things, correct and complete Data inputs. If incorrect Data is entered into even a well-founded Model, the resulting information will be incorrect. However, even if Data is input correctly, Model prices may differ substantially from market prices, especially for securities with complex characteristics. Investments selected with the use of Models may perform differently than expected as a result of the design of the Model, inputs into the Model or other factors. There can be no assurance that the use of Models will result in effective investment decisions for the fund.
Portfolio Management – The value of your investment may decrease if the sub-adviser’s judgment about the quality, relative yield, value or market trends affecting a particular security or issuer, industry, sector, region or market segment, or about the economy or interest rates is incorrect, or if there are imperfections, errors or limitations in the tools and data used by the sub-adviser or manager. In addition, the fund’s investment strategies or policies may change from time to time. Those changes may not lead to the results intended by the sub-adviser and could have an adverse effect on the value or performance of the fund.
REITs – Investing in real estate investment trusts (“REITs”) involves unique risks. When the fund invests in REITs, it is subject to risks generally associated with investing in real estate. A REIT’s performance depends on the types and locations of the properties it owns, how well it manages those properties and cash flow. REITs may have lower trading volumes and may be subject to more abrupt or erratic price movements than the overall securities markets. In addition to its own expenses, the fund will indirectly bear its proportionate share of any management and other expenses paid by REITs in which it invests. REITs are subject to a number of highly technical tax-related rules and requirements; and the failure to qualify as a REIT could result in corporate-level taxation, significantly reducing the return on an investment to the fund.
Small and Medium Capitalization Companies – The fund will be exposed to additional risks as a result of its investments in the securities of small or medium capitalization companies. Small or medium capitalization companies may be more at risk than large capitalization companies because, among other things, they may have limited product lines, operating history, market or financial resources, or because they may depend on a limited management group. The prices of securities of small and medium capitalization companies generally are more volatile than those of large capitalization companies and are more likely to be adversely affected than large capitalization companies by changes in earnings results and investor expectations or poor economic or market conditions. Securities of small and medium capitalization companies may underperform large capitalization companies, may be harder to sell at times and at prices the portfolio managers believe appropriate and may offer greater potential for losses.
- 118 -
Valuation – The sales price the fund could receive for any particular portfolio investment may differ from the fund’s valuation of the investment, particularly for securities that trade in thin or volatile markets, that are priced based upon valuations provided by third-party pricing services that use matrix or evaluated pricing systems, or that are valued using a fair value methodology. The fund’s ability to value its investments may be impacted by technological issues and/or errors by pricing services or other third party service providers.
Value Investing – The prices of securities the sub-adviser believes are undervalued may not appreciate as anticipated or may go down. Value stocks as a group may be out of favor and underperform the overall equity market for a long period of time, for example, while the market favors “growth” stocks.
Each Fund is subject to similar management related risks. The Target Funds are subject to the following related principal risk:
Management – The fund is subject to the risk that the Investment Manager’s or sub-adviser’s judgments and decisions may be incorrect or otherwise may not produce the desired results. The value of your investment may decrease if the sub-adviser’s judgment about the quality, relative yield or value of, or market trends affecting, a particular security or issuer, industry, sector, region or market segment, or about the economy or interest rates, is incorrect. The fund may also suffer losses if there are imperfections, errors or limitations in the tools, resources, information and data used, or the analyses employed or relied on, by the sub-adviser, or if the sub-adviser’s investment style is out of favor or otherwise fails to produce the desired results. The fund’s investment strategies designed by the investment manager may not work as intended. In addition, the fund’s investment strategies or policies may change from time to time. Those changes may not lead to the results intended by the investment manager and could have an adverse effect on the value or performance of the fund. Any of these things could cause the fund to lose value or its results to lag relevant benchmarks or other funds with similar objectives.
The Destination Fund is subject to the following related principal risks:
Manager – The fund is subject to the risk that the sub-adviser’s judgments and investment decisions, as well as the methods, tools, resources, information and data, and the analyses employed or relied on by the sub-adviser to make those judgments and decisions may be incorrect or otherwise may not produce the desired results. This could cause the fund to lose value or its results to lag relevant benchmarks or other funds with similar objectives.
Portfolio Management – The value of your investment may decrease if the sub-adviser’s judgment about the quality, relative yield, value or market trends affecting a particular security or issuer, industry, sector, region or market segment, or about the economy or interest rates is incorrect, or if there are imperfections, errors or limitations in the tools and data used by the sub-adviser or manager. In addition, the fund’s investment strategies or policies may change from time to time. Those changes may not lead to the results intended by the sub-adviser and could have an adverse effect on the value or performance of the fund.
Repurchase Agreements – If the other party to a repurchase agreement defaults on its obligation, the fund may suffer delays and incur costs or lose money in exercising its rights under the agreement. If the seller fails to repurchase the security and the market value declines, the fund could lose money. If the seller becomes insolvent and subject to liquidation or reorganization under applicable bankruptcy or other laws, the fund’s ability to dispose of the underlying securities may be restricted.
The Funds’ Past Performance
Set forth below is performance information for each Fund. The bar charts and tables below provide some indication of the risks of investing in each Fund by showing you how the performance of the Target Funds and Class A shares of the Destination Fund has varied from year to year for 10 years or since inception, as applicable, and how the average total returns of each Target Fund and the applicable class of shares of the Destination Fund for different periods compare to the returns of one or more broad measures of market performance. The performance shown below for Transamerica Partners Small Core Portfolio reflects only master portfolio level expenses, and does not
- 119 -
include the expenses of any of the applicable Non-Mutual Fund Feeder Funds. If those expenses were reflected, the performance would be lower. Absent any applicable limitation of or cap on the Funds’ expenses, performance would have been lower. No performance information is presented for the Class R, Class R4 and Class I3 shares of the Destination Fund because those share classes are newly offered. Class R, Class R4 and Class I3 shares of the Destination Fund would have different performance because they have different expenses. A Fund’s past performance (before and after taxes) is not necessarily an indication of how the Fund will perform in the future. Following the Reorganizations, Transamerica Partners Institutional Small Core will be the surviving fund for performance purposes.
Prior to July 3, 2008, the Target Funds had different sub-advisers. The performance set forth below for the Target Funds for the period prior to that date is partly attributable to the previous sub-advisers.
Prior to February 27, 2009, the Target Funds had different sub-advisers. The performance set forth below for the Target Funds for the period between July 3, 2008 and February 26, 2009 is partly attributable to the previous sub-advisers.
Prior to June 28, 2013, the Target Funds had a different sub-adviser, a different investment objective and used different investment strategies. The performance set forth below for the Target Funds for the period between February 27, 2009 and June 27, 2013 is partly attributable to a previous sub-adviser.
Transamerica Partners Small Core Annual Returns
Annual Total Returns (calendar years ended December 31)
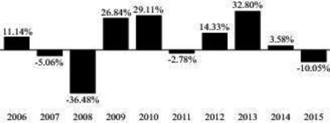
| | | | | | | | |
| | | Quarter Ended | | | Return | |
Best Quarter: | | | 9/30/2009 | | | | 18.66 | % |
Worst Quarter: | | | 12/31/2008 | | | | -25.65 | % |
Year-to-date return as of September 30, 2016: 10.19%
Transamerica Partners Small Core Average Annual Total Returns
Average Annual Total Returns (periods ended December 31, 2015)
| | | | | | | | | | | | | | | | |
| | | 1 Year | | | 5 Years | | | 10 Years | | | Inception Date | |
Transamerica Partners Small Core | | | -10.05 | % | | | 6.58 | % | | | 4.20 | % | | | 07/05/1994 | |
Russell 2000® Index (reflects no deduction for fees, expenses or taxes) | | | -4.41 | % | | | 9.19 | % | | | 6.80 | % | | | | |
S&P 500® (reflects no deduction for fees, expenses or taxes) | | | 1.38 | % | | | 12.57 | % | | | 7.31 | % | | | | |
- 120 -
Transamerica Partners Institutional Small Core Annual Returns
Annual Total Returns (calendar years ended December 31)

| | | | | | | | |
| | | Quarter Ended | | | Return | |
Best Quarter: | | | 9/30/2009 | | | | 18.96 | % |
Worst Quarter: | | | 12/31/2008 | | | | -25.54 | % |
Year-to-date return as of September 30, 2016: 10.50%
Transamerica Partners Institutional Small Core Average Annual Total Returns
Average Annual Total Returns (periods ended December 31, 2015)
| | | | | | | | | | | | | | | | |
| | | 1 Year | | | 5 Years | | | 10 Years | | | Inception Date | |
Transamerica Partners Institutional Small Core | | | -9.72 | % | | | 6.96 | % | | | 4.58 | % | | | 09/11/2000 | |
Russell 2000® Index (reflects no deduction for fees, expenses or taxes) | | | -4.41 | % | | | 9.19 | % | | | 6.80 | % | | | | |
S&P 500® (reflects no deduction for fees, expenses or taxes) | | | 1.38 | % | | | 12.57 | % | | | 7.31 | % | | | | |
Transamerica Partners Small Core Portfolio Annual Returns
Annual Total Returns (calendar years ended December 31)
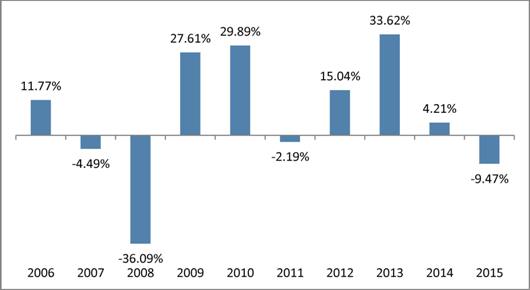
- 121 -
The highest and lowest quarterly returns for the periods reflected in the table above are:
| | | | | | | | |
| | | Quarter Ended | | | Return | |
Best Quarter: | | | 9/30/2009 | | | | 18.87 | % |
Worst Quarter: | | | 12/31/2008 | | | | -25.53 | % |
Year-to-date return as of September 30, 2016: 16.22%
Transamerica Partners Small Core Portfolio Average Annual Total Returns
(for periods ended 12/31/2015)
| | | | | | | | | | | | | | | | |
| | | 1 Year | | | 5 Years | | | 10 Years | | | Inception Date | |
Transamerica Partners Small Core Portfolio | | | -9.47 | % | | | 7.24 | % | | | 4.84 | % | | | 05/31/1993 | |
S&P 500 (reflects no deduction for fees, expenses or taxes) | | | 1.38 | % | | | 12.57 | % | | | 7.31 | % | | | | |
Transamerica Small Cap Core Annual Returns
Annual Total Returns (calendar years ended December 31) - Class A
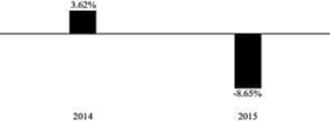
| | | | | | | | |
| | | Quarter Ended | | | Return | |
Best Quarter: | | | 12/31/2014 | | | | 5.74 | % |
Worst Quarter: | | | 09/30/2015 | | | | -11.90 | % |
Year-to-date return as of September 30, 2016: 9.99%
Transamerica Small Cap Core Average Annual Total Returns
Average Annual Total Returns (periods ended December 31, 2015)
| | | | | | | | | | | | |
| | | 1 Year | | | Since
Inception | | | Inception Date | |
Class A | | | | | | | | | | | 10/31/2013 | |
Return before taxes | | | -13.70 | % | | | -2.85 | % | | | | |
Return after taxes on distributions | | | -14.33 | % | | | -3.64 | % | | | | |
Return after taxes on distributions and sale of fund shares | | | -7.34 | % | | | -2.35 | % | | | | |
Russell 2000® Index (reflects no deduction for fees, expenses or taxes) | | | -4.41 | % | | | 2.64 | % | | | | |
The after-tax returns are calculated using the historic highest individual federal marginal income tax rates and do not reflect the impact of state and local taxes. Actual after-tax returns may depend on the investor’s individual tax situation and may differ from those shown. After-tax returns may not be relevant if the investment is made through a tax-exempt or tax-deferred account, such as a 401(k) plan.
- 122 -
The Funds’ Fees and Expenses
Shareholders of the Target Funds and the Destination Fund pay various fees and expenses, either directly or indirectly. The tables below show the fees and expenses that you would pay if you were to buy and hold shares of each Fund. The fees and expenses in the tables appearing below are based on the expenses of the Funds for the twelve-month period ended June 30, 2016. The tables also show the pro forma expenses of the combined Destination Fund after giving effect to all Group 7 Reorganizations based on pro forma net assets as of June 30, 2016. Pro forma numbers are estimated in good faith and are hypothetical. Actual expenses may vary significantly. The fees and expenses shown in the table and Example below for Transamerica Partners Small Core Portfolio reflect only master portfolio level fees and expenses, and do not include the fees and expenses of any of the applicable Non-Mutual Fund Feeder Funds. For financial statement purposes, Transamerica Partners Institutional Small Core will be the accounting survivor of the Reorganizations. As the accounting survivor, Transamerica Partners Institutional Small Core’s operating history will be used for financial reporting purposes.
Transamerica Partners Small Core
| | | | | | | | | | | | |
| | | Transamerica
Partners Small
Core1 | | | Transamerica
Small Cap
Core | | | Combined
Transamerica
Small Cap
Core
(Pro Forma) | |
| | | | | | Class R | | | Class R | |
Shareholder Fees (fees paid directly from your investment) | | | | | | | | | | | | |
Maximum sales charge (load) imposed on purchases (as a % of offering price) | | | None | | | | None | | | | None | |
Maximum deferred sales charge (load) (as a % of offering price) | | | None | | | | None | | | | None | |
Redemption fee (as a % of amount redeemed) | | | None | | | | None | | | | None | |
| | | |
Annual Fund Operating Expenses (expenses that you pay each year as a % of the value of your investment) | | | | | | | | | | | | |
Management fees2 | | | 0.80 | % | | | 0.82 | % | | | 0.82 | % |
Distribution and service (12b-1) fees | | | 0.25 | % | | | 0.50 | % | | | 0.50 | % |
Other expenses3 | | | 0.44 | % | | | 0.06 | %4 | | | 0.06 | %4 |
Total annual fund operating expenses | | | 1.49 | % | | | 1.38 | % | | | 1.38 | % |
Fee waiver and/or expense reimbursement | | | 0.00 | %5 | | | 0.00 | %6 | | | 0.00 | %6 |
Total annual fund operating expenses after fee waiver and/or expense reimbursement | | | 1.49 | % | | | 1.38 | % | | | 1.38 | % |
Transamerica Partners Institutional Small Core
| | | | | | | | | | | | |
| | | Transamerica
Partners
Institutional
Small Core1 | | | Transamerica
Small Cap
Core | | | Combined
Transamerica
Small Cap
Core
(Pro Forma) | |
| | | | | | Class R4 | | | Class R4 | |
Shareholder Fees (fees paid directly from your investment) | | | | | | | | | | | | |
Maximum sales charge (load) imposed on purchases (as a % of offering price) | | | None | | | | None | | | | None | |
Maximum deferred sales charge (load) (as a % of offering price) | | | None | | | | None | | | | None | |
Redemption fee (as a % of amount redeemed) | | | None | | | | None | | | | None | |
| | | |
Annual Fund Operating Expenses (expenses that you pay each year as a % of the value of your investment) | | | | | | | | | | | | |
Management fees2 | | | 0.80 | % | | | 0.82 | % | | | 0.82 | % |
Distribution and service (12b-1) fees | | | 0.25 | % | | | 0.25 | % | | | 0.25 | % |
Other expenses3 | | | 0.47 | % | | | 0.06 | %4 | | | 0.06 | %4 |
Total annual fund operating expenses | | | 1.52 | % | | | 1.13 | % | | | 1.13 | % |
Fee waiver and/or expense reimbursement | | | 0.42 | %7 | | | 0.03 | %6 | | | 0.03 | %6 |
Total annual fund operating expenses after fee waiver and/or expense reimbursement | | | 1.10 | % | | | 1.10 | % | | | 1.10 | % |
- 123 -
Transamerica Partners Small Core Portfolio
| | | | | | | | | | | | |
| | | Transamerica
Partners Small
Core Portfolio | | | Transamerica
Small Cap
Core | | | Combined
Transamerica
Small Cap Core
(Pro Forma) | |
| | | | | | Class I3 | | | Class I3 | |
Shareholder Fees (fees paid directly from your investment) | | | | | | | | | | | | |
Maximum sales charge (load) imposed on purchases (as a % of offering price) | | | None | | | | None | | | | None | |
Maximum deferred sales charge (load) (as a % of offering price) | | | None | | | | None | | | | None | |
Redemption fee (as a % of amount redeemed) | | | None | | | | None | | | | None | |
| | | |
Annual Fund Operating Expenses (expenses that you pay each year as a % of the value of your investment) | | | | | | | | | | | | |
Management fees2 | | | 0.80 | % | | | 0.82 | % | | | 0.82 | % |
Distribution and service (12b-1) fees | | | None | | | | None | | | | None | |
Other expenses3 | | | 0.04 | % | | | 0.06 | %4 | | | 0.06 | %4 |
Total annual fund operating expenses | | | 0.84 | % | | | 0.88 | % | | | 0.88 | % |
Fee waiver and/or expense reimbursement | | | N/A | | | | 0.03 | %6 | | | 0.03 | %6 |
Total annual fund operating expenses after fee waiver and/or expense reimbursement | | | 0.84 | % | | | 0.85 | % | | | 0.85 | % |
| 1 | The Target Feeder Fund invests in securities through an underlying Target Master Portfolio, Transamerica Partners Small Core Portfolio. The information in this table and in the Example below concerning the Target Feeder Fund reflects the direct fees and expenses of the Target Feeder Fund and its allocated share of the fees and expenses of the Target Master Portfolio. |
| 2 | The Destination Fund receives investment advisory and administrative services under one agreement with the Destination Fund’s investment manager, Transamerica Asset Management, Inc. (“TAM”), and pays a single management fee to TAM. Transamerica Partners Small Core and Transamerica Partners Institutional Small Core receive investment advisory and administrative services from TAM under separate agreements and pay separate advisory fees and administrative services fees to TAM. The administrative services fees of 0.30% for Transamerica Partners Small Core and 0.05% for Transamerica Partners Institutional Small Core are included in “Other expenses.” Transamerica Partners Small Core Portfolio receives investment advisory services from TAM and pays advisory fees to TAM. Transamerica Partners Small Core Portfolio pays no separate administrative services fees. |
| 3 | Other expenses do not include the costs of the Reorganization to be borne by the Target Funds and the Destination Fund. These costs are considered extraordinary expenses and are not covered by the applicable expense limitation arrangements. The basis point impact of such costs is 0.00% for Transamerica Partners Small Core, 0.04% for Transamerica Partners Institutional Small Core, 0.06% for Transamerica Partners Small Core Portfolio and 0.01% for Transamerica Small Cap Core. |
| 4 | Other expenses are based on estimates for the current fiscal year. Actual expenses may differ from estimates. |
| 5 | Contractual arrangements have been made with TAM through May 1, 2017 to waive fees and/or reimburse fund expenses to the extent that the fund’s total operating expenses exceed 1.50%, excluding, as applicable, acquired fund fees and expenses, interest, taxes, brokerage commissions, dividend and interest expenses on securities sold short, extraordinary expenses and other expenses not incurred in the ordinary course of the fund’s business. |
| 6 | Contractual arrangements have been made with TAM through May 1, 2018 to waive fees and/or reimburse fund expenses to the extent that the fund’s total operating expenses exceed 1.50% for Class R shares, 1.10% for Class R4 shares and 0.85% for Class I3 shares, excluding, |
- 124 -
as applicable, acquired fund fees and expenses, interest, taxes, brokerage commissions, dividend and interest expenses on securities sold short, extraordinary expenses and other expenses not incurred in the ordinary course of the fund’s business. These arrangements cannot be terminated prior to May 1, 2018 without the Board of Trustees’ consent. TAM is entitled to reimbursement by the fund of fees waived or expenses reduced during any of the previous 36 months if on any day or month the estimated annualized fund operating expenses are less than the cap.
| 7 | Contractual arrangements have been made with TAM through May 1, 2017 to waive fees and/or reimburse fund expenses to the extent that the fund’s total operating expenses exceed 1.10%, excluding, as applicable, acquired fund fees and expenses, interest, taxes, brokerage commissions, dividend and interest expenses on securities sold short, extraordinary expenses and other expenses not incurred in the ordinary course of the fund’s business. |
The hypothetical examples below help you compare the cost of investing in each Fund. Each example assumes that:
| | • | | you invest $10,000 in each Fund; |
| | • | | you reinvest all dividends and distributions without a sales charge; |
| | • | | your investment has a 5% annual return (this assumption is required by the SEC and is not a prediction of the Fund’s future performance); and |
| | • | | each Fund’s operating expenses remain the same. |
Each example also assumes no fees for IRA accounts, if applicable. Costs are the same whether you redeem at the end of any period or not. Pro forma expenses are included assuming the consummation of all Group 1 Reorganizations. The examples are for comparison purposes only and do not represent the Funds’ actual expenses or returns, either past or future. Because actual return and expenses will be different, the examples are for comparison only.
Transamerica Partners Small Core
| | | | | | | | | | | | |
Number of years
you own your shares | | Transamerica
Partners Small
Core | | | Transamerica
Small Cap Core | | | Combined
Transamerica
Small Cap Core
(Pro Forma) | |
| | | | | | Class R | | | Class R | |
Year 1 | | $ | 152 | | | $ | 140 | | | $ | 140 | |
Year 3 | | $ | 471 | | | $ | 437 | | | $ | 437 | |
Year 5 | | $ | 813 | | | $ | 755 | | | $ | 755 | |
Year 10 | | $ | 1,779 | | | $ | 1,657 | | | $ | 1,657 | |
Transamerica Partners Institutional Small Core
| | | | | | | | | | | | |
Number of years
you own your shares | | Transamerica
Partners
Institutional
Small Core | | | Transamerica
Small Cap Core | | | Combined
Transamerica
Small Cap Core
(Pro Forma) | |
| | | | | | Class R4 | | | Class R4 | |
Year 1 | | $ | 112 | | | $ | 112 | | | $ | 112 | |
Year 3 | | $ | 439 | | | $ | 356 | | | $ | 356 | |
Year 5 | | $ | 789 | | | $ | 619 | | | $ | 619 | |
Year 10 | | $ | 1,777 | | | $ | 1,372 | | | $ | 1,372 | |
- 125 -
Transamerica Partners Small Core Portfolio
| | | | | | | | | | | | |
Number of years
you own your shares | | Transamerica
Partners Small
Core Portfolio | | | Transamerica
Small Cap Core | | | Combined
Transamerica
Small Cap Core
(Pro Forma) | |
| | | | | | Class I3 | | | Class I3 | |
Year 1 | | $ | 86 | | | $ | 87 | | | $ | 87 | |
Year 3 | | $ | 268 | | | $ | 278 | | | $ | 278 | |
Year 5 | | $ | 466 | | | $ | 485 | | | $ | 485 | |
Year 10 | | $ | 1,037 | | | $ | 1,082 | | | $ | 1,082 | |
CAPITALIZATION
The following tables set forth the capitalization of each Target Fund and the Destination Fund as of September 30, 2016 and the pro forma combined capitalization of the combined Destination Fund as if the Reorganizations had occurred on that date. If the Reorganizations are consummated, the actual exchange ratios on the closing date may vary from the exchange ratios used in the computation below. This is due to changes in the market value of the portfolio securities of the Funds between September 30, 2016 and the closing date, changes in the amount of undistributed net investment income and net realized capital gains of the Funds during that period resulting from income and distributions, and changes in the accrued liabilities of the Funds during the same period.
Transamerica Partners Small Core Funds
| | | | | | | | | | | | |
| | | Transamerica
Partners Small
Core | | | Transamerica
Partners
Institutional Small
Core | | | Transamerica
Partners Small Core
Portfolio | |
Net Assets | | $ | 64,520,553 | | | $ | 12,478,084 | | | $ | 156,013,543 | |
| | | |
Net Asset Value Per Share | | $ | 28.30 | | | $ | 14.98 | | | $ | 10.39 | |
| | | |
Shares Outstanding | | | 2,280,118 | | | | 832,981 | | | | 15,015,740 | |
Transamerica Small Cap Core
| | | | | | | | |
| | | Transamerica
Small Cap Core | | | Transamerica Small
Cap Core
Pro Forma | |
Net Assets | | | | | | | | |
Class A | | $ | 1,352,644 | | | $ | 1,352,644 | |
Class C | | $ | 418,864 | | | $ | 418,864 | |
Class I | | $ | 1,294,299 | | | $ | 1,294,299 | |
Class I2 | | $ | 38,237,317 | | | $ | 38,237,317 | |
Advisor Class | | | — | | | | — | |
Class R | | | — | | | $ | 64,520,553 | |
Class R4 | | | — | | | $ | 12,478,084 | |
Class I3 | | | — | | | $ | 155,887,596 | |
Net Asset Value Per Share | | | | | | | | |
Class A | | $ | 10.35 | | | $ | 10.35 | |
Class C | | $ | 10.27 | | | $ | 10.27 | |
Class I | | $ | 10.39 | | | $ | 10.39 | |
Class I2 | | $ | 10.39 | | | $ | 10.39 | |
- 126 -
| | | | | | | | |
| | | Transamerica
Small Cap Core | | | Transamerica Small
Cap Core
Pro Forma | |
Advisor Class | | | — | | | | — | |
Class R | | $ | 10.39 | | | $ | 10.39 | |
Class R4 | | $ | 10.39 | | | $ | 10.39 | |
Class I3 | | $ | 10.39 | | | $ | 10.38 | |
Shares Outstanding | | | | | | | | |
Class A | | | 130,637 | | | | 130,637 | |
Class C | | | 40,803 | | | | 40,803 | |
Class I | | | 124,619 | | | | 124,619 | |
Class I2 | | | 3,679,658 | | | | 3,679,658 | |
Advisor Class | | | — | | | | — | |
Class R | | | — | | | | 6,209,870 | |
Class R4 | | | — | | | | 1,200,971 | |
Class I3 | | | — | | | | 15,015,740 | |
It is impossible to predict with any certainty how many shares of the Destination Fund will actually be received and distributed by a Target Fund on the closing date. The foregoing table should not be relied upon to determine the amount of Destination Fund shares that will actually be received and distributed.
ADDITIONAL INFORMATION
For information relating to each Fund and its Reorganization, including tax capital loss carryforwards, the tax status of the Reorganization, a comparison of the fundamental investment policies of the Funds, how to buy, sell or exchange Fund shares, how each Fund values its securities, financial highlights information for each Fund and ownership of shares of the Funds, please see the sections immediately following the discussion of the Group 9 Reorganizations.
TARGET FUND BOARD’S EVALUATION AND RECOMMENDATION
With respect to each Target Fund, the Board of the Target Fund, including its Independent Trustees, after careful consideration, unanimously determined that the Reorganization is in the best interest of the Target Fund and will not dilute the interests of the existing holders of the Target Fund. Each Board made this determination based on various factors, which include those that are discussed in the section entitled “Reasons for the Proposed Reorganizations” in the back of this Proxy Statement/Prospectus following the discussion of the proposals.
Similarly, the Board of the Destination Fund, including all its Independent Trustees, has approved the Reorganization with respect to the Destination Fund. The Board has determined that the Reorganization is in the best interest of the Destination Fund and that the interests of the Destination Fund’s holders will not be diluted as a result of the Reorganization.
THE BOARD OF YOUR TARGET FUND RECOMMENDS THAT YOU VOTE “FOR” PROPOSAL 7A, 7B OR 7C, AS APPLICABLE, TO APPROVE THE PLAN.
- 127 -
GROUP 8 – SMALL GROWTH FUNDS
TRANSAMERICA PARTNERS SMALL GROWTH
TRANSAMERICA PARTNERS INSTITUTIONAL SMALL GROWTH
TRANSAMERICA PARTNERS SMALL GROWTH PORTFOLIO
(each, a “Target Fund” and together, the “Target Funds”)
AND
TRANSAMERICA SMALL CAP GROWTH
(the “Destination Fund”)
PROPOSALS 8A, 8B AND 8C
APPROVAL OF AGREEMENT AND PLAN OF REORGANIZATION
SUMMARY
The following is a summary of more complete information appearing later in this Proxy Statement/Prospectus or incorporated herein. You should read carefully the entire Proxy Statement/Prospectus, including the form of Plan attached as Exhibit A, which includes additional information that is not included in the summary and is a part of this Proxy Statement/Prospectus. For a discussion of the terms of the Plan, please see the section entitled “Terms of Each Agreement and Plan of Reorganization” in the back of this Proxy Statement/Prospectus, after the discussion of the proposals.
In each proposed Reorganization, the Target Fund would be reorganized into the Destination Fund, with that Target Fund receiving shares of the applicable class of the Destination Fund as shown in the following table. The Target Funds, which operate in a master-feeder structure, do not have share classes.
| | | | |
Proposal | | Target Fund | | Destination Fund and Shares |
Proposal 8A | | Transamerica Partners Small Growth | | Transamerica Small Cap Growth
Class R |
Proposal 8B | | Transamerica Partners Institutional Small Growth | | Transamerica Small Cap Growth
Class R4 |
Proposal 8C | | Transamerica Partners Small Growth Portfolio | | Transamerica Small Cap Growth
Class I3 |
Transamerica Partners Small Growth would reorganize first, Transamerica Partners Institutional Small Growth would reorganize next and Transamerica Partners Small Growth Portfolio would reorganize last. All Reorganizations would occur on the same closing date.
The Target Funds and the Destination Fund are managed by Transamerica Asset Management, Inc. (“TAM”) and have the same investment objective, principal investment strategies and related risks. The tables below provide a comparison of certain features of the Funds. Unless otherwise noted, the information is the same for each Target Fund. In the tables below, if a row extends across the entire table, the information applies to the Destination Fund and the Target Funds.
Comparison of Target Funds and Destination Fund
| | | | |
| | | Target Funds | | Destination Fund |
| Investment objective | | Seeks long term capital appreciation. |
| |
| Principal investment strategies1 | | Under normal circumstances, the fund invests at least 80% of its net assets (plus the amount of borrowings, if any, for investment purposes) in stocks of small capitalization companies. The fund’s sub-adviser, Ranger Investment Management, L.P. (the “sub-adviser”), primarily focuses on seeking to identify high quality, high-growth small capitalization companies. The sub-adviser considers small capitalization companies to be companies with market capitalizations that, at the time of initial purchase, have either market capitalizations between $100 million and $2 billion or within the range of the Russell 2000® Growth Index, which as of March 31, 2016, the most recent constitution of the index, was between $15 million and $6.05 billion. The sub-adviser’s approach to security selection seeks quality growth companies by implementing a bottom-up, fundamental research driven security selection process. The sub-adviser’s focus is to attempt to identify companies with characteristics such as high recurring revenue, steady and/or accelerating sales growth, strong balance sheets and free cash flows, stable/expanding margins, and superior return on equity/return on invested |
- 128 -
| | | | |
| | capital. In addition to the extensive quantitative analysis, careful consideration is given to qualitative analysis. The sub-adviser incorporates a preference towards companies with certain qualitative characteristics such as conservative accounting practices, seasoned management team with high corporate integrity, sustainable competitive advantage and ability to grow market share, sound corporate governance, and unique demand drivers. Once these quantitative and qualitative characteristics are analyzed, the sub-adviser then determines whether it believes a company is undervalued and has sufficient upside to the stock price to warrant an investment. The fund may invest in foreign securities through American Depositary Receipts (“ADRs”), and generally will not invest more than 10% of fund assets in foreign securities. The fund only invests in securities traded on U.S. exchanges. |
| |
| Investment manager | | TAM |
| |
| Sub-adviser | | Ranger Investment Management, L.P. |
| |
| Portfolio managers | | W. Conrad Doenges: Portfolio Manager of the Funds since 2012; Portfolio Manager at Ranger Investment Management, L.P. since 2004 (small, mid and small-mid growth strategies) |
| | |
| Business | | Transamerica Partners Small Growth is a diversified series of TPFG, an open-end management investment company organized as a Massachusetts business trust. Transamerica Partners Institutional Small Growth is a diversified series of TPFG II, an open-end management investment company organized as a Massachusetts business trust. Transamerica Partners Small Growth Portfolio is a diversified series of TPP, an open-end management investment company and a trust governed by New York law. | | The Destination Fund is a diversified series of the Destination Trust, an open-end management investment company organized as a Delaware statutory trust. |
| | |
| Net assets (as of June 30, 2016) | | Transamerica Partners Small Growth = $38,465,938 Transamerica Partners Institutional Small Growth = $10,669,799 Transamerica Partners Small Growth Portfolio (excluding the Target Feeder Funds) = $66,337,935 | | $363,625,960 |
| | |
| Management fees | | TAM receives compensation for investment advisory services from the Target Funds at annual rates of 0.84% of the first $300 million; and 0.80% in excess of $300 million. TAM also receives compensation for administrative services from Transamerica Partners Small Growth and Transamerica Partners Institutional Small Growth at annual rates of 0.30% and 0.05%, respectively. Transamerica Partners Small Growth Portfolio pays no separate administrative services fees. The applicable fee(s) are based upon average daily net assets and are accrued daily and paid monthly. | | TAM receives compensation for investment management services, which include investment advisory and administrative services, from the Destination Fund at annual rates of 0.87% of the first $300 million; and 0.83% in excess of $300 million. The fee is based upon average daily net assets and is accrued daily and paid monthly. |
- 129 -
| | | | |
| Distribution and service (12b-1) fees | | Transamerica Partners Small Growth is subject to a distribution and service (12b-1) fee of up to 0.25% of average daily net assets. Transamerica Partners Institutional Small Growth is subject to a distribution and service (12b-1) fee of up to 0.25% of average daily net assets. Transamerica Partners Small Growth Portfolio is not subject to a distribution and service (12b-1) fee. | | Class R shares of the Destination Fund are subject to a distribution and service (12b-1) fee of up to 0.50% of average daily net assets. Class R4 shares of the Destination Fund are subject to a distribution and service (12b-1) fee of up to 0.25% of average daily net assets. Class I3 shares of the Destination Fund are not subject to a distribution and service (12b-1) fee. |
| | |
| Sales charges | | Shares of the Target Funds are offered without a sales charge and are not subject to a contingent deferred sales charge. | | Class R, Class R4, and Class I3 shares of the Destination Fund are offered without a sales charge and are not subject to a contingent deferred sales charge. |
| | |
| Fee waiver and expense reimbursement | | Contractual arrangements have been made with TAM through May 1, 2017 to waive fees and/or reimburse fund expenses to the extent that the total operating expenses exceed: • 1.55% for Transamerica Partners Small Growth; and • 1.15% for Transamerica Partners Institutional Small Growth. The expense limitation excludes, as applicable, acquired fund fees and expenses, interest, taxes, brokerage commissions, dividend and interest expenses on securities sold short, extraordinary expenses and other expenses not incurred in the ordinary course of the fund’s business. These arrangements cannot be terminated prior to May 1, 2017 without the Board of Trustees’ consent. TAM has agreed to waive fees and reimburse expenses to limit the total operating expenses of Transamerica Partners Small Growth Portfolio to 0.90%. This arrangement is voluntary and may be terminated by TAM at any time. | | Contractual arrangements have been made with TAM through May 1, 2018 to waive fees and/or reimburse fund expenses to the extent that the Destination Fund’s total operating expenses exceed: • 1.55% for Class R shares; • 1.15% for Class R4 shares; and • 0.90% for Class I3 shares. The expense limitation excludes, as applicable, acquired fund fees and expenses, interest, taxes, brokerage commissions, dividend and interest expenses on securities sold short, extraordinary expenses and other expenses not incurred in the ordinary course of the fund’s business. These arrangements cannot be terminated prior to May 1, 2018 without the Board of Trustees’ consent. TAM is entitled to reimbursement by the Destination Fund of fees waived or expenses reduced during any of the previous 36 months if on any day or month the estimated annualized fund operating expenses are less than the cap. |
| |
| Gross and net expenses | | For a comparison of the gross and net expenses of the Funds, please see the class fee tables in the “The Funds’ Fees and Expenses” section. |
| 1 | Transamerica Partners Small Growth and Transamerica Partners Institutional Small Growth are feeder funds and invest in securities through Transamerica Partners Small Growth Portfolio, an underlying master fund having the same investment goals and strategies. |
Comparison of Principal Risks of Investing in the Funds
Because the Funds have the same investment objective and principal investment strategies, they are subject to the same principal risks. Risk is inherent in all investing. The value of your investment in a Fund, as well as the amount of return you receive on your investment, may fluctuate significantly from day to day and over time. You may lose part or all of your investment in a Fund or your investment may not perform as well as other similar investments.
- 130 -
Each Fund is subject to the following principal risks (in alphabetical order) of investing in the Fund:
Active Trading – The fund is actively managed and may purchase and sell securities without regard to the length of time held. Active trading may have a negative impact on performance by increasing transaction costs and may generate greater amounts of net short-term capital gains, which, for shareholders holding shares in taxable accounts, would generally be subject to tax at ordinary income tax rates upon distribution.
Currency – The value of investments in securities denominated in foreign currencies increases or decreases as the rates of exchange between those currencies and the U.S. dollar change. Currency conversion costs and currency fluctuations could reduce or eliminate investment gains or add to investment losses. Currency exchange rates can be volatile, and are affected by factors such as general economic conditions, the actions of the U.S. and foreign governments or central banks, the imposition of currency controls, and speculation.
Depositary Receipts – Depositary receipts may be less liquid than the underlying shares in their primary trading market. Any distributions paid to the holders of depositary receipts are usually subject to a fee charged by the depositary. Holders of depositary receipts may have limited voting rights, and investment restrictions in certain countries may adversely impact the value of depositary receipts because such restrictions may limit the ability to convert equity shares into depositary receipts and vice versa. Such restrictions may cause equity shares of the underlying issuer to trade at a discount or premium to the market price of the depositary receipts.
Equity Securities – Equity securities represent an ownership interest in an issuer, rank junior in a company’s capital structure and consequently may entail greater risk of loss than debt securities. Equity securities include common and preferred stocks. Stock markets are volatile. The price of equity securities fluctuates based on changes in a company’s financial condition and overall market and economic conditions. If the market prices of the equity securities owned by the fund fall, the value of your investment in the fund will decline.
Focused Investing – To the extent the fund invests in a limited number of countries, regions, sectors or industries, or in a limited number of issuers, the fund will be more susceptible to negative events affecting those countries, regions, sectors, industries or issuers, and the value of its shares may be more volatile than if invested more widely. Local events, such as political upheaval, financial troubles, or natural disasters may disrupt a country’s or region’s securities markets. Geographic risk is especially high in emerging markets.
Foreign Investments – Investing in securities of foreign issuers or issuers with significant exposure to foreign markets involves additional risk. Foreign countries in which the fund may invest may have markets that are less liquid, less regulated and more volatile than U.S. markets. The value of the fund’s investments may decline because of factors affecting the particular issuer as well as foreign markets and issuers generally, such as unfavorable or unsuccessful government actions, reduction of government or central bank support, political or financial instability or other adverse economic or political developments. Lack of information and weaker accounting standards also may affect the value of these securities.
Growth Stocks – Returns on growth stocks may not move in tandem with returns on other categories of stocks or the market as a whole. Growth stocks may be particularly susceptible to larger price swings or to adverse developments. Growth stocks as a group may be out of favor and underperform the overall equity market for a long period of time, for example, while the market favors “value” stocks.
Legal and Regulatory – Legal and regulatory changes could occur that may adversely affect the fund, its investments, and its ability to pursue its investment strategies and/or increase the costs of implementing such strategies. Certain changes have already been proposed and additional changes are expected. New or revised laws or regulations may be imposed by the U.S. Securities and Exchange Commission, the U.S. Commodity Futures Trading Commission, the Internal Revenue Service, the U.S. Federal Reserve or other governmental regulatory authorities or self-regulatory organizations that could adversely affect the fund. The fund also may be adversely affected by changes in the enforcement or interpretation of existing statutes and rules by governmental regulatory authorities or self-regulatory organizations.
Management – The fund is subject to the risk that the investment manager’s or sub-adviser’s judgments and decisions may be incorrect or otherwise may not produce the desired results. The value of your investment may
- 131 -
decrease if the sub-adviser’s judgment about the quality, relative yield or value of, or market trends affecting, a particular security or issuer, industry, sector, region or market segment, or about the economy or interest rates, is incorrect. The fund may also suffer losses if there are imperfections, errors or limitations in the tools, resources, information and data used, or the analyses employed or relied on, by the sub-adviser, or if the sub-adviser’s investment style is out of favor or otherwise fails to produce the desired results. The fund’s investment strategies designed by the investment manager may not work as intended. In addition, the fund’s investment strategies or policies may change from time to time. Those changes may not lead to the results intended by the investment manager and could have an adverse effect on the value or performance of the fund. Any of these things could cause the fund to lose value or its results to lag relevant benchmarks or other funds with similar objectives.
Market – The market prices of the fund’s securities may go up or down, sometimes rapidly or unpredictably, due to general market conditions, such as real or perceived adverse economic or political conditions, inflation, changes in interest rates or currency rates, lack of liquidity in the markets or adverse investor sentiment. Adverse market conditions may be prolonged and may not have the same impact on all types of securities. Market prices of securities also may go down due to events or conditions that affect particular sectors, industries or issuers. When market prices fall, the value of your investment will go down. The fund may experience a substantial or complete loss on any individual security.
In the past several years, financial markets, such as those in the United States, Europe, Asia and elsewhere, have experienced increased volatility, depressed valuations, decreased liquidity and heightened uncertainty. Governmental and non-governmental issuers defaulted on, or were forced to restructure, their debts. These market conditions may continue, worsen or spread.
The U.S. government and the Federal Reserve, as well as certain foreign governments and central banks have taken steps to support financial markets, including keeping interest rates at historically low levels. This and other government intervention may not work as intended, particularly if the efforts are perceived by investors as being unlikely to achieve the desired results. The Federal Reserve recently has reduced its market support activities. Further reduction or withdrawal of Federal Reserve or other U.S. or non-U.S. governmental or central bank support, including interest rate increases, could negatively affect financial markets generally, increase market volatility and reduce the value and liquidity of securities in which the fund invests.
Policy and legislative changes in the United States and in other countries are affecting many aspects of financial regulation, and may in some instances contribute to decreased liquidity and increased volatility in the financial markets. The impact of these changes on the markets, and the practical implications for market participants, may not be fully known for some time.
Economies and financial markets throughout the world are becoming increasingly interconnected. As a result, whether or not the fund invests in securities of issuers located in or with significant exposure to countries experiencing economic and financial difficulties, the value and liquidity of the fund’s investments may be negatively affected.
Small Capitalization Companies – The fund will be exposed to additional risks as a result of its investments in the securities of small capitalization companies. Small capitalization companies may be more at risk than larger capitalization companies because, among other things, they may have limited product lines, operating history, market or financial resources, or because they may depend on limited management groups. The prices of securities of small capitalization companies generally are more volatile than those of larger capitalization companies and are more likely to be adversely affected than larger capitalization companies by changes in earnings results and investor expectations or poor economic or market conditions. Securities of small capitalization companies may underperform larger capitalization companies, may be harder to sell at times and at prices the portfolio managers believe appropriate and may offer greater potential for losses.
Valuation – The sales price the fund could receive for any particular portfolio investment may differ from the fund’s valuation of the investment, particularly for securities that trade in thin or volatile markets, that are priced based upon valuations provided by third-party pricing services that use matrix or evaluated pricing systems, or that are valued using a fair value methodology. The fund’s ability to value its investments may be impacted by technological issues and/or errors by pricing services or other third party service providers.
- 132 -
The Funds’ Past Performance
Set forth below is performance information for each Fund. The bar charts and tables below provide some indication of the risks of investing in each Fund by showing you how the performance of the Target Funds and Class A shares of the Destination Fund has varied from year to year for 10 years or since inception, as applicable, and how the average total returns of each Target Fund and the applicable class of shares of the Destination Fund for different periods compare to the returns of one or more broad measures of market performance. The performance shown below for Transamerica Partners Small Growth Portfolio reflects only master portfolio level expenses, and does not include the expenses of any of the applicable Non-Mutual Fund Feeder Funds. If those expenses were reflected, the performance would be lower. Absent any applicable limitation of or cap on the Funds’ expenses, performance would have been lower. No performance information is presented for the Class R, Class R4 and Class I3 shares of the Destination Fund because those share classes are newly offered. Class R, Class R4 and Class I3 shares of the Destination Fund would have different performance because they have different expenses. A Fund’s past performance (before and after taxes) is not necessarily an indication of how the Fund will perform in the future. Following the Reorganizations, Transamerica Small Cap Growth will be the surviving fund for performance purposes.
Prior to August 31, 2012, the Target Funds had a different sub-adviser, a different investment objective and used different investment strategies. The performance set forth below for the Target Funds prior to that date is attributable to a previous sub-adviser.
Transamerica Partners Small Growth Annual Returns
Annual Total Returns (calendar years ended December 31)

| | | | | | |
| | | Quarter Ended | | Return | |
Best Quarter: | | 6/30/2009 | | | 23.59 | % |
Worst Quarter: | | 12/31/2008 | | | -25.40 | % |
Year-to-date return as of September 30, 2016: 13.09%
Transamerica Partners Small Growth Average Annual Total Returns
Average Annual Total Returns (periods ended December 31, 2015)
| | | | | | | | | | | | | | | | |
| | | 1 Year | | | 5 Years | | | 10 Years | | | Inception Date | |
Transamerica Partners Small Growth | | | 2.89 | % | | | 6.21 | % | | | 4.83 | % | | | 08/09/2002 | |
Russell 2000® Growth Index (reflects no deduction for fees, expenses or taxes) | | | -1.38 | % | | | 10.67 | % | | | 7.95 | % | | | | |
- 133 -
Transamerica Partners Institutional Small Growth Annual Returns
Annual Total Returns (calendar years ended December 31)
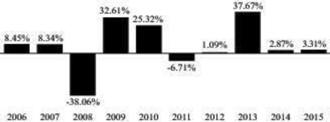
| | | | | | |
| | | Quarter Ended | | Return | |
Best Quarter: | | 6/30/2009 | | | 23.68 | % |
Worst Quarter: | | 12/31/2008 | | | -25.34 | % |
Year-to-date return as of September 30, 2016: 13.33%
Transamerica Partners Institutional Small Growth Average Annual Total Returns
Average Annual Total Returns (periods ended December 31, 2015)
| | | | | | | | | | | | | | | | |
| | | 1 Year | | | 5 Years | | | 10 Years | | | Inception Date | |
Transamerica Partners Institutional Small Growth | | | 3.31 | % | | | 6.65 | % | | | 5.25 | % | | | 05/29/2003 | |
Russell 2000® Growth Index (reflects no deduction for fees, expenses or taxes) | | | -1.38 | % | | | 10.67 | % | | | 7.95 | % | | | | |
Transamerica Partners Small Growth Portfolio Annual Returns
Annual Total Returns (calendar years ended December 31)
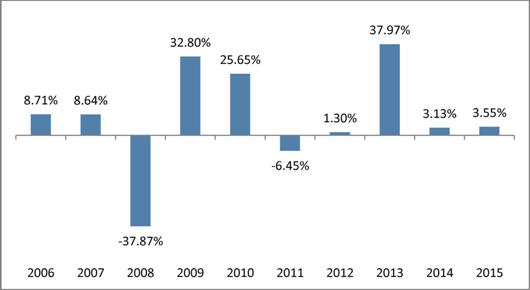
- 134 -
The highest and lowest quarterly returns for the periods reflected in the table above are:
| | | | | | | | |
| | | Quarter Ended | | | Return | |
Best Quarter: | | | 6/30/2009 | | | | 23.78 | % |
Worst Quarter: | | | 12/31/2008 | | | | -25.22 | % |
Year-to-date return as of September 30, 2016: 13.58%
Transamerica Partners Small Growth Portfolio Average Annual Total Returns
(for periods ended 12/31/2015)
| | | | | | | | | | | | | | | | |
| | | 1 Year | | | 5 Years | | | 10 Years | | | Inception
Date | |
Transamerica Partners Small Growth Portfolio | | | 3.55 | % | | | 6.90 | % | | | 5.51 | % | | | 06/01/2002 | |
Russell 2000® Growth Index (reflects no deduction for fees, expenses or taxes) | | | -1.38 | % | | | 10.67 | % | | | 7.95 | % | | | | |
Transamerica Small Cap Growth Annual Returns
Annual Total Returns (calendar years ended December 31) - Class A
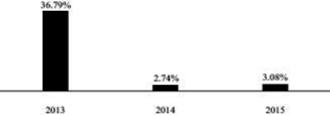
| | | | | | | | |
| | | Quarter Ended | | | Return | |
Best Quarter: | | | 09/30/2013 | | | | 12.30 | % |
Worst Quarter: | | | 09/30/2015 | | | | -7.16 | % |
Year-to-date return as of September 30, 2016: 12.52%
Transamerica Small Cap Growth Average Annual Total Returns
Average Annual Total Returns (periods ended December 31, 2015)
| | | | | | | | | | | | |
| | | 1 Year | | | Since
Inception | | | Inception Date | |
Class A | | | | 08/31/2012 | |
Return before taxes | | | -2.56 | % | | | 7.69 | % | | | | |
Return after taxes on distributions | | | -4.50 | % | | | 6.43 | % | | | | |
Return after taxes on distributions and sale of fund shares | | | 0.18 | % | | | 5.97 | % | | | | |
Russell 2000® Growth Index (reflects no deduction for fees, expenses or taxes) | | | -1.38 | % | | | 14.06 | % | | | | |
The after-tax returns are calculated using the historic highest individual federal marginal income tax rates and do not reflect the impact of state and local taxes. Actual after-tax returns may depend on the investor’s individual tax situation and may differ from those shown. After-tax returns may not be relevant if the investment is made through a tax-exempt or tax-deferred account, such as a 401(k) plan.
- 135 -
The Funds’ Fees and Expenses
Shareholders of the Target Funds and the Destination Fund pay various fees and expenses, either directly or indirectly. The tables below show the fees and expenses that you would pay if you were to buy and hold shares of each Fund. The fees and expenses in the tables appearing below are based on the expenses of the Funds for the twelve-month period ended June 30, 2016. The tables also show the pro forma expenses of the combined Destination Fund after giving effect to all Group 8 Reorganizations based on pro forma net assets as of June 30, 2016. Pro forma numbers are estimated in good faith and are hypothetical. Actual expenses may vary significantly. The fees and expenses shown in the table and Example below for Transamerica Partners Small Growth Portfolio reflect only master portfolio level fees and expenses, and do not include the fees and expenses of any of the applicable Non-Mutual Fund Feeder Funds. For financial statement purposes, Transamerica Small Cap Growth will be the accounting survivor of the Reorganizations. As the accounting survivor, Transamerica Small Cap Growth’s operating history will be used for financial reporting purposes.
Transamerica Partners Small Growth
| | | | | | | | | | | | |
| | | Transamerica
Partners Small
Growth1 | | | Transamerica
Small Cap
Growth | | | Combined
Transamerica
Small Cap
Growth
(Pro Forma) | |
| | | | | | Class R | | | Class R | |
Shareholder Fees (fees paid directly from your investment) | | | | | | | | | | | | |
Maximum sales charge (load) imposed on purchases (as a % of offering price) | | | None | | | | None | | | | None | |
Maximum deferred sales charge (load) (as a % of offering price) | | | None | | | | None | | | | None | |
Redemption fee (as a % of amount redeemed) | | | None | | | | None | | | | None | |
| | | |
Annual Fund Operating Expenses (expenses that you pay each year as a % of the value of your investment) | | | | | | | | | | | | |
Management fees2 | | | 0.84 | % | | | 0.85 | % | | | 0.85 | % |
Distribution and service (12b-1) fees | | | 0.25 | % | | | 0.50 | % | | | 0.50 | % |
Other expenses3 | | | 0.51 | % | | | 0.05 | %4 | | | 0.05 | %4 |
Total annual fund operating expenses | | | 1.60 | % | | | 1.40 | % | | | 1.40 | % |
Fee waiver and/or expense reimbursement | | | 0.05 | %5 | | | 0.00 | %6 | | | 0.00 | %6 |
Total annual fund operating expenses after fee waiver and/or expense reimbursement | | | 1.55 | % | | | 1.40 | % | | | 1.40 | % |
Transamerica Partners Institutional Small Growth
| | | | | | | | | | | | |
| | | Transamerica
Partners
Institutional
Small Growth1 | | | Transamerica
Small Cap
Growth | | | Combined
Transamerica
Small Cap
Growth
(Pro Forma) | |
| | | | | | Class R4 | | | Class R4 | |
Shareholder Fees (fees paid directly from your investment) | | | | | | | | | | | | |
Maximum sales charge (load) imposed on purchases (as a % of offering price) | | | None | | | | None | | | | None | |
Maximum deferred sales charge (load) (as a % of offering price) | | | None | | | | None | | | | None | |
Redemption fee (as a % of amount redeemed) | | | None | | | | None | | | | None | |
| | | |
Annual Fund Operating Expenses (expenses that you pay each year as a % of the value of your investment) | | | | | | | | | | | | |
Management fees2 | | | 0.84 | % | | | 0.85 | % | | | 0.85 | % |
Distribution and service (12b-1) fees | | | 0.25 | % | | | 0.25 | % | | | 0.25 | % |
Other expenses3 | | | 0.69 | % | | | 0.05 | %4 | | | 0.05 | %4 |
Total annual fund operating expenses | | | 1.78 | % | | | 1.15 | % | | | 1.15 | % |
Fee waiver and/or expense reimbursement | | | 0.63 | %7 | | | 0.00 | %6 | | | 0.00 | %6 |
Total annual fund operating expenses after fee waiver and/or expense reimbursement | | | 1.15 | % | | | 1.15 | % | | | 1.15 | % |
- 136 -
Transamerica Partners Small Growth Portfolio
| | | | | | | | | | | | |
| | | Transamerica
Partners Small
Growth
Portfolio | | | Transamerica
Small Cap
Growth | | | Combined
Transamerica
Small Cap
Growth
(Pro Forma) | |
| | | | | | Class I3 | | | Class I3 | |
Shareholder Fees (fees paid directly from your investment) | | | | | | | | | | | | |
Maximum sales charge (load) imposed on purchases (as a % of offering price) | | | None | | | | None | | | | None | |
Maximum deferred sales charge (load) (as a % of offering price) | | | None | | | | None | | | | None | |
Redemption fee (as a % of amount redeemed) | | | None | | | | None | | | | None | |
| | | |
Annual Fund Operating Expenses (expenses that you pay each year as a % of the value of your investment) | | | | | | | | | | | | |
Management fees2 | | | 0.84 | % | | | 0.85 | % | | | 0.85 | % |
Distribution and service (12b-1) fees | | | None | | | | None | | | | None | |
Other expenses3 | | | 0.07 | % | | | 0.05 | %4 | | | 0.05 | %4 |
Total annual fund operating expenses | | | 0.91 | % | | | 0.90 | % | | | 0.90 | % |
Fee waiver and/or expense reimbursement | | | N/A | | | | 0.00 | %6 | | | 0.00 | %6 |
Total annual fund operating expenses after fee waiver and/or expense reimbursement | | | 0.91 | % | | | 0.90 | % | | | 0.90 | % |
| 1 | The Target Feeder Fund invests in securities through an underlying Target Master Portfolio, Transamerica Partners Small Growth Portfolio. The information in this table and in the Example below concerning the Target Feeder Fund reflects the direct fees and expenses of the Target Feeder Fund and its allocated share of the fees and expenses of the Target Master Portfolio. |
| 2 | The Destination Fund receives investment advisory and administrative services under one agreement with the Destination Fund’s investment manager, Transamerica Asset Management, Inc. (“TAM”), and pays a single management fee to TAM. Transamerica Partners Small Growth and Transamerica Partners Institutional Small Growth receive investment advisory and administrative services from TAM under separate agreements and pay separate advisory fees and administrative services fees to TAM. The administrative services fees of 0.30% for Transamerica Partners Small Growth and 0.05% for Transamerica Partners Institutional Small Growth are included in “Other expenses.” Transamerica Partners Small Growth Portfolio receives investment advisory services from TAM and pays advisory fees to TAM. Transamerica Partners Small Growth Portfolio pays no separate administrative services fees. |
| 3 | Other expenses do not include the costs of the Reorganization to be borne by the Target Funds and the Destination Fund. These costs are considered extraordinary expenses and are not covered by the applicable expense limitation arrangements. The basis point impact of such costs is 0.00% for Transamerica Partners Small Growth, 0.00% for Transamerica Partners Institutional Small Growth, 0.09% for Transamerica Partners Small Growth Portfolio and 0.05% for Transamerica Small Cap Growth. |
| 4 | Other expenses are based on estimates for the current fiscal year. Actual expenses may differ from estimates. |
| 5 | Contractual arrangements have been made with TAM through May 1, 2017 to waive fees and/or reimburse fund expenses to the extent that the fund’s total operating expenses exceed 1.55%, excluding, as applicable, acquired fund fees and expenses, interest, taxes, brokerage commissions, dividend and interest expenses on securities sold short, extraordinary expenses and other expenses not incurred in the ordinary course of the fund’s business. |
| 6 | Contractual arrangements have been made with TAM through May 1, 2018 to waive fees and/or reimburse fund expenses to the extent that the fund’s total operating expenses exceed 1.55% for Class R shares, 1.15% for Class R4 shares and 0.90% for Class I3 shares, excluding, as applicable, acquired fund fees and expenses, interest, taxes, brokerage commissions, dividend and interest expenses on securities sold short, extraordinary expenses and other expenses not incurred in the ordinary course of the fund’s business. These arrangements cannot be |
- 137 -
| | terminated prior to May 1, 2018 without the Board of Trustees’ consent. TAM is entitled to reimbursement by the fund of fees waived or expenses reduced during any of the previous 36 months if on any day or month the estimated annualized fund operating expenses are less than the cap. |
| 7 | Contractual arrangements have been made with TAM through May 1, 2017 to waive fees and/or reimburse fund expenses to the extent that the fund’s total operating expenses exceed 1.15%, excluding, as applicable, acquired fund fees and expenses, interest, taxes, brokerage commissions, dividend and interest expenses on securities sold short, extraordinary expenses and other expenses not incurred in the ordinary course of the fund’s business. |
The hypothetical examples below help you compare the cost of investing in each Fund. Each example assumes that:
| | • | | you invest $10,000 in each Fund; |
| | • | | you reinvest all dividends and distributions without a sales charge; |
| | • | | your investment has a 5% annual return (this assumption is required by the SEC and is not a prediction of the Fund’s future performance); and |
| | • | | each Fund’s operating expenses remain the same. |
Each example also assumes no fees for IRA accounts, if applicable. Costs are the same whether you redeem at the end of any period or not. Pro forma expenses are included assuming the consummation of all Group 1 Reorganizations. The examples are for comparison purposes only and do not represent the Funds’ actual expenses or returns, either past or future. Because actual return and expenses will be different, the examples are for comparison only.
Transamerica Partners Small Growth
| | | | | | | | | | | | |
Number of years
you own your shares | | Transamerica
Partners Small
Growth | | | Transamerica
Small Cap
Growth | | | Combined
Transamerica
Small Cap Growth
(Pro Forma) | |
| | | | | | Class R | | | Class R | |
Year 1 | | $ | 158 | | | $ | 143 | | | $ | 143 | |
Year 3 | | $ | 500 | | | $ | 443 | | | $ | 443 | |
Year 5 | | $ | 866 | | | $ | 766 | | | $ | 766 | |
Year 10 | | $ | 1,896 | | | $ | 1,680 | | | $ | 1,680 | |
Transamerica Partners Institutional Small Growth
| | | | | | | | | | | | |
Number of years
you own your shares | | Transamerica
Partners
Institutional
Small Growth | | | Transamerica
Small Cap
Growth | | | Combined
Transamerica
Small Cap Growth
(Pro Forma) | |
| | | | | | Class R4 | | | Class R4 | |
Year 1 | | $ | 117 | | | $ | 117 | | | $ | 117 | |
Year 3 | | $ | 499 | | | $ | 365 | | | $ | 365 | |
Year 5 | | $ | 906 | | | $ | 633 | | | $ | 633 | |
Year 10 | | $ | 2,043 | | | $ | 1,398 | | | $ | 1,398 | |
- 138 -
Transamerica Partners Small Growth Portfolio
| | | | | | | | | | | | |
Number of years
you own your shares | | Transamerica
Partners Small
Growth Portfolio | | | Transamerica
Small Cap
Growth | | | Combined
Transamerica
Small Cap Growth
(Pro Forma) | |
| | | | | | Class I3 | | | Class I3 | |
Year 1 | | $ | 93 | | | $ | 92 | | | $ | 92 | |
Year 3 | | $ | 290 | | | $ | 287 | | | $ | 287 | |
Year 5 | | $ | 504 | | | $ | 498 | | | $ | 498 | |
Year 10 | | $ | 1,120 | | | $ | 1,108 | | | $ | 1,108 | |
CAPITALIZATION
The following tables set forth the capitalization of each Target Fund and the Destination Fund as of September 30, 2016 and the pro forma combined capitalization of the combined Destination Fund as if the Reorganizations had occurred on that date. If the Reorganizations are consummated, the actual exchange ratios on the closing date may vary from the exchange ratios used in the computation below. This is due to changes in the market value of the portfolio securities of the Funds between September 30, 2016 and the closing date, changes in the amount of undistributed net investment income and net realized capital gains of the Funds during that period resulting from income and distributions, and changes in the accrued liabilities of the Funds during the same period.
Transamerica Partners Small Growth Funds
| | | | | | | | | | | | |
| | | Transamerica
Partners Small
Growth | | | Transamerica
Partners
Institutional Small
Growth | | | Transamerica
Partners Small
Growth Portfolio | |
Net Assets | | $ | 40,278,505 | | | $ | 11,237,896 | | | $ | 17,234,045 | |
Net Asset Value Per Share | | $ | 18.06 | | | $ | 20.57 | | | $ | 13.07 | |
Shares Outstanding | | | 2,230,809 | | | | 546,235 | | | | 1,318,596 | |
Transamerica Small Cap Growth
| | | | | | | | |
| | | Transamerica
Small Cap
Growth | | | Transamerica Small
Cap Growth
Pro Forma | |
Net Assets | | | | | | | | |
Class A | | $ | 9,092,955 | | | $ | 9,092,955 | |
Class C | | $ | 1,404,210 | | | $ | 1,404,210 | |
Class I | | $ | 2,042,047 | | | $ | 2,042,047 | |
Class I2 | | $ | 57,657,996 | | | $ | 57,657,996 | |
Advisor Class | | | — | | | | — | |
Class R6 | | $ | 51,670 | | | $ | 51,670 | |
Class R | | | — | | | $ | 40,278,505 | |
Class R4 | | | — | | | $ | 11,237,896 | |
Class I3 | | | — | | | $ | 17,144,557 | |
Net Asset Value Per Share | | | | | | | | |
Class A | | $ | 12.85 | | | $ | 12.85 | |
Class C | | $ | 12.46 | | | $ | 12.46 | |
Class I | | $ | 13.01 | | | $ | 13.01 | |
Class I2 | | $ | 13.07 | | | $ | 13.07 | |
- 139 -
| | | | | | | | |
| | | Transamerica
Small Cap
Growth | | | Transamerica Small
Cap Growth
Pro Forma | |
Advisor Class | | | — | | | | — | |
Class R6 | | $ | 13.07 | | | $ | 13.07 | |
Class R | | $ | 13.07 | | | $ | 13.07 | |
Class R4 | | $ | 13.07 | | | $ | 13.07 | |
Class I3 | | $ | 13.07 | | | $ | 13.00 | |
Shares Outstanding | | | | | | | | |
Class A | | | 707,699 | | | | 707,699 | |
Class C | | | 112,736 | | | | 112,736 | |
Class I | | | 157,009 | | | | 157,009 | |
Class I2 | | | 4,411,753 | | | | 4,411,753 | |
Advisor Class | | | — | | | | — | |
Class R6 | | | 3,953 | | | | 3,953 | |
Class R | | | | | | | 3,081,752 | |
Class R4 | | | — | | | | 859,824 | |
Class I3 | | | — | | | | 1,318,596 | |
It is impossible to predict with any certainty how many shares of the Destination Fund will actually be received and distributed by a Target Fund on the closing date. The foregoing table should not be relied upon to determine the amount of Destination Fund shares that will actually be received and distributed.
ADDITIONAL INFORMATION
For information relating to each Fund and its Reorganization, including tax capital loss carryforwards, the tax status of the Reorganization, a comparison of the fundamental investment policies of the Funds, how to buy, sell or exchange Fund shares, how each Fund values its securities, financial highlights information for each Fund and ownership of shares of the Funds, please see the sections immediately following the discussion of the Group 9 Reorganizations.
TARGET FUND BOARD’S EVALUATION AND RECOMMENDATION
With respect to each Target Fund, the Board of the Target Fund, including its Independent Trustees, after careful consideration, unanimously determined that the Reorganization is in the best interest of the Target Fund and will not dilute the interests of the existing holders of the Target Fund. Each Board made this determination based on various factors, which include those that are discussed in the section entitled “Reasons for the Proposed Reorganizations” in the back of this Proxy Statement/Prospectus following the discussion of the proposals.
Similarly, the Board of the Destination Fund, including all its Independent Trustees, has approved the Reorganization with respect to the Destination Fund. The Board has determined that the Reorganization is in the best interest of the Destination Fund and that the interests of the Destination Fund’s holders will not be diluted as a result of the Reorganization.
THE BOARD OF YOUR TARGET FUND RECOMMENDS THAT YOU VOTE “FOR” PROPOSAL 8A, 8B OR 8C, AS APPLICABLE, TO APPROVE THE PLAN.
- 140 -
GROUP 9 – SMALL VALUE FUNDS
TRANSAMERICA PARTNERS SMALL VALUE
TRANSAMERICA PARTNERS INSTITUTIONAL SMALL VALUE
TRANSAMERICA PARTNERS SMALL VALUE PORTFOLIO
(each, a “Target Fund” and together, the “Target Funds”)
AND
TRANSAMERICA SMALL CAP VALUE
(the “Destination Fund”)
PROPOSALS 9A, 9B AND 9C
APPROVAL OF AGREEMENT AND PLAN OF REORGANIZATION
SUMMARY
The following is a summary of more complete information appearing later in this Proxy Statement/Prospectus or incorporated herein. You should read carefully the entire Proxy Statement/Prospectus, including the form of Plan attached as Exhibit A, which includes additional information that is not included in the summary and is a part of this Proxy Statement/Prospectus. For a discussion of the terms of the Plan, please see the section entitled “Terms of Each Agreement and Plan of Reorganization” in the back of this Proxy Statement/Prospectus, after the discussion of the proposals.
In each proposed Reorganization, the Target Fund would be reorganized into the Destination Fund, with that Target Fund receiving shares of the applicable class of the Destination Fund as shown in the following table. The Target Funds, which operate in a master-feeder structure, do not have share classes.
| | | | |
Proposal | | Target Fund | | Destination Fund and Shares |
Proposal 9A | | Transamerica Partners Small Value | | Transamerica Small Cap Value
Class R |
Proposal 9B | | Transamerica Partners Institutional Small Value | | Transamerica Small Cap Value
Class R4 |
Proposal 9C | | Transamerica Partners Small Value Portfolio | | Transamerica Small Cap Value
Class I3 |
Transamerica Partners Small Value would reorganize first, Transamerica Partners Institutional Small Value would reorganize next and Transamerica Partners Small Value Portfolio would reorganize last. All Reorganizations would occur on the same closing date.
The Target Funds and the Destination Fund are managed by Transamerica Asset Management, Inc. (“TAM”) and have the same investment objective and the same principal investment strategies and related risks. The tables below provide a comparison of certain features of the Funds. Unless otherwise noted, the information is the same for each Target Fund. In the tables below, if a row extends across the entire table, the information applies to the Destination Fund and the Target Funds.
Comparison of Target Funds and Destination Fund
| | | | |
| | | Target Funds | | Destination Fund |
Investment objective | | Seeks long term capital appreciation. |
| |
| Principal investment strategies1 | | The fund’s sub-adviser, Boston Advisors, LLC (the “sub-adviser”) invests, under normal circumstances, at least 80% of the fund’s net assets (plus the amount of borrowings, if any, for investment purposes) in equity securities of small capitalization companies. The fund generally considers a small capitalization company to be a company with a market capitalization within the range of the Russell 2000 Value® Total Return Index at the time of initial purchase. As of December 31, 2015, the market capitalization range of the Russell 2000® Value Total Return Index was between $14.78 million and $5.28 billion. The equity securities in which the fund invests are primarily common stocks of U.S. companies. |
- 141 -
| | | | |
| | In selecting investments for the fund, the sub-adviser combines quantitative modeling, fundamental research and qualitative analysis. The sub-adviser first ranks the individual stocks in which the fund may invest through the use of a proprietary model that incorporates multiple fundamental factors, with the weightings of the factors in the model varying in relation to the stock’s industry group and the current market environment. The sub-adviser also ranks industry groups using a fundamental research process which takes into account macroeconomic considerations and other factors. The sub-adviser selects stocks on behalf of the fund based on the stock and industry rankings which are derived from the sub-adviser’s proprietary process. The sub-adviser will generally sell a stock on behalf of the fund if the stock experiences a rankings decline or extreme price movements, or for risk management purposes. From time to time, the fund may invest up to 10% of its assets in exchange-traded funds (“ETFs”) in order to manage market liquidity and timing issues. |
| Investment manager | | TAM |
| Sub-adviser | | Boston Advisors, LLC |
| Portfolio managers | | David Hanna: Portfolio Manager of the Funds since 2015; Associated with Boston Advisors, LLC in an investment management capacity since 2007; Senior Vice President and Director of Institutional Portfolio Management James W. Gaul, CFA: Portfolio Manager of the Funds since 2015; Associated with Boston Advisors, LLC in an investment management capacity since 2005; Vice President and Portfolio Manager Michael J. Vogelzang, CFA: Portfolio Manager of the Funds since 2015; Associated with Boston Advisors, LLC in an investment management capacity since 1997; President and Chief Investment Officer Douglas A. Riley, CFA: Portfolio Manager of the Funds since 2015; Associated with Boston Advisors, LLC in an investment management capacity since 2002; Senior Vice President and Director of Growth Equity Investing |
| Business | | Transamerica Partners Small Value is a diversified series of TPFG, an open-end management investment company organized as a Massachusetts business trust. Transamerica Partners Institutional Small Value is a diversified series of TPFG II, an open-end management investment company organized as a Massachusetts business trust. Transamerica Partners Small Value Portfolio is a diversified series of TPP, an open-end management investment company and a trust governed by New York law. | | The Destination Fund is a diversified series of the Destination Trust, an open-end management investment company organized as a Delaware statutory trust. |
| Net assets (as of June 30, 2016) | | Transamerica Partners Small Value = $34,442,708 Transamerica Partners Institutional Small Value = $6,550,062 Transamerica Partners Small Value Portfolio (excluding the Target Feeder Funds) = 64,884,148 | | $302,693,584 |
| Management fees | | TAM receives compensation for investment advisory services from the Target Funds at annual rates of 0.82% of the first $250 | | TAM receives compensation for investment management services, which include investment advisory and administrative |
- 142 -
| | | | |
| | million; 0.78% over $250 million up to $500 million; 0.75% over $500 million up to $750 million; and 0.725% in excess of $750 million. TAM also receives compensation for administrative services from Transamerica Partners Small Value and Transamerica Partners Institutional Small Value at annual rates of 0.30% and 0.05%, respectively. Transamerica Partners Small Value Portfolio pays no separate administrative services fees. The applicable fee(s) are based upon average daily net assets and are accrued daily and paid monthly. | | services, from the Destination Fund at annual rates of 0.85% of the first $250 million; 0.81% over $250 million up to $500 million; 0.78% over $500 million up to $750 million; and 0.755% in excess of $750 million. The fee is based upon average daily net assets and is accrued daily and paid monthly. |
| Distribution and service (12b-1) fees | | Transamerica Partners Small Value is subject to a distribution and service (12b-1) fee of up to 0.25% of average daily net assets. Transamerica Partners Institutional Small Value is subject to a distribution and service (12b-1) fee of up to 0.25% of average daily net assets. Transamerica Partners Small Value Portfolio is not subject to a distribution and service (12b-1) fee. | | Class R shares of the Destination Fund are subject to a distribution and service (12b-1) fee of up to 0.50% of average daily net assets. Class R4 shares of the Destination Fund are subject to a distribution and service (12b-1) fee of up to 0.25% of average daily net assets. Class I3 shares of the Destination Fund are not subject to a distribution and service (12b-1) fee. |
| Sales charges | | Shares of the Target Funds are offered without a sales charge and are not subject to a contingent deferred sales charge. | | Class R, Class R4, and Class I3 shares of the Destination Fund are offered without a sales charge and are not subject to a contingent deferred sales charge. |
| Fee waiver and expense reimbursement | | Contractual arrangements have been made with TAM through May 1, 2017 to waive fees and/or reimburse fund expenses to the extent that the total operating expenses exceed: • 1.50% for Transamerica Partners Small Value; and • 1.10% for Transamerica Partners Institutional Small Value. The expense limitation excludes, as applicable, acquired fund fees and expenses, interest, taxes, brokerage commissions, dividend and interest expenses on securities sold short, extraordinary expenses and other expenses not incurred in the ordinary course of the fund’s business. These arrangements cannot be terminated prior to May 1, 2017 without the Board of Trustees’ consent. TAM has agreed to waive fees and reimburse expenses to limit the total operating expenses of Transamerica Partners Small Value Portfolio to 0.85%. This arrangement is voluntary and may be terminated by TAM at any time. | | Contractual arrangements have been made with TAM through May 1, 2018 to waive fees and/or reimburse fund expenses to the extent that the Destination Fund’s total operating expenses exceed: • 1.50% for Class R shares; • 1.10% for Class R4 shares; and • 0.85% for Class I3 shares. The expense limitation excludes, as applicable, acquired fund fees and expenses, interest, taxes, brokerage commissions, dividend and interest expenses on securities sold short, extraordinary expenses and other expenses not incurred in the ordinary course of the fund’s business. These arrangements cannot be terminated prior to May 1, 2018 without the Board of Trustees’ consent. TAM is entitled to reimbursement by the Destination Fund of fees waived or expenses reduced during any of the previous 36 months if on any day or month the estimated annualized fund operating expenses are less than the cap. |
Gross and net expenses | | For a comparison of the gross and net expenses of the Funds, please see the class fee tables in the “The Funds’ Fees and Expenses” section. |
| 1 | Transamerica Partners Small Value and Transamerica Partners Institutional Small Value are feeder funds and invest in securities through Transamerica Partners Small Value Portfolio, an underlying master fund having the same investment goals and strategies. |
- 143 -
Comparison of Principal Risks of Investing in the Funds
Because the Funds have the same investment objective and principal investment strategies, they are subject to the same principal risks. Risk is inherent in all investing. The value of your investment in a Fund, as well as the amount of return you receive on your investment, may fluctuate significantly from day to day and over time. You may lose part or all of your investment in a Fund or your investment may not perform as well as other similar investments.
Each Fund is subject to the following principal risks (in alphabetical order) of investing in the Fund:
Active Trading – The fund is actively managed and may purchase and sell securities without regard to the length of time held. Active trading may have a negative impact on performance by increasing transaction costs and may generate greater amounts of net short-term capital gains, which, for shareholders holding shares in taxable accounts, would generally be subject to tax at ordinary income tax rates upon distribution.
Equity Securities – Equity securities represent an ownership interest in an issuer, rank junior in a company’s capital structure and consequently may entail greater risk of loss than debt securities. Equity securities include common and preferred stocks. Stock markets are volatile. The price of equity securities fluctuates based on changes in a company’s financial condition and overall market and economic conditions. If the market prices of the equity securities owned by the fund fall, the value of your investment in the fund will decline.
Exchange Traded Funds (ETFs) – Equity-based ETFs are subject to risks similar to those of stocks; fixed income-based ETFs are subject to risks similar to those of fixed-income securities. ETF shares may trade at a premium or discount to net asset value. ETFs are subject to secondary market trading risks. In addition, a fund will bear a pro rata portion of the operating expenses of an ETF in which it invests.
Legal and Regulatory – Legal and regulatory changes could occur that may adversely affect the fund, its investments, and its ability to pursue its investment strategies and/or increase the costs of implementing such strategies. Certain changes have already been proposed and additional changes are expected. New or revised laws or regulations may be imposed by the U.S. Securities and Exchange Commission, the U.S. Commodity Futures Trading Commission, the Internal Revenue Service, the U.S. Federal Reserve or other governmental regulatory authorities or self-regulatory organizations that could adversely affect the fund. The fund also may be adversely affected by changes in the enforcement or interpretation of existing statutes and rules by governmental regulatory authorities or self-regulatory organizations.
Liquidity – The fund may make investments that are illiquid or that become illiquid after purchase. Investments may become illiquid due to the lack of an active market, a reduced number of traditional market participants, or reduced capacity of traditional market participants to make a market in securities. The liquidity and value of investments can deteriorate rapidly and those investments may be difficult or impossible for the fund to sell, particularly during times of market turmoil. These illiquid investments can be difficult to value. If the fund is forced to sell an illiquid investment to meet redemption requests or other cash needs, the fund may be forced to sell at a loss. The fund may not receive its proceeds from the sale of certain securities for an extended period (for example, several weeks or even longer).
Management – The fund is subject to the risk that the investment manager’s or sub-adviser’s judgments and decisions may be incorrect or otherwise may not produce the desired results. The value of your investment may decrease if the sub-adviser’s judgment about the quality, relative yield or value of, or market trends affecting, a particular security or issuer, industry, sector, region or market segment, or about the economy or interest rates, is incorrect. The fund may also suffer losses if there are imperfections, errors or limitations in the tools, resources,
- 144 -
information and data used, or the analyses employed or relied on, by the sub-adviser, or if the sub-adviser’s investment style is out of favor or otherwise fails to produce the desired results. The fund’s investment strategies designed by the investment manager may not work as intended. In addition, the fund’s investment strategies or policies may change from time to time. Those changes may not lead to the results intended by the investment manager and could have an adverse effect on the value or performance of the fund. Any of these things could cause the fund to lose value or its results to lag relevant benchmarks or other funds with similar objectives.
Market – The market prices of the fund’s securities may go up or down, sometimes rapidly or unpredictably, due to general market conditions, such as real or perceived adverse economic or political conditions, inflation, changes in interest rates or currency rates, lack of liquidity in the markets or adverse investor sentiment. Adverse market conditions may be prolonged and may not have the same impact on all types of securities. Market prices of securities also may go down due to events or conditions that affect particular sectors, industries or issuers. When market prices fall, the value of your investment will go down. The fund may experience a substantial or complete loss on any individual security.
In the past several years, financial markets, such as those in the United States, Europe, Asia and elsewhere, have experienced increased volatility, depressed valuations, decreased liquidity and heightened uncertainty. Governmental and non-governmental issuers defaulted on, or were forced to restructure, their debts. These market conditions may continue, worsen or spread.
The U.S. government and the Federal Reserve, as well as certain foreign governments and central banks have taken steps to support financial markets, including keeping interest rates at historically low levels. This and other government intervention may not work as intended, particularly if the efforts are perceived by investors as being unlikely to achieve the desired results. The Federal Reserve recently has reduced its market support activities. Further reduction or withdrawal of Federal Reserve or other U.S. or non-U.S. governmental or central bank support, including interest rate increases, could negatively affect financial markets generally, increase market volatility and reduce the value and liquidity of securities in which the fund invests.
Policy and legislative changes in the United States and in other countries are affecting many aspects of financial regulation, and may in some instances contribute to decreased liquidity and increased volatility in the financial markets. The impact of these changes on the markets, and the practical implications for market participants, may not be fully known for some time.
Economies and financial markets throughout the world are becoming increasingly interconnected. As a result, whether or not the fund invests in securities of issuers located in or with significant exposure to countries experiencing economic and financial difficulties, the value and liquidity of the fund’s investments may be negatively affected.
Model and Data – If quantitative models, algorithms or calculations (whether proprietary and developed by the sub-adviser or supplied by third parties) (“Models”) or information or data supplied by third parties (“Data”) prove to be incorrect or incomplete, any decisions made, in whole or part, in reliance thereon expose the fund to additional risks. Models can be predictive in nature. The use of predictive Models has inherent risks. The success of relying on or otherwise using Models depends on a number of factors, including the validity, accuracy and completeness of the Model’s development, implementation and maintenance, the Model’s assumptions, factors, algorithms and methodologies, and the accuracy and reliability of the supplied historical or other Data. Models rely on, among other things, correct and complete Data inputs. If incorrect Data is entered into even a well-founded Model, the resulting information will be incorrect. However, even if Data is input correctly, Model prices may differ substantially from market prices, especially for securities with complex characteristics. Investments selected with the use of Models may perform differently than expected as a result of the design of the Model, inputs into the Model or other factors. There can be no assurance that the use of Models will result in effective investment decisions for the fund.
Small Capitalization Companies – The fund will be exposed to additional risks as a result of its investments in the securities of small capitalization companies. Small capitalization companies may be more at risk than larger
- 145 -
capitalization companies because, among other things, they may have limited product lines, operating history, market or financial resources, or because they may depend on limited management groups. The prices of securities of small capitalization companies generally are more volatile than those of larger capitalization companies and are more likely to be adversely affected than larger capitalization companies by changes in earnings results and investor expectations or poor economic or market conditions. Securities of small capitalization companies may underperform larger capitalization companies, may be harder to sell at times and at prices the portfolio managers believe appropriate and may offer greater potential for losses.
Valuation – The sales price the fund could receive for any particular portfolio investment may differ from the fund’s valuation of the investment, particularly for securities that trade in thin or volatile markets, that are priced based upon valuations provided by third-party pricing services that use matrix or evaluated pricing systems, or that are valued using a fair value methodology. The fund’s ability to value its investments may be impacted by technological issues and/or errors by pricing services or other third party service providers.
Value Investing – The prices of securities the sub-adviser believes are undervalued may not appreciate as anticipated or may go down. Value stocks as a group may be out of favor and underperform the overall equity market for a long period of time, for example, while the market favors “growth” stocks.
The Funds’ Past Performance
Set forth below is performance information for each Fund. The bar charts and tables below provide some indication of the risks of investing in each Fund by showing you how the performance of the Target Funds and Class A shares of the Destination Fund has varied from year to year for 10 years or since inception, as applicable, and how the average total returns of each Target Fund and the applicable class of shares of the Destination Fund for different periods compare to the returns of one or more broad measures of market performance. The performance shown below for Transamerica Partners Small Value Portfolio reflects only master portfolio level expenses, and does not include the expenses of any of the applicable Non-Mutual Fund Feeder Funds. If those expenses were reflected, the performance would be lower. Absent any applicable limitation of or cap on the Funds’ expenses, performance would have been lower. No performance information is presented for the Class R, Class R4 and Class I3 shares of the Destination Fund because those share classes are newly offered. Class R, Class R4 and Class I3 shares of the Destination Fund would have different performance because they have different expenses. A Fund’s past performance (before and after taxes) is not necessarily an indication of how the Fund will perform in the future. Following the Reorganizations, Transamerica Partners Institutional Small Value will be the surviving fund for performance purposes.
Prior to February 27, 2009, the Target Funds had a different sub-adviser. The performance set forth below for the Target Funds for the period prior to that date is partly attributable to a previous sub-adviser.
Prior to July 9, 2010, a different sub-adviser managed the Target Funds and the Target Funds used different investment strategies. The performance set forth below for the Target Funds for the period between February 27, 2009 and July 8, 2010 is attributable to a previous sub-adviser.
Prior to September 28, 2015, the Target Funds had a different sub-adviser, a different investment objective and used different investment strategies. The performance set forth below for the Target Funds for the period between July 9, 2010 and September 27, 2015 is attributable to a previous sub-adviser.
- 146 -
Transamerica Partners Small Value Annual Returns
Annual Total Returns (calendar years ended December 31)
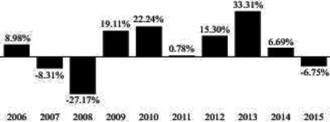
| | | | | | |
| | | Quarter Ended | | Return | |
Best Quarter: | | 12/31/2011 | | | 17.63 | % |
Worst Quarter: | | 12/31/2008 | | | -22.55 | % |
Year-to-date return as of September 30, 2016: 6.21%
Transamerica Partners Small Value Average Annual Total Returns
Average Annual Total Returns (periods ended December 31, 2015)
| | | | | | | | | | | | | | | | |
| | | 1 Year | | | 5 Years | | | 10 Years | | | Inception Date | |
Transamerica Partners Small Value | | | -6.75 | % | | | 9.04 | % | | | 5.03 | % | | | 07/10/2002 | |
Russell 2000® Value Total Return Index (reflects no deduction for fees, expenses or taxes) | | | -7.47 | % | | | 7.67 | % | | | 5.57 | % | | | | |
Transamerica Partners Institutional Small Value Annual Returns
Annual Total Returns (calendar years ended December 31)
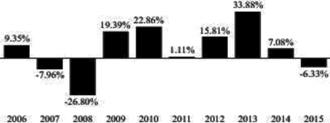
| | | | | | |
| | | Quarter Ended | | Return | |
Best Quarter: | | 12/31/2011 | | | 17.69 | % |
Worst Quarter: | | 12/31/2008 | | | -22.43 | % |
Year-to-date return as of September 30, 2016: 6.51%
Transamerica Partners Institutional Small Value Average Annual Total Returns
Average Annual Total Returns (periods ended December 31, 2015)
| | | | | | | | | | | | | | | | |
| | | 1 Year | | | 5 Years | | | 10 Years | | | Inception Date | |
Transamerica Partners Institutional Small Value | | | -6.33 | % | | | 9.47 | % | | | 5.45 | % | | | 01/23/2003 | |
Russell 2000® Value Total Return Index (reflects no deduction for fees, expenses or taxes) | | | -7.47 | % | | | 7.67 | % | | | 5.57 | % | | | | |
- 147 -
Transamerica Partners Small Value Portfolio Annual Returns
Annual Total Returns (calendar years ended December 31)
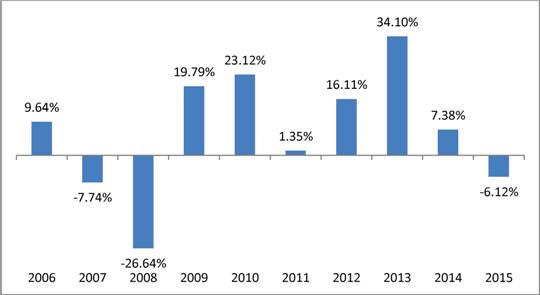
The highest and lowest quarterly returns for the periods reflected in the table above are:
| | | | | | |
| | | Quarter Ended | | Return | |
Best Quarter: | | 12/31/2011 | | | 17.76 | % |
Worst Quarter: | | 12/31/2008 | | | -22.41 | % |
Year-to-date return as of September 30, 2016: 12.35%
Transamerica Partners Small Value Portfolio Average Annual Total Returns (for periods ended 12/31/2015)
| | | | | | | | | | | | | | | | |
| | | 1 Year | | | 5 Years | | | 10 Years | | | Inception Date | |
Transamerica Partners Small Value Portfolio | | | -6.12 | % | | | 9.73 | % | | | 5.70 | % | | | 06/01/2002 | |
Russell 2000® Value Total Return Index (reflects no deduction for fees, expenses or taxes) | | | -7.47 | % | | | 7.67 | % | | | 5.57 | % | | | | |
Transamerica Small Cap Value Annual Returns
Annual Total Returns (calendar years ended December 31) - Class A
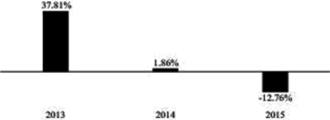
- 148 -
| | | | | | |
| | | Quarter Ended | | Return | |
Best Quarter: | | 03/31/2013 | | | 12.40 | % |
Worst Quarter: | | 09/30/2015 | | | -12.60 | % |
Year-to-date return as of September 30, 2016: 5.91%
Transamerica Small Cap Value Average Annual Total Returns
Average Annual Total Returns (periods ended December 31, 2015)
| | | | | | | | | | | | |
| | | 1 Year | | | Since
Inception | | | Inception Date | |
Class A | | | | | | | | | | | 04/30/2012 | |
Return before taxes | | | -17.59 | % | | | 4.48 | % | | | | |
Return after taxes on distributions | | | -19.40 | % | | | 2.63 | % | | | | |
Return after taxes on distributions and sale of fund shares | | | -8.45 | % | | | 3.49 | % | | | | |
Russell 2000® Value Total Return Index (reflects no deduction for fees, expenses or taxes) | | | -7.47 | % | | | 9.10 | % | | | | |
The after-tax returns are calculated using the historic highest individual federal marginal income tax rates and do not reflect the impact of state and local taxes. Actual after-tax returns may depend on the investor’s individual tax situation and may differ from those shown. After-tax returns may not be relevant if the investment is made through a tax-exempt or tax-deferred account, such as a 401(k) plan.
The Funds’ Fees and Expenses
Shareholders of the Target Funds and the Destination Fund pay various fees and expenses, either directly or indirectly. The tables below show the fees and expenses that you would pay if you were to buy and hold shares of each Fund. The fees and expenses in the tables appearing below are based on the expenses of the Funds for the twelve-month period ended June 30, 2016. The tables also show the pro forma expenses of the combined Destination Fund after giving effect to all Group 9 Reorganizations based on pro forma net assets as of June 30, 2016. Pro forma numbers are estimated in good faith and are hypothetical. Actual expenses may vary significantly. The fees and expenses shown in the table and Example below for Transamerica Partners Small Value Portfolio reflect only master portfolio level fees and expenses, and do not include the fees and expenses of any of the applicable Non-Mutual Fund Feeder Funds. For financial statement purposes, Transamerica Partners Institutional Small Value will be the accounting survivor of the Reorganizations. As the accounting survivor, Transamerica Partners Institutional Small Value’s operating history will be used for financial reporting purposes.
Transamerica Partners Small Value
| | | | | | | | | | | | |
| | | Transamerica
Partners Small
Value1 | | | Transamerica
Small Cap
Value | | | Combined
Transamerica
Small Cap
Value
(Pro Forma) | |
| | | | | | Class R | | | Class R | |
Shareholder Fees (fees paid directly from your investment) | | | | | | | | | | | | |
Maximum sales charge (load) imposed on purchases (as a % of offering price) | | | None | | | | None | | | | None | |
Maximum deferred sales charge (load) (as a % of offering price) | | | None | | | | None | | | | None | |
Redemption fee (as a % of amount redeemed) | | | None | | | | None | | | | None | |
Annual Fund Operating Expenses (expenses that you pay each year as a % of the value of your investment) | | | | | | | | | | | | |
Management fees2 | | | 0.82 | % | | | 0.83 | % | | | 0.83 | % |
Distribution and service (12b-1) fees | | | 0.25 | % | | | 0.50 | % | | | 0.50 | % |
Other expenses3 | | | 0.56 | % | | | 0.06 | %4 | | | 0.06 | %4 |
Acquired Fund Fees and expenses | | | 0.03 | % | | | 0.00 | % | | | 0.00 | % |
Total annual fund operating expenses | | | 1.66 | % | | | 1.39 | % | | | 1.39 | % |
Fee waiver and/or expense reimbursement | | | 0.13 | %5 | | | 0.00 | %6 | | | 0.00 | %6 |
Total annual fund operating expenses after fee waiver and/or expense reimbursement | | | 1.53 | % | | | 1.39 | % | | | 1.39 | % |
- 149 -
Transamerica Partners Institutional Small Value
| | | | | | | | | | | | |
| | | Transamerica
Partners
Institutional
Small Value1 | | | Transamerica
Small Cap
Value | | | Combined
Transamerica
Small Cap
Value
(Pro Forma) | |
| | | | | | Class R4 | | | Class R4 | |
Shareholder Fees (fees paid directly from your investment) | | | | | | | | | | | | |
Maximum sales charge (load) imposed on purchases (as a % of offering price) | | | None | | | | None | | | | None | |
Maximum deferred sales charge (load) (as a % of offering price) | | | None | | | | None | | | | None | |
Redemption fee (as a % of amount redeemed) | | | None | | | | None | | | | None | |
| | | |
Annual Fund Operating Expenses (expenses that you pay each year as a % of the value of your investment) | | | | | | | | | | | | |
Management fees2 | | | 0.82 | % | | | 0.83 | % | | | 0.83 | % |
Distribution and service (12b-1) fees | | | 0.25 | % | | | 0.25 | % | | | 0.25 | % |
Other expenses3 | | | 0.82 | % | | | 0.06 | %4 | | | 0.06 | %4 |
Acquired fund fees and expenses | | | 0.03 | % | | | 0.00 | % | | | 0.00 | % |
Total annual fund operating expenses | | | 1.92 | % | | | 1.14 | % | | | 1.14 | % |
Fee waiver and/or expense reimbursement | | | 0.79 | %7 | | | 0.04 | %6 | | | 0.04 | %6 |
Total annual fund operating expenses after fee waiver and/or expense reimbursement | | | 1.13 | % | | | 1.10 | % | | | 1.10 | % |
Transamerica Partners Small Value Portfolio
| | | | | | | | | | | | |
| | | Transamerica
Partners Small
Value Portfolio | | | Transamerica
Small Cap
Value | | | Combined
Transamerica
Small Cap
Value
(Pro Forma) | |
| | | | | | Class I3 | | | Class I3 | |
Shareholder Fees (fees paid directly from your investment) | | | | | | | | | | | | |
Maximum sales charge (load) imposed on purchases (as a % of offering price) | | | None | | | | None | | | | None | |
Maximum deferred sales charge (load) (as a % of offering price) | | | None | | | | None | | | | None | |
Redemption fee (as a % of amount redeemed) | | | None | | | | None | | | | None | |
| | | |
Annual Fund Operating Expenses (expenses that you pay each year as a % of the value of your investment) | | | | | | | | | | | | |
Management fees2 | | | 0.82 | % | | | 0.83 | % | | | 0.83 | % |
Distribution and service (12b-1) fees | | | None | | | | None | | | | None | |
Other expenses3 | | | 0.08 | % | | | 0.06 | %4 | | | 0.06 | %4 |
Total annual fund operating expenses | | | 0.90 | % | | | 0.89 | % | | | 0.89 | % |
Fee waiver and/or expense reimbursement | | | N/A | | | | 0.04 | %6 | | | 0.04 | %6 |
Total annual fund operating expenses after fee waiver and/or expense reimbursement | | | 0.90 | % | | | 0.85 | % | | | 0.85 | % |
| 1 | The Target Feeder Fund invests in securities through an underlying Target Master Portfolio, Transamerica Partners Small Value Portfolio. The information in this table and in the Example below concerning the Target Feeder Fund reflects the direct fees and expenses of the Target Feeder Fund and its allocated share of the fees and expenses of the Target Master Portfolio. |
- 150 -
| 2 | The Destination Fund receives investment advisory and administrative services under one agreement with the Destination Fund’s investment manager, Transamerica Asset Management, Inc. (“TAM”), and pays a single management fee to TAM. Transamerica Partners Small Value and Transamerica Partners Institutional Small Value receive investment advisory and administrative services from TAM under separate agreements and pay separate advisory fees and administrative services fees to TAM. The administrative services fees of 0.30% for Transamerica Partners Small Value and 0.05% for Transamerica Partners Institutional Small Value are included in “Other expenses.” Transamerica Partners Small Value Portfolio receives investment advisory services from TAM and pays advisory fees to TAM. Transamerica Partners Small Value Portfolio pays no separate administrative services fees. |
| 3 | Other expenses do not include the costs of the Reorganization to be borne by the Target Funds and the Destination Fund. These costs are considered extraordinary expenses and are not covered by the applicable expense limitation arrangements. The basis point impact of such costs is 0.00% for Transamerica Partners Small Value, 0.01% for Transamerica Partners Institutional Small Value, 0.11% for Transamerica Partners Small Value Portfolio and 0.00% for Transamerica Small Cap Value. |
| 4 | Other expenses are based on estimates for the current fiscal year. Actual expenses may differ from estimates. |
| 5 | Contractual arrangements have been made with TAM through May 1, 2017 to waive fees and/or reimburse fund expenses to the extent that the fund’s total operating expenses exceed 1.50%, excluding, as applicable, acquired fund fees and expenses, interest, taxes, brokerage commissions, dividend and interest expenses on securities sold short, extraordinary expenses and other expenses not incurred in the ordinary course of the fund’s business. |
| 6 | Contractual arrangements have been made with TAM through May 1, 2018 to waive fees and/or reimburse fund expenses to the extent that the fund’s total operating expenses exceed 1.50% for Class R shares, 1.10% for Class R4 shares and 0.85% for Class I3 shares, excluding, as applicable, acquired fund fees and expenses, interest, taxes, brokerage commissions, dividend and interest expenses on securities sold short, extraordinary expenses and other expenses not incurred in the ordinary course of the fund’s business. These arrangements cannot be terminated prior to May 1, 2018 without the Board of Trustees’ consent. TAM is entitled to reimbursement by the fund of fees waived or expenses reduced during any of the previous 36 months if on any day or month the estimated annualized fund operating expenses are less than the cap. |
| 7 | Contractual arrangements have been made with TAM through May 1, 2017 to waive fees and/or reimburse fund expenses to the extent that the fund’s total operating expenses exceed 1.10%, excluding, as applicable, acquired fund fees and expenses, interest, taxes, brokerage commissions, dividend and interest expenses on securities sold short, extraordinary expenses and other expenses not incurred in the ordinary course of the fund’s business. |
The hypothetical examples below help you compare the cost of investing in each Fund. Each example assumes that:
| | • | | you invest $10,000 in each Fund; |
| | • | | you reinvest all dividends and distributions without a sales charge; |
| | • | | your investment has a 5% annual return (this assumption is required by the SEC and is not a prediction of the Fund’s future performance); and |
| | • | | each Fund’s operating expenses remain the same. |
Each example also assumes no fees for IRA accounts, if applicable. Costs are the same whether you redeem at the end of any period or not. Pro forma expenses are included assuming the consummation of all Group 1 Reorganizations. The examples are for comparison purposes only and do not represent the Funds’ actual expenses or returns, either past or future. Because actual return and expenses will be different, the examples are for comparison only.
- 151 -
Transamerica Partners Small Value
| | | | | | | | | | | | |
Number of years
you own your shares | | Transamerica
Partners Small
Value | | | Transamerica
Small Cap Value | | | Combined
Transamerica
Small Cap Value
(Pro Forma) | |
| | | | | | Class R | | | Class R | |
Year 1 | | $ | 156 | | | $ | 142 | | | $ | 142 | |
Year 3 | | $ | 511 | | | $ | 440 | | | $ | 440 | |
Year 5 | | $ | 890 | | | $ | 761 | | | $ | 761 | |
Year 10 | | $ | 1,954 | | | $ | 1,669 | | | $ | 1,669 | |
Transamerica Partners Institutional Small Value
| | | | | | | | | | | | |
Number of years
you own your shares | | Transamerica
Partners
Institutional
Small Value | | | Transamerica
Small Cap Value | | | Combined
Transamerica
Small Cap Value
(Pro Forma) | |
| | | | | | Class R4 | | | Class R4 | |
Year 1 | | $ | 115 | | | $ | 112 | | | $ | 112 | |
Year 3 | | $ | 526 | | | $ | 358 | | | $ | 358 | |
Year 5 | | $ | 963 | | | $ | 624 | | | $ | 624 | |
Year 10 | | $ | 2,179 | | | $ | 1,383 | | | $ | 1,383 | |
Transamerica Partners Small Value Portfolio
| | | | | | | | | | | | |
Number of years
you own your shares | | Transamerica
Partners Small
Value Portfolio | | | Transamerica
Small Cap Value | | | Combined
Transamerica
Small Cap Value
(Pro Forma) | |
| | | | | | Class I3 | | | Class I3 | |
Year 1 | | $ | 92 | | | $ | 87 | | | $ | 87 | |
Year 3 | | $ | 287 | | | $ | 280 | | | $ | 280 | |
Year 5 | | $ | 498 | | | $ | 489 | | | $ | 489 | |
Year 10 | | $ | 1,108 | | | $ | 1,092 | | | $ | 1,092 | |
CAPITALIZATION
The following tables set forth the capitalization of each Target Fund and the Destination Fund as of September 30, 2016 and the pro forma combined capitalization of the combined Destination Fund as if the Reorganizations had occurred on that date. If the Reorganizations are consummated, the actual exchange ratios on the closing date may vary from the exchange ratios used in the computation below. This is due to changes in the market value of the portfolio securities of the Funds between September 30, 2016 and the closing date, changes in the amount of undistributed net investment income and net realized capital gains of the Funds during that period resulting from income and distributions, and changes in the accrued liabilities of the Funds during the same period.
- 152 -
Transamerica Partners Small Value Funds
| | | | | | | | | | | | |
| | | Transamerica
Partners Small
Value | | | Transamerica
Partners
Institutional Small
Value | | | Transamerica
Partners Small
Value Portfolio | |
Net Assets | | $ | 34,337,703 | | | $ | 6,727,452 | | | $ | 24,210,479 | |
| | | |
Net Asset Value Per Share | | $ | 15.97 | | | $ | 21.75 | | | $ | 10.10 | |
| | | |
Shares Outstanding | | | 2,150,609 | | | | 309,373 | | | | 2,397,077 | |
Transamerica Small Cap Value
| | | | | | | | |
| | | Transamerica
Small Cap Value | | | Transamerica Small
Cap Value
Pro Forma | |
Net Assets | | | | | | | | |
Class A | | $ | 1,812,137 | | | $ | 1,812,137 | |
Class C | | $ | 756,521 | | | $ | 756,521 | |
Class I | | $ | 396,076 | | | $ | 396,076 | |
Class I2 | | $ | 260,736,966 | | | $ | 260,736,966 | |
Advisor Class | | | — | | | | — | |
Class R6 | | $ | 50,715 | | | $ | 50,715 | |
Class R | | | — | | | $ | 34,337,703 | |
Class R4 | | | — | | | $ | 6,727,452 | |
Class I3 | | | — | | | $ | 24,084,532 | |
Net Asset Value Per Share | | | | | | | | |
Class A | | $ | 10.03 | | | $ | 10.03 | |
Class C | | $ | 9.97 | | | $ | 9.97 | |
Class I | | $ | 10.09 | | | $ | 10.09 | |
Class I2 | | $ | 10.10 | | | $ | 10.10 | |
Advisor Class | | | — | | | | — | |
Class R6 | | $ | 10.10 | | | $ | 10.10 | |
Class R | | $ | 10.10 | | | $ | 10.10 | |
Class R4 | | $ | 10.10 | | | $ | 10.10 | |
Class I3 | | $ | 10.10 | | | $ | 10.05 | |
Shares Outstanding | | | | | | | | |
Class A | | | 180,666 | | | | 180,666 | |
Class C | | | 75,915 | | | | 75,915 | |
Class I | | | 39,259 | | | | 39,259 | |
Class I2 | | | 25,807,512 | | | | 25,807,512 | |
Advisor Class | | | — | | | | — | |
Class R6 | | | 5,020 | | | | 5,020 | |
Class R | | | — | | | | 3,399,773 | |
Class R4 | | | — | | | | 666,084 | |
Class I3 | | | — | | | | 2,397,077 | |
- 153 -
It is impossible to predict with any certainty how many shares of the Destination Fund will actually be received and distributed by a Target Fund on the closing date. The foregoing table should not be relied upon to determine the amount of Destination Fund shares that will actually be received and distributed.
ADDITIONAL INFORMATION
For information relating to each Fund and its Reorganization, including tax capital loss carryforwards, the tax status of the Reorganization, a comparison of the fundamental investment policies of the Funds, how to buy, sell or exchange Fund shares, how each Fund values its securities, financial highlights information for each Fund and ownership of shares of the Funds, please see the sections immediately following this discussion of the Group 9 Reorganizations.
TARGET FUND BOARD’S EVALUATION AND RECOMMENDATION
With respect to each Target Fund, the Board of the Target Fund, including its Independent Trustees, after careful consideration, unanimously determined that the Reorganization is in the best interest of the Target Fund and will not dilute the interests of the existing holders of the Target Fund. Each Board made this determination based on various factors, which include those that are discussed in the section entitled “Reasons for the Proposed Reorganizations” in the back of this Proxy Statement/Prospectus following the discussion of the proposals.
Similarly, the Board of the Destination Fund, including all its Independent Trustees, has approved the Reorganization with respect to the Destination Fund. The Board has determined that the Reorganization is in the best interest of the Destination Fund and that the interests of the Destination Fund’s holders will not be diluted as a result of the Reorganization.
THE BOARD OF YOUR TARGET FUND RECOMMENDS THAT YOU VOTE “FOR” PROPOSAL 9A, 9B OR 9C, AS APPLICABLE, TO APPROVE THE PLAN.
- 154 -
REASONS FOR THE PROPOSED REORGANIZATIONS
At a meeting held on July 13-14, 2016, the Board of each Target Fund, including the Independent Trustees, unanimously voted to approve the proposed Reorganization of the Target Fund. In approving the Reorganization, the Board and the Independent Trustees determined that the Reorganization is in the best interests of the Target Fund and the interests of the existing holders of the Target Fund will not be diluted as result of the Reorganization. The Board, including the Independent Trustees, also considered and approved the terms and conditions of the Plan for the Reorganization.
The initiative to reorganize the Transamerica Partners funds into Transamerica Funds was discussed by the Board and the Independent Trustees on a number of occasions prior to the July 13-14, 2016 meeting. TAM provided an overview of the initiative to the Board at a meeting held on March 9-10, 2016, and the Board of each Destination Fund approved at that joint meeting the establishment and registration of the additional classes of shares of the Destination Fund to be issued in the Reorganization. The initiative was further discussed by TAM and the Board at June 8-9, 2016 meeting. The Independent Trustees met telephonically on July 7, 2016 and in-person on July 12, 2016 to discuss the proposed Reorganizations. The Independent Trustees were assisted in their consideration of the proposed Reorganizations by their independent legal counsel.
The Trustees considered the following matters, among others things, in approving the Reorganizations:
| | • | | The proposed Reorganizations are part of an initiative designed to streamline the Transamerica fund family and to promote operating efficiencies. |
| | • | | The Target Funds are part of the Transamerica Partners funds. The Transamerica Partners funds, which were initially established primarily for retirement and benefit plan investors, have been experiencing net outflows for a number of years, and that these outflows have resulted in certain diseconomies, including fixed costs representing an increasing percentage of a smaller asset base and the funds losing the benefit of previously attained fee breakpoints. |
| | • | | The Transamerica Partners funds appear to have limited distribution opportunities and prospects for future asset growth. |
| | • | | The current contractual expense limitations on the Target Feeder Funds expire on May 1, 2017, and TAM does not expect to maintain the expense limitations for many of the Institutional Target Feeder Funds at their current levels beyond that time should the Reorganizations not occur. |
| | • | | The Destination Funds are part of a separate group of mutual funds managed by TAM, branded Transamerica Funds. Transamerica Funds is a larger fund complex which is growing in size. |
| | • | | Transamerica Funds offers increased distribution capabilities and greater potential for asset growth and efficiencies, including the potential for lower expense ratios. The Reorganizations would eliminate certain redundancies in product offerings and are expected to strengthen TAM’s ability to pursue investment and marketing opportunities. |
| | • | | Each Target Fund would reorganize into an existing Destination Fund in Transamerica Funds. The larger asset base resulting from the Reorganizations is expected to give each combined Destination Fund the ability to better diversify its holdings and effect larger portfolio transactions while also spreading fixed costs across a larger asset base. |
| | • | | Each Target Fund would receive new Class R, Class R4 or Class I3 shares of the corresponding Destination Fund, as applicable, in the Reorganization. |
- 155 -
| | • | | Each Target Fund would in most instances reorganize into a Destination Fund with the same or substantially similar investment objective and strategies. The exception would be the Transamerica Partners Mid Value funds, which would experience a difference in sub-advisers and principal investment strategies. The Transamerica Partners Mid Value Portfolio, a Target Master Portfolio, is sub-advised by Thompson, Siegel and Walmsley LLC (“TS&W”) and J.P. Morgan Investment Management Inc. Transamerica Mid Cap Value Opportunities, the corresponding Destination Fund, is sub-advised only by TS&W. The principal investment objective and strategies for the Transamerica Partners Mid Value funds and their corresponding Destination Fund differ, although each of the funds invest, under normal circumstances, at least 80% of their net assets in equity securities of mid cap companies. |
| | • | | With the exception of the Transamerica Partners Mid Value funds, each Target Feeder Fund and its related Target Master Portfolio would reorganize into a Destination Fund with the same sub-adviser(s) as the applicable Target Master Portfolio. |
| | • | | The performance track records of the Target and Destination funds and the expected accounting and performance survivor of each Reorganization grouping. |
| | • | | While the fees of the Target Funds and Destination Funds differ in structure and amount, based on information as of March 31, 2016, it is expected that the total expenses for the Target Funds would in most cases be lower or stay the same following the Reorganizations. Certain Target Master Portfolios (Transamerica Partners High Yield Bond Portfolio, Transamerica Partners Core Bond Portfolio, Transamerica Partners Mid Value Portfolio, Transamerica Partners Money Market Portfolio and Transamerica Partners Small Core Portfolio) are expected to experience an increase in their expense ratios following the applicable Reorganization, but that increase is not expected to exceed 2.5 basis points, which would bring the relevant Target Master Portfolio up to its current voluntary expense cap. |
| | • | | The management fee of each Destination Fund as compared to the advisory fee of the applicable Target Fund. TAM serves as each Fund’s investment manager. TAM performs administration as well as investment advisory services for the Destination Funds under a single management agreement for a single management fee. For the Target Feeder Funds, TAM provides investment advisory services under an investment advisory agreement and administration services under an administrative services agreement, and each Target Feeder Fund pays separate advisory and administration fees. The Target Master Portfolios do not pay separate administration fees. |
| | • | | The Investor Target Feeder Funds currently pay a 0.25% Rule 12b-1 fee and a 0.30% administration fee which covers, among other things, retirement plan recordkeeping and transfer agency activity. Holders of these Investor Target Feeder Funds would receive Class R shares of the applicable Destination Funds in the Reorganization which would pay a 0.50% Rule 12b-1 fee and a transfer agency fee of $21.00 per open account, and retirement plan recordkeeping services would be paid for under the Rule 12b-1 plan. |
| | • | | The expected tax-free nature of each Reorganization involving a Target Feeder Fund for U.S. federal income tax purposes, and particularly the expectation that shareholders of the merging Target Feeder Funds would not realize any income, gain or loss in connection with the Reorganizations. The Reorganization of each Target Master Portfolio is expected to be a taxable transaction for U.S. federal income tax purposes. The only holders of each Target Master Portfolio at the time of the Reorganization will be the applicable Non-Mutual Fund Feeder Funds, and TAM understands that there are few (if any) tax sensitive investors in the Non-Mutual Fund Feeder Funds. |
| | • | | Each Target Fund and corresponding Destination Fund use the same pricing and valuation procedures and same pricing vendors. |
| | • | | The terms and conditions of the Plan for each Reorganization. |
| | • | | Certain benefits that TAM and its affiliates would receive from the Reorganizations, including a more unified fund family and the administrative conveniences of fewer funds and trusts to oversee and maintain. |
- 156 -
| | • | | The costs of the Reorganizations would be shared equally by TAM, on the one hand, and by the funds participating in the various reorganizations as part of the initiative, on the other hand, in accordance with a cost sharing methodology that takes into account, among other factors, the expected benefits of the Reorganization to each Target Fund. |
In their deliberations, the Trustees did not identify any particular information that was all-important or controlling, and the Trustees attributed different weights to the various factors. The Trustees evaluated all information available to them on a Target Fund-by-Target Fund basis, and their determinations were made separately in respect of each Target Fund.
QUORUM, VOTE REQUIRED AND MANNER OF VOTING PROXIES
Quorum
A quorum of holders of a Target Fund is required to take action at that Target Fund’s Special Meeting. For the purposes of taking action on a proposal, holders entitled to vote and present in person or by proxy representing at least thirty percent (30%) of the voting power of the Target Fund shall constitute a quorum at the Special Meeting.
Only proxies that are voted, abstentions and “broker non-votes” will be counted toward establishing a quorum. “Broker non-votes” are shares held by a broker or nominee as to which proxies have been returned but (a) instructions have not been received from the beneficial owners or persons entitled to vote and (b) the broker or nominee does not have discretionary voting power on a particular matter.
In the absence of a quorum, or if a quorum is present but sufficient votes to approve a proposal are not received, a Special Meeting may be adjourned by the affirmative vote of a majority of the voting power of the shares present in person or represented by proxy at the Special Meeting. The persons named as proxies may, at their discretion, vote those proxies in favor of an adjournment of a Special Meeting.
Vote Required
With respect to each Target Fund, approval of the applicable Reorganization proposal requires, if a quorum is present at the Special Meeting, the vote of “a majority of the outstanding voting securities” of that Target Fund within the meaning of the 1940 Act, which is defined as the affirmative vote of the lesser of (a) 67% or more of the voting power of the voting securities present at the Special Meeting, if the holders of more than 50% of the outstanding voting securities of the Target Fund are present at the meeting or represented by proxy, or (b) more than 50% of the voting power of the outstanding voting securities of the Target Fund.
Manner of Voting
When a Target Feeder Fund holder votes with respect to a Reorganization proposal, that vote will also constitute instructions for the Target Feeder Fund to vote in the same manner on the corresponding Reorganization proposal for the Target Master Portfolio in which the Target Feeder Fund invests.
Interests in each Target Master Portfolio are held by the applicable Target Feeder Funds and the Non-Mutual Feeder Funds. In each proposed Reorganization of a Target Master Portfolio, each Target Feeder Fund will vote its interests in the Target Master Portfolio in which it invests in accordance with the voting instructions received from its holders as discussed above and will vote interests in the Target Master Portfolio with respect to which it has not received voting instructions in the same proportion as the interests for which it has received instructions from other holders (this is called “proportional voting” or “echo voting”). Because each Target Feeder Fund will use proportional voting to vote its interests in its corresponding Target Master Portfolio, a small number of holders could determine how the Target Feeder Fund votes if other holders fail to vote. Please note that, as the Target Master Portfolios have holders besides the Target Feeder Funds, it is possible that the Reorganization of a Target Master Portfolio may not be approved by the Target Master Portfolio, even if it is approved by the requisite Target Feeder Fund holders. It is also possible that the Reorganization of a Target Master Portfolio may be approved by the Target Master Portfolio, even if it is not approved by Target Feeder Fund holders.
- 157 -
For many of the Target Master Portfolios, the Target Feeder Funds represent a significant portion of the Target Master Portfolio’s assets. As a result, in voting on the proposed Reorganization of a Target Master Portfolio, the Non-Mutual Fund Feeder Funds may be outvoted by the Target Feeder Funds. As of June 30, 2016, the applicable Target Feeder Funds represented the portion of the related Target Master Portfolios as indicated in the table below:
| | | | |
Target Feeder Fund | | Percentage of the Relevant
Target Master Portfolio’s
Net Assets | |
Transamerica Partners Core Bond | | | 30.44 | % |
Transamerica Partners Institutional Core Bond | | | 29.86 | % |
| |
Transamerica Partners Government Money Market | | | 61.95 | % |
Transamerica Partners Institutional Government Money Market | | | 25.56 | % |
| |
Transamerica Partners High Yield Bond | | | 14.78 | % |
Transamerica Partners Institutional High Yield Bond | | | 42.46 | % |
| |
Transamerica Partners International Equity | | | 30.48 | % |
Transamerica Partners Institutional International Equity | | | 11.21 | % |
| |
Transamerica Partners Mid Growth | | | 49.91 | % |
Transamerica Partners Institutional Mid Growth | | | 16.17 | % |
| |
Transamerica Partners Mid Value | | | 15.29 | % |
Transamerica Partners Institutional Mid Value | | | 51.49 | % |
| |
Transamerica Partners Small Core | | | 27.48 | % |
Transamerica Partners Institutional Small Core | | | 5.39 | % |
| |
Transamerica Partners Small Growth | | | 58.05 | % |
Transamerica Partners Institutional Small Growth | | | 16.09 | % |
| |
Transamerica Partners Small Value | | | 53.13 | % |
Transamerica Partners Institutional Small Value | | | 10.11 | % |
In the case of interests in the Target Master Portfolio held by Non-Mutual Feeder Funds which are separate accounts established by Transamerica insurance companies to fund variable annuity contracts or variable life insurance policies, ownership of the interests is legally vested in the separate accounts. It is the Funds’ understanding that the Transamerica insurance companies will seek voting instructions from the account holders for Target Master Portfolio interests held by separate accounts registered under the 1940 Act and will vote in accordance with such instructions. A signed proxy card or other authorization by a holder that does not specify how the holder’s interests should be voted may be deemed an instruction to vote in favor of the applicable proposal. For separate accounts that are registered under the 1940 Act, the Transamerica insurance companies will use proportional voting to vote interests for which no timely instructions are received from holders. The Transamerica insurance companies do not require that a specified number of holders submit voting instructions before they will vote the interests in the Target Master Portfolio held by their separate accounts at the Special Meeting. As a result, a small number of holders could determine how a Transamerica insurance company votes, if other holders fail to vote. Other Non-Mutual Fund Feeders may follow similar voting procedures.
A signed proxy card or other authorization by a holder that does not specify how the holder’s interests should be voted on a proposal may be deemed an instruction to vote such interests in favor of the applicable proposal.
Target Fund holders may continue to vote, and votes will be included in the tabulation, up until the date and time of the Special Meeting, [10:00 a.m.], Mountain Time, on February 10, 2017.
- 158 -
TAX STATUS OF EACH REORGANIZATION
Each Target Feeder Fund Reorganization is conditioned upon the receipt by the applicable Target Trust and the Destination Trust of an opinion from Morgan, Lewis & Bockius, LLP, counsel to the Funds, substantially to the effect that, for federal income tax purposes:
| | • | | The transfer of all of the applicable Target Fund’s assets to the corresponding Destination Fund in the Reorganization in exchange solely for the issuance of the applicable Destination Fund shares to the Target Fund and the assumption of all the Target Fund’s liabilities by the Destination Fund, followed by the distribution of those Destination Fund shares to the Target Fund’s shareholders in complete liquidation of the Target Fund, will constitute a “reorganization” within the meaning of Section 368(a) of the Code, and each of the Target Fund and the Destination Fund will be a “party to a reorganization” within the meaning of Section 368(b) of the Code; |
| | • | | No gain or loss will be recognized by the Destination Fund upon receipt of the assets of the Target Fund solely in exchange for the applicable shares of the Destination Fund and the assumption by the Destination Fund of all of the liabilities of the Target Fund as part of the Reorganization; |
| | • | | The tax basis in the hands of the Destination Fund of the assets of the Target Fund received in the Reorganization will be the same as the tax basis of such assets in the hands of the Target Fund immediately before the transfer of the assets, increased by the amount of gain (or decreased by the amount of loss), if any, recognized by the Target Fund upon the transfer; |
| | • | | The holding period of each asset of the Target Fund in the hands of the Destination Fund, other than assets with respect to which gain or loss is required to be recognized in the Reorganization, will include the period during which the asset was held by the Target Fund (except where investment activities of the Destination Fund have the effect of reducing or eliminating the holding period with respect to an asset); |
| | • | | No gain or loss will be recognized by the Target Fund upon the transfer of its assets to the Destination Fund in the Reorganization solely in exchange for the applicable shares of the Destination Fund and the assumption by the Destination Fund of all of the liabilities of the Target Fund, or upon the distribution of the applicable shares of the Destination Fund by the Target Fund to its shareholders in complete liquidation, except for (1) any gain or loss that may be recognized with respect to contracts subject to Section 1256 of the Code, (2) any gain that may be recognized on the transfer of stock in a “passive foreign investment company” as defined in Section 1297(a) of the Code, and (3) any other gain or loss that may be required to be recognized as a result of the closing of the Target Fund’s taxable year or upon transfer of an asset regardless of whether the transfer would otherwise be a non-recognition transaction under the Code; |
| | • | | No gain or loss will be recognized by the Target Fund shareholders upon the exchange of their Target Fund shares solely for the shares of the Destination Fund as part of the Reorganization; |
| | • | | The aggregate tax basis of the Destination Fund shares received by each shareholder of the Target Fund in the Reorganization will be the same as the aggregate tax basis of his or her shares of the Target Fund surrendered in exchange therefor; and |
| | • | | The holding period of each shareholder of the Target Fund for his or her Destination Fund shares received in the Reorganization will include the holding period of the shares of the Target Fund that were surrendered in exchange therefor, provided that the shareholder held the Target Fund shares as capital assets on the date of the exchange. |
In rendering such opinion, counsel shall rely upon, among other things, certain facts, assumptions and representations of the applicable Target Trust, on behalf of the applicable Target Fund, and of the Destination Trust, on behalf of the applicable Destination Fund.
No tax ruling has been or will be received from the IRS in connection with any of the Reorganizations. An opinion of counsel is not binding on the IRS or a court, and no assurance can be given that the IRS would not assert, or a court would not sustain, a contrary position.
- 159 -
Immediately prior to each Reorganization involving a Target Feeder Fund, the applicable Target Fund will declare and pay a dividend, which, together with all previous dividends, is intended to have the effect of distributing to its shareholders all of its investment company taxable income for taxable years ending on or prior to the Closing Date (computed without regard to any deduction for dividends paid), all of its net tax-exempt income and all of its net capital gain, if any, realized in taxable years ending on or prior to the Closing Date (after reduction for any available capital loss carryover). The amount of such distributions to the shareholders of each Target Feeder Fund is estimated as of March 31, 2017 to be as set forth in the table below. The amounts set forth in the table below are estimates of the applicable Target Feeder Fund’s investment company taxable income (computed without regard to any deduction for dividends paid), net tax-exempt income and net capital gain as if its taxable year ended on the Closing Date. Any amount actually distributed to a Target Feeder Fund’s shareholders immediately prior to the applicable Reorganization may be higher or lower than the amount set forth in the table below. Any such distribution by a Target Feeder Fund generally will be taxable to the Target Feeder Fund’s shareholders.
| | | | |
Fund | | Distribution amount
(per share) | |
Transamerica Partners Core Bond | | $ | 0.0621 | |
Transamerica Partners Institutional Core Bond | | $ | 0.0590 | |
Transamerica Partners Government Money Market | | $ | 0.0000 | |
Transamerica Partners Institutional Government Money Market | | $ | 0.0000 | |
Transamerica Partners High Yield Bond | | $ | 0.1213 | |
Transamerica Partners Institutional High Yield Bond | | $ | 0.1235 | |
Transamerica Partners International Equity | | $ | 0.0390 | |
Transamerica Partners Institutional International Equity | | $ | 0.0282 | |
Transamerica Partners Mid Growth | | $ | 0.0001 | |
Transamerica Partners Institutional Mid Growth | | $ | 0.0001 | |
Transamerica Partners Mid Value | | $ | 0.0535 | |
Transamerica Partners Institutional Mid Value | | $ | 0.0581 | |
Transamerica Partners Small Core | | $ | 0.0471 | |
Transamerica Partners Institutional Small Core | | $ | 0.0424 | |
Transamerica Partners Small Growth | | $ | 0.0001 | |
Transamerica Partners Institutional Small Growth | | $ | 0.0001 | |
Transamerica Partners Small Value | | $ | 0.0171 | |
Transamerica Partners Institutional Small Value | | $ | 0.0386 | |
Each Reorganization of a Target Master Portfolio may be a taxable transaction. The exchange of each Target Master Portfolio’s assets for (a) the applicable shares of the corresponding Destination Fund and (b) the Destination Fund’s assumption of the Target Master Portfolio’s liabilities is expected, in most cases, to be a taxable exchange for federal income tax purposes, in which the Target Master Portfolio will recognize gains and losses. In such a case, holders of beneficial interests in the applicable Target Master Portfolio will be required to take into account their allocable shares of the gains and losses recognized by the Target Master Portfolio. Holders of beneficial interests in a Target Master Portfolio may also recognize gain or loss in connection with the applicable Destination Fund’s assumption of the Target Master Portfolio’s liabilities or the distribution of the applicable Destination Fund’s shares in liquidation of the Target Master Portfolio. As noted above, the only holders of the Target Master Portfolios at the time of the Reorganization will be the applicable Non-Mutual Fund Feeder Funds.
Even if a Reorganization of a Target Master Portfolio is otherwise treated as a non-recognition transaction, the Target Master Portfolio may make a deemed-sale election that would generally result in the recognition of gain by the Target Master Portfolio. The Target Master Portfolio would generally allocate such gain to holders of beneficial interests in the Target Master Portfolio that are “C corporations” within the meaning of applicable Treasury Regulations, to partnerships in which such “C corporations” are direct or indirect partners, or to grantor trusts or other disregarded entities owned, directly or indirectly, by such “C corporations.”
The foregoing discussion is very general. The foregoing consequences may not apply to certain classes of taxpayers who are subject to special circumstances, such as shareholders who are not citizens or residents of the United States, insurance companies, tax-exempt organizations, financial institutions, dealers in securities or foreign currencies, or persons who hold their shares as part of a straddle or conversion transaction. Except as expressly set
- 160 -
forth above, this discussion does not address any state, local or foreign tax consequences of the Reorganizations. You should consult your tax adviser for the particular tax consequences to you of the transaction, including the applicability of any state, local or foreign tax laws.
OTHER IMPORTANT INFORMATION
CONCERNING THE REORGANIZATIONS
Tax Capital Loss Carryforwards
The following discussion relates solely to the Reorganizations involving the Target Feeder Funds. The Target Master Portfolios are treated as partnerships for U.S. federal income tax purposes and are not entitled to carry forward capital losses.
Federal income tax law permits a regulated investment company to carry forward its net capital losses from any taxable year that began on or before December 22, 2010 (“Pre-2011 Carryforwards”) for a period of up to eight taxable years. Federal income tax law permits a regulated investment company to carry forward its net capital losses from any taxable year that began after December 22, 2010 (“Post-2010 Carryforwards”) for an unlimited number of taxable years, but such carryforwards must be fully utilized before the regulated investment company is permitted to utilize any carryforwards of losses from taxable years that began on or before December 22, 2010.
In the tax year of the applicable Destination Fund during which the applicable Reorganization occurs, the Destination Fund will be able to use carryforwards of the applicable Target Fund (including from the Target Fund’s short tax year ending on the applicable Closing Date), subject to the limitations described below, to offset only a prorated portion of the Destination Fund’s capital gains for the Destination Fund’s tax year, based on the number of days remaining in its tax year after the Closing Date.
Each Reorganization may result in limitations on the applicable Destination Fund’s ability to use carryforwards of the corresponding Target Fund. Those limitations, imposed by Section 382 of the Code, will generally apply if the shareholders of the Target Fund own less than 50% of the corresponding Destination Fund immediately after the applicable Reorganization, and will be imposed on an annual basis. Each Reorganization may result in limitations on the applicable Destination Fund’s ability to use unrealized losses inherent in the applicable Target Fund’s assets at the time of the Reorganization. Losses in excess of the limitation may be carried forward, subject to the overall eight-year limit with respect to Pre-2011 Carryforwards. The annual Section 382 limitation for periods following a Reorganization that is subject to such a limitation generally will equal the product of the net asset value of the applicable Target Fund immediately prior to the Reorganization and the “long-term tax-exempt rate,” published by the Internal Revenue Service (“IRS”), in effect at the time of the Reorganization. This limitation may be prorated in the taxable year of the applicable Destination Fund in which the applicable Reorganization occurs based on the number of days remaining after the Closing Date in such taxable year.
- 161 -
As of December 31, 2015, the Target Funds had the following unused capital loss carryforwards:
| | | | | | | | | | | | | | | | | | | | | | | | | | | | | | | | |
| | | Pre-2011 Carryforwards | | | Post-2010 Carryforwards | |
Fund | | Expiring in
2016 | | | Expiring in
2017 | | | Expiring
in 2018 | | | Expiring
in 2019 | | | Total | | | Short-term | | | Long-term | | | Total | |
Transamerica Partners Core Bond | | $ | — | | | $ | — | | | $ | — | | | $ | — | | | $ | — | | | $ | — | | | $ | — | | | $ | — | |
Transamerica Partners Government Money Market | | $ | 177,177 | | | $ | — | | | $ | — | | | $ | — | | | $ | 177,177 | | | $ | — | | | $ | — | | | $ | — | |
Transamerica Partners High Yield Bond | | $ | — | | | $ | 12,895,121 | | | $ | — | | | $ | — | | | $ | 12,895,121 | | | $ | 1,070,871 | | | $ | 1,017,395 | | | $ | 2,088,266 | |
Transamerica Partners International Equity | | $ | — | | | $ | 137,902,335 | | | $ | — | | | $ | — | | | $ | 137,902,335 | | | $ | 392,827 | | | $ | 4,378,153 | | | $ | 4,770,980 | |
Transamerica Partners Mid Growth | | $ | — | | | $ | — | | | $ | — | | | $ | — | | | $ | — | | | $ | — | | | $ | — | | | $ | — | |
Transamerica Partners Mid Value | | $ | — | | | $ | — | | | $ | — | | | $ | — | | | $ | — | | | $ | — | | | $ | — | | | $ | — | |
Transamerica Partners Small Core | | $ | — | | | $ | 18,743,813 | | | $ | — | | | $ | — | | | $ | 18,743,813 | | | $ | — | | | $ | — | | | $ | — | |
Transamerica Partners Small Growth | | $ | — | | | $ | — | | | $ | — | | | $ | — | | | $ | — | | | $ | — | | | $ | — | | | $ | — | |
Transamerica Partners Small Value | | $ | — | | | $ | — | | | $ | — | | | $ | — | | | $ | — | | | $ | — | | | $ | — | | | $ | — | |
Transamerica Partners Institutional Core Bond | | $ | — | | | $ | — | | | $ | — | | | $ | — | | | $ | — | | | $ | — | | | $ | — | | | $ | — | |
Transamerica Partners Institutional Government Money Market | | $ | 198,199 | | | $ | — | | | $ | — | | | $ | — | | | $ | 198,199 | | | $ | — | | | $ | — | | | $ | — | |
Transamerica Partners Institutional High Yield Bond | | $ | — | | | $ | — | | | $ | — | | | $ | — | | | $ | — | | | $ | 2,744,615 | | | $ | 2,607,557 | | | $ | 5,352,172 | |
Transamerica Partners Institutional International Equity | | $ | 58,385,680 | | | $ | 175,849,038 | | | $ | — | | | $ | — | | | $ | 234,234,718 | | | $ | 63,924 | | | $ | 708,008 | | | $ | 771,932 | |
Transamerica Partners Institutional Mid Growth | | $ | — | | | $ | — | | | $ | — | | | $ | — | | | $ | — | | | $ | — | | | $ | — | | | $ | — | |
Transamerica Partners Institutional Mid Value | | $ | — | | | $ | — | | | $ | — | | | $ | — | | | $ | — | | | $ | — | | | $ | — | | | $ | — | |
Transamerica Partners Institutional Small Core | | $ | 13,245,711 | | | $ | 29,110,407 | | | $ | — | | | $ | — | | | $ | 42,356,118 | | | $ | — | | | $ | — | | | $ | — | |
Transamerica Partners Institutional Small Growth | | $ | — | | | $ | — | | | $ | — | | | $ | — | | | $ | — | | | $ | — | | | $ | — | | | $ | — | |
Transamerica Partners Institutional Small Value | | $ | — | | | $ | 2,559,462 | | | $ | — | | | $ | — | | | $ | 2,559,462 | | | $ | — | | | $ | — | | | $ | — | |
- 162 -
Each Reorganization may result in limitations on the applicable Destination Fund’s ability, in the post-Reorganization period, to use a portion of its carryforwards (including any carryforward generated in its tax year that includes the Reorganization) and potentially on such Destination Fund’s ability to use unrealized capital losses inherent in the tax basis of its assets. Those limitations are imposed on an annual basis. Losses in excess of the limitation may be carried forward, subject to generally applicable limitations. If applicable, the annual limitation on the use of those carryforwards for periods following the Reorganization generally will equal the product of the net asset value of the Destination Fund and the “long-term tax-exempt rate,” as published by the IRS.
If a Destination Fund or a corresponding Target Fund has a net unrealized gain inherent in its assets at the time of the applicable Reorganization, then, under certain circumstances, the combined Fund may not offset that gain, to the extent realized within five years of the applicable Reorganization, by a carryforward of pre-Reorganization losses (other than a carryforward or net operating loss of that Destination Fund or that Target Fund, as applicable) or, in certain cases, by a net unrealized loss inherent at the time of the applicable Reorganization in the assets of the other Fund involved in the Reorganization.
As a result of each Reorganization, losses and loss carryforwards will benefit the shareholders of the combined Destination Fund, rather than only the shareholders of the Destination Fund or Target Fund that incurred them. If a Target Fund’s Reorganization closes on a date other than its regular tax year-end, the Reorganization will cause the Target Fund’s Pre-2011 Carryforwards to expire earlier than the time they otherwise would have expired. Even if a particular limitation described above would not be triggered solely by a particular Reorganization, the limitation may be triggered by the Reorganization and one or more other transactions entered into by the applicable Target Fund or Destination Fund (including, potentially, another Reorganization). By reason of the foregoing rules, taxable shareholders of a Target Fund may pay more taxes, or pay taxes sooner, than they otherwise would have if the Target Fund’s Reorganization did not occur.
Since the Reorganizations are not expected to close until [ ], 2017, the capital loss carryforwards and limitations described above may change between now and the completion of the Reorganizations. Further, the ability of each Destination Fund to use losses (even in the absence of a Reorganization) also depends on factors other than loss limitations, such as the future realization of capital gains or losses.
PORTFOLIO SECURITIES
If a Reorganization is effected, management will analyze and evaluate the portfolio securities of the Target Fund being transferred to the corresponding Destination Fund. Consistent with each Destination Fund’s investment goal or goals and investment strategies and policies, any restrictions imposed by the Code and in the best interests of each Destination Fund’s shareholders (including former shareholders of the corresponding Target Fund), management will influence the extent and duration to which the portfolio securities of the corresponding Target Fund will be maintained by the Target Fund. As each Target Fund and corresponding Destination Fund have the same or compatible investment strategies, management expects that there will be no significant portfolio restructuring before or after the Reorganizations. It is possible that there may be dispositions of some of the portfolio securities of one or more Target Funds following the Reorganizations. Subject to market conditions at the time of any such disposition, the disposition of the portfolio securities by each combined Destination Fund may result in a capital gain or loss. The actual tax consequences of any disposition of portfolio securities will vary depending upon the specific security(ies) being sold and the combined Destination Fund’s ability to use any available tax loss carryforwards. The disposition of portfolio securities also may result in brokerage expense to the combined Destination Fund.
- 163 -
TERMS OF EACH AGREEMENT AND PLAN OF REORGANIZATION
The Reorganizations
Subject to holder approval and the satisfaction of certain closing conditions, each Reorganization is scheduled to close during the first or second quarter of 2017 (each, a “Closing Date”), but may occur on such later date as the parties may agree to in writing.
On the applicable Closing Date, each Target Fund will transfer all of its property and assets to the corresponding Destination Fund. In exchange, the applicable Destination Fund will assume all of the liabilities of the applicable Target Fund and issue shares to that Target Fund, as described below.
In each Reorganization, the applicable Destination Fund will issue shares of the applicable class to the applicable Target Fund with an aggregate net asset value equal to the aggregate net asset value of the Target Feeder Fund’s shares (or beneficial interests in the case of the Target Master Portfolios). Holders of shares of Investor Target Feeder Funds will receive Class R shares. Holders of shares of Institutional Target Feeder Funds will receive Class R4 shares. Holders of beneficial interests in the Target Master Portfolios will receive Class I3 shares.
Shares of the applicable class of the applicable Destination Fund will then be distributed by the applicable Target Fund to holders of shares (or beneficial interests) in the Target Fund on a pro rata basis in complete redemption of the holders’ shares (or beneficial interests) and in complete liquidation of the Target Fund. Therefore, on the Closing Date, upon completion of the applicable Reorganization, each holder of shares (or beneficial interests) in the applicable Target Fund will hold shares of the applicable class of the corresponding Destination Fund with an aggregate net asset value equal to the aggregate net asset value of the holder’s shares (or beneficial interests) in the applicable Target Fund immediately prior to the Reorganization. The net asset value attributable to each Target Fund will be determined using the Target Fund’s valuation policies and procedures, and the net asset value attributable to a class of shares of each Destination Fund will be determined using the Destination Fund’s valuation policies and procedures. The portfolio assets of each Target Fund and corresponding Destination Fund are valued using the same valuation policies and procedures.
For each Reorganization grouping, the Target Master Portfolio and the Target Feeder Funds that invest in the Target Master Portfolio will reorganize into the corresponding Destination Fund on the same Closing Date. Prior to the applicable Reorganization, each Target Feeder Fund will redeem its interest in the applicable Target Master Portfolio in kind, subject to its pro rata share of liabilities, and then complete its Reorganization into the applicable Destination Fund. The Reorganizations of the Target Feeder Funds will occur prior to the Reorganization of the relevant Target Master Portfolio. Following completion of the Reorganizations of the Target Feeder Funds, the related Target Master Portfolio will complete its Reorganization with the applicable Destination Fund. At the time of each Target Master Portfolio Reorganization, the applicable Non-Mutual Fund Feeder Funds will be the only holders of the Target Master Portfolio.
Each Target Fund will be terminated after the consummation of its Reorganization.
No sales load, contingent deferred sales charge, commission, redemption fee or other transactional fee will be charged as a result of the Reorganizations.
Following the Reorganizations, TAM will continue to act as investment manager to each Destination Fund and the relevant sub-advisers will continue to serve as sub-advisers to the Destination Funds.
For each Reorganization involving a Target Feeder Fund, for federal income tax purposes, no gain or loss is expected to be recognized by holders or, generally, the Target Feeder Fund as a result of the Reorganization. The exchange of each Target Master Portfolio’s assets for the applicable class of shares of the corresponding Destination Fund and the Destination Fund’s assumption of the Target Master Portfolio’s liabilities is expected, in most cases, to be a taxable exchange for federal income tax purposes, in which the Target Master Portfolio will recognize gains and losses.
Agreement and Plan of Reorganization
The holders of each Target Fund are being asked to approve the Plan substantially in the form attached as Exhibit A to this Proxy Statement/Prospectus, which is incorporated herein by this reference. The description of the Plan contained herein, which includes the material provisions of the Plan, is qualified in its entirety by the attached copy.
- 164 -
Determination of Net Asset Value. If a Reorganization is approved, the applicable Destination Fund will deliver to the corresponding Target Fund a number of full and fractional shares of the applicable class of the Destination Fund with an aggregate net asset value equal to the aggregate net asset value of the corresponding Target Feeder Fund’s shares (or beneficial interests in the case of the Target Master Portfolios). The net asset value per share of the applicable class of shares of such Destination Fund shall be computed using the Destination Fund’s valuation procedures and the net asset value per share (or beneficial interest) of such Target Fund shall be computed using the Target Fund’s valuation policies and procedures. The number of full and fractional shares of the applicable class of the Destination Fund shall be determined by dividing the value of the Target Fund’s net assets by the net asset value of one share of the applicable class of the corresponding Destination Fund.
Conditions to Closing the Reorganization. The obligation of each Fund to consummate a given Reorganization is subject to the satisfaction of certain conditions, including the Fund’s performance of all its obligations under the Plan, the receipt of certain documents and financial statements from the subject Target Fund and the receipt of all consents, orders and permits necessary to consummate the Reorganization. The consummation of one Reorganization is not contingent on the consummation of any other Reorganization.
The obligations of a Destination Fund and a corresponding Target Fund are subject to approval of the applicable Plan by the necessary vote of the outstanding shares of the Target Fund with respect to the Reorganization of that Target Fund, in accordance with the provisions of the applicable Target Trust’s charter and by-laws and applicable law. For each Reorganization involving a Target Feeder Fund, the obligations are also subject to the receipt of a favorable opinion of Morgan, Lewis & Bockius LLP as to the United States federal income tax consequences of the Reorganization.
Termination of a Plan. The Target Fund’s Board or the Destination Fund’s Board of Trustees may terminate a Plan (even if the holders of the relevant Target Fund have already approved it) at any time before the Closing Date, if such Board believes that proceeding with the Reorganization would no longer be in the best interests of the Fund’s holders. Any such termination will be effective when communicated to the other party.
Expenses of the Reorganizations. The expenses incurred in connection with the Reorganizations will be shared equally by TAM, on the one hand, and the Target Funds and Destination Funds, on the other, in accordance with an allocation approved by the Target Funds’ Board of Trustees and the Destination Funds’ Board of Trustees. Notwithstanding the foregoing, in each Reorganization involving a Target Feeder Fund, expenses will be paid by the party directly incurring such expenses (without reimbursement by another person) if and to the extent that the payment by another person of such expenses would prevent such party from being treated as a “regulated investment company” under the Code or would prevent the Reorganization from qualifying as a tax-free reorganization.
CHARTER DOCUMENTS
The Investors Target Feeder Funds are series of TPFG and the Institutional Target Feeder Funds are series of TPFG II. TPFG and TPFG II are each a Massachusetts business trust. The Target Master Portfolios are series of TPP, a trust governed by New York law. The Destination Funds are series of Transamerica Funds, a Delaware statutory trust. TPFG, TPFG II, TPP and Transamerica Funds are governed by their respective declaration of trust, by-laws and applicable state law. A summary of certain of the more significant provisions and differences between the declarations of trust of TPFG, TPFG II, TPP and Transamerica Funds is provided below.
Holder Voting. The declaration of trust of each of TPFG, TPFG II, TPP and Transamerica Funds provides for shareholder voting as required by the 1940 Act or other applicable laws but otherwise permits, consistent with state law, actions by the Trustees without seeking the consent of shareholders. Each trust is not required to hold an annual meeting of shareholders, but each trust will call special meetings of holders whenever required by the 1940 Act or by the terms of the declaration of trust. All holders of record of all series and, as applicable, classes of a trust vote together, except where required by the 1940 Act to vote separately by series or by class, or when the Trustees have determined that a matter affects only the interests of one or more series or classes of shares. There is no cumulative voting on any matter submitted to a vote of the shareholders.
- 165 -
The declaration of trust of each of TPFG, TPFG II and Transamerica Funds provides for “dollar-weighted voting” which means that a holder’s voting power is determined, not by the number of shares he or she owns, but by the net asset value, in U.S. dollars, of those shares determined at the close of business on the record date.
The declaration of trust of TPP provides that each holder’s voting power is proportionate to such holder’s book capital account as recorded on the books of TPP (which, in the case of a holder that holds interest in more than one Target Master Portfolio shall be the sum of the holder’s book capital accounts with respect to each Target Master Portfolio) at the close of business on the record date.
Election and Removal of Trustees. The declaration of trust of each of TPFG, TPFG II, TPP and Transamerica Funds provides that the Trustees may establish the number of Trustees and that vacancies on the Board may be filled by a vote or consent of the remaining Trustees, except when election of Trustees by the holders is required under the 1940 Act. Trustees are then elected by a plurality of votes cast by holders at a meeting at which a quorum is present. Each declaration of trust also provides that a mandatory retirement age may be set by action of two-thirds of the Trustees and that any Trustee may be removed by a vote of holders holding two-thirds of the voting power of the trust, or by a vote of two-thirds of the remaining Trustees. The provisions of each declaration of trust relating to the election and removal of Trustees may not be amended without the approval of two-thirds of the Trustees.
Amendments to the Declaration. The Trustees of each of TPFG, TPFG II, TPP and Transamerica Funds are authorized to amend the applicable declaration of trust without the vote of holders, but no amendment may be made that impairs the exemption from personal liability granted in the declaration of trust to persons who are or have been holders, Trustees, officers or employees of the trust, that limits the rights to indemnification, advancement of expenses or insurance provided in the declaration of trust with respect to actions or omissions of persons entitled to indemnification, advancement of expenses or insurance under the declaration of trust prior to the amendment.
Issuance and Redemption of Shares. With respect to each of TPFG, TPFG II and Transamerica Funds, a fund may issue an unlimited number of shares for such consideration and on such terms as the Trustees may determine. All shares offered pursuant to the prospectus of a fund, when issued, will be fully paid and non- assessable. Holders are not entitled to any appraisal, preemptive, conversion, exchange or similar rights, except as the Trustees may determine. A fund may involuntarily redeem a holder’s shares upon certain conditions as may be determined by the Trustees, including, for example, if the holder fails to provide a fund with identification required by law, or if the fund is unable to verify the information received from the shareholder or the shareholder fails to provide the required information. In addition, as discussed below, shares may be redeemed in connection with the closing of small accounts.
For TPP, the amount of authorized interests in each fund is unlimited. Interests may only be sold by the trust to certain institutional investors. Holders have no appraisal rights with respect to their interests and, except as may be determined by the Trustees from time to time, have no exchange or conversion rights with respect to their interests.
Disclosure of Holder Holdings. The declaration of trust of each of TPFG, TPFG II, TPP and Transamerica Funds specifically requires holders, upon demand, to disclose in writing to a fund information with respect to the direct and indirect ownership of shares or interests in order to comply with various laws or regulations, and a fund may disclose such ownership if required by law or regulation, or as the Trustees otherwise decide.
Small Accounts. The declaration of trust of each of TPFG, TPFG II and Transamerica Funds provides that a fund may close out a holder’s account by redeeming all of the shares in the account if the account falls below a minimum account size (which may vary by class) that may be set by the Trustees from time to time. Alternately, the declaration of trust permits a fund to assess a fee for small accounts (which may vary by class) and redeem shares in the account to cover such fees, or convert the shares into another share class that is geared to smaller accounts. The declaration of trust of TPP contains no comparable provisions.
Holder, Trustee and Officer Liability. The declaration of trust of each of TPFG, TPFG II, TPP and Transamerica Funds provides that holders are not personally liable for the obligations of a fund and require the fund to indemnify a holder against any loss or expense arising from any such liability. A fund will assume the defense of any claim against a holder for personal liability at the request of the holder.
- 166 -
Each declaration of trust provides that a Trustee acting in his or her capacity as a Trustee is not personally liable to any person, other than the trust or any series, in connection with the affairs of the trust. Each declaration of trust also provides that no Trustee, officer or employee of the trust owes any duty to any person (including without limitation any holder), other than the trust or any series. Each Trustee is required to perform his or her duties in good faith and in a manner he or she believes to be in the best interests of the applicable trust. All actions and omissions of Trustees are presumed to be in accordance with the foregoing standard of performance, and any person alleging the contrary has the burden of proving that allegation.
Each declaration of trust requires the trust to indemnify any persons who are or who have been Trustees, officers or employees of the trust to the fullest extent permitted by law against liability and expenses in connection with any claim or proceeding in which he or she is involved by virtue of having been a Trustee, officer or employee. In making any determination as to whether any person is entitled to the advancement of expenses in connection with a claim for which indemnification is sought, such person is entitled to a rebuttable presumption that he or she did not engage in conduct for which indemnification is not available.
Each declaration of trust also provides that any Trustee who serves as chair of the Board, a member or chair of a committee of the Board, lead independent Trustee, audit committee financial expert, or in any other similar capacity will not be subject to any greater standard of care or liability because of such position.
Derivative and Direct Actions. The declaration of trust of each of TPFG, TPFG II, TPP and Transamerica Funds provides a detailed process for the bringing of derivative or direct actions by holders in order to permit legitimate inquiries and claims while avoiding the time, expense, distraction, and other harm that can be caused to a fund or its holders as a result of spurious shareholder claims, demands and derivative actions.
Prior to bringing a derivative action, the declaration of trust of TPP requires that a demand by a holder must be made on the Trustees and the declarations of trust of TPFG, TPFG II, TPP and Transamerica Funds require that a demand by no fewer than three unrelated holders must be made on the Trustees. The declarations of trust detail information, certifications, undertakings and acknowledgements that must be included in the demand. The Trustees are not required to consider a demand that is not submitted in accordance with the requirements contained in the applicable declaration of trust. Each declaration of trust also requires that, in order to bring a derivative action, the complaining holder(s) must be joined in the action by holders owning, at the time of the alleged wrongdoing, at the time of demand, and at the time the action is commenced, shares representing at least 5% of the voting power of the affected funds. The Trustees have a period of 90 days, which may be extended by up to an additional 60 days, to consider the demand. If a majority of the Trustees who are considered independent for the purposes of considering the demand (or a committee comprised of some or all of such Trustees), with the assistance of counsel who may be retained by such Trustees on behalf and at the expense of the trust, determine that a suit should be maintained, then the trust will commence the suit and the suit will proceed directly and not derivatively. If a majority of the independent Trustees determines that maintaining the suit would not be in the best interests of the applicable trust, the Trustees are required to reject the demand and the complaining holders may not proceed with the derivative action unless the holders are able to sustain the burden of proof to a court that the decision of the Trustees not to pursue the requested action was not consistent with the standard of performance required of the Trustees in performing their duties. If a demand is rejected, each complaining holder will be responsible, jointly and severally with any and all other complaining holders, for the costs and expenses (including attorneys’ fees) incurred by the trust in connection with the consideration of the demand, if, in the judgment of the independent Trustees, the demand was made without reasonable cause or for an improper purpose.
Each declarations of trust provides that no holder may bring a direct action claiming injury as a holder of the trust, or any series or class thereof, where the matters alleged (if true) would give rise to a claim by the trust or by the trust on behalf of a series or class, unless the holder has suffered an injury distinct from that suffered by the holders of the trust, or the series or class, generally. Under each declaration of trust, a holder bringing a direct claim must be a holder of the series or class with respect to which the direct action is brought at the time of the injury complained of, or have acquired the shares afterwards by operation of law from a person who was a holder at that time.
- 167 -
Under each declaration of trust , if a derivative or direct action is brought in violation of the declaration of trust, each holder who commences or maintains such action will be required. jointly and severally, to reimburse the trust for the costs and expenses (including attorneys’ fees) incurred by the trust in connection with the action if the action is dismissed on the basis of the failure to comply with the declaration. In addition, if a court determines that any derivative action has been brought without reasonable cause or for an improper purpose, the costs and expenses (including attorneys’ fees) incurred by the trust in connection with the action will be borne, jointly and severally, by each holder who commenced the action.
The declarations of trust further provide that a fund shall be responsible for payment of attorneys’ fees and legal expenses incurred by a complaining holder bringing a derivative or direct claim only if required by law, and any attorneys’ fees that the fund is obligated to pay shall be calculated using reasonable hourly rates.
The declarations of trust of TPFG and TPFG II require that actions by holders against the trust or a fund be brought only in the U.S. District Court for the Southern District of New York or if not permitted to be brought in federal court, then in the Business Litigation Session of Suffolk Superior Court in Massachusetts, and that the right to jury trial be waived to the full extent permitted by law.
The declarations of trust of TPP and Transamerica Funds require that actions by holders against the trust or a fund be brought only in the U.S. District Court for the Southern District of New York, or if not permitted to be brought in federal court, then in the New York Supreme Court sitting in New York County with assignment to the Commercial Division to the extent such assignment is permitted under the applicable court rules, and that the right to jury trial be waived to the fullest extent permitted by law.
Series and Classes. The declaration of trust of each of TPFG, TPFG II, TPP and Transamerica Funds provides that the Trustees may establish series and classes in addition to those currently established and that the Trustees may determine the rights and preferences, limitations and restrictions, including qualifications for ownership, conversion and exchange features, minimum purchase and account size, expenses and charges, and other features of the series and classes. Each share of a fund, as a series of the trust, represents an interest in the fund only and not in the assets of any other series of the trust.
The foregoing is a very general summary of certain provisions of the Funds’ declarations of trust. It is qualified in its entirety by reference to the respective declaration of trust.
FUNDAMENTAL INVESTMENT POLICIES OF THE FUNDS
Each Fund has adopted certain fundamental investment policies which may not be changed without the affirmative vote of the holders of a “majority of the outstanding voting securities” (as defined in the 1940 Act) of the Fund. Under the 1940 Act, the vote of a majority of the outstanding voting securities of a Fund means the affirmative vote of the lesser of (a) 67% or more of the voting power of the voting securities present at the meeting, if the holders of more than 50% of the outstanding voting securities of the Fund are present at the meeting or represented by proxy, or (b) more than 50% of the voting power of the outstanding voting securities of the Fund. The following table lists the fundamental investment restrictions for each Target Fund and each Destination Fund.
| | | | |
| | | Target Funds | | Destination Funds |
| Borrowing | | Each Target Fund may not borrow money, except as permitted under the 1940 Act, and as interpreted, modified or otherwise permitted by regulatory authority having jurisdiction, from time to time. | | Each Destination Fund may not borrow money, except as permitted under the 1940 Act, and as interpreted, modified or otherwise permitted by regulatory authority having jurisdiction. |
- 168 -
| | | | |
| | | Target Funds | | Destination Funds |
| Underwriting | | Each Target Fund may not engage in the business of underwriting the securities of other issuers except as permitted by the 1940 Act. | | Each Destination Fund may not engage in the business of underwriting the securities of other issuers except as permitted by the 1940 Act. |
| | |
| Making Loans | | Each Target Fund may not make loans, except as permitted under the 1940 Act, and as interpreted, modified or otherwise permitted by regulatory authority having jurisdiction, from time to time. | | Each Destination Fund may not make loans, except as permitted under the 1940 Act, and as interpreted, modified or otherwise permitted by regulatory authority having jurisdiction, from time to time. |
| | |
| Senior Securities | | Each Target Fund may not issue any senior security, except as permitted under the 1940 Act, and as interpreted, modified or otherwise permitted by regulatory authority having jurisdiction, from time to time. | | Each Destination Fund may not issue any senior security, except as permitted under the 1940 Act, and as interpreted, modified or otherwise permitted from time to time by regulatory authority having jurisdiction. |
| | |
| Real Estate | | Each Target Fund may not purchase or sell real estate except as permitted by the 1940 Act. | | Each Destination Fund may not purchase or sell real estate except as permitted by the 1940 Act. |
| | |
| Commodities | | Each Target Fund may not purchase physical commodities or contracts relating to physical commodities, except as permitted under the 1940 Act, and as interpreted, modified or otherwise permitted by regulatory authority having jurisdiction, from time to time. | | Each Destination Fund may not purchase physical commodities or contracts relating to physical commodities, except as permitted from time to time under the 1940 Act, and as interpreted, modified or otherwise permitted by regulatory authority having jurisdiction. |
| | |
| Concentration of Investments | | Each Target Fund may not make any investment if, as a result, the Target Fund’s investments will be concentrated in any one industry, as the relevant terms are used in the 1940 Act, as interpreted or modified by regulatory authority having jurisdiction, from time to time. | | Each Destination Fund may not make any investment if, as a result, the Destination Fund’s investments will be concentrated in any one industry, as the relevant terms are used in the 1940 Act, as interpreted or modified by regulatory authority having jurisdiction, from time to time. |
| | |
| Diversification | | No stated policy. However, each Target Fund is currently classified as a diversified fund under the 1940 Act. This means that each Target Fund may not purchase securities of any one issuer (other than cash, cash items, securities issued or guaranteed by the U.S. government, its agencies or instrumentalities or any certificate of deposit thereof, and securities of other investment companies) if, as a result, with respect to 75% of the value of its total assets, (a) more than 5% of the value of each Target Fund’s total assets would be invested in securities of that issuer, or (b) each Target Fund would hold more than 10% of the outstanding voting securities of that issuer. The 1940 Act requires any change from diversified to non-diversified status of a fund to be approved in advance by fund shareholders. | | No stated policy. However, each Destination Fund is currently classified as a diversified fund under the 1940 Act. This means that each Destination Fund may not purchase securities of any one issuer (other than cash, cash items, securities issued or guaranteed by the U.S. government, its agencies or instrumentalities or any certificate of deposit thereof, and securities of other investment companies) if, as a result, with respect to 75% of the value of its total assets, (a) more than 5% of the value of each Destination Fund’s total assets would be invested in securities of that issuer, or (b) each Destination Fund would hold more than 10% of the outstanding voting securities of that issuer. The 1940 Act requires any change from diversified to non-diversified status of a fund to be approved in advance by fund shareholders. |
- 169 -
BUYING, SELLING AND EXCHANGING OF FUND SHARES
The following sets forth how shareholders may buy, sell and exchange shares of the Funds and how each of the Funds determines its net asset value.
| | | | | | |
| | | Target Feeder Funds | | Target Master Portfolios | | Destination Funds |
| Buying Shares | | Shares of the funds are available to individual and institutional investors through certain retirement plans. These plans include, but are not limited to, 401(k), 403(b) and 457 Plans, Money Purchase Plans, Profit Sharing Plans, Simplified Employee Pension Plans, Keogh Plans, defined benefit plans, nonqualified deferred compensation plans, and IRAs. Shares may be purchased through a plan administrator, recordkeeper or authorized financial intermediary. If you are a participant in a plan, you should obtain the plan’s conditions for participation from your plan administrator. Plans may prohibit purchases or redemptions of fund shares during certain circumstances, such as a change in plan administrators. Consult your plan administrator for more information. Shares of the funds are also available to other investors, including endowment funds and foundations, any state, county or city, or its instrumentality, department, authority or agency, and accounts registered to insurance companies, trust companies and bank trust departments. Each fund’s shares are sold without a sales charge. Purchases may be made Monday through Friday, except on certain holidays. Shares are purchased at net asset value (“NAV”) the next time it is calculated after your investment is | | Beneficial interests in the portfolios are issued solely in private placement transactions which do not involve any “public offering” within the meaning of Section 4(2) of the 1933 Act. Investments in the portfolios may only be made by investment companies, common or commingled trust funds or similar organizations or entities which are “accredited investors” within the meaning of Regulation D under the 1933 Act. This Registration Statement does not constitute an offer to sell, or the solicitation of an offer to buy, any “security” within the meaning of the 1933 Act. An investment in each portfolio is made without a sales load. All investments are made at net asset value next determined after an order is received by a portfolio. There is no minimum initial or subsequent investment in a portfolio. However, since each portfolio intends to be as fully invested at all times as is reasonably practicable in order to enhance the yield on its assets, investments must be made in federal funds (i.e., moneys credited to the account of a portfolio’s custodian bank by a U.S. Federal Reserve Bank). The Trust reserves the right to cease accepting investments for any portfolio at any time or to reject any investment order. | | Investors may purchase shares of the funds at the “offering price” of the shares, which is the net asset value per share (“NAV”). Please note that purchase requests initiated through an automated service that exceed $50,000 per day may be rejected and must be submitted by check or via bank wire. Please refer to the retirement plan documents for information on how to purchase Class R and R4 shares of the funds and any fees that may apply. Class I3 shares are only available to certain funds of funds, registered and unregistered insurance company separate accounts and collective investment trusts. Transamerica Funds must receive your payment within three business days after your order is accepted. Transamerica Funds or its agents may reject a request for purchase of shares at any time, in whole or in part, including any purchase under the exchange privilege. Each fund reserves the right to make additional exceptions or otherwise to modify the foregoing policies at any time. |
- 170 -
| | | | | | |
| | | Target Feeder Funds | | Target Master Portfolios | | Destination Funds |
| | received in good order and is accepted by the transfer agent. The funds reserve the right to reject any purchase orders at any time. You may purchase shares in a fund through the transfer agent directly or by authorizing your retirement plan to purchase shares on your behalf. Initial and subsequent purchases may be made by check or wire transfer. Checks should be in U.S. dollars and drawn on a U.S. bank and made payable to Transamerica Funds Services and mailed to: Transamerica Fund Services, Inc. P.O. Box 219945 Kansas City, MO 64121-9945 In the case of an initial purchase, the check must be accompanied by a completed Account Application. If shares are purchased with a check that does not clear, the purchase will be canceled and any losses or fees incurred in the transaction will be the responsibility of the investor. If shares are purchased with a check and a redemption request relating to such shares is received within fifteen days of such purchase, the redemption proceeds will be paid only when the check clears. If you would like to purchase shares in a fund by a wire transfer, please call 1-888-233-4339 for wire transfer instructions and direct your bank to transmit immediately available funds in accordance with such instructions. Investors who make initial purchases by wire transfer must complete an Account Application and mail it to the address above. See your plan administrator, recordkeeper, or authorized financial intermediary, to obtain purchase instructions if you are a participant in a retirement plan. Plans which include fixed investment options may restrict or prohibit the purchase of shares of certain of the funds with monies withdrawn from those fixed investment options. | | Each investor in a portfolio may add to or reduce its investment in the portfolio on each Business Day. As of the close of regular trading on the New York Stock Exchange, on each Business Day, the value of each investor’s beneficial interest in a portfolio is determined by multiplying the net asset value of the portfolio by the percentage, effective for that day, which represents that investor’s share of the aggregate beneficial interests in the portfolio. Any additions or withdrawals, which are to be effected on that day, are then effected. Thereafter, the investor’s percentage of the aggregate beneficial interests in the portfolio is then re-computed as the percentage equal to the fraction (i) the numerator of which is the value of such investor’s investment in the portfolio as of the close of regular trading on such day plus or minus, as the case may be, the amount of any additions to or withdrawals from the investor’s investment in the portfolio effected on such day, and (ii) the denominator of which is the aggregate net asset value of the portfolio as of the same time on such day plus or minus, as the case may be, the amount of the net additions to or withdrawals from the aggregate investments in the portfolio by all investors in the portfolio. The percentage so determined is then applied to determine the value of the investor’s interest in the portfolio as of the close of regular trading on the following Business Day of the portfolio. | | |
- 171 -
| | | | | | |
| | | Target Feeder Funds | | Target Master Portfolios | | Destination Funds |
| Minimum Initial Investment | | The minimum initial investment is $5,000. The funds are currently waiving this minimum. A retirement plan may, however, impose minimum investment requirements. Plan participants or IRA holders should consult their plan administrator, recordkeeper or authorized financial intermediary. | | There is no minimum initial investment in a portfolio for those who qualify to purchase interests in private placement transactions. | | There is no minimum investment for Class R shares. The minimum initial investment for Class R4 shares is $5,000. The funds are currently waiving this minimum. A retirement plan may, however, impose minimum investment requirements. Plan participants or IRA holders should consult their plan administrator, recordkeeper or authorized financial intermediary. There is no minimum investment for Class I3 shares for those that qualify for the share class. |
| | | |
| Minimum Subsequent Investment | | There is no minimum for subsequent investments. | | There is no minimum subsequent investments. | | There is no minimum for subsequent investments. |
| | | |
| Selling Shares | | On any day the New York Stock Exchange is open for business, you may sell (redeem) all or a portion of your shares. Shares are redeemed at NAV, without a sales charge. Redemption requests may be made by mail and, in certain circumstances, telephone. The proceeds of the redemption will be sent by mail or, if authorized on the Account Application, wire transfer. Redemption requests by mail must specify the dollar amount or number of shares to be redeemed, the account number and the name of the fund. The redemption request must be signed in exactly the same way that the account is registered. If there is more than one owner of the shares, each owner must sign the redemption request. Requests to redeem shares should be mailed to: | | An investor in a portfolio may withdraw all or any portion of its investment at any time after a withdrawal request in proper form is received by the portfolio from the investor. The proceeds of a withdrawal will be paid by the portfolio in federal funds normally on the Business Day the withdrawal is effected, but in any event within seven days. The portfolios may pay the redemption price in kind with readily marketable securities (instead of cash). If securities are distributed, an investor could incur brokerage, tax or other charges in converting the securities to cash. Investments in a portfolio may not be transferred. The right of any investor to receive payment with respect to any withdrawal may be suspended or the payment of the withdrawal proceeds postponed during any period in which the New York Stock Exchange is | | Shares may be sold (or “redeemed”) on any day the New York Stock Exchange is open for business. Proceeds from the redemption of shares will usually be sent to the redeeming shareholder within three business days after receipt in good order of a request for redemption. However, Transamerica Funds has the right to take up to seven days to pay redemption proceeds, and may postpone payment under certain circumstances, as authorized by law. If you have recently purchased your shares by check or electronic funds transfer, your redemption payment may be delayed until the fund is reasonably satisfied that the check or electronic funds transfer has cleared (which may take up to 10 calendar days). This delay may be avoided if you purchase shares by Federal Funds wire or certified check. |
- 172 -
| | | | | | |
| | | Target Feeder Funds | | Target Master Portfolios | | Destination Funds |
| | Transamerica Fund Services, Inc. P.O. Box 219945 Kansas City, MO 64121-9945 You may redeem shares by telephone if you authorized telephone redemptions on your Account Application. The funds reserve the right to modify the telephone redemption privilege at any time. Your transaction will be processed at the applicable fund’s NAV the next time it is calculated after your redemption request in good order is received by the transfer agent. Redemption proceeds normally will be paid or mailed within seven days. A redemption is treated as a sale for tax purposes, and will generally result in taxable gain or loss for a shareholder not holding shares through a tax-deferred account. Each fund reserves the right to delay delivery of your redemption proceeds up to 7 days. Participants in a retirement plan or IRA program should obtain redemption instructions from their plan administrator, recordkeeper, or authorized financial intermediary. A signature guarantee is required for the following: • any redemption by mail if the proceeds are to be paid to someone else or are to be mailed to an address other than your address of record; • any redemption by mail if the proceeds are to be wired to a bank; • any redemption request for more than $50,000; and • requests to transfer registration of shares to another owner. | | closed (other than weekends or holidays) or trading on the Exchange is restricted, or, to the extent otherwise permitted by the 1940 Act, if an emergency exists. | | Please note that redemption requests greater than $50,000 per day must be submitted in writing. In addition, amounts greater than $50,000 cannot be sent via ACH (check or federal funds wire only). Additionally, requests totaling more than $100,000 must be in writing with an original signature guarantee for all shareholders. The electronic bank link option must be established in advance for payments made electronically to your bank such as ACH or expedited wire redemptions. Call Customer Service to verify this feature is in place on your account or to obtain information on how to establish the electronic bank link. If you own Class R or R4 shares, please refer to the retirement plan documents for information on how to redeem Class R and R4 shares of the funds. Shares are redeemed at NAV. |
- 173 -
| | | | | | |
| | | Target Feeder Funds | | Target Master Portfolios | | Destination Funds |
| | At the funds’ discretion signature guarantees may also be required for other redemptions. A signature guarantee assures that a signature is genuine and protects shareholders from unauthorized account transfers. Banks, savings and loan associations, trust companies, credit unions, broker-dealers and member firms of a national securities exchange may guarantee signatures. Call your financial institution to see if it has this capability. A signature guarantee is not the same as a notarized signature. | | | | |
| | | |
| Exchanging Shares | | On any business day you may exchange all or a portion of your shares in a fund for shares of any other available fund. To make exchanges, please follow the procedures for sales described above under “Selling Shares.” Plan participants or IRA holders should contact their plan administrator, recordkeeper, or authorized financial intermediary. Exchanges are processed at NAV the next time it is calculated after your exchange request in good order is received and approved by the transfer agent. The funds reserve the right to reject any exchange request or to modify or terminate the exchange privilege at any time. An exchange is the sale of shares of one fund and purchase of shares of another, and will generally result in taxable gain or loss for a shareholder not holding shares through a tax-deferred account. | | Investments in a portfolio may not be transferred or exchanged. | | • You may request an exchange in writing, by phone, or by accessing your account through the internet. • You can exchange shares in one fund for shares in the same class of another fund. • An exchange is treated as a redemption of a fund’s shares, followed by a purchase of the shares of the fund into which you exchanged. Prior to making exchanges into a fund that you do not own, please read the prospectus for that fund carefully. • If you exchange all your shares to a new fund, any active systematic plan that you maintain with Transamerica Funds will also carry over to this new fund unless otherwise instructed. • In certain circumstances, shares of one class of a fund may also be exchanged directly for shares of another class of the same fund, as described in the Statement of Additional Information. • Transamerica Funds reserves the right to modify or terminate the exchange privilege at any time upon 60 days’ written notice. • Transamerica Funds reserves the right to deny any exchange request involving transactions between classes of shares. Please review your individual circumstances with your financial professional. |
- 174 -
| | | | | | |
| | | Target Feeder Funds | | Target Master Portfolios | | Destination Funds |
| | | | | | • The minimum exchange amount may be waived with respect to transactions in omnibus accounts maintained on behalf of certain 401(k) and other retirement plans. • For Class R and R4 shares, if authorized by your plan, you can request an exchange of your shares in one fund for corresponding shares of another fund. Please refer to your plan’s documents for additional information. An exchange is treated as a redemption of a fund’s shares followed by a purchase of the shares of the fund into which you exchanged. Prior to making exchanges into a fund you do not own, please read the prospectus of that fund. |
| | | |
| Net Asset Value | | The NAV of each fund is calculated by taking the value of its net assets and dividing by the number of shares of the fund that are then outstanding. The Board has approved procedures to be used to value the funds’ securities for purposes of determining the funds’ NAV. The valuation of the securities of the funds is determined in good faith by or under the direction of the Board. While the Board has primary responsibility to shareholders for valuation of portfolio securities, the Board has delegated certain valuation functions for the funds to TAM. In general, securities and other investments (including shares of ETFs) are valued based on market prices at the close of regular trading on the NYSE. Fund securities (including shares of ETFs) listed or traded on domestic securities exchanges or the NASDAQ/NMS, including dollar-denominated foreign securities or | | The book capital account of each holder’s beneficial interest is determined in accordance with the method and procedures established by the Board of Trustees for determining the value of portfolio assets. The Board of Trustees has approved procedures to be used to value the portfolios’ securities for the purposes of determining the value of book capital accounts. The valuation of the securities of the portfolios is determined in good faith by or under the direction of the Board. The Board has delegated certain valuation functions for the portfolios to TAM. In general, securities and other investments (including shares of ETFs) are valued based on market prices at the close of regular trading on the NYSE. Portfolio securities (including shares of ETFs) listed or traded on domestic securities exchanges or the NASDAQ/NMS, including | | The NAV of each fund (or class thereof) is calculated by taking the value of its net assets and dividing by the number of shares of the fund (or class) that are then outstanding. The Board has approved procedures to be used to value the funds’ securities for purposes of determining the funds’ NAV. The valuation of the securities of the funds is determined in good faith by or under the direction of the Board. While the Board has primary responsibility to shareholders for valuation of portfolio securities, the Board has delegated certain valuation functions for the funds to TAM. In general, securities and other investments (including shares of ETFs) are valued based on market prices at the close of regular trading on the NYSE. Fund securities (including shares of ETFs) listed or traded on domestic securities exchanges or the NASDAQ/NMS, including dollar- |
- 175 -
| | | | | | |
| | | Target Feeder Funds | | Target Master Portfolios | | Destination Funds |
| | ADRs, are valued at the closing price on the exchange or system where the security is principally traded. With respect to securities traded on the NASDAQ/NMS, such closing price may be the last reported sale price or the NASDAQ Official Closing Price (“NOCP”). If there have been no sales for that day on the exchange or system where the security is principally traded, then the value should be determined with reference to the last sale price, or the NOCP, if applicable, on any other exchange or system. If there have been no sales for that day on any exchange or system, a security is valued at the closing bid quotes on the exchange or system where the security is principally traded, or at the NOCP, if applicable. Foreign securities traded on U.S. exchanges are generally priced using last sale price regardless of trading activity. Securities traded over-the-counter are valued at the last bid price. The market price for debt obligations is generally the price supplied by an independent third party pricing service, which may use market prices or quotations or a variety of fair value techniques and methodologies. Short-term debt obligations that will mature in 60 days or less are valued at amortized cost, unless it is determined that using this method would not reflect an investment’s fair value. The prices that the fund uses may differ from the amounts that would be realized if the investments were sold and the differences could be significant, particularly for securities that trade in relatively thin markets and/or markets that experience extreme volatility. Foreign securities generally are valued based on quotations from the primary market in which they are traded, and are converted from the local currency into U.S. dollars using current exchange rates. Market quotations for securities prices may be obtained from automated | | dollar-dominated foreign securities or ADRs, are valued at the closing price on the exchange or system where the security is principally traded. With respect to securities traded on the NASDAQ/NMS, such closing price may be the last reported sale price or the NASDAQ Official Closing Price (“NOCP”). If there have been no sales for that day on the exchange or system where the security is principally traded, then the value should be determined with reference to the last sale price, or the NOCP, if applicable, on any other exchange or system. If there have been no sales for that day on any exchange or system, a security is valued at the closing bid quotes on the exchange or system where the security is principally traded, or at the NOCP, if applicable. Foreign securities traded on U.S. exchanges are generally priced using last sale price regardless of trading activity. Securities traded over-the-counter are valued at the mean of the last bid and asked prices. The market price for debt obligations is generally the price supplied by an independent third party pricing service, which may use market prices or quotations or a variety of fair value techniques and methodologies. Short-term debt obligations that will mature in 60 days or less are valued at amortized cost, unless it is determined that using this method would not reflect an investment’s fair value. The prices that the portfolio uses may differ from the amounts that would be realized if the investments were sold and the differences could be significant, particularly for securities that trade in relatively thin markets and/or markets that experience extreme volatility. Foreign securities generally are valued based on quotations from the primary market in which they are traded, and are converted from the local currency into U.S. | | denominated foreign securities or ADRs, are valued at the closing price on the exchange or system where the security is principally traded. With respect to securities traded on the NASDAQ/NMS, such closing price may be the last reported sale price or the NASDAQ Official Closing Price (“NOCP”). If there have been no sales for that day on the exchange or system where the security is principally traded, then the value should be determined with reference to the last sale price, or the NOCP, if applicable, on any other exchange or system. If there have been no sales for that day on any exchange or system, a security is valued at the closing bid quotes on the exchange or system where the security is principally traded, or at the NOCP, if applicable. Foreign securities traded on U.S. exchanges are generally priced using last sale price regardless of trading activity. Securities traded over-the-counter are valued at the last bid price. The market price for debt obligations is generally the price supplied by an independent third party pricing service, which may use market prices or quotations or a variety of fair value techniques and methodologies. Short-term debt obligations that will mature in 60 days or less are valued at amortized cost, unless it is determined that using this method would not reflect an investment’s fair value. The prices that the fund uses may differ from the amounts that would be realized if the investments were sold and the differences could be significant, particularly for securities that trade in relatively thin markets and/or markets that experience extreme volatility. Foreign securities generally are valued based on quotations from the primary market in which they are traded, and are converted from the local currency into U.S. dollars using current exchange rates. Market quotations for securities prices may |
- 176 -
| | | | | | |
| | | Target Feeder Funds | | Target Master Portfolios | | Destination Funds |
| | pricing services. Shares of open-end funds (other than ETF shares) are generally valued at the NAV reported by that investment company. ETF shares are valued at the most recent sale price or official closing price on the exchange on which they are traded. When a market quotation for a security is not readily available (which may include closing prices deemed to be unreliable because of the occurrence of a subsequent event), a valuation committee appointed by the Board may, in good faith, establish a value for the security in accordance with fair valuation procedures adopted by the Board. The Board reviews all fair value determinations typically at its regularly scheduled meetings. The types of securities for which such fair value pricing may be required include, but are not limited to: foreign securities, where a significant event occurs after the close of the foreign market on which such security principally trades that is likely to have changed the value of such security, or the closing value is otherwise deemed unreliable; securities of an issuer that has entered into a restructuring; securities whose trading has been halted or suspended; fixed-income securities that have gone into default and for which there is no current market value quotation; and securities that are restricted as to transfer or resale. The funds use a fair value model developed by an independent third party pricing service to price foreign equity securities on days when there is a certain percentage change in the value of a domestic equity security index, as such percentage may be determined by TAM from time to time. Valuing securities in accordance with fair value procedures involves greater reliance on judgment than valuing securities based on readily | | dollars using current exchange rates. Market quotations for securities prices may be obtained from automated pricing services. Shares of open-end funds (other than ETF shares) are generally valued at the net asset value per share reported by that investment company. ETF shares are valued at the most recent sale price or official closing price on the exchange on which they are traded. When a market quotation for a security is not readily available (which may include closing prices deemed to be unreliable because of the occurrence of a subsequent event), a valuation committee appointed by the Board of Trustees may, in good faith, establish a value for the security in accordance with fair valuation procedures adopted by the Board. The types of securities for which such fair value pricing may be required include, but are not limited to: foreign securities, where a significant event occurs after the close of the foreign market on which such security principally trades that is likely to have changed the value of such security, or the closing value is otherwise deemed unreliable; securities of an issuer that has entered into a restructuring; securities whose trading has been halted or suspended; fixed-income securities that have gone into default and for which there is no current market value quotation; and securities that are restricted as to transfer or resale. The portfolios use a fair value model developed by an independent third party pricing service to price foreign equity securities on days when there is a certain percentage change in the value of a domestic equity security index, as such percentage may be determined by TAM from time to time. | | be obtained from automated pricing services. Shares of open-end funds (other than ETF shares) are generally valued at the NAV reported by that investment company. ETF shares are valued at the most recent sale price or official closing price on the exchange on which they are traded. When a market quotation for a security is not readily available (which may include closing prices deemed to be unreliable because of the occurrence of a subsequent event), a valuation committee appointed by the Board may, in good faith, establish a value for the security in accordance with fair valuation procedures adopted by the Board. The Board reviews all fair value determinations typically at its regularly scheduled meetings. The types of securities for which such fair value pricing may be required include, but are not limited to: foreign securities, where a significant event occurs after the close of the foreign market on which such security principally trades that is likely to have changed the value of such security, or the closing value is otherwise deemed unreliable; securities of an issuer that has entered into a restructuring; securities whose trading has been halted or suspended; fixed-income securities that have gone into default and for which there is no current market value quotation; and securities that are restricted as to transfer or resale. The funds use a fair value model developed by an independent third party pricing service to price foreign equity securities on days when there is a certain percentage change in the value of a domestic equity security index, as such percentage may be determined by TAM from time to time. Valuing securities in accordance with fair value procedures involves greater reliance on judgment than |
- 177 -
| | | | | | |
| | | Target Feeder Funds | | Target Master Portfolios | | Destination Funds |
| | available market quotations. The valuation committee makes fair value determinations in good faith in accordance with the funds’ valuation procedures. Fair value determinations can also involve reliance on quantitative models employed by a fair value pricing service. There can be no assurance that a fund could obtain the fair value assigned to a security if it were to sell the security at approximately the time at which the fund determines its NAV. | | Valuing securities in accordance with fair value procedures involves greater reliance on judgment than valuing securities based on readily available market quotations. The valuation committee makes fair value determinations in good faith in accordance with the portfolios’ valuation procedures. Fair value determinations can also involve reliance on quantitative models employed by a fair value pricing service. There can be no assurance that a portfolio could obtain the fair value assigned to a security if it were to sell the security at approximately the time at which the portfolio determines its NAV per share. | | valuing securities based on readily available market quotations. The valuation committee makes fair value determinations in good faith in accordance with the funds’ valuation procedures. Fair value determinations can also involve reliance on quantitative models employed by a fair value pricing service. There can be no assurance that a fund could obtain the fair value assigned to a security if it were to sell the security at approximately the time at which the fund determines its NAV. |
| | | |
| Dividends and Distributions | | Each fund intends to distribute all or substantially all of its net investment income and net capital gains, if any, to its shareholders each year. Dividends will be reinvested in additional shares unless you elect to take your dividends in cash. Each fund generally pays any distributions of net capital gains annually. Each fund generally pays any dividends from net investment income quarterly, except that Transamerica Partners Government Money Market and Transamerica Partners Institutional Government Money Market declare dividends daily and pay dividends monthly. If necessary, each fund may make distributions at other times as well. | | Each portfolio will allocate at least annually to each investor the investor’s distributive share of the portfolio’s net investment income, net realized capital gains, and any other items of income, gain, loss, deduction, or credit in a manner intended to comply with the Internal Revenue Code of 1986, as amended, and applicable Treasury Regulations. | | Each fund intends to distribute all or substantially all of its net investment income and net capital gains, if any, to its shareholders each year. Dividends will be reinvested in additional shares unless you elect to take your dividends in cash. Each fund generally pays any distributions of net capital gains annually. Each fund generally pays any dividends from net investment income annually, except for: (i) Transamerica Government Money Market which declares dividends daily and pays dividends from net investment income monthly; (ii) Transamerica High Yield Bond which declares dividends daily and pays any dividends from net investment income monthly; and (iii) Transamerica Intermediate Bond which pays any dividends from net investment income monthly. If necessary, each fund may make distributions at other times as well. A fund will not generally have to pay income tax on amounts it distributes to shareholders. Shareholders will generally be taxed on distributions (other than any distributions treated as a return of capital), whether such distributions are paid in cash or reinvested in additional shares. |
- 178 -
ADDITIONAL INFORMATION ABOUT THE DESTINATION FUNDS
Investment Manager
Transamerica Asset Management, Inc. (“TAM” ), located at 1801 California Street, Suite 5200, Denver, CO 80202, serves as investment manager for Transamerica Funds. TAM provides continuous and regular investment management services.
For each of the Destination Funds, TAM currently acts as a “manager of managers” and hires investment sub-advisers to furnish investment advice and recommendations and has entered into a sub-advisory agreement with each fund’s sub-adviser. In acting as a manager of managers, TAM provides investment management services that include, without limitation, selection, proactive oversight and monitoring of sub-advisers, daily monitoring of the sub-advisers’ buying and selling of securities for the funds and regular review and evaluation of sub-adviser performance and adherence to investment style and process. TAM’s management services include, among other things, the provision of supervisory, compliance and administrative services to each fund. More information on the investment management services rendered by TAM is included in the SAI. TAM is paid investment management fees for its service as investment manager to each fund. These fees are calculated on the average daily net assets of each fund.
TAM has been a registered investment adviser since 1996. As of December 31, 2015, TAM has approximately $74 billion in total assets under management. Although TAM is also registered as a commodity pool operator under the Commodity Exchange Act, the Destination Funds are operated by TAM pursuant to an exclusion from registration as a commodity pool operator under the Commodity Exchange Act.
TAM is directly owned by Transamerica Premier Life Insurance Company (77%) (“TPLIC”) and AUSA Holding, LLC (23%) (“AUSA”), both of which are indirect, wholly owned subsidiaries of Aegon N.V. TPLIC is owned by Commonwealth General Corporation (“Commonwealth”). Commonwealth and AUSA are wholly owned by Transamerica Corporation, a financial services holding company whose primary emphasis is on life and health insurance, and annuity and investment products. Transamerica Corporation is owned by The Aegon Trust, which is owned by Aegon International B.V., which is owned by Aegon N.V., a Netherlands corporation, and a publicly traded international insurance group.
TAM acts as a manager of managers for the Destination Funds pursuant to an exemptive order from the U.S. Securities and Exchange Commission (“SEC”) (Release IC- 23379 dated August 5, 1998). TAM has responsibility, subject to oversight by the Board of Trustees, to, among other matters, oversee and monitor sub-advisers, recommend selection of sub-advisers and recommend changes to sub-advisers where it believes appropriate or advisable. The exemptive order permits TAM, subject to certain conditions including the approval of the Board of Trustees, but without the approval of the applicable fund’s shareholders, to:
| | (1) | employ a new unaffiliated sub-adviser for a fund pursuant to the terms of a new investment sub-advisory agreement, either as a replacement for an existing sub-adviser or as an additional sub-adviser; |
| | (2) | materially change the terms of any sub-advisory agreement; and |
- 179 -
| | (3) | continue the employment of an existing sub-adviser on sub-advisory contract terms where a contract has been assigned because of a change of control of the sub-adviser. |
Pursuant to the exemptive order, each Destination Fund has agreed to provide certain information about new sub-advisers and new sub-advisory agreements to its shareholders.
A discussion regarding the basis of the Destination Board’s most-recent approval of the investment management agreement with TAM will be available in the Destination Funds’ annual report to shareholders for the fiscal year ended October 31, 2016.
Sub-Advisers
Pursuant to an Investment Sub-advisory Agreement between TAM and each sub-adviser on behalf of the respective Destination Fund, each sub-adviser shall make investment decisions, buy and sell securities for the fund, conduct research that leads to these purchase and sale decisions, and pay broker-dealers a commission for these trades (which can include payments for research and brokerage services).
Each sub-adviser receives compensation from TAM.
Aegon USA Investment Management, LLC, located at 4333 Edgewood Road NE, Cedar Rapids, Iowa 52499, serves as sub-adviser for Transamerica Government Money Market, Transamerica High Yield Bond and Transamerica Intermediate Bond.
Boston Advisors, LLC, located at 1 Liberty Square, Boston, Massachusetts, 02109, serves as sub-adviser for Transamerica Small Cap Value.
Quantum Capital Management, located at 311 California Street, Suite 510, San Francisco, California 94104, serves as sub-adviser for Transamerica Mid Cap Growth.
Ranger Investment Management, L.P., located at 2828 N. Harwood Street #1900, Dallas, Texas 75201, serves as sub-adviser for Transamerica Small Cap Growth.
Systematic Financial Management, L.P., located at 300 Frank W. Burr Boulevard, Glenpointe East, 7th Floor, Teaneck, New Jersey 07666, serves as sub-adviser for Transamerica Small Cap Core.
Thompson, Siegel & Walmsley LLC, located at 6641 West Broad Street, Suite 600, Richmond, Virginia, 23320, serves as sub-adviser for Transamerica International Equity and Transamerica Mid Cap Value Opportunities.
A discussion regarding the basis of the Destination Board’s most-recent approval of the investment sub-advisory agreements with each of the sub-advisers will be available in the Destination Funds’ annual report to shareholders for the fiscal year ended October 31, 2016.
Distributor and Transfer Agent
Transamerica Capital, Inc. (“TCI”), located at 1801 California Street, Suite 5200, Denver, Colorado 80202, is appointed as principal underwriter and distributor in connection with the offering and sale of shares of each Destination Fund. TCI is an affiliate of TAM. TCI offers the shares of an agency or “best efforts” basis under which a Destination Fund issues only the number of shares actually sold. Shares of each Destination Fund are continuously offered by TCI.
Transamerica Fund Services, Inc. (“TFS”), located at 1801 California Street, Suite 5200, Denver, Colorado 80202, serves as transfer agent, withholding agent and dividend disbursing agent for each Destination Fund. TFS is an affiliate of TAM. As transfer agent, TFS maintains an account for each shareholder of a Destination Fund and performs other transfer agency functions. TFS has outsourced the provision of certain transfer agency services to Boston Financial Data Services, Inc., located at 2000 Crown Colony Drive, Quincy, Massachusetts 02169.
Each Destination Fund compensates TCI and TFS for their services.
Certain officers and Trustees of the Destination Funds are also officers and/or directors of TAM, TCI and TFS.
- 180 -
Disclosure of Portfolio Holdings
A detailed description of each Destination Fund’s policies and procedures with respect to the disclosure of each Destination Fund’s portfolio securities is available in the Destination Funds’ statement of additional information. Each Destination Fund publishes all holdings on its website at www.transamerica.com approximately 15 days after the end of each calendar quarter. Such information generally remains online for 6 months, or as otherwise consistent with applicable regulations.
Transamerica Government Money Market files monthly a schedule of portfolio holdings with the SEC on Form N-MFP. The information filed on Form N-MFP is made available to the public by the SEC 60 days after the end of the month to which the information pertains. A schedule of portfolio holdings for Transamerica Government Money Market is posted each month to the fund’s website in accordance with Rule 2a-7(c)(12) under the 1940 Act.
Buying, Selling and Exchanging Shares of Destination Fund Shares
Buying Shares. Investors may purchase shares of the Destination Funds at the “offering price” of the shares, which is the net asset value per share (“NAV”). Please note that purchase requests initiated through an automated service that exceed $50,000 per day may be rejected and must be submitted by check or via bank wire.
Please refer to the retirement plan documents for information on how to purchase Class R and R4 shares of the Destination Funds and any fees that may apply.
Class I3 shares are only available to certain funds of funds, registered and unregistered insurance company separate accounts and collective investment trusts.
Transamerica Funds must receive your payment within three business days after your order is accepted.
Transamerica Funds or its agents may reject a request for purchase of shares at any time, in whole or in part, including any purchase under the exchange privilege.
Each Destination Fund reserves the right to make additional exceptions or otherwise to modify the foregoing policies at any time.
By Check
| | • | | Make your check payable and send to Transamerica Fund Services, Inc. |
| | • | | If you are purchasing shares in an existing account(s), please reference your account number(s) and the Transamerica fund(s) in which you wish to invest. If you do not specify the fund(s) in which you wish to invest, and your referenced account is invested in one fund, your check will be deposited into such fund. |
| | • | | Redemption proceeds will be withheld for 15 calendar days from the date of purchase for funds to clear. |
| | • | | Transamerica Funds does not accept cash, money orders, traveler’s checks, credit card convenience checks, or starter checks without pre-printed information. Cashier’s checks and third-party checks may be accepted, subject to approval by Transamerica Funds. We reserve the right to reject or accept any form of payment. Any unacceptable forms of payment will be returned. |
| | • | | If you are opening a new account, send your completed application along with your check. |
By Automatic Investment Plan
| | • | | With an Automatic Investment Plan (“AIP”), a level dollar amount is invested monthly and payment is deducted electronically from your bank account. Due to your bank’s requirements, please allow up to 30 days for your AIP to begin. Investments may be made between the 3rd and 28th of each month only, and will occur on the 15th if no selection is made. Call Customer Service for information on how to establish an AIP or visit our website to obtain an AIP request form. |
By Telephone
| | • | | You may request an electronic transfer of funds from your bank account to your Transamerica Funds account. The electronic bank link option must be established in advance before Automated Clearing House (“ACH”) purchases will be accepted. Call Customer Service or visit our website at www.transamerica.com for information on how to establish an electronic bank link. Due to your bank’s requirements, please allow up to 30 days to establish this option. |
- 181 -
Through an Authorized Dealer
| | • | | If your dealer has already established your account for you, no additional documentation is needed. Call your dealer to place your order. Transamerica Funds must receive your payment within three business days after your order is accepted. |
By Internet
| | • | | You may request an electronic transfer of funds from your bank account to your Transamerica Funds account. The electronic bank link option must be established in advance before ACH purchases will be accepted. Call Customer Service or visit our website at www.transamerica.com for information on how to establish an electronic bank link. |
By Payroll Deduction
| | • | | You may have money transferred regularly from your payroll to your Transamerica Funds account. Call Customer Service to establish this option. |
By Wire Transfer
| | • | | You may request that your bank wire funds to your Transamerica Funds account (note that your bank may charge a fee for such service). You must have an existing account to make a payment by wire transfer. Ask your bank to send your payment to: |
State Street Bank and Trust Company, Boston, MA, ABA#011000028
Credit: Transamerica Funds Acct #00418533
Ref: Shareholder name, Transamerica fund and account numbers.
| | • | | Shares will be purchased at the next determined public offering price after receipt of your wire if you have supplied all other required information. |
Other Information
If your check, draft or electronic transfer is returned unpaid by your bank, you will be charged a fee of $20 for each item that has been returned.
Transamerica Funds reserves the right to terminate your electronic draft privileges if the drafts are returned unpaid by your bank.
Transamerica Funds or its agents may reject a request for purchase of shares at any time, in whole or in part, in its discretion for any reason at any time, and is not obligated to provide notice before rejecting or canceling an order, including, but not limited to, any purchase under the exchange privilege and any purchase request that does not include an investment representative or an approved broker-dealer.
Selling Shares. Shares may be sold (or “redeemed”) on any day the New York Stock Exchange is open for business. Proceeds from the redemption of shares will usually be sent to the redeeming shareholder within three business days after receipt in good order of a request for redemption. However, Transamerica Funds has the right to take up to seven days to pay redemption proceeds, and may postpone payment under certain circumstances, as authorized by law.
If you have recently purchased your shares by check or electronic funds transfer, your redemption payment may be delayed until the Fund is reasonably satisfied that the check or electronic funds transfer has cleared (which may take up to 15 calendar days). This delay may be avoided if you purchase shares by Federal Funds wire or certified check.
Please note that redemption requests greater than $50,000 per day must be submitted in writing. In addition, amounts greater than $50,000 cannot be sent via ACH (check or federal funds wire only). Additionally, requests totaling more than $100,000 must be in writing with an original signature guarantee for all shareholders.
- 182 -
The electronic bank link option must be established in advance for payments made electronically to your bank such as ACH or expedited wire redemptions. Call Customer Service to verify this feature is in place on your account or to obtain information on how to establish the electronic bank link.
Shares are redeemed at NAV.
To request your redemption and receive payment by:
Direct Deposit – ACH
| | • | | You may request an “ACH redemption” in writing, by phone or by internet access to your account. Payment should usually be received by your bank account 2-4 banking days after your request is received in good order. Transamerica Funds does not charge for this payment option. Certain IRAs and qualified retirement plans may not be eligible via the internet. |
Direct Deposit – Wire
| | • | | You may request an expedited wire redemption in writing or by phone. The electronic bank link must be established in advance. Otherwise, an original signature guarantee will be required. Wire redemptions have a minimum of $1,000 per wire. Payment should be received by your bank account the next banking day after your request is received in good order. Transamerica Funds charges $10 for this service. Your bank may charge a fee as well. |
Check to Address of Record
| | • | | Written Request – Send a letter requesting a withdrawal to Transamerica Funds. Specify the fund, account number, and dollar amount or number of shares you wish to redeem. Be sure to include all shareholders’ signatures and any additional documents, as well as an original signature guarantee(s) if required. If you are requesting a distribution from an IRA, federal tax withholding of 10% will apply unless you elect otherwise. If you elect to withhold, the minimum tax withholding rate is 10%. |
| | • | | Telephone or Internet Request – You may request your redemption by phone or internet. Certain IRAs and qualified retirement plans may not be eligible. |
Check to Another Party/Address
| | • | | This request must be in writing, regardless of amount, signed by all account owners with an original signature guarantee. |
Systematic Withdrawal Plan (by Direct Deposit – ACH or Check)
| | • | | You can establish a Systematic Withdrawal Plan (“SWP”) either at the time you open your account or at a later date. Call Customer Service for information on how to establish a SWP, or visit our website to obtain the appropriate form to complete. |
Through an Authorized Dealer
| | • | | You may redeem your shares through an authorized dealer (they may impose a service charge). Contact your Registered Representative or call Customer Service for assistance. |
Your Request to Sell Your Shares and Receive Payment May Be Subject to:
| | • | | The type of account you have and if there is more than one shareholder. |
| | • | | The dollar amount you are requesting; redemptions over $50,000 must be in writing and those redemptions totaling more than $100,000 require a written request with an original signature guarantee for all shareholders on the account. |
| | • | | A written request and original signature guarantee may be required if there have been recent changes made to your account (such as an address change) or other such circumstances. For your protection, if an address change was made in the last 10 days, Transamerica Funds requires a redemption request in writing, signed by all account owners with an original signature guarantee. |
| | • | | When redeeming all shares from an account with an active AIP, your AIP will automatically be stopped. Please contact Customer Service if you wish to re-activate your AIP. |
- 183 -
| | • | | Each Fund reserves the right to refuse a telephone redemption request if it is believed it is advisable to do so. The telephone redemption option may be suspended or terminated at any time without advance notice. |
| | • | | Redemption proceeds will be withheld for 15 calendar days from the date of purchase for funds to clear. |
| | • | | Shares will normally be redeemed for cash, although each Fund retains the right to redeem its shares in kind. Please see the Destination Funds’ statement of additional information for more details. |
| | • | | If you request that a withdrawal check be delivered overnight, a $20 overnight fee will be charged; for Saturday delivery, a $30 overnight fee will be charged. |
Please see additional information relating to original signature guarantee later in this Proxy Statement/Prospectus.
Involuntary Redemptions
Each Destination Fund reserves the right, to the fullest extent permitted by law, to close your account if the account value falls below the fund’s minimum account balance, including solely due to declines in NAV, or you are deemed to engage in activities that are illegal (such as late trading) activity that is believed to be detrimental to the Fund (such as market timing), or other potential criminal or fraudulent activity.
Exchanging Shares. You may request an exchange in writing, by phone, or by accessing your account through the internet.
| | • | | You can exchange shares in one fund for shares in the same class of another fund. |
| | • | | An exchange is treated as a redemption of a fund’s shares, followed by a purchase of the shares of the fund into which you exchanged. Prior to making exchanges into a fund that you do not own, please read the prospectus for that fund carefully. |
| | • | | If you exchange all your shares to a new fund, any active systematic plan that you maintain with Transamerica Funds will also carry over to this new fund unless otherwise instructed. |
| | • | | Transamerica Funds reserves the right to modify or terminate the exchange privilege at any time upon 60 days’ written notice. |
| | • | | Transamerica Funds reserves the right to deny any exchange request involving transactions between classes of shares. Please review your individual circumstances with your financial professional. |
| | • | | The minimum exchange amount may be waived with respect to transactions in omnibus accounts maintained on behalf of certain 401(k) and other retirement plans. |
| | • | | For Class R and R4 shares, if authorized by your plan, you can request an exchange of your shares in one fund for corresponding shares of another fund. Please refer to your plan’s documents for additional information. An exchange is treated as a redemption of a fund’s shares followed by a purchase of the shares of the fund into which you exchanged. Prior to making exchanges into a fund you do not own, please read the prospectus of that fund. |
Converting Shares
Please contact your financial adviser or Customer Service for conversion instructions.
A conversion between share classes of the same fund is a nontaxable event.
If you convert from one class of shares to another, the transaction will be based on the respective NAVs of the two classes on the trade date for the conversion. Consequently, a conversion may provide you with fewer shares or more shares than you originally owned, depending on that day’s NAV. At the time of conversion, the total dollar value of your “old” shares will equal the total dollar value of your “new” shares. However, subsequent share price fluctuations may decrease or increase the total dollar value of your “new” shares compared with that of your “old” shares.
- 184 -
Features and Policies
Customer Service
Occasionally, Transamerica Funds experiences high call volume due to unusual market activity or other events that may make it difficult for you to reach a Customer Service Representative by telephone. If you are unable to reach Transamerica Funds by telephone, please consider visiting our website at www.transamerica.com.
You may also send instructions by mail, by fax, or by using our automated phone system at 1-888-233-4339.
Uncashed Checks Issued on Your Account
If any check Transamerica Funds issues is returned by the Post Office as undeliverable, or remains outstanding (uncashed) for six months, we reserve the right to reinvest check proceeds back into your account at the NAV next calculated after reinvestment. If applicable, we will also change your account distribution option from cash to reinvest. Interest does not accrue on amounts represented by uncashed checks. In case we are unable to reinvest check proceeds in the original funds that you held, for example, if a fund has been liquidated or is closed to new investments, we reserve the right to reinvest the proceeds in Transamerica Money Market.
Minimum Dividend Check Amounts
To control costs associated with issuing and administering dividend checks, we reserve the right not to issue checks under a specified amount. For accounts with the cash by check dividend distribution option, if the dividend payment total is less than $10, the distribution will be reinvested into the account and no check will be issued.
Minimum Account Balance
Due to the proportionately higher cost of maintaining customer fund accounts with balances below the stated minimums for each class of shares, Transamerica Funds reserves the right to close such accounts or assess an annual fee on such fund accounts to help offset the costs associated with maintaining the account. Transamerica Funds generally provides a 60-day notification to the address of record prior to assessing a minimum fund account fee, or closing any fund account. The following describes the fees assessed against fund accounts with balances below the stated minimum:
| | |
| Account Balance (per fund account) | | Fee Assessment (per fund account) |
| If your balance is below $1,000 per fund account, including solely due to declines in NAV | | $25 annual fee assessed, until balance reaches $1,000 |
No fees will be charged on:
| | • | | accounts opened within the preceding 12 months |
| | • | | accounts with an active monthly Automatic Investment Plan or payroll deduction ($50 minimum per fund account) |
| | • | | accounts owned by an individual that, when combined by Social Security Number, have a balance of $5,000 or more |
| | • | | accounts owned by individuals in the same household (by address) that have a combined balance of $5,000 or more |
| | • | | accounts for which Transamerica Funds in its discretion has waived the minimum account balance requirements |
| | • | | UTMA/UGMA accounts (held at Transamerica Funds) |
| | • | | State Street Custodial Accounts (held at Transamerica Funds) |
| | • | | Coverdell ESA accounts (held at Transamerica Funds) |
| | • | | Omnibus and Network Level 3 accounts |
| | • | | While there is currently no minimum account size for maintaining a Class I share account, the funds reserve the right, without prior notice, to establish a minimum amount required to maintain an account. |
- 185 -
Telephone Transactions
Transamerica Funds and its transfer agent, Transamerica Fund Services, Inc. (“TFS”), are not liable for complying with telephone instructions that are deemed by them to be genuine. Transamerica Funds and TFS will employ reasonable procedures to help ensure telephone instructions are genuine. These procedures may include requiring personal identification, providing written confirmation of transactions, and tape recording conversations. In situations where Transamerica Funds or TFS reasonably believe they were acting on genuine telephone instructions, you bear the risk of loss. Transamerica Funds reserves the right to modify the telephone redemption privilege at any time.
Retirement and ESA State Street Account Maintenance Fees
Retirement plan and Coverdell ESA State Street accounts are subject to an annual custodial fee of $15 per fund account, with a maximum fee of $30 per Social Security Number. For example, an IRA in two fund accounts would normally be subject to a $30 annual custodial fee. The fee is waived if the total of the retirement plan and ESA account(s)’ value per Social Security Number is more than $50,000.
Professional Fees
Your financial professional may charge a fee for his or her services. This fee will be in addition to any fees charged by Transamerica Funds. Your financial professional will answer any questions that you may have regarding such fees.
Signature Guarantee
An original signature guarantee assures that a signature is genuine so that you are protected from unauthorized account transactions. Notarization is not an acceptable substitute. Acceptable guarantors only include participants in the Securities Transfer Agents Medallion Program (“STAMP2000”). Participants in STAMP2000 may include financial institutions such as banks, savings and loan associations, trust companies, credit unions, broker-dealers, and member firms of a national securities exchange.
An original signature guarantee is typically required if any of the following is applicable:
| | • | | You request a redemption or distribution transaction totaling more than $100,000 or, in the case of an IRA with a market value in excess of $100,000, you request a custodian to custodian transfer. |
| | • | | You would like a check made payable to anyone other than the shareholder(s) of record. |
| | • | | You would like a check mailed to an address which has been changed within 10 days of the redemption request. |
| | • | | You would like a check mailed to an address other than the address of record. |
| | • | | You would like your redemption proceeds wired to a bank account other than a bank account of record. |
| | • | | You are adding or removing a shareholder from an account. |
| | • | | You are changing ownership of an account. |
| | • | | When establishing an electronic bank link, if the Transamerica Funds’ account holder’s name does not appear on the check. |
| | • | | Transactions requiring supporting legal documentation. |
The Funds reserve the right to require an original signature guarantee under other circumstances or to reject or delay a redemption on certain legal grounds.
An original signature guarantee may be refused if any of the following is applicable:
| | • | | It does not appear valid or in good form. |
| | • | | The transaction amount exceeds the surety bond limit of the signature guarantee. |
| | • | | The guarantee stamp has been reported as stolen, missing or counterfeit. |
- 186 -
Note: For certain maintenance and non-financial requests, Transamerica Funds requires a Signature Validation Program Stamp for your protection. When an institution provides a Signature Validation Program Stamp, it assures Transamerica Funds that the signature and instructions are yours and that you have the authority to provide the instruction(s) contained within the request. A notary’s seal cannot serve as an alternative to a Signature Validation Program Stamp.
Electronic Signatures
Transamerica may accept electronic signatures in certain circumstances. Please contact Customer Service (1-888-233-4339) to see if you are eligible for this feature.
Paperless Legal Program
Transamerica may accept requests to transfer or redeem accounts having an original signature guarantee without the necessity to include additional legal documentation. The shareholder should contact their signature guarantor regarding all documentation that may be required to obtain an original signature guarantee.
Employer Sponsored Accounts
If you participate in an employer sponsored retirement plan and wish to make an allocation change to your current fund selection, you or your financial professional must notify Transamerica Funds by phone or in writing. Please also remember to inform your employer of the change(s) to your fund allocation. Documentation for allocations submitted online or in writing from your employer will be used to allocate your contributions. This documentation will supersede all other prior instructions received from you or your financial professional. (Note: If you perform a partial or complete exchange to a new fund selection, your current fund allocation will remain unchanged for future contributions unless specified otherwise.)
E-Mail Communication
As e-mail communications may not be secure, and because we are unable to take reasonable precautions to verify your shareholder and transaction information, we cannot respond to account-specific requests received via e-mail. For your protection, we ask that all account specific requests be submitted only via telephone, mail or through the secure link on our website.
Reinvestment Privilege
Within a 90-day period after you sell your shares, you have the right to “reinvest” your money in any fund of the same class. You will not incur a new sales charge if you use this privilege within the allotted time frame. Any CDSC you paid on your shares will be credited to your account. To take advantage of the 90-day reinvestment privilege, a written request must accompany your investment check.
Statements and Reports
Transamerica Funds will send you a confirmation statement after every transaction that affects your account balance or registration, with the exception of systematic transactions or transactions necessary to assess account fees. Systematic transactions and fees will be shown on your next regularly scheduled quarterly statement. Information regarding these fee is disclosed in this Proxy Statement/Prospectus. Please review the confirmation statement carefully and promptly notify Transamerica Funds of any error. Information about the tax status of the prior year’s income dividends and capital gains distributions will be mailed to shareholders early each year.
Please retain your statements. If you require historical statements, Transamerica Funds may charge $10 per statement year up to a maximum of $50 per Social Security Number. Financial reports for the Funds, which include a list of the holdings, will be mailed twice a year to all shareholders.
eDelivery
By enrolling in eDelivery, you are notified via e-mail when shareholder documents are available for viewing on our website such as account statements, financial transaction confirmations, prospectuses, tax forms, and annual and semi-annual reports. With eDelivery, you can save time by receiving e-mail notifications days before documents might be received through the postal service; reduce clutter by reducing the amount of paper for filing, shredding, or recycling; lower environmental impact by cutting paper waste and transportation requirements; and enjoy added security by accessing your information electronically through our secure website link.
- 187 -
Once your account is established, visit our website at www.transamerica.com. Click on Resources, and select Individual Investor. When you have logged into your account, select the “Electronic Delivery” option and follow the simple enrollment steps provided.
Right to Terminate or Suspend Account Privileges
The Destination Fund may, in their discretion, limit or terminate trading activity by any person, group or account that each Destination Fund believes would be disruptive, even if the activity has not exceeded the policy described in this Proxy Statement/Prospectus. As part of the fund’s policy to detect and deter frequent purchases, redemptions and exchanges, the fund may review and consider the history of frequent trading activity in all accounts in the Transamerica Funds known to be under common ownership or control. The fund may send a written warning to a shareholder that it believes may be engaging in disruptive or excessive trading activity; however, the fund reserves the right to suspend or terminate the ability to purchase or exchange shares, with or without warning, for any account that the fund determines, in the exercise of its discretion, has engaged in such trading activity.
Market Timing/Excessive Trading
Some investors try to profit from various short-term or frequent trading strategies known as market timing. Examples of market timing include switching money into funds when their share prices are expected to rise and taking money out when their share prices are expected to fall, and switching from one fund to another and then back again after a short period of time. As money is shifted in and out, a fund may incur expenses for buying and selling securities. Excessive purchases, redemptions or exchanges of fund shares may disrupt portfolio management, hurt fund performance and drive fund expenses higher. For example, a fund may be forced to liquidate investments as a result of short-term trading and incur increased brokerage costs or realize capital gains without attaining any investment advantage. These costs are generally borne by all shareholders, including long-term investors who do not generate these costs.
The Board of Trustees has approved policies and procedures that are designed to discourage market timing or excessive trading, which include limitations on the number of transactions in fund shares. If you intend to engage in such practices, we request that you do not purchase shares of any of the funds. Each fund reserves the right to reject any request to purchase shares, including purchases in connection with an exchange transaction, which the fund reasonably believes to be in connection with market timing or excessive trading.
While the funds discourage market timing and excessive short-term trading, the funds cannot always recognize or detect such trading, particularly if it is facilitated by financial intermediaries or done through Omnibus Account arrangements.
The funds’ distributor has entered into agreements with intermediaries requiring the intermediaries to provide certain information to help identify harmful trading activity and to prohibit further purchases or exchanges by a shareholder identified as having engaged in excessive trading. There is no guarantee that the procedures used by financial intermediaries will be able to curtail frequent, short-term trading activity. For example, shareholders who seek to engage in frequent, short-term trading activity may use a variety of strategies to avoid detection, and the financial intermediaries’ ability to deter such activity may be limited by the capabilities of operational and information systems. Due to the risk that the funds and financial intermediaries may not detect all harmful trading activity, it is possible that shareholders may bear the risks associated with such activity.348
Orders to purchase, redeem or exchange shares forwarded by certain omnibus accounts with Transamerica Funds will not be considered to be market timing or excessive trading for purposes of Transamerica Funds’ policies. However, the market timing and excessive trading policies of these omnibus firms or plans may apply to transactions by the underlying shareholders.
Reallocations in underlying series of Transamerica Funds by an Asset Allocation Fund that invests in other series of Transamerica Funds in furtherance of a fund’s objective are not considered to be market timing or excessive trading.
Additional Information
This Proxy Statement/Prospectus and the SAI provide information concerning the funds that you should consider in determining whether to purchase shares of a fund. A fund may make changes to this information from time to time. Each fund’s investment objective may be changed by the Board without holder approval. Each fund’s investment strategies and policies may be changed from time to time without holder approval, unless specifically stated otherwise in this Proxy Statement/Prospectus or in the SAI.
- 188 -
A fund that has a policy of investing, under normal circumstances, at least 80% of its net assets (plus the amount of any borrowings for investment purposes) in the particular type of securities implied by its name will provide its shareholders with at least 60 days’ prior written notice before making changes to such policy. Such notice will comply with the conditions set forth in any applicable SEC rules then in effect.
Neither this Proxy Statement/Prospectus nor the SAI is intended to give rise to any contract rights or other rights of any holder, other than any rights conferred explicitly by federal or state securities laws that may not be waived.
The funds enter into contractual arrangements with various parties, including the funds’ investment manager, who provide services to the funds. Holders are not parties to, or intended (or “third-party”) beneficiaries of those contractual arrangements.
To the extent authorized by law, the funds reserve the right to discontinue offering shares at any time, to merge or liquidate a class of shares or to cease operations entirely.
Abandoned or Unclaimed Property
Every state has unclaimed property laws that generally provide for escheatment to the state of unclaimed property under various circumstances. In addition to the state unclaimed property laws, we may be required to escheat property pursuant to regulatory demand, finding, agreement or settlement. To help prevent such escheatment, it is important that you keep your contact and other information on file with us up to date, including the names, contact information and identifying information for customers, beneficiaries and other payees. Such updates should be communicated in a form and manner satisfactory to us.
Sending Forms and Transaction Requests in Good Order
We cannot process your requests for transactions relating to the funds until they are received in good order. “Good order” means the actual receipt of the instructions relating to the requested transaction in writing (or, when appropriate, by telephone or electronically), along with all forms, information and supporting legal documentation necessary to effect the transaction. This information and documentation generally includes, to the extent applicable to the transaction: your completed application; the transaction amount (in dollars, shares or percentage terms); the names, fund and account number(s) and allocations to and/or from the fund accounts affected by the requested transaction; the signatures of all owners (exactly as registered on the account) if necessary; Social Security Number or Taxpayer I.D.; and any other information or supporting documentation that we may require, including any spousal or joint owner’s consents and signature guarantees. With respect to purchase requests, “good order” also generally includes receipt of sufficient funds to effect any purchase. We may, in our sole discretion, determine whether any particular transaction request is in good order, and we reserve the right to change or waive any good order requirements at any time. “Received” or receipt in good order generally means that everything necessary must be received by the funds, at our mailing address specified in this Proxy Statement/Prospectus. We reserve the right to reject electronic transactions that do not meet our requirements.
Net Asset Value. The NAV of each fund (or class thereof) is calculated by taking the value of its net assets and dividing by the number of shares of the fund (or class) that are then outstanding.
The Board has approved procedures to be used to value the funds’ securities for purposes of determining the funds’ NAV. The valuation of the securities of the funds is determined in good faith by or under the direction of the Board. While the Board has primary responsibility to shareholders for valuation of portfolio securities, the Board has delegated certain valuation functions for the funds to TAM.
In general, securities and other investments (including shares of ETFs) are valued based on market prices at the close of regular trading on the NYSE. Fund securities (including shares of ETFs) listed or traded on domestic securities exchanges or the NASDAQ/NMS, including dollar-denominated foreign securities or ADRs, are valued at the closing price on the exchange or system where the security is principally traded. With respect to securities traded on the NASDAQ/NMS, such closing price may be the last reported sale price or the NASDAQ Official Closing Price (“NOCP”). If there have been no sales for that day on the exchange or system where the security is
- 189 -
principally traded, then the value should be determined with reference to the last sale price, or the NOCP, if applicable, on any other exchange or system. If there have been no sales for that day on any exchange or system, a security is valued at the closing bid quotes on the exchange or system where the security is principally traded, or at the NOCP, if applicable. Foreign securities traded on U.S. exchanges are generally priced using last sale price regardless of trading activity. Securities traded over-the-counter are valued at the last bid price. The market price for debt obligations is generally the price supplied by an independent third party pricing service, which may use market prices or quotations or a variety of fair value techniques and methodologies. Short-term debt obligations that will mature in 60 days or less are valued at amortized cost, unless it is determined that using this method would not reflect an investment’s fair value. The prices that the fund uses may differ from the amounts that would be realized if the investments were sold and the differences could be significant, particularly for securities that trade in relatively thin markets and/or markets that experience extreme volatility. Foreign securities generally are valued based on quotations from the primary market in which they are traded, and are converted from the local currency into U.S. dollars using current exchange rates. Market quotations for securities prices may be obtained from automated pricing services. Shares of open-end funds (other than ETF shares) are generally valued at the NAV reported by that investment company. ETF shares are valued at the most recent sale price or official closing price on the exchange on which they are traded.
When a market quotation for a security is not readily available (which may include closing prices deemed to be unreliable because of the occurrence of a subsequent event), a valuation committee appointed by the Board may, in good faith, establish a value for the security in accordance with fair valuation procedures adopted by the Board. The Board reviews all fair value determinations typically at its regularly scheduled meetings. The types of securities for which such fair value pricing may be required include, but are not limited to: foreign securities, where a significant event occurs after the close of the foreign market on which such security principally trades that is likely to have changed the value of such security, or the closing value is otherwise deemed unreliable; securities of an issuer that has entered into a restructuring; securities whose trading has been halted or suspended; fixed-income securities that have gone into default and for which there is no current market value quotation; and securities that are restricted as to transfer or resale. The funds use a fair value model developed by an independent third party pricing service to price foreign equity securities on days when there is a certain percentage change in the value of a domestic equity security index, as such percentage may be determined by TAM from time to time.
Valuing securities in accordance with fair value procedures involves greater reliance on judgment than valuing securities based on readily available market quotations. The valuation committee makes fair value determinations in good faith in accordance with the funds’ valuation procedures. Fair value determinations can also involve reliance on quantitative models employed by a fair value pricing service. There can be no assurance that a fund could obtain the fair value assigned to a security if it were to sell the security at approximately the time at which the fund determines its NAV.
Distribution Arrangements
Each Destination Fund has adopted a Rule 12b-1 Plan under the Investment Company Act of 1940 (the “Plan”) for each class of shares.
The Plan permits the use of fund assets to pay distribution and service fees for the sale and distribution of its shares. These fees are used to pay TCI, broker-dealers, financial intermediaries and other professionals who sell fund shares and provide ongoing services to shareholders and to pay other marketing and advertising expenses.
Under the Plan, each fund pays the following distribution and service fees (as a percentage of the fund’s average daily net assets):
| | • | | Class R Shares – Up to 0.50% |
| | • | | Class R4 Shares – Up to 0.25% |
- 190 -
Because these fees are paid out of each fund’s assets on an ongoing basis, over time these fees will increase the cost of your investment and may cost you more than paying other types of sales charges.
Other Distribution and Service Arrangements. TCI, TAM and their affiliates may enter into arrangements with affiliated entities that provide administrative, recordkeeping and other services with respect to one or more of the funds. Payment for these services is made by TCI, TAM and their affiliates out of past profits and other available sources and may take the form of internal credit, recognition or cash payments. TCI, TAM and their affiliates may also enter into similar arrangements with unaffiliated entities.
TCI engages in wholesaling activities designed to support, maintain, and increase the number of financial intermediaries who sell shares of the funds. Wholesaling activities include, but are not limited to, recommending and promoting, directly or through intermediaries, the funds to financial intermediaries and providing sales training, retail broker support and other services. Payment for these activities is made by TCI, TAM and their affiliates out of past profits and other available sources, including revenue sharing payments from others.
TCI (in connection with, or in addition to, wholesaling services), TAM and fund sub-advisers, directly or through TCI, out of their past profits and other available sources, typically provide cash payments or non-cash compensation to unaffiliated brokers and other financial intermediaries who have sold shares of the funds, promote the distribution of the funds or render investor services to fund shareholders. Such payments and compensation are in addition to the sales charges, Rule 12b-1 Plan fees, service fees and other fees that may be paid, directly or indirectly, to such brokers and other financial intermediaries. These arrangements are sometimes referred to as “revenue sharing” arrangements. The amount of revenue sharing payments is substantial, may be substantial to any given recipient and may exceed the costs and expenses incurred by the recipient for any fund-related distribution or shareholder servicing activities. The presence of these payments and the basis on which an intermediary compensates its registered representatives or salespersons may create an incentive for a particular intermediary, registered representative or salesperson to highlight, feature or recommend the funds, at least in part, based on the level of compensation paid. Revenue sharing arrangements are separately negotiated. Revenue sharing payments are not an additional charge to the funds.
Such additional cash payments may be made to brokers and other financial intermediaries that provide services to the funds and/or fund shareholders, including (without limitation) shareholder servicing, marketing support and/or access to meetings and/or events, sales representatives and management representatives of the broker or other financial intermediaries. Cash compensation may also be paid to brokers and other financial intermediaries for inclusion of a fund on a sales list or mutual fund trading platform, including a preferred or select sales list or trading platform, in other sales programs, or as an expense reimbursement or compensation in cases where the broker or other financial intermediary provides services to fund shareholders. To the extent permitted by applicable law, TCI and other parties may pay or allow other incentives and compensation to brokers and other financial intermediaries. TCI, TAM and the other parties making these payments generally assess the advisability of continuing making these payments periodically.
These cash payments may take a variety of forms, including (without limitation) reimbursement of ticket charges, additional compensation based on sales, on-going fees for shareholder servicing and maintenance of investor accounts, and finder’s fees that vary depending on the fund or share class and the dollar amount of shares sold. Revenue sharing payments can be calculated: (i) as a percentage of gross or net sales for a particular period; (ii) as a percentage of gross or net assets under management; (iii) as a fixed or negotiated flat fee dollar amount; or (iv) based on a combination of any of these methods. These payments are made on a periodic basis, such as monthly or quarterly. During 2015, in general, payments calculated as a percentage of sales ranged from 5 basis points (0.05%) to 45 basis points (0.45%), payments calculated as a percentage of assets under management ranged from 2.5 basis points (0.025%) to 20 basis points (0.20%), and flat annual fees ranged from $25,000 to $75,000, which included at times payments for a series of meetings and/or events of other broker-dealers and banks.
As of December 31, 2015, TCI had revenue sharing agreements with more than 32 brokers and other financial intermediaries including, without limitation: Ameriprise Financial Services, Inc.; AXA Advisors, LLC; Bank of America – Merrill Lynch; Centaurus Financial, Inc.; Cetera Financial Group; Charles Schwab & Co Inc.;
- 191 -
Morgan StanleyWealth Management; Fifth Third Securities, Inc.; Hantz Financial Services, Inc.; J.P. Morgan Securities LLC; LPL Financial; National Financial Services LLC; PNC Investments LLC; Pershing LLC; Raymond James and Associates; Raymond James Financial Services; Suntrust Investments Services, Inc.; Transamerica Financial Advisors; UBS Financial Services, Inc.; US Bancorp Investments, Inc.; andWells Fargo Advisors, LLC. For the calendar year ended December 31, 2015, TCI paid approximately $11 million to various brokers and other financial intermediaries in connection with revenue sharing arrangements. TCI expects to have revenue sharing arrangements with a number of brokers and other financial intermediaries in 2016, including some or all of the foregoing brokers and financial intermediaries, among others, on terms similar to those discussed above.
For the same period, TCI received revenue sharing payments totaling approximately $1.12 million from various financial services firms for their participation in functions, events and meetings sponsored by TCI, including, without limitation, the following firms: American Century; American Funds Insurance Series; AQR Capital Management LLC; Aegon USA Investment Management, LLC; Barrow, Hanley, Mewhinney & Strauss, LLC; Belle Haven Investments L.P.; BlackRock Investment Management, LLC; Fidelity; Franklin Templeton; Janus Capital Management LLC; Jennison Associates LLC; JP Morgan Asset Management; Kayne Anderson Capital Advisors L.P.; Legg Mason Global Asset Allocation, LLC; Logan Circle Partners LP; MainStay Investments; MFS Investment Management; Milliman Financial Risk Management LLC; Morgan Stanley Investment Management; Morningstar Associates, LLC; OppenheimerFunds, Inc.; Pacific Investment Management Company LLC; PineBridge Investments LLC; Pioneer Investments; RidgeWorth; Rockefeller & CO, Inc.; RS Investments; Schroder Investment Management; Systematic Financial Management L.P.; Torray LLC; Thompson, Siegel &Walmsley LLC; Vanguard;Waddell and Reed Companies; andWellington Management Company LLP.
As of December 31, 2015, TAM made revenue sharing payments to approximately three financial intermediaries, the most sizeable of which were to Universal Life Insurance Company. For the same period, TAM did not receive any revenue sharing payments from financial services firms.
TAM also serves as investment manager to certain funds of funds that are underlying investment options for Transamerica insurance products. TCI and its affiliates make revenue sharing payments to, or receive revenue sharing payments from, affiliates of certain underlying unaffiliated funds within Transamerica insurance products for the provision of services to investors and distribution activities. These amounts are in addition to any revenue sharing programs described above with respect to mutual fund distributors. A financial intermediary may receive both mutual fund-related and insurance-related revenue sharing payments.
From time to time, TCI, its affiliates and/or TAM and/or fund sub-advisers may also, to the extent permitted by applicable law, pay non-cash compensation or revenue sharing to brokers and other financial intermediaries and their sales representatives in the form of, for example: (i) occasional gifts or prizes; (ii) occasional meals, tickets or other entertainment; and/or (iii) ad hoc sponsorship support of broker marketing events, programs, sales contests, promotions or other activities. Such non-cash compensation may also include, in part, assistance with the costs and expenses associated with travel, lodging, and educational sales and promotional meetings, seminars, programs and conferences, entertainment and meals to the extent permitted by law. TCI and TAM may also make payments in connection with the sponsorship by Transamerica or its affiliates of special events which may be attended by brokers and other financial intermediaries. Such non-cash compensation is in addition to the overall revenue sharing arrangements described above.
The non-cash compensation to sales representatives and compensation or reimbursement received by brokers and other financial intermediaries through sales charges, other fees payable from the funds, and/or revenue sharing arrangements for selling shares of the funds may be more or less than the overall compensation or reimbursement on similar or other products and may influence your broker or other financial intermediary to present and recommend the funds over other investment options available in the marketplace. In addition, depending on the arrangements in place at any particular time, your broker or other financial intermediary may have a financial incentive for recommending a particular class of fund shares over other share classes.
- 192 -
Shareholders may obtain more information about these arrangements, including the conflicts of interests that such arrangements may create, from their brokers and other financial intermediaries, and should so inquire if they would like additional information. Intermediaries may categorize and disclose these arrangements to their clients and to members of the public in a manner different from the disclosures in this prospectus and the SAI. A shareholder should ask his/her broker or financial intermediary how he/she will be compensated for investments made in the funds. Revenue sharing payments, as well as payments under the shareholder services and distribution plan (where applicable), also benefit TAM, TCI and their affiliates and fund sub-advisers to the extent the payments result in more assets being invested in the funds on which fees are being charged.
Although a fund may use financial firms that sell fund shares to effect transactions for the fund’s portfolio, the fund and its investment manager or sub-adviser will not consider the sale of fund shares as a factor when choosing financial firms to effect those transactions.
Dividends and Distributions
Taxes on Distributions in General. Each Destination Fund intends to distribute all or substantially all of its net investment income and net capital gains, if any, to its shareholders each year. Dividends will be reinvested in additional shares unless you elect to take your dividends in cash. Each Destination Fund generally pays any distributions of net capital gains annually.
Each Destination Fund generally pays any dividends from net investment income annually, except for: (i) Transamerica Government Money Market which declares dividends daily and pays dividends from investment income monthly; (ii) Transamerica High Yield Bond which declares dividends daily and pays any dividends from net investment income monthly; and (iii) Transamerica Intermediate Bond which pays any dividends from net investment income monthly.
If necessary, each Destination Fund may make distributions at other times as well.
A fund will not generally have to pay income tax on amounts it distributes to shareholders. Shareholders will generally be taxed on distributions (other than any distributions treated as a return of capital), whether such distributions are paid in cash or reinvested in additional shares.
The following are guidelines for how certain distributions by a fund are generally taxed to non-corporate shareholders under current federal income tax law:
| | • | | Distributions of net capital gain (i.e., the excess of net long-term capital gain over net short-term capital loss) will be taxed as long-term capital gains, generally at rates of up to 20%, regardless of how long the shareholders have held their shares. |
| | • | | Distributions reported as paid from a fund’s “qualified dividend income” may be taxable to shareholders as qualified dividend income at rates of up to 20%. Qualified dividend income generally is income derived from certain dividends from U.S. corporations or certain foreign corporations that are either incorporated in a U.S. possession or eligible for tax benefits under certain U.S. income tax treaties. In addition, dividends that a fund receives in respect of stock of certain foreign corporations will be qualified dividend income if that stock is readily tradable on an established U.S. securities market. A shareholder (and the fund in which the shareholder invests) will have to satisfy certain holding period requirements in order for the shareholder to obtain the benefit of the tax rates applicable to qualified dividend income. |
| | • | | Distributions in excess of a fund’s earnings and profits will, as to each shareholder, be treated as a return of capital to the extent of the shareholder’s basis in his or her fund shares, and as a capital gain thereafter (assuming the shareholder holds the shares as capital assets). A distribution treated as a return of capital will not be taxable currently but will reduce the shareholder’s tax basis in his or her shares, which will generally increase the gain (or decrease the loss) that will be recognized on a subsequent sale or exchange of the shares. |
| | • | | Other distributions generally will be taxed at ordinary income tax rates. |
- 193 -
A 3.8% Medicare contribution tax generally applies to all or a portion of the net investment income of a shareholder who is an individual and not a nonresident alien for federal income tax purposes and who has adjusted gross income (subject to certain adjustments) that exceeds a threshold amount. This 3.8% tax also applies to all or a portion of the undistributed net investment income of certain shareholders that are estates or trusts. For these purposes, dividends, interest, and certain capital gains are generally taken into account in computing a shareholder’s net investment income, but exempt-interest dividends are not taken into account.
If a fund declares a dividend in October, November, or December, payable to shareholders of record in such a month, and pays it in the following January, shareholders will be taxed on the dividend as if they received it in the year in which it was declared.
Each fund in which you invest will send you a tax report annually summarizing the amount and tax aspects of your distributions. If you buy shares of a fund shortly before it makes a taxable distribution (other than regular monthly distributions paid by Transamerica Government Money Market and Transamerica High Yield Bond), the distribution will be generally taxable to you even though it may effectively represent a return of a portion of your investment. This is known as “buying a dividend.”
Investors who invest through tax-deferred accounts, such as IRAs, 403(b) accounts, and qualified retirement plans, will ordinarily not be subject to tax until a distribution is made from the account, at which time such distribution is generally taxed as ordinary income, even if the distribution is wholly or partly attributable to exempt-interest dividends received by the tax-deferred account. These accounts are subject to complex tax rules, and tax-deferred account investors should therefore consult their tax advisers regarding their investments in a tax-deferred account.
Funds that invest in other funds (“asset allocation funds”) may recognize income on distributions from underlying funds in which they invest and may also recognize gains and losses if they redeem or sell shares in underlying funds. Distributions of net capital gains or qualified dividend income of either the asset allocation funds or underlying funds will generally be taxed at long-term capital gain rates of up to 20% when distributed to noncorporate shareholders of the asset allocation funds. Other distributions, including short-term capital gains, generally will be taxed as ordinary income. The structure of such asset allocation funds and the reallocation of investments among underlying funds could affect the amount, timing and character of distributions.
Taxes on the Sale or Exchange of Shares. If you sell shares of a fund or exchange them for shares of another fund, you generally will have a capital gain or loss, which will generally be a long-term capital gain or loss if you held the shares for more than one year; otherwise it will generally be a short-term capital gain or loss.
Any loss recognized on shares held for six months or less will be treated as a long-term capital loss to the extent of any amounts treated as distributions of long-term capital gain that were received with respect to the shares. In certain cases, a loss realized upon a disposition of shares in a fund held for six months or less will be disallowed to the extent of any exempt-interest dividends received with respect to those shares.
Any gain or loss on the sale or exchange of shares is computed by subtracting your tax basis in the shares from the redemption proceeds in the case of a sale or the value of the shares received in the case of an exchange. Because your tax basis depends on the original purchase price, on the price at which any dividends may have been reinvested, and on the amount of any distributions treated as returns of capital for federal income tax purposes, you should be sure to keep account statements so that you or your tax return preparer will be able to determine whether a sale will result in a taxable gain or loss.
Money market funds typically maintain a stable net asset value of $1.00 per share. Assuming Transamerica Money Market maintains a stable net asset value, you will typically not recognize gain or loss upon the sale, redemption, or exchange of shares of this fund.
Withholding Taxes. A fund in which you invest may be required to apply backup withholding of U.S. federal income tax on all distributions payable to you (including exempt-interest dividends) if you fail to provide the funds with your correct taxpayer identification number or to make required certifications, or if you have been notified by the IRS that you are subject to backup withholding.
The backup withholding rate is 28%. Backup withholding is not an additional tax, but is a method by which the IRS ensures that it will collect taxes otherwise due. Any amounts withheld may be credited against your U.S. federal income tax liability. Backup withholding will not be applied to payments that have been subject to the 30% withholding tax applicable to shareholders that are not U.S. persons.
- 194 -
Non-Resident Alien Withholding. Dividends and certain other payments (but not distributions of net capital gains, “short-term capital gains dividends” and “interest-related dividends” (described below)), to persons who are not citizens or residents of the United States or U.S. entities (“Non-U.S. Persons”) are generally subject to U.S. tax withholding at the rate of 30%. Each fund intends to withhold U.S. federal income tax at the rate of 30% on taxable distributions and other payments to Non-U.S. Persons that are subject to withholding, regardless of whether a lower rate may be permitted under an applicable treaty.
Dividends reported by a fund as (i) interest-related dividends, to the extent such dividends are derived from the fund’s “qualified net interest income,” or (ii) short-term capital gain dividends, to the extent such dividends are derived from the fund’s “qualified short-term gain,” are generally exempt from this 30% withholding tax. “Qualified net interest income” is a fund’s net income derived from U.S.-source interest and original issue discount, subject to certain exceptions and limitations. “Qualified short-term gain” generally means the excess of a fund’s net short-term capital gain for the taxable year over its net long-term capital loss, if any.
If you are a non-U.S. person, you must provide a U.S. mailing address to establish an account unless your broker-dealer firm submits your account through the National Securities Clearing Corporation. Your broker-dealer will be required to submit a foreign certification form. Investors changing a mailing address to a non-U.S. address will be required to have a foreign certification form completed by their broker-dealer and returned to us before future purchases can be accepted. Additionally, those shareholders will need to provide an appropriate tax form (e.g., Form W-8BEN) and documentary evidence and letter of explanation.
Unless certain non-U.S. entities that hold fund shares comply with IRS requirements that will generally require them to report information regarding U.S. persons investing in, or holding accounts with, such entities, a 30% withholding tax may apply to fund distributions payable to such entities after June 30, 2014 (or, in certain cases, after later dates) and redemptions and certain capital gain dividends payable to such entities after December 31, 2018. A non-U.S. shareholder may be exempt from the withholding described in this paragraph under an applicable intergovernmental agreement between the U.S. and a foreign government, provided that the shareholder and the applicable foreign government comply with the terms of such agreement.
Other Tax Information. This tax discussion is for general information only. In addition to federal income taxes, you may be subject to state, local or foreign taxes on payments received from, and investments made in shares of, a Destination Fund. More information is provided in the Destination Funds’ prospectus and statement of additional information. You should also consult your own tax adviser for information regarding all tax consequences applicable to your investments in the funds.
Temporary Defensive Strategies
For temporary defensive purposes, a Destination Fund may, at times, choose to hold some or all of its assets in cash, or to invest that cash in a variety of debt securities. This may be done as a defensive measure at times when desirable risk/reward characteristics are not available in stocks or to earn income from otherwise uninvested cash. When a Destination Fund increases its cash or debt investment position, its income may increase while its ability to participate in stock market advances or declines decrease. Furthermore, when a Destination Fund assumes a temporary defensive position it may not be able to achieve its investment goal(s).
FINANCIAL HIGHLIGHTS
The following tables show the financial performance of the applicable class of shares of each Fund for the past five fiscal years and, if applicable, for any recent semi-annual period (or periods during which a Fund has been in operation, if less than five years). Certain information reflects financial results for a single Fund share. The total returns in the tables represent the rate that you would have earned or lost on an investment in a Fund (assuming reinvestment of all dividends and distributions). No financial highlights are provided for Class R, Class R4 or Class I3 shares of the Destination Funds because Class R, Class R4 and Class I3 shares are newly offered. The information presented with respect to each Target Fund through the period ended December 31, 2015 has been derived from financial statements audited by Ernst & Young LLP, independent registered public accounting firm, whose report, along with the Target Fund’s financial statements, is included in the Target Funds’ annual report to shareholders for the fiscal year ended December 31, 2015. The information presented with respect to each Destination Fund through the period ended October 31, 2015 has been derived from financial statements audited by Ernst & Young LLP, independent registered public accounting firm, whose report, along with the Destination Fund’s financial statements, is included in the Destination
- 195 -
Funds’ annual report to shareholders for the fiscal year ended October 31, 2015. Each of the Target Trust’s and Destination Trust’s annual report is incorporated into this Proxy Statement/Prospectus by reference. Copies of each Trust’s annual report may be obtained without charge by calling 1-888-233-4339.
The financial highlights for each Target Fund for six months ended June 30, 2016 and for each Destination Fund for the six months ended April 30, 2016 are unaudited.
Core Bond Funds
| | | | | | | | | | | | | | | | | | | | | | | | |
| For a share outstanding during the period and years indicated: | | Transamerica Partners Core Bond | |
| | | June 30, 2016
(unaudited) | | | December 31,
2015 | | | December 31,
2014 | | | December 31,
2013 | | | December 31,
2012 | | | December 31,
2011 | |
Net asset value, beginning of period/year | | $ | 12.80 | | | $ | 13.12 | | | $ | 12.85 | | | $ | 13.57 | | | $ | 13.15 | | | $ | 12.85 | |
Investment operations:(A) | | | | | | | | | | | | | | | | | | | | | | | | |
Net investment income (loss)(B) | | | 0.13 | | | | 0.22 | | | | 0.26 | | | | 0.27 | | | | 0.33 | | | | 0.38 | |
Net realized and unrealized gain (loss) | | | 0.50 | | | | (0.24 | ) | | | 0.47 | | | | (0.48 | ) | | | 0.66 | | | | 0.32 | |
| | | | | | | | | | | | | | | | | | | | | | | | |
Total investment operations | | | 0.63 | | | | (0.02 | ) | | | 0.73 | | | | (0.21 | ) | | | 0.99 | | | | 0.70 | |
| | | | | | | | | | | | | | | | | | | | | | | | |
Dividends and/or distributions to shareholders: | | | | | | | | | | | | | | | | | | | | | | | | |
Net investment income | | | (0.13 | ) | | | (0.24 | ) | | | (0.31 | ) | | | (0.45 | ) | | | (0.37 | ) | | | (0.40 | ) |
Net realized gains | | | — | | | | (0.06 | ) | | | (0.15 | ) | | | (0.06 | ) | | | (0.20 | ) | | | — | |
| | | | | | | | | | | | | | | | | | | | | | | | |
Total dividends and/or distributions to shareholders | | | (0.13 | ) | | | (0.30 | ) | | | (0.46 | ) | | | (0.51 | ) | | | (0.57 | ) | | | (0.40 | ) |
| | | | | | | | | | | | | | | | | | | | | | | | |
Net asset value, end of period/year | | $ | 13.30 | | | $ | 12.80 | | | $ | 13.12 | | | $ | 12.85 | | | $ | 13.57 | | | $ | 13.15 | |
| | | | | | | | | | | | | | | | | | | | | | | | |
Total return(C) | | | 4.93 | %(D) | | | (0.16 | )% | | | 5.71 | % | | | (1.54 | )% | | | 7.64 | % | | | 5.55 | % |
| | | | | | | | | | | | | | | | | | | | | | | | |
Ratio and supplemental data: | | | | | | | | | | | | | | | | | | | | | | | | |
Net assets end of period/year (000’s) | | $ | 381,773 | | | $ | 382,370 | | | $ | 366,758 | | | $ | 316,099 | | | $ | 357,948 | | | $ | 386,270 | |
Expenses to average net assets(A) | | | 0.96 | %(E) | | | 0.96 | % | | | 0.97 | % | | | 0.98 | % | | | 0.99 | % | | | 0.98 | % |
Net investment income (loss) to average net assets(A) | | | 1.97 | %(E) | | | 1.69 | % | | | 1.99 | % | | | 2.06 | % | | | 2.44 | % | | | 2.96 | % |
Portfolio turnover rate of Series Portfolio | | | 19 | %(D) | | | 46 | % | | | 184 | % | | | 200 | % | | | 297 | % | | | 406 | % |
| (A) | The per share amounts and percentages include the Fund’s proportionate share of income and expenses of the Series Portfolio. |
| (B) | Calculated based on average number of shares outstanding. |
| (C) | Total return reflects Fund expenses and includes reinvestment of dividends and capital gains. |
| | | | | | | | | | | | | | | | | | | | | | | | |
| For a share outstanding during the period and years indicated: | | Transamerica Partners Institutional Core Bond | |
| | | June 30, 2016
(unaudited) | | | December 31,
2015 | | | December 31,
2014 | | | December 31,
2013 | | | December 31,
2012 | | | December 31,
2011 | |
Net asset value, beginning of period/year | | $ | 10.59 | | | $ | 10.88 | | | $ | 10.66 | | | $ | 11.21 | | | $ | 11.08 | | | $ | 10.77 | |
Investment operations:(A) | | | | | | | | | | | | | | | | | | | | | | | | |
Net investment income (loss)(B) | | | 0.12 | | | | 0.22 | | | | 0.25 | | | | 0.26 | | | | 0.31 | | | | 0.36 | |
Net realized and unrealized gain (loss) | | | 0.42 | | | | (0.19 | ) | | | 0.39 | | | | (0.40 | ) | | | 0.55 | | | | 0.27 | |
| | | | | | | | | | | | | | | | | | | | | | | | |
Total investment operations | | | 0.54 | | | | 0.03 | | | | 0.64 | | | | (0.14 | ) | | | 0.86 | | | | 0.63 | |
| | | | | | | | | | | | | | | | | | | | | | | | |
Dividends and/or distributions to shareholders: | | | | | | | | | | | | | | | | | | | | | | | | |
Net investment income | | | (0.12 | ) | | | (0.24 | ) | | | (0.29 | ) | | | (0.38 | ) | | | (0.37 | ) | | | (0.30 | ) |
Net realized gains | | | — | | | | (0.08 | ) | | | (0.13 | ) | | | (0.03 | ) | | | (0.36 | ) | | | (0.02 | ) |
Return of capital | | | — | | | | — | | | | — | | | | (0.00 | )(C) | | | — | | | | — | |
| | | | | | | | | | | | | | | | | | | | | | | | |
Total dividends and/or distributions to shareholders | | | (0.12 | ) | | | (0.32 | ) | | | (0.42 | ) | | | (0.41 | ) | | | (0.73 | ) | | | (0.32 | ) |
| | | | | | | | | | | | | | | | | | | | | | | | |
Net asset value, end of period/year | | $ | 11.01 | | | $ | 10.59 | | | $ | 10.88 | | | $ | 10.66 | | | $ | 11.21 | | | $ | 11.08 | |
| | | | | | | | | | | | | | | | | | | | | | | | |
Total return(D) | | | 5.13 | %(E) | | | 0.21 | % | | | 5.99 | % | | | (1.22 | )% | | | 7.97 | % | | | 5.94 | % |
| | | | | | | | | | | | | | | | | | | | | | | | |
Ratio and supplemental data: | | | | | | | | | | | | | | | | | | | | | | | | |
Net assets end of period/year (000’s) | | $ | 373,802 | | | $ | 373,605 | | | $ | 410,662 | | | $ | 400,409 | | | $ | 445,634 | | | $ | 481,012 | |
Expenses to average net assets(A) | | | | | | | | | | | | | | | | | | | | | | | | |
Excluding waiver and/or reimbursement | | | 0.70 | %(F) | | | 0.71 | % | | | 0.72 | % | | | 0.72 | % | | | 0.73 | % | | | 0.72 | % |
Including waiver and/or reimbursement | | | 0.65 | %(F) | | | 0.65 | % | | | 0.65 | % | | | 0.65 | % | | | 0.65 | % | | | 0.65 | % |
Net investment income (loss) to average net assets(A) | | | 2.28 | %(F) | | | 1.99 | % | | | 2.32 | % | | | 2.39 | % | | | 2.78 | % | | | 3.28 | % |
Portfolio turnover rate of Series Portfolio | | | 19 | %(E) | | | 46 | % | | | 184 | % | | | 200 | % | | | 297 | % | | | 406 | % |
| (A) | The per share amounts and percentages include the Fund’s proportionate share of income and expenses of the Series Portfolio. |
| (B) | Calculated based on average number of shares outstanding. |
| (C) | Rounds to less than $0.01 or $(0.01). |
| (D) | Total return reflects Fund expenses and includes reinvestment of dividends and capital gains. |
- 196 -
| | | | | | | | | | | | | | | | | | | | | | | | |
| | | Transamerica Partners Core Bond Portfolio | |
| | | June 30, 2016
(unaudited) | | | December 31,
2015 | | | December 31,
2014 | | | December 31,
2013 | | | December 31,
2012 | | | December 31,
2011 | |
Total return(A) | | | 5.08 | %(B) | | | 0.46 | % | | | 6.32 | % | | | (0.96 | )% | | | 8.28 | % | | | 6.20 | % |
| | | | | | | | | | | | | | | | | | | | | | | | |
Ratio and supplemental data: | | | | | | | | | | | | | | | | | | | | | | | | |
Net assets end of period/year (000’s) | | $ | 1,255,792 | | | $ | 1,282,948 | | | $ | 1,354,476 | | | $ | 1,336,211 | | | $ | 1,470,033 | | | $ | 1,588,591 | |
Expenses to average net assets | | | 0.37 | %(C) | | | 0.37 | % | | | 0.38 | % | | | 0.39 | % | | | 0.39 | % | | | 0.39 | % |
Net investment income (loss) to average net assets | | | 2.55 | %(C) | | | 2.27 | % | | | 2.58 | % | | | 2.64 | % | | | 3.03 | % | | | 3.54 | % |
Portfolio turnover rate | | | 19 | %(B) | | | 46 | % | | | 184 | % | | | 200 | % | | | 297 | % | | | 406 | % |
| (A) | Total return reflects all Portfolio expenses. |
| | | | | | | | | | | | |
| For a share outstanding during the periods and year indicated: | | Transamerica Intermediate Bond | |
| | April 30, 2016
(unaudited) | | | October 31,
2015 | | | October 31,
2014 (A) | |
Net asset value, beginning of period/year | | $ | 10.08 | | | $ | 10.12 | | | $ | 10.00 | |
| | | | | | | | | | | | |
Investment operations: | | | | | | | | | | | | |
Net investment income (loss)(B) | | | 0.10 | | | | 0.19 | | | | 0.12 | |
Net realized and unrealized gain (loss) | | | 0.16 | | | | (0.02 | ) | | | 0.13 | |
| | | | | | | | | | | | |
Total investment operations | | | 0.26 | | | | 0.17 | | | | 0.25 | |
| | | | | | | | | | | | |
Distributions: | | | | | | | | | | | | |
Net investment income | | | (0.10 | ) | | | (0.20 | ) | | | (0.13 | ) |
Net realized gains | | | (0.01 | ) | | | (0.01 | ) | | | — | |
| | | | | | | | | | | | |
Total distributions | | | (0.11 | ) | | | (0.21 | ) | | | (0.13 | ) |
| | | | | | | | | | | | |
Net asset value, end of period/year | | $ | 10.23 | | | $ | 10.08 | | | $ | 10.12 | |
| | | | | | | | | | | | |
Total return | | | 2.65 | %(C) | | | 1.67 | % | | | 2.48 | %(C) |
| | | | | | | | | | | | |
Ratio and supplemental data: | | | | | | | | | | | | |
Net assets end of period/year (000’s) | | $ | 1,261,592 | | | $ | 809,902 | | | $ | 304,392 | |
Expenses to average net assets | | | 0.41 | %(D) | | | 0.42 | % | | | 0.44 | %(D) |
Net investment income (loss) to average net assets | | | 2.02 | %(D) | | | 1.92 | % | | | 1.81 | %(D) |
Portfolio turnover rate | | | 25 | %(C) | | | 50 | % | | | 83 | %(C) |
| (A) | Commenced operations on March 1, 2014. |
| (B) | Calculated based on average number of shares outstanding. |
Government Money Market Funds
| | | | | | | | | | | | | | | | | | | | | | | | |
| For a share outstanding during the period and years indicated: | | Transamerica Partners Government Money Market(A) | |
| | | June 30, 2016
(unaudited) | | | December 31,
2015 | | | December 31,
2014 | | | December 31,
2013 | | | December 31,
2012 | | | December 31,
2011 | |
Net asset value, beginning of period/year | | $ | 1.00 | | | $ | 1.00 | | | $ | 1.00 | | | $ | 1.00 | | | $ | 1.00 | | | $ | 1.00 | |
| | | | | | | | | | | | | | | | | | | | | | | | |
Investment operations:(B) | | | | | | | | | | | | | | | | | | | | | | | | |
Net investment income (loss)(C) | | | (0.00 | )(D) | | | (0.00 | )(D) | | | (0.00 | )(D) | | | (0.00 | )(D) | | | — | | | | (0.00 | )(D) |
Net realized and unrealized gain (loss) | | | 0.00 | (D) | | | 0.00 | (D) | | | 0.00 | (D) | | | 0.00 | (D) | | | — | | | | 0.00 | (D) |
| | | | | | | | | | | | | | | | | | | | | | | | |
Total investment operations | | | (0.00 | )(D) | | | (0.00 | )(D) | | | (0.00 | )(D) | | | 0.00 | (D) | | | — | | | | 0.00 | (D) |
| | | | | | | | | | | | | | | | | | | | | | | | |
Dividends and/or distributions to shareholders: | | | | | | | | | | | | | | | | | | | | | | | | |
Net investment income | | | — | | | | — | | | | — | | | | (0.00 | )(D) | | | — | | | | — | |
| | | | | | | | | | | | | | | | | | | | | | | | |
Net asset value, end of period/year | | $ | 1.00 | | | $ | 1.00 | | | $ | 1.00 | | | $ | 1.00 | | | $ | 1.00 | | | $ | 1.00 | |
| | | | | | | | | | | | | | | | | | | | | | | | |
Total return(E) | | | 0.00 | %(F)(G) | | | 0.00 | %(G) | | | 0.00 | %(G) | | | 0.00 | %(G) | | | 0.00 | %(G) | | | 0.00 | %(G) |
| | | | | | | | | | | | | | | | | | | | | | | | |
Ratio and supplemental data: | | | | | | | | | | | | | | | | | | | | | | | | |
Net assets end of period/year (000’s) | | $ | 557,014 | | | $ | 550,411 | | | $ | 498,613 | | | $ | 474,926 | | | $ | 399,195 | | | $ | 368,104 | |
Expenses to average net assets(B) | | | | | | | | | | | | | | | | | | | | | | | | |
Excluding waiver and/or reimbursement and recapture | | | 0.86 | %(H) | | | 0.87 | % | | | 0.87 | % | | | 0.87 | % | | | 0.88 | % | | | 0.87 | % |
Including waiver and/or reimbursement and recapture(I) | | | 0.47 | %(H) | | | 0.29 | % | | | 0.23 | % | | | 0.22 | % | | | 0.18 | % | | | 0.24 | % |
Net investment income (loss) to average net assets(B) | | | (0.01 | )%(H) | | | (0.00 | )%(G) | | | (0.00 | )%(G) | | | (0.00 | )%(G) | | | — | % | | | (0.00 | )%(G) |
| (A) | Effective May 2, 2016, the Fund underwent a 10.61-for-1 share split. The per share data has been retroactively adjusted to reflect the share split. See the Stock Split section of the Notes to Financial Statements for more information. |
| (B) | The per share amounts and percentages include the Fund’s proportionate share of income and expenses of the Series Portfolio. |
| (C) | Calculated based on average number of shares outstanding. |
| (D) | Rounds to less than $0.01 or $(0.01). |
| (E) | Total return reflects Fund expenses and includes reinvestment of dividends and capital gains. |
| (G) | Rounds to less than 0.01% or (0.01)%. |
| (I) | Transamerica Asset Management, Inc. or any of its affiliates waive fees or reimburse expenses in order to avoid a negative yield. See the Affiliates and Affiliated Transactions section of the Notes to Financial Statements for more information. |
- 197 -
| | | | | | | | | | | | | | | | | | | | | | | | |
| For a share outstanding during the period and years indicated: | | Transamerica Partners Institutional Government Money Market(A) | |
| | | June 30, 2016
(unaudited) | | | December 31,
2015 | | | December 31,
2014 | | | December 31,
2013 | | | December 31,
2012 | | | December 31,
2011 | |
Net asset value, beginning of period/year | | $ | 1.00 | | | $ | 1.00 | | | $ | 1.00 | | | $ | 1.00 | | | $ | 1.00 | | | $ | 1.00 | |
| | | | | | | | | | | | | | | | | | | | | | | | |
Investment operations:(B) | | | | | | | | | | | | | | | | | | | | | | | | |
Net investment income (loss)(C) | | | (0.00 | )(D) | | | (0.00 | )(D) | | | (0.00 | )(D) | | | (0.00 | )(D) | | | — | | | | (0.00 | )(D) |
Net realized and unrealized gain (loss) | | | 0.00 | (D) | | | 0.00 | (D) | | | 0.00 | (D) | | | 0.00 | (D) | | | — | | | | 0.00 | (D) |
| | | | | | | | | | | | | | | | | | | | | | | | |
Total investment operations | | | (0.00 | )(D) | | | (0.00 | )(D) | | | (0.00 | )(D) | | | (0.00 | )(D) | | | — | | | | 0.00 | (D) |
| | | | | | | | | | | | | | | | | | | | | | | | |
Dividends and/or distributions to shareholders: | | | | | | | | | | | | | | | | | | | | | | | | |
Net investment income | | | — | | | | — | | | | — | | | | (0.00 | )(D) | | | — | | | | — | |
| | | | | | | | | | | | | | | | | | | | | | | | |
Net asset value, end of period/year | | $ | 1.00 | | | $ | 1.00 | | | $ | 1.00 | | | $ | 1.00 | | | $ | 1.00 | | | $ | 1.00 | |
| | | | | | | | | | | | | | | | | | | | | | | | |
Total return(E) | | | 0.00 | %(F)(G) | | | 0.00 | %(F) | | | 0.00 | %(F) | | | 0.00 | %(F) | | | 0.00 | %(F) | | | 0.00 | %(F) |
| | | | | | | | | | | | | | | | | | | | | | | | |
Ratio and supplemental data: | | | | | | | | | | | | | | | | | | | | | | | | |
Net assets end of period/year (000’s) | | $ | 223,777 | | | $ | 225,994 | | | $ | 252,828 | | | $ | 316,371 | | | $ | 348,183 | | | $ | 385,219 | |
Expenses to average net assets(B) | | | | | | | | | | | | | | | | | | | | | | | | |
Excluding waiver and/or reimbursement and recapture | | | 0.63 | %(H) | | | 0.62 | % | | | 0.63 | % | | | 0.62 | % | | | 0.63 | % | | | 0.61 | % |
Including waiver and/or reimbursement and recapture(I) | | | 0.47 | %(H) | | | 0.29 | % | | | 0.23 | % | | | 0.22 | % | | | 0.18 | % | | | 0.24 | % |
Net investment income (loss) to average net
assets(B) | | | (0.01 | )%(H) | | | (0.00 | )%(F) | | | (0.00 | )%(F) | | | (0.00 | )%(F) | | | — | % | | | (0.00 | )%(F) |
| (A) | Effective May 2, 2016, the Fund underwent a 10.06-for-1 share split. The per share data has been retroactively adjusted to reflect the share split. See the Stock Split section of the Notes to Financial Statements for more information. |
| (B) | The per share amounts and percentages include the Fund’s proportionate share of income and expenses of the Series Portfolio. |
| (C) | Calculated based on average number of shares outstanding. |
| (D) | Rounds to less than $0.01 or $(0.01). |
| (E) | Total return reflects Fund expenses and includes reinvestment of dividends and capital gains. |
| (F) | Rounds to less than 0.01% or (0.01)%. |
| (I) | Transamerica Asset Management, Inc. or any of its affiliates waive fees or reimburse expenses in order to avoid a negative yield. See the Affiliates and Affiliated Transactions section of the Notes to Financial Statements for more information. |
| | | | | | | | | | | | | | | | | | | | | | | | |
| | | Transamerica Partners Government Money Market Portfolio | |
| | | June 30, 2016
(unaudited) | | | December 31,
2015 | | | December 31,
2014 | | | December 31,
2013 | | | December 31,
2012 | | | December 31,
2011 | |
Total return(A) | | | 0.10 | %(B) | | | 0.01 | % | | | (0.05 | )% | | | (0.07 | )% | | | (0.11 | )% | | | (0.04 | )% |
| | | | | | | | | | | | | | | | | | | | | | | | |
Ratio and supplemental data: | | | | | | | | | | | | | | | | | | | | | | | | |
Net assets end of period/year (000’s) | | $ | 894,826 | | | $ | 873,057 | | | $ | 862,368 | | | $ | 986,862 | | | $ | 948,358 | | | $ | 995,629 | |
Expenses to average net assets | | | 0.28 | %(C) | | | 0.28 | % | | | 0.28 | % | | | 0.29 | % | | | 0.28 | % | | | 0.28 | % |
Net investment income (loss) to average net assets | | | 0.19 | %(C) | | | 0.01 | % | | | (0.05 | )% | | | (0.07 | )% | | | (0.11 | )% | | | (0.04 | )% |
| (A) | Total return reflects all Portfolio expenses. |
| | | | | | | | | | | | | | | | | | | | | | | | |
| For a share outstanding during the period and years indicated: | | Transamerica Government Money Market
Class A | |
| | April 30, 2016
(unaudited) | | | October 31,
2015 | | | October 31,
2014 | | | October 31,
2013 | | | October 31,
2012 | | | October 31,
2011 | |
Net asset value, beginning of period/year | | $ | 1.00 | | | $ | 1.00 | | | $ | 1.00 | | | $ | 1.00 | | | $ | 1.00 | | | $ | 1.00 | |
| | | | | | | | | | | | | | | | | | | | | | | | |
Investment operations: | | | | | | | | | | | | | | | | | | | | | | | | |
Net investment income (loss)(A) | | | 0.00 | (B) | | | 0.00 | (B) | | | 0.00 | (B) | | | 0.00 | (B) | | | 0.00 | (B) | | | 0.00 | (B) |
| | | | | | | | | | | | | | | | | | | | | | | | |
Total investment operations | | | 0.00 | (B) | | | 0.00 | (B) | | | 0.00 | (B) | | | 0.00 | (B) | | | 0.00 | (B) | | | 0.00 | (B) |
| | | | | | | | | | | | | | | | | | | | | | | | |
Distributions: | | | | | | | | | | | | | | | | | | | | | | | | |
Net investment income | | | (0.00 | )(B) | | | (0.00 | )(B) | | | (0.00 | )(B) | | | (0.00 | )(B) | | | (0.00 | )(B) | | | (0.00 | )(B) |
| | | | | | | | | | | | | | | | | | | | | | | | |
Net asset value, end of period/year | | $ | 1.00 | | | $ | 1.00 | | | $ | 1.00 | | | $ | 1.00 | | | $ | 1.00 | | | $ | 1.00 | |
| | | | | | | | | | | | | | | | | | | | | | | | |
Total return(C) | | | 0.00 | %(D)(E) | | | 0.01 | % | | | 0.01 | % | | | 0.01 | % | | | 0.01 | % | | | 0.00 | %(E) |
| | | | | | | | | | | | | | | | | | | | | | | | |
Ratio and supplemental data: | | | | | | | | | | | | | | | | | | | | | | | | |
Net assets end of period/year (000’s) | | $ | 156,296 | | | $ | 105,532 | | | $ | 100,310 | | | $ | 90,423 | | | $ | 95,801 | | | $ | 112,490 | |
Expenses to average net assets | | | | | | | | | | | | | | | | | | | | | | | | |
Excluding waiver and/or reimbursement and recapture | | | 0.96 | %(F) | | | 1.07 | % | | | 1.09 | % | | | 1.09 | % | | | 1.17 | % | | | 1.26 | % |
Including waiver and/or reimbursement and recapture (G) | | | 0.46 | %(F) | | | 0.27 | % | | | 0.22 | % | | | 0.24 | % | | | 0.27 | % | | | 0.20 | % |
Net investment income (loss) to average net assets | | | 0.01 | %(F) | | | 0.00 | %(E) | | | 0.01 | % | | | 0.00 | %(E) | | | 0.00 | %(E) | | | 0.00 | %(E) |
| (A) | Calculated based on average number of shares outstanding. |
| (B) | Rounds to less than $0.01 or $(0.01). |
| (C) | Total return has been calculated without deduction of a sales load on an initial purchase. |
| (E) | Rounds to less than 0.01% or (0.01)%. |
| (G) | Transamerica Asset Management, Inc. or any of its affiliates waive fees or reimburse expenses in order to avoid a negative yield. Refer to the Notes to the Financial Statements for details. |
- 198 -
High Yield Bond Funds
| | | | | | | | | | | | | | | | | | | | | | | | |
| For a share outstanding during the period and years indicated: | | Transamerica Partners High Yield Bond | |
| | | June 30, 2016
(unaudited) | | | December 31,
2015 | | | December 31,
2014 | | | December 31,
2013 | | | December 31,
2012 | | | December 31,
2011 | |
Net asset value, beginning of period/year | | $ | 7.92 | | | $ | 8.76 | | | $ | 9.00 | | | $ | 8.93 | | | $ | 8.35 | | | $ | 8.63 | |
| | | | | | | | | | | | | | | | | | | | | | | | |
Investment operations:(A) | | | | | | | | | | | | | | | | | | | | | | | | |
Net investment income (loss)(B) | | | 0.23 | | | | 0.45 | | | | 0.48 | | | | 0.53 | | | | 0.59 | | | | 0.65 | |
Net realized and unrealized gain (loss) | | | 0.32 | | | | (0.84 | ) | | | (0.24 | ) | | | 0.07 | | | | 0.59 | | | | (0.28 | ) |
| | | | | | | | | | | | | | | | | | | | | | | | |
Total investment operations | | | 0.55 | | | | (0.39 | ) | | | 0.24 | | | | 0.60 | | | | 1.18 | | | | 0.37 | |
| | | | | | | | | | | | | | | | | | | | | | | | |
Dividends and/or distributions to shareholders: | | | | | | | | | | | | | | | | | | | | | | | | |
Net investment income | | | (0.24 | ) | | | (0.45 | ) | | | (0.48 | ) | | | (0.53 | ) | | | (0.60 | ) | | | (0.65 | ) |
| | | | | | | | | | | | | | | | | | | | | | | | |
Net asset value, end of period/year | | $ | 8.23 | | | $ | 7.92 | | | $ | 8.76 | | | $ | 9.00 | | | $ | 8.93 | | | $ | 8.35 | |
| | | | | | | | | | | | | | | | | | | | | | | | |
Total return(C) | | | 7.00 | %(D) | | | (4.67 | )% | | | 2.68 | % | | | 6.91 | % | | | 14.55 | % | | | 4.40 | % |
| | | | | | | | | | | | | | | | | | | | | | | | |
Ratio and supplemental data: | | | | | | | | | | | | | | | | | | | | | | | | |
Net assets end of period/year (000’s) | | $ | 116,991 | | | $ | 117,296 | | | $ | 127,483 | | | $ | 121,202 | | | $ | 115,923 | | | $ | 106,726 | |
Expenses to average net assets(A) | | | | | | | | | | | | | | | | | | | | | | | | |
Excluding waiver and/or reimbursement | | | 1.18 | %(E) | | | 1.18 | % | | | 1.19 | % | | | 1.19 | % | | | 1.22 | % | | | 1.20 | % |
Including waiver and/or reimbursement | | | 1.10 | %(E) | | | 1.10 | % | | | 1.10 | % | | | 1.10 | % | | | 1.10 | % | | | 1.10 | % |
Net investment income (loss) to average net assets(A) | | | 5.79 | %(E) | | | 5.21 | % | | | 5.35 | % | | | 5.86 | % | | | 6.75 | % | | | 7.55 | % |
Portfolio turnover rate of Series Portfolio | | | 19 | %(D) | | | 44 | % | | | 97 | % | | | 51 | % | | | 102 | % | | | 81 | % |
| (A) | The per share amounts and percentages include the Fund’s proportionate share of income and expenses of the Series Portfolio. |
| (B) | Calculated based on average number of shares outstanding. |
| (C) | Total return reflects Fund expenses and includes reinvestment of dividends and capital gains. |
| | | | | | | | | | | | | | | | | | | | | | | | |
| For a share outstanding during the period and years indicated: | | Transamerica Partners Institutional High Yield Bond | |
| | | June 30, 2016
(unaudited) | | | December 31,
2015 | | | December 31,
2014 | | | December 31,
2013 | | | December 31,
2012 | | | December 31,
2011 | |
Net asset value, beginning of period/year | | $ | 7.91 | | | $ | 8.74 | | | $ | 9.09 | | | $ | 9.02 | | | $ | 8.43 | | | $ | 8.70 | |
| | | | | | | | | | | | | | | | | | | | | | | | |
Investment operations:(A) | | | | | | | | | | | | | | | | | | | | | | | | |
Net investment income (loss)(B) | | | 0.24 | | | | 0.47 | | | | 0.51 | | | | 0.56 | | | | 0.62 | | | | 0.68 | |
Net realized and unrealized gain (loss) | | | 0.31 | | | | (0.83 | ) | | | (0.25 | ) | | | 0.07 | | | | 0.60 | | | | (0.29 | ) |
| | | | | | | | | | | | | | | | | | | | | | | | |
Total investment operations | | | 0.55 | | | | (0.36 | ) | | | 0.26 | | | | 0.63 | | | | 1.22 | | | | 0.39 | |
| | | | | | | | | | | | | | | | | | | | | | | | |
Dividends and/or distributions to shareholders: | | | | | | | | | | | | | | | | | | | | | | | | |
Net investment income | | | (0.24 | ) | | | (0.47 | ) | | | (0.51 | ) | | | (0.56 | ) | | | (0.63 | ) | | | (0.66 | ) |
Net realized gains | | | — | | | | — | | | | (0.10 | ) | | | — | | | | — | | | | — | |
| | | | | | | | | | | | | | | | | | | | | | | | |
Total dividends and/or distributions to shareholders | | | (0.24 | ) | | | (0.47 | ) | | | (0.61 | ) | | | (0.56 | ) | | | (0.63 | ) | | | (0.66 | ) |
| | | | | | | | | | | | | | | | | | | | | | | | |
Net asset value, end of period/year | | $ | 8.22 | | | $ | 7.91 | | | $ | 8.74 | | | $ | 9.09 | | | $ | 9.02 | | | $ | 8.43 | |
| | | | | | | | | | | | | | | | | | | | | | | | |
Total return(C) | | | 7.04 | %(D) | | | (4.35 | )% | | | 2.88 | % | | | 7.20 | % | | | 14.86 | % | | | 4.63 | % |
| | | | | | | | | | | | | | | | | | | | | | | | |
Ratio and supplemental data: | | | | | | | | | | | | | | | | | | | | | | | | |
Net assets end of period/year (000’s) | | $ | 333,597 | | | $ | 305,040 | | | $ | 340,122 | | | $ | 317,237 | | | $ | 298,141 | | | $ | 256,281 | |
Expenses to average net assets(A) | | | | | | | | | | | | | | | | | | | | | | | | |
Excluding waiver and/or reimbursement | | | 0.91 | %(E) | | | 0.91 | % | | | 0.92 | % | | | 0.92 | % | | | 0.94 | % | | | 0.92 | % |
Including waiver and/or reimbursement | | | 0.85 | %(E) | | | 0.85 | % | | | 0.85 | % | | | 0.85 | % | | | 0.85 | % | | | 0.85 | % |
Net investment income (loss) to average net assets(A) | | | 6.04 | %(E) | | | 5.45 | % | | | 5.60 | % | | | 6.11 | % | | | 6.97 | % | | | 7.77 | % |
Portfolio turnover rate of Series Portfolio | | | 19 | %(D) | | | 44 | % | | | 97 | % | | | 51 | % | | | 102 | % | | | 81 | % |
| (A) | The per share amounts and percentages include the Fund’s proportionate share of income and expenses of the Series Portfolio. |
| (B) | Calculated based on average number of shares outstanding. |
| (C) | Total return reflects Fund expenses and includes reinvestment of dividends and capital gains. |
| | | | | | | | | | | | | | | | | | | | | | | | |
| | | Transamerica Partners High Yield Bond Portfolio | |
| | | June 30, 2016
(unaudited) | | | December 31,
2015 | | | December 31,
2014 | | | December 31,
2013 | | | December 31,
2012 | | | December 31,
2011 | |
Total return(A) | | | 8.11 | %(B) | | | (4.13 | )% | | | 3.16 | % | | | 7.48 | % | | | 15.14 | % | | | 4.93 | % |
| | | | | | | | | | | | | | | | | | | | | | | | |
Ratio and supplemental data: | | | | | | | | | | | | | | | | | | | | | | | | |
Net assets end of period/year (000’s) | | $ | 792,531 | | | $ | 748,987 | | | $ | 876,775 | | | $ | 856,906 | | | $ | 819,993 | | | $ | 729,276 | |
Expenses to average net assets | | | 0.57 | %(C) | | | 0.58 | % | | | 0.58 | %(D) | | | 0.59 | %(D) | | | 0.59 | %(D) | | | 0.59 | %(D) |
Net investment income (loss) to average net assets | | | 6.31 | %(C) | | | 5.72 | % | | | 5.87 | %(E) | | | 6.37 | %(E) | | | 7.23 | %(E) | | | 8.04 | %(E) |
Portfolio turnover rate | | | 19 | %(B) | | | 44 | % | | | 97 | %(F) | | | 51 | %(F) | | | 102 | %(F) | | | 81 | %(F) |
| (A) | Total return reflects all Portfolio expenses. |
| (D) | Does not include expenses of the investment companies and/or ETFs in which the Portfolio invests. |
| (E) | Recognition of net investment income by the Portfolio is affected by the timing of the declaration of dividends by the investment companies and/or ETFs in which the Portfolio invests. |
| (F) | Does not include portfolio activity of the investment companies and/or ETFs in which the Portfolio invests. |
- 199 -
| | | | | | | | | | | | | | | | | | | | | | | | |
| For a share outstanding during the period and years indicated: | | Transamerica High Yield Bond | |
| | | Class A | |
| | | April 30, 2016
(unaudited) | | | October 31,
2015 | | | October 31,
2014 | | | October 31,
2013 | | | October 31,
2012 | | | October 31,
2011 | |
Net asset value, beginning of period/year | | $ | 8.97 | | | $ | 9.68 | | | $ | 9.75 | | | $ | 9.59 | | | $ | 8.95 | | | $ | 9.16 | |
| | | | | | | | | | | | | | | | | | | | | | | | |
Investment operations: | | | | | | | | | | | | | | | | | | | | | | | | |
Net investment income (loss)(A) | | | 0.25 | | | | 0.48 | | | | 0.50 | | | | 0.54 | | | | 0.59 | | | | 0.61 | |
Net realized and unrealized gain (loss) | | | (0.25 | ) | | | (0.58 | ) | | | 0.05 | | | | 0.17 | | | | 0.67 | | | | (0.21 | ) |
| | | | | | | | | | | | | | | | | | | | | | | | |
Total investment operations | | | — | | | | (0.10 | ) | | | 0.55 | | | | 0.71 | | | | 1.26 | | | | 0.40 | |
| | | | | | | | | | | | | | | | | | | | | | | | |
Distributions: | | | | | | | | | | | | | | | | | | | | | | | | |
Net investment income | | | (0.26 | ) | | | (0.49 | ) | | | (0.49 | ) | | | (0.55 | ) | | | (0.62 | ) | | | (0.61 | ) |
Net realized gains | | | — | | | | (0.12 | ) | | | (0.13 | ) | | | — | | | | — | | | | — | |
| | | | | | | | | | | | | | | | | | | | | | | | |
Total distributions | | | (0.26 | ) | | | (0.61 | ) | | | (0.62 | ) | | | (0.55 | ) | | | (0.62 | ) | | | (0.61 | ) |
| | | | | | | | | | | | | | | | | | | | | | | | |
Net asset value, end of period/year | | $ | 8.71 | | | $ | 8.97 | | | $ | 9.68 | | | $ | 9.75 | | | $ | 9.59 | | | $ | 8.95 | |
| | | | | | | | | | | | | | | | | | | | | | | | |
Total return(B) | | | 0.10 | %(C) | | | (1.11 | )% | | | 5.85 | % | | | 7.58 | % | | | 14.57 | % | | | 4.41 | % |
| | | | | | | | | | | | | | | | | | | | | | | | |
Ratio and supplemental data: | | | | | | | | | | | | | | | | | | | | | | | | |
Net assets end of period/year (000’s) | | $ | 129,299 | | | $ | 127,509 | | | $ | 135,250 | | | $ | 404,077 | | | $ | 256,099 | | | $ | 228,920 | |
Expenses to average net assets | | | | | | | | | | | | | | | | | | | | | | | | |
Excluding waiver and/or reimbursement and recapture | | | 1.04 | %(D) | | | 1.00 | % | | | 0.97 | % | | | 1.04 | % | | | 1.06 | % | | | 1.17 | % |
Including waiver and/or reimbursement and recapture | | | 1.04 | %(D) | | | 1.00 | % | | | 0.97 | % | | | 1.04 | % | | | 1.06 | % | | | 1.17 | % |
Net investment income (loss) to average net assets | | | 5.93 | %(D) | | | 5.14 | % | | | 5.10 | % | | | 5.49 | % | | | 6.44 | % | | | 6.65 | % |
Portfolio turnover rate | | | 31 | %(C) | | | 61 | % | | | 48 | % | | | 64 | % | | | 78 | % | | | 93 | % |
| (A) | Calculated based on average number of shares outstanding. |
| (B) | Total return has been calculated without deduction of a sales load on an initial purchase. |
International Equity Funds
| | | | | | | | | | | | | | | | | | | | | | | | |
| For a share outstanding during the period and years indicated: | | Transamerica Partners International Equity | |
| | | June 30, 2016
(unaudited) | | | December 31,
2015 | | | December 31,
2014 | | | December 31,
2013 | | | December 31,
2012 | | | December 31,
2011 | |
Net asset value, beginning of period/year | | $ | 10.12 | | | $ | 10.62 | | | $ | 11.82 | | | $ | 10.53 | | | $ | 9.21 | | | $ | 10.77 | |
| | | | | | | | | | | | | | | | | | | | | | | | |
Investment operations:(A) | | | | | | | | | | | | | | | | | | | | | | | | |
Net investment income (loss)(B) | | | 0.13 | | | | 0.19 | | | | 0.25 | | | | 0.08 | | | | 0.11 | | | | 0.12 | |
Net realized and unrealized gain (loss) | | | (0.52 | ) | | | (0.50 | ) | | | (1.20 | ) | | | 1.31 | | | | 1.41 | | | | (1.62 | ) |
| | | | | | | | | | | | | | | | | | | | | | | | |
Total investment operations | | | (0.39 | ) | | | (0.31 | ) | | | (0.95 | ) | | | 1.39 | | | | 1.52 | | | | (1.50 | ) |
| | | | | | | | | | | | | | | | | | | | | | | | |
Dividends and/or distributions to shareholders: | | | | | | | | | | | | | | | | | | | | | | | | |
Net investment income | | | (0.13 | ) | | | (0.18 | ) | | | (0.25 | ) | | | (0.10 | ) | | | (0.20 | ) | | | (0.06 | ) |
Return of capital | | | — | | | | (0.01 | ) | | | — | | | | — | | | | — | | | | — | |
| | | | | | | | | | | | | | | | | | | | | | | | |
Total dividends and/or distributions to shareholders | | | (0.13 | ) | | | (0.19 | ) | | | (0.25 | ) | | | (0.10 | ) | | | (0.20 | ) | | | (0.06 | ) |
| | | | | | | | | | | | | | | | | | | | | | | | |
Net asset value, end of period/year | | $ | 9.60 | | | $ | 10.12 | | | $ | 10.62 | | | $ | 11.82 | | | $ | 10.53 | | | $ | 9.21 | |
| | | | | | | | | | | | | | | | | | | | | | | | |
Total return(C) | | | (3.88 | )%(D) | | | (3.08 | )% | | | (8.22 | )% | | | 13.27 | % | | | 16.65 | % | | | (14.01 | )% |
| | | | | | | | | | | | | | | | | | | | | | | | |
Ratio and supplemental data: | | | | | | | | | | | | | | | | | | | | | | | | |
Net assets end of period/year (000’s) | | $ | 138,136 | | | $ | 151,236 | | | $ | 162,235 | | | $ | 157,125 | | | $ | 142,538 | | | $ | 171,170 | |
Expenses to average net assets(A) | | | | | | | | | | | | | | | | | | | | | | | | |
Excluding waiver and/or reimbursement | | | 1.44 | %(E) | | | 1.42 | % | | | 1.43 | % | | | 1.45 | % | | | 1.43 | % | | | 1.41 | % |
Including waiver and/or reimbursement | | | 1.40 | %(E) | | | 1.40 | % | | | 1.40 | % | | | 1.40 | % | | | 1.40 | % | | | 1.40 | % |
Net investment income (loss) to average net assets(A) | | | 2.75 | %(E) | | | 1.71 | % | | | 2.12 | % | | | 0.73 | % | | | 1.12 | % | | | 1.12 | % |
Portfolio turnover rate of Series Portfolio | | | 13 | %(D) | | | 23 | % | | | 28 | % | | | 116 | % | | | 23 | % | | | 24 | % |
| (A) | The per share amounts and percentages include the Fund’s proportionate share of income and expenses of the Series Portfolio. |
| (B) | Calculated based on average number of shares outstanding. |
| (C) | Total return reflects Fund expenses and includes reinvestment of dividends and capital gains. |
| | | | | | | | | | | | | | | | | | | | | | | | |
| For a share outstanding during the period and years indicated: | | Transamerica Partners Institutional International Equity | |
| | | June 30, 2016
(unaudited) | | | December 31,
2015 | | | December 31,
2014 | | | December 31,
2013 | | | December 31,
2012 | | | December 31,
2011 | |
Net asset value, beginning of period/year | | $ | 6.44 | | | $ | 6.77 | | | $ | 7.55 | | | $ | 6.73 | | | $ | 5.88 | | | $ | 6.88 | |
| | | | | | | | | | | | | | | | | | | | | | | | |
Investment operations:(A) | | | | | | | | | | | | | | | | | | | | | | | | |
Net investment income (loss)(B) | | | 0.09 | | | | 0.14 | | | | 0.19 | | | | 0.08 | | | | 0.09 | | | | 0.09 | |
Net realized and unrealized gain (loss) | | | (0.33 | ) | | | (0.32 | ) | | | (0.77 | ) | | | 0.82 | | | | 0.90 | | | | (1.03 | ) |
| | | | | | | | | | | | | | | | | | | | | | | | |
Total investment operations | | | (0.24 | ) | | | (0.18 | ) | | | (0.58 | ) | | | 0.90 | | | | 0.99 | | | | (0.94 | ) |
| | | | | | | | | | | | | | | | | | | | | | | | |
Dividends and/or distributions to shareholders: | | | | | | | | | | | | | | | | | | | | | | | | |
Net investment income | | | (0.09 | ) | | | (0.14 | ) | | | (0.20 | ) | | | (0.08 | ) | | | (0.14 | ) | | | (0.06 | ) |
| | | | | | | | | | | | | | | | | | | | | | | | |
Return of capital | | | — | | | | (0.01 | ) | | | — | | | | — | | | | — | | | | — | |
| | | | | | | | | | | | | | | | | | | | | | | | |
Total dividends and/or distributions to shareholders | | | (0.09 | ) | | | (0.15 | ) | | | (0.20 | ) | | | (0.08 | ) | | | (0.14 | ) | | | (0.06 | ) |
| | | | | | | | | | | | | | | | | | | | | | | | |
Net asset value, end of period/year | | $ | 6.11 | | | $ | 6.44 | | | $ | 6.77 | | | $ | 7.55 | | | $ | 6.73 | | | $ | 5.88 | |
| | | | | | | | | | | | | | | | | | | | | | | | |
Total return(C) | | | (3.75 | )%(D) | | | (2.87 | )% | | | (7.97 | )% | | | 13.50 | % | | | 17.03 | % | | | (13.78 | )% |
| | | | | | | | | | | | | | | | | | | | | | | | |
Ratio and supplemental data: | | | | | | | | | | | | | | | | | | | | | | | | |
Net assets end of period/year (000’s) | | $ | 40,343 | | | $ | 43,157 | | | $ | 53,241 | | | $ | 80,876 | | | $ | 103,904 | | | $ | 137,269 | |
Expenses to average net assets(A) | | | | | | | | | | | | | | | | | | | | | | | | |
Excluding waiver and/or reimbursement | | | 1.26 | %(E) | | | 1.21 | % | | | 1.21 | % | | | 1.20 | % | | | 1.18 | % | | | 1.15 | % |
Including waiver and/or reimbursement | | | 1.15 | %(E) | | | 1.15 | % | | | 1.15 | % | | | 1.15 | % | | | 1.15 | % | | | 1.15 | % |
Net investment income (loss) to average net assets(A) | | | 3.02 | %(E) | | | 2.02 | % | | | 2.58 | % | | | 1.10 | % | | | 1.39 | % | | | 1.36 | % |
Portfolio turnover rate of Series Portfolio | | | 13 | %(D) | | | 23 | % | | | 28 | % | | | 116 | % | | | 23 | % | | | 24 | % |
| (A) | The per share amounts and percentages include the Fund’s proportionate share of income and expenses of the Series Portfolio. |
| (B) | Calculated based on average number of shares outstanding. |
| (C) | Total return reflects Fund expenses and includes reinvestment of dividends and capital gains. |
- 200 -
| | | | | | | | | | | | | | | | | | | | | | | | |
| | | Transamerica Partners International Equity Portfolio | |
| | | June 30, 2016
(unaudited) | | | December 31,
2015 | | | December 31,
2014 | | | December 31,
2013 | | | December 31,
2012 | | | December 31,
2011 | |
Total return(A) | | | (3.66 | )%(B) | | | (2.47 | )% | | | (7.74 | )% | | | 13.92 | % | | | 17.35 | % | | | (13.51 | )% |
| | | | | | | | | | | | | | | | | | | | | | | | |
Ratio and supplemental data: | | | | | | | | | | | | | | | | | | | | | | | | |
Net assets end of period/year (000’s) | | $ | 360,054 | | | $ | 404,276 | | | $ | 499,180 | | | $ | 612,105 | | | $ | 614,432 | | | $ | 680,170 | |
Expenses to average net assets | | | 0.83 | %(C) | | | 0.82 | % | | | 0.83 | % | | | 0.85 | % | | | 0.82 | % | | | 0.82 | % |
Net investment income (loss) to average net assets | | | 3.31 | %(C) | | | 2.32 | % | | | 2.80 | % | | | 1.31 | % | | | 1.65 | % | | | 1.70 | % |
Portfolio turnover rate | | | 13 | %(B) | | | 23 | % | | | 28 | % | | | 116 | % | | | 23 | % | | | 24 | % |
| (A) | Total return reflects all Portfolio expenses. |
| | | | | | | | | | | | | | | | | | | | | | | | |
| For a share outstanding during the period and years indicated: | | Transamerica International Equity | |
| | | Class I | |
| | | April 30, 2016
(unaudited) | | | October 31,
2015 | | | October 31,
2014 | | | October 31,
2013 | | | October 31,
2012 | | | October 31,
2011(A) | |
Net asset value, beginning of period/year | | $ | 17.60 | | | $ | 17.80 | | | $ | 18.60 | | | $ | 14.65 | | | $ | 13.50 | | | $ | 13.97 | |
| | | | | | | | | | | | | | | | | | | | | | | | |
Investment operations: | | | | | | | | | | | | | | | | | | | | | | | | |
Net investment income (loss)(B) | | | 0.14 | | | | 0.39 | | | | 0.48 | | | | 0.40 | | | | 0.33 | | | | 0.40 | |
Net realized and unrealized gain (loss) | | | (0.79 | ) | | | (0.00 | )(C) | | | (0.52 | ) | | | 3.81 | | | | 1.17 | | | | (0.68 | ) |
| | | | | | | | | | | | | | | | | | | | | | | | |
Total investment operations | | | (0.65 | ) | | | 0.39 | | | | (0.04 | ) | | | 4.21 | | | | 1.50 | | | | (0.28 | ) |
| | | | | | | | | | | | | | | | | | | | | | | | |
Distributions: | | | | | | | | | | | | | | | | | | | | | | | | |
Net investment income | | | (0.35 | ) | | | (0.31 | ) | | | (0.37 | ) | | | (0.26 | ) | | | (0.35 | ) | | | (0.19 | ) |
Net realized gains | | | (0.09 | ) | | | (0.28 | ) | | | (0.39 | ) | | | — | | | | — | | | | — | |
| | | | | | | | | | | | | | | | | | | | | | | | |
Total distributions | | | (0.44 | ) | | | (0.59 | ) | | | (0.76 | ) | | | (0.26 | ) | | | (0.35 | ) | | | (0.19 | ) |
| | | | | | | | | | | �� | | | | | | | | | | | | | |
Net asset value, end of period/year | | $ | 16.51 | | | $ | 17.60 | | | $ | 17.80 | | | $ | 18.60 | | | $ | 14.65 | | | $ | 13.50 | |
| | | | | | | | | | | | | | | | | | | | | | | | |
Total return | | | (3.74 | )%(D) | | | 2.29 | % | | | (0.20 | )% | | | 29.14 | % | | | 11.58 | % | | | (2.05 | )% |
| | | | | | | | | | | | | | | | | | | | | | | | |
Ratio and supplemental data: | | | | | | | | | | | | | | | | | | | | | | | | |
Net assets end of period/year (000’s) | | $ | 1,379,427 | | | $ | 1,043,345 | | | $ | 567,267 | | | $ | 168,782 | | | $ | 90,012 | | | $ | 78,738 | |
Expenses to average net assets | | | 0.90 | %(E) | | | 0.93 | % | | | 0.95 | % | | | 1.02 | % | | | 1.05 | % | | | 1.16 | % |
Net investment income (loss) to average net assets | | | 1.79 | %(E) | | | 2.20 | % | | | 2.63 | % | | | 2.40 | % | | | 2.39 | % | | | 2.79 | % |
Portfolio turnover rate | | | 9 | %(D) | | | 21 | % | | | 19 | % | | | 34 | % | | | 33 | % | | | 16 | % |
| (A) | Prior to March 1, 2011, information provided in previous periods reflects TS&W International Equity Portfolio, which is the accounting survivor pursuant to a Plan of Reorganization. Prior to November 1, 2010, the financial highlights were audited by another independent registered public accounting firm. |
| (B) | Calculated based on average number of shares outstanding. |
| (C) | Rounds to less than $0.01 or $(0.01). |
Mid Growth Funds
| | | | | | | | | | | | | | | | | | | | | | | | |
| For a share outstanding during the period and years indicated: | | Transamerica Partners Mid Growth | |
| | | June 30, 2016
(unaudited) | | | December 31,
2015 | | | December 31,
2014 | | | December 31,
2013 | | | December 31,
2012 | | | December 31,
2011 | |
Net asset value, beginning of period/year | | $ | 8.94 | | | $ | 10.04 | | | $ | 10.25 | | | $ | 10.47 | | | $ | 9.90 | | | $ | 10.70 | |
| | | | | | | | | | | | | | | | | | | | | | | | |
Investment operations:(A) | | | | | | | | | | | | | | | | | | | | | | | | |
Net investment income (loss)(B) | | | (0.02 | ) | | | (0.08 | ) | | | 0.01 | | | | (0.07 | ) | | | (0.05 | ) | | | (0.10 | ) |
Net realized and unrealized gain (loss) | | | (0.05 | ) | | | (0.13 | ) | | | 0.72 | | | | 2.99 | | | | 1.36 | | | | (0.70 | ) |
| | | | | | | | | | | | | | | | | | | | | | | | |
Total investment operations | | | (0.07 | ) | | | (0.21 | ) | | | 0.73 | | | | 2.92 | | | | 1.31 | | | | (0.80 | ) |
| | | | | | | | | | | | | | | | | | | | | | | | |
Dividends and/or distributions to shareholders: | | | | | | | | | | | | | | | | | | | | | | | | |
Net investment income | | | — | | | | — | | | | (0.01 | ) | | | — | | | | — | | | | — | |
Net realized gains | | | — | | | | (0.89 | ) | | | (0.93 | ) | | | (3.14 | ) | | | (0.74 | ) | | | — | |
| | | | | | | | | | | | | | | | | | | | | | | | |
Total dividends and/or distributions to shareholders | | | — | | | | (0.89 | ) | | | (0.94 | ) | | | (3.14 | ) | | | (0.74 | ) | | | — | |
| | | | | | | | | | | | | | | | | | | | | | | | |
Net asset value, end of period/year | | $ | 8.87 | | | $ | 8.94 | | | $ | 10.04 | | | $ | 10.25 | | | $ | 10.47 | | | $ | 9.90 | |
| | | | | | | | | | | | | | | | | | | | | | | | |
Total return(C) | | | (0.78 | )%(D) | | | (1.95 | )% | | | 7.41 | % | | | 29.54 | % | | | 13.29 | % | | | (7.48 | )% |
| | | | | | | | | | | | | | | | | | | | | | | | |
Ratio and supplemental data: | | | | | | | | | | | | | | | | | | | | | | | | |
Net assets end of period/year (000’s) | | $ | 48,616 | | | $ | 53,966 | | | $ | 59,584 | | | $ | 57,872 | | | $ | 52,310 | | | $ | 68,655 | |
Expenses to average net assets(A) | | | | | | | | | | | | | | | | | | | | | | | | |
Excluding waiver and/or reimbursement | | | 1.45 | %(E) | | | 1.39 | % | | | 1.41 | % | | | 1.41 | % | | | 1.41 | % | | | 1.38 | % |
Including waiver and/or reimbursement(F) | | | 1.35 | %(E) | | | 1.35 | % | | | 1.35 | % | | | 1.35 | % | | | 1.35 | % | | | 1.35 | % |
Net investment income (loss) to average net assets(A) | | | (0.58 | )%(E) | | | (0.72 | )% | | | 0.06 | % | | | (0.60 | )% | | | (0.51 | )% | | | (0.93 | )% |
Portfolio turnover rate of Series Portfolio | | | 27 | %(D) | | | 70 | % | | | 60 | % | | | 234 | % | | | 178 | % | | | 135 | % |
| (A) | The per share amounts and percentages include the Fund’s proportionate share of income and expenses of the Series Portfolio. |
| (B) | Calculated based on average number of shares outstanding. |
| (C) | Total return reflects Fund expenses and includes reinvestment of dividends and capital gains. |
| (F) | Includes waiver and/or reimbursement of fees at the underlying Series Portfolio level. |
- 201 -
| | | | | | | | | | | | | | | | | | | | | | | | |
| For a share outstanding during the period and years indicated: | | Transamerica Partners Institutional Mid Growth | |
| | | June 30, 2016
(unaudited) | | | December 31,
2015 | | | December 31,
2014 | | | December 31,
2013 | | | December 31,
2012 | | | December 31,
2011 | |
Net asset value, beginning of period/year | | $ | 10.54 | | | $ | 13.01 | | | $ | 14.09 | | | $ | 13.69 | | | $ | 12.04 | | | $ | 12.95 | |
| | | | | | | | | | | | | | | | | | | | | | | | |
Investment operations:(A) | | | | | | | | | | | | | | | | | | | | | | | | |
Net investment income (loss)(B) | | | (0.01 | ) | | | (0.04 | ) | | | 0.05 | | | | (0.03 | ) | | | (0.01 | ) | | | (0.07 | ) |
Net realized and unrealized gain (loss) | | | (0.05 | ) | | | (0.20 | ) | | | 0.98 | | | | 3.99 | | | | 1.66 | | | | (0.84 | ) |
| | | | | | | | | | | | | | | | | | | | | | | | |
Total investment operations | | | (0.06 | ) | | | (0.24 | ) | | | 1.03 | | | | 3.96 | | | | 1.65 | | | | (0.91 | ) |
| | | | | | | | | | | | | | | | | | | | | | | | |
Dividends and/or distributions to shareholders: | | | | | | | | | | | | | | | | | | | | | | | | |
Net investment income | | | — | | | | — | | | | (0.06 | ) | | | — | | | | — | | | | — | |
Net realized gains | | | — | | | | (2.23 | ) | | | (1.97 | ) | | | (3.56 | ) | | | — | | | | — | |
Return of capital | | | — | | | | — | | | | (0.08 | ) | | | — | | | | — | | | | — | |
| | | | | | | | | | | | | | | | | | | | | | | | |
Total dividends and/or distributions to shareholders | | | — | | | | (2.23 | ) | | | (2.11 | ) | | | (3.56 | ) | | | — | | | | — | |
| | | | | | | | | | | | | | | | | | | | | | | | |
Net asset value, end of period/year | | $ | 10.48 | | | $ | 10.54 | | | $ | 13.01 | | | $ | 14.09 | | | $ | 13.69 | | | $ | 12.04 | |
| | | | | | | | | | | | | | | | | | | | | | | | |
Total return(C) | | | (0.57 | )%(D) | | | (1.60 | )% | | | 7.83 | % | | | 30.10 | % | | | 13.70 | % | | | (7.03 | )% |
| | | | | | | | | | | | | | | | | | | | | | | | |
Ratio and supplemental data: | | | | | | | | | | | | | | | | | | | | | | | | |
Net assets end of period/year (000’s) | | $ | 15,773 | | | $ | 17,075 | | | $ | 22,686 | | | $ | 33,879 | | | $ | 37,985 | | | $ | 42,808 | |
Expenses to average net assets(A) | | | | | | | | | | | | | | | | | | | | | | | | |
Excluding waiver and/or reimbursement | | | 1.40 | %(E) | | | 1.22 | % | | | 1.24 | % | | | 1.18 | % | | | 1.19 | % | | | 1.15 | % |
Including waiver and/or reimbursement(F) | | | 0.95 | %(E) | | | 0.95 | % | | | 0.95 | % | | | 0.95 | % | | | 0.95 | % | | | 0.95 | % |
Net investment income (loss) to average net assets(A) | | | (0.18 | )%(E) | | | (0.31 | )% | | | 0.34 | % | | | (0.21 | )% | | | (0.09 | )% | | | (0.53 | )% |
Portfolio turnover rate of Series Portfolio | | | 27 | %(D) | | | 70 | % | | | 60 | % | | | 234 | % | | | 178 | % | | | 135 | % |
| (A) | The per share amounts and percentages include the Fund’s proportionate share of income and expenses of the Series Portfolio. |
| (B) | Calculated based on average number of shares outstanding. |
| (C) | Total return reflects Fund expenses and includes reinvestment of dividends and capital gains. |
| (F) | Includes waiver and/or reimbursement of fees at the underlying Series Portfolio level. |
| | | | | | | | | | | | | | | | | | | | | | | | |
| | | Transamerica Partners Mid Growth Portfolio | |
| | | June 30, 2016
(unaudited) | | | December 31,
2015 | | | December 31,
2014 | | | December 31,
2013 | | | December 31,
2012 | | | December 31,
2011 | |
Total return(A) | | | (0.47 | )%(B) | | | (1.37 | )% | | | 8.04 | % | | | 30.35 | % | | | 13.93 | % | | | (6.90 | )% |
| | | | | | | | | | | | | | | | | | | | | | | | |
Ratio and supplemental data: | | | | | | | | | | | | | | | | | | | | | | | | |
Net assets end of period/year (000’s) | | $ | 97,513 | | | $ | 107,745 | | | $ | 126,129 | | | $ | 150,143 | | | $ | 164,933 | | | $ | 206,602 | |
Expenses to average net assets | | | | | | | | | | | | | | | | | | | | | | | | |
Excluding waiver and/or reimbursement | | | 0.77 | %(C) | | | 0.76 | % | | | 0.76 | % | | | 0.77 | % | | | 0.76 | % | | | 0.75 | % |
Including waiver and/or reimbursement | | | 0.75 | %(C) | | | 0.75 | % | | | 0.75 | % | | | 0.75 | % | | | 0.75 | % | | | 0.75 | % |
Net investment income (loss) to average net assets | | | 0.02 | %(C) | | | (0.12 | )% | | | 0.60 | % | | | (0.00 | )%(D) | | | 0.10 | % | | | (0.33 | )% |
Portfolio turnover rate | | | 27 | %(B) | | | 70 | % | | | 60 | % | | | 234 | % | | | 178 | % | | | 135 | % |
| (A) | Total return reflects all Portfolio expenses. |
| (D) | Rounds to less than 0.01% or (0.01)%. |
- 202 -
| | | | | | | | | | | | |
| For a share outstanding during the period and years indicated: | | Transamerica Mid Cap Growth | |
| | | Class A | |
| | | April 30, 2016
(unaudited) | | | October 31,
2015 | | | October 31,
2014(A) | |
Net asset value, beginning of period/year | | $ | 11.36 | | | $ | 10.96 | | | $ | 10.00 | |
| | | | | | | | | | | | |
Investment operations: | | | | | | | | | | | | |
Net investment income (loss)(B) | | | (0.02 | ) | | | (0.03 | ) | | | (0.06 | ) |
Net realized and unrealized gain (loss) | | | (0.42 | ) | | | 0.48 | (C) | | | 1.02 | |
| | | | | | | | | | | | |
Total investment operations | | | (0.44 | ) | | | 0.45 | | | | 0.96 | |
| | | | | | | | | | | | |
Distributions: | | | | | | | | | | | | |
Net investment income | | | — | | | | (0.03 | ) | | | — | |
Net realized gains | | | — | | | | (0.01 | ) | | | — | |
Return of capital | | | — | | | | (0.01 | ) | | | — | |
| | | | | | | | | | | | |
Total distributions | | | — | | | | (0.05 | ) | | | — | |
| | | | | | | | | | | | |
Net asset value, end of period/year | | $ | 10.92 | | | $ | 11.36 | | | $ | 10.96 | |
| | | | | | | | | | | | |
Total return (D) | | | (3.87 | )%(E) | | | 4.23 | % | | | 9.60 | % |
| | | | | | | | | | | | |
Ratio and supplemental data: | | | | | | | | | | | | |
Net assets end of period/year (000’s) | | $ | 3,840 | | | $ | 2,734 | | | $ | 492 | |
Expenses to average net assets | | | | | | | | | | | | |
Excluding waiver and/or reimbursement and recapture | | | 1.19 | %(F) | | | 1.22 | % | | | 1.33 | % |
Including waiver and/or reimbursement and recapture | | | 1.19 | %(F) | | | 1.22 | %(G) | | | 1.31 | % |
Net investment income (loss) to average net assets | | | (0.46 | )%(F) | | | (0.28 | )% | | | (0.55 | )% |
Portfolio turnover rate | | | 41 | %(E) | | | 70 | % | | | 67 | % |
| (A) | Commenced operations on October 31, 2013. |
| (B) | Calculated based on average number of shares outstanding. |
| (C) | The amount of net realized and unrealized gain/(loss) per share does not correspond with the amounts reported in the Statements of Changes due to the timing of purchases and redemptions of Fund shares and fluctuating market values during the period. |
| (D) | Total return has been calculated without deduction of a sales load on an initial purchase. |
| (G) | Waiver and/or reimbursement rounds to less than 0.01%. |
Mid Value Funds
| | | | | | | | | | | | | | | | | | | | | | | | |
| For a share outstanding during the period and years indicated: | | Transamerica Partners Mid Value | |
| | | June 30, 2016
(unaudited) | | | December 31,
2015 | | | December 31,
2014 | | | December 31,
2013 | | | December 31,
2012 | | | December 31,
2011 | |
Net asset value, beginning of period/year | | $ | 20.04 | | | $ | 21.23 | | | $ | 19.04 | | | $ | 14.46 | | | $ | 12.26 | | | $ | 12.67 | |
| | | | | | | | | | | | | | | | | | | | | | | | |
Investment operations:(A) | | | | | | | | | | | | | | | | | | | | | | | | |
Net investment income (loss)(B) | | | 0.09 | | | | 0.15 | | | | 0.15 | | | | 0.06 | | | | 0.11 | | | | 0.07 | |
Net realized and unrealized gain (loss) | | | 1.35 | | | | (0.37 | ) | | | 2.20 | | | | 4.60 | | | | 2.20 | | | | (0.42 | ) |
| | | | | | | | | | | | | | | | | | | | | | | | |
Total investment operations | | | 1.44 | | | | (0.22 | ) | | | 2.35 | | | | 4.66 | | | | 2.31 | | | | (0.35 | ) |
| | | | | | | | | | | | | | | | | | | | | | | | |
Dividends and/or distributions to shareholders: | | | | | | | | | | | | | | | | | | | | | | | | |
Net investment income | | | (0.12 | ) | | | (0.18 | ) | | | (0.16 | ) | | | (0.08 | ) | | | (0.11 | ) | | | (0.06 | ) |
Net realized gains | | | — | | | | (0.79 | ) | | | — | | | | — | | | | — | | | | — | |
| | | | | | | | | | | | | | | | | | | | | | | | |
Total dividends and/or distributions to shareholders | | | (0.12 | ) | | | (0.97 | ) | | | (0.16 | ) | | | (0.08 | ) | | | (0.11 | ) | | | (0.06 | ) |
| | | | | | | | | | | | | | | | | | | | | | | | |
Net asset value, end of period/year | | $ | 21.36 | | | $ | 20.04 | | | $ | 21.23 | | | $ | 19.04 | | | $ | 14.46 | | | $ | 12.26 | |
| | | | | | | | | | | | | | | | | | | | | | | | |
Total return(C) | | | 7.18 | %(D) | | | (1.00 | )% | | | 12.37 | % | | | 32.30 | % | | | 18.88 | % | | | (2.68 | )% |
| | | | | | | | | | | | | | | | | | | | | | | | |
Ratio and supplemental data: | | | | | | | | | | | | | | | | | | | | | | | | |
Net assets end of period/year (000’s) | | $ | 128,975 | | | $ | 134,609 | | | $ | 161,070 | | | $ | 156,087 | | | $ | 127,161 | | | $ | 147,575 | |
Expenses to average net assets(A) | | | | | | | | | | | | | | | | | | | | | | | | |
Excluding waiver and/or reimbursement | | | 1.30 | %(E) | | | 1.29 | % | | | 1.30 | % | | | 1.30 | % | | | 1.32 | % | | | 1.29 | % |
Including waiver and/or reimbursement | | | 1.25 | %(E) | | | 1.25 | % | | | 1.25 | % | | | 1.25 | %(F) | | | 1.25 | %(F) | | | 1.25 | % |
Net investment income (loss) to average net assets(A) | | | 0.86 | %(E) | | | 0.72 | % | | | 0.77 | % | | | 0.38 | % | | | 0.78 | % | | | 0.52 | % |
Portfolio turnover rate of Series Portfolio | | | 24 | %(D) | | | 37 | % | | | 92 | % | | | 53 | % | | | 71 | % | | | 69 | % |
| (A) | The per share amounts and percentages include the Fund’s proportionate share of income and expenses of the Series Portfolio. |
| (B) | Calculated based on average number of shares outstanding. |
| (C) | Total return reflects Fund expenses and includes reinvestment of dividends and capital gains. |
| (F) | Includes waiver and/or reimbursement of fees at the underlying Series Portfolio level. |
- 203 -
| | | | | | | | | | | | | | | | | | | | | | | | |
| For a share outstanding during the period and years indicated: | | Transamerica Partners Institutional Mid Value | |
| | | June 30, 2016
(unaudited) | | | December 31,
2015 | | | December 31,
2014 | | | December 31,
2013 | | | December 31,
2012 | | | December 31,
2011 | |
Net asset value, beginning of period/year | | $ | 16.54 | | | $ | 19.17 | | | $ | 20.91 | | | $ | 16.46 | | | $ | 13.96 | | | $ | 14.42 | |
| | | | | | | | | | | | | | | | | | | | | | | | |
Investment operations:(A) | | | | | | | | | | | | | | | | | | | | | | | | |
Net investment income (loss)(B) | | | 0.10 | | | | 0.20 | | | | 0.24 | | | | 0.14 | | | | 0.18 | | | | 0.13 | |
Net realized and unrealized gain (loss) | | | 1.12 | | | | (0.34 | ) | | | 2.26 | | | | 5.18 | | | | 2.50 | | | | (0.47 | ) |
| | | | | | | | | | | | | | | | | | | | | | | | |
Total investment operations | | | 1.22 | | | | (0.14 | ) | | | 2.50 | | | | 5.32 | | | | 2.68 | | | | (0.34 | ) |
| | | | | | | | | | | | | | | | | | | | | | | | |
Dividends and/or distributions to shareholders: | | | | | | | | | | | | | | | | | | | | | | | | |
Net investment income | | | (0.12 | ) | | | (0.22 | ) | | | (0.24 | ) | | | (0.14 | ) | | | (0.18 | ) | | | (0.12 | ) |
Net realized gains | | | — | | | | (2.27 | ) | | | (4.00 | ) | | | (0.73 | ) | | | — | | | | — | |
| | | | | | | | | | | | | | | | | | | | | | | | |
Total dividends and/or distributions to shareholders | | | (0.12 | ) | | | (2.49 | ) | | | (4.24 | ) | | | (0.87 | ) | | | (0.18 | ) | | | (0.12 | ) |
| | | | | | | | | | | | | | | | | | | | | | | | |
Net asset value, end of period/year | | $ | 17.64 | | | $ | 16.54 | | | $ | 19.17 | | | $ | 20.91 | | | $ | 16.46 | | | $ | 13.96 | |
| | | | | | | | | | | | | | | | | | | | | | | | |
Total return(C) | | | 7.39 | %(D) | | | (0.65 | )% | | | 12.75 | % | | | 32.68 | % | | | 19.28 | % | | | (2.34 | )% |
| | | | | | | | | | | | | | | | | | | | | | | | |
Ratio and supplemental data: | | | | | | | | | | | | | | | | | | | | | | | | |
Net assets end of period/year (000’s) | | $ | 427,931 | | | $ | 375,612 | | | $ | 371,997 | | | $ | 470,530 | | | $ | 349,963 | | | $ | 290,325 | |
Expenses to average net assets(A) | | | | | | | | | | | | | | | | | | | | | | | | |
Excluding waiver and/or reimbursement | | | 1.03 | %(E) | | | 1.02 | % | | | 1.03 | % | | | 1.03 | % | | | 1.05 | % | | | 1.03 | % |
Including waiver and/or reimbursement | | | 0.90 | %(E) | | | 0.90 | % | | | 0.90 | % | | | 0.90 | %(F) | | | 0.90 | %(F) | | | 0.90 | % |
Net investment income (loss) to average net assets(A) | | | 1.18 | %(E) | | | 1.07 | % | | | 1.12 | % | | | 0.73 | % | | | 1.17 | % | | | 0.89 | % |
Portfolio turnover rate of Series Portfolio | | | 24 | %(D) | | | 37 | % | | | 92 | % | | | 53 | % | | | 71 | % | | | 69 | % |
| (A) | The per share amounts and percentages include the Fund’s proportionate share of income and expenses of the Series Portfolio. |
| (B) | Calculated based on average number of shares outstanding. |
| (C) | Total return reflects Fund expenses and includes reinvestment of dividends and capital gains. |
| (F) | Includes waiver and/or reimbursement of fees at the underlying Series Portfolio level. |
| | | | | | | | | | | | | | | | | | | | | | | | |
| | | Transamerica Partners Mid Value Portfolio | |
| | | June 30, 2016
(unaudited) | | | December 31,
2015 | | | December 31,
2014 | | | December 31,
2013 | | | December 31,
2012 | | | December 31,
2011 | |
Total return(A) | | | 7.71 | %(B) | | | (0.46 | )% | | | 12.97 | % | | | 32.99 | % | | | 19.50 | % | | | (2.19 | )% |
| | | | | | | | | | | | | | | | | | | | | | | | |
Ratio and supplemental data: | | | | | | | | | | | | | | | | | | | | | | | | |
Net assets end of period/year (000’s) | | $ | 844,091 | | | $ | 801,854 | | | $ | 868,934 | | | $ | 975,081 | | | $ | 777,964 | | | $ | 748,835 | |
Expenses to average net assets | | | | | | | | | | | | | | | | | | | | | | | | |
Excluding waiver and/or reimbursement | | | 0.69 | %(C) | | | 0.69 | % | | | 0.70 | % | | | 0.70 | % | | | 0.70 | % | | | 0.70 | % |
Including waiver and/or reimbursement | | | 0.69 | %(C) | | | 0.69 | % | | | 0.70 | % | | | 0.70 | % | | | 0.70 | % | | | 0.70 | % |
Net investment income (loss) to average net assets | | | 1.41 | %(C) | | | 1.28 | % | | | 1.32 | % | | | 0.93 | % | | | 1.36 | % | | | 1.08 | % |
Portfolio turnover rate | | | 24 | %(B) | | | 37 | % | | | 92 | % | | | 53 | % | | | 71 | % | | | 69 | % |
| (A) | Total return reflects all Portfolio expenses. |
| | | | | | | | | | | | |
| For a share outstanding during the periods and year indicated: | | Transamerica Mid Cap Value Opportunities | |
| | | Class A | |
| | | April 30, 2016
(unaudited) | | | October 31,
2015 | | | October 31,
2014(A) | |
Net asset value, beginning of period/year | | $ | 11.37 | | | $ | 10.68 | | | $ | 10.00 | |
| | | | | | | | | | | | |
Investment operations: | | | | | | | | | | | | |
Net investment income (loss)(B) | | | 0.08 | | | | 0.11 | | | | 0.07 | |
Net realized and unrealized gain (loss) | | | 0.08 | | | | 0.68 | | | | 0.69 | |
| | | | | | | | | | | | |
Total investment operations | | | 0.16 | | | | 0.79 | | | | 0.76 | |
| | | | | | | | | | | | |
Distributions: | | | | | | | | | | | | |
Net investment income | | | (0.14 | ) | | | (0.03 | ) | | | (0.08 | ) |
Net realized gains | | | (0.27 | ) | | | (0.07 | ) | | | — | |
| | | | | | | | | | | | |
Total distributions | | | (0.41 | ) | | | (0.10 | ) | | | (0.08 | ) |
| | | | | | | | | | | | |
Net asset value, end of period/year | | $ | 11.12 | | | $ | 11.37 | | | $ | 10.68 | |
| | | | | | | | | | | | |
Total return(C) | | | 1.51 | %(D) | | | 7.50 | % | | | 7.62 | %(D) |
| | | | | | | | | | | | |
Ratio and supplemental data: | | | | | | | | | | | | |
Net assets end of period/year (000’s) | | $ | 45,912 | | | $ | 18,794 | | | $ | 703 | |
Expenses to average net assets | | | 1.09 | %(E) | | | 1.05 | % | | | 1.18 | %(E) |
Net investment income (loss) to average net assets | | | 1.41 | %(E) | | | 1.02 | % | | | 1.38 | %(E) |
Portfolio turnover rate | | | 15 | %(D) | | | 31 | % | | | 23 | %(D) |
| (A) | Commenced operations on April 30, 2014 |
| (B) | Calculated based on average number of shares outstanding. |
| (C) | Total return has been calculated without deduction of a sales load on an initial purchase. |
- 204 -
Small Core Funds
| | | | | | | | | | | | | | | | | | | | | | | | |
| For a share outstanding during the period and years indicated: | | Transamerica Partners Small Core | |
| | | June 30, 2016
(unaudited) | | | December 31,
2015 | | | December 31,
2014 | | | December 31,
2013 | | | December 31,
2012 | | | December 31,
2011 | |
Net asset value, beginning of period/year | | $ | 25.81 | | | $ | 28.85 | | | $ | 27.98 | | | $ | 21.10 | | | $ | 18.54 | | | $ | 19.07 | |
| | | | | | | | | | | | | | | | | | | | | | | | |
Investment operations:(A) | | | | | | | | | | | | | | | | | | | | | | | | |
Net investment income (loss)(B) | | | 0.08 | | | | 0.13 | | | | 0.12 | | | | 0.03 | | | | 0.08 | | | | (0.06 | ) |
Net realized and unrealized gain (loss) | | | 0.96 | | | | (3.02 | ) | | | 0.88 | | | | 6.89 | | | | 2.58 | | | | (0.47 | ) |
| | | | | | | | | | | | | | | | | | | | | | | | |
Total investment operations | | | 1.04 | | | | (2.89 | ) | | | 1.00 | | | | 6.92 | | | | 2.66 | | | | (0.53 | ) |
| | | | | | | | | | | | | | | | | | | | | | | | |
Dividends and/or distributions to shareholders: | | | | | | | | | | | | | | | | | | | | | | | | |
Net investment income | | | (0.11 | ) | | | (0.15 | ) | | | (0.13 | ) | | | (0.04 | ) | | | (0.10 | ) | | | — | |
| | | | | | | | | | | | | | | | | | | | | | | | |
Net asset value, end of period/year | | $ | 26.74 | | | $ | 25.81 | | | $ | 28.85 | | | $ | 27.98 | | | $ | 21.10 | | | $ | 18.54 | |
| | | | | | | | | | | | | | | | | | | | | | | | |
Total return(C) | | | 4.02 | %(D) | | | (10.05 | )% | | | 3.58 | % | | | 32.80 | % | | | 14.33 | % | | | (2.78 | )% |
| | | | | | | | | | | | | | | | | | | | | | | | |
Ratio and supplemental data: | | | | | | | | | | | | | | | | | | | | | | | | |
Net assets end of period/year (000’s) | | $ | 62,033 | | | $ | 62,120 | | | $ | 82,191 | | | $ | 89,084 | | | $ | 80,670 | | | $ | 89,650 | |
Expenses to average net assets(A) | | | 1.48 | %(E) | | | 1.46 | % | | | 1.45 | % | | | 1.46 | % | | | 1.47 | % | | | 1.46 | % |
Net investment income (loss) to average net assets(A) | | | 0.66 | %(E) | | | 0.46 | % | | | 0.43 | % | | | 0.12 | % | | | 0.41 | % | | | (0.30 | )% |
Portfolio turnover rate of Series Portfolio | | | 72 | %(D) | | | 132 | % | | | 148 | % | | | 195 | % | | | 59 | % | | | 59 | % |
| (A) | The per share amounts and percentages include the Fund’s proportionate share of income and expenses of the Series Portfolio. |
| (B) | Calculated based on average number of shares outstanding. |
| (C) | Total return reflects Fund expenses and includes reinvestment of dividends and capital gains. |
| | | | | | | | | | | | | | | | | | | | | | | | |
| For a share outstanding during the period and years indicated: | | Transamerica Partners Institutional Small Core | |
| | | June 30, 2016
(unaudited) | | | December 31,
2015 | | | December 31,
2014 | | | December 31,
2013 | | | December 31,
2012 | | | December 31,
2011 | |
Net asset value, beginning of period/year | | $ | 13.66 | | | $ | 15.27 | | | $ | 14.81 | | | $ | 11.17 | | | $ | 9.81 | | | $ | 10.08 | |
| | | | | | | | | | | | | | | | | | | | | | | | |
Investment operations:(A) | | | | | | | | | | | | | | | | | | | | | | | | |
Net investment income (loss)(B) | | | 0.07 | | | | 0.12 | | | | 0.12 | | | | 0.06 | | | | 0.09 | | | | 0.01 | |
Net realized and unrealized gain (loss) | | | 0.51 | | | | (1.60 | ) | | | 0.46 | | | | 3.64 | | | | 1.36 | | | | (0.26 | ) |
| | | | | | | | | | | | | | | | | | | | | | | | |
Total investment operations | | | 0.58 | | | | (1.48 | ) | | | 0.58 | | | | 3.70 | | | | 1.45 | | | | (0.25 | ) |
| | | | | | | | | | | | | | | | | | | | | | | | |
Dividends and/or distributions to shareholders: | | | | | | | | | | | | | | | | | | | | | | | | |
Net investment income | | | (0.09 | ) | | | (0.13 | ) | | | (0.12 | ) | | | (0.06 | ) | | | (0.09 | ) | | | (0.02 | ) |
| | | | | | | | | | | | | | | | | | | | | | | | |
Net asset value, end of period/year | | $ | 14.15 | | | $ | 13.66 | | | $ | 15.27 | | | $ | 14.81 | | | $ | 11.17 | | | $ | 9.81 | |
| | | | | | | | | | | | | | | | | | | | | | | | |
Total return(C) | | | 4.24 | %(D) | | | (9.72 | )% | | | 3.94 | % | | | 33.23 | % | | | 14.84 | % | | | (2.47 | )% |
| | | | | | | | | | | | | | | | | | | | | | | | |
Ratio and supplemental data: | | | | | | | | | | | | | | | | | | | | | | | | |
Net assets end of period/year (000’s) | | $ | 12,168 | | | $ | 12,719 | | | $ | 27,550 | | | $ | 30,567 | | | $ | 32,600 | | | $ | 30,083 | |
Expenses to average net assets(A) | | | | | | | | | | | | | | | | | | | | | | | | |
Excluding waiver and/or reimbursement | | | 1.52 | %(E) | | | 1.32 | % | | | 1.28 | % | | | 1.27 | % | | | 1.31 | % | | | 1.28 | % |
Including waiver and/or reimbursement | | | 1.10 | %(E) | | | 1.10 | % | | | 1.10 | % | | | 1.10 | % | | | 1.10 | % | | | 1.10 | % |
Net investment income (loss) to average net assets(A) | | | 1.05 | %(E) | | | 0.82 | % | | | 0.78 | % | | | 0.46 | % | | | 0.85 | % | | | 0.05 | % |
Portfolio turnover rate of Series Portfolio | | | 72 | %(D) | | | 132 | % | | | 148 | % | | | 195 | % | | | 59 | % | | | 59 | % |
| (A) | The per share amounts and percentages include the Fund’s proportionate share of income and expenses of the Series Portfolio. |
| (B) | Calculated based on average number of shares outstanding. |
| (C) | Total return reflects Fund expenses and includes reinvestment of dividends and capital gains. |
| | | | | | | | | | | | | | | | | | | | | | | | |
| | | Transamerica Partners Small Core Portfolio | |
| | | June 30, 2016
(unaudited) | | | December 31,
2015 | | | December 31,
2014 | | | December 31,
2013 | | | December 31,
2012 | | | December 31,
2011 | |
Total return(A) | | | 3.63 | %(B) | | | (9.47 | )% | | | 4.21 | % | | | 33.62 | % | | | 15.04 | % | | | (2.19 | )% |
| | | | | | | | | | | | | | | | | | | | | | | | |
Ratio and supplemental data: | | | | | | | | | | | | | | | | | | | | | | | | |
Net assets end of period/year (000’s) | | $ | 225,890 | | | $ | 231,619 | | | $ | 306,291 | | | $ | 334,182 | | | $ | 296,936 | | | $ | 296,060 | |
Expenses to average net assets | | | 0.84 | %(C) | | | 0.84 | % | | | 0.83 | % | | | 0.84 | % | | | 0.84 | % | | | 0.84 | % |
Net investment income (loss) to average net assets | | | 1.31 | %(C) | | | 1.08 | % | | | 1.05 | % | | | 0.74 | % | | | 1.07 | % | | | 0.32 | % |
Portfolio turnover rate | | | 72 | %(B) | | | 132 | % | | | 148 | % | | | 195 | % | | | 59 | % | | | 59 | % |
| (A) | Total return reflects all Portfolio expenses. |
- 205 -
| | | | | | | | | | | | |
| For a share outstanding during the period and years indicated: | | Transamerica Small Cap Core | |
| | | Class A | |
| | | April 30, 2016
(unaudited) | | | October 31,
2015 | | | October 31,
2014(A) | |
Net asset value, beginning of period/year | | $ | 9.81 | | | $ | 10.80 | | | $ | 10.00 | |
| | | | | | | | | | | | |
Investment operations: | | | | | | | | | | | | |
Net investment income (loss)(B) | | | 0.02 | | | | 0.07 | | | | 0.06 | |
Net realized and unrealized gain (loss) | | | 0.29 | | | | (0.79 | ) | | | 0.76 | |
| | | | | | | | | | | | |
Total investment operations | | | 0.31 | | | | (0.72 | ) | | | 0.82 | |
| | | | | | | | | | | | |
Distributions: | | | | | | | | | | | | |
Net investment income | | | (0.27 | ) | | | (0.04 | ) | | | (0.02 | ) |
Net realized gains | | | — | | | | (0.23 | ) | | | — | |
| | | | | | | | | | | | |
Total distributions | | | (0.27 | ) | | | (0.27 | ) | | | (0.02 | ) |
| | | | | | | | | | | | |
Net asset value, end of period/year | | $ | 9.85 | | | $ | 9.81 | | | $ | 10.80 | |
| | | | | | | | | | | | |
Total return(C) | | | 3.23 | %(D) | | | (6.86 | )% | | | 8.18 | % |
| | | | | | | | | | | | |
Ratio and supplemental data: | | | | | | | | | | | | |
Net assets end of period/year (000’s) | | $ | 1,270 | | | $ | 605 | | | $ | 333 | |
Expenses to average net assets | | | | | | | | | | | | |
Excluding waiver and/or reimbursement and recapture | | | 1.37 | %(E) | | | 1.21 | % | | | 1.32 | % |
Including waiver and/or reimbursement and recapture | | | 1.30 | %(E) | | | 1.21 | % | | | 1.32 | % |
Net investment income (loss) to average net assets | | | 0.52 | %(E) | | | 0.63 | % | | | 0.55 | % |
Portfolio turnover rate | | | 38 | %(D) | | | 149 | % | | | 140 | % |
| (A) | Commenced operations on October 31, 2013. |
| (B) | Calculated based on average number of shares outstanding. |
| (C) | Total return has been calculated without deduction of a sales load on an initial purchase. |
Small Growth Funds
| | | | | | | | | | | | | | | | | | | | | | | | |
| For a share outstanding during the period and years indicated: | | Transamerica Partners Small Growth | |
| | | June 30, 2016
(unaudited) | | | December 31,
2015 | | | December 31,
2014 | | | December 31,
2013 | | | December 31,
2012 | | | December 31,
2011 | |
Net asset value, beginning of period/year | | $ | 15.97 | | | $ | 16.56 | | | $ | 17.63 | | | $ | 12.86 | | | $ | 12.78 | | | $ | 13.75 | |
| | | | | | | | | | | | | | | | | | | | | | | | |
Investment operations:(A) | | | | | | | | | | | | | | | | | | | | | | | | |
Net investment income (loss)(B) | | | (0.08 | ) | | | (0.11 | ) | | | (0.17 | ) | | | (0.17 | ) | | | (0.11 | ) | | | (0.14 | ) |
Net realized and unrealized gain (loss) | | | 0.98 | | | | 0.60 | | | | 0.55 | | | | 4.94 | | | | 0.19 | | | | (0.83 | ) |
| | | | | | | | | | | | | | | | | | | | | | | | |
Total investment operations | | | 0.90 | | | | 0.49 | | | | 0.38 | | | | 4.77 | | | | 0.08 | | | | (0.97 | ) |
| | | | | | | | | | | | | | | | | | | | | | | | |
Dividends and/or distributions to shareholders: | | | | | | | | | | | | | | | | | | | | | | | | |
Net investment income | | | — | | | | (0.04 | ) | | | — | | | | — | | | | — | | | | — | |
Net realized gains | | | — | | | | (1.04 | ) | | | (1.45 | ) | | | — | | | | — | | | | — | |
| | | | | | | | | | | | | | | | | | | | | | | | |
Total dividends and/or distributions to shareholders | | | — | | | | (1.08 | ) | | | (1.45 | ) | | | — | | | | — | | | | — | |
| | | | | | | | | | | | | | | | | | | | | | | | |
Net asset value, end of period/year | | $ | 16.87 | | | $ | 15.97 | | | $ | 16.56 | | | $ | 17.63 | | | $ | 12.86 | | | $ | 12.78 | |
| | | | | | | | | | | | | | | | | | | | | | | | |
Total return (C) | | | 5.64 | %(D) | | | 2.89 | % | | | 2.45 | % | | | 37.09 | % | | | 0.63 | % | | | (7.05 | )% |
| | | | | | | | | | | | | | | | | | | | | | | | |
Ratio and supplemental data: | | | | | | | | | | | | | | | | | | | | | | | | |
Net assets end of period/year (000’s) | | $ | 38,466 | | | $ | 40,221 | | | $ | 38,948 | | | $ | 35,415 | | | $ | 25,251 | �� | | $ | 34,335 | |
Expenses to average net assets(A) | | | | | | | | | | | | | | | | | | | | | | | | |
Excluding waiver and/or reimbursement | | | 1.60 | %(E) | | | 1.56 | % | | | 1.60 | % | | | 1.62 | % | | | 1.69 | % | | | 1.62 | % |
Including waiver and/or reimbursement(F) | | | 1.55 | %(E) | | | 1.55 | % | | | 1.55 | % | | | 1.55 | % | | | 1.55 | % | | | 1.55 | % |
Net investment income (loss) to average net assets(A) | | | (0.98 | )%(E) | | | (0.64 | )% | | | (1.02 | )% | | | (1.11 | )% | | | (0.82 | )% | | | (1.02 | )% |
Portfolio turnover rate of Series Portfolio | | | 50 | %(D) | | | 53 | % | | | 78 | % | | | 72 | % | | | 209 | % | | | 120 | % |
| (A) | The per share amounts and percentages include the Fund’s proportionate share of income and expenses of the Series Portfolio. |
| (B) | Calculated based on average number of shares outstanding. |
| (C) | Total return reflects Fund expenses and includes reinvestment of dividends and capital gains. |
| (F) | Includes waiver and/or reimbursement of fees at the underlying Series Portfolio level |
- 206 -
| | | | | | | | | | | | | | | | | | | | | | | | |
| For a share outstanding during the period and years indicated: | | Transamerica Partners Institutional Small Growth | |
| | | June 30, 2016
(unaudited) | | | December 31,
2015 | | | December 31,
2014 | | | December 31,
2013 | | | December 31,
2012 | | | December 31,
2011 | |
Net asset value, beginning of period/year | | $ | 18.15 | | | $ | 18.31 | | | $ | 17.80 | | | $ | 12.93 | | | $ | 12.79 | | | $ | 13.71 | |
| | | | | | | | | | | | | | | | | | | | | | | | |
Investment operations:(A) | | | | | | | | | | | | | | | | | | | | | | | | |
Net investment income (loss)(B) | | | (0.05 | ) | | | (0.04 | ) | | | (0.11 | ) | | | (0.11 | ) | | | (0.06 | ) | | | (0.08 | ) |
Net realized and unrealized gain (loss) | | | 1.11 | | | | 0.65 | | | | 0.62 | | | | 4.98 | | | | 0.20 | | | | (0.84 | ) |
| | | | | | | | | | | | | | | | | | | | | | | | |
Total investment operations | | | 1.06 | | | | 0.61 | | | | 0.51 | | | | 4.87 | | | | 0.14 | | | | (0.92 | ) |
| | | | | | | | | | | | | | | | | | | | | | | | |
Dividends and/or distributions to shareholders: | | | | | | | | | | | | | | | | | | | | | | | | |
Net investment income | | | — | | | | (0.06 | ) | | | — | | | | — | | | | — | | | | — | |
Net realized gains | | | — | | | | (0.71 | ) | | | — | | | | — | | | | — | | | | — | |
| | | | | | | | | | | | | | | | | | | | | | | | |
Total dividends and/or distributions to shareholders | | | — | | | | (0.77 | ) | | | — | | | | — | | | | — | | | | — | |
| | | | | | | | | | | | | | | | | | | | | | | | |
Net asset value, end of period/year | | $ | 19.21 | | | $ | 18.15 | | | $ | 18.31 | | | $ | 17.80 | | | $ | 12.93 | | | $ | 12.79 | |
| | | | | | | | | | | | | | | | | | | | | | | | |
Total return(C) | | | 5.84 | %(D) | | | 3.31 | % | | | 2.87 | % | | | 37.67 | % | | | 1.09 | % | | | (6.71 | )% |
| | | | | | | | | | | | | | | | | | | | | | | | |
Ratio and supplemental data: | | | | | | | | | | | | | | | | | | | | | | | | |
Net assets end of period/year (000’s) | | $ | 10,670 | | | $ | 10,201 | | | $ | 11,049 | | | $ | 13,660 | | | $ | 12,761 | | | $ | 19,353 | |
Expenses to average net assets(A) | | | | | | | | | | | | | | | | | | | | | | | | |
Excluding waiver and/or reimbursement | | | 1.78 | %(E) | | | 1.50 | % | | | 1.61 | % | | | 1.45 | % | | | 1.62 | % | | | 1.43 | % |
Including waiver and/or reimbursement(F) | | | 1.15 | %(E) | | | 1.15 | % | | | 1.15 | % | | | 1.15 | % | | | 1.15 | % | | | 1.15 | % |
Net investment income (loss) to average net assets(A) | | | (0.57 | )%(E) | | | (0.20 | )% | | | (0.63 | )% | | | (0.71 | )% | | | (0.43 | )% | | | (0.63 | )% |
Portfolio turnover rate of Series Portfolio | | | 50 | %(D) | | | 53 | % | | | 78 | % | | | 72 | % | | | 209 | % | | | 120 | % |
| (A) | The per share amounts and percentages include the Fund’s proportionate share of income and expenses of the Series Portfolio. |
| (B) | Calculated based on average number of shares outstanding. |
| (C) | Total return reflects Fund expenses and includes reinvestment of dividends and capital gains. |
| (F) | Includes waiver and/or reimbursement of fees at the underlying Series Portfolio level. |
| | | | | | | | | | | | | | | | | | | | | | | | |
| | | Transamerica Partners Small Growth Portfolio | |
| | | June 30, 2016
(unaudited) | | | December 31,
2015 | | | December 31,
2014 | | | December 31,
2013 | | | December 31,
2012 | | | December 31,
2011 | |
Total return(A) | | | 5.98 | %(B) | | | 3.55 | % | | | 3.13 | % | | | 37.97 | % | | | 1.30 | % | | | (6.45 | )% |
| | | | | | | | | | | | | | | | | | | | | | | | |
Ratio and supplemental data: | | | | | | | | | | | | | | | | | | | | | | | | |
Net assets end of period/year (000’s) | | $ | 66,338 | | | $ | 66,942 | | | $ | 66,461 | | | $ | 73,064 | | | $ | 58,300 | | | $ | 108,124 | |
Expenses to average net assets | | | | | | | | | | | | | | | | | | | | | | | | |
Excluding waiver and/or reimbursement | | | 0.91 | %(C) | | | 0.91 | % | | | 0.91 | % | | | 0.93 | % | | | 0.94 | % | | | 0.94 | % |
Including waiver and/or reimbursement | | | 0.90 | %(C) | | | 0.90 | % | | | 0.90 | % | | | 0.90 | % | | | 0.90 | % | | | 0.90 | % |
Net investment income (loss) to average net assets | | | (0.33 | )%(C) | | | 0.01 | % | | | (0.37 | )% | | | (0.46 | )% | | | (0.20 | )% | | | (0.37 | )% |
Portfolio turnover rate | | | 50 | %(B) | | | 53 | % | | | 78 | % | | | 72 | % | | | 209 | % | | | 120 | % |
| (A) | Total return reflects all Portfolio expenses. |
| | | | | | | | | | | | | | | | | | | | |
| For a share outstanding during the periods and years indicated: | | Transamerica Small Cap Growth | |
| | | Class A | |
| | | April 30, 2016
(unaudited) | | | October 31,
2015 | | | October 31,
2014 | | | October 31,
2013 | | | October 31,
2012 (A) | |
Net asset value, beginning of period/year | | $ | 12.82 | | | $ | 12.87 | | | $ | 12.37 | | | $ | 9.38 | | | $ | 10.00 | |
| | | | | | | | | | | | | | | | | | | | |
Investment operations: | | | | | | | | | | | | | | | | | | | | |
Net investment income (loss)(B) | | | (0.05 | ) | | | (0.03 | ) | | | (0.11 | ) | | | (0.08 | ) | | | (0.02 | ) |
Net realized and unrealized gain (loss) | | | (0.09 | ) | | | 1.03 | | | | 0.61 | | | | 3.07 | | | | (0.60 | ) |
| | | | | | | | | | | | | | | | | | | | |
Total investment operations | | | (0.14 | ) | | | 1.00 | | | | 0.50 | | | | 2.99 | | | | (0.62 | ) |
| | | | | | | | | | | | | | | | | | | | |
Distributions: | | | | | | | | | | | | | | | | | | | | |
Net investment income | | | (0.00 | )(C) | | | — | | | | — | | | | (0.00 | )(C) | | | — | |
Net realized gains | | | (1.06 | ) | | | (1.05 | ) | | | — | | | | — | | | | — | |
| | | | | | | | | | | | | | | | | | | | |
Total distributions | | | (1.06 | ) | | | (1.05 | ) | | | — | | | | (0.00 | )(C) | | | — | |
| | | | | | | | | | | | | | | | | | | | |
Net asset value, end of period/year | | $ | 11.62 | | | $ | 12.82 | | | $ | 12.87 | | | $ | 12.37 | | | $ | 9.38 | |
| | | | | | | | | | | | | | | | | | | | |
Total return(D) | | | (1.09 | )%(E) | | | 8.27 | % | | | 4.04 | % | | | 31.90 | % | | | (6.20 | )%(E) |
| | | | | | | | | | | | | | | | | | | | |
Ratio and supplemental data: | | | | | | | | | | | | | | | | | | | | |
Net assets end of period/year (000’s) | | $ | 4,500 | | | $ | 2,882 | | | $ | 862 | | | $ | 591 | | | $ | 236 | |
Expenses to average net assets | | | | | | | | | | | | | | | | | | | | |
Excluding waiver and/or reimbursement and recapture | | | 1.33 | %(F) | | | 1.30 | % | | | 1.35 | % | | | 1.29 | % | | | 1.52 | %(F) |
Including waiver and/or reimbursement and recapture | | | 1.33 | %(F) | | | 1.30 | % | | | 1.35 | % | | | 1.29 | % | | | 1.45 | %(F) |
Net investment income (loss) to average net assets | | | (0.82 | )%(F) | | | (0.26 | )% | | | (0.87 | )% | | | (0.70 | )% | | | (1.17 | )%(F) |
Portfolio turnover rate | | | 19 | %(E) | | | 60 | % | | | 73 | % | | | 74 | % | | | 11 | %(E) |
| (A) | Commenced operations on August 31, 2012. |
| (B) | Calculated based on average number of shares outstanding. |
| (C) | Rounds to less than $0.01 or $(0.01). |
| (D) | Total return has been calculated without deduction of a sales load on an initial purchase. |
- 207 -
Small Value Funds
| | | | | | | | | | | | | | | | | | | | | | | | |
| For a share outstanding during the period and years indicated: | | Transamerica Partners Small Value | |
| | | June 30, 2016
(unaudited) | | | December 31,
2015 | | | December 31,
2014 | | | December 31,
2013 | | | December 31,
2012 | | | December 31,
2011 | |
Net asset value, beginning of period/year | | $ | 15.09 | | | $ | 17.07 | | | $ | 16.06 | | | $ | 12.09 | | | $ | 10.54 | | | $ | 10.46 | |
| | | | | | | | | | | | | | | | | | | | | | | | |
Investment operations:(A) | | | | | | | | | | | | | | | | | | | | | | | | |
Net investment income (loss)(B) | | | 0.04 | | | | 0.05 | | | | 0.05 | | | | (0.01 | ) | | | 0.09 | | | | 0.00 | (C) |
| | | | | | | | | | | | | | | | | | | | | | | | |
Net realized and unrealized gain (loss) | | | 0.09 | | | | (1.21 | ) | | | 1.02 | | | | 4.03 | | | | 1.52 | | | | 0.08 | |
| | | | | | | | | | | | | | | | | | | | | | | | |
Total investment operations | | | 0.13 | | | | (1.16 | ) | | | 1.07 | | | | 4.02 | | | | 1.61 | | | | 0.08 | |
Dividends and/or distributions to shareholders: | | | | | | | | | | | | | | | | | | | | | | | | |
Net investment income | | | (0.05 | ) | | | (0.04 | ) | | | (0.06 | ) | | | (0.05 | ) | | | (0.06 | ) | | | (0.00 | )(C) |
Net realized gains | | | — | | | | (0.78 | ) | | | — | | | | — | | | | — | | | | — | |
| | | | | | | | | | | | | | | | | | | | | | | | |
Total dividends and/or distributions to shareholders | | | (0.05 | ) | | | (0.82 | ) | | | (0.06 | ) | | | (0.05 | ) | | | (0.06 | ) | | | (0.00 | )(C) |
| | | | | | | | | | | | | | | | | | | | | | | | |
Net asset value, end of period/year | | $ | 15.17 | | | $ | 15.09 | | | $ | 17.07 | | | $ | 16.06 | | | $ | 12.09 | | | $ | 10.54 | |
| | | | | | | | | | | | | | | | | | | | | | | | |
Total return(D) | | | 0.86 | %(E) | | | (6.75 | )% | | | 6.69 | % | | | 33.31 | % | | | 15.30 | % | | | 0.78 | % |
| | | | | | | | | | | | | | | | | | | | | | | | |
Ratio and supplemental data: | | | | | | | | | | | | | | | | | | | | | | | | |
Net assets end of period/year (000’s) | | $ | 34,443 | | | $ | 36,463 | | | $ | 40,861 | | | $ | 35,786 | | | $ | 26,117 | | | $ | 31,392 | |
Expenses to average net assets(A) | | | | | | | | | | | | | | | | | | | | | | | | |
Excluding waiver and/or reimbursement | | | 1.63 | %(F) | | | 1.56 | % | | | 1.57 | % | | | 1.57 | % | | | 1.61 | % | | | 1.57 | % |
Including waiver and/or reimbursement(G) | | | 1.50 | %(F) | | | 1.50 | % | | | 1.50 | % | | | 1.50 | % | | | 1.50 | % | | | 1.50 | % |
Net investment income (loss) to average net assets(A) | | | 0.49 | %(F) | | | 0.32 | % | | | 0.34 | % | | | (0.08 | )% | | | 0.80 | % | | | (0.01 | )% |
Portfolio turnover rate of Series Portfolio | | | 42 | %(E) | | | 133 | % | | | 18 | % | | | 16 | % | | | 15 | % | | | 16 | % |
| (A) | The per share amounts and percentages include the Fund’s proportionate share of income and expenses of the Series Portfolio. |
| (B) | Calculated based on average number of shares outstanding. |
| (C) | Rounds to less than $0.01 or $(0.01). |
| (D) | Total return reflects Fund expenses and includes reinvestment of dividends and capital gains. |
| (G) | Includes waiver and/or reimbursement of fees at the underlying Series Portfolio level. |
| | | | | | | | | | | | | | | | | | | | | | | | |
| For a share outstanding during the period and years indicated: | | Transamerica Partners Institutional Small Value | |
| | | June 30, 2016
(unaudited) | | | December 31,
2015 | | | December 31,
2014 | | | December 31,
2013 | | | December 31,
2012 | | | December 31,
2011 | |
Net asset value, beginning of period/year | | $ | 20.56 | | | $ | 22.08 | | | $ | 20.78 | | | $ | 15.65 | | | $ | 13.64 | | | $ | 13.53 | |
| | | | | | | | | | | | | | | | | | | | | | | | |
Investment operations:(A) | | | | | | | | | | | | | | | | | | | | | | | | |
Net investment income (loss)(B) | | | 0.09 | | | | 0.16 | | | | 0.15 | | | | 0.06 | | | | 0.18 | | | | 0.05 | |
Net realized and unrealized gain (loss) | | | 0.12 | | | | (1.55 | ) | | | 1.31 | | | | 5.22 | | | | 1.97 | | | | 0.10 | |
| | | | | | | | | | | | | | | | | | | | | | | | |
Total investment operations | | | 0.21 | | | | (1.39 | ) | | | 1.46 | | | | 5.28 | | | | 2.15 | | | | 0.15 | |
| | | | | | | | | | | | | | | | | | | | | | | | |
Dividends and/or distributions to shareholders: | | | | | | | | | | | | | | | | | | | | | | | | |
Net investment income | | | (0.13 | ) | | | (0.13 | ) | | | (0.16 | ) | | | (0.15 | ) | | | (0.14 | ) | | | (0.04 | ) |
| | | | | | | | | | | | | | | | | | | | | | | | |
Net asset value, end of period/year | | $ | 20.64 | | | $ | 20.56 | | | $ | 22.08 | | | $ | 20.78 | | | $ | 15.65 | | | $ | 13.64 | |
| | | | | | | | | | | | | | | | | | | | | | | | |
Total return(C) | | | 1.01 | %(D) | | | (6.33 | )% | | | 7.08 | % | | | 33.88 | % | | | 15.81 | % | | | 1.11 | % |
| | | | | | | | | | | | | | | | | | | | | | | | |
Ratio and supplemental data: | | | | | | | | | | | | | | | | | | | | | | | | |
Net assets end of period/year (000’s) | | $ | 6,550 | | | $ | 6,709 | | | $ | 8,537 | | | $ | 11,948 | | | $ | 13,475 | | | $ | 15,014 | |
Expenses to average net assets(A) | | | | | | | | | | | | | | | | | | | | | | | | |
Excluding waiver and/or reimbursement | | | 1.89 | %(E) | | | 1.73 | % | | | 1.67 | % | | | 1.41 | % | | | 1.47 | % | | | 1.40 | % |
Including waiver and/or reimbursement(F) | | | 1.10 | %(E) | | | 1.10 | % | | | 1.10 | % | | | 1.10 | % | | | 1.10 | % | | | 1.10 | % |
Net investment income (loss) to average net assets(A) | | | 0.89 | %(E) | | | 0.73 | % | | | 0.73 | % | | | 0.31 | % | | | 1.22 | % | | | 0.37 | % |
Portfolio turnover rate of Series Portfolio | | | 42 | %(D) | | | 133 | % | | | 18 | % | | | 16 | % | | | 15 | % | | | 16 | % |
| (A) | The per share amounts and percentages include the Fund’s proportionate share of income and expenses of the Series Portfolio. |
| (B) | Calculated based on average number of shares outstanding. |
| (C) | Total return reflects Fund expenses and includes reinvestment of dividends and capital gains. |
| (F) | Includes waiver and/or reimbursement of fees at the underlying Series Portfolio level. |
| | | | | | | | | | | | | | | | | | | | | | | | |
| | | Transamerica Partners Small Value Portfolio | |
| | | June 30, 2016
(unaudited) | | | December 31,
2015 | | | December 31,
2014 | | | December 31,
2013 | | | December 31,
2012 | | | December 31,
2011 | |
Total return(A) | | | 0.34 | %(B) | | | (6.12 | )% | | | 7.38 | % | | | 34.10 | % | | | 16.11 | % | | | 1.35 | % |
| | | | | | | | | | | | | | | | | | | | | | | | |
Ratio and supplemental data: | | | | | | | | | | | | | | | | | | | | | | | | |
Net assets end of period/year (000’s) | | $ | 64,884 | | | $ | 67,821 | | | $ | 76,593 | | | $ | 82,298 | | | $ | 70,183 | | | $ | 103,958 | |
Expenses to average net assets | | | | | | | | | | | | | | | | | | | | | | | | |
Excluding waiver and/or reimbursement | | | 0.90 | %(C) | | | 0.90 | % | | | 0.88 | % | | | 0.88 | % | | | 0.88 | % | | | 0.87 | % |
Including waiver and/or reimbursement | | | 0.85 | %(C) | | | 0.85 | % | | | 0.85 | % | | | 0.85 | % | | | 0.85 | % | | | 0.85 | % |
Net investment income (loss) to average net assets | | | 1.14 | %(C) | | | 0.97 | % | | | 0.99 | % | | | 0.57 | % | | | 1.41 | % | | | 0.63 | % |
Portfolio turnover rate | | | 42 | %(B) | | | 133 | % | | | 18 | % | | | 16 | % | | | 15 | % | | | 16 | % |
| (A) | Total return reflects all Portfolio expenses. |
- 208 -
| | | | | | | | | | | | | | | | | | | | |
| For a share outstanding during the periods and years indicated: | | Transamerica Small Cap Value | |
| | | Class A | |
| | | April 30, 2016
(unaudited) | | | October 31,
2015 | | | October 31,
2014 | | | October 31,
2013 | | | October 31,
2012(A) | |
Net asset value, beginning of period/year | | $ | 10.97 | | | $ | 12.95 | | | $ | 13.21 | | | $ | 9.83 | | | $ | 10.00 | |
| | | | | | | | | | | | | | | | | | | | |
Investment operations: | | | | | | | | | | | | | | | | | | | | |
Net investment income (loss)(B)(C) | | | 0.03 | | | | 0.11 | | | | 0.08 | | | | 0.06 | | | | 0.04 | |
Net realized and unrealized gain (loss) | | | (0.56 | ) | | | (0.83 | ) | | | 0.56 | | | | 3.39 | | | | (0.21 | ) |
| | | | | | | | | | | | | | | | | | | | |
Total investment operations | | | (0.53 | ) | | | (0.72 | ) | | | 0.64 | | | | 3.45 | | | | (0.17 | ) |
| | | | | | | | | | | | | | | | | | | | |
Distributions: | | | | | | | | | | | | | | | | | | | | |
Net investment income | | | (0.12 | ) | | | (0.09 | ) | | | (0.08 | ) | | | (0.07 | ) | | | — | |
Net realized gains | | | (0.85 | ) | | | (1.17 | ) | | | (0.82 | ) | | | (0.00 | )(D) | | | — | |
| | | | | | | | | | | | | | | | | | | | |
Total distributions | | | (0.97 | ) | | | (1.26 | ) | | | (0.90 | ) | | | (0.07 | ) | | | — | |
| | | | | | | | | | | | | | | | | | | | |
Net asset value, end of period/year | | $ | 9.47 | | | $ | 10.97 | | | $ | 12.95 | | | $ | 13.21 | | | $ | 9.83 | |
| | | | | | | | | | | | | | | | | | | | |
Total return(E) | | | (4.97 | )%(F) | | | (6.35 | )% | | | 4.99 | % | | | 35.30 | % | | | (1.70 | )%(F) |
| | | | | | | | | | | | | | | | | | | | |
Ratio and supplemental data: | | | | | | | | | | | | | | | | | | | | |
Net assets end of period/year (000’s) | | $ | 1,311 | | | $ | 1,124 | | | $ | 955 | | | $ | 996 | | | $ | 268 | |
Expenses to average net assets(G) | | | | | | | | | | | | | | | | | | | | |
Excluding waiver and/or reimbursement and recapture | | | 1.38 | %(H) | | | 1.31 | % | | | 1.38 | % | | | 1.37 | % | | | 1.36 | %(H) |
Including waiver and/or reimbursement and recapture | | | 1.30 | %(H) | | | 1.31 | %(I) | | | 1.38 | % | | | 1.37 | % | | | 1.36 | %(H) |
Net investment income (loss) to average net assets (C) | | | 0.64 | %(H) | | | 0.96 | % | | | 0.61 | % | | | 0.50 | % | | | 0.91 | %(H) |
Portfolio turnover rate (J) | | | 52 | %(F) | | | 145 | % | | | 37 | % | | | 49 | % | | | 22 | %(F) |
| (A) | Commenced operations on April 30, 2012. |
| (B) | Calculated based on average number of shares outstanding. |
| (C) | Recognition of net investment income by the Fund is affected by the timing of the declaration of dividends by the investment companies and/or ETFs in which the Fund invests. |
| (D) | Rounds to less than $0.01 or $(0.01). |
| (E) | Total return has been calculated without deduction of a sales load on an initial purchase. |
| (G) | Does not include expenses of the investment companies and/or ETFs in which the Fund invests. |
| (I) | Waiver and/or reimbursement rounds to less than 0.01%. |
| (J) | Does not include portfolio activity of the investment companies and/or ETFs in which the Fund invests. |
- 209 -
INFORMATION CONCERNING THE MEETING
Solicitation of Proxies
The principal solicitation of proxies will be by mailing of this Proxy Statement/Prospectus, but proxies may be solicited by telephone or in person by the representatives of the Target Board, regular employees of TFS, their affiliates, or [Computershare Fund Services], a private proxy services firm. If the Target Fund has not received your vote as the date of the Special Meeting approaches, you may receive a call from these parties to ask for your vote. Arrangements will be made with brokerage houses and other custodians, nominees and fiduciaries to forward proxies and proxy materials to their principals.
The cost of the meeting, including the preparation and mailing of the notice, Proxy Statement/Prospectus and the solicitation of proxies, including reimbursement to broker-dealers and others who forwarded proxy materials to their clients, with respect to the Reorganizations will be shared equally by TAM, on the one hand, and, subject to certain limits, the Target Funds and Destination Funds, on the other.
Revoking Proxies
Each Target Fund shareholder signing and returning a proxy has the power to revoke it at any time before it is exercised:
| | • | | By filing a written notice of revocation with the Secretary of the Target Trust; |
| | • | | By returning a duly executed proxy bearing a later date; |
| | • | | By voting by telephone or over the Internet at a later date; or |
| | • | | By attending the meeting and voting in person at the meeting and giving oral notice of revocation to the chairman of the meeting. |
However, attendance in-person at the meeting, by itself, will not revoke a previously executed and returned proxy.
If a Target Fund holder holds Target Fund shares through a bank or other intermediary, the bank or intermediary should be consulted regarding the shareholder’s ability to revoke voting instructions after such instructions have been provided.
Outstanding Shares
Only holders of record of each Target Fund at the close of business on the Record Date, October 14, 2016, are entitled to notice of and to vote at the Special Meeting. As of the close of business on the Record Date, the following shares of each Target Fund were outstanding:
| | |
Fund | | Shares Outstanding
(as of October 14,
2016) |
Transamerica Partners Core Bond | | [ ] |
Transamerica Partners Institutional Core Bond | | [ ] |
Transamerica Partners Core Bond Portfolio | | [ ] |
Transamerica Partners Government Money Market | | [ ] |
Transamerica Partners Institutional Government Money Market | | [ ] |
Transamerica Partners Government Money Market Portfolio | | [ ] |
Transamerica Partners High Yield Bond | | [ ] |
Transamerica Partners Institutional High Yield Bond | | [ ] |
Transamerica Partners High Yield Bond Portfolio | | [ ] |
- 210 -
| | |
Transamerica Partners International Equity | | [ ] |
Transamerica Partners Institutional International Equity | | [ ] |
Transamerica Partners International Equity Portfolio | | [ ] |
Transamerica Partners Mid Growth | | [ ] |
Transamerica Partners Institutional Mid Growth | | [ ] |
Transamerica Partners Mid Growth Portfolio | | [ ] |
Transamerica Partners Mid Value | | [ ] |
Transamerica Partners Institutional Mid Value | | [ ] |
Transamerica Partners Mid Value Portfolio | | [ ] |
Transamerica Partners Small Core | | [ ] |
Transamerica Partners Institutional Small Core | | [ ] |
Transamerica Partners Small Core Portfolio | | [ ] |
Transamerica Partners Small Growth | | [ ] |
Transamerica Partners Institutional Small Growth | | [ ] |
Transamerica Partners Small Growth Portfolio | | [ ] |
Transamerica Partners Small Value | | [ ] |
Transamerica Partners Institutional Small Value | | [ ] |
Transamerica Partners Small Value Portfolio | | [ ] |
Other Business
Your Target Board knows of no business to be presented for consideration at the meeting other than the Proposals set forth in this Proxy Statement/Prospectus. If other business is properly brought before the meeting, proxies will be voted in accordance with the discretion of the persons named as proxies.
Adjournments
If, by the time scheduled for the meeting, a quorum of shareholders of a Target Fund is not present, or if a quorum is present but sufficient votes “for” a Proposal have not been received, the chairperson of the meeting may adjourn the meeting or the persons named as proxies may propose an adjournment of the meeting to another date and time, and the meeting may be held as adjourned as to the Target Fund or the Proposal, as applicable, within a reasonable time after the original meeting date without further notice. If submitted to shareholders, any such adjournment will require the affirmative vote of a majority of the shares present in person or represented by proxy at the meeting (or a majority of votes cast if a quorum is present). The persons named as proxies, at their discretion, vote those proxies in favor of an adjournment of the meeting. A shareholder vote may be taken on any proposal prior to any such adjournment if sufficient votes have been received and it is otherwise appropriate. The persons named in the enclosed proxy may also move for an adjournment of the meeting to permit further solicitation of proxies with respect to any of the Proposals if they determine that adjournment and further solicitation are reasonable and in the best interests of shareholders.
Telephone and Internet Voting
In addition to soliciting proxies by mail or in person, the Target Funds have also arranged to have votes recorded by telephone, the Internet or other electronic means by following the enclosed instructions. The voting procedures used in connection with such voting methods are designed to authenticate shareholders’ identities, to allow shareholders to authorize the voting of their shares in accordance with their instructions and to confirm that their instructions have been properly recorded. If you authorize your proxy by telephone or Internet, please do not return your proxy card, unless you later elect to change your vote.
- 211 -
Shareholders’ Proposals
As a general matter, the Target Funds do not hold annual shareholder meetings. Shareholders wishing to submit proposals for inclusion in a proxy statement for a subsequent meeting (if any) should send their written proposals to Tané T. Tyler, Secretary, 1801 California Street, Suite 5200, Denver, Colorado 80202.
Proposals must be received a reasonable time prior to the date of a meeting of shareholders of the applicable Fund to be considered for inclusion in the proxy materials for the meeting. Timely submission of a proposal does not, however, necessarily mean that the proposal will be included. Persons named as proxies for any subsequent shareholder meeting will vote in their discretion with respect to proposals submitted on an untimely basis.
Appraisal Rights
If the Reorganization of your Target Fund is approved at the Special Meeting, shareholders of your Target Fund will not have the right to dissent and obtain payment of the fair value of their shares because the exercise of appraisal rights is subject to the forward pricing requirements of Rule 22c-1 under the 1940 Act, which supersedes state law. Shareholder of your Target Fund, however, have the right to redeem their Target Fund shares until the Closing Date of the Reorganization.
OWNERSHIP OF SHARES OF THE FUNDS
To the knowledge of each Target Fund, as of October 14, 2016, the Trustees and officers of the Target Funds owned in the aggregate less than 1% of the outstanding shares of each Target Fund.
To the knowledge of each Destination Fund, as of October 14, 2016, the Trustees and officers of the Destination Funds owned in the aggregate less than 1% of the outstanding shares of each Destination Fund.
To the knowledge of each Target Fund, as of October 14, 2016, the following persons owned of record or beneficially 5% or more of the outstanding shares of a Target Fund:
| | | | | | | | | | | | |
Fund | | Name and Address | | | Number of
Shares | | | Owned
Beneficially
or
of Record? | |
Transamerica Partners Core Bond | | | | | | | | | | | | |
Transamerica Partners Institutional Core Bond | | | | | | | | | | | | |
Transamerica Partners Core Bond Portfolio | | | | | | | | | | | | |
Transamerica Partners Government Money Market | | | | | | | | | | | | |
Transamerica Partners Institutional Government Money Market | | | | | | | | | | | | |
Transamerica Partners Government Money Market Portfolio | | | | | | | | | | | | |
Transamerica Partners High Yield Bond | | | | | | | | | | | | |
Transamerica Partners Institutional High Yield Bond | | | | | | | | | | | | |
Transamerica Partners High Yield Bond Portfolio | | | | | | | | | | | | |
Transamerica Partners International Equity | | | | | | | | | | | | |
Transamerica Partners Institutional International Equity | | | | | | | | | | | | |
Transamerica Partners International Equity Portfolio | | | | | | | | | | | | |
Transamerica Partners Mid Growth | | | | | | | | | | | | |
Transamerica Partners Institutional Mid Growth | | | | | | | | | | | | |
Transamerica Partners Mid Growth Portfolio | | | | | | | | | | | | |
- 212 -
| | | | | | | | | | | | |
Fund | | Name and Address | | | Number of
Shares | | | Owned
Beneficially
or
of Record? | |
Transamerica Partners Mid Value | | | | | | | | | | | | |
Transamerica Partners Institutional Mid Value | | | | | | | | | | | | |
Transamerica Partners Mid Value Portfolio | | | | | | | | | | | | |
Transamerica Partners Small Core | | | | | | | | | | | | |
Transamerica Partners Institutional Small Core | | | | | | | | | | | | |
Transamerica Partners Small Core Portfolio | | | | | | | | | | | | |
Transamerica Partners Small Growth | | | | | | | | | | | | |
Transamerica Partners Institutional Small Growth | | | | | | | | | | | | |
Transamerica Partners Small Growth Portfolio | | | | | | | | | | | | |
Transamerica Partners Small Value | | | | | | | | | | | | |
Transamerica Partners Institutional Small Value | | | | | | | | | | | | |
Transamerica Partners Small Value Portfolio | | | | | | | | | | | | |
To the knowledge of each Destination Fund, as of October 14, 2016, the following persons owned of record or beneficially 5% or more of the outstanding shares of a Destination Fund:
| | | | | | | | | | | | |
Fund | | Name and Address | | | Number of
Shares | | | Owned
Beneficially
or
of Record? | |
Transamerica Intermediate Bond | | | | | | | | | | | | |
Transamerica Government Money Market | | | | | | | | | | | | |
Transamerica High Yield Bond | | | | | | | | | | | | |
Transamerica International Equity | | | | | | | | | | | | |
Transamerica Mid Cap Growth | | | | | | | | | | | | |
Transamerica Mid Cap Value Opportunities | | | | | | | | | | | | |
Transamerica Small Cap Core | | | | | | | | | | | | |
Transamerica Small Cap Growth | | | | | | | | | | | | |
Transamerica Small Cap Value | | | | | | | | | | | | |
EXPERTS
Target Funds
The financial statements and financial highlights of each Target Fund for the past five fiscal years or since inception of the Target Fund, as applicable, are incorporated by reference into this Proxy Statement/Prospectus. The financial statements and financial highlights of each Target Fund for its most recent fiscal year end December 31, 2015 have been audited by Ernst & Young LLP, independent registered public accounting firm, as set forth in their report thereon incorporated by reference into this Proxy Statement/Prospectus. Such financial statements and financial highlights are incorporated by reference herein in reliance upon such report given on the authority of such firm as experts in accounting and auditing.
Destination Funds
The financial statements and financial highlights of each Destination Fund for the past five fiscal years or since inception of the Target Fund, as applicable, are incorporated by reference into this Proxy Statement/Prospectus. The financial statements and financial highlights of each Target Fund for its most recent fiscal year end October 31, 2015 have been audited by Ernst & Young LLP, independent registered public accounting firm, as set forth in their report thereon incorporated by reference into this Proxy Statement/Prospectus. Such financial statements and financial highlights are incorporated by reference herein in reliance upon such report given on the authority of such firm as experts in accounting and auditing.
- 213 -
AVAILABLE INFORMATION
You can obtain more free information about each Fund from your investment firm or by writing to your Fund at 1801 California Street, Suite 5200, Denver, Colorado 80202. You may also call 1-888-233-4339.
The Target Feeder Funds’ statements of additional information are available free of charge on the Target Funds’ website at http://www.transamericapartners.com/content/prospectus.aspx.
The Target Master Portfolios’ statement of additional information is available to qualified investors free of charge by calling 1-888-233-4339.
The Destinations Funds’ statement of additional information is available free of charge on the Destination Funds’ website at https://www.transamerica.com/individual/products/mutual-funds/prospectus/.
Shareholder reports. Annual and semi-annual reports to shareholders, and quarterly reports filed with the SEC, provide information about each Fund’s investments. An annual report discusses market conditions and investment strategies that significantly affected each Fund’s performance during its last fiscal year.
Each Fund is subject to the informational requirements of the Securities Exchange Act of 1934, as amended, and the 1940 Act and files reports, proxy statements and other information with the SEC. These reports, proxy statements and other information filed by the Funds and their predecessors can be inspected and copied (for a duplication fee) at the public reference facilities of the SEC at 100 F Street, N.E., Washington, DC 20549. Copies of these materials can also be obtained by mail from the Public Reference Branch, Office of Consumer Affairs and Information Services, Securities and Exchange Commission, Washington, DC 20549, at prescribed rates. In addition, copies of these documents may be viewed on-screen or downloaded from the SEC’s Internet site at www.sec.gov.
|
| By Order of the Boards of Trustees, |
|
| [ ] |
| Tané T. Tyler, Secretary |
| Transamerica Partners Fund Group |
| Transamerica Partners Fund Group II |
| Transamerica Partners Portfolios |
Denver, Colorado
[ ], 2016
- 214 -
EXHIBIT A
FORM OF AGREEMENT AND PLAN OF REORGANIZATION
This AGREEMENT AND PLAN OF REORGANIZATION (“Agreement”) is made as of this [ ] day of [ ], 2017, by and among Transamerica Funds, a Delaware statutory trust (the “Acquiring Entity”), with its principal place of business at 1801 California St., Suite 5200, Denver, Colorado 80202, on behalf of each of its series listed on Exhibit A attached hereto (each, an “Acquiring Fund”), and [Transamerica Partners Funds Group/ Transamerica Partners Funds Group II, a Massachusetts business trust] [Transamerica Partners Portfolios, a New York trust] (the “Acquired Entity”), with its principal place of business at 1801 California St., Suite 5200, Denver, Colorado 80202, on behalf of each of its series listed on Exhibit A attached hereto (each, an “Acquired Fund”)[, and, solely for purposes of paragraph 10.2 hereof, Transamerica Asset Management, Inc. (“TAM”)].
WHEREAS, each Acquired Fund and Acquiring Fund is a series of an open-end management investment company registered pursuant to the Investment Company Act of 1940, as amended (the “1940 Act”);
[Transamerica Partners Funds Group and Transamerica Partners Funds Group II only - WHEREAS, it is intended that, for United States federal income tax purposes (i) each transaction contemplated by this Agreement constitute a “reorganization” within the meaning of Section 368(a) of the Internal Revenue Code of 1986, as amended (the “Code”), and (ii) this Agreement constitute a plan of reorganization within the meaning of Section 368 of the Code and Treasury Regulations Section 1.368-2(g);]
[Transamerica Partners Funds Group and Transamerica Partners Funds Group II only - WHEREAS, prior to the transactions contemplated by this Agreement, each Acquired Fund that operates as a feeder fund and invests its assets in a master portfolio which is a series of Transamerica Partners Portfolios will redeem in-kind (subject to its pro rata share of liabilities) its beneficial interests in the applicable master portfolio; [[Transamerica Partners Portfolios only - WHEREAS, prior to the transactions contemplated by this Agreement, each Acquired Fund shareholder that is treated as a “regulated investment company” under the Internal Revenue Code of 1986, as amended (the “Code”), and that operates as a feeder fund, investing substantially all its assets in an Acquired Fund, will redeem in-kind (subject to its pro rata share of liabilities) its beneficial interests in the Acquired Fund;]
WHEREAS, each reorganization of an Acquired Fund listed on Exhibit A will consist of (1) the sale, assignment, conveyance, transfer and delivery of all of the property and assets of the Acquired Fund to the corresponding Acquiring Fund listed on Exhibit A (as to each Acquired Fund, the “corresponding Acquiring Fund”) in exchange solely for (a) shares of the applicable class of shares of beneficial interest of that Acquiring Fund listed on Exhibit A (the “Acquiring Fund Shares”), as described herein, and (b) the assumption by the Acquiring Fund of all liabilities of the Acquired Fund, and (2) the subsequent distribution of the Acquiring Fund Shares (which shall then constitute all of the assets of the Acquired Fund) to the holders of the [Transamerica Partners Funds Group and Transamerica Partners Funds Group II - shares of beneficial interest] [Transamerica Partners Portfolios - beneficial interests] of the Acquired Fund (the “Acquired Fund Shares”) in complete redemption of the Acquired Fund Shares and the termination of the Acquired Fund, as provided herein (each, a “Reorganization”), all upon the terms and conditions hereinafter set forth in this Agreement;
A-1
WHEREAS, the Board of Trustees of the Acquiring Entity (the “Acquiring Entity Board”) has determined, with respect to each Acquiring Fund listed on Exhibit A, that the sale, assignment, conveyance, transfer and delivery of all of the property and assets of the corresponding Acquired Fund listed on Exhibit A (as to each Acquiring Fund, the “corresponding Acquired Fund”) in exchange for Acquiring Fund Shares and the assumption of all liabilities of that Acquired Fund by the Acquiring Fund is in the best interests of the Acquiring Fund and its holders and that the interests of the existing holders of the Acquiring Fund will not be diluted as a result of this transaction; and
WHEREAS, the Board of Trustees of the Acquired Entity (the “Acquired Entity Board”) has determined, with respect to each Acquired Fund, that the sale, assignment, conveyance, transfer and delivery of all of the property and assets of the Acquired Fund in exchange for Acquiring Fund Shares and the assumption of all liabilities of the Acquired Fund by the corresponding Acquiring Fund is in the best interests of the Acquired Fund and its holders and that the interests of the existing holders of the Acquired Fund will not be diluted as a result of this transaction;
NOW, THEREFORE, in consideration of the premises and of the covenants and agreements hereinafter set forth, the parties hereto covenant and agree as follows:
| 1. | TRANSFER OF ASSETS OF EACH ACQUIRED FUND TO THE CORRESPONDING ACQUIRING FUND IN EXCHANGE FOR ACQUIRING FUND SHARES IN SUCH ACQUIRING FUND, ASSUMPTION OF ALL LIABILITIES OF THAT ACQUIRED FUND AND TERMINATION OF THAT ACQUIRED FUND |
1.1 Subject to requisite approvals and the other terms and conditions herein set forth and on the basis of the representations and warranties contained herein, the Acquired Entity, on behalf of each Acquired Fund listed on Exhibit A, agrees to sell, assign, convey, transfer and deliver all of its property and assets attributable to that Acquired Fund, as set forth in paragraph 1.2, to the corresponding Acquiring Fund, and the Acquiring Entity, on behalf of that Acquiring Fund, agrees in exchange therefor: (a) to deliver to the corresponding Acquired Fund as of the time and date set forth in paragraph 3.1 the number of full and fractional Acquiring Fund Shares of that Acquiring Fund determined by dividing the value of the Acquired Entity’s net assets with respect to the Acquired Fund (computed in the manner and as of the time and date set forth in paragraph 2.1) by the net asset value of one share of Acquiring Fund Shares of that Acquiring Fund (computed in the manner and as of the time and date set forth in paragraph 2.2); and (b) to assume all Liabilities (as defined in paragraph 1.2) of the corresponding Acquired Fund as set forth in paragraph 1.2. Such transactions shall take place on a closing date as provided for in paragraph 3.1 (the “Closing Date”). Exhibit A attached hereto shows each Acquired Fund, the corresponding Acquiring Fund and the class of Acquiring Fund Shares to be delivered to the Acquired Fund.
1.2 The property and assets of the Acquired Entity attributable to each Acquired Fund to be sold, assigned, conveyed, transferred and delivered to and acquired by the Acquiring Entity, on behalf of the corresponding Acquiring Fund, shall consist of all assets and property of every kind and nature of the Acquired Fund, including, without limitation, all rights, receivables (including dividend, interest and other receivables), cash, cash equivalents, claims (whether absolute or contingent, known or unknown), securities, commodities and futures interests, good will and other intangible property, any deferred or prepaid expenses and all interests, rights, privileges and powers, the Acquired Fund owns at the Valuation Date (as defined in
A-2
paragraph 2.1) (collectively, “Assets”). The “Liabilities” of each Acquired Fund to be assumed by the corresponding Acquiring Fund consist of all of the liabilities and obligations of the corresponding Acquired Fund, including, without limitation, all indemnification obligations of such Acquired Fund with respect to the current and former members of the Acquired Entity Board and officers of the Acquired Entity, whether accrued or contingent, known or unknown, existing at the Valuation Date. Each Acquired Fund will promptly assign, convey, transfer and deliver to the Acquiring Entity, on behalf of the corresponding Acquiring Fund, any rights, stock dividends, cash dividends or other securities received by the Acquired Fund after the Closing Date as stock dividends, cash dividends or other distributions on or with respect to the property and assets transferred, which rights, stock dividends, cash dividends and other securities shall be deemed included in the property and assets transferred to the Acquiring Entity, on behalf of the corresponding Acquiring Fund, at the Closing Date and shall not be separately valued, in which case any such distribution that remains unpaid as of the Closing Date shall be included in the determination of the value of the assets of the Acquired Fund acquired by the Acquiring Entity on behalf of the corresponding Acquiring Fund.
1.3 Immediately upon delivery to the Acquired Fund of the Acquiring Fund Shares, the Acquired Entity, on behalf of such Acquired Fund, as an initial shareholder of the Acquiring Fund, shall approve the distribution plan pursuant to Rule 12b-1 under the 1940 Act for the Acquiring Fund with respect to the class of Acquiring Fund Shares received by the Acquired Fund in the Reorganization.
1.4 Immediately following the actions contemplated by paragraphs 1.1 and 1.3, the Acquired Entity shall take such actions as may be necessary or appropriate to complete the liquidation of each Acquired Fund. To complete the liquidation, the Acquired Entity, on behalf of each Acquired Fund, shall (a) distribute to the holders of record of Acquired Fund Shares as of the Closing Date (“Acquired Fund Shareholders”), on a pro rata basis, the Acquiring Fund Shares of the corresponding Acquiring Fund received by the Acquired Entity, on behalf of that Acquired Fund, pursuant to paragraph 1.1, in complete redemption of such Acquired Fund Shares, and (b) terminate the Acquired Fund in accordance with applicable state law. Such distribution and redemption shall be accomplished by the transfer of the Acquiring Fund Shares then credited to the account of the Acquired Fund on the books of the corresponding Acquiring Fund to open accounts on the share records of the Acquiring Fund in the names of the Acquired Fund Shareholders. The aggregate net asset value of Acquiring Fund Shares of each Acquiring Fund to be so credited to each of the corresponding Acquired Fund Shareholders holding Acquired Fund Shares of the corresponding Acquired Fund shall be equal to the aggregate net asset value of the Acquired Fund Shares of that Acquired Fund owned by that Acquired Fund Shareholder on the Closing Date. All issued Acquired Fund Shares will be canceled on the books of the Acquired Fund. The Acquiring Fund shall not issue certificates representing Acquiring Fund Shares in connection with such exchange.
1.5 Ownership of Acquiring Fund Shares will be shown on the books of the Acquiring Fund as maintained by the Acquiring Fund’s transfer agent.
1.6 Any reporting responsibility of an Acquired Fund, including, but not limited to, the responsibility for filing regulatory reports, tax returns, or other documents with the Securities and Exchange Commission (“Commission”), any state securities commission, and any federal, state or local tax authorities or any other relevant regulatory authority, is and shall remain the responsibility of the Acquired Entity, on behalf of such Acquired Fund. The Acquiring Entity shall fully cooperate to the extent necessary or desirable for these responsibilities to be discharged.
A-3
1.7 As promptly as practicable following the Reorganization of each Acquired Fund, the Acquired Entity will take all necessary action to effect the Acquired Fund’s deregistration as an investment company in accordance with the rules and regulations of the Commission and shall subsequently voluntarily dissolve in accordance with the requirements of [Transamerica Partners Funds Group and Transamerica Partners Funds Group II - Massachusetts] [Transamerica Partners Portfolios - New York].
2.1 The value of the Assets and the amount of the Liabilities of each Acquired Fund shall be determined as of the time for calculation of its net asset value as set forth in the then-current prospectus for the Acquired Fund, and after the declaration of any dividends by the Acquired Fund, on the applicable Closing Date (such time and date being hereinafter called the “Valuation Date”), computed using the valuation procedures established by the Acquired Entity Board and the Acquiring Entity Board. All computations of value and amounts shall be subject to confirmation by the independent registered public accounting firm for the applicable Acquired Fund.
2.2 The net asset value per share of the Acquiring Fund Shares of each Acquiring Fund shall be determined as of the time for calculation of the applicable Acquiring Fund’s net asset value as set forth in the then-current prospectus for the Acquiring Fund on the Valuation Date, computed using the valuation procedures established by the Acquired Entity Board and the Acquiring Entity Board. All computations of value and amounts shall be subject to confirmation by the independent registered public accounting firm for the applicable Acquiring Fund.
| 3. | CLOSING AND CLOSING DATE |
3.1 Subject to the terms and conditions set forth herein, the Closing Date with respect to each Reorganization shall be as specified on Exhibit A attached hereto, or such other date as the parties may agree with respect to such Reorganization. All acts taking place at the closing of a Reorganization as provided for in this Agreement with respect to each such Reorganization (a “Closing”) shall be deemed to take place simultaneously as of the “close of business” on the Closing Date for such Reorganization unless otherwise agreed to by the parties. The close of business on the Closing Date shall be as of [Transamerica Partners Funds Group - 4:30 p.m. Eastern Time for each Reorganization involving an Acquired Fund that operates as a feeder fund and invests its assets in a master portfolio and 6:00 p.m. Eastern Time for each Reorganization involving an Acquired Fund that operates as an asset allocation fund and currently invests its assets in various feeder funds] [Transamerica Partners Funds Group II - 5:00 p.m. Eastern Time for each Reorganization involving an Acquired Fund that operates as a feeder fund and currently invests its assets in a master portfolio and 6:00 p.m. Eastern Time for each Reorganization involving an Acquired Fund that operates as an asset allocation fund and invests its assets in various feeder funds] [Transamerica Partners Portfolios - 5:30 p.m. Eastern Time], or, as to any Reorganization, such later time on that date as the applicable Acquired Fund’s net asset value and/or the net asset value per share of the class of shares of the corresponding Acquiring Fund is calculated in accordance with Article 2 and after the declaration of any dividends. The Closing shall be held at the offices of [TAM, 1801 California St., Suite 5200, Denver, Colorado 80202], or at such other time and/or place as the parties may agree.
3.2 At the Closing of each Reorganization, the Acquired Entity shall direct State Street Bank and Trust Company (the “Custodian”) to transfer ownership of the Assets from the accounts of the applicable Acquired Fund that the Custodian maintains as custodian for the Acquired Fund to the accounts of the corresponding
A-4
Acquiring Fund that the Custodian maintains as custodian for the Acquiring Fund. The Acquired Entity shall, within one business day after the Closing for each Reorganization, deliver to the applicable Acquiring Entity a certificate of an authorized officer stating that (i) the Assets of the corresponding Acquired Fund have been so transferred as of the Closing Date, and (ii) all necessary taxes in connection with the delivery of the Assets of that Acquired Fund, including all applicable federal and state stock transfer stamps, if any, have been paid or provision for payment has been made.
3.3 The Acquired Entity shall direct Transamerica Fund Services, Inc., in its capacity as transfer agent for each Acquired Fund (“Transfer Agent”), to deliver to the Acquiring Entity, within one business day after the Closing of each Reorganization, a certificate of an authorized officer stating that its records contain the name and address of each Acquired Fund Shareholder of the applicable Acquired Fund and the number and percentage ownership of the outstanding Acquired Fund Shares owned by each such holder immediately prior to the Closing. At the Closing of each Reorganization, the applicable Acquiring Fund shall deliver to the Secretary of the corresponding Acquired Fund a confirmation evidencing that the appropriate number of Acquiring Fund Shares of the appropriate class have been credited to the Acquired Fund’s account on the books of such Acquiring Fund pursuant to paragraph 1.1. At the applicable Closing, each party shall deliver to the other party such bills of sale, checks, assignments, share certificates, if any, receipts or other documents as the other party or its counsel may reasonably request.
3.4 In the event that on the Valuation Date (a) the New York Stock Exchange or another primary trading market for portfolio securities of an Acquiring Fund or an Acquired Fund (each, an “Exchange”) shall be closed to trading or trading thereupon shall be restricted, or (b) trading or the reporting of trading on such Exchange or elsewhere shall be disrupted so that accurate appraisal of the value of the net assets of such Acquired Fund or such Acquiring Fund is impracticable (in the judgment of the Acquiring Entity Board with respect to such Acquiring Fund and the Acquired Entity Board with respect to such Acquired Fund), the Closing Date for the applicable Reorganization shall be postponed until the first Friday (that is also a business day) after the day when trading shall have been fully resumed and reporting shall have been restored.
| 4. | REPRESENTATIONS AND WARRANTIES |
4.1 Except as has been fully disclosed to the Acquiring Entity in Schedule 4.1 of this Agreement, the Acquired Entity, on behalf of each Acquired Fund, represents and warrants to the Acquiring Entity and the corresponding Acquiring Fund as follows:
(a) Such Acquired Fund is duly established as a series of the Acquired Entity, which is a [Transamerica Partners Funds Group and Transamerica Partners Funds Group II - business trust validly existing and in good standing under the laws of the Commonwealth of Massachusetts] [Transamerica Partners Portfolios - trust validly existing and in good standing under the laws of the State of New York], with power under its charter documents, as amended (the “Acquired Entity Charter”), to own all of its assets and to carry on its business as it is being conducted as of the date hereof. The Acquired Entity is duly qualified to do business as a foreign corporation in each jurisdiction in which the conduct of its business makes such qualification necessary except where the failure to so qualify would not have a material adverse effect on the condition (financial or otherwise), business, properties, net assets or results of operations of the Acquired Entity. The Acquired Entity has all necessary federal, state and local authorization to carry on its business as now being conducted and to fulfill the terms of this Agreement, except as set forth in paragraph 4.1(c).
A-5
(b) The Acquired Entity is a registered open-end management investment company, and its registration with the Commission as an investment company under the 1940 Act [Transamerica Partners Funds Group and Transamerica Partners Funds Group II only -, and the registration of Acquired Fund Shares under the Securities Act of 1933, as amended (the “1933 Act”),] is in full force and effect.
(c) No consent, approval, authorization, or order of any court or governmental authority is required for the consummation by the Acquired Fund of the transactions contemplated herein, except such as may be required under the [Transamerica Partners Funds Group and Transamerica Partners Funds Group II - 1933 Act] [Transamerica Partners Portfolios - the Securities Act of 1933, as amended (the “1933 Act”)], the Securities Exchange Act of 1934 (the “1934 Act”), the 1940 Act, state securities laws and the Hart-Scott-Rodino Act.
(d) The current prospectus and statement of additional information of such Acquired Fund (true and correct copies of which have been delivered to the Acquiring Entity) and each prospectus and statement of additional information of the Acquired Fund used during the three (3) years prior to the date of this Agreement conforms or conformed at the time of its use in all material respects to the applicable requirements of the 1933 Act and the 1940 Act and the rules and regulations of the Commission thereunder and does not or did not at the time of its use include any untrue statement of a material fact or omit to state any material fact required to be stated therein or necessary to make the statements therein, in light of the circumstances under which they were made, not materially misleading.
(e) On the Closing Date, the Acquired Entity, on behalf of such Acquired Fund, will have good and marketable title to such Acquired Fund’s Assets and full right, power and authority to sell, assign, convey, transfer and deliver such Assets hereunder free of any liens or other encumbrances, and upon delivery and payment for the Assets, the Acquiring Entity, on behalf of the corresponding Acquiring Fund, will acquire good and marketable title thereto, subject to no restrictions on the full transfer thereof, excluding such restrictions as might arise under the 1933 Act.
(f) The Acquired Fund is not engaged currently, and the execution, delivery and performance of this Agreement by the Acquired Entity, on behalf of such Acquired Fund, will not result, in a material violation of [Transamerica Partners Funds Group and Transamerica Partners Funds Group II - Massachusetts] [Transamerica Partners Portfolios - New York] law or of the Acquired Entity Charter or the by-laws of the Acquired Entity, or of any agreement, indenture, instrument, contract, lease or other undertaking to which the Acquired Entity, on behalf of such Acquired Fund, is a party or by which it is bound, and the execution, delivery and performance of this Agreement by the Acquired Entity, on behalf of such Acquired Fund, will not result in the acceleration of any material obligation, or the imposition of any material penalty, under any agreement, indenture, instrument, contract, lease, judgment or decree to which the Acquired Entity, on behalf of such Acquired Fund, is a party or by which it is bound.
(g) All material contracts or other commitments of such Acquired Fund (other than this Agreement, certain investment contracts, including options, futures, swaps and forward contracts, the indemnification agreements of the current and former members of the Acquired Entity Board, and those contracts listed in Schedule 4.1) will terminate without liability to such Acquired Fund on or prior to the Closing Date. Each contract listed in Schedule 4.1 is a valid, binding and enforceable obligation of such Acquired Fund and, to the Acquired Fund’s knowledge, the other parties thereto (assuming due authorization, execution and delivery by the other parties thereto) and the assignment by such Acquired Fund to the corresponding Acquiring Fund of
each such contract will not result in the termination of such contract, any breach or default thereunder by such Acquired Fund or the imposition of any penalty thereunder.
A-6
(h) No litigation or administrative proceeding or investigation of or before any court or governmental body is pending or, to the Acquired Entity’s knowledge, threatened against the Acquired Entity, with respect to such Acquired Fund or any of its properties or assets, that, if adversely determined, would materially and adversely affect its financial condition or the conduct of such Acquired Fund’s business. The Acquired Entity, on behalf of such Acquired Fund, is not a party to or subject to the provisions of any order, decree or judgment of any court or governmental body that materially and adversely affects such Acquired Fund’s business or the Acquired Entity’s ability to consummate the transactions herein contemplated on behalf of such Acquired Fund.
(i) The Statement of Assets and Liabilities, Statements of Operations and Changes in Net Assets and Schedule of Investments of such Acquired Fund as at the last day of and for the most recently completed fiscal year of such Acquired Fund prior to the date of this Agreement have been audited by Ernst & Young LLP, independent registered public accounting firm, and are in accordance with accounting principles generally accepted in the United States of America (“GAAP”) consistently applied, and such statements (true and correct copies of which have been furnished to the Acquiring Entity) present fairly, in all material respects, the financial condition of such Acquired Fund as of such date and for such period in accordance with GAAP, and there are no known contingent, accrued or other liabilities of such Acquired Fund required to be reflected on a balance sheet (including the notes thereto) in accordance with GAAP as of such date that are not disclosed therein.
(j) Since the last day of the most recently completed fiscal year of such Acquired Fund prior to the date of this Agreement, there has not been any material adverse change in such Acquired Fund’s financial condition, assets, liabilities or business, or any incurrence by the Acquired Fund of indebtedness for money borrowed maturing more than one year from the date such indebtedness was incurred. For the purposes of this subparagraph (j), a decline in net asset value per share of Acquired Fund Shares due to declines in market values of securities held by such Acquired Fund, the discharge of Acquired Fund liabilities, or the redemption of Acquired Fund Shares by holders of such Acquired Fund shall not constitute a material adverse change.
(k) All federal and other tax returns, dividend reporting forms and other tax-related reports of such Acquired Fund required by law to have been filed (taking into account any extensions) shall have been timely filed (taking such extensions into account) and shall be correct in all material respects, and all federal and other taxes shown as due or required to be shown as due from the Acquired Fund on such tax returns, forms and reports shall have been paid or provision shall have been made for the payment thereof and, to the best of the Acquired Entity’s knowledge, no such return is currently under audit and no outstanding assessment of any tax has been asserted with respect to such returns.
(l) [Transamerica Partners Funds Group and Transamerica Partners Funds Group II - Such Acquired Fund is a separate series of the Acquired Entity that is treated as a corporation separate from any and all other series of the Acquired Entity under Section 851(g) of the Code. For each taxable year of its operation (including the current taxable year, assuming such year ends on the Closing Date), such Acquired Fund has met (or will meet) the requirements of Subchapter M of Chapter 1 of the Code for qualification and treatment as a “regulated investment company,” has had in effect an election to be treated as such, and has been (or will be) eligible to compute and has computed (or will compute) its federal income tax under Section 852 of the
A-7
Code. For each taxable year of its operation (including the current taxable year, assuming such year ends on the Closing Date), such Acquired Fund will have distributed, on or before the Closing Date, substantially all of (a) its investment company taxable income (as defined in the Code) (computed without regard to any deduction for dividends paid), (b) the excess of its interest income excludable from gross income under Section 103(a) of the Code, if any, over its deductions disallowed under Section 265 and Section 171(a)(2) of the Code, and (c) any net capital gain (as defined in the Code) (after reduction for any allowable capital loss carryover) that has accrued or been recognized, respectively, through the Closing Date such that for all tax periods ending on or before the Closing Date (and treating the current taxable year as ending on the Closing Date) such Acquired Fund will not have any unpaid tax liability under Section 852 of the Code. For each calendar year of its operation (including the calendar year that includes the Closing Date), such Acquired Fund will have made such distributions, on or before the Closing Date, as are necessary so that for all calendar years ending on or before the Closing Date, and for the calendar year that includes the Closing Date, such Acquired Fund will not have any unpaid tax liability under Section 4982 of the Code.] [Transamerica Partners Portfolios - Such Acquired Fund is a separate series of the Acquired Entity that is treated as a partnership and not as an association or a publicly traded partnership taxable as a corporation for U.S. federal income tax purposes, has been properly treated as a partnership since its formation, and has never filed an election to be treated as an entity other than a partnership for U.S. federal income tax purposes. [No Acquired Fund Shareholder is a “C corporation” within the meaning of Treasury Regulations Section 1.337(d)-7(a)(2)(i), a partnership in which such a C corporation is a direct or indirect partner, or a grantor trust or other disregarded entity owned, directly or indirectly, by such a C corporation.]
(m) All issued and outstanding Acquired Fund Shares of such Acquired Fund are, and on the Closing Date will be, duly authorized and validly and legally issued and outstanding, fully paid and non-assessable by the Acquired Entity and have been offered and sold in any state, territory or the District of Columbia in compliance in all material respects with applicable registration requirements of all applicable federal and state securities laws. All of the issued and outstanding Acquired Fund Shares of such Acquired Fund will, at the time of Closing, be held by the persons and in the amounts set forth in the records of the Transfer Agent, on behalf of such Acquired Fund, as provided in paragraph 3.3. Such Acquired Fund does not have outstanding any options, warrants or other rights to subscribe for or purchase any of the Acquired Fund Shares of such Acquired Fund, nor is there outstanding any security convertible into any of the Acquired Fund Shares of such Acquired Fund.
(n) The execution, delivery and performance of this Agreement, and the transactions contemplated herein, have been duly authorized by all necessary action on the part of the Acquired Entity Board, on behalf of such Acquired Fund, and this Agreement constitutes a valid and binding obligation of the Acquired Entity, on behalf of such Acquired Fund, enforceable in accordance with its terms, subject, as to enforcement, to bankruptcy, insolvency, reorganization, moratorium and other laws relating to or affecting creditors’ rights and to general equity principles.
(o) The information to be furnished by the Acquired Entity, on behalf of such Acquired Fund, for use in any documents filed or to be filed with any federal, state or local regulatory authority, which may be necessary in connection with the transactions contemplated hereby, shall be accurate and complete in all material respects and shall comply in all material respects with federal securities and other laws and regulations thereunder applicable thereto.
A-8
(p) The Registration Statement (as defined in paragraph 5.9), insofar as it relates to such Acquired Fund, from the effective date of the Registration Statement through the date of the meeting of holders of the Acquired Fund contemplated herein and on the Closing Date, will (i) not contain any statement which, at the time and in the light of the circumstances under which it is made, is false or misleading with respect to any material fact, or which omits to state any material fact necessary in order to make the statements therein not false or misleading (provided that this representation and warranty shall not apply to statements in or omissions from the Registration Statement made in reliance upon and in conformity with information that was furnished by the Acquiring Entity, on behalf of the corresponding Acquiring Fund, for use therein), and (ii) comply in all material respects with the provisions of the 1934 Act and the 1940 Act and the rules and regulations thereunder.
4.2 Except as has been fully disclosed to the Acquired Entity in Schedule 4.2 to this Agreement, the Acquiring Entity, on behalf of each Acquiring Fund, represents and warrants to the Acquired Entity and the corresponding Acquired Fund as follows:
(a) Such Acquiring Fund is duly established as a series of the Acquiring Entity, which is a statutory trust validly existing and in good standing under the laws of the State of Delaware, with the power under the Acquiring Entity’s Declaration of Trust, as amended (the “Acquiring Entity Charter”), to own all of the assets of such Acquiring Fund and to carry on its business as it is being conducted as of the date hereof. The Acquiring Entity is duly qualified to do business as a foreign trust in each jurisdiction in which the conduct of its business makes such qualification necessary except where the failure to so qualify would not have a material adverse effect on the condition (financial or otherwise), business, properties, net assets or results of operations of the Acquiring Entity. The Acquiring Entity has all necessary federal, state and local authorization to carry on its business as now being conducted and to fulfill the terms of this Agreement except as described in paragraph 4.2(c).
(b) The Acquiring Entity is a registered open-end management investment company, and its registration with the Commission as an investment company under the 1940 Act, and the registration of Acquiring Fund Shares under the 1933 Act, is in full force and effect or will be in full force and effect as of the Closing Date.
(c) No consent, approval, authorization, or order of any court or governmental authority is required for the consummation by the Acquiring Fund of the transactions contemplated herein, except such as may be required under the 1933 Act, the 1934 Act, the 1940 Act, state securities laws and the Hart-Scott-Rodino Act.
(d) The current prospectus and statement of additional information of such Acquiring Fund (true and correct copies of which have been delivered to the Acquired Entity) and each prospectus and statement of additional information of such Acquiring Fund used during the three (3) years prior to the date of this Agreement conforms or conformed at the time of its use in all material respects to the applicable requirements of the 1933 Act and the 1940 Act and the rules and regulations of the Commission thereunder and does not or did not at the time of its use include any untrue statement of a material fact or omit to state any material fact required to be stated therein or necessary to make the statements therein, in light of the circumstances under which they were made, not materially misleading.
A-9
(e) Such Acquiring Fund is not engaged currently, and the execution, delivery and performance of this Agreement by the Acquiring Entity, on behalf of such Acquiring Fund, will not result, in a material violation of Delaware law or the Acquiring Entity Charter or the by-laws of the Acquiring Entity, or of any agreement, indenture, instrument, contract, lease or other undertaking to which the Acquiring Entity, on behalf of such Acquiring Fund, is a party or by which it is bound, and the execution, delivery and performance of this Agreement by the Acquiring Entity, on behalf of such Acquiring Fund, will not result in the acceleration of any material obligation, or the imposition of any material penalty, under any agreement, indenture, instrument, contract, lease, judgment or decree to which the Acquiring Entity, on behalf of such Acquiring Fund, is a party or by which it is bound.
(f) No litigation or administrative proceeding or investigation of or before any court or governmental body is pending or, to the Acquiring Entity’s knowledge, threatened against the Acquiring Entity, with respect to such Acquiring Fund, or any of its properties or assets, that, if adversely determined, would materially and adversely affect its financial condition or the conduct of such Acquiring Fund’s business. The Acquiring Entity, on behalf of such Acquiring Fund, is not a party to or subject to the provisions of any order, decree or judgment of any court or governmental body that materially and adversely affects such Acquiring Fund’s business or the Acquiring Entity’s ability to consummate the transactions herein contemplated on behalf of such Acquiring Fund.
(g) The Statement of Assets and Liabilities, Statements of Operations and Changes in Net Assets and Schedule of Investments of such Acquiring Fund as at the last day of and for the most recently completed fiscal year of such Acquiring Fund prior to the date of this Agreement have been audited by Ernst & Young LLP, independent registered public accounting firm, and are in accordance with GAAP consistently applied, and such statements (true and correct copies of which have been furnished to the Acquired Entity) present fairly, in all material respects, the financial condition of such Acquiring Fund as of such date and for such period in accordance with GAAP, and there are no known contingent, accrued or other liabilities of such Acquiring Fund required to be reflected on a balance sheet (including the notes thereto) in accordance with GAAP as of such date that are not disclosed therein.
(h) Since the last day of the most recently completed fiscal year of such Acquiring Fund prior to the date of this Agreement, there has not been any material adverse change in such Acquiring Fund’s financial condition, assets, liabilities or business, or any incurrence by such Acquiring Fund of indebtedness for money borrowed maturing more than one year from the date such indebtedness was incurred. For the purposes of this subparagraph (h), a decline in net asset value per share of Acquiring Fund Shares due to declines in market values of securities held by such Acquiring Fund, the discharge of Acquiring Fund liabilities, or the redemption of Acquiring Fund Shares by holders of such Acquiring Fund shall not constitute a material adverse change.
(i) All federal and other tax returns, dividend reporting forms and other tax-related reports of such Acquiring Fund required by law to have been filed (taking into account any extensions) shall have been timely filed (taking such extensions into account) and shall be correct in all material respects, and all federal and other taxes shown as due or required to be shown as due from the Acquiring Fund on such tax returns, forms and reports shall have been paid or provision shall have been made for the payment thereof and, to the best of the Acquiring Entity’s knowledge, no such return is currently under audit and no outstanding assessment of any tax has been asserted with respect to such returns.
A-10
(j) Such Acquiring Fund is a separate series of the Acquiring Entity that is treated as a corporation separate from any and all other series of the Acquiring Entity under Section 851(g) of the Code. For each taxable year of its operation (including the taxable year that includes the Closing Date), such Acquiring Fund has met (or will meet) the requirements of Subchapter M of Chapter 1 of the Code for qualification and treatment as a “regulated investment company,” has had in effect an election to be treated as such, and has been (or will be) eligible to compute and has computed (or will compute) its federal income tax under Section 852 of the Code. For each taxable year of its operation ending prior to the Closing Date, such Acquiring Fund will have distributed (or will distribute pursuant to the provisions of Section 855 of the Code) substantially all of (a) its investment company taxable income (as defined in the Code) (computed without regard to any deduction for dividends paid), (b) the excess of its interest income excludable from gross income under Section 103(a) of the Code, if any, over its deductions disallowed under Section 265 and Section 171(a)(2) of the Code, and (c) any net capital gain (as defined in the Code) (after reduction for any capital loss carryover) such that for all tax periods ending prior to the Closing Date such Acquiring Fund will not have any unpaid tax liability under Section 852 of the Code. For each calendar year of its operation ending prior to the Closing Date, such Acquiring Fund will have made such distributions as are necessary so that for all calendar years ending prior to the Closing Date such Acquiring Fund will not have any unpaid tax liability under Section 4982 of the Code.
(k) All issued and outstanding Acquiring Fund Shares are, and on the Closing Date will be, duly authorized and validly and legally issued and outstanding, fully paid and non-assessable by the Acquiring Entity and will have been offered and sold in any state, territory or the District of Columbia in compliance in all material respects with applicable registration requirements of all applicable federal and state securities laws. Such Acquiring Fund does not have outstanding any options, warrants or other rights to subscribe for or purchase any Acquiring Fund Shares, nor is there outstanding any security convertible into any Acquiring Fund Shares. All of the Acquiring Fund Shares to be issued and delivered to the Acquired Entity, for the account of the Acquired Fund Shareholders, pursuant to this Agreement, will on the Closing Date have been duly authorized and, when so issued and delivered, will be duly and validly and legally issued Acquiring Fund Shares and be fully paid and non-assessable by the Acquiring Entity.
(l) The execution, delivery and performance of this Agreement, and the transactions contemplated herein, have been duly authorized by all necessary action on the part of the Acquiring Entity Board, on behalf of such Acquiring Fund, and this Agreement constitutes a valid and binding obligation of the Acquiring Entity, on behalf of such Acquiring Fund, enforceable in accordance with its terms, subject, as to enforcement, to bankruptcy, insolvency, reorganization, moratorium and other laws relating to or affecting creditors’ rights and to general equity principles.
(m) The information to be furnished by the Acquiring Entity, on behalf of such Acquiring Fund, for use in any documents filed or to be filed with any federal, state or local regulatory authority, which may be necessary in connection with the transactions contemplated hereby, shall be accurate and complete in all material respects and shall comply in all material respects with federal securities and other laws and regulations applicable thereto.
(n) The Registration Statement (as defined in paragraph 5.9), insofar as it relates to such Acquiring Fund, from the effective date of the Registration Statement through the date of the meeting of holders of the corresponding Acquired Fund contemplated therein and on the Closing Date, will (i) not contain any statement which, at the time and in the light of the circumstances under which it is made, is false or misleading with respect to any material fact, or which omits to state any material fact necessary to make the statements therein not false or misleading (provided that this representation and warranty shall not apply to statements in or
A-11
omissions from the Registration Statement made in reliance upon and in conformity with information that was furnished by the Acquired Entity for use therein) and (ii) comply in all material respects with the provisions of the 1933 Act, the 1934 Act and the 1940 Act and the rules and regulations thereunder.
(o) The Post-Effective Amendments (as defined in paragraph 5.10) to be filed by the Acquiring Entity, insofar as they relate to such Acquiring Fund, pursuant to this Agreement will, on the effective date of the Post-Effective Amendments, comply in all material respects with the 1940 Act and the rules and regulations thereunder.
The Acquired Entity, on behalf of each Acquired Fund, and the Acquiring Entity, on behalf of each Acquiring Fund, respectively, hereby further covenant as follows:
5.1 The Acquired Fund and the Acquiring Fund each will operate its business in the ordinary course and shall comply in all material respects with all applicable laws, rules and regulations between the date hereof and the Closing Date, it being understood that such ordinary course of business will include the declaration and payment of customary dividends and other distributions, and any other distribution that may be advisable.
5.2 The Acquiring Fund Shares to be acquired by such Acquired Fund hereunder are not being acquired for the purpose of making any distribution thereof, other than in accordance with the terms of this Agreement.
5.3 The Acquired Entity, on behalf of each Acquired Fund, will assist the Acquiring Entity in obtaining such information as the Acquiring Entity reasonably requests concerning the beneficial ownership of the Acquired Fund Shares.
5.4 Subject to the provisions of this Agreement, the Acquiring Entity, on behalf of each Acquiring Fund, and the Acquired Entity, on behalf of each Acquired Fund, each will take, or cause to be taken, all action, and do or cause to be done, all things reasonably necessary, proper or advisable to consummate and make effective the transactions contemplated by this Agreement.
5.5 Each of the Acquiring Entity, on behalf of each Acquiring Fund, and the Acquired Entity, on behalf of each Acquired Fund, will use all reasonable efforts to fulfill or obtain the fulfillment of the conditions precedent to effect the transactions contemplated by this Agreement as promptly as practicable.
5.6 The Acquired Entity, on behalf of each Acquired Fund, will, from time to time, as and when reasonably requested by the Acquiring Entity, execute and deliver or cause to be executed and delivered all such assignments and other instruments and will take or cause to be taken such further action as the Acquiring Entity, on behalf of the corresponding Acquiring Fund, may reasonably deem necessary or desirable in order to vest in and confirm (a) the Acquired Entity’s title to and possession of the Acquiring Fund Shares to be delivered hereunder and (b) the Acquiring Entity’s title to and possession of all the Assets, and to otherwise to carry out the intent and purpose of this Agreement.
5.7 The Acquiring Entity, on behalf of each Acquiring Fund, will use all reasonable efforts to obtain the approvals and authorizations required by the 1933 Act, the 1940 Act and such of the state blue sky or securities laws as may be necessary in order to continue its operations after the Closing Date.
A-12
5.8 The Acquired Entity will call a meeting of the holders of such Acquired Fund to consider and act upon this Agreement and to take all other action necessary to obtain approval of the transactions contemplated herein.
5.9 The Acquiring Entity, on behalf of such Acquiring Fund, shall prepare and file a registration statement on Form N-14 in compliance with the 1933 Act, the 1934 Act and the 1940 Act and the rules and regulations thereunder with respect to the Reorganization (the “Registration Statement”). The Acquired Entity, on behalf of such Acquired Fund, will provide to the Acquiring Entity such information regarding the Acquired Fund as may be reasonably necessary for the preparation of the Registration Statement.
5.10 The Acquiring Entity, on behalf of each Acquiring Fund, shall prepare and file one or more post-effective amendments to its registration statement on Form N-1A (the “Post-Effective Amendments”) to become effective on or before the Closing Date to register the Acquiring Fund Shares under the 1933 Act and the 1940 Act.
[5.11 [Transamerica Partners Portfolios - After the liquidation of the Acquired Fund, its final tax return and required information returns shall be filed in a timely manner, and such returns shall include a deemed-sale election under Treasury Regulations §§ 1.337(d)-7(c)(5) and -7(e) and shall properly reflect allocation of net gain recognized by the Acquired Fund on the deemed sale.
6. CONDITIONS PRECEDENT TO OBLIGATIONS OF EACH ACQUIRED FUND
The obligations of the Acquired Entity, on behalf of each Acquired Fund, to consummate the Reorganization of such Acquired Fund shall be subject, at the Acquired Entity’s election, to the following conditions with respect to the applicable Acquired Fund:
6.1 All representations and warranties of the Acquiring Entity, on behalf of such Acquiring Fund, contained in this Agreement shall be true and correct in all material respects as of the date hereof and, except as they may be affected by the transactions contemplated by this Agreement, as of the Closing Date, with the same force and effect as if made on and as of the Closing Date.
6.2 The Acquiring Entity, on behalf of such Acquiring Fund, shall have performed all of the covenants and complied with all of the provisions required by this Agreement to be performed or complied with by the Acquiring Entity, on behalf of such Acquiring Fund, on or before the Closing Date.
6.3 The Acquiring Entity, on behalf of such Acquiring Fund, shall have executed and delivered an assumption of the Liabilities of the corresponding Acquired Fund and all such other agreements and instruments as the Acquired Entity may reasonably deem necessary or desirable in order to vest in and confirm (a) such Acquired Fund’s title to and possession of the Acquiring Fund Shares to be delivered hereunder and (b) the Acquiring Entity’s assumption of all of the Liabilities, and to otherwise to carry out the intent and purpose of this Agreement.
6.4 The Acquiring Entity, on behalf of such Acquiring Fund, shall have delivered to such Acquired Fund a certificate executed in the name of the Acquiring Entity, on behalf of such Acquiring Fund, by the Acquiring Entity’s President or Vice President and its Treasurer or Assistant Treasurer, in a form reasonably satisfactory to the Acquired Entity and dated as of the Closing Date, as to the matters set forth in paragraphs 6.1 and 6.2 and as to such other matters as the Acquired Entity shall reasonably request.
A-13
6.5 The Acquiring Entity, on behalf of such Acquiring Fund, and the Acquired Entity, on behalf of the corresponding Acquired Fund, shall have agreed on the number of full and fractional Acquiring Fund Shares to be issued in connection with the Reorganization after such number has been calculated in accordance with paragraph 1.1.
| 7. | CONDITIONS PRECEDENT TO OBLIGATIONS OF EACH ACQUIRING FUND |
The obligations of the Acquiring Entity, on behalf of each Acquiring Fund, to consummate the Reorganization of the corresponding Acquiring Fund shall be subject, at the Acquiring Entity’s election, to the following conditions with respect to the applicable Acquiring Fund:
7.1 All representations and warranties of the Acquired Entity, on behalf of such Acquired Fund, contained in this Agreement shall be true and correct in all material respects as of the date hereof and, except as they may be affected by the transactions contemplated by this Agreement, as of the Closing Date, with the same force and effect as if made on and as of the Closing Date.
7.2 The Acquired Entity, on behalf of such Acquired Fund, shall have performed all of the covenants and complied with all of the provisions required by this Agreement to be performed or complied with by the Acquired Entity, on behalf of such Acquired Fund, on or before the Closing Date.
7.3 The Acquired Entity shall have delivered to the Acquiring Entity, on behalf of such Acquiring Fund, a Statement of Assets and Liabilities of such Acquired Fund as of the Closing Date, including a schedule of investments, certified by the Treasurer of the Acquired Entity on behalf of such Acquired Fund. The Acquired Entity, on behalf of such Acquired Fund, shall have executed and delivered all such assignments and other instruments of transfer as the Acquiring Entity may reasonably deem necessary or desirable in order to vest in and confirm (a) the Acquired Fund’s title to and possession of the Acquiring Fund Shares to be delivered hereunder and (b) the Acquiring Fund’s title to and possession of all the Assets and to otherwise to carry out the intent and purpose of this Agreement.
7.4 The Acquired Entity, on behalf of such Acquired Fund, shall have delivered to the Acquiring Entity a certificate executed in the name of the Acquired Entity, on behalf of such Acquired Fund, by the Acquired Entity’s President or Vice President and its Treasurer or Assistant Treasurer, in a form reasonably satisfactory to the Acquiring Entity and dated as of the Closing Date, as to the matters set forth in paragraphs 7.1 and 7.2 and as to such other matters as the Acquiring Entity shall reasonably request.
7.5 The Acquired Entity, on behalf of such Acquired Fund, and the Acquiring Entity, on behalf of such Acquiring Fund, shall have agreed on the number of full and fractional Acquiring Fund Shares to be issued by such Acquiring Fund in connection with the Reorganization after such number has been calculated in accordance with paragraph 1.1.
A-14
| 8. | FURTHER CONDITIONS PRECEDENT TO OBLIGATIONS OF EACH ACQUIRING FUND AND EACH CORRESPONDING ACQUIRED FUND |
If any of the conditions set forth below have not been satisfied on or before the Closing Date with respect to the Acquired Entity, on behalf of each Acquired Fund, or the Acquiring Entity, on behalf of the corresponding Acquiring Fund, the other party to this Agreement shall be entitled on behalf of the corresponding Acquired Fund or Acquiring Fund, as applicable, at its option, to [Transamerica Partners Funds Group and Transamerica Partners Funds Group II only - (and shall, in the case of a failure to satisfy the conditions set forth in paragraph 8.7)] refuse to consummate the transactions contemplated by this Agreement with respect to the applicable Acquired Fund and its corresponding Acquiring Fund:
8.1 This Agreement and the transactions contemplated herein shall have been approved by the requisite vote of the holders of the outstanding shares of such Acquired Fund, in accordance with the provisions of the Acquired Entity Charter, the by-laws of the Acquired Entity, and applicable state law, and certified copies of the resolutions evidencing such approval shall have been delivered to the Acquiring Entity. Notwithstanding anything herein to the contrary, neither the Acquiring Entity nor the Acquired Entity may waive the condition set forth in this paragraph 8.1.
8.2 On the applicable Closing Date, no court or governmental agency of competent jurisdiction shall have issued any order that remains in effect and that restrains or enjoins the Acquired Entity, with respect to such Acquired Fund, or the Acquiring Entity, with respect to such Acquiring Fund, from completing the transactions contemplated by this Agreement.
8.3 All consents of other parties and all other consents, orders and permits of federal, state and local regulatory authorities deemed necessary by the Acquiring Entity or the Acquired Entity to permit consummation, in all material respects, of the transactions contemplated hereby shall have been obtained, except where failure to obtain any such consent, order or permit would not involve a risk of a material adverse effect on the assets or properties of such Acquiring Fund or such Acquired Fund, provided that either party hereto may for itself waive any of such conditions.
8.4 The Registration Statement shall have become effective under the 1933 Act and no stop orders suspending the effectiveness thereof shall have been issued and, to the best knowledge of the parties hereto, no investigation or proceeding for that purpose shall have been instituted or be pending. The Post-Effective Amendments shall have become effective, and no stop orders suspending the effectiveness thereof shall have been issued and, to the best knowledge of the parties hereto, no investigation or proceeding for that purpose shall have been instituted or be pending.
8.5 The Acquiring Entity, on behalf of each Acquiring Fund, shall have received on the applicable Closing Date an opinion of Morgan, Lewis & Bockius LLP, in a form reasonably satisfactory to the Acquiring Entity, and dated as of the Closing Date, substantially to the effect that, based upon certain facts and certifications made by the Acquired Entity, on behalf of the Acquired Fund, and its authorized officers: (a) the Acquired Entity is a [Transamerica Partners Funds Group and Transamerica Partners Funds Group II - business trust validly existing under the laws of the Commonwealth of Massachusetts] [Transamerica Partners Portfolios - trust validly existing under the laws of the State of New York] ; (b) the Acquired Entity, with respect to the corresponding Acquired Fund, has the power as a corporation to carry on its business as presently conducted in accordance with the description thereof in the Acquired Entity’s registration statement
A-15
as an open-end investment company registered under the 1940 Act; (c) this Agreement has been duly authorized, executed and delivered by the Acquired Entity, on behalf of the corresponding Acquired Fund, and constitutes a valid and legally binding obligation of the Acquired Entity, on behalf of the corresponding Acquired Fund, enforceable against the Acquired Entity in accordance with its terms; and (d) the execution and delivery of this Agreement did not, and the transfer of the Assets for Acquiring Fund Shares and the assumption by the Acquiring Fund of the Liabilities pursuant to this Agreement will not, violate the Acquired Entity Charter or the by-laws of the Acquired Entity. Such opinion may state that it is solely for the benefit of the Acquiring Entity and the Acquiring Entity Board. Such opinion may contain such assumptions and limitations as shall be in the opinion of Morgan, Lewis & Bockius LLP appropriate to render the opinions expressed therein.
8.6 The Acquired Entity, on behalf of each Acquired Fund, shall have received on the applicable Closing Date an opinion of Morgan, Lewis & Bockius LLP, in a form reasonably satisfactory to the Acquired Entity, and dated as of the Closing Date, substantially to the effect that, based upon certain facts and certifications made by the Acquiring Entity, on behalf of the corresponding Acquiring Fund and its authorized officers: (a) the Acquiring Entity is a statutory trust validly existing under the laws of the State of Delaware; (b) the Acquiring Entity, with respect to the corresponding Acquiring Fund, has the power as a statutory trust to carry on its business as presently conducted in accordance with the description thereof in the Acquiring Entity’s registration statement as an open-end investment company registered under the 1940 Act; (c) this Agreement has been duly authorized, executed and, so far as known to such counsel, delivered by the Acquiring Entity, on behalf of the corresponding Acquiring Fund, and constitutes a valid and legally binding obligation of the Acquiring Entity, on behalf of the corresponding Acquiring Fund, enforceable against the Acquiring Entity in accordance with its terms; and (d) the execution and delivery of this Agreement did not, and the issuance of the Acquiring Fund Shares and the assumption of the Liabilities in exchange for the transfer of the Assets pursuant to this Agreement will not, violate the Acquiring Entity Charter or the by-laws of the Acquiring Entity. Such opinion may state that it is solely for the benefit of the Acquired Entity and the Acquired Entity Board. Such opinion may contain such assumptions and limitations as shall be in the opinion of Morgan, Lewis & Bockius LLP appropriate to render the opinions expressed therein.
[Transamerica Partners Funds Group and Transamerica Partners Funds Group II only 8.7 The parties shall have received the opinion of Morgan, Lewis & Bockius LLP, dated the Closing Date, substantially to the effect that, based upon certain facts, assumptions and representations and upon certifications made by the Acquired Entity, on behalf of the applicable Acquired Fund, the Acquiring Entity, on behalf of the applicable Acquiring Fund, and their respective authorized officers, (i) the applicable Reorganization will constitute a reorganization within the meaning of Section 368(a) of the Code, and the applicable Acquired Fund and the corresponding Acquiring Fund will each be a “party to a reorganization” within the meaning of Section 368(b) of the Code; (ii) no gain or loss will be recognized by such Acquiring Fund upon receipt of the Assets of the corresponding Acquired Fund solely in exchange for the applicable Acquiring Fund Shares and the assumption by the Acquiring Entity, on behalf of the Acquiring Fund, of the Liabilities of the applicable Acquired Fund as part of the Reorganization; (iii) the tax basis in the hands of such Acquiring Fund of the Assets of the corresponding Acquired Fund will be the same as the tax basis of such Assets in the hands of the Acquired Fund immediately prior to the transfer, increased by the amount of gain (or decreased by the amount of loss), if any, recognized by the Acquired Fund upon the transfer; (iv) the holding period of each Asset in the hands of such Acquiring Fund, other than Assets with respect to which gain or loss is required to be recognized in the Reorganization, will include the period during which the Asset was held by such Acquired Fund (except where investment activities of the Acquiring Fund have the effect of reducing or eliminating the
A-16
holding period with respect to an asset); (v) no gain or loss will be recognized by such Acquired Fund upon the transfer of its Assets to the corresponding Acquiring Fund in the Reorganization solely in exchange for the applicable Acquiring Fund Shares and the assumption by the Acquiring Entity, on behalf of the Acquiring Fund, of the Liabilities of the Acquired Fund, or upon the distribution of the Acquiring Fund Shares by the Acquired Fund to its holders in complete liquidation, except for (A) any gain or loss that may be recognized with respect to contracts subject to Section 1256 of the Code, (B) any gain that may be recognized on the transfer of stock in a “passive foreign investment company” as defined in Section 1297(a) of the Code and (C) any other gain or loss that may be required to be recognized as a result of the closing of the Acquired Fund’s taxable year or upon the transfer of an Asset regardless of whether such transfer would otherwise be a non-recognition transaction under the Code; (vi) no gain or loss will be recognized by the Acquired Fund Shareholders of such Acquired Fund upon the exchange of their Acquired Fund Shares solely for the Acquiring Fund Shares of the corresponding Acquiring Fund as part of the Reorganization; (vii) the aggregate tax basis of the Acquiring Fund Shares that each Acquired Fund Shareholder of the applicable Acquired Fund receives in the Reorganization will be the same as the aggregate tax basis of his or her Acquired Fund Shares exchanged therefor; and (viii) each Acquired Fund Shareholder’s holding period for his or her Acquiring Fund Shares will include the period for which he or she held the Acquired Fund Shares exchanged therefor, provided that he or she held such Acquired Fund Shares as capital assets on the date of the exchange. The delivery of such opinion is conditioned upon the receipt by Morgan, Lewis & Bockius LLP of representations it shall request of the Acquiring Entity and the Acquired Entity. Notwithstanding anything herein to the contrary, neither the Acquiring Entity nor the Acquired Entity may waive the condition set forth in this paragraph 8.7.]
9.1 The Acquiring Entity, out of each Acquiring Fund’s assets and property (including any amounts paid to the Acquiring Fund pursuant to any applicable liability insurance policies or indemnification agreements), agrees to indemnify and hold harmless the Acquired Entity and the members of the Acquired Entity Board and its officers from and against any and all losses, claims, damages, liabilities or expenses (including, without limitation, the payment of reasonable legal fees and reasonable costs of investigation) to which the Acquired Entity and those board members and officers may become subject, insofar as such loss, claim, damage, liability or expense (or actions with respect thereto) arises out of or is based on (a) any breach by the Acquiring Entity, on behalf of an Acquiring Fund, of any of its representations, warranties, covenants or agreements set forth in this Agreement or (b) any act, error, omission, neglect, misstatement, materially misleading statement, breach of duty or other act wrongfully done or attempted to be committed by the Acquiring Entity or the members of the Acquiring Entity Board or its officers prior to the Closing Date, provided that such indemnification by the Acquiring Entity is not (i) in violation of any applicable law or (ii) otherwise prohibited as a result of any applicable order or decree issued by any governing regulatory authority or court of competent jurisdiction.
9.2 The Acquired Entity, out of each Acquired Fund’s assets and property (including any amounts paid to the Acquired Fund pursuant to any applicable liability insurance policies or indemnification agreements), agrees to indemnify and hold harmless the Acquiring Entity and the members of the Acquiring Entity Board and its officers from and against any and all losses, claims, damages, liabilities or expenses (including, without limitation, the payment of reasonable legal fees and reasonable costs of investigation) to which the Acquiring Entity and those board members and officers may become subject, insofar as such loss, claim, damage, liability or expense (or actions with respect thereto) arises out of or is based on (a) any breach by the Acquired Entity, on behalf of an Acquired Fund, of any of its representations, warranties, covenants or
A-17
agreements set forth in this Agreement or (b) any act, error, omission, neglect, misstatement, materially misleading statement, breach of duty or other act wrongfully done or attempted to be committed by the Acquired Entity or the members of the Acquired Entity Board or its officers prior to the Closing Date, provided that such indemnification by the Acquired Entity is not (i) in violation of any applicable law or (ii) otherwise prohibited as a result of any applicable order or decree issued by any governing regulatory authority or court of competent jurisdiction.
| 10. | BROKER FEES AND EXPENSES |
10.1 The Acquiring Entity, on behalf of each Acquiring Fund, and the Acquired Entity, on behalf of each Acquired Fund, represent and warrant to each other that there are no brokers or finders entitled to receive any payments in connection with the transactions provided for herein.
10.2 The costs of the Reorganizations will be shared equally by TAM and the Acquiring Funds and Acquired Funds in accordance with an allocation approved by the Acquired Entity and Acquiring Entity Boards. [Transamerica Partners Funds Group and Transamerica Partners Funds Group II - Notwithstanding any of the foregoing, expenses will in any event be paid by the party directly incurring such expenses (without reimbursement by another person) if and to the extent that the payment by another person of such expenses would prevent such party from being treated as a “regulated investment company” under the Code or would prevent the Reorganization from qualifying as a tax-free reorganization.] [Transamerica Partners Portfolios - Notwithstanding any of the foregoing, expenses will in any event be paid by the party directly incurring such expenses (without reimbursement by another person) if and to the extent that the payment by another person of such expenses would prevent an Acquiring Fund from being treated as a “regulated investment company” under the Code.]
| 11. | ENTIRE AGREEMENT; SURVIVAL OF WARRANTIES |
11.1 The Acquiring Entity and the Acquired Entity agree that neither party has made any representation, warranty or covenant, on behalf of an Acquiring Fund or an Acquired Fund, respectively, not set forth herein and that this Agreement constitutes the entire agreement between the parties.
11.2 The covenants to be performed after the Closing by both the Acquiring Entity and the Acquired Entity, and the obligations of the Acquiring Entity, on behalf of each Acquiring Fund, in Article 9, shall survive the Closing. All other representations, warranties and covenants contained in this Agreement or in any document delivered pursuant hereto or in connection herewith shall not survive the consummation of the transactions contemplated hereunder and shall terminate on the Closing.
This Agreement may be terminated and the transactions contemplated hereby may be abandoned with respect to any Acquiring Fund or Acquired Fund at any time prior to the Closing Date with respect to the applicable Reorganization by resolution of either the Acquiring Entity Board or the Acquired Entity Board, if circumstances should develop that, in the opinion of that Board, make proceeding with the Agreement inadvisable with respect to such Acquiring Fund or such Acquired Fund, respectively. Any such termination resolution will be effective when communicated to the other party. The termination of this Agreement with respect to an Acquired Fund or its corresponding Acquiring Fund shall not affect the continued effectiveness of this Agreement with respect to any other Acquired Fund or Acquiring Fund, nor shall it affect the rights and obligations of any party in respect of any breach of this Agreement occurring prior to such termination.
A-18
This Agreement may be amended, modified or supplemented in such manner as may be deemed necessary or advisable by the authorized officers of the Acquired Entity and the Acquiring Entity; provided, however, that following the meeting of the Acquired Fund Shareholders called by the Acquired Fund pursuant to paragraph 5.8 of this Agreement, no such amendment may have the effect of changing the provisions for determining the number of Acquiring Fund Shares to be issued to Acquired Fund Shareholders under this Agreement to the detriment of such holders without their further approval.
Any notice, report, statement or demand required or permitted by any provisions of this Agreement shall be in writing and shall be given by facsimile, electronic delivery (i.e., e-mail), personal service or prepaid or certified mail addressed to the Acquiring Entity or the Acquired Entity, at its address set forth in the preamble to this Agreement, in each case to the attention of its President.
| 15. | HEADINGS; COUNTERPARTS; GOVERNING LAW; SEVERABILITY; ASSIGNMENT; LIMITATION OF LIABILITY |
15.1 The Article headings contained in this Agreement are for reference purposes only and shall not affect in any way the meaning or interpretation of this Agreement.
15.2 This Agreement may be executed in any number of counterparts, each of which shall be deemed an original.
15.3 This Agreement shall be governed by and construed and interpreted in accordance with the internal laws of the State of New York.
15.4 This Agreement shall bind and inure to the benefit of the parties hereto and their respective successors and assigns, but no assignment or transfer hereof or of any rights or obligations hereunder shall be made by any party without the written consent of the other parties. Nothing herein expressed or implied is intended or shall be construed to confer upon or give any person, firm or corporation, other than the parties hereto and their respective successors and assigns, any rights or remedies under or by reason of this Agreement.
15.5 The warranties, representations and agreements contained in this Agreement made by the Acquired Entity, on behalf of each of the Acquired Funds, are made on a several (and not joint, or joint and several) basis. Similarly, the warranties, representations and agreements contained in this Agreement made by the Acquiring Entity, on behalf of each of the Acquiring Funds, are made on a several (and not joint, or joint and several) basis.
[Transamerica Partners Funds Group and Transamerica Partners Funds Group II only - 15.6 The Acquired Entity Charter is on file with the Secretary of State of the Commonwealth of Massachusetts.
A-19
Consistent with the Acquired Entity Charter, the obligations of the Acquired Entity with respect to any Acquired Fund entered into in the name or on behalf the Acquired Entity by any of its board members, officers, employees or agents are made not individually, but in such capacities, and are not binding upon any of the Trustees, officers, employees, agents or shareholders of the Acquired Entity personally, but bind only the assets of the Acquired Entity belonging to the applicable Acquired Fund, and all persons dealing with any series or funds of Acquired Entity must look solely to the assets of the Acquired Entity belonging to such series or fund for the enforcement of any claims against the Acquired Entity.]
[Rest of page intentionally left blank]
A-20
IN WITNESS WHEREOF, each of the parties hereto has caused this Agreement to be executed by its duly authorized officer.
TRANSAMERICA FUNDS, on behalf of each of its series listed in Exhibit A attached hereto
[TRANSAMERICA PARTNERS FUNDS GROUP/ TRANSAMERICA PARTNERS FUNDS GROUP II/TRANSAMERICA PARTNERS PORTFOLIOS], on behalf of each of its series listed in Exhibit A attached hereto
A-21
Exhibit A
| | | | |
Acquired Fund | | Acquiring Fund/Class | | Closing Date |
| [Acquired Fund] | | [Acquiring Fund] [Class] | | |
| [Acquired Fund] | | [Acquiring Fund] [Class] | | |
| [Acquired Fund] | | [Acquiring Fund] [Class] | | |
| [Acquired Fund] | | [Acquiring Fund] [Class] | | |
A-22
SCHEDULE 4.1
A-23
SCHEDULE 4.2
A-24
|
The information in this Statement of Additional Information is not complete and may be changed. We may not sell these securities until the registration statement filed with the Securities and Exchange Commission is effective. This Statement of Additional Information is not an offer to sell these securities and it is not soliciting an offer to buy these securities in any state where the offer or sale is not permitted. |
PART B
TRANSAMERICA FUNDS
ON BEHALF OF ITS SERIES:
TRANSAMERICA INTERMEDIATE BOND
TRANSAMERICA GOVERNMENT MONEY MARKET
TRANSAMERICA HIGH YIELD BOND
TRANSAMERICA INTERNATIONAL EQUITY
TRANSAMERICA MID CAP GROWTH
TRANSAMERICA MID CAP VALUE OPPORTUNITIES
TRANSAMERICA SMALL CAP CORE
TRANSAMERICA SMALL CAP GROWTH
TRANSAMERICA SMALL CAP VALUE
(each a “Destination Fund” and collectively, the “Destination Funds”)
1801 California Street, Ste. 5200
Denver, Colorado 80202
(Toll free) 1-888-233-4339
STATEMENT OF ADDITIONAL INFORMATION
[ ], 2016
This Statement of Additional Information (“SAI”) is not a prospectus and should be read in conjunction with the combined Information Statement and Prospectus dated October 6, 2009 (the “Information Statement/Prospectus”), which relates to the Class R, Class R4 and Class I3 shares, as applicable, of each Destination Fund to be issued in exchange for shares of the corresponding series of Transamerica Partners Fund Group, Transamerica Partners Fund Group II or Transamerica Partners Portfolios as shown below (each a “Target Fund” and collectively, the “Target Funds”). Please retain this SAI for further reference.
To obtain a copy of the Proxy Statement/Prospectus, free of charge, please write to the Destination Funds at the address set forth above or call the Destination Funds at the number set forth above.
S-1
The Reorganizations are grouped and described together for convenience. The consummation of a particular Reorganization is not contingent on the consummation of any other Reorganization.
| | | | |
| Group | | Target Fund | | Destination Fund and Shares |
| Group 1 | | | | |
| | | Transamerica Partners Core Bond | | Transamerica Intermediate Bond Class R |
| | | Transamerica Partners Institutional Core Bond | | Transamerica Intermediate Bond Class R4 |
| | | Transamerica Partners Core Bond Portfolio | | Transamerica Intermediate Bond Class I3 |
| Group 2 | | | | |
| | | Transamerica Partners Government Money Market | | Transamerica Government Money Market Class R |
| | | Transamerica Partners Institutional Government Money Market | | Transamerica Government Money Market Class R4 |
| | | Transamerica Partners Government Money Market Portfolio | | Transamerica Government Money Market Class I3 |
| Group 3 | | | | |
| | | Transamerica Partners High Yield Bond | | Transamerica High Yield Bond Class R |
| | | Transamerica Partners Institutional High Yield Bond | | Transamerica High Yield Bond Class R4 |
| | | Transamerica Partners High Yield Bond Portfolio | | Transamerica High Yield Bond Class I3 |
| Group 4 | | | | |
| | | Transamerica Partners International Equity | | Transamerica International Equity Class R |
| | | Transamerica Partners Institutional International Equity | | Transamerica International Equity Class R4 |
| | | Transamerica Partners International Equity Portfolio | | Transamerica International Equity Class I3 |
| Group 5 | | | | |
| | | Transamerica Partners Mid Growth | | Transamerica Mid Cap Growth Class R |
| | | Transamerica Partners Institutional Mid Growth | | Transamerica Mid Cap Growth Class R4 |
| | | Transamerica Partners Mid Growth Portfolio | | Transamerica Mid Cap Growth Class I3 |
| Group 6 | | | | |
| | | Transamerica Partners Mid Value | | Transamerica Mid Cap Value Opportunities Class R |
| | | Transamerica Partners Institutional Mid Value | | Transamerica Mid Cap Value Opportunities Class R4 |
| | | Transamerica Partners Mid Value Portfolio | | Transamerica Mid Cap Value Opportunities Class I3 |
| Group 7 | | | | |
| | | Transamerica Partners Small Core | | Transamerica Small Cap Core Class R |
| | | Transamerica Partners Institutional Small Core | | Transamerica Small Cap Core Class R4 |
| | | Transamerica Partners Small Core Portfolio | | Transamerica Small Cap Core Class I3 |
| Group 8 | | | | |
| | | Transamerica Partners Small Growth | | Transamerica Small Cap Growth Class R |
| | | Transamerica Partners Institutional Small Growth | | Transamerica Small Cap Growth Class R4 |
| | | Transamerica Partners Small Growth Portfolio | | Transamerica Small Cap Growth Class I3 |
| Group 9 | | | | |
| | | Transamerica Partners Small Value | | Transamerica Small Cap Value Class R |
| | | Transamerica Partners Institutional Small Value | | Transamerica Small Cap Value Class R4 |
| | | Transamerica Partners Small Value Portfolio | | Transamerica Small Cap Value Class I3 |
S-2
TABLE OF CONTENTS
S-3
INTRODUCTION
This SAI is intended to supplement the Proxy Statement/Prospectus relating specifically to the proposed transfer of all of the assets of each Target Fund to, and the assumption of the liabilities of each Target Fund by, the corresponding Destination Fund in exchange for shares of the Destination Fund as shown in the table above. Please retain this SAI for further reference.
DOCUMENTS INCORPORATED BY REFERENCE
This SAI consists of these cover pages, the accompanying pro forma financial statements and the following documents, each of which was filed electronically with the Securities and Exchange Commission (the “SEC”) and is incorporated by reference herein.
| | 1. | The Destination Funds’ Statement of Additional Information dated [ ], 2016 (File Nos. 811-04556 and 033-02659), as filed with the SEC on [ ], 2016 (Accession No. [ ]) is incorporated herein by reference. [To be filed prior to the effective date of this Registration Statement on Form N-14.] |
| | 2. | The Destination Funds’ Annual Report for the fiscal year ended October 31, 2015 (File No. 811-04556), as filed with the SEC on January 8, 2016 (Accession No. 0001193125-16-423654) is incorporated herein by reference. |
| | 3. | The Destination Funds’ Semi-Annual Report filed the period ended April 30, 2016 (File No. 811-04556), as filed with the SEC on July 7, 2016 (Accession No. 0001193125-16-643460) is incorporated herein by reference. |
| | 4. | The Investors Target Feeder Funds’ Statement of Additional Information dated May 1, 2016 (File Nos. 811-07674 and 033-61810), as filed with the SEC on April 29, 2016 (Accession No. 0001193125-16-565066) is incorporated herein by reference. |
| | 5. | The Institutional Target Feeder Funds’ Statement of Additional Information dated May 1, 2016 (File Nos. 811-07495 and 333-00295), as filed with the SEC on April 29, 2016 (Accession No. 0001193125-16-565039 ) is incorporated herein by reference. |
| | 6. | The Target Feeder Funds’ Annual Report for the fiscal year ended December 31, 2015 (File Nos. 811-07674 and 811-07495), as filed with the SEC on March 9, 2016 (Accession Nos. 0001193125-16-497957 and 0001193125-16-497962) is incorporated herein by reference. |
| | 7. | The Target Feeder Funds’ Semi-Annual Report for the period ended June 30, 2016 (File Nos. 811-07674 and 811-07495), as filed with the SEC on September 1, 2016 (Accession Nos. 0001193125-16-699248 and 0001193125-16-699253) is incorporated herein by reference. |
| | 8. | The Target Master Portfolios’ Statement of Additional Information dated May 1, 2016 (File No. 811-08272), as filed with the SEC on April 29, 2016 (Accession No. 0001193125-16-565034) is incorporated herein by reference. |
| | 9. | The Target Master Portfolios’ Annual Report for the fiscal year ended December 31, 2015 (File No. 811-08272), as filed with the SEC on March 9, 2016 (Accession No. 0001193125-16-497954) is incorporated herein by reference. |
| | 10. | The Target Master Portfolios’ Semi-Annual Report for the period ended June 30, 2016 (File No. 811-08272), as filed with the SEC on September 1, 2016 (Accession No. 0001193125-16-699254) is incorporated herein by reference. |
S-4
PRO FORMA FINANCIAL STATEMENTS
Shown below are the financial statements for each Target Fund and each Destination Fund shown in the table above.
The pro forma financial statements are unaudited.
Group One Reorganization Between:
TRANSAMERICA PARTNERS CORE BOND
TRANSAMERICA PARTNERS INSTITUTIONAL CORE BOND
TRANSAMERICA PARTNERS CORE BOND PORTFOLIO
AND
TRANSAMERICA INTERMEDIATE BOND
PRO FORMA SCHEDULE OF INVESTMENTS
At June 30, 2016
Reorganization Between TPP Master and TAF
PRO FORMA SCHEDULE OF INVESTMENTS
At June 30, 2016
| | | | | | | | | | | | | | | | | | | | | | | | | | | | | | | | | | | | | | | | | | | | | | | | | | | | | | |
| | | | | | | | | | | TPP Master | | | | | TAF Destination | | | | | Adjustments | | | | | Combined Pro Forma Destination | |
| | | | | | | | | | | | | | | | | |
| | | Coupon Rate | | | Maturity Date | | | | | Principal | | | | | Value | | | | | Principal | | | | | Value | | | | | Principal | | | Value | | | | | Principal | | | | | Value | |
| | | | | | | | | | | | | | | | | | | | | | | | | | | | |
Asset-Backed Securities - 5.8 % | | | | | | | | | | | | | | | | | | | | | | | | | | | | | | | | | | | | | | | | | | | | | | | | | | | | | | |
321 Henderson Receivables VI LLC | | | 5.56 | % | | | 07/15/2059 | | | | | $ | 3,562,609 | | | | | $ | 3,956,430 | | | | | $ | 1,271,755 | | | | | $ | 1,412,338 | | | | | | | | | | | | | | | $ | 4,834,364 | | | | | $ | 5,368,768 | |
American Tower Trust I | | | 1.55 | % | | | 03/15/2043 | | | | | | - | | | | | | - | | | | | | 4,564,000 | | | | | | 4,573,666 | | | | | | | | | | | | | | | | 4,564,000 | | | | | | 4,573,666 | |
BlueMountain CLO, Ltd. | | | 2.06 | % | | | 07/18/2027 | | | | | | 4,560,000 | | | | | | 4,525,194 | | | | | | 5,880,000 | | | | | | 5,835,118 | | | | | | | | | | | | | | | | 10,440,000 | | | | | | 10,360,312 | |
BXG Receivables Note Trust | | | 2.88 | % | | | 05/02/2030 | | | | | | 2,583,369 | | | | | | 2,614,197 | | | | | | - | | | | | | - | | | | | | | | | | | | | | | | 2,583,369 | | | | | | 2,614,197 | |
Conseco Finance Securitizations Corp. | | | 6.03 | % | | | 03/01/2033 | | | | | | 110,016 | | | | | | 110,455 | | | | | | - | | | | | | - | | | | | | | | | | | | | | | | 110,016 | | | | | | 110,455 | |
Diamond Resorts Owner Trust | | | 2.73 | % | | | 07/20/2027 | | | | | | - | | | | | | - | | | | | | 365,665 | | | | | | 367,824 | | | | | | | | | | | | | | | | 365,665 | | | | | | 367,824 | |
Ford Credit Floorplan Master Owner Trust | | | 2.86 | % | | | 01/15/2019 | | | | | | 455,000 | | | | | | 458,262 | | | | | | - | | | | | | - | | | | | | | | | | | | | | | | 455,000 | | | | | | 458,262 | |
Ford Credit Floorplan Master Owner Trust | | | 3.50 | % | | | 01/15/2019 | | | | | | 815,000 | | | | | | 822,577 | | | | | | - | | | | | | - | | | | | | | | | | | | | | | | 815,000 | | | | | | 822,577 | |
Hilton Grand Vacations Trust | | | 2.28 | % | | | 01/25/2026 | | | | | | - | | | | | | - | | | | | | 804,224 | | | | | | 805,312 | | | | | | | | | | | | | | | | 804,224 | | | | | | 805,312 | |
HSBC Home Equity Loan Trust | | | 0.71 | % | | | 03/20/2036 | | | | | | 5,750,000 | | | | | | 5,665,032 | | | | | | - | | | | | | - | | | | | | | | | | | | | | | | 5,750,000 | | | | | | 5,665,032 | |
ICG US CLO, Ltd. | | | 1.78 | % | | | 04/20/2026 | | | | | | 4,610,000 | | | | | | 4,512,208 | | | | | | 5,010,000 | | | | | | 4,903,723 | | | | | | | | | | | | | | | | 9,620,000 | | | | | | 9,415,931 | |
JG Wentworth XXI LLC | | | 4.07 | % | | | 01/15/2048 | | | | | | - | | | | | | - | | | | | | 1,309,122 | | | | | | 1,362,719 | | | | | | | | | | | | | | | | 1,309,122 | | | | | | 1,362,719 | |
MVW Owner Trust | | | 2.25 | % | | | 09/22/2031 | | | | | | 2,224,576 | | | | | | 2,189,443 | | | | | | - | | | | | | - | | | | | | | | | | | | | | | | 2,224,576 | | | | | | 2,189,443 | |
NRZ Advance Receivables Trust Advance Receivables Backed | | | 3.20 | % | | | 11/15/2047 | | | | | | 5,920,000 | | | | | | 5,947,715 | | | | | | 5,310,000 | | | | | | 5,334,859 | | | | | | | | | | | | | | | | 11,230,000 | | | | | | 11,282,574 | |
OCP CLO, Ltd. | | | 2.16 | % | | | 04/17/2027 | | | | | | 4,650,000 | | | | | | 4,591,452 | | | | | | 5,570,000 | | | | | | 5,499,868 | | | | | | | | | | | | | | | | 10,220,000 | | | | | | 10,091,320 | |
Ocwen Master Advance Receivables Trust | | | 3.21 | % | | | 11/15/2047 | | | | | | 6,115,000 | | | | | | 6,140,934 | | | | | | 4,668,000 | | | | | | 4,687,797 | | | | | | | | | | | | | | | | 10,783,000 | | | | | | 10,828,731 | |
Orange Lake Timeshare Trust | | | 2.29 | % | | | 07/09/2029 | | | | | | - | | | | | | - | | | | | | 1,487,080 | | | | | | 1,491,302 | | | | | | | | | | | | | | | | 1,487,080 | | | | | | 1,491,302 | |
Orange Lake Timeshare Trust | | | 2.88 | % | | | 09/08/2027 | | | | | | - | | | | | | - | | | | | | 2,574,800 | | | | | | 2,578,185 | | | | | | | | | | | | | | | | 2,574,800 | | | | | | 2,578,185 | |
Palmer Square CLO, Ltd. | | | 2.13 | % | | | 07/20/2027 | | | | | | 4,575,000 | | | | | | 4,538,135 | | | | | | 1,870,000 | | | | | | 1,854,932 | | | | | | | | | | | | | | | | 6,445,000 | | | | | | 6,393,067 | |
RAAC Trust | | | 0.80 | % | | | 11/25/2046 | | | | | | 905,436 | | | | | | 766,799 | | | | | | - | | | | | | - | | | | | | | | | | | | | | | | 905,436 | | | | | | 766,799 | |
SBA Tower Trust | | | 2.90 | % | | | 10/15/2044 | | | | | | 9,030,000 | | | | | | 9,155,382 | | | | | | 9,391,000 | | | | | | 9,521,394 | | | | | | | | | | | | | | | | 18,421,000 | | | | | | 18,676,776 | |
Sierra Timeshare Receivables Funding LLC | | | 2.70 | % | | | 10/20/2030 | | | | | | 882,048 | | | | | | 880,427 | | | | | | - | | | | | | - | | | | | | | | | | | | | | | | 882,048 | | | | | | 880,427 | |
Sierra Timeshare Receivables Funding LLC | | | 2.07 | % | | | 03/20/2030 | | | | | | 1,702,707 | | | | | | 1,698,916 | | | | | | 1,082,191 | | | | | | 1,079,782 | | | | | | | | | | | | | | | | 2,784,898 | | | | | | 2,778,698 | |
Sierra Timeshare Receivables Funding LLC | | | 1.59 | % | | | 11/20/2029 | | | | | | - | | | | | | - | | | | | | 1,366,326 | | | | | | 1,355,455 | | | | | | | | | | | | | | | | 1,366,326 | | | | | | 1,355,455 | |
Sierra Timeshare Receivables Funding LLC | | | 2.05 | % | | | 06/20/2031 | | | | | | 1,495,350 | | | | | | 1,492,313 | | | | | | 452,609 | | | | | | 451,690 | | | | | | | | | | | | | | | | 1,947,959 | | | | | | 1,944,003 | |
Sierra Timeshare Receivables Funding LLC | | | 2.20 | % | | | 10/20/2030 | | | | | | - | | | | | | - | | | | | | 1,036,180 | | | | | | 1,036,509 | | | | | | | | | | | | | | | | 1,036,180 | | | | | | 1,036,509 | |
Sierra Timeshare Receivables Funding LLC | | | 2.30 | % | | | 10/20/2031 | | | | | | 1,782,858 | | | | | | 1,788,264 | | | | | | 412,390 | | | | | | 413,641 | | | | | | | | | | | | | | | | 2,195,248 | | | | | | 2,201,905 | |
Sierra Timeshare Receivables Funding LLC | | | 2.40 | % | | | 06/20/2031 | | | | | | - | | | | | | - | | | | | | 1,044,482 | | | | | | 1,039,047 | | | | | | | | | | | | | | | | 1,044,482 | | | | | | 1,039,047 | |
Sierra Timeshare Receivables Funding LLC | | | 2.40 | % | | | 03/22/2032 | | | | | | 1,151,859 | | | | | | 1,154,464 | | | | | | - | | | | | | - | | | | | | | | | | | | | | | | 1,151,859 | | | | | | 1,154,464 | |
Sierra Timeshare Receivables Funding LLC | | | 2.58 | % | | | 09/20/2032 | | | | | | - | | | | | | - | | | | | | 2,657,806 | | | | | | 2,679,307 | | | | | | | | | | | | | | | | 2,657,806 | | | | | | 2,679,307 | |
Sierra Timeshare Receivables Funding LLC | | | 3.05 | % | | | 03/22/2032 | | | | | | 1,195,144 | | | | | | 1,198,043 | | | | | | - | | | | | | - | | | | | | | | | | | | | | | | 1,195,144 | | | | | | 1,198,043 | |
SilverLeaf Finance XVII LLC | | | 2.68 | % | | | 03/16/2026 | | | | | | - | | | | | | - | | | | | | 472,760 | | | | | | 459,346 | | | | | | | | | | | | | | | | 472,760 | | | | | | 459,346 | |
Silverleaf Finance XVIII LLC | | | 2.81 | % | | | 01/15/2027 | | | | | | 1,560,842 | | | | | | 1,556,724 | | | | | | 647,780 | | | | | | 646,071 | | | | | | | | | | | | | | | | 2,208,622 | | | | | | 2,202,795 | |
SLM Private Education Loan Trust | | | 2.69 | % | | | 06/16/2042 | | | | | | 690,000 | | | | | | 708,769 | | | | | | - | | | | | | - | | | | | | | | | | | | | | | | 690,000 | | | | | | 708,769 | |
SolarCity LMC Series III LLC | | | 4.02 | % | | | 07/20/2044 | | | | | | 3,471,434 | | | | | | 3,356,360 | | | | | | 780,838 | | | | | | 754,954 | | | | | | | | | | | | | | | | 4,252,272 | | | | | | 4,111,314 | |
SpringCastle America Funding LLC | | | 2.70 | % | | | 05/25/2023 | | | | | | 1,361,483 | | | | | | 1,366,112 | | | | | | 1,070,725 | | | | | | 1,074,366 | | | | | | | | | | | | | | | | 2,432,208 | | | | | | 2,440,478 | |
SPS Servicer Advance Receivables Trust Advance Receivables Backed Notes | | | 2.92 | % | | | 07/15/2047 | | | | | | - | | | | | | - | | | | | | 2,000,000 | | | | | | 2,008,754 | | | | | | | | | | | | | | | | 2,000,000 | | | | | | 2,008,754 | |
SVO VOI Mortgage LLC | | | 2.00 | % | | | 09/20/2029 | | | | | | - | | | | | | - | | | | | | 617,473 | | | | | | 610,639 | | | | | | | | | | | | | | | | 617,473 | | | | | | 610,639 | |
Trafigura Securitisation Finance PLC | | | 1.39 | % | | | 10/15/2018 | | | | | | 6,291,000 | | | | | | 6,224,992 | | | | | | 5,537,000 | | | | | | 5,478,903 | | | | | | | | | | | | | | | | 11,828,000 | | | | | | 11,703,895 | |
| | | | | | | | | | | | | | | | | | | | | | | | | | | | |
Total Asset-Backed Securities | | | | | | | | | | | | | | | | | | | 77,419,599 | | | | | | | | | | | | 69,317,501 | | | | | | | | | | | | | | | | | | | | | | 146,737,100 | |
| | | | | | | | | | | | | | | | | | | | | | | | | | | | |
| | | | | | | | | | | | | | | | | | | Total Cost ($77,748,092) | | | | | | | | | | | | Total Cost ($69,175,169) | | | | | | | | | | | | | | | | | | | | | | Total Cost ($146,923,261) | |
Corporate Debt Securities - 38.2 % | | | | | | | | | | | | | | | | | | | | | | | | | | | | | | | | | | | | | | | | | | | | | | | | | | | | | | |
Air Freight & Logistics | | | | | | | | | | | | | | | | | | | | | | | | | | | | | | | | | | | | | | | | | | | | | | | | | | | | | | |
FedEx Corp. | | | 4.90 | % | | | 01/15/2034 | | | | | | 1,260,000 | | | | | | 1,220,175 | | | | | | - | | | | | | - | | | | | | | | | | | | | | | | 1,260,000 | | | | | | 1,220,175 | |
FedEx Corp. | | | 5.10 | % | | | 01/15/2044 | | | | | | 1,075,000 | | | | | | 1,468,144 | | | | | | 1,140,000 | | | | | | 1,293,952 | | | | | | | | | | | | | | | | 2,215,000 | | | | | | 2,762,096 | |
Airlines | | | | | | | | | | | | | | | | | | | | | | | | | | | | | | | | | | | | | | | | | | | | | | | | | | | | | | |
American Airlines Pass-Through Trust | | | 3.20 | % | | | 12/15/2029 | | | | | | 2,264,224 | | | | | | 2,341,026 | | | | | | - | | | | | | - | | | | | | | | | | | | | | | | 2,264,224 | | | | | | 2,341,026 | |
American Airlines Pass-Through Trust | | | 3.70 | % | | | 04/01/2028 | | | | | | 3,927,584 | | | | | | 4,084,688 | | | | | | 3,110,099 | | | | | | 3,234,503 | | | | | | | | | | | | | | | | 7,037,683 | | | | | | 7,319,191 | |
American Airlines Pass-Through Trust | | | 4.95 | % | | | 07/15/2024 | | | | | | - | | | | | | - | | | | | | 3,761,382 | | | | | | 4,090,503 | | | | | | | | | | | | | | | | 3,761,382 | | | | | | 4,090,503 | |
Continental Airlines Pass-Through Trust | | | 4.00 | % | | | 04/29/2026 | | | | | | - | | | | | | - | | | | | | 5,065,941 | | | | | | 5,319,239 | | | | | | | | | | | | | | | | 5,065,941 | | | | | | 5,319,239 | |
Continental Airlines Pass-Through Trust | | | 9.00 | % | | | 01/08/2018 | | | | | | - | | | | | | - | | | | | | 976,412 | | | | | | 976,412 | | | | | | | | | | | | | | | | 976,412 | | | | | | 976,412 | |
Delta Air Lines Pass-Through Trust | | | 4.75 | % | | | 11/07/2021 | | | | | | - | | | | | | - | | | | | | 2,013,591 | | | | | | 2,134,407 | | | | | | | | | | | | | | | | 2,013,591 | | | | | | 2,134,407 | |
Delta Air Lines Pass-Through Trust | | | 6.82 | % | | | 02/10/2024 | | | | | | - | | | | | | - | | | | | | 1,735,402 | | | | | | 2,016,537 | | | | | | | | | | | | | | | | 1,735,402 | | | | | | 2,016,537 | |
Delta Air Lines Pass-Through Trust | | | 7.75 | % | | | 06/17/2021 | | | | | | - | | | | | | - | | | | | | 170,663 | | | | | | 192,440 | | | | | | | | | | | | | | | | 170,663 | | | | | | 192,440 | |
Southwest Airlines Co. Pass-Through Trust | | | 6.15 | % | | | 02/01/2024 | | | | | | - | | | | | | - | | | | | | 378,285 | | | | | | 429,150 | | | | | | | | | | | | | | | | 378,285 | | | | | | 429,150 | |
UAL Pass-Through Trust | | | 10.40 | % | | | 05/01/2018 | | | | | | - | | | | | | - | | | | | | 632,245 | | | | | | 649,632 | | | | | | | | | | | | | | | | 632,245 | | | | | | 649,632 | |
United Airlines Pass-Through Trust | | | 3.75 | % | | | 03/03/2028 | | | | | | 6,888,559 | | | | | | 7,284,651 | | | | | | - | | | | | | - | | | | | | | | | | | | | | | | 6,888,559 | | | | | | 7,284,651 | |
Auto Components | | | | | | | | | | | | | | | | | | | | | | | | | | | | | | | | | | | | | | | | | | | | | | | | | | | | | | |
BorgWarner, Inc. | | | 3.38 | % | | | 03/15/2025 | | | | | | 2,235,000 | | | | | | 2,285,330 | | | | | | 1,665,000 | | | | | | 1,702,494 | | | | | | | | | | | | | | | | 3,900,000 | | | | | | 3,987,824 | |
Automobiles | | | | | | | | | | | | | | | | | | | | | | | | | | | | | | | | | | | | | | | | | | | | | | | | | | | | | | |
BMW US Capital LLC | | | 2.80 | % | | | 04/11/2026 | | | | | | 1,777,143 | | | | | | 1,822,839 | | | | | | 3,095,000 | | | | | | 3,174,582 | | | | | | | | | | | | | | | | 4,872,143 | | | | | | 4,997,421 | |
General Motors Co. | | | 4.88 | % | | | 10/02/2023 | | | | | | 850,000 | | | | | | 904,860 | | | | | | 3,190,000 | | | | | | 3,395,886 | | | | | | | | | | | | | | | | 4,040,000 | | | | | | 4,300,746 | |
General Motors Co. | | | 6.25 | % | | | 10/02/2043 | | | | | | 500,000 | | | | | | 555,426 | | | | | | 575,000 | | | | | | 638,740 | | | | | | | | | | | | | | | | 1,075,000 | | | | | | 1,194,166 | |
Banks | | | | | | | | | | | | | | | | | | | | | | | | | | | | | | | | | | | | | | | | | | | | | | | | | | | | | | |
Bank of America Corp. | | | 4.10 | % | | | 07/24/2023 | | | | | | 1,595,000 | | | | | | 1,708,779 | | | | | | - | | | | | | - | | | | | | | | | | | | | | | | 1,595,000 | | | | | | 1,708,779 | |
Bank of America Corp. | | | 4.45 | % | | | 03/03/2026 | | | | | | 1,325,000 | | | | | | 1,385,865 | | | | | | - | | | | | | - | | | | | | | | | | | | | | | | 1,325,000 | | | | | | 1,385,865 | |
Bank of America Corp. | | | 5.42 | % | | | 03/15/2017 | | | | | | 1,600,000 | | | | | | 1,644,954 | | | | | | 8,670,000 | | | | | | 8,913,592 | | | | | | | | | | | | | | | | 10,270,000 | | | | | | 10,558,546 | |
Bank of America Corp. | | | 5.75 | % | | | 12/01/2017 | | | | | | 1,965,000 | | | | | | 2,079,839 | | | | | | - | | | | | | - | | | | | | | | | | | | | | | | 1,965,000 | | | | | | 2,079,839 | |
Bank One Corp. | | | 8.00 | % | | | 04/29/2027 | | | | | | 470,000 | | | | | | 636,975 | | | | | | 470,000 | | | | | | 636,975 | | | | | | | | | | | | | | | | 940,000 | | | | | | 1,273,950 | |
Barclays Bank PLC | | | 10.18 | % | | | 06/12/2021 | | | | | | 9,240,000 | | | | | | 11,633,382 | | | | | | 7,660,000 | | | | | | 9,644,124 | | | | | | | | | | | | | | | | 16,900,000 | | | | | | 21,277,506 | |
Branch Banking & Trust Co. | | | 3.80 | % | | | 10/30/2026 | | | | | | 1,980,000 | | | | | | 2,180,631 | | | | | | 2,430,000 | | | | | | 2,676,229 | | | | | | | | | | | | | | | | 4,410,000 | | | | | | 4,856,860 | |
Citigroup, Inc. | | | 1.70 | % | | | 04/27/2018 | | | | | | 5,142,000 | | | | | | 5,150,243 | | | | | | - | | | | | | - | | | | | | | | | | | | | | | | 5,142,000 | | | | | | 5,150,243 | |
Citigroup, Inc. | | | 3.38 | % | | | 03/01/2023 | | | | | | 1,380,000 | | | | | | 1,428,027 | | | | | | - | | | | | | - | | | | | | | | | | | | | | | | 1,380,000 | | | | | | 1,428,027 | |
Citigroup, Inc. | | | 5.95 | % | | | 01/30/2023 | | | | | | - | | | | | | - | | | | | | 1,700,000 | | | | | | 1,679,813 | | | | | | | | | | | | | | | | 1,700,000 | | | | | | 1,679,813 | |
Citigroup, Inc. | | | 6.68 | % | | | 09/13/2043 | | | | | | 490,000 | | | | | | 629,080 | | | | | | - | | | | | | - | | | | | | | | | | | | | | | | 490,000 | | | | | | 629,080 | |
Commerzbank AG | | | 8.13 | % | | | 09/19/2023 | | | | | | 6,715,000 | | | | | | 7,837,614 | | | | | | 6,730,000 | | | | | | 7,855,121 | | | | | | | | | | | | | | | | 13,445,000 | | | | | | 15,692,735 | |
Cooperatieve Rabobank UA | | | 2.25 | % | | | 01/14/2019 | | | | | | 620,000 | | | | | | 631,938 | | | | | | - | | | | | | - | | | | | | | | | | | | | | | | 620,000 | | | | | | 631,938 | |
Cooperatieve Rabobank UA | | | 11.00 | % | | | 06/30/2019 | | | | | | 8,795,000 | | | | | | 10,488,037 | | | | | | 8,182,000 | | | | | | 9,757,035 | | | | | | | | | | | | | | | | 16,977,000 | | | | | | 20,245,072 | |
First Horizon National Corp. | | | 3.50 | % | | | 12/15/2020 | | | | | | 2,345,000 | | | | | | 2,366,473 | | | | | | 2,440,000 | | | | | | 2,462,343 | | | | | | | | | | | | | | | | 4,785,000 | | | | | | 4,828,816 | |
HSBC Holdings PLC | | | 4.25 | % | | | 03/14/2024 | | | | | | 485,000 | | | | | | 490,715 | | | | | | - | | | | | | - | | | | | | | | | | | | | | | | 485,000 | | | | | | 490,715 | |
Intesa Sanpaolo SpA | | | 5.02 | % | | | 06/26/2024 | | | | | | 1,405,000 | | | | | | 1,286,273 | | | | | | 1,540,000 | | | | | | 1,409,865 | | | | | | | | | | | | | | | | 2,945,000 | | | | | | 2,696,138 | |
JPMorgan Chase & Co. | | | 2.00 | % | | | 08/15/2017 | | | | | | 5,975,000 | | | | | | 6,030,669 | | | | | | - | | | | | | - | | | | | | | | | | | | | | | | 5,975,000 | | | | | | 6,030,669 | |
JPMorgan Chase & Co. | | | 3.25 | % | | | 09/23/2022 | | | | | | 1,745,000 | | | | | | 1,824,267 | | | | | | 3,380,000 | | | | | | 3,533,537 | | | | | | | | | | | | | | | | 5,125,000 | | | | | | 5,357,804 | |
JPMorgan Chase & Co. | | | 4.85 | % | | | 02/01/2044 | | | | | | 490,000 | | | | | | 587,863 | | | | | | - | | | | | | - | | | | | | | | | | | | | | | | 490,000 | | | | | | 587,863 | |
JPMorgan Chase & Co. | | | 6.40 | % | | | 05/15/2038 | | | | | | - | | | | | | - | | | | | | 3,925,000 | | | | | | 5,375,413 | | | | | | | | | | | | | | | | 3,925,000 | | | | | | 5,375,413 | |
JPMorgan Chase & Co. | | | 6.75 | % | | | 02/01/2024 | | | | | | 412,000 | | | | | | 453,715 | | | | | | - | | | | | | - | | | | | | | | | | | | | | | | 412,000 | | | | | | 453,715 | |
JPMorgan Chase Bank NA | | | 6.00 | % | | | 10/01/2017 | | | | | | 2,566,000 | | | | | | 2,710,237 | | | | | | 3,155,000 | | | | | | 3,332,346 | | | | | | | | | | | | | | | | 5,721,000 | | | | | | 6,042,583 | |
Macquarie Bank, Ltd. | | | 1.65 | % | | | 03/24/2017 | | | | | | 2,245,000 | | | | | | 2,249,982 | | | | | | - | | | | | | - | | | | | | | | | | | | | | | | 2,245,000 | | | | | | 2,249,982 | |
Nordea Bank AB | | | 4.25 | % | | | 09/21/2022 | | | | | | 9,640,000 | | | | | | 10,188,208 | | | | | | 8,402,000 | | | | | | 8,879,805 | | | | | | | | | | | | | | | | 18,042,000 | | | | | | 19,068,013 | |
Oversea-Chinese Banking Corp., Ltd. | | | 3.15 | % | | | 03/11/2023 | | | | | | - | | | | | | - | | | | | | 1,480,000 | | | | | | 1,505,756 | | | | | | | | | | | | | | | | 1,480,000 | | | | | | 1,505,756 | |
PNC Bank NA | | | 2.95 | % | | | 02/23/2025 | | | | | | - | | | | | | - | | | | | | 1,210,000 | | | | | | 1,249,653 | | | | | | | | | | | | | | | | 1,210,000 | | | | | | 1,249,653 | |
Royal Bank of Scotland Group PLC | | | 5.13 | % | | | 05/28/2024 | | | | | | - | | | | | | - | | | | | | 1,470,000 | | | | | | 1,433,401 | | | | | | | | | | | | | | | | 1,470,000 | | | | | | 1,433,401 | |
Royal Bank of Scotland Group PLC | | | 6.00 | % | | | 12/19/2023 | | | | | | 1,685,000 | | | | | | 1,712,182 | | | | | | - | | | | | | - | | | | | | | | | | | | | | | | 1,685,000 | | | | | | 1,712,182 | |
Royal Bank of Scotland Group PLC | | | 6.40 | % | | | 10/21/2019 | | | | | | 1,130,000 | | | | | | 1,246,758 | | | | | | - | | | | | | - | | | | | | | | | | | | | | | | 1,130,000 | | | | | | 1,246,758 | |
Societe Generale SA | | | 5.00 | % | | | 01/17/2024 | | | | | | 2,315,000 | | | | | | 2,407,380 | | | | | | - | | | | | | - | | | | | | | | | | | | | | | | 2,315,000 | | | | | | 2,407,380 | |
US Bank NA | | | 2.13 | % | | | 10/28/2019 | | | | | | - | | | | | | - | | | | | | 689,000 | | | | | | 706,248 | | | | | | | | | | | | | | | | 689,000 | | | | | | 706,248 | |
Wells Fargo & Co. | | | 2.15 | % | | | 01/15/2019 | | | | | | 912,000 | | | | | | 931,076 | | | | | | - | | | | | | - | | | | | | | | | | | | | | | | 912,000 | | | | | | 931,076 | |
Wells Fargo & Co. | | | 4.13 | % | | | 08/15/2023 | | | | | | 1,855,000 | | | | | | 1,997,091 | | | | | | 2,015,000 | | | | | | 2,169,347 | | | | | | | | | | | | | | | | 3,870,000 | | | | | | 4,166,438 | |
Wells Fargo & Co. | | | 5.38 | % | | | 11/02/2043 | | | | | | 550,000 | | | | | | 640,735 | | | | | | 2,298,000 | | | | | | 2,677,106 | | | | | | | | | | | | | | | | 2,848,000 | | | | | | 3,317,841 | |
Wells Fargo & Co. | | | 5.90 | % | | | 06/15/2024 | | | | | | 1,080,000 | | | | | | 1,111,050 | | | | | | - | | | | | | - | | | | | | | | | | | | | | | | 1,080,000 | | | | | | 1,111,050 | |
Beverages | | | | | | | | | | | | | | | | | | | | | | | | | | | | | | | | | | | | | | | | | | | | | | | | | | | | | | |
Anheuser-Busch InBev Finance, Inc. | | | 3.65 | % | | | 02/01/2026 | | | | | | 1,105,000 | | | | | | 1,183,727 | | | | | | 1,585,000 | | | | | | 1,697,925 | | | | | | | | | | | | | | | | 2,690,000 | | | | | | 2,881,652 | |
Anheuser-Busch InBev Worldwide, Inc. | | | 2.50 | % | | | 07/15/2022 | | | | | | 1,360,000 | | | | | | 1,383,608 | | | | | | 1,130,000 | | | | | | 1,149,616 | | | | | | | | | | | | | | | | 2,490,000 | | | | | | 2,533,224 | |
Molson Coors Brewing Co. | | | 2.10 | % | | | 07/15/2021 | | | | | | 2,605,000 | | | | | | 2,612,919 | | | | | | 2,640,000 | | | | | | 2,648,026 | | | | | | | | | | | | | | | | 5,245,000 | | | | | | 5,260,945 | |
Biotechnology | | | | | | | | | | | | | | | | | | | | | | | | | | | | | | | | | | | | | | | | | | | | | | | | | | | | | | |
Celgene Corp. | | | 3.63 | % | | | 05/15/2024 | | | | | | 2,330,000 | | | | | | 2,426,586 | | | | | | 3,710,000 | | | | | | 3,863,791 | | | | | | | | | | | | | | | | 6,040,000 | | | | | | 6,290,377 | |
Celgene Corp. | | | 3.88 | % | | | 08/15/2025 | | | | | | 3,585,000 | | | | | | 3,823,990 | | | | | | 3,745,000 | | | | | | 3,994,657 | | | | | | | | | | | | | | | | 7,330,000 | | | | | | 7,818,647 | |
Celgene Corp. | | | 5.00 | % | | | 08/15/2045 | | | | | | 4,585,000 | | | | | | 5,049,639 | | | | | | 1,715,000 | | | | | | 1,888,796 | | | | | | | | | | | | | | | | 6,300,000 | | | | | | 6,938,435 | |
Gilead Sciences, Inc. | | | 3.65 | % | | | 03/01/2026 | | | | | | 2,310,000 | | | | | | 2,513,691 | | | | | | 3,805,000 | | | | | | 4,140,517 | | | | | | | | | | | | | | | | 6,115,000 | | | | | | 6,654,208 | |
Gilead Sciences, Inc. | | | 4.75 | % | | | 03/01/2046 | | | | | | 2,005,000 | | | | | | 2,279,892 | | | | | | 5,960,000 | | | | | | 6,777,134 | | | | | | | | | | | | | | | | 7,965,000 | | | | | | 9,057,026 | |
S-5
| | | | | | | | | | | | | | | | | | | | | | | | | | | | | | | | | | | | | | | | | | | | | | | | | | | | | | |
| | | | | | | | | | | TPP Master | | | | | TAF Destination | | | | | Adjustments | | | | | Combined Pro Forma Destination | |
| | | | | | | | | | | | | | | | | |
| | | Coupon Rate | | | Maturity Date | | | | | Principal | | | | | Value | | | | | Principal | | | | | Value | | | | | Principal | | | Value | | | | | Principal | | | | | Value | |
| | | | | | | | | | | | | | | | | | | | | | | | | | | | |
Building Products | | | | | | | | | | | | | | | | | | | | | | | | | | | | | | | | | | | | | | | | | | | | | | | | | | | | | | |
Owens Corning | | | 4.20 | % | | | 12/15/2022 | | | | | $ | - | | | | | $ | - | | | | | $ | 4,114,000 | | | | | $ | 4,386,902 | | | | | | | | | | | | | | | $ | 4,114,000 | | | | | $ | 4,386,902 | |
Capital Markets | | | | | | | | | | | | | | | | | | | | | | | | | | | | | | | | | | | | | | | | | | | | | | | | | | | | | | |
Ameriprise Financial, Inc. | | | 3.70 | % | | | 10/15/2024 | | | | | | 3,495,000 | | | | | | 3,722,783 | | | | | | 6,836,000 | | | | | | 7,281,529 | | | | | | | | | | | | | | | | 10,331,000 | | | | | | 11,004,312 | |
Bank of New York Mellon Corp. | | | 2.10 | % | | | 01/15/2019 | | | | | | 1,275,000 | | | | | | 1,303,474 | | | | | | 1,990,000 | | | | | | 2,034,443 | | | | | | | | | | | | | | | | 3,265,000 | | | | | | 3,337,917 | |
Credit Suisse Group Funding Guernsey, Ltd. | | | 3.75 | % | | | 03/26/2025 | | | | | | - | | | | | | - | | | | | | 3,415,000 | | | | | | 3,342,445 | | | | | | | | | | | | | | | | 3,415,000 | | | | | | 3,342,445 | |
Credit Suisse Group Funding Guernsey, Ltd. | | | 3.80 | % | | | 06/09/2023 | | | | | | - | | | | | | - | | | | | | 5,920,000 | | | | | | 5,904,809 | | | | | | | | | | | | | | | | 5,920,000 | | | | | | 5,904,809 | |
Deutsche Bank AG | | | 1.95 | % | | | 08/20/2020 | | | | | | 2,535,000 | | | | | | 2,474,657 | | | | | | 2,210,000 | | | | | | 2,157,393 | | | | | | | | | | | | | | | | 4,745,000 | | | | | | 4,632,050 | |
Goldman Sachs Group, Inc. | | | 1.73 | % | | | 11/15/2018 | | | | | | - | | | | | | - | | | | | | 3,615,000 | | | | | | 3,623,821 | | | | | | | | | | | | | | | | 3,615,000 | | | | | | 3,623,821 | |
Goldman Sachs Group, Inc. | | | 4.25 | % | | | 10/21/2025 | | | | | | 4,225,000 | | | | | | 4,367,336 | | | | | | 3,525,000 | | | | | | 3,643,754 | | | | | | | | | | | | | | | | 7,750,000 | | | | | | 8,011,090 | |
Goldman Sachs Group, Inc. | | | 5.75 | % | | | 01/24/2022 | | | | | | 3,555,000 | | | | | | 4,127,213 | | | | | | 4,815,000 | | | | | | 5,590,022 | | | | | | | | | | | | | | | | 8,370,000 | | | | | | 9,717,235 | |
Goldman Sachs Group, Inc. | | | 6.25 | % | | | 02/01/2041 | | | | | | 490,000 | | | | | | 634,111 | | | | | | - | | | | | | - | | | | | | | | | | | | | | | | 490,000 | | | | | | 634,111 | |
Goldman Sachs Group, Inc. | | | 6.75 | % | | | 10/01/2037 | | | | | | 1,557,000 | | | | | | 1,920,612 | | | | | | - | | | | | | - | | | | | | | | | | | | | | | | 1,557,000 | | | | | | 1,920,612 | |
Macquarie Group, Ltd. | | | 6.25 | % | | | 01/14/2021 | | | | | | 5,645,000 | | | | | | 6,451,789 | | | | | | 6,245,000 | | | | | | 7,137,542 | | | | | | | | | | | | | | | | 11,890,000 | | | | | | 13,589,331 | |
Morgan Stanley | | | 5.00 | % | | | 11/24/2025 | | | | | | 1,260,000 | | | | | | 1,379,437 | | | | | | - | | | | | | - | | | | | | | | | | | | | | | | 1,260,000 | | | | | | 1,379,437 | |
Morgan Stanley | | | 5.75 | % | | | 01/25/2021 | | | | | | 8,880,000 | | | | | | 10,124,488 | | | | | | 8,720,000 | | | | | | 9,942,064 | | | | | | | | | | | | | | | | 17,600,000 | | | | | | 20,066,552 | |
Oaktree Capital Management, LP | | | 6.75 | % | | | 12/02/2019 | | | | | | 4,080,000 | | | | | | 4,677,814 | | | | | | 2,330,000 | | | | | | 2,671,399 | | | | | | | | | | | | | | | | 6,410,000 | | | | | | 7,349,213 | |
State Street Capital Trust IV | | | 1.65 | % | | | 06/01/2077 | | | | | | 285,000 | | | | | | 238,069 | | | | | | - | | | | | | - | | | | | | | | | | | | | | | | 285,000 | | | | | | 238,069 | |
UBS AG | | | 1.80 | % | | | 03/26/2018 | | | | | | - | | | | | | - | | | | | | 2,503,000 | | | | | | 2,526,814 | | | | | | | | | | | | | | | | 2,503,000 | | | | | | 2,526,814 | |
UBS AG | | | 7.63 | % | | | 08/17/2022 | | | | | | 5,385,000 | | | | | | 6,098,512 | | | | | | 4,000,000 | | | | | | 4,530,000 | | | | | | | | | | | | | | | | 9,385,000 | | | | | | 10,628,512 | |
UBS Group Funding Jersey, Ltd. | | | 4.13 | % | | | 09/24/2025 | | | | | | 2,883,000 | | | | | | 2,988,368 | | | | | | - | | | | | | - | | | | | | | | | | | | | | | | 2,883,000 | | | | | | 2,988,368 | |
Chemicals | | | | | | | | | | | | | | | | | | | | | | | | | | | | | | | | | | | | | | | | | | | | | | | | | | | | | | |
LyondellBasell Industries NV | | | 5.00 | % | | | 04/15/2019 | | | | | | 1,217,000 | | | | | | 1,317,262 | | | | | | - | | | | | | - | | | | | | | | | | | | | | | | 1,217,000 | | | | | | 1,317,262 | |
Monsanto Co. | | | 4.40 | % | | | 07/15/2044 | | | | | | 2,705,000 | | | | | | 2,652,393 | | | | | | 3,836,000 | | | | | | 3,761,397 | | | | | | | | | | | | | | | | 6,541,000 | | | | | | 6,413,790 | |
Commercial Services & Supplies | | | | | | | | | | | | | | | | | | | | | | | | | | | | | | | | | | | | | | | | | | | | | | | | | | | | | | |
ERAC USA Finance LLC | | | 3.85 | % | | | 11/15/2024 | | | | | | 3,020,000 | | | | | | 3,246,304 | | | | | | - | | | | | | - | | | | | | | | | | | | | | | | 3,020,000 | | | | | | 3,246,304 | |
Hutchison Whampoa International 11, Ltd. | | | 3.50 | % | | | 01/13/2017 | | | | | | - | | | | | | - | | | | | | 235,000 | | | | | | 237,726 | | | | | | | | | | | | | | | | 235,000 | | | | | | 237,726 | |
Hutchison Whampoa International 12 II, Ltd. | | | 2.00 | % | | | 11/08/2017 | | | | | | - | | | | | | - | | | | | | 3,050,000 | | | | | | 3,079,747 | | | | | | | | | | | | | | | | 3,050,000 | | | | | | 3,079,747 | |
Hutchison Whampoa International 14, Ltd. | | | 1.63 | % | | | 10/31/2017 | | | | | | 2,325,000 | | | | | | 2,335,599 | | | | | | 1,250,000 | | | | | | 1,255,699 | | | | | | | | | | | | | | | | 3,575,000 | | | | | | 3,591,298 | |
Communications Equipment | | | | | | | | | | | | | | | | | | | | | | | | | | | | | | | | | | | | | | | | | | | | | | | | | | | | | | |
Cisco Systems, Inc. | | | 2.13 | % | | | 03/01/2019 | | | | | | 797,000 | | | | | | 818,568 | | | | | | - | | | | | | - | | | | | | | | | | | | | | | | 797,000 | | | | | | 818,568 | |
Harris Corp. | | | 5.55 | % | | | 10/01/2021 | | | | | | 3,442,000 | | | | | | 3,904,767 | | | | | | 5,369,000 | | | | | | 6,090,846 | | | | | | | | | | | | | | | | 8,811,000 | | | | | | 9,995,613 | |
Construction Materials | | | | | | | | | | | | | | | | | | | | | | | | | | | | | | | | | | | | | | | | | | | | | | | | | | | | | | |
Martin Marietta Materials, Inc. | | | 4.25 | % | | | 07/02/2024 | | | | | | 5,140,000 | | | | | | 5,474,773 | | | | | | 4,225,000 | | | | | | 4,500,178 | | | | | | | | | | | | | | | | 9,365,000 | | | | | | 9,974,951 | |
Consumer Finance | | | | | | | | | | | | | | | | | | | | | | | | | | | | | | | | | | | | | | | | | | | | | | | | | | | | | | |
Discover Financial Services | | | 3.85 | % | | | 11/21/2022 | | | | | | 1,111,000 | | | | | | 1,128,326 | | | | | | 5,260,000 | | | | | | 5,342,030 | | | | | | | | | | | | | | | | 6,371,000 | | | | | | 6,470,356 | |
Ford Motor Credit Co. LLC | | | 4.38 | % | | | 08/06/2023 | | | | | | 706,000 | | | | | | 767,310 | | | | | | - | | | | | | - | | | | | | | | | | | | | | | | 706,000 | | | | | | 767,310 | |
Containers & Packaging | | | | | | | | | | | | | | | | | | | | | | | | | | | | | | | | | | | | | | | | | | | | | | | | | | | | | | |
International Paper Co. | | | 4.75 | % | | | 02/15/2022 | | | | | | 2,047,000 | | | | | | 2,274,166 | | | | | | 2,300,000 | | | | | | 2,555,243 | | | | | | | | | | | | | | | | 4,347,000 | | | | | | 4,829,409 | |
Diversified Telecommunication Services | | | | | | | | | | | | | | | | | | | | | | | | | | | | | | | | | | | | | | | | | | | | | | | | | | | | | | |
AT&T, Inc. | | | 2.45 | % | | | 06/30/2020 | | | | | | 4,480,000 | | | | | | 4,573,896 | | | | | | 6,173,000 | | | | | | 6,302,380 | | | | | | | | | | | | | | | | 10,653,000 | | | | | | 10,876,276 | |
AT&T, Inc. | | | 3.40 | % | | | 05/15/2025 | | | | | | 2,735,000 | | | | | | 2,797,651 | | | | | | 1,808,000 | | | | | | 1,849,416 | | | | | | | | | | | | | | | | 4,543,000 | | | | | | 4,647,067 | |
AT&T, Inc. | | | 4.35 | % | | | 06/15/2045 | | | | | | 1,445,000 | | | | | | 1,400,156 | | | | | | 1,320,000 | | | | | | 1,279,035 | | | | | | | | | | | | | | | | 2,765,000 | | | | | | 2,679,191 | |
AT&T, Inc. | | | 4.60 | % | | | 02/15/2021 | | | | | | 1,685,000 | | | | | | 1,843,872 | | | | | | - | | | | | | - | | | | | | | | | | | | | | | | 1,685,000 | | | | | | 1,843,872 | |
AT&T, Inc. | | | 5.00 | % | | | 03/01/2021 | | | | | | 905,000 | | | | | | 1,013,374 | | | | | | - | | | | | | - | | | | | | | | | | | | | | | | 905,000 | | | | | | 1,013,374 | |
GTP Acquisition Partners I LLC | | | 2.35 | % | | | 06/15/2045 | | | | | | 790,000 | | | | | | 788,309 | | | | | | 795,000 | | | | | | 793,299 | | | | | | | | | | | | | | | | 1,585,000 | | | | | | 1,581,608 | |
Intelsat Jackson Holdings SA | | | 7.25 | % | | | 04/01/2019 | | | | | | 1,902,000 | | | | | | 1,388,460 | | | | | | 1,472,000 | | | | | | 1,074,560 | | | | | | | | | | | | | | | | 3,374,000 | | | | | | 2,463,020 | |
Sprint Capital Corp. | | | 6.88 | % | | | 11/15/2028 | | | | | | 822,000 | | | | | | 645,270 | | | | | | - | | | | | | - | | | | | | | | | | | | | | | | 822,000 | | | | | | 645,270 | |
Verizon Communications, Inc. | | | 3.45 | % | | | 03/15/2021 | | | | | | 1,125,000 | | | | | | 1,205,359 | | | | | | - | | | | | | - | | | | | | | | | | | | | | | | 1,125,000 | | | | | | 1,205,359 | |
Verizon Communications, Inc. | | | 3.85 | % | | | 11/01/2042 | | | | | | - | | | | | | - | | | | | | 1,250,000 | | | | | | 1,175,574 | | | | | | | | | | | | | | | | 1,250,000 | | | | | | 1,175,574 | |
Verizon Communications, Inc. | | | 4.50 | % | | | 09/15/2020 | | | | | | 1,135,000 | | | | | | 1,259,800 | | | | | | - | | | | | | - | | | | | | | | | | | | | | | | 1,135,000 | | | | | | 1,259,800 | |
Verizon Communications, Inc. | | | 5.15 | % | | | 09/15/2023 | | | | | | 2,975,000 | | | | | | 3,464,762 | | | | | | 6,545,000 | | | | | | 7,622,477 | | | | | | | | | | | | | | | | 9,520,000 | | | | | | 11,087,239 | |
Verizon Communications, Inc. | | | 6.55 | % | | | 09/15/2043 | | | | | | 2,901,000 | | | | | | 3,908,767 | | | | | | 1,986,000 | | | | | | 2,675,909 | | | | | | | | | | | | | | | | 4,887,000 | | | | | | 6,584,676 | |
Electric Utilities | | | | | | | | | | | | | | | | | | | | | | | | | | | | | | | | | | | | | | | | | | | | | | | | | | | | | | |
Appalachian Power Co. | | | 3.40 | % | | | 06/01/2025 | | | | | | 2,700,000 | | | | | | 2,865,316 | | | | | | 2,585,000 | | | | | | 2,743,274 | | | | | | | | | | | | | | | | 5,285,000 | | | | | | 5,608,590 | |
CenterPoint Energy Houston Electric LLC | | | 4.50 | % | | | 04/01/2044 | | | | | | 1,160,000 | | | | | | 1,368,528 | | | | | | - | | | | | | - | | | | | | | | | | | | | | | | 1,160,000 | | | | | | 1,368,528 | |
Cleveland Electric Illuminating Co. | | | 5.95 | % | | | 12/15/2036 | | | | | | 458,000 | | | | | | 504,139 | | | | | | - | | | | | | - | | | | | | | | | | | | | | | | 458,000 | | | | | | 504,139 | |
Cleveland Electric Illuminating Co. | | | 8.88 | % | | | 11/15/2018 | | | | | | 449,000 | | | | | | 523,167 | | | | | | - | | | | | | - | | | | | | | | | | | | | | | | 449,000 | | | | | | 523,167 | |
Commonwealth Edison Co. | | | 4.70 | % | | | 01/15/2044 | | | | | | 1,055,000 | | | | | | 1,269,546 | | | | | | - | | | | | | - | | | | | | | | | | | | | | | | 1,055,000 | | | | | | 1,269,546 | |
Duke Energy Carolinas LLC | | | 4.25 | % | | | 12/15/2041 | | | | | | 925,000 | | | | | | 1,036,495 | | | | | | - | | | | | | - | | | | | | | | | | | | | | | | 925,000 | | | | | | 1,036,495 | |
Duke Energy Corp. | | | 3.75 | % | | | 04/15/2024 | | | | | | 275,000 | | | | | | 295,292 | | | | | | - | | | | | | - | | | | | | | | | | | | | | | | 275,000 | | | | | | 295,292 | |
Entergy Arkansas, Inc. | | | 3.70 | % | | | 06/01/2024 | | | | | | 1,110,000 | | | | | | 1,216,745 | | | | | | - | | | | | | - | | | | | | | | | | | | | | | | 1,110,000 | | | | | | 1,216,745 | |
Jersey Central Power & Light Co. | | | 7.35 | % | | | 02/01/2019 | | | | | | 1,000,000 | | | | | | 1,127,812 | | | | | | - | | | | | | - | | | | | | | | | | | | | | | | 1,000,000 | | | | | | 1,127,812 | |
Niagara Mohawk Power Corp. | | | 4.88 | % | | | 08/15/2019 | | | | | | - | | | | | | - | | | | | | 1,540,000 | | | | | | 1,685,978 | | | | | | | | | | | | | | | | 1,540,000 | | | | | | 1,685,978 | |
Oncor Electric Delivery Co. LLC | | | 4.10 | % | | | 06/01/2022 | | | | | | 333,000 | | | | | | 369,154 | | | | | | 4,010,000 | | | | | | 4,445,374 | | | | | | | | | | | | | | | | 4,343,000 | | | | | | 4,814,528 | |
Oncor Electric Delivery Co. LLC | | | 5.30 | % | | | 06/01/2042 | | | | | | 525,000 | | | | | | 654,231 | | | | | | - | | | | | | - | | | | | | | | | | | | | | | | 525,000 | | | | | | 654,231 | |
Pacific Gas & Electric Co. | | | 4.75 | % | | | 02/15/2044 | | | | | | 488,000 | | | | | | 576,506 | | | | | | - | | | | | | - | | | | | | | | | | | | | | | | 488,000 | | | | | | 576,506 | |
PacifiCorp | | | 3.60 | % | | | 04/01/2024 | | | | | | 3,380,000 | | | | | | 3,712,605 | | | | | | 3,200,000 | | | | | | 3,514,893 | | | | | | | | | | | | | | | | 6,580,000 | | | | | | 7,227,498 | |
PacifiCorp | | | 5.75 | % | | | 04/01/2037 | | | | | | 400,000 | | | | | | 523,152 | | | | | | - | | | | | | - | | | | | | | | | | | | | | | | 400,000 | | | | | | 523,152 | |
Public Service Electric & Gas Co. | | | 3.00 | % | | | 05/15/2025 | | | | | | 2,760,000 | | | | | | 2,949,063 | | | | | | 3,335,000 | | | | | | 3,563,451 | | | | | | | | | | | | | | | | 6,095,000 | | | | | | 6,512,514 | |
Energy Equipment & Services | | | | | | | | | | | | | | | | | | | | | | | | | | | | | | | | | | | | | | | | | | | | | | | | | | | | | | |
Hiland Partners Holdings LLC / Hiland Partners Finance Corp. | | | 7.25 | % | | | 10/01/2020 | | | | | | - | | | | | | - | | | | | | 760,000 | | | | | | 788,500 | | | | | | | | | | | | | | | | 760,000 | | | | | | 788,500 | |
Schlumberger Holdings Corp. | | | 3.00 | % | | | 12/21/2020 | | | | | | 2,040,000 | | | | | | 2,127,630 | | | | | | 3,115,000 | | | | | | 3,248,808 | | | | | | | | | | | | | | | | 5,155,000 | | | | | | 5,376,438 | |
Schlumberger Investment SA | | | 3.65 | % | | | 12/01/2023 | | | | | | 835,000 | | | | | | 896,348 | | | | | | - | | | | | | - | | | | | | | | | | | | | | | | 835,000 | | | | | | 896,348 | |
Weatherford International, Ltd. | | | 5.95 | % | | | 04/15/2042 | | | | | | 960,000 | | | | | | 681,600 | | | | | | - | | | | | | - | | | | | | | | | | | | | | | | 960,000 | | | | | | 681,600 | |
Food & Staples Retailing | | | | | | | | | | | | | | | | | | | | | | | | | | | | | | | | | | | | | | | | | | | | | | | | | | | | | | |
CVS Health Corp. | | | 2.25 | % | | | 08/12/2019 | | | | | | 3,890,000 | | | | | | 3,994,945 | | | | | | 4,290,000 | | | | | | 4,405,736 | | | | | | | | | | | | | | | | 8,180,000 | | | | | | 8,400,681 | |
CVS Health Corp. | | | 5.30 | % | | | 12/05/2043 | | | | | | 319,000 | | | | | | 398,218 | | | | | | - | | | | | | - | | | | | | | | | | | | | | | | 319,000 | | | | | | 398,218 | |
Wal-Mart Stores, Inc. | | | 4.00 | % | | | 04/11/2043 | | | | | | 1,258,000 | | | | | | 1,396,386 | | | | | | - | | | | | | - | | | | | | | | | | | | | | | | 1,258,000 | | | | | | 1,396,386 | |
Wal-Mart Stores, Inc. | | | 4.30 | % | | | 04/22/2044 | | | | | | 945,000 | | | | | | 1,102,728 | | | | | | 2,855,000 | | | | | | 3,331,522 | | | | | | | | | | | | | | | | 3,800,000 | | | | | | 4,434,250 | |
Walgreens Boots Alliance, Inc. | | | 3.30 | % | | | 11/18/2021 | | | | | | 2,653,000 | | | | | | 2,782,042 | | | | | | 2,790,000 | | | | | | 2,925,706 | | | | | | | | | | | | | | | | 5,443,000 | | | | | | 5,707,748 | |
Food Products | | | | | | | | | | | | | | | | | | | | | | | | | | | | | | | | | | | | | | | | | | | | | | | | | | | | | | |
Kraft Heinz Foods Co. | | | 2.80 | % | | | 07/02/2020 | | | | | | 2,305,000 | | | | | | 2,393,606 | | | | | | 2,962,000 | | | | | | 3,075,862 | | | | | | | | | | | | | | | | 5,267,000 | | | | | | 5,469,468 | |
Mondelez International, Inc. | | | 2.25 | % | | | 02/01/2019 | | | | | | 1,570,000 | | | | | | 1,604,234 | | | | | | - | | | | | | - | | | | | | | | | | | | | | | | 1,570,000 | | | | | | 1,604,234 | |
Health Care Equipment & Supplies | | | | | | | | | | | | | | | | | | | | | | | | | | | | | | | | | | | | | | | | | | | | | | | | | | | | | | |
Boston Scientific Corp. | | | 2.65 | % | | | 10/01/2018 | | | | | | 1,062,000 | | | | | | 1,085,564 | | | | | | - | | | | | | - | | | | | | | | | | | | | | | | 1,062,000 | | | | | | 1,085,564 | |
Health Care Providers & Services | | | | | | | | | | | | | | | | | | | | | | | | | | | | | | | | | | | | | | | | | | | | | | | | | | | | | | |
Aetna, Inc. | | | 4.75 | % | | | 03/15/2044 | | | | | | 345,000 | | | | | | 379,053 | | | | | | - | | | | | | - | | | | | | | | | | | | | | | | 345,000 | | | | | | 379,053 | |
Anthem, Inc. | | | 1.88 | % | | | 01/15/2018 | | | | | | 1,930,000 | | | | | | 1,940,926 | | | | | | - | | | | | | - | | | | | | | | | | | | | | | | 1,930,000 | | | | | | 1,940,926 | |
Anthem, Inc. | | | 2.30 | % | | | 07/15/2018 | | | | | | 1,930,000 | | | | | | 1,957,763 | | | | | | 3,650,000 | | | | | | 3,702,505 | | | | | | | | | | | | | | | | 5,580,000 | | | | | | 5,660,268 | |
Anthem, Inc. | | | 3.30 | % | | | 01/15/2023 | | | | | | 620,000 | | | | | | 640,413 | | | | | | - | | | | | | - | | | | | | | | | | | | | | | | 620,000 | | | | | | 640,413 | |
Coventry Health Care, Inc. | | | 5.45 | % | | | 06/15/2021 | | | | | | 1,632,000 | | | | | | 1,862,399 | | | | | | - | | | | | | - | | | | | | | | | | | | | | | | 1,632,000 | | | | | | 1,862,399 | |
Express Scripts Holding Co. | | | 3.40 | % | | | 03/01/2027 | | | | | | 2,410,000 | | | | | | 2,406,934 | | | | | | 2,445,000 | | | | | | 2,441,890 | | | | | | | | | | | | | | | | 4,855,000 | | | | | | 4,848,824 | |
Express Scripts Holding Co. | | | 4.75 | % | | | 11/15/2021 | | | | | | 1,255,000 | | | | | | 1,407,682 | | | | | | 1,575,000 | | | | | | 1,766,613 | | | | | | | | | | | | | | | | 2,830,000 | | | | | | 3,174,295 | |
Express Scripts Holding Co. | | | 4.80 | % | | | 07/15/2046 | | | | | | 660,000 | | | | | | 659,120 | | | | | | 670,000 | | | | | | 669,106 | | | | | | | | | | | | | | | | 1,330,000 | | | | | | 1,328,226 | |
HCA Holdings, Inc. | | | 6.25 | % | | | 02/15/2021 | | | | | | - | | | | | | - | | | | | | 1,150,000 | | | | | | 1,227,625 | | | | | | | | | | | | | | | | 1,150,000 | | | | | | 1,227,625 | |
Tenet Healthcare Corp. | | | 6.25 | % | | | 11/01/2018 | | | | | | 1,010,000 | | | | | | 1,065,550 | | | | | | - | | | | | | - | | | | | | | | | | | | | | | | 1,010,000 | | | | | | 1,065,550 | |
UnitedHealth Group, Inc. | | | 3.38 | % | | | 11/15/2021 | | | | | | 650,000 | | | | | | 701,547 | | | | | | 1,335,000 | | | | | | 1,440,870 | | | | | | | | | | | | | | | | 1,985,000 | | | | | | 2,142,417 | |
Household Products | | | | | | | | | | | | | | | | | | | | | | | | | | | | | | | | | | | | | | | | | | | | | | | | | | | | | | |
Reynolds Group Issuer, Inc. / Reynolds Group Issuer LLC | | | 5.75 | % | | | 10/15/2020 | | | | | | - | | | | | | - | | | | | | 2,450,000 | | | | | | 2,529,625 | | | | | | | | | | | | | | | | 2,450,000 | | | | | | 2,529,625 | |
Reynolds Group Issuer, Inc. / Reynolds Group Issuer LLC | | | 6.88 | % | | | 02/15/2021 | | | | | | 2,320,000 | | | | | | 2,389,600 | | | | | | 1,235,000 | | | | | | 1,272,050 | | | | | | | | | | | | | | | | 3,555,000 | | | | | | 3,661,650 | |
Industrial Conglomerates | | | | | | | | | | | | | | | | | | | | | | | | | | | | | | | | | | | | | | | | | | | | | | | | | | | | | | |
General Electric Co. | | | 5.00 | % | | | 01/21/2021 | | | | | | 9,493,000 | | | | | | 10,072,073 | | | | | | 8,814,000 | | | | | | 9,351,654 | | | | | | | | | | | | | | | | 18,307,000 | | | | | | 19,423,727 | |
General Electric Co. | | | 5.50 | % | | | 01/08/2020 | | | | | | - | | | | | | - | | | | | | 1,635,000 | | | | | | 1,868,838 | | | | | | | | | | | | | | | | 1,635,000 | | | | | | 1,868,838 | |
General Electric Co. | | | 6.88 | % | | | 01/10/2039 | | | | | | 500,000 | | | | | | 754,725 | | | | | | - | | | | | | - | | | | | | | | | | | | | | | | 500,000 | | | | | | 754,725 | |
Insurance | | | | | | | | | | | | | | | | | | | | | | | | | | | | | | | | | | | | | | | | | | | | | | | | | | | | | | |
American Financial Group, Inc. | | | 9.88 | % | | | 06/15/2019 | | | | | | - | | | | | | - | | | | | | 635,000 | | | | | | 769,809 | | | | | | | | | | | | | | | | 635,000 | | | | | | 769,809 | |
American International Group, Inc. | | | 4.13 | % | | | 02/15/2024 | | | | | | 629,000 | | | | | | 663,552 | | | | | | 2,415,000 | | | | | | 2,547,658 | | | | | | | | | | | | | | | | 3,044,000 | | | | | | 3,211,210 | |
American International Group, Inc. | | | 8.18 | % | | | 05/15/2068 | | | | | | 1,070,000 | | | | | | 1,344,919 | | | | | | - | | | | | | - | | | | | | | | | | | | | | | | 1,070,000 | | | | | | 1,344,919 | |
Fidelity National Financial, Inc. | | | 5.50 | % | | | 09/01/2022 | | | | | | 1,320,000 | | | | | | 1,455,346 | | | | | | 370,000 | | | | | | 407,938 | | | | | | | | | | | | | | | | 1,690,000 | | | | | | 1,863,284 | |
Fidelity National Financial, Inc. | | | 6.60 | % | | | 05/15/2017 | | | | | | - | | | | | | - | | | | | | 1,226,000 | | | | | | 1,277,268 | | | | | | | | | | | | | | | | 1,226,000 | | | | | | 1,277,268 | |
Genworth Holdings, Inc. | | | 7.63 | % | | | 09/24/2021 | | | | | | 1,125,000 | | | | | | 957,656 | | | | | | - | | | | | | - | | | | | | | | | | | | | | | | 1,125,000 | | | | | | 957,656 | |
Hartford Financial Services Group, Inc. | | | 5.13 | % | | | 04/15/2022 | | | | | | - | | | | | | - | | | | | | 4,315,000 | | | | | | 4,907,428 | | | | | | | | | | | | | | | | 4,315,000 | | | | | | 4,907,428 | |
Lincoln National Corp. | | | 8.75 | % | | | 07/01/2019 | | | | | | 3,140,000 | | | | | | 3,714,366 | | | | | | 1,950,000 | | | | | | 2,306,692 | | | | | | | | | | | | | | | | 5,090,000 | | | | | | 6,021,058 | |
Metropolitan Life Global Funding I | | | 1.30 | % | | | 04/10/2017 | | | | | | 4,970,000 | | | | | | 4,985,516 | | | | | | - | | | | | | - | | | | | | | | | | | | | | | | 4,970,000 | | | | | | 4,985,516 | |
Nippon Life Insurance Co. | | | 5.00 | % | | | 10/18/2042 | | | | | | - | | | | | | - | | | | | | 4,080,000 | | | | | | 4,395,384 | | | | | | | | | | | | | | | | 4,080,000 | | | | | | 4,395,384 | |
OneBeacon US Holdings, Inc. | | | 4.60 | % | | | 11/09/2022 | | | | | | 1,690,000 | | | | | | 1,718,705 | | | | | | 1,694,000 | | | | | | 1,722,773 | | | | | | | | | | | | | | | | 3,384,000 | | | | | | 3,441,478 | |
Pacific Life Insurance Co. | | | 9.25 | % | | | 06/15/2039 | | | | | | 4,240,000 | | | | | | 6,428,713 | | | | | | 3,515,000 | | | | | | 5,329,464 | | | | | | | | | | | | | | | | 7,755,000 | | | | | | 11,758,177 | |
S-6
| | | | | | | | | | | | | | | | | | | | | | | | | | | | | | | | | | | | | | | | | | | | | | | | | | | | | | |
| | | | | | | | | | | TPP Master | | | | | TAF Destination | | | | | Adjustments | | | | | Combined Pro Forma Destination | |
| | | | | | | | | | | | | | | | | |
| | | Coupon Rate | | | Maturity Date | | | | | Principal | | | | | Value | | | | | Principal | | | | | Value | | | | | Principal | | | Value | | | | | Principal | | | | | Value | |
| | | | | | | | | | | | | | | | | | | | | | | | | | | | |
Principal Financial Group, Inc. | | | 8.88 | % | | | 05/15/2019 | | | | | $ | 1,770,000 | | | | | $ | 2,100,312 | | | | | $ | 1,403,000 | | | | | $ | 1,664,824 | | | | | | | | | | | | | | | $ | 3,173,000 | | | | | $ | 3,765,136 | |
Prudential Financial, Inc. | | | 5.38 | % | | | 06/21/2020 | | | | | | 1,465,000 | | | | | | 1,651,603 | | | | | | 395,000 | | | | | | 445,313 | | | | | | | | | | | | | | | | 1,860,000 | | | | | | 2,096,916 | |
Prudential Financial, Inc. | | | 7.38 | % | | | 06/15/2019 | | | | | | 1,595,000 | | | | | | 1,850,454 | | | | | | - | | | | | | - | | | | | | | | | | | | | | | | 1,595,000 | | | | | | 1,850,454 | |
Reinsurance Group of America, Inc. | | | 3.32 | % | | | 12/15/2065 | | | | | | 10,476,000 | | | | | | 7,621,290 | | | | | | 2,791,000 | | | | | | 2,030,453 | | | | | | | | | | | | | | | | 13,267,000 | | | | | | 9,651,743 | |
Swiss Re Solutions Holding Corp. | | | 7.75 | % | | | 06/15/2030 | | | | | | - | | | | | | - | | | | | | 2,903,000 | | | | | | 4,155,409 | | | | | | | | | | | | | | | | 2,903,000 | | | | | | 4,155,409 | |
IT Services | | | | | | | | | | | | | | | | | | | | | | | | | | | | | | | | | | | | | | | | | | | | | | | | | | | | | | |
International Business Machines Corp. | | | 3.63 | % | | | 02/12/2024 | | | | | | 1,543,000 | | | | | | 1,682,645 | | | | | | - | | | | | | - | | | | | | | | | | | | | | | | 1,543,000 | | | | | | 1,682,645 | |
MasterCard, Inc. | | | 2.00 | % | | | 04/01/2019 | | | | | | 1,366,000 | | | | | | 1,400,741 | | | | | | - | | | | | | - | | | | | | | | | | | | | | | | 1,366,000 | | | | | | 1,400,741 | |
MasterCard, Inc. | | | 3.38 | % | | | 04/01/2024 | | | | | | 878,000 | | | | | | 951,407 | | | | | | - | | | | | | - | | | | | | | | | | | | | | | | 878,000 | | | | | | 951,407 | |
Life Sciences Tools & Services | | | | | | | | | | | | | | | | | | | | | | | | | | | | | | | | | | | | | | | | | | | | | | | | | | | | | | |
Thermo Fisher Scientific, Inc. | | | 2.40 | % | | | 02/01/2019 | | | | | | 3,515,000 | | | | | | 3,576,129 | | | | | | 790,000 | | | | | | 803,739 | | | | | | | | | | | | | | | | 4,305,000 | | | | | | 4,379,868 | |
Machinery | | | | | | | | | | | | | | | | | | | | | | | | | | | | | | | | | | | | | | | | | | | | | | | | | | | | | | |
Doosan Heavy Industries & Construction Co., Ltd. | | | 2.13 | % | | | 04/27/2020 | | | | | | 1,245,000 | | | | | | 1,252,849 | | | | | | 1,185,000 | | | | | | 1,192,470 | | | | | | | | | | | | | | | | 2,430,000 | | | | | | 2,445,319 | |
Media | | | | | | | | | | | | | | | | | | | | | | | | | | | | | | | | | | | | | | | | | | | | | | | | | | | | | | |
21st Century Fox America, Inc. | | | 7.63 | % | | | 11/30/2028 | | | | | | 1,045,000 | | | | | | 1,445,800 | | | | | | - | | | | | | - | | | | | | | | | | | | | | | | 1,045,000 | | | | | | 1,445,800 | |
CBS Corp. | | | 4.63 | % | | | 05/15/2018 | | | | | | 655,000 | | | | | | 691,105 | | | | | | - | | | | | | - | | | | | | | | | | | | | | | | 655,000 | | | | | | 691,105 | |
CBS Corp. | | | 5.75 | % | | | 04/15/2020 | | | | | | 520,000 | | | | | | 594,999 | | | | | | 1,100,000 | | | | | | 1,258,651 | | | | | | | | | | | | | | | | 1,620,000 | | | | | | 1,853,650 | |
Clear Channel Worldwide Holdings, Inc. | | | 6.50 | % | | | 11/15/2022 | | | | | | - | | | | | | - | | | | | | 2,400,000 | | | | | | 2,400,000 | | | | | | | | | | | | | | | | 2,400,000 | | | | | | 2,400,000 | |
Comcast Corp. | | | 5.88 | % | | | 02/15/2018 | | | | | | 2,649,000 | | | | | | 2,852,939 | | | | | | - | | | | | | - | | | | | | | | | | | | | | | | 2,649,000 | | | | | | 2,852,939 | |
NBCUniversal Enterprise, Inc. | | | 5.25 | % | | | 03/19/2021 | | | | | | 1,500,000 | | | | | | 1,546,875 | | | | | | - | | | | | | - | | | | | | | | | | | | | | | | 1,500,000 | | | | | | 1,546,875 | |
NBCUniversal Media LLC | | | 4.38 | % | | | 04/01/2021 | | | | | | 2,770,000 | | | | | | 3,103,973 | | | | | | 3,864,000 | | | | | | 4,329,875 | | | | | | | | | | | | | | | | 6,634,000 | | | | | | 7,433,848 | |
NBCUniversal Media LLC | | | 4.45 | % | | | 01/15/2043 | | | | | | 1,359,000 | | | | | | 1,521,445 | | | | | | 1,106,000 | | | | | | 1,238,204 | | | | | | | | | | | | | | | | 2,465,000 | | | | | | 2,759,649 | |
Metals & Mining | | | | | | | | | | | | | | | | | | | | | | | | | | | | | | | | | | | | | | | | | | | | | | | | | | | | | | |
BHP Billiton Finance USA, Ltd. | | | 3.85 | % | | | 09/30/2023 | | | | | | 1,031,000 | | | | | | 1,121,896 | | | | | | - | | | | | | - | | | | | | | | | | | | | | | | 1,031,000 | | | | | | 1,121,896 | |
Freeport-McMoRan, Inc. | | | 3.88 | % | | | 03/15/2023 | | | | | | 1,125,000 | | | | | | 984,375 | | | | | | - | | | | | | - | | | | | | | | | | | | | | | | 1,125,000 | | | | | | 984,375 | |
Novelis, Inc. | | | 8.75 | % | | | 12/15/2020 | | | | | | 2,735,000 | | | | | | 2,851,238 | | | | | | 2,380,000 | | | | | | 2,481,150 | | | | | | | | | | | | | | | | 5,115,000 | | | | | | 5,332,388 | |
Rio Tinto Finance USA PLC | | | 2.88 | % | | | 08/21/2022 | | | | | | 390,000 | | | | | | 395,960 | | | | | | - | | | | | | - | | | | | | | | | | | | | | | | 390,000 | | | | | | 395,960 | |
Multi-Utilities | | | | | | | | | | | | | | | | | | | | | | | | | | | | | | | | | | | | | | | | | | | | | | | | | | | | | | |
CMS Energy Corp. | | | 3.88 | % | | | 03/01/2024 | | | | | | 539,000 | | | | | | 586,191 | | | | | | - | | | | | | - | | | | | | | | | | | | | | | | 539,000 | | | | | | 586,191 | |
CMS Energy Corp. | | | 4.88 | % | | | 03/01/2044 | | | | | | 725,000 | | | | | | 831,187 | | | | | | - | | | | | | - | | | | | | | | | | | | | | | | 725,000 | | | | | | 831,187 | |
DTE Electric Co. | | | 4.30 | % | | | 07/01/2044 | | | | | | - | | | | | | - | | | | | | 3,677,000 | | | | | | 4,222,273 | | | | | | | | | | | | | | | | 3,677,000 | | | | | | 4,222,273 | |
Oil, Gas & Consumable Fuels | | | | | | | | | | | | | | | | | | | | | | | | | | | | | | | | | | | | | | | | | | | | | | | | | | | | | | |
Anadarko Petroleum Corp. | | | 5.55 | % | | | 03/15/2026 | | | | | | 1,485,000 | | | | | | 1,639,856 | | | | | | 1,582,000 | | | | | | 1,746,971 | | | | | | | | | | | | | | | | 3,067,000 | | | | | | 3,386,827 | |
Apache Corp. | | | 4.25 | % | | | 01/15/2044 | | | | | | 360,000 | | | | | | 348,495 | | | | | | - | | | | | | - | | | | | | | | | | | | | | | | 360,000 | | | | | | 348,495 | |
Apache Corp. | | | 4.75 | % | | | 04/15/2043 | | | | | | 520,000 | | | | | | 534,595 | | | | | | - | | | | | | - | | | | | | | | | | | | | | | | 520,000 | | | | | | 534,595 | |
BP Capital Markets PLC | | | 3.12 | % | | | 05/04/2026 | | | | | | 3,120,000 | | | | | | 3,186,971 | | | | | | 3,140,000 | | | | | | 3,207,400 | | | | | | | | | | | | | | | | 6,260,000 | | | | | | 6,394,371 | |
CNOOC Nexen Finance ULC | | | 1.63 | % | | | 04/30/2017 | | | | | | - | | | | | | - | | | | | | 850,000 | | | | | | 851,390 | | | | | | | | | | | | | | | | 850,000 | | | | | | 851,390 | |
Continental Resources, Inc. | | | 3.80 | % | | | 06/01/2024 | | | | | | - | | | | | | - | | | | | | 1,055,000 | | | | | | 920,488 | | | | | | | | | | | | | | | | 1,055,000 | | | | | | 920,488 | |
Energy Transfer Partners, LP | | | 4.90 | % | | | 02/01/2024 | | | | | | - | | | | | | - | | | | | | 2,070,000 | | | | | | 2,116,314 | | | | | | | | | | | | | | | | 2,070,000 | | | | | | 2,116,314 | |
Energy Transfer Partners, LP | | | 5.15 | % | | | 03/15/2045 | | | | | | - | | | | | | - | | | | | | 720,000 | | | | | | 654,260 | | | | | | | | | | | | | | | | 720,000 | | | | | | 654,260 | |
Energy Transfer Partners, LP | | | 5.95 | % | | | 10/01/2043 | | | | | | 960,000 | | | | | | 927,690 | | | | | | - | | | | | | - | | | | | | | | | | | | | | | | 960,000 | | | | | | 927,690 | |
Energy Transfer Partners, LP | | | 7.60 | % | | | 02/01/2024 | | | | | | - | | | | | | - | | | | | | 3,005,000 | | | | | | 3,361,952 | | | | | | | | | | | | | | | | 3,005,000 | | | | | | 3,361,952 | |
EnLink Midstream Partners, LP | | | 2.70 | % | | | 04/01/2019 | | | | | | - | | | | | | - | | | | | | 3,615,000 | | | | | | 3,513,512 | | | | | | | | | | | | | | | | 3,615,000 | | | | | | 3,513,512 | |
EOG Resources, Inc. | | | 2.45 | % | | | 04/01/2020 | | | | | | 1,627,000 | | | | | | 1,649,882 | | | | | | - | | | | | | - | | | | | | | | | | | | | | | | 1,627,000 | | | | | | 1,649,882 | |
Exxon Mobil Corp. | | | 1.82 | % | | | 03/15/2019 | | | | | | 2,930,000 | | | | | | 2,985,614 | | | | | | - | | | | | | - | | | | | | | | | | | | | | | | 2,930,000 | | | | | | 2,985,614 | |
Exxon Mobil Corp. | | | 3.04 | % | | | 03/01/2026 | | | | | | 1,290,000 | | | | | | 1,369,352 | | | | | | 2,090,000 | | | | | | 2,218,562 | | | | | | | | | | | | | | | | 3,380,000 | | | | | | 3,587,914 | |
Husky Energy, Inc. | | | 4.00 | % | | | 04/15/2024 | | | | | | 1,120,000 | | | | | | 1,137,761 | | | | | | - | | | | | | - | | | | | | | | | | | | | | | | 1,120,000 | | | | | | 1,137,761 | |
Kerr-McGee Corp. | | | 6.95 | % | | | 07/01/2024 | | | | | | 865,000 | | | | | | 1,000,135 | | | | | | - | | | | | | - | | | | | | | | | | | | | | | | 865,000 | | | | | | 1,000,135 | |
Kinder Morgan Energy Partners, LP | | | 4.15 | % | | | 02/01/2024 | | | | | | 2,480,000 | | | | | | 2,492,730 | | | | | | - | | | | | | - | | | | | | | | | | | | | | | | 2,480,000 | | | | | | 2,492,730 | |
Kinder Morgan, Inc. | | | 3.05 | % | | | 12/01/2019 | | | | | | - | | | | | | - | | | | | | 830,000 | | | | | | 838,669 | | | | | | | | | | | | | | | | 830,000 | | | | | | 838,669 | |
Laredo Petroleum, Inc. | | | 7.38 | % | | | 05/01/2022 | | | | | | 1,370,000 | | | | | | 1,373,425 | | | | | | - | | | | | | - | | | | | | | | | | | | | | | | 1,370,000 | | | | | | 1,373,425 | |
MEG Energy Corp. | | | 6.50 | % | | | 03/15/2021 | | | | | | 1,090,000 | | | | | | 844,750 | | | | | | - | | | | | | - | | | | | | | | | | | | | | | | 1,090,000 | | | | | | 844,750 | |
Murphy Oil Corp. | | | 3.50 | % | | | 12/01/2017 | | | | | | 1,326,000 | | | | | | 1,322,103 | | | | | | - | | | | | | - | | | | | | | | | | | | | | | | 1,326,000 | | | | | | 1,322,103 | |
Nexen Energy ULC | | | 5.88 | % | | | 03/10/2035 | | | | | | 110,000 | | | | | | 128,752 | | | | | | - | | | | | | - | | | | | | | | | | | | | | | | 110,000 | | | | | | 128,752 | |
Noble Energy, Inc. | | | 6.00 | % | | | 03/01/2041 | | | | | | 430,000 | | | | | | 462,448 | | | | | | - | | | | | | - | | | | | | | | | | | | | | | | 430,000 | | | | | | 462,448 | |
Noble Energy, Inc. | | | 8.25 | % | | | 03/01/2019 | | | | | | 1,065,000 | | | | | | 1,219,758 | | | | | | - | | | | | | - | | | | | | | | | | | | | | | | 1,065,000 | | | | | | 1,219,758 | |
Peabody Energy Corp. | | | 6.25 | % | | | 11/15/2021 | | | | | | 1,715,000 | | | | | | 227,238 | | | | | | - | | | | | | - | | | | | | | | | | | | | | | | 1,715,000 | | | | | | 227,238 | |
Petrobras Global Finance BV | | | 5.38 | % | | | 01/27/2021 | | | | | | - | | | | | | - | | | | | | 1,415,000 | | | | | | 1,296,069 | | | | | | | | | | | | | | | | 1,415,000 | | | | | | 1,296,069 | |
Petrobras Global Finance BV | | | 6.25 | % | | | 03/17/2024 | | | | | | 1,370,000 | | | | | | 1,215,875 | | | | | | - | | | | | | - | | | | | | | | | | | | | | | | 1,370,000 | | | | | | 1,215,875 | |
Petroleos Mexicanos | | | 3.50 | % | | | 01/30/2023 | | | | | | 1,145,000 | | | | | | 1,078,132 | | | | | | 2,000,000 | | | | | | 1,883,200 | | | | | | | | | | | | | | | | 3,145,000 | | | | | | 2,961,332 | |
Petroleos Mexicanos | | | 3.50 | % | | | 07/18/2018 | | | | | | - | | | | | | - | | | | | | 3,560,000 | | | | | | 3,583,140 | | | | | | | | | | | | | | | | 3,560,000 | | | | | | 3,583,140 | |
Range Resources Corp. | | | 5.75 | % | | | 06/01/2021 | | | | | | 450,000 | | | | | | 439,875 | | | | | | - | | | | | | - | | | | | | | | | | | | | | | | 450,000 | | | | | | 439,875 | |
Ras Laffan Liquefied Natural Gas Co., Ltd. III | | | 5.83 | % | | | 09/30/2016 | | | | | | - | | | | | | - | | | | | | 332,940 | | | | | | 336,596 | | | | | | | | | | | | | | | | 332,940 | | | | | | 336,596 | |
Shell International Finance BV | | | 2.00 | % | | | 11/15/2018 | | | | | | 2,249,000 | | | | | | 2,287,246 | | | | | | - | | | | | | - | | | | | | | | | | | | | | | | 2,249,000 | | | | | | 2,287,246 | |
TransCanada PipeLines, Ltd. | | | 3.75 | % | | | 10/16/2023 | | | | | | 1,010,000 | | | | | | 1,081,285 | | | | | | - | | | | | | - | | | | | | | | | | | | | | | | 1,010,000 | | | | | | 1,081,285 | |
TransCanada PipeLines, Ltd. | | | 4.63 | % | | | 03/01/2034 | | | | | | 875,000 | | | | | | 919,986 | | | | | | - | | | | | | - | | | | | | | | | | | | | | | | 875,000 | | | | | | 919,986 | |
Western Gas Partners, LP | | | 5.38 | % | | | 06/01/2021 | | | | | | 1,956,000 | | | | | | 2,062,295 | | | | | | - | | | | | | - | | | | | | | | | | | | | | | | 1,956,000 | | | | | | 2,062,295 | |
Williams Cos., Inc. | | | 3.70 | % | | | 01/15/2023 | | | | | | 540,000 | | | | | | 477,900 | | | | | | - | | | | | | - | | | | | | | | | | | | | | | | 540,000 | | | | | | 477,900 | |
Williams Cos., Inc. | | | 7.88 | % | | | 09/01/2021 | | | | | | 796,000 | | | | | | 855,700 | | | | | | - | | | | | | - | | | | | | | | | | | | | | | | 796,000 | | | | | | 855,700 | |
Williams Partners, LP | | | 5.40 | % | | | 03/04/2044 | | | | | | 814,000 | | | | | | 724,165 | | | | | | - | | | | | | - | | | | | | | | | | | | | | | | 814,000 | | | | | | 724,165 | |
Pharmaceuticals | | | | | | | | | | | | | | | | | | | | | | | | | | | | | | | | | | | | | | | | | | | | | | | | | | | | | | |
Actavis Funding SCS | | | 4.55 | % | | | 03/15/2035 | | | | | | 3,695,000 | | | | | | 3,797,429 | | | | | | 2,290,000 | | | | | | 2,353,481 | | | | | | | | | | | | | | | | 5,985,000 | | | | | | 6,150,910 | |
Merck & Co., Inc. | | | 1.30 | % | | | 05/18/2018 | | | | | | - | | | | | | - | | | | | | 500,000 | | | | | | 504,747 | | | | | | | | | | | | | | | | 500,000 | | | | | | 504,747 | |
Mylan NV | | | 3.15 | % | | | 06/15/2021 | | | | | | 2,929,000 | | | | | | 2,971,025 | | | | | | 2,941,000 | | | | | | 2,983,197 | | | | | | | | | | | | | | | | 5,870,000 | | | | | | 5,954,222 | |
Perrigo Co. PLC | | | 2.30 | % | | | 11/08/2018 | | | | | | 3,365,000 | | | | | | 3,393,970 | | | | | | 710,000 | | | | | | 716,112 | | | | | | | | | | | | | | | | 4,075,000 | | | | | | 4,110,082 | |
Teva Pharmaceutical Finance Co., BV | | | 3.65 | % | | | 11/10/2021 | | | | | | 383,000 | | | | | | 405,875 | | | | | | - | | | | | | - | | | | | | | | | | | | | | | | 383,000 | | | | | | 405,875 | |
Real Estate Investment Trusts | | | | | | | | | | | | | | | | | | | | | | | | | | | | | | | | | | | | | | | | | | | | | | | | | | | | | | |
CBL & Associates, LP | | | 5.25 | % | | | 12/01/2023 | | | | | | - | | | | | | - | | | | | | 2,880,000 | | | | | | 2,732,374 | | | | | | | | | | | | | | | | 2,880,000 | | | | | | 2,732,374 | |
EPR Properties | | | 4.50 | % | | | 04/01/2025 | | | | | | 4,740,000 | | | | | | 4,700,701 | | | | | | - | | | | | | - | | | | | | | | | | | | | | | | 4,740,000 | | | | | | 4,700,701 | |
EPR Properties | | | 5.75 | % | | | 08/15/2022 | | | | | | - | | | | | | - | | | | | | 2,308,000 | | | | | | 2,506,481 | | | | | | | | | | | | | | | | 2,308,000 | | | | | | 2,506,481 | |
HCP, Inc. | | | 3.40 | % | | | 02/01/2025 | | | | | | 1,665,000 | | | | | | 1,609,933 | | | | | | 700,000 | | | | | | 676,849 | | | | | | | | | | | | | | | | 2,365,000 | | | | | | 2,286,782 | |
Highwoods Realty, LP | | | 5.85 | % | | | 03/15/2017 | | | | | | - | | | | | | - | | | | | | 1,555,000 | | | | | | 1,599,016 | | | | | | | | | | | | | | | | 1,555,000 | | | | | | 1,599,016 | |
Hospitality Properties Trust | | | 5.00 | % | | | 08/15/2022 | | | | | | - | | | | | | - | | | | | | 4,800,000 | | | | | | 5,158,502 | | | | | | | | | | | | | | | | 4,800,000 | | | | | | 5,158,502 | |
Kilroy Realty, LP | | | 4.25 | % | | | 08/15/2029 | | | | | | 6,355,000 | | | | | | 6,722,561 | | | | | | 2,565,000 | | | | | | 2,713,354 | | | | | | | | | | | | | | | | 8,920,000 | | | | | | 9,435,915 | |
National Retail Properties, Inc. | | | 3.90 | % | | | 06/15/2024 | | | | | | - | | | | | | - | | | | | | 3,565,000 | | | | | | 3,758,576 | | | | | | | | | | | | | | | | 3,565,000 | | | | | | 3,758,576 | |
Realty Income Corp. | | | 3.88 | % | | | 07/15/2024 | | | | | | 4,095,000 | | | | | | 4,300,933 | | | | | | - | | | | | | - | | | | | | | | | | | | | | | | 4,095,000 | | | | | | 4,300,933 | |
Realty Income Corp. | | | 6.75 | % | | | 08/15/2019 | | | | | | - | | | | | | - | | | | | | 4,015,000 | | | | | | 4,600,588 | | | | | | | | | | | | | | | | 4,015,000 | | | | | | 4,600,588 | |
Simon Property Group, LP | | | 3.38 | % | | | 10/01/2024 | | | | | | 6,665,000 | | | | | | 7,149,079 | | | | | | 5,070,000 | | | | | | 5,438,234 | | | | | | | | | | | | | | | | 11,735,000 | | | | | | 12,587,313 | |
Ventas Realty, LP / Ventas Capital Corp. | | | 2.70 | % | | | 04/01/2020 | | | | | | 535,000 | | | | | | 546,004 | | | | | | - | | | | | | - | | | | | | | | | | | | | | | | 535,000 | | | | | | 546,004 | |
Vereit Operating Partnership, LP | | | 2.00 | % | | | 02/06/2017 | | | | | | 3,705,000 | | | | | | 3,727,230 | | | | | | 5,427,000 | | | | | | 5,459,562 | | | | | | | | | | | | | | | | 9,132,000 | | | | | | 9,186,792 | |
Vereit Operating Partnership, LP | | | 3.00 | % | | | 02/06/2019 | | | | | | 1,655,000 | | | | | | 1,657,069 | | | | | | - | | | | | | - | | | | | | | | | | | | | | | | 1,655,000 | | | | | | 1,657,069 | |
Road & Rail | | | | | | | | | | | | | | | | | | | | | | | | | | | | | | | | | | | | | | | | | | | | | | | | | | | | | | |
Aviation Capital Group Corp. | | | 7.13 | % | | | 10/15/2020 | | | | | | 3,032,000 | | | | | | 3,441,320 | | | | | | 5,920,000 | | | | | | 6,719,200 | | | | | | | | | | | | | | | | 8,952,000 | | | | | | 10,160,520 | |
Burlington Northern Santa Fe LLC | | | 3.00 | % | | | 03/15/2023 | | | | | | 269,000 | | | | | | 282,894 | | | | | | - | | | | | | - | | | | | | | | | | | | | | | | 269,000 | | | | | | 282,894 | |
Burlington Northern Santa Fe LLC | | | 3.75 | % | | | 04/01/2024 | | | | | | 294,000 | | | | | | 324,848 | | | | | | - | | | | | | - | | | | | | | | | | | | | | | | 294,000 | | | | | | 324,848 | |
Hertz Corp. | | | 6.75 | % | | | 04/15/2019 | | | | | | - | | | | | | - | | | | | | 2,023,000 | | | | | | 2,065,291 | | | | | | | | | | | | | | | | 2,023,000 | | | | | | 2,065,291 | |
Semiconductors & Semiconductor Equipment | | | | | | | | | | | | | | | | | | | | | | | | | | | | | | | | | | | | | | | | | | | | | | | | | | | | | | |
Intel Corp. | | | 2.45 | % | | | 07/29/2020 | | | | | | - | | | | | | - | | | | | | 4,850,000 | | | | | | 5,043,627 | | | | | | | | | | | | | | | | 4,850,000 | | | | | | 5,043,627 | |
KLA-Tencor Corp. | | | 4.13 | % | | | 11/01/2021 | | | | | | 3,735,000 | | | | | | 3,976,434 | | | | | | 2,216,000 | | | | | | 2,359,244 | | | | | | | | | | | | | | | | 5,951,000 | | | | | | 6,335,678 | |
LAM Research Corp. | | | 3.90 | % | | | 06/15/2026 | | | | | | 885,000 | | | | | | 931,710 | | | | | | 885,000 | | | | | | 931,710 | | | | | | | | | | | | | | | | 1,770,000 | | | | | | 1,863,420 | |
Software | | | | | | | | | | | | | | | | | | | | | | | | | | | | | | | | | | | | | | | | | | | | | | | | | | | | | | |
Microsoft Corp. | | | 2.70 | % | | | 02/12/2025 | | | | | | 2,445,000 | | | | | | 2,527,673 | | | | | | 3,550,000 | | | | | | 3,670,036 | | | | | | | | | | | | | | | | 5,995,000 | | | | | | 6,197,709 | |
Technology Hardware, Storage & Peripherals | | | | | | | | | | | | | | | | | | | | | | | | | | | | | | | | | | | | | | | | | | | | | | | | | | | | | | |
Apple, Inc. | | | 2.40 | % | | | 05/03/2023 | | | | | | - | | | | | | - | | | | | | 5,130,000 | | | | | | 5,224,141 | | | | | | | | | | | | | | | | 5,130,000 | | | | | | 5,224,141 | |
Apple, Inc. | | | 2.85 | % | | | 02/23/2023 | | | | | | 5,198,000 | | | | | | 5,462,142 | | | | | | - | | | | | | - | | | | | | | | | | | | | | | | 5,198,000 | | | | | | 5,462,142 | |
Diamond 1 Finance Corp. / Diamond 2 Finance Corp. | | | 6.02 | % | | | 06/15/2026 | | | | | | 1,265,000 | | | | | | 1,318,746 | | | | | | 1,270,000 | | | | | | 1,323,958 | | | | | | | | | | | | | | | | 2,535,000 | | | | | | 2,642,704 | |
Hewlett Packard Enterprise Co. | | | 3.60 | % | | | 10/15/2020 | | | | | | 4,040,000 | | | | | | 4,216,875 | | | | | | 3,686,000 | | | | | | 3,847,377 | | | | | | | | | | | | | | | | 7,726,000 | | | | | | 8,064,252 | |
HP, Inc. | | | 3.75 | % | | | 12/01/2020 | | | | | | 270,000 | | | | | | 285,203 | | | | | | - | | | | | | - | | | | | | | | | | | | | | | | 270,000 | | | | | | 285,203 | |
Seagate HDD | | | 4.88 | % | | | 06/01/2027 | | | | | | - | | | | | | - | | | | | | 1,305,000 | | | | | | 945,172 | | | | | | | | | | | | | | | | 1,305,000 | | | | | | 945,172 | |
Tobacco | | | | | | | | | | | | | | | | | | | | | | | | | | | | | | | | | | | | | | | | | | | | | | | | | | | | | | |
Altria Group, Inc. | | | 4.00 | % | | | 01/31/2024 | | | | | | 905,000 | | | | | | 1,012,460 | | | | | | - | | �� | | | | - | | | | | | | | | | | | | | | | 905,000 | | | | | | 1,012,460 | |
Reynolds American, Inc. | | | 8.13 | % | | | 06/23/2019 | | | | | | - | | | | | | - | | | | | | 2,315,000 | | | | | | 2,744,669 | | | | | | | | | | | | | | | | 2,315,000 | | | | | | 2,744,669 | |
RJ Reynolds Tobacco Co. | | | 8.13 | % | | | 06/23/2019 | | | | | | - | | | | | | - | | | | | | 2,855,000 | | | | | | 3,384,894 | | | | | | | | | | | | | | | | 2,855,000 | | | | | | 3,384,894 | |
Trading Companies & Distributors | | | | | | | | | | | | | | | | | | | | | | | | | | | | | | | | | | | | | | | | | | | | | | | | | | | | | | |
International Lease Finance Corp. | | | 6.75 | % | | | 09/01/2016 | | | | | | 2,000,000 | | | | | | 2,010,000 | | | | | | 5,009,000 | | | | | | 5,034,045 | | | | | | | | | | | | | | | | 7,009,000 | | | | | | 7,044,045 | |
Wireless Telecommunication Services | | | | | | | | | | | | | | | | | | | | | | | | | | | | | | | | | | | | | | | | | | | | | | | | | | | | | | |
America Movil SAB de CV | | | 2.38 | % | | | 09/08/2016 | | | | | | 3,420,000 | | | | | | 3,430,034 | | | | | | - | | | | | | - | | | | | | | | | | | | | | | | 3,420,000 | | | | | | 3,430,034 | |
America Movil SAB de CV | | | 3.13 | % | | | 07/16/2022 | | | | | | - | | | | | | - | | | | | | 1,500,000 | | | | | | 1,539,029 | | | | | | | | | | | | | | | | 1,500,000 | | | | | | 1,539,029 | |
America Movil SAB de CV | | | 4.38 | % | | | 07/16/2042 | | | | | | - | | | | | | - | | | | | | 2,600,000 | | | | | | 2,627,565 | | | | | | | | | | | | | | | | 2,600,000 | | | | | | 2,627,565 | |
S-7
| | | | | | | | | | | | | | | | | | | | | | | | | | | | | | | | | | | | | | | | | | | | | | | | | | | | | | |
| | | | | | | | | | | TPP Master | | | | | TAF Destination | | | | | Adjustments | | | | | Combined Pro Forma Destination | |
| | | | | | | | | | | | | | | | | |
| | | Coupon Rate | | | Maturity Date | | | | | Principal | | | | | Value | | | | | Principal | | | | | Value | | | | | Principal | | | Value | | | | | Principal | | | | | Value | |
| | | | | | | | | | | | | | | | | | | | | | | | | | | | |
Crown Castle Towers LLC | | | 3.22 | % | | | 05/15/2042 | | | | | $ | - | | | | | $ | - | | | | | $ | 8,255,000 | | | | | $ | 8,580,041 | | | | | | | | | | | | | | | $ | 8,255,000 | | | | | $ | 8,580,041 | |
Crown Castle Towers LLC | | | 4.88 | % | | | 08/15/2040 | | | | | | 3,445,000 | | | | | | 3,755,509 | | | | | | 3,200,000 | | | | | | 3,488,426 | | | | | | | | | | | | | | | | 6,645,000 | | | | | | 7,243,935 | |
Crown Castle Towers LLC | | | 6.11 | % | | | 01/15/2040 | | | | | | 7,393,000 | | | | | | 8,223,676 | | | | | | - | | | | | | - | | | | | | | | | | | | | | | | 7,393,000 | | | | | | 8,223,676 | |
SBA Tower Trust | | | 2.24 | % | | | 04/15/2043 | | | | | | 1,420,000 | | | | | | 1,423,885 | | | | | | 920,000 | | | | | | 922,517 | | | | | | | | | | | | | | | | 2,340,000 | | | | | | 2,346,402 | |
Sprint Communications, Inc. | | | 9.00 | % | | | 11/15/2018 | | | | | | 3,570,000 | | | | | | 3,802,050 | | | | | | 5,174,000 | | | | | | 5,510,305 | | | | | | | | | | | | | | | | 8,744,000 | | | | | | 9,312,355 | |
Sprint Corp. | | | 7.88 | % | | | 09/15/2023 | | | | | | 1,290,000 | | | | | | 1,054,575 | | | | | | - | | | | | | - | | | | | | | | | | | | | | | | 1,290,000 | | | | | | 1,054,575 | |
T-Mobile USA, Inc. | | | 6.46 | % | | | 04/28/2019 | | | | | | 145,000 | | | | | | 147,356 | | | | | | - | | | | | | - | | | | | | | | | | | | | | | | 145,000 | | | | | | 147,356 | |
T-Mobile USA, Inc. | | | 6.63 | % | | | 04/28/2021 | | | | | | 475,000 | | | | | | 496,375 | | | | | | - | | | | | | - | | | | | | | | | | | | | | | | 475,000 | | | | | | 496,375 | |
T-Mobile USA, Inc. | | | 6.73 | % | | | 04/28/2022 | | | | | | 460,000 | | | | | | 483,713 | | | | | | - | | | | | | - | | | | | | | | | | | | | | | | 460,000 | | | | | | 483,713 | |
T-Mobile USA, Inc. | | | 6.84 | % | | | 04/28/2023 | | | | | | 145,000 | | | | | | 153,156 | | | | | | - | | | | | | - | | | | | | | | | | | | | | | | 145,000 | | | | | | 153,156 | |
| | | | | | | | | | | | | | | | | | | | | | | | | | | | |
Total Corporate Debt Securities | | | | | | | | | | | | | | | | | | | 476,942,516 | | | | | | | | | | | | 489,252,599 | | | | | | | | | | | | | | | | | | | | | | 966,195,115 | |
| | | | | | | | | | | | | | | | | | | | | | | | | | | | |
| | | | | | | | | | | | | | | | | | | Total Cost ($468,669,633) | | | | | | | | | | | | Total Cost ($479,201,801) | | | | | | | | | | | | | | | | | | | | | | Total Cost ($947,871,434) | |
Foreign Government Obligations - 1.1 % | | | | | | | | | | | | | | | | | | | | | | | | | | | | | | | | | | | | | | | | | | | | | | | | | | | | | | |
Brazil | | | | | | | | | | | | | | | | | | | | | | | | | | | | | | | | | | | | | | | | | | | | | | | | | | | | | | |
Brazil Government International Bond | | | 4.25 | % | | | 01/07/2025 | | | | | | 1,440,000 | | | | | | 1,414,800 | | | | | | - | | | | | | - | | | | | | | | | | | | | | | | 1,440,000 | | | | | | 1,414,800 | |
Colombia | | | | | | | | | | | | | | | | | | | | | | | | | | | | | | | | | | | | | | | | | | | | | | | | | | | | | | |
Colombia Government International Bond | | | 4.00 | % | | | 02/26/2024 | | | | | | 810,000 | | | | | | 846,045 | | | | | | - | | | | | | - | | | | | | | | | | | | | | | | 810,000 | | | | | | 846,045 | |
Colombia Government International Bond | | | 4.50 | % | | | 01/28/2026 | | | | | | - | | | | | | - | | | | | | 1,850,000 | | | | | | 1,970,250 | | | | | | | | | | | | | | | | 1,850,000 | | | | | | 1,970,250 | |
Indonesia | | | | | | | | | | | | | | | | | | | | | | | | | | | | | | | | | | | | | | | | | | | | | | | | | | | | | | |
Indonesia Government International Bond | | | 4.75 | % | | | 01/08/2026 | | | | | | - | | | | | | - | | | | | | 1,260,000 | | | | | | 1,371,977 | | | | | | | | | | | | | | | | 1,260,000 | | | | | | 1,371,977 | |
Indonesia Government International Bond | | | 5.38 | % | | | 10/17/2023 | | | | | | 2,500,000 | | | | | | 2,813,257 | | | | | | - | | | | | | - | | | | | | | | | | | | | | | | 2,500,000 | | | | | | 2,813,257 | |
Mexico | | | | | | | | | | | | | | | | | | | | | | | | | | | | | | | | | | | | | | | | | | | | | | | | | | | | | | |
Mexico Government International Bond | | | 4.00 | % | | | 10/02/2023 | | | | | | 3,618,000 | | | | | | 3,894,958 | | | | | | - | | | | | | - | | | | | | | | | | | | | | | | 3,618,000 | | | | | | 3,894,958 | |
Peru | | | | | | | | | | | | | | | | | | | | | | | | | | | | | | | | | | | | | | | | | | | | | | | | | | | | | | |
Peru Government International Bond | | | 7.35 | % | | | 07/21/2025 | | | | | | 1,010,000 | | | | | | 1,373,600 | | | | | | - | | | | | | - | | | | | | | | | | | | | | | | 1,010,000 | | | | | | 1,373,600 | |
Republic of Korea | | | | | | | | | | | | | | | | | | | | | | | | | | | | | | | | | | | | | | | | | | | | | | | | | | | | | | |
Export-Import Bank of Korea | | | 4.00 | % | | | 01/11/2017 | | | | | | 3,750,000 | | | | | | 3,805,875 | | | | | | 1,700,000 | | | | | | 1,725,330 | | | | | | | | | | | | | | | | 5,450,000 | | | | | | 5,531,205 | |
Korea Development Bank | | | 3.00 | % | | | 03/17/2019 | | | | | | - | | | | | | - | | | | | | 3,400,000 | | | | | | 3,533,974 | | | | | | | | | | | | | | | | 3,400,000 | | | | | | 3,533,974 | |
Korea Development Bank | | | 3.50 | % | | | 08/22/2017 | | | | | | 1,610,000 | | | | | | 1,651,242 | | | | | | 900,000 | | | | | | 923,054 | | | | | | | | | | | | | | | | 2,510,000 | | | | | | 2,574,296 | |
Turkey | | | | | | | | | | | | | | | | | | | | | | | | | | | | | | | | | | | | | | | | | | | | | | | | | | | | | | |
Turkey Government International Bond | | | 5.75 | % | | | 03/22/2024 | | | | | | 2,180,000 | | | | | | 2,430,940 | | | | | | - | | | | | | - | | | | | | | | | | | | | | | | 2,180,000 | | | | | | 2,430,940 | |
| | | | | | | | | | | | | | | | | | | | | | | | | | | | |
Total Foreign Government Obligations | | | | | | | | | | | | | | | | | | | 18,230,717 | | | | | | | | | | | | 9,524,585 | | | | | | | | | | | | | | | | | | | | | | 27,755,302 | |
| | | | | | | | | | | | | | | | | | | | | | | | | | | | |
| | | | | | | | | | | | | | | | | | | Total Cost ($17,331,428) | | | | | | | | | | | | Total Cost ($9,361,965) | | | | | | | | | | | | | | | | | | | | | | Total Cost ($26,693,393) | |
Mortgage-Backed Securities - 12.5 % | | | | | | | | | | | | | | | | | | | | | | | | | | | | | | | | | | | | | | | | | | | | | | | | | | | | | | |
Adjustable Rate Mortgage Trust | | | 1.29 | % | | | 02/25/2035 | | | | | | 4,403 | | | | | | 4,390 | | | | | | - | | | | | | - | | | | | | | | | | | | | | | | 4,403 | | | | | | 4,390 | |
Alternative Loan Trust | | | 0.76 | % | | | 08/25/2035 | | | | | | 1,149,757 | | | | | | 791,893 | | | | | | - | | | | | | - | | | | | | | | | | | | | | | | 1,149,757 | | | | | | 791,893 | |
Alternative Loan Trust | | | 5.50 | % | | | 11/25/2035 | | | | | | 1,991,811 | | | | | | 1,802,401 | | | | | | - | | | | | | - | | | | | | | | | | | | | | | | 1,991,811 | | | | | | 1,802,401 | |
Alternative Loan Trust | | | 0.77 | % | | | 11/20/2035 | | | | | | 997,877 | | | | | | 808,730 | | | | | | - | | | | | | - | | | | | | | | | | | | | | | | 997,877 | | | | | | 808,730 | |
Alternative Loan Trust | | | 6.50 | % | | | 09/25/2037 | | | | | | 7,526,615 | | | | | | 5,418,548 | | | | | | - | | | | | | - | | | | | | | | | | | | | | | | 7,526,615 | | | | | | 5,418,548 | |
Alternative Loan Trust | | | 5.50 | % | | | 04/25/2037 | | | | | | 1,644,321 | | | | | | 1,259,803 | | | | | | - | | | | | | - | | | | | | | | | | | | | | | | 1,644,321 | | | | | | 1,259,803 | |
Aventura Mall Trust | | | 3.87 | % | | | 12/05/2032 | | | | | | - | | | | | | - | | | | | | 4,500,000 | | | | | | 4,865,025 | | | | | | | | | | | | | | | | 4,500,000 | | | | | | 4,865,025 | |
Banc of America Commercial Mortgage Trust | | | 5.72 | % | | | 06/10/2049 | | | | | | 2,358,105 | | | | | | 2,417,960 | | | | | | 2,373,931 | | | | | | 2,434,188 | | | | | | | | | | | | | | | | 4,732,036 | | | | | | 4,852,148 | |
Banc of America Funding Trust | | | 2.89 | % | | | 03/20/2035 | | | | | | 162,134 | | | | | | 159,670 | | | | | | - | | | | | | - | | | | | | | | | | | | | | | | 162,134 | | | | | | 159,670 | |
Banc of America Re-REMIC Trust | | | 5.72 | % | | | 06/15/2049 | | | | | | - | | | | | | - | | | | | | 2,295,000 | | | | | | 2,327,165 | | | | | | | | | | | | | | | | 2,295,000 | | | | | | 2,327,165 | |
BBCMS Trust | | | 4.04 | % | | | 09/05/2032 | | | | | | - | | | | | | - | | | | | | 2,530,000 | | | | | | 2,689,751 | | | | | | | | | | | | | | | | 2,530,000 | | | | | | 2,689,751 | |
BB-UBS Trust | | | 2.89 | % | | | 06/05/2030 | | | | | | 3,410,000 | | | | | | 3,493,232 | | | | | | 1,234,000 | | | | | | 1,264,120 | | | | | | | | | | | | | | | | 4,644,000 | | | | | | 4,757,352 | |
BB-UBS Trust | | | 3.58 | % | | | 06/05/2030 | | | | | | 4,215,000 | | | | | | 4,153,107 | | | | | | 2,980,000 | | | | | | 2,936,242 | | | | | | | | | | | | | | | | 7,195,000 | | | | | | 7,089,349 | |
BCAP LLC Trust | | | 2.38 | % | | | 08/26/2035 | | | | | | - | | | | | | - | | | | | | 1,859,227 | | | | | | 1,865,915 | | | | | | | | | | | | | | | | 1,859,227 | | | | | | 1,865,915 | |
BCAP LLC Trust | | | 2.69 | % | | | 10/26/2035 | | | | | | - | | | | | | - | | | | | | 94,053 | | | | | | 93,351 | | | | | | | | | | | | | | | | 94,053 | | | | | | 93,351 | |
BCAP LLC Trust | | | 2.83 | % | | | 08/26/2035 | | | | | | - | | | | | | - | | | | | | 1,158,258 | | | | | | 1,145,545 | | | | | | | | | | | | | | | | 1,158,258 | | | | | | 1,145,545 | |
BCAP LLC Trust | | | 2.88 | % | | | 10/26/2035 | | | | | | - | | | | | | - | | | | | | 133,593 | | | | | | 133,152 | | | | | | | | | | | | | | | | 133,593 | | | | | | 133,152 | |
BCAP LLC Trust | | | 2.91 | % | | | 06/26/2035 | | | | | | - | | | | | | - | | | | | | 705,607 | | | | | | 708,964 | | | | | | | | | | | | | | | | 705,607 | | | | | | 708,964 | |
BCAP LLC Trust | | | 3.05 | % | | | 04/26/2036 | | | | | | - | | | | | | - | | | | | | 1,559,726 | | | | | | 1,576,292 | | | | | | | | | | | | | | | | 1,559,726 | | | | | | 1,576,292 | |
Bear Stearns Alt-A Trust | | | 3.22 | % | | | 11/25/2034 | | | | | | 82,388 | | | | | | 73,563 | | | | | | - | | | | | | - | | | | | | | | | | | | | | | | 82,388 | | | | | | 73,563 | |
Bear Stearns Commercial Mortgage Securities Trust | | | 5.19 | % | | | 12/11/2038 | | | | | | 2,485,860 | | | | | | 2,501,271 | | | | | | 1,081,074 | | | | | | 1,087,776 | | | | | | | | | | | | | | | | 3,566,934 | | | | | | 3,589,047 | |
Bear Stearns Commercial Mortgage Securities Trust | | | 5.32 | % | | | 02/11/2044 | | | | | | 1,706,805 | | | | | | 1,737,831 | | | | | | 858,554 | | | | | | 874,160 | | | | | | | | | | | | | | | | 2,565,359 | | | | | | 2,611,991 | |
Bear Stearns Commercial Mortgage Securities Trust | | | 5.65 | % | | | 06/11/2050 | | | | | | 1,612,079 | | | | | | 1,671,809 | | | | | | 1,060,252 | | | | | | 1,099,536 | | | | | | | | | | | | | | | | 2,672,331 | | | | | | 2,771,345 | |
Bear Stearns Mortgage Funding Trust | | | 0.66 | % | | | 12/25/2046 | | | | | | 113,238 | | | | | | 65,781 | | | | | | - | | | | | | - | | | | | | | | | | | | | | | | 113,238 | | | | | | 65,781 | |
CHL Mortgage Pass-Through Trust | | | 2.86 | % | | | 02/25/2034 | | | | | | 100,790 | | | | | | 98,699 | | | | | | - | | | | | | - | | | | | | | | | | | | | | | | 100,790 | | | | | | 98,699 | |
CHL Mortgage Pass-Through Trust | | | 0.74 | % | | | 04/25/2035 | | | | | | 207,327 | | | | | | 176,453 | | | | | | - | | | | | | - | | | | | | | | | | | | | | | | 207,327 | | | | | | 176,453 | |
Citigroup Commercial Mortgage Trust | | | 3.75 | % | | | 03/10/2047 | | | | | | 1,140,000 | | | | | | 1,250,181 | | | | | | 485,000 | | | | | | 531,875 | | | | | | | | | | | | | | | | 1,625,000 | | | | | | 1,782,056 | |
Citigroup Commercial Mortgage Trust | | | 4.02 | % | | | 03/10/2047 | | | | | | 1,735,000 | | | | | | 1,933,415 | | | | | | 330,000 | | | | | | 367,739 | | | | | | | | | | | | | | | | 2,065,000 | | | | | | 2,301,154 | |
Citigroup Mortgage Loan Trust | | | 3.50 | % | | | 06/25/2058 | | | | | | 5,401,960 | | | | | | 5,556,335 | | | | | | 2,969,135 | | | | | | 3,053,986 | | | | | | | | | | | | | | | | 8,371,095 | | | | | | 8,610,321 | |
Citigroup Mortgage Loan Trust | | | 3.75 | % | | | 09/25/2042 | | | | | | - | | | | | | - | | | | | | 3,380,458 | | | | | | 3,468,583 | | | | | | | | | | | | | | | | 3,380,458 | | | | | | 3,468,583 | |
Citigroup Mortgage Loan Trust | | | 4.00 | % | | | 01/25/2035 | | | | | | - | | | | | | - | | | | | | 1,781,439 | | | | | | 1,827,280 | | | | | | | | | | | | | | | | 1,781,439 | | | | | | 1,827,280 | |
COMM Mortgage Trust | | | 1.71 | % | | | 02/10/2028 | | | | | | - | | | | | | - | | | | | | 273,898 | | | | | | 273,672 | | | | | | | | | | | | | | | | 273,898 | | | | | | 273,672 | |
COMM Mortgage Trust | | | 5.54 | % | | | 12/11/2049 | | | | | | 2,350,000 | | | | | | 2,382,687 | | | | | | - | | | | | | - | | | | | | | | | | | | | | | | 2,350,000 | | | | | | 2,382,687 | |
COMM Mortgage Trust | | | 4.72 | % | | | 10/10/2046 | | | | | | 565,000 | | | | | | 643,868 | | | | | | - | | | | | | - | | | | | | | | | | | | | | | | 565,000 | | | | | | 643,868 | |
COMM Mortgage Trust | | | 3.37 | % | | | 02/10/2028 | | | | | | 1,380,000 | | | | | | 1,448,792 | | | | | | 2,625,000 | | | | | | 2,755,854 | | | | | | | | | | | | | | | | 4,005,000 | | | | | | 4,204,646 | |
COMM Mortgage Trust | | | 3.42 | % | | | 03/10/2031 | | | | | | - | | | | | | - | | | | | | 2,760,000 | | | | | | 2,951,382 | | | | | | | | | | | | | | | | 2,760,000 | | | | | | 2,951,382 | |
COMM Mortgage Trust | | | 3.96 | % | | | 03/10/2047 | | | | | | 1,240,000 | | | | | | 1,366,029 | | | | | | 1,500,000 | | | | | | 1,652,454 | | | | | | | | | | | | | | | | 2,740,000 | | | | | | 3,018,483 | |
Commercial Mortgage Pass-Through Certificates | | | 3.40 | % | | | 10/05/2030 | | | | | | 1,560,000 | | | | | | 1,637,413 | | | | | | 5,475,000 | | | | | | 5,746,689 | | | | | | | | | | | | | | | | 7,035,000 | | | | | | 7,384,102 | |
Commercial Mortgage Trust | | | 5.87 | % | | | 12/10/2049 | | | | | | 1,175,000 | | | | | | 1,215,482 | | | | | | - | | | | | | - | | | | | | | | | | | | | | | | 1,175,000 | | | | | | 1,215,482 | |
Core Industrial Trust | | | 3.25 | % | | | 02/10/2034 | | | | | | 4,655,000 | | | | | | 4,836,576 | | | | | | 4,625,000 | | | | | | 4,805,406 | | | | | | | | | | | | | | | | 9,280,000 | | | | | | 9,641,982 | |
Credit Suisse Commercial Mortgage Trust | | | 5.45 | % | | | 01/15/2049 | | | | | | 5,729 | | | | | | 5,718 | | | | | | - | | | | | | - | | | | | | | | | | | | | | | | 5,729 | | | | | | 5,718 | |
Credit Suisse Mortgage Capital Certificates | | | 2.80 | % | | | 09/27/2036 | | | | | | - | | | | | | - | | | | | | 569,594 | | | | | | 567,139 | | | | | | | | | | | | | | | | 569,594 | | | | | | 567,139 | |
Credit Suisse Mortgage Capital Certificates | | | 4.04 | % | | | 08/26/2036 | | | | | | 4,327,261 | | | | | | 4,233,160 | | | | | | - | | | | | | - | | | | | | | | | | | | | | | | 4,327,261 | | | | | | 4,233,160 | |
CSMC Trust | | | 0.60 | % | | | 12/27/2036 | | | | | | - | | | | | | - | | | | | | 2,231,464 | | | | | | 2,086,878 | | | | | | | | | | | | | | | | 2,231,464 | | | | | | 2,086,878 | |
CSMC Trust | | | 5.00 | % | | | 02/27/2047 | | | | | | 1,387,718 | | | | | | 1,376,943 | | | | | | - | | | | | | - | | | | | | | | | | | | | | | | 1,387,718 | | | | | | 1,376,943 | |
CSMC Trust | | | 0.78 | % | | | 12/27/2035 | | | | | | 5,933,662 | | | | | | 5,409,046 | | | | | | - | | | | | | - | | | | | | | | | | | | | | | | 5,933,662 | | | | | | 5,409,046 | |
CSMC Trust | | | 5.00 | % | | | 06/26/2037 | | | | | | - | | | | | | - | | | | | | 420,692 | | | | | | 427,033 | | | | | | | | | | | | | | | | 420,692 | | | | | | 427,033 | |
DBRR Trust | | | 5.89 | % | | | 06/17/2049 | | | | | | 1,320,000 | | | | | | 1,342,088 | | | | | | - | | | | | | - | | | | | | | | | | | | | | | | 1,320,000 | | | | | | 1,342,088 | |
Extended Stay America Trust | | | 2.96 | % | | | 12/05/2031 | | | | | | 1,289,157 | | | | | | 1,293,302 | | | | | | - | | | | | | - | | | | | | | | | | | | | | | | 1,289,157 | | | | | | 1,293,302 | |
GMACM Mortgage Loan Trust | | | 3.42 | % | | | 12/19/2033 | | | | | | 27,332 | | | | | | 25,868 | | | | | | - | | | | | | - | | | | | | | | | | | | | | | | 27,332 | | | | | | 25,868 | |
GMACM Mortgage Loan Trust | | | 3.27 | % | | | 03/18/2035 | | | | | | 54,725 | | | | | | 53,226 | | | | | | - | | | | | | - | | | | | | | | | | | | | | | | 54,725 | | | | | | 53,226 | |
GS Mortgage Securities Corp. II | | | 3.55 | % | | | 12/10/2027 | | | | | | 3,320,000 | | | | | | 3,177,591 | | | | | | - | | | | | | - | | | | | | | | | | | | | | | | 3,320,000 | | | | | | 3,177,591 | |
GS Mortgage Securities Corp. Trust | | | 3.63 | % | | | 06/05/2031 | | | | | | 410,000 | | | | | | 420,690 | | | | | | 2,825,000 | | | | | | 2,898,658 | | | | | | | | | | | | | | | | 3,235,000 | | | | | | 3,319,348 | |
GS Mortgage Securities Trust | | | 3.56 | % | | | 04/10/2031 | | | | | | - | | | | | | - | | | | | | 4,055,517 | | | | | | 4,214,347 | | | | | | | | | | | | | | | | 4,055,517 | | | | | | 4,214,347 | |
HarborView Mortgage Loan Trust | | | 1.01 | % | | | 06/19/2034 | | | | | | - | | | | | | - | | | | | | 580,750 | | | | | | 534,817 | | | | | | | | | | | | | | | | 580,750 | | | | | | 534,817 | |
Hilton USA Trust | | | 2.66 | % | | | 11/05/2030 | | | | | | - | | | | | | - | | | | | | 2,885,000 | | | | | | 2,897,318 | | | | | | | | | | | | | | | | 2,885,000 | | | | | | 2,897,318 | |
Hilton USA Trust | | | 4.41 | % | | | 11/05/2030 | | | | | | 970,000 | | | | | | 975,757 | | | | | | - | | | | | | - | | | | | | | | | | | | | | | | 970,000 | | | | | | 975,757 | |
Hilton USA Trust, Interest Only STRIPS | | | 0.00 | % | | | 11/05/2030 | | | | | | 22,320,000 | | | | | | 223 | | | | | | - | | | | | | - | | | | | | | | | | | | | | | | 22,320,000 | | | | | | 223 | |
Houston Galleria Mall Trust | | | 3.09 | % | | | 03/05/2037 | | | | | | - | | | | | | - | | | | | | 3,600,000 | | | | | | 3,739,571 | | | | | | | | | | | | | | | | 3,600,000 | | | | | | 3,739,571 | |
Impac CMB Trust | | | 1.13 | % | | | 10/25/2033 | | | | | | - | | | | | | - | | | | | | 382,698 | | | | | | 370,659 | | | | | | | | | | | | | | | | 382,698 | | | | | | 370,659 | |
Impac CMB Trust | | | 1.25 | % | | | 10/25/2034 | | | | | | 38,252 | | | | | | 35,068 | | | | | | - | | | | | | - | | | | | | | | | | | | | | | | 38,252 | | | | | | 35,068 | |
Independent National Mortgage Corp. Index Mortgage Loan Trust | | | 4.07 | % | | | 08/25/2037 | | | | | | 663,279 | | | | | | 501,773 | | | | | | - | | | | | | - | | | | | | | | | | | | | | | | 663,279 | | | | | | 501,773 | |
Jefferies Re-REMIC Trust | | | 3.25 | % | | | 05/26/2037 | | | | | | - | | | | | | - | | | | | | 1,053,770 | | | | | | 1,053,860 | | | | | | | | | | | | | | | | 1,053,770 | | | | | | 1,053,860 | |
JPMorgan Chase Commercial Mortgage Securities Trust | | | 3.77 | % | | | 06/10/2027 | | | | | | - | | | | | | - | | | | | | 2,800,000 | | | | | | 2,888,110 | | | | | | | | | | | | | | | | 2,800,000 | | | | | | 2,888,110 | |
JPMorgan Chase Commercial Mortgage Securities Trust | | | 5.43 | % | | | 06/12/2047 | | | | | | 3,778,246 | | | | | | 3,822,802 | | | | | | - | | | | | | - | | | | | | | | | | | | | | | | 3,778,246 | | | | | | 3,822,802 | |
JPMorgan Chase Commercial Mortgage Securities Trust | | | 5.93 | % | | | 06/15/2049 | | | | | | 228,517 | | | | | | 230,187 | | | | | | - | | | | | | - | | | | | | | | | | | | | | | | 228,517 | | | | | | 230,187 | |
JPMorgan Chase Commercial Mortgage Securities Trust | | | 5.85 | % | | | 02/15/2051 | | | | | | 3,377,548 | | | | | | 3,496,807 | | | | | | 288,251 | | | | | | 298,429 | | | | | | | | | | | | | | | | 3,665,799 | | | | | | 3,795,236 | |
JPMorgan Chase Commercial Mortgage Securities Trust | | | 5.44 | % | | | 01/15/2049 | | | | | | 2,714,554 | | | | | | 2,762,555 | | | | | | 1,157,257 | | | | | | 1,177,721 | | | | | | | | | | | | | | | | 3,871,811 | | | | | | 3,940,276 | |
JPMorgan Chase Commercial Mortgage Securities Trust | | | 3.91 | % | | | 05/05/2030 | | | | | | 190,959 | | | | | | 205,154 | | | | | | 3,172,860 | | | | | | 3,408,707 | | | | | | | | | | | | | | | | 3,363,819 | | | | | | 3,613,861 | |
JPMorgan Mortgage Trust | | | 2.45 | % | | | 02/25/2034 | | | | | | 67,422 | | | | | | 66,692 | | | | | | - | | | | | | - | | | | | | | | | | | | | | | | 67,422 | | | | | | 66,692 | |
JPMorgan Mortgage Trust | | | 2.71 | % | | | 11/25/2033 | | | | | | 75,579 | | | | | | 75,884 | | | | | | - | | | | | | - | | | | | | | | | | | | | | | | 75,579 | | | | | | 75,884 | |
JPMorgan Mortgage Trust | | | 6.50 | % | | | 08/25/2036 | | | | | | 396,861 | | | | | | 324,874 | | | | | | - | | | | | | - | | | | | | | | | | | | | | | | 396,861 | | | | | | 324,874 | |
JPMorgan Re-REMIC Trust | | | 2.92 | % | | | 05/26/2037 | | | | | | 5,336,809 | | | | | | 5,331,099 | | | | | | - | | | | | | - | | | | | | | | | | | | | | | | 5,336,809 | | | | | | 5,331,099 | |
LB Commercial Mortgage Trust | | | 6.07 | % | | | 07/15/2044 | | | | | | - | | | | | | - | | | | | | 819,989 | | | | | | 849,502 | | | | | | | | | | | | | | | | 819,989 | | | | | | 849,502 | |
LB-UBS Commercial Mortgage Trust | | | 6.36 | % | | | 09/15/2045 | | | | | | 900,000 | | | | | | 950,554 | | | | | | - | | | | | | - | | | | | | | | | | | | | | | | 900,000 | | | | | | 950,554 | |
MASTR Adjustable Rate Mortgages Trust | | | 2.90 | % | | | 11/25/2035 | | | | | | 573,233 | | | | | | 431,722 | | | | | | - | | | | | | - | | | | | | | | | | | | | | | | 573,233 | | | | | | 431,722 | |
Merrill Lynch Mortgage Investors Trust | | | 1.09 | % | | | 10/25/2028 | | | | | | 37,023 | | | | | | 36,082 | | | | | | - | | | | | | - | | | | | | | | | | | | | | | | 37,023 | | | | | | 36,082 | |
Merrill Lynch Mortgage Investors Trust | | | 2.77 | % | | | 02/25/2034 | | | | | | 218,384 | | | | | | 218,973 | | | | | | - | | | | | | - | | | | | | | | | | | | | | | | 218,384 | | | | | | 218,973 | |
Merrill Lynch Mortgage Investors Trust | | | 0.72 | % | | | 04/25/2035 | | | | | | 42,605 | | | | | | 40,566 | | | | | | - | | | | | | - | | | | | | | | | | | | | | | | 42,605 | | | | | | 40,566 | |
Merrill Lynch Mortgage Investors Trust | | | 2.88 | % | | | 07/25/2035 | | | | | | 233,455 | | | | | | 206,057 | | | | | | - | | | | | | - | | | | | | | | | | | | | | | | 233,455 | | | | | | 206,057 | |
Merrill Lynch Mortgage Trust | | | 6.02 | % | | | 06/12/2050 | | | | | | 1,013,943 | | | | | | 1,039,356 | | | | | | - | | | | | | - | | | | | | | | | | | | | | | | 1,013,943 | | | | | | 1,039,356 | |
Morgan Stanley Bank of America Merrill Lynch Trust | | | 4.56 | % | | | 08/15/2046 | | | | | | - | | | | | | - | | | | | | 1,035,000 | | | | | | 1,132,370 | | | | | | | | | | | | | | | | 1,035,000 | | | | | | 1,132,370 | |
Morgan Stanley Capital I Trust | | | 5.90 | % | | | 04/12/2049 | | | | | | 2,855,000 | | | | | | 2,874,794 | | | | | | - | | | | | | - | | | | | | | | | | | | | | | | 2,855,000 | | | | | | 2,874,794 | |
S-8
| | | | | | | | | | | | | | | | | | | | | | | | | | | | | | | | | | | | | | | | | | | | | | | | | | | | | | |
| | | | | | | | | | | TPP Master | | | | | TAF Destination | | | | | Adjustments | | | | | Combined Pro Forma Destination | |
| | | | | | | | | | | | | | | | | |
| | | Coupon Rate | | | Maturity Date | | | | | Principal | | | | | Value | | | | | Principal | | | | | Value | | | | | Principal | | | Value | | | | | Principal | | | | | Value | |
| | | | | | | | | | | | | | | | | | | | | | | | | | | | |
Morgan Stanley Capital I Trust | | | 5.31 | % | | | 03/15/2044 | | | | | $ | 3,674,818 | | | | | $ | 3,730,535 | | | | | $ | 1,085,515 | | | | | $ | 1,101,974 | | | | | | | | | | | | | | | $ | 4,760,333 | | | | | $ | 4,832,509 | |
Morgan Stanley Capital I Trust | | | 5.41 | % | | | 03/15/2044 | | | | | | 1,090,000 | | | | | | 1,110,912 | | | | | | - | | | | | | - | | | | | | | | | | | | | | | | 1,090,000 | | | | | | 1,110,912 | |
Morgan Stanley Capital I Trust | | | 5.67 | % | | | 04/15/2049 | | | | | | 1,030,988 | | | | | | 1,058,048 | | | | | | 2,580,272 | | | | | | 2,647,996 | | | | | | | | | | | | | | | | 3,611,260 | | | | | | 3,706,044 | |
Morgan Stanley Capital I Trust | | | 5.82 | % | | | 06/11/2042 | | | | | | - | | | | | | - | | | | | | 1,527,164 | | | | | | 1,578,515 | | | | | | | | | | | | | | | | 1,527,164 | | | | | | 1,578,515 | |
Morgan Stanley Capital I Trust | | | 6.10 | % | | | 06/11/2049 | | | | | | 1,225,000 | | | | | | 1,262,969 | | | | | | - | | | | | | - | | | | | | | | | | | | | | | | 1,225,000 | | | | | | 1,262,969 | |
Morgan Stanley Re-REMIC Trust | | | 1.17 | % | | | 09/26/2036 | | | | | | - | | | | | | - | | | | | | 546,299 | | | | | | 528,235 | | | | | | | | | | | | | | | | 546,299 | | | | | | 528,235 | |
Morgan Stanley Re-REMIC Trust | | | 5.99 | % | | | 08/15/2045 | | | | | | 540,000 | | | | | | 550,574 | | | | | | - | | | | | | - | | | | | | | | | | | | | | | | 540,000 | | | | | | 550,574 | |
Morgan Stanley Re-REMIC Trust | | | 2.00 | % | | | 07/27/2049 | | | | | | 478,515 | | | | | | 474,836 | | | | | | - | | | | | | - | | | | | | | | | | | | | | | | 478,515 | | | | | | 474,836 | |
Morgan Stanley Re-REMIC Trust | | | 2.20 | % | | | 11/26/2036 | | | | | | - | | | | | | - | | | | | | 452,054 | | | | | | 449,638 | | | | | | | | | | | | | | | | 452,054 | | | | | | 449,638 | |
Morgan Stanley Re-REMIC Trust | | | 2.89 | % | | | 11/21/2035 | | | | | | - | | | | | | - | | | | | | 1,772,246 | | | | | | 1,784,675 | | | | | | | | | | | | | | | | 1,772,246 | | | | | | 1,784,675 | |
Morgan Stanley Re-REMIC Trust | | | 3.00 | % | | | 07/26/2048 | | | | | | 7,253,938 | | | | | | 7,397,115 | | | | | | 1,527,145 | | | | | | 1,557,287 | | | | | | | | | | | | | | | | 8,781,083 | | | | | | 8,954,402 | |
Morgan Stanley Re-REMIC Trust | | | 5.50 | % | | | 10/26/2035 | | | | | | - | | | | | | - | | | | | | 215,592 | | | | | | 225,324 | | | | | | | | | | | | | | | | 215,592 | | | | | | 225,324 | |
Morgan Stanley Re-REMIC Trust | | | 6.25 | % | | | 08/15/2045 | | | | | | - | | | | | | - | | | | | | 3,202,489 | | | | | | 3,266,935 | | | | | | | | | | | | | | | | 3,202,489 | | | | | | 3,266,935 | |
Motel 6 Trust | | | 3.30 | % | | | 02/05/2030 | | | | | | - | | | | | | - | | | | | | 4,105,000 | | | | | | 4,139,390 | | | | | | | | | | | | | | | | 4,105,000 | | | | | | 4,139,390 | |
Motel 6 Trust | | | 3.64 | % | | | 02/05/2030 | | | | | | 11,625,000 | | | | | | 11,563,135 | | | | | | 5,795,000 | | | | | | 5,764,161 | | | | | | | | | | | | | | | | 17,420,000 | | | | | | 17,327,296 | |
NACC Reperforming Loan REMIC Trust | | | 6.50 | % | | | 10/25/2034 | | | | | | 92,096 | | | | | | 92,888 | | | | | | - | | | | | | - | | | | | | | | | | | | | | | | 92,096 | | | | | | 92,888 | |
Nationstar Mortgage Loan Trust | | | 3.75 | % | | | 12/25/2052 | | | | | | 3,887,390 | | | | | | 4,038,022 | | | | | | 872,475 | | | | | | 906,283 | | | | | | | | | | | | | | | | 4,759,865 | | | | | | 4,944,305 | |
New Residential Mortgage Loan Trust | | | 3.75 | % | | | 01/25/2054 | | | | | | 1,697,612 | | | | | | 1,759,993 | | | | | | - | | | | | | - | | | | | | | | | | | | | | | | 1,697,612 | | | | | | 1,759,993 | |
New Residential Mortgage Loan Trust | | | 3.75 | % | | | 05/25/2054 | | | | | | - | | | | | | - | | | | | | 1,459,957 | | | | | | 1,515,858 | | | | | | | | | | | | | | | | 1,459,957 | | | | | | 1,515,858 | |
New Residential Mortgage Loan Trust | | | 3.75 | % | | | 11/25/2054 | | | | | | 3,042,087 | | | | | | 3,174,725 | | | | | | 1,501,830 | | | | | | 1,567,312 | | | | | | | | | | | | | | | | 4,543,917 | | | | | | 4,742,037 | |
New Residential Mortgage Loan Trust | | | 3.75 | % | | | 08/25/2055 | | | | | | - | | | | | | - | | | | | | 5,655,776 | | | | | | 5,920,561 | | | | | | | | | | | | | | | | 5,655,776 | | | | | | 5,920,561 | |
New Residential Mortgage Loan Trust | | | 3.75 | % | | | 03/25/2056 | | | | | | - | | | | | | - | | | | | | 4,430,005 | | | | | | 4,627,735 | | | | | | | | | | | | | | | | 4,430,005 | | | | | | 4,627,735 | |
New Residential Mortgage Loan Trust | | | 3.75 | % | | | 11/25/2035 | | | | | | - | | | | | | - | | | | | | 4,846,743 | | | | | | 5,067,022 | | | | | | | | | | | | | | | | 4,846,743 | | | | | | 5,067,022 | |
Palisades Center Trust | | | 2.71 | % | | | 04/13/2033 | | | | | | - | | | | | | - | | | | | | 6,500,000 | | | | | | 6,600,693 | | | | | | | | | | | | | | | | 6,500,000 | | | | | | 6,600,693 | |
Provident Funding Mortgage Loan Trust | | | 1.03 | % | | | 05/25/2035 | | | | | | 3,356,087 | | | | | | 3,216,113 | | | | | | 905,419 | | | | | | 867,656 | | | | | | | | | | | | | | | | 4,261,506 | | | | | | 4,083,769 | |
Queens Center Mortgage Trust | | | 3.59 | % | | | 01/11/2037 | | | | | | 4,200,000 | | | | | | 3,956,203 | | | | | | - | | | | | | - | | | | | | | | | | | | | | | | 4,200,000 | | | | | | 3,956,203 | |
RALI Trust | | | 0.60 | % | | | 02/25/2047 | | | | | | 523,999 | | | | | | 413,795 | | | | | | - | | | | | | - | | | | | | | | | | | | | | | | 523,999 | | | | | | 413,795 | |
RALI Trust | | | 0.64 | % | | | 05/25/2047 | | | | | | 977,995 | | | | | | 758,339 | | | | | | - | | | | | | - | | | | | | | | | | | | | | | | 977,995 | | | | | | 758,339 | |
RBSCF Trust | | | 6.15 | % | | | 02/16/2051 | | | | | | - | | | | | | - | | | | | | 1,215,000 | | | | | | 1,236,066 | | | | | | | | | | | | | | | | 1,215,000 | | | | | | 1,236,066 | |
RBSCF Trust | | | 6.15 | % | | | 02/16/2051 | | | | | | 6,734,996 | | | | | | 6,757,369 | | | | | | - | | | | | | - | | | | | | | | | | | | | | | | 6,734,996 | | | | | | 6,757,369 | |
RBSSP Resecuritization Trust | | | 0.85 | % | | | 06/26/2037 | | | | | | - | | | | | | - | | | | | | 861,502 | | | | | | 817,052 | | | | | | | | | | | | | | | | 861,502 | | | | | | 817,052 | |
RBSSP Resecuritization Trust | | | 2.49 | % | | | 01/26/2036 | | | | | | - | | | | | | - | | | | | | 1,224,438 | | | | | | 1,234,128 | | | | | | | | | | | | | | | | 1,224,438 | | | | | | 1,234,128 | |
SCG Trust | | | 2.39 | % | | | 11/15/2026 | | | | | | 1,140,000 | | | | | | 1,136,777 | | | | | | 1,400,000 | | | | | | 1,396,042 | | | | | | | | | | | | | | | | 2,540,000 | | | | | | 2,532,819 | |
STRIPS, Ltd. | | | 1.50 | % | | | 12/25/2044 | | | | | | 366,204 | | | | | | 365,746 | | | | | | - | | | | | | - | | | | | | | | | | | | | | | | 366,204 | | | | | | 365,746 | |
Structured Adjustable Rate Mortgage Loan Trust | | | 2.84 | % | | | 07/25/2035 | | | | | | 672,308 | | | | | | 540,469 | | | | | | - | | | | | | - | | | | | | | | | | | | | | | | 672,308 | | | | | | 540,469 | |
Structured Adjustable Rate Mortgage Loan Trust | | | 3.06 | % | | | 04/25/2047 | | | | | | 1,649,897 | | | | | | 1,262,982 | | | | | | - | | | | | | - | | | | | | | | | | | | | | | | 1,649,897 | | | | | | 1,262,982 | |
Structured Asset Mortgage Investments II Trust | | | 1.15 | % | | | 01/19/2034 | | | | | | 47,335 | | | | | | 45,475 | | | | | | - | | | | | | - | | | | | | | | | | | | | | | | 47,335 | | | | | | 45,475 | |
Towd Point Mortgage Trust | | | 2.75 | % | | | 04/25/2055 | | | | | | - | | | | | | - | | | | | | 2,326,454 | | | | | | 2,354,747 | | | | | | | | | | | | | | | | 2,326,454 | | | | | | 2,354,747 | |
Towd Point Mortgage Trust | | | 3.00 | % | | | 03/25/2054 | | | | | | 3,488,417 | | | | | | 3,556,381 | | | | | | 1,970,163 | | | | | | 2,008,547 | | | | | | | | | | | | | | | | 5,458,580 | | | | | | 5,564,928 | |
Towd Point Mortgage Trust | | | 2.75 | % | | | 05/25/2055 | | | | | | 4,033,904 | | | | | | 4,083,981 | | | | | | 6,247,197 | | | | | | 6,324,749 | | | | | | | | | | | | | | | | 10,281,101 | | | | | | 10,408,730 | |
Towd Point Mortgage Trust | | | 2.75 | % | | | 08/25/2055 | | | | | | - | | | | | | - | | | | | | 3,537,477 | | | | | | 3,585,254 | | | | | | | | | | | | | | | | 3,537,477 | | | | | | 3,585,254 | |
Towd Point Mortgage Trust | | | 2.75 | % | | | 04/25/2055 | | | | | | - | | | | | | - | | | | | | 5,917,753 | | | | | | 5,995,196 | | | | | | | | | | | | | | | | 5,917,753 | | | | | | 5,995,196 | |
UBS-BAMLL Trust | | | 3.66 | % | | | 06/10/2030 | | | | | | 2,680,000 | | | | | | 2,842,914 | | | | | | 1,239,000 | | | | | | 1,314,317 | | | | | | | | | | | | | | | | 3,919,000 | | | | | | 4,157,231 | |
Voyager BRSTN Delaware Trust, Interest Only STRIPS | | | 0.70 | % | | | 12/26/2036 | | | | | | 168,124 | | | | | | 163,101 | | | | | | - | | | | | | - | | | | | | | | | | | | | | | | 168,124 | | | | | | 163,101 | |
WaMu Mortgage Pass-Through Certificates Trust | | | 0.74 | % | | | 07/25/2045 | | | | | | 61,566 | | | | | | 57,578 | | | | | | - | | | | | | - | | | | | | | | | | | | | | | | 61,566 | | | | | | 57,578 | |
WaMu Mortgage Pass-Through Certificates Trust | | | 1.22 | % | | | 07/25/2047 | | | | | | 837,170 | | | | | | 218,680 | | | | | | - | | | | | | - | | | | | | | | | | | | | | | | 837,170 | | | | | | 218,680 | |
Wells Fargo Commercial Mortgage Trust | | | 3.78 | % | | | 02/15/2048 | | | | | | - | | | | | | - | | | | | | 3,000,000 | | | | | | 3,140,621 | | | | | | | | | | | | | | | | 3,000,000 | | | | | | 3,140,621 | |
Wells Fargo Mortgage-Backed Securities Trust | | | 2.68 | % | | | 12/25/2033 | | | | | | - | | | | | | - | | | | | | 849,379 | | | | | | 845,670 | | | | | | | | | | | | | | | | 849,379 | | | | | | 845,670 | |
Wells Fargo Re-REMIC Trust | | | 1.75 | % | | | 08/20/2021 | | | | | | 65,955 | | | | | | 65,947 | | | | | | - | | | | | | - | | | | | | | | | | | | | | | | 65,955 | | | | | | 65,947 | |
| | | | | | | | | | | | | | | | | | | | | | | | | | | | |
Total Mortgage-Backed Securities | | | | | | | | | | | | | | | | | | | 155,526,132 | | | | | | | | | | | | 161,450,860 | | | | | | | | | | | | | | | | | | | | | | 316,976,992 | |
| | | | | | | | | | | | | | | | | | | | | | | | | | | | |
| | | | | | | | | | | | | | | | | | | Total Cost ($159,247,499) | | | | | | | | | | | | Total Cost ($160,179,245) | | | | | | | | | | | | | | | | | | | | | | Total Cost ($319,426,744) | |
Municipal Government Obligations - 0.5 % | | | | | | | | | | | | | | | | | | | | | | | | | | | | | | | | | | | | | | | | | | | | | | | | | | | | | | |
California | | | | | | | | | | | | | | | | | | | | | | | | | | | | | | | | | | | | | | | | | | | | | | | | | | | | | | |
Los Angeles Community College District | | | 6.60 | % | | | 08/01/2042 | | | | | | 340,000 | | | | | | 519,411 | | | | | | - | | | | | | - | | | | | | | | | | | | | | | | 340,000 | | | | | | 519,411 | |
State of California | | | 7.60 | % | | | 11/01/2040 | | | | | | 1,585,000 | | | | | | 2,563,896 | | | | | | 2,000,000 | | | | | | 3,235,200 | | | | | | | | | | | | | | | | 3,585,000 | | | | | | 5,799,096 | |
State of California | | | 7.95 | % | | | 03/01/2036 | | | | | | - | | | | | | - | | | | | | 1,075,000 | | | | | | 1,306,566 | | | | | | | | | | | | | | | | 1,075,000 | | | | | | 1,306,566 | |
University of California | | | 4.86 | % | | | 05/15/2112 | | | | | | 315,000 | | | | | | 351,178 | | | | | | - | | | | | | - | | | | | | | | | | | | | | | | 315,000 | | | | | | 351,178 | |
Georgia | | | | | | | | | | | | | | | | | | | | | | | | | | | | | | | | | | | | | | | | | | | | | | | | | | | | | | |
Municipal Electric Authority of Georgia | | | 6.64 | % | | | 04/01/2057 | | | | | | 295,000 | | | | | | 388,462 | | | | | | - | | | | | | - | | | | | | | | | | | | | | | | 295,000 | | | | | | 388,462 | |
Illinois | | | | | | | | | | | | | | | | | | | | | | | | | | | | | | | | | | | | | | | | | | | | | | | | | | | | | | |
State of Illinois | | | 5.10 | % | | | 06/01/2033 | | | | | | 670,000 | | | | | | 643,166 | | | | | | - | | | | | | - | | | | | | | | | | | | | | | | 670,000 | | | | | | 643,166 | |
New Jersey | | | | | | | | | | | | | | | | | | | | | | | | | | | | | | | | | | | | | | | | | | | | | | | | | | | | | | |
New Jersey Turnpike Authority | | | 7.41 | % | | | 01/01/2040 | | | | | | 431,000 | | | | | | 674,662 | | | | | | - | | | | | | - | | | | | | | | | | | | | | | | 431,000 | | | | | | 674,662 | |
New York | | | | | | | | | | | | | | | | | | | | | | | | | | | | | | | | | | | | | | | | | | | | | | | | | | | | | | |
Metropolitan Transportation Authority | | | 6.81 | % | | | 11/15/2040 | | | | | | 355,000 | | | | | | 517,267 | | | | | | - | | | | | | - | | | | | | | | | | | | | | | | 355,000 | | | | | | 517,267 | |
New York City Water & Sewer System | | | 5.88 | % | | | 06/15/2044 | | | | | | 340,000 | | | | | | 488,713 | | | | | | - | | | | | | - | | | | | | | | | | | | | | | | 340,000 | | | | | | 488,713 | |
New York State Dormitory Authority | | | 5.39 | % | | | 03/15/2040 | | | | | | 330,000 | | | | | | 437,464 | | | | | | - | | | | | | - | | | | | | | | | | | | | | | | 330,000 | | | | | | 437,464 | |
Port Authority of New York & New Jersey | | | 4.96 | % | | | 08/01/2046 | | | | | | 570,000 | | | | | | 708,333 | | | | | | - | | | | | | - | | | | | | | | | | | | | | | | 570,000 | | | | | | 708,333 | |
| | | | | | | | | | | | | | | | | | | | | | | | | | | | |
Total Municipal Government Obligations | | | | | | | | | | | | | | | | | | | 7,292,552 | | | | | | | | | | | | 4,541,766 | | | | | | | | | | | | | | | | | | | | | | 11,834,318 | |
| | | | | | | | | | | | | | | | | | | | | | | | | | | | |
| | | | | | | | | | | | | | | | | | | Total Cost ($6,302,493) | | | | | | | | | | | | Total Cost ($4,226,792) | | | | | | | | | | | | | | | | | | | | | | Total Cost ($10,529,285) | |
U.S. Government Agency Obligations - 16.9 % | | | | | | | | | | | | | | | | | | | | | | | | | | | | | | | | | | | | | | | | | | | | | | | | | | | | | | |
Federal Home Loan Mortgage Corp. | | | 2.25 | % | | | 02/01/2037 | | | | | | 46,890 | | | | | | 48,910 | | | | | | - | | | | | | - | | | | | | | | | | | | | | | | 46,890 | | | | | | 48,910 | |
Federal Home Loan Mortgage Corp. | | | 2.25 | % | | | 05/01/2037 | | | | | | 91,068 | | | | | | 94,012 | | | | | | - | | | | | | - | | | | | | | | | | | | | | | | 91,068 | | | | | | 94,012 | |
Federal Home Loan Mortgage Corp. | | | 2.37 | % | | | 04/01/2037 | | | | | | 192,662 | | | | | | 200,833 | | | | | | - | | | | | | - | | | | | | | | | | | | | | | | 192,662 | | | | | | 200,833 | |
Federal Home Loan Mortgage Corp. | | | 2.49 | % | | | 09/01/2035 | | | | | | 1,059,608 | | | | | | 1,125,142 | | | | | | - | | | | | | - | | | | | | | | | | | | | | | | 1,059,608 | | | | | | 1,125,142 | |
Federal Home Loan Mortgage Corp. | | | 2.54 | % | | | 01/01/2038 | | | | | | 231,741 | | | | | | 245,353 | | | | | | - | | | | | | - | | | | | | | | | | | | | | | | 231,741 | | | | | | 245,353 | |
Federal Home Loan Mortgage Corp. | | | 2.55 | % | | | 09/01/2037 | | | | | | 22,193 | | | | | | 23,651 | | | | | | - | | | | | | - | | | | | | | | | | | | | | | | 22,193 | | | | | | 23,651 | |
Federal Home Loan Mortgage Corp. | | | 2.63 | % | | | 12/01/2034 | | | | | | 21,325 | | | | | | 22,774 | | | | | | - | | | | | | - | | | | | | | | | | | | | | | | 21,325 | | | | | | 22,774 | |
Federal Home Loan Mortgage Corp. | | | 3.00 | % | | | 05/01/2037 | | | | | | 102,888 | | | | | | 109,682 | | | | | | - | | | | | | - | | | | | | | | | | | | | | | | 102,888 | | | | | | 109,682 | |
Federal Home Loan Mortgage Corp. | | | 3.00 | % | | | 02/01/2041 | | | | | | 658,493 | | | | | | 698,412 | | | | | | - | | | | | | - | | | | | | | | | | | | | | | | 658,493 | | | | | | 698,412 | |
Federal Home Loan Mortgage Corp. | | | 5.00 | % | | | 12/01/2035 | | | | | | - | | | | | | - | | | | | | 699,782 | | | | | | 790,207 | | | | | | | | | | | | | | | | 699,782 | | | | | | 790,207 | |
Federal Home Loan Mortgage Corp. | | | 5.50 | % | | | 12/01/2016 | | | | | | 1,498 | | | | | | 1,504 | | | | | | - | | | | | | - | | | | | | | | | | | | | | | | 1,498 | | | | | | 1,504 | |
Federal Home Loan Mortgage Corp. | | | 5.50 | % | | | 12/01/2016 | | | | | | 21 | | | | | | 21 | | | | | | - | | | | | | - | | | | | | | | | | | | | | | | 21 | | | | | | 21 | |
Federal Home Loan Mortgage Corp. | | | 5.50 | % | | | 06/01/2041 | | | | | | 2,010,688 | | | | | | 2,255,402 | | | | | | - | | | | | | - | | | | | | | | | | | | | | | | 2,010,688 | | | | | | 2,255,402 | |
Federal Home Loan Mortgage Corp. | | | 5.50 | % | | | 11/01/2038 | | | | | | - | | | | | | - | | | | | | 382,442 | | | | | | 440,609 | | | | | | | | | | | | | | | | 382,442 | | | | | | 440,609 | |
Federal Home Loan Mortgage Corp. | | | 6.00 | % | | | 11/01/2016 | | | | | | 106 | | | | | | 106 | | | | | | - | | | | | | - | | | | | | | | | | | | | | | | 106 | | | | | | 106 | |
Federal Home Loan Mortgage Corp. | | | 6.00 | % | | | 08/01/2016 | | | | | | 32 | | | | | | 32 | | | | | | - | | | | | | - | | | | | | | | | | | | | | | | 32 | | | | | | 32 | |
Federal Home Loan Mortgage Corp. | | | 6.00 | % | | | 05/01/2031 | | | | | | 545,258 | | | | | | 632,795 | | | | | | - | | | | | | - | | | | | | | | | | | | | | | | 545,258 | | | | | | 632,795 | |
Federal National Mortgage Association | | | 0.00 | % | | | 10/09/2019 | | | | | | - | | | | | | - | | | | | | 6,045,000 | | | | | | 5,806,869 | | | | | | | | | | | | | | | | 6,045,000 | | | | | | 5,806,869 | |
Federal National Mortgage Association | | | 1.70 | % | | | 08/01/2037 | | | | | | 9,170 | | | | | | 9,415 | | | | | | - | | | | | | - | | | | | | | | | | | | | | | | 9,170 | | | | | | 9,415 | |
Federal National Mortgage Association | | | 2.16 | % | | | 08/01/2034 | | | | | | 13,492 | | | | | | 14,028 | | | | | | - | | | | | | - | | | | | | | | | | | | | | | | 13,492 | | | | | | 14,028 | |
Federal National Mortgage Association | | | 2.29 | % | | | 01/01/2035 | | | | | | 25,973 | | | | | | 27,060 | | | | | | - | | | | | | - | | | | | | | | | | | | | | | | 25,973 | | | | | | 27,060 | |
Federal National Mortgage Association | | | 2.50 | % | | | 07/01/2031 | | | | | | 9,151,000 | | | | | | 9,467,526 | | | | | | 9,190,000 | | | | | | 9,507,875 | | | | | | | | | | | | | | | | 18,341,000 | | | | | | 18,975,401 | |
Federal National Mortgage Association | | | 2.65 | % | | | 08/01/2035 | | | | | | 67,162 | | | | | | 69,449 | | | | | | - | | | | | | - | | | | | | | | | | | | | | | | 67,162 | | | | | | 69,449 | |
Federal National Mortgage Association | | | 2.82 | % | | | 03/01/2041 | | | | | | 418,093 | | | | | | 442,816 | | | | | | - | | | | | | - | | | | | | | | | | | | | | | | 418,093 | | | | | | 442,816 | |
Federal National Mortgage Association | | | 2.95 | % | | | 03/01/2041 | | | | | | 265,919 | | | | | | 281,039 | | | | | | - | | | | | | - | | | | | | | | | | | | | | | | 265,919 | | | | | | 281,039 | |
Federal National Mortgage Association | | | 3.00 | % | | | 07/01/2046 | | | | | | 60,605,000 | | | | | | 62,894,245 | | | | | | 61,463,000 | | | | | | 63,784,654 | | | | | | | | | | | | | | | | 122,068,000 | | | | | | 126,678,899 | |
Federal National Mortgage Association | | | 3.50 | % | | | 07/01/2028 | | | | | | 1,128,467 | | | | | | 1,210,573 | | | | | | - | | | | | | - | | | | | | | | | | | | | | | | 1,128,467 | | | | | | 1,210,573 | |
Federal National Mortgage Association | | | 3.50 | % | | | 10/01/2028 | | | | | | 2,159,751 | | | | | | 2,315,842 | | | | | | - | | | | | | - | | | | | | | | | | | | | | | | 2,159,751 | | | | | | 2,315,842 | |
Federal National Mortgage Association | | | 3.50 | % | | | 01/01/2029 | | | | | | 1,425,844 | | | | | | 1,528,772 | | | | | | - | | | | | | - | | | | | | | | | | | | | | | | 1,425,844 | | | | | | 1,528,772 | |
Federal National Mortgage Association | | | 3.50 | % | | | 07/01/2031 | | | | | | 4,144,000 | | | | | | 4,391,084 | | | | | | 13,676,000 | | | | | | 14,491,426 | | | | | | | | | | | | | | | | 17,820,000 | | | | | | 18,882,510 | |
Federal National Mortgage Association | | | 3.50 | % | | | 07/14/2046 | | | | | | 59,741,000 | | | | | | 63,036,087 | | | | | | 60,025,000 | | | | | | 63,335,751 | | | | | | | | | | | | | | | | 119,766,000 | | | | | | 126,371,838 | |
Federal National Mortgage Association | | | 4.00 | % | | | 07/01/2046 | | | | | | 21,425,000 | | | | | | 22,971,002 | | | | | | 21,272,000 | | | | | | 22,806,962 | | | | | | | | | | | | | | | | 42,697,000 | | | | | | 45,777,964 | |
Federal National Mortgage Association | | | 4.50 | % | | | 06/01/2026 | | | | | | 2,423,559 | | | | | | 2,604,608 | | | | | | - | | | | | | - | | | | | | | | | | | | | | | | 2,423,559 | | | | | | 2,604,608 | |
Federal National Mortgage Association | | | 4.50 | % | | | 02/01/2025 | | | | | | 351,543 | | | | | | 374,784 | | | | | | - | | | | | | - | | | | | | | | | | | | | | | | 351,543 | | | | | | 374,784 | |
Federal National Mortgage Association | | | 4.50 | % | | | 04/01/2025 | | | | | | 69,401 | | | | | | 74,879 | | | | | | - | | | | | | - | | | | | | | | | | | | | | | | 69,401 | | | | | | 74,879 | |
Federal National Mortgage Association | | | 4.50 | % | | | 07/01/2025 | | | | | | 260,952 | | | | | | 280,963 | | | | | | - | | | | | | - | | | | | | | | | | | | | | | | 260,952 | | | | | | 280,963 | |
Federal National Mortgage Association | | | 5.00 | % | | | 04/01/2039 | | | | | | 1,266,828 | | | | | | 1,431,987 | | | | | | 9,023,227 | | | | | | 10,199,604 | | | | | | | | | | | | | | | | 10,290,055 | | | | | | 11,631,591 | |
Federal National Mortgage Association | | | 5.00 | % | | | 08/01/2039 | | | | | | 1,362,457 | | | | | | 1,531,371 | | | | | | 1,362,457 | | | | | | 1,531,371 | | | | | | | | | | | | | | | | 2,724,914 | | | | | | 3,062,742 | |
Federal National Mortgage Association | | | 5.00 | % | | | 10/01/2039 | | | | | | 1,106,693 | | | | | | 1,244,293 | | | | | | 1,111,620 | | | | | | 1,249,833 | | | | | | | | | | | | | | | | 2,218,313 | | | | | | 2,494,126 | |
Federal National Mortgage Association | | | 5.00 | % | | | 11/01/2039 | | | | | | 2,496,891 | | | | | | 2,823,991 | | | | | | 2,488,157 | | | | | | 2,814,113 | | | | | | | | | | | | | | | | 4,985,048 | | | | | | 5,638,104 | |
Federal National Mortgage Association | | | 5.00 | % | | | 11/01/2039 | | | | | | 1,025,272 | | | | | | 1,159,513 | | | | | | 919,812 | | | | | | 1,040,245 | | | | | | | | | | | | | | | | 1,945,084 | | | | | | 2,199,758 | |
Federal National Mortgage Association | | | 5.00 | % | | | 07/01/2046 | | | | | | 2,122,000 | | �� | | | | 2,357,673 | | | | | | 2,159,000 | | | | | | 2,398,782 | | | | | | | | | | | | | | | | 4,281,000 | | | | | | 4,756,455 | |
Federal National Mortgage Association | | | 5.50 | % | | | 04/01/2036 | | | | | | 38,212 | | | | | | 40,740 | | | | | | - | | | | | | - | | | | | | | | | | | | | | | | 38,212 | | | | | | 40,740 | |
Federal National Mortgage Association | | | 5.50 | % | | | 04/01/2041 | | | | | | 161,594 | | | | | | 182,552 | | | | | | - | | | | | | - | | | | | | | | | | | | | | | | 161,594 | | | | | | 182,552 | |
Federal National Mortgage Association | | | 5.50 | % | | | 10/01/2036 | | | | | | - | | | | | | - | | | | | | 494,637 | | | | | | 572,593 | | | | | | | | | | | | | | | | 494,637 | | | | | | 572,593 | |
Federal National Mortgage Association | | | 5.50 | % | | | 08/01/2037 | | | | | | 60,578 | | | | | | 68,578 | | | | | | - | | | | | | - | | | | | | | | | | | | | | | | 60,578 | | | | | | 68,578 | |
S-9
| | | | | | | | | | | | | | | | | | | | | | | | | | | | | | | | | | | | | | | | | | | | | | | | | | | | | | |
| | | | | | | | | | | TPP Master | | | | | TAF Destination | | | | | Adjustments | | | | | Combined Pro Forma Destination | |
| | | | | | | | | | | | | | | | | |
| | | Coupon Rate | | | Maturity Date | | | | | Principal | | | | | Value | | | | | Principal | | | | | Value | | | | | Principal | | | Value | | | | | Principal | | | | | Value | |
| | | | | | | | | | | | | | | | | | | | | | | | | | | | |
Federal National Mortgage Association | | | 5.50 | % | | | 06/01/2038 | | | | | $ | - | | | | | $ | - | | | | | $ | 498,980 | | | | | $ | 567,860 | | | | | | | | | | | | | | | $ | 498,980 | | | | | $ | 567,860 | |
Federal National Mortgage Association | | | 5.50 | % | | | 08/01/2037 | | | | | | 1,337,235 | | | | | | 1,518,029 | | | | | | - | | | | | | - | | | | | | | | | | | | | | | | 1,337,235 | | | | | | 1,518,029 | |
Federal National Mortgage Association | | | 6.00 | % | | | 02/01/2041 | | | | | | 1,821,342 | | | | | | 2,106,354 | | | | | | 908,778 | | | | | | 1,050,987 | | | | | | | | | | | | | | | | 2,730,120 | | | | | | 3,157,341 | |
Federal National Mortgage Association | | | 6.00 | % | | | 02/01/2034 | | | | | | 848,668 | | | | | | 985,422 | | | | | | - | | | | | | - | | | | | | | | | | | | | | | | 848,668 | | | | | | 985,422 | |
Federal National Mortgage Association | | | 6.00 | % | | | 08/01/2034 | | | | | | 494,485 | | | | | | 572,703 | | | | | | - | | | | | | - | | | | | | | | | | | | | | | | 494,485 | | | | | | 572,703 | |
Federal National Mortgage Association | | | 6.00 | % | | | 04/01/2035 | | | | | | 3,732,377 | | | | | | 4,333,759 | | | | | | - | | | | | | - | | | | | | | | | | | | | | | | 3,732,377 | | | | | | 4,333,759 | |
Federal National Mortgage Association | | | 6.00 | % | | | 02/01/2034 | | | | | | 3,946 | | | | | | 4,507 | | | | | | - | | | | | | - | | | | | | | | | | | | | | | | 3,946 | | | | | | 4,507 | |
Federal National Mortgage Association | | | 6.00 | % | | | 10/01/2034 | | | | | | 2,636 | | | | | | 3,010 | | | | | | - | | | | | | - | | | | | | | | | | | | | | | | 2,636 | | | | | | 3,010 | |
Federal National Mortgage Association | | | 6.00 | % | | | 01/01/2035 | | | | | | 33,241 | | | | | | 37,965 | | | | | | - | | | | | | - | | | | | | | | | | | | | | | | 33,241 | | | | | | 37,965 | |
Federal National Mortgage Association | | | 6.00 | % | | | 02/01/2038 | | | | | | 286,794 | | | | | | 330,573 | | | | | | - | | | | | | - | | | | | | | | | | | | | | | | 286,794 | | | | | | 330,573 | |
Federal National Mortgage Association | | | 6.00 | % | | | 03/01/2038 | | | | | | - | | | | | | - | | | | | | 950,444 | | | | | | 1,109,611 | | | | | | | | | | | | | | | | 950,444 | | | | | | 1,109,611 | |
Federal National Mortgage Association | | | 6.00 | % | | | 10/01/2038 | | | | | | 106,684 | | | | | | 123,193 | | | | | | - | | | | | | - | | | | | | | | | | | | | | | | 106,684 | | | | | | 123,193 | |
Federal National Mortgage Association | | | 6.00 | % | | | 12/01/2038 | | | | | | 128,979 | | | | | | 148,868 | | | | | | - | | | | | | - | | | | | | | | | | | | | | | | 128,979 | | | | | | 148,868 | |
Federal National Mortgage Association | | | 6.00 | % | | | 05/01/2038 | | | | | | 366,928 | | | | | | 425,924 | | | | | | - | | | | | | - | | | | | | | | | | | | | | | | 366,928 | | | | | | 425,924 | |
Federal National Mortgage Association | | | 6.00 | % | | | 03/01/2038 | | | | | | 112,378 | | | | | | 130,154 | | | | | | - | | | | | | - | | | | | | | | | | | | | | | | 112,378 | | | | | | 130,154 | |
Federal National Mortgage Association | | | 6.00 | % | | | 12/01/2037 | | | | | | - | | | | | | - | | | | | | 1,349,637 | | | | | | 1,566,128 | | | | | | | | | | | | | | | | 1,349,637 | | | | | | 1,566,128 | |
Federal National Mortgage Association | | | 6.00 | % | | | 09/01/2038 | | | | | | - | | | | | | - | | | | | | 376,746 | | | | | | 433,730 | | | | | | | | | | | | | | | | 376,746 | | | | | | 433,730 | |
Federal National Mortgage Association | | | 6.00 | % | | | 11/01/2034 | | | | | | - | | | | | | - | | | | | | 1,223,997 | | | | | | 1,418,527 | | | | | | | | | | | | | | | | 1,223,997 | | | | | | 1,418,527 | |
Federal National Mortgage Association | | | 6.00 | % | | | 01/01/2040 | | | | | | 865,908 | | | | | | 1,011,064 | | | | | | 459,162 | | | | | | 536,134 | | | | | | | | | | | | | | | | 1,325,070 | | | | | | 1,547,198 | |
Federal National Mortgage Association | | | 6.50 | % | | | 05/01/2040 | | | | | | 2,514,759 | | | | | | 2,921,513 | | | | | | - | | | | | | - | | | | | | | | | | | | | | | | 2,514,759 | | | | | | 2,921,513 | |
Federal National Mortgage Association | | | 6.50 | % | | | 06/01/2038 | | | | | | - | | | | | | - | | | | | | 1,122,681 | | | | | | 1,388,556 | | | | | | | | | | | | | | | | 1,122,681 | | | | | | 1,388,556 | |
Federal National Mortgage Association | | | 7.00 | % | | | 09/01/2016 | | | | | | 74 | | | | | | 74 | | | | | | - | | | | | | - | | | | | | | | | | | | | | | | 74 | | | | | | 74 | |
Federal National Mortgage Association | | | 7.00 | % | | | 09/01/2016 | | | | | | 46 | | | | | | 46 | | | | | | - | | | | | | - | | | | | | | | | | | | | | | | 46 | | | | | | 46 | |
Government National Mortgage Association | | | 4.46 | % | | | 06/20/2062 | | | | | | 7,286,974 | | | | | | 7,758,540 | | | | | | 6,170,421 | | | | | | 6,569,732 | | | | | | | | | | | | | | | | 13,457,395 | | | | | | 14,328,272 | |
Government National Mortgage Association, Interest Only STRIPS | | | 0.90 | % | | | 02/16/2053 | | | | | | 9,011,059 | | | | | | 550,293 | | | | | | - | | | | | | - | | | | | | | | | | | | | | | | 9,011,059 | | | | | | 550,293 | |
| | | | | | | | | | | | | | | | | | | | | | | | | | | | |
Total U.S. Government Agency Obligations | | | | | | | | | | | | | | | | | | | 211,255,490 | | | | | | | | | | | | 215,412,159 | | | | | | | | | | | | | | | | | | | | | | 426,667,649 | |
| | | | | | | | | | | | | | | | | | | | | | | | | | | | |
| | | | | | | | | | | | | | | | | | | Total Cost ($208,783,584) | | | | | | | | | | | | Total Cost ($213,690,349) | | | | | | | | | | | | | | | | | | | | | | Total Cost ($422,473,933) | |
U.S. Government Obligations - 23.4 % | | | | | | | | | | | | | | | | | | | | | | | | | | | | | | | | | | | | | | | | | | | | | | | | | | | | | | |
U.S. Treasury Bond | | | 2.50 | % | | | 02/15/2045 | | | | | | 10,126,000 | | | | | | 10,542,513 | | | | | | 20,572,200 | | | | | | 21,418,396 | | | | | | | | | | | | | | | | 30,698,200 | | | | | | 31,960,909 | |
U.S. Treasury Bond | | | 2.75 | % | | | 08/15/2042 | | | | | | 11,570,500 | | | | | | 12,748,342 | | | | | | 12,839,000 | | | | | | 14,145,972 | | | | | | | | | | | | | | | | 24,409,500 | | | | | | 26,894,314 | |
U.S. Treasury Bond | | | 2.88 | % | | | 08/15/2045 | | | | | | - | | | | | | - | | | | | | 6,049,000 | | | | | | 6,792,368 | | | | | | | | | | | | | | | | 6,049,000 | | | | | | 6,792,368 | |
U.S. Treasury Bond | | | 3.00 | % | | | 11/15/2045 | | | | | | 400,000 | | | | | | 459,938 | | | | | | - | | | | | | - | | | | | | | | | | | | | | | | 400,000 | | | | | | 459,938 | |
U.S. Treasury Bond | | | 3.13 | % | | | 02/15/2042 | | | | | | - | | | | | | - | | | | | | 15,643,800 | | | | | | 18,485,355 | | | | | | | | | | | | | | | | 15,643,800 | | | | | | 18,485,355 | |
U.S. Treasury Bond | | | 3.50 | % | | | 02/15/2039 | | | | | | 3,049,000 | | | | | | 3,847,933 | | | | | | 10,439,100 | | | | | | 13,174,468 | | | | | | | | | | | | | | | | 13,488,100 | | | | | | 17,022,401 | |
U.S. Treasury Bond | | | 3.63 | % | | | 02/15/2044 | | | | | | 38,610,900 | | | | | | 49,783,929 | | | | | | 5,501,700 | | | | | | 7,093,754 | | | | | | | | | | | | | | | | 44,112,600 | | | | | | 56,877,683 | |
U.S. Treasury Bond | | | 4.50 | % | | | 02/15/2036 | | | | | | 9,878,200 | | | | | | 14,228,470 | | | | | | 12,225,500 | | | | | | 17,609,500 | | | | | | | | | | | | | | | | 22,103,700 | | | | | | 31,837,970 | |
U.S. Treasury Bond | | | 4.75 | % | | | 02/15/2037 | | | | | | 2,822,000 | | | | | | 4,197,945 | | | | | | 2,210,000 | | | | | | 3,287,547 | | | | | | | | | | | | | | | | 5,032,000 | | | | | | 7,485,492 | |
U.S. Treasury Bond | | | 5.25 | % | | | 02/15/2029 | | | | | | 8,215,000 | | | | | | 11,615,879 | | | | | | 11,004,500 | | | | | | 15,560,187 | | | | | | | | | | | | | | | | 19,219,500 | | | | | | 27,176,066 | |
U.S. Treasury Inflation Indexed Bond | | | 1.75 | % | | | 01/15/2028 | | | | | | 1,740,256 | | | | | | 2,034,491 | | | | | | 7,287,720 | | | | | | 8,519,899 | | | | | | | | | | | | | | | | 9,027,976 | | | | | | 10,554,390 | |
U.S. Treasury Inflation Indexed Bond | | | 2.50 | % | | | 01/15/2029 | | | | | | 7,433,630 | | | | | | 9,418,640 | | | | | | 7,325,997 | | | | | | 9,282,265 | | | | | | | | | | | | | | | | 14,759,627 | | | | | | 18,700,905 | |
U.S. Treasury Inflation Indexed Note | | | 0.63 | % | | | 01/15/2024 | | | | | | 15,901,475 | | | | | | 16,647,477 | | | | | | 10,967,206 | | | | | | 11,481,722 | | | | | | | | | | | | | | | | 26,868,681 | | | | | | 28,129,199 | |
U.S. Treasury Note | | | 0.38 | % | | | 10/31/2016 | | | | | | 19,272,000 | | | | | | 19,273,310 | | | | | | 25,178,000 | | | | | | 25,179,712 | | | | | | | | | | | | | | | | 44,450,000 | | | | | | 44,453,022 | |
U.S. Treasury Note | | | 0.50 | % | | | 09/30/2016 | | | | | | 4,374,000 | | | | | | 4,375,627 | | | | | | 10,643,600 | | | | | | 10,647,559 | | | | | | | | | | | | | | | | 15,017,600 | | | | | | 15,023,186 | |
U.S. Treasury Note | | | 0.50 | % | | | 07/31/2017 | | | | | | - | | | | | | - | | | | | | 5,611,300 | | | | | | 5,609,549 | | | | | | | | | | | | | | | | 5,611,300 | | | | | | 5,609,549 | |
U.S. Treasury Note | | | 0.63 | % | | | 09/30/2017 | | | | | | 5,085,000 | | | | | | 5,089,770 | | | | | | 6,792,300 | | | | | | 6,798,671 | | | | | | | | | | | | | | | | 11,877,300 | | | | | | 11,888,441 | |
U.S. Treasury Note | | | 0.88 | % | | | 04/15/2017 | | | | | | - | | | | | | - | | | | | | 7,076,000 | | | | | | 7,097,419 | | | | | | | | | | | | | | | | 7,076,000 | | | | | | 7,097,419 | |
U.S. Treasury Note | | | 0.88 | % | | | 04/30/2017 | | | | | | 12,222,000 | | | | | | 12,259,130 | | | | | | 20,645,000 | | | | | | 20,707,720 | | | | | | | | | | | | | | | | 32,867,000 | | | | | | 32,966,850 | |
U.S. Treasury Note | | | 1.00 | % | | | 11/30/2019 | | | | | | 8,771,500 | | | | | | 8,828,716 | | | | | | 8,795,000 | | | | | | 8,852,370 | | | | | | | | | | | | | | | | 17,566,500 | | | | | | 17,681,086 | |
U.S. Treasury Note | | | 1.25 | % | | | 11/30/2018 | | | | | | 24,527,900 | | | | | | 24,877,619 | | | | | | 17,004,200 | | | | | | 17,246,646 | | | | | | | | | | | | | | | | 41,532,100 | | | | | | 42,124,265 | |
U.S. Treasury Note | | | 1.63 | % | | | 03/31/2019 | | | | | | 27,812,800 | | | | | | 28,510,289 | | | | | | 16,413,400 | | | | | | 16,825,015 | | | | | | | | | | | | | | | | 44,226,200 | | | | | | 45,335,304 | |
U.S. Treasury Note | | | 1.63 | % | | | 05/15/2026 | | | | | | - | | | | | | - | | | | | | 400,000 | | | | | | 404,891 | | | | | | | | | | | | | | | | 400,000 | | | | | | 404,891 | |
U.S. Treasury Note | | | 1.63 | % | | | 08/15/2022 | | | | | | 7,470,400 | | | | | | 7,660,664 | | | | | | 3,101,900 | | | | | | 3,180,902 | | | | | | | | | | | | | | | | 10,572,300 | | | | | | 10,841,566 | |
U.S. Treasury Note | | | 1.63 | % | | | 11/15/2022 | | | | | | 6,582,600 | | | | | | 6,737,910 | | | | | | 1,876,000 | | | | | | 1,920,262 | | | | | | | | | | | | | | | | 8,458,600 | | | | | | 8,658,172 | |
U.S. Treasury Note | | | 1.63 | % | | | 02/15/2026 | | | | | | 495,000 | | | | | | 500,569 | | | | | | 3,658,000 | | | | | | 3,699,153 | | | | | | | | | | | | | | | | 4,153,000 | | | | | | 4,199,722 | |
U.S. Treasury Note | | | 1.75 | % | | | 05/15/2023 | | | | | | 3,333,000 | | | | | | 3,438,329 | | | | | | - | | | | | | - | | | | | | | | | | | | | | | | 3,333,000 | | | | | | 3,438,329 | |
U.S. Treasury Note | | | 1.88 | % | | | 11/30/2021 | | | | | | 6,429,000 | | | | | | 6,694,698 | | | | | | 2,434,100 | | | | | | 2,534,696 | | | | | | | | | | | | | | | | 8,863,100 | | | | | | 9,229,394 | |
U.S. Treasury Note | | | 2.00 | % | | | 02/15/2025 | | | | | | 13,447,000 | | | | | | 14,068,924 | | | | | | 15,638,900 | | | | | | 16,362,199 | | | | | | | | | | | | | | | | 29,085,900 | | | | | | 30,431,123 | |
U.S. Treasury Note | | | 2.25 | % | | | 11/15/2024 | | | | | | 3,363,900 | | | | | | 3,588,336 | | | | | | - | | | | | | - | | | | | | | | | | | | | | | | 3,363,900 | | | | | | 3,588,336 | |
U.S. Treasury Note | | | 2.50 | % | | | 08/15/2023 | | | | | | 6,868,000 | | | | | | 7,440,243 | | | | | | - | | | | | | - | | | | | | | | | | | | | | | | 6,868,000 | | | | | | 7,440,243 | |
U.S. Treasury Note | | | 2.50 | % | | | 05/15/2024 | | | | | | 6,921,100 | | | | | | 7,517,234 | | | | | | 1,085,100 | | | | | | 1,178,563 | | | | | | | | | | | | | | | | 8,006,200 | | | | | | 8,695,797 | |
| | | | | | | | | | | | | | | | | | | | | | | | | | | | |
Total U.S. Government Obligations | | | | | | | | | | | | | | | | | | | 296,386,925 | | | | | | | | | | | | 295,096,760 | | | | | | | | | | | | | | | | | | | | | | 591,483,685 | |
| | | | | | | | | | | | | | | | | | | | | | | | | | | | |
| | | | | | | | | | | | | | | | | | | Total Cost ($276,257,730) | | | | | | | | | | | | Total Cost ($279,796,153) | | | | | | | | | | | | | | | | | | | | | | Total Cost ($556,053,883) | |
Preferred Stocks - 0.2 % | | | | | | | | | | | | | | | | | | | | | | | | | | | | | | | | | | | | | | | | | | | | | | | | | | | | | | |
Banks | | | | | | | | | | | | | | | | | | | | | | | | | | | | | | | | | | | | | | | | | | | | | | | | | | | | | | |
Citigroup Capital XIII | | | 7.01 | % | | | | | | | | | 60,502 | | | | | | 1,577,287 | | | | | | - | | | | | | - | | | | | | | | | | | | | | | | 60,502 | | | | | | 1,577,287 | |
CoBank ACB | | | 6.25 | % | | | | | | | | | - | | | | | | - | | | | | | 6,000 | | | | | | 619,125 | | | | | | | | | | | | | | | | 6,000 | | | | | | 619,125 | |
Capital Markets | | | | | | | | | | | | | | | | | | | | | | | | | | | | | | | | | | | | | | | | | | | | | | | | | | | | | | |
State Street Corp. | | | 5.90 | % | | | | | | | | | 23,039 | | | | | | 649,469 | | | | | | - | | | | | | - | | | | | | | | | | | | | | | | 23,039 | | | | | | 649,469 | |
Electric Utilities | | | | | | | | | | | | | | | | | | | | | | | | | | | | | | | | | | | | | | | | | | | | | | | | | | | | | | |
SCE Trust III | | | 5.75 | % | | | | | | | | | 7,998 | | | | | | 231,942 | | | | | | - | | | | | | - | | | | | | | | | | | | | | | | 7,998 | | | | | | 231,942 | |
Thrifts & Mortgage Finance | | | | | | | | | | | | | | | | | | | | | | | | | | | | | | | | | | | | | | | | | | | | | | | | | | | | | | |
Federal Home Loan Mortgage Corp. | | | 8.38 | % | | | | | | | | | 93,300 | | | | | | 415,185 | | | | | | - | | | | | | - | | | | | | | | | | | | | | | | 93,300 | | | | | | 415,185 | |
Federal National Mortgage Association | | | 0.00 | % | | | | | | | | | 1,300 | | | | | | 9,555 | | | | | | - | | | | | | - | | | | | | | | | | | | | | | | 1,300 | | | | | | 9,555 | |
Federal National Mortgage Association | | | 8.25 | % | | | | | | | | | 81,175 | | | | | | 362,853 | | | | | | - | | | | | | - | | | | | | | | | | | | | | | | 81,175 | | | | | | 362,853 | |
| | | | | | | | | | | | | | | | | | | | | | | | | | | | |
Total Preferred Stocks | | | | | | | | | | | | | | | | | | | 3,246,291 | | | | | | | | | | | | 619,125 | | | | | | | | | | | | | | | | | | | | | | 3,865,416 | |
| | | | | | | | | | | | | | | | | | | | | | | | | | | | |
| | | | | | | | | | | | | | | | | | | Total Cost ($4,586,141) | | | | | | | | | | | | Total Cost ($612,000) | | | | | | | | | | | | | | | | | | | | | | Total Cost ($5,198,141) | |
Short-Term U.S. Government Agency Obligations - 11.6 % | | | | | | | | | | | | | | | | | | | | | | | | | | | | | | | | | | | | | | | | | | | | | | | | | | | | | | |
Federal Home Loan Bank Discount Notes | | | 0.33 | % | | | 08/01/2016 | | | | | | 15,300,000 | | | | | | 15,296,710 | | | | | | 47,170,000 | | | | | | 47,159,858 | | | | | | | | | | | | | | | | 62,470,000 | | | | | | 62,456,568 | |
Federal Home Loan Bank Discount Notes | | | 0.33 | % | | | 08/01/2016 | | | | | | 50,000,000 | | | | | | 49,989,250 | | | | | | - | | | | | | - | | | | | | | | | | | | | | | | 50,000,000 | | | | | | 49,989,250 | |
Federal Home Loan Bank Discount Notes | | | 0.34 | % | | | 10/03/2016 | | | | | | 13,200,000 | | | | | | 13,187,592 | | | | | | 8,500,000 | | | | | | 8,492,010 | | | | | | | | | | | | | | | | 21,700,000 | | | | | | 21,679,602 | |
Federal Home Loan Bank Discount Notes | | | 0.34 | % | | | 08/12/2016 | | | | | | 9,708,000 | | | | | | 9,705,165 | | | | | | 3,973,000 | | | | | | 3,971,840 | | | | | | | | | | | | | | | | 13,681,000 | | | | | | 13,677,005 | |
Federal Home Loan Bank Discount Notes | | | 0.34 | % | | | 07/08/2016 | | | | | | - | | | | | | - | | | | | | 5,500,000 | | | | | | 5,499,819 | | | | | | | | | | | | | | | | 5,500,000 | | | | | | 5,499,819 | |
Federal Home Loan Bank Discount Notes | | | 0.35 | % | | | 07/08/2016 | | | | | | 800,000 | | | | | | 799,974 | | | | | | 21,550,000 | | | | | | 21,549,289 | | | | | | | | | | | | | | | | 22,350,000 | | | | | | 22,349,263 | |
Federal Home Loan Bank Discount Notes | | | 0.35 | % | | | 07/29/2016 | | | | | | 4,300,000 | | | | | | 4,299,432 | | | | | | 16,700,000 | | | | | | 16,697,796 | | | | | | | | | | | | | | | | 21,000,000 | | | | | | 20,997,228 | |
Federal Home Loan Bank Discount Notes | | | 0.40 | % | | | 09/07/2016 | | | | | | 24,670,000 | | | | | | 24,656,950 | | | | | | 24,900,000 | | | | | | 24,886,828 | | | | | | | | | | | | | | | | 49,570,000 | | | | | | 49,543,778 | |
Federal Home Loan Bank Discount Notes | | | 0.40 | % | | | 09/16/2016 | | | | | | 21,230,000 | | | | | | 21,217,283 | | | | | | 14,445,000 | | | | | | 14,436,347 | | | | | | | | | | | | | | | | 35,675,000 | | | | | | 35,653,630 | |
Federal Home Loan Bank Discount Notes | | | 0.43 | % | | | 08/12/2016 | | | | | | 1,000,000 | | | | | | 999,708 | | | | | | 9,060,000 | | | | | | 9,057,354 | | | | | | | | | | | | | | | | 10,060,000 | | | | | | 10,057,062 | |
Federal Home Loan Bank Discount Notes | | | 0.47 | % | | | 08/17/2016 | | | | | | - | | | | | | - | | | | | | 150,000 | | | | | | 149,951 | | | | | | | | | | | | | | | | 150,000 | | | | | | 149,951 | |
| | | | | | | | | | | | | | | | | | | | | | | | | | | | |
Total Short-Term U.S. Government Agency Obligations | | | | | | | | | | | | | | | | | | | 140,152,064 | | | | | | | | | | | | 151,901,092 | | | | | | | | | | | | | | | | | | | | | | 292,053,156 | |
| | | | | | | | | | | | | | | | | | | | | | | | | | | | |
| | | | | | | | | | | | | | | | | | | Total Cost ($140,136,694) | | | | | | | | | | | | Total Cost ($151,885,035) | | | | | | | | | | | | | | | | | | | | | | Total Cost ($292,021,729) | |
Short-Term U.S. Government Obligations - 2.0 % | | | | | | | | | | | | | | | | | | | | | | | | | | | | | | | | | | | | | | | | | | | | | | | | | | | | | | |
U.S. Treasury Bill | | | 0.20 | % | | | 08/11/2016 | | | | | | 8,412,000 | | | | | | 8,410,048 | | | | | | - | | | | | | - | | | | | | | | | | | | | | | | 8,412,000 | | | | | | 8,410,048 | |
U.S. Treasury Bill | | | 0.21 | % | | | 07/07/2016 | | | | | | 5,575,000 | | | | | | 5,574,944 | | | | | | - | | | | | | - | | | | | | | | | | | | | | | | 5,575,000 | | | | | | 5,574,944 | |
U.S. Treasury Bill | | | 0.27 | % | | | 08/11/2016 | | | | | | 2,700,000 | | | | | | 2,699,374 | | | | | | - | | | | | | - | | | | | | | | | | | | | | | | 2,700,000 | | | | | | 2,699,374 | |
U.S. Treasury Bill | | | 0.29 | % | | | 08/18/2016 | | | | | | - | | | | | | - | | | | | | 1,365,000 | | | | | | 1,364,582 | | | | | | | | | | | | | | | | 1,365,000 | | | | | | 1,364,582 | |
U.S. Treasury Bill | | | 0.29 | % | | | 10/06/2016 | | | | | | 8,415,000 | | | | | | 8,409,194 | | | | | | 17,330,000 | | | | | | 17,318,042 | | | | | | | | | | | | | | | | 25,745,000 | | | | | | 25,727,236 | |
U.S. Treasury Bill | | | 0.30 | % | | | 08/18/2016 | | | | | | - | | | | | | - | | | | | | 6,460,000 | | | | | | 6,458,023 | | | | | | | | | | | | | | | | 6,460,000 | | | | | | 6,458,023 | |
| | | | | | | | | | | | | | | | | | | | | | | | | | | | |
Total Short-Term U.S. Government Obligations | | | | | | | | | | | | | | | | | | | 25,093,560 | | | | | | | | | | | | 25,140,647 | | | | | | | | | | | | | | | | | | | | | | 50,234,207 | |
| | | | | | | | | | | | | | | | | | | | | | | | | | | | |
| | | | | | | | | | | | | | | | | | | Total Cost ($25,092,620) | | | | | | | | | | | | Total Cost ($25,138,695) | | | | | | | | | | | | | | | | | | | | | | Total Cost ($50,231,315) | |
| | | | | | | | | | | | | | | | | |
| | | | | | | | | | | Shares | | | | | Value | | | | | Shares | | | | | Value | | | | | Shares | | | Value | | | | | Shares | | | | | Value | |
| | | | | | | | | | | | | | | | | | | | | | | | | | | | |
Securities Lending Collateral - 5.1 % | | | | | | | | | | | | | | | | | | | | | | | | | | | | | | | | | | | | | | | | | | | | | | | | | | | | | | |
State Street Navigator Securities Lending Trust - Prime Portfolio | | | 0.51 | % | | | | | | | | | 86,070,228 | | | | | | 86,070,228 | | | | | | 42,194,079 | | | | | | 42,194,079 | | | | | | | | | | | | | | | | 128,264,307 | | | | | | 128,264,307 | |
| | | | | | | | | | | | | | | | | | | | | | | | | | | | |
Total Securities Lending Collateral | | | | | | | | | | | | | | | | | | | 86,070,228 | | | | | | | | | | | | 42,194,079 | | | | | | | | | | | | | | | | | | | | | | 128,264,307 | |
| | | | | | | | | | | | | | | | | | | | | | | | | | | | |
| | | | | | | | | | | | | | | | | | | Total Cost ($86,070,228) | | | | | | | | | | | | Total Cost ($42,194,079) | | | | | | | | | | | | | | | | | | | | | | Total Cost ($128,264,307) | |
| | | | | | | | | | | | | | | | | |
| | | | | | | | | | | Principal | | | | | Value | | | | | Principal | | | | | Value | | | | | Principal | | | Value | | | | | Principal | | | | | Value | |
| | | | | | | | | | | | | | | | | | | | | | | | | | | | |
Repurchase Agreement - 2.3 % | | | | | | | | | | | | | | | | | | | | | | | | | | | | | | | | | | | | | | | | | | | | | | | | | | | | | | |
State Street Bank & Trust Co. | | | 0.03 | % | | | 07/01/2016 | | | | | $ | 23,956,669 | | | | | | 23,956,669 | | | | | $ | 34,059,776 | | | | | | 34,059,776 | | | | | | | | | | | | | | | $ | 58,016,445 | | | | | | 58,016,445 | |
| | | | | | | | | | | | | | | | | | | | | | | | | | | | |
Total Repurchase Agreement | | | | | | | | | | | | | | | | | | | 23,956,669 | | | | | | | | | | | | 34,059,776 | | | | | | | | | | | | | | | | | | | | | | 58,016,445 | |
| | | | | | | | | | | | | | | | | | | | | | | | | | | | |
| | | | | | | | | | | | | | | | | | | Total Cost ($23,956,669) | | | | | | | | | | | | Total Cost ($34,059,776) | | | | | | | | | | | | | | | | | | | | | | Total Cost ($58,016,445) | |
| | | | | | | | | | | | | | | | | | | | | | | | | | | | |
Total Investments | | | | | | | | | | | | | | | | | | | 1,521,572,743 | | | | | | | | | | | | 1,498,510,949 | | | | | | | | | | | | | | | | | | | | | | 3,020,083,692 | |
| | | | | | | | | | | | | | | | | | | | | | | | | | | | |
| | | | | | | | | | | | | | | | | | | Total Cost ($1,494,182,811) | | | | | | | | | | | | Total Cost ($1,469,521,059) | | | | | | | | | | | | | | | | | | | | | | Total Cost ($2,963,703,870) | |
| | | | | | | | | | | | | | | | | |
Other Assets and Liabilities - (19.6)% | | | | | | | | | | | | | | | | | | | (265,780,287) | | | | | | | | | | | | (226,453,587) | | | | | | | | | | (1,710,829) | (a) (c) | | | | | | | | | | | (493,944,703) | |
| | | | | | | | | | | | | | | | | | | | | | | | | | | | | | | | | | | | | | | | | | | | | | | | | | | | | | |
Net Assets | | | | | | | | | | | | | | | | | | | $1,255,792,456 | | | | | | | | | | | | 1,272,057,362 | | | | | | | | | | ($1,710,829) | | | | | | | | | | | | $2,526,138,989 | |
| | | | | | | | | | | | | | | | | | | | | | | | | | | | | | | | | | | | | | | | | | | | | | | | | | | | | | |
S-10
VALUATION SUMMARY:
| | | | | | | | | | | | | | | | | | | | | | | | | | | | | | | | | | | | | | | | | | | | | | | | | | | | | | | | |
| Investments | | Level 1 - Unadjusted
Quoted Prices | | | Level 2 - Other Significant Observable Inputs | | | Level 3 - Significant Unobservable Inputs | | | Value | | | | | | Level 1 - Unadjusted Quoted Prices | | | Level 2 - Other Significant Observable Inputs | | | Level 3 - Significant Unobservable Inputs | | | Value | | | | | | Level 1 - Unadjusted Quoted Prices | | | Level 2 - Other Significant Observable Inputs | | | Level 3 - Significant Unobservable Inputs | | | Value | |
Asset-Backed Securities | | $ | - | | | $ | 77,419,599 | | | $ | - | | | $ | 77,419,599 | | | | | | | $ | - | | | $ | 69,317,501 | | | $ | - | | | $ | 69,317,501 | | | | | | | $ | - | | | $ | 146,737,100 | | | $ | - | | | $ | 146,737,100 | |
Corporate Debt Securities | | | - | | | | 476,942,516 | | | | - | | | | 476,942,516 | | | | | | | | - | | | | 489,252,599 | | | | - | | | | 489,252,599 | | | | | | | | - | | | | 966,195,115 | | | | - | | | | 966,195,115 | |
Foreign Government Obligations | | | - | | | | 18,230,717 | | | | - | | | | 18,230,717 | | | | | | | | - | | | | 9,524,585 | | | | - | | | | 9,524,585 | | | | | | | | - | | | | 27,755,302 | | | | - | | | | 27,755,302 | |
Mortgage-Backed Securities | | | - | | | | 155,526,132 | | | | - | | | | 155,526,132 | | | | | | | | - | | | | 161,450,860 | | | | - | | | | 161,450,860 | | | | | | | | - | | | | 316,976,992 | | | | - | | | | 316,976,992 | |
Municipal Government Obligations | | | - | | | | 7,292,552 | | | | - | | | | 7,292,552 | | | | | | | | - | | | | 4,541,766 | | | | - | | | | 4,541,766 | | | | | | | | - | | | | 11,834,318 | | | | - | | | | 11,834,318 | |
U.S. Government Agency Obligations | | | - | | | | 211,255,490 | | | | - | | | | 211,255,490 | | | | | | | | - | | | | 215,412,159 | | | | - | | | | 215,412,159 | | | | | | | | - | | | | 426,667,649 | | | | - | | | | 426,667,649 | |
U.S. Government Obligations | | | - | | | | 296,386,925 | | | | - | | | | 296,386,925 | | | | | | | | - | | | | 295,096,760 | | | | - | | | | 295,096,760 | | | | | | | | - | | | | 591,483,685 | | | | - | | | | 591,483,685 | |
Preferred Stocks | | | 3,246,291 | | | | - | | | | - | | | | 3,246,291 | | | | | | | | 619,125 | | | | - | | | | - | | | | 619,125 | | | | | | | | 3,865,416 | | | | - | | | | - | | | | 3,865,416 | |
Short-Term U.S. Government Agency Obligations | | | - | | | | 140,152,064 | | | | - | | | | 140,152,064 | | | | | | | | - | | | | 151,901,092 | | | | - | | | | 151,901,092 | | | | | | | | - | | | | 292,053,156 | | | | - | | | | 292,053,156 | |
Short-Term U.S. Government Obligations | | | - | | | | 25,093,560 | | | | - | | | | 25,093,560 | | | | | | | | - | | | | 25,140,647 | | | | - | | | | 25,140,647 | | | | | | | | - | | | | 50,234,207 | | | | - | | | | 50,234,207 | |
Securities Lending Collateral | | | 86,070,228 | | | | - | | | | - | | | | 86,070,228 | | | | | | | | 42,194,079 | | | | - | | | | - | | | | 42,194,079 | | | | | | | | 128,264,307 | | | | - | | | | - | | | | 128,264,307 | |
Repurchase Agreement | | | - | | | | 23,956,669 | | | | - | | | | 23,956,669 | | | | | | | | - | | | | 34,059,776 | | | | - | | | | 34,059,776 | | | | | | | | - | | | | 58,016,445 | | | | - | | | | 58,016,445 | |
Total Investments | | $ | 89,316,519 | | | $ | 1,432,256,224 | | | $ | - | | | $ | 1,521,572,743 | | | | | | | $ | 42,813,204 | | | $ | 1,455,697,745 | | | $ | - | | | $ | 1,498,510,949 | | | | | | | $ | 132,129,723 | | | $ | 2,887,953,969 | | | $ | - | | | $ | 3,020,083,692 | |
(a)-(l) See Note 2 of the Notes to the Pro Forma Financial Statements.
As of June 30, 2016, all securities held by the Target Master Portfolio would comply with the investment restrictions of the Destination Fund.
S-11
Reorganization Between TPP Master, TPFG Feeder, TPFG II Feeder, and TAF Destination
PRO FORMA STATEMENT OF ASSETS AND LIABILITIES
At June 30, 2016
| | | | | | | | | | | | | | | | | | | | | | | | | | | | | | | | | | | | | | | | | | | | | | | | | | | | | | | | | | | | | | | | | | | | |
| | | | | | TPP Master | | | | | | | | | TPFG Feeder | | | | | | | | | TPFG II Feeder | | | | | | | | | TAF Destination | | | | | | | | | Adjustments | | | | | | | | | Combined Pro Forma
Destination | |
Assets: | | | | | | | | | | | | | | | | | | | | | | | | | | | | | | | | | | | | | | | | | | | | | | | | | | | | | | | | | | | | | | | | | | | | |
Investments, at value | | $ | | | | | 1,497,616,074 | | | | | | | $ | | | | | | | | | | | | $ | | | | | | | | | | | | $ | | | | | 1,464,451,173 | | | | | | | $ | | | | | - | | | | | | | $ | | | | | 2,962,067,247 | |
Repurchase agreements, at value | | | | | | | 23,956,669 | | | | | | | | | | | | | | | | | | | | | | | | | | | | | | | | | | | | 34,059,776 | | | | | | | | | | | | - | | | | | | | | | | | | 58,016,445 | |
Investments in Series Portfolio, at value | | | | | | | | | | | | | | | | | | | 382,230,935 | | | | | | | | | | | | 374,966,202 | | | | | | | | | | | | | | | | | | | | | | | | (757,197,137) | | | | (b | ) | | | | | | | - | |
Receivables: | | | | | | | | | | | | | | | | | | | | | | | | | | | | | | | | | | | | | | | | | | | | | | | | | | | | | | | | | | | | | | | | | | | | |
Shares of beneficial interest sold | | | | | | | | | | | | | | | | | | | | | | | | | | | | | | | | | | | | | | | | | | | 5,290 | | | | | | | | | | | | - | | | | | | | | | | | | 5,290 | |
Investments sold | | | | | | | 1,890,756 | | | | | | | | | | | | | | | | | | | | | | | | | | | | | | | | | | | | 3,259,976 | | | | | | | | | | | | - | | | | | | | | | | | | 5,150,732 | |
Interest | | | | | | | 8,016,744 | | | | | | | | | | | | | | | | | | | | | | | | | | | | | | | | | | | | 7,996,173 | | | | | | | | | | | | - | | | | | | | | | | | | 16,012,917 | |
Dividends | | | | | | | | | | | | | | | | | | | | | | | | | | | | | | | | | | | | | | | | | | | 9,375 | | | | | | | | | | | | - | | | | | | | | | | | | 9,375 | |
Tax reclaims | | | | | | | | | | | | | | | | | | | | | | | | | | | | | | | | | | | | | | | | | | | 8,948 | | | | | | | | | | | | - | | | | | | | | | | | | 8,948 | |
Net income from securities lending | | | | | | | 18,088 | | | | | | | | | | | | | | | | | | | | | | | | | | | | | | | | | | | | | | | | | | | | | | | | - | | | | | | | | | | | | 18,088 | |
Due from advisor | | | | | | | | | | | | | | | | | | | | | | | | | | | | | | | 14,905 | | | | | | | | | | | | | | | | | | | | | | | | - | | | | | | | | | | | | 14,905 | |
Prepaid Expenses | | | | | | | 4,369 | | | | | | | | | | | | 1,567 | | | | | | | | | | | | 1,394 | | | | | | | | | | | | 3,938 | | | | | | | | | | | | - | | | | | | | | | | | | 11,268 | |
| | | | | | | | | | | | | | | | | | | | | | | | | | | | | | | | | | | | | | | | | | | | |
Total assets | | $ | | | | | 1,531,502,700 | | | | | | | $ | | | | | 382,232,502 | | | | | | | $ | | | | | 374,982,501 | | | | | | | $ | | | | | 1,509,794,649 | | | | | | | $ | | | | | (757,197,137) | | | | | | | $ | | | | | 3,041,315,215 | |
| | | | | | | | | | | | | | | | | | | | | | | | | | | | | | | | | | | | | | | | | | | | |
| | | | | | | | | | | | | | | | | |
Liabilities: | | | | | | | | | | | | | | | | | | | | | | | | | | | | | | | | | | | | | | | | | | | | | | | | | | | | | | | | | | | | | | | | | | | | |
Due to custodian | | | | | | | 12,860,424 | | | | | | | | | | | | | | | | | | | | | | | | | | | | | | | | | | | | 8,492,598 | | | | | | | | | | | | - | | | | | | | | | | | | 21,353,022 | |
Cash deposit due to broker | | | | | | | | | | | | | | | | | | | | | | | | | | | | | | | | | | | | | | | | | | | 616,000 | | | | | | | | | | | | - | | | | | | | | | | | | 616,000 | |
Payables and other liabilities: | | | | | | | | | | | | | | | | | | | | | | | | | | | | | | | | | | | | | | | | | | | | | | | | | | | | | | | | | | | | | | | | | | | | |
Shares of beneficial interest redeemed | | | | | | | | | | | | | | | | | | | 246,044 | | | | | | | | | | | | 1,047,896 | | | | | | | | | | | | 41 | | | | | | | | | | | | - | | | | | | | | | | | | 1,293,981 | |
Investments purchased | | | | | | | 6,233,310 | | | | | | | | | | | | | | | | | | | | | | | | | | | | | | | | | | | | 186,003,393 | | | | | | | | | | | | - | | | | | | | | | | | | 192,236,703 | |
When-issued, delay-delivery, and forward commitment securities purchased | | | | | | | 169,737,326 | | | | | | | | | | | | | | | | | | | | | | | | | | | | | | | | | | | | | | | | | | | | | | | | - | | | | | | | | | | | | 169,737,326 | |
Investment advisory fees | | | | | | | 360,509 | | | | | | | | | | | | | | | | | | | | | | | | | | | | | | | | | | | | 393,694 | | | | | | | | | | | | - | | | | | | | | | | | | 754,203 | |
Administration/Investment advisory fees | | | | | | | | | | | | | | | | | | | 93,438 | | | | | | | | | | | | 15,266 | | | | | | | | | | | | | | | | | | | | | | | | - | | | | | | | | | | | | 108,704 | |
Distribution and service fees | | | | | | | | | | | | | | | | | | | 77,865 | | | | | | | | | | | | 76,329 | | | | | | | | | | | | 377 | | | | | | | | | | | | - | | | | | | | | | | | | 154,571 | |
Transfer agent fees | | | | | | | | | | | | | | | | | | | | | | | | | | | | | | | | | | | | | | | | | | | 7,770 | | | | | | | | | | | | - | | | | | | | | | | | | 7,770 | |
Trustee, CCO and deferred compensation fees | | | | | | | 2,483 | | | | | | | | | | | | 951 | | | | | | | | | | | | 895 | | | | | | | | | | | | 108 | | | | | | | | | | | | - | | | | | | | | | | | | 4,437 | |
Audit and tax fees | | | | | | | 13,813 | | | | | | | | | | | | 9,156 | | | | | | | | | | | | 9,117 | | | | | | | | | | | | 14,800 | | | | | | | | | | | | - | | | | | | | | | | | | 46,886 | |
Custody and accounting fees | | | | | | | 41,823 | | | | | | | | | | | | 1,831 | | | | | | | | | | | | 1,831 | | | | | | | | | | | | | | | | | | | | | | | | - | | | | | | | | | | | | 45,485 | |
Legal fees | | | | | | | 21,057 | | | | | | | | | | | | 6,282 | | | | | | | | | | | | 6,725 | | | | | | | | | | | | 3,181 | | | | | | | | | | | | - | | | | | | | | | | | | 37,245 | |
Printing and shareholder reports fees | | | | | | | 8,169 | | | | | | | | | | | | 13,661 | | | | | | | | | | | | 7,733 | | | | | | | | | | | | 165 | | | | | | | | | | | | - | | | | | | | | | | | | 29,728 | |
Registration fees | | | | | | | | | | | | | | | | | | | 6,526 | | | | | | | | | | | | 10,934 | | | | | | | | | | | | 10,943 | | | | | | | | | | | | - | | | | | | | | | | | | 28,403 | |
Dividends, interest and fees for borrowings from securities sold short | | | | | | | | | | | | | | | | | | | | | | | | | | | | | | | 3,401 | | | | | | | | | | | | | | | | | | | | | | | | - | | | | | | | | | | | | 3,401 | |
Other | | | | | | | 8,102 | | | | | | | | | | | | 3,326 | | | | | | | | | | | | | | | | | | | | | | | | 137 | | | | | | | | | | | | 89,488 | | | | (c | ) | | | | | | | 101,053 | |
Variation margin payable | | | | | | | 353,000 | | | | | | | | | | | | | | | | | | | | | | | | | | | | | | | | | | | | | | | | | | | | | | | | - | | | | | | | | | | | | 353,000 | |
Collateral for securities on loan | | | | | | | 86,070,228 | | | | | | | | | | | | | | | | | | | | | | | | | | | | | | | | | | | | 42,194,080 | | | | | | | | | | | | - | | | | | | | | | | | | 128,264,308 | |
| | | | | | | | | | | | | | | | | | | | | | | | | | | | | | | | | | | | | | | | | | | | |
Total liabilities | | | | | | | 275,710,244 | | | | | | | | | | | | 459,080 | | | | | | | | | | | | 1,180,127 | | | | | | | | | | | | 237,737,287 | | | | | | | | | | | | 89,488 | | | | | | | | | | | | 515,176,226 | |
| | | | | | | | | | | | | | | | | | | | | | | | | | | | | | | | | | | | | | | | | | | | |
Net Assets | | $ | | | | | 1,255,792,456 | | | | | | | $ | | | | | 381,773,422 | | | | | | | $ | | | | | 373,802,374 | | | | | | | $ | | | | | 1,272,057,362.00 | | | | | | | $ | | | | | (757,286,625) | | | | | | | $ | | | | | 2,526,138,989 | |
| | | | | | | | | | | | | | | | | | | | | | | | | | | | | | | | | | | | | | | | | | | | |
| | | | | | | | | | | | | | | | | |
Net Assets Consist of: | | | | | | | | | | | | | | | | | | | | | | | | | | | | | | | | | | | | | | | | | | | | | | | | | | | | | | | | | | | | | | | | | | | | |
Paid-in capital | | $ | | | | | (27,407,350) | | | | | | | | | | | | 375,645,517 | | | | | | | | | | | | 362,058,316 | | | | | | | | | | | | 1,240,768,491 | | | | | | | $ | | | | | 527,473,617 | | | | (d | ) | | $ | | | | | 2,478,538,591 | |
Undistributed (distributions in excess of) net investment income (loss) | | | | | | | 1,091,916,672 | | | | | | | | | | | | 23,772 | | | | | | | | | | | | 28,841 | | | | | | | | | | | | (394,383) | | | | | | | | | | | | (1,091,969,285) | | | | (d | ) | | | | | | | (394,383) | |
Accumulated net realized gain (loss) | | | | | | | 163,893,202 | | | | | | | | | | | | 1,102,664 | | | | | | | | | | | | 405,159 | | | | | | | | | | | | 2,693,369 | | | | | | | | | | | | (165,401,025) | | | | (d | ) | | | | | | | 2,693,369 | |
Net unrealized appreciation (depreciation) on: | | | | | | | | | | | | | | | | | | | | | | | | | | | | | | | | | | | | | | | | | | | | | | | | | | | | | | | | | | | | | | | | | | | | |
Investments | | | | | | | 27,389,932 | | | | | | | | | | | | | | | | | | | | | | | | | | | | | | | | | | | | 28,989,885 | | | | | | | | | | | | (27,389,932) | | | | (d | ) | | | | | | | 28,989,885 | |
Allocated from Series Portfolio | | | | | | | | | | | | | | | | | | | 5,001,469 | | | | | | | | | | | | 11,310,058 | | | | | | | | | | | | - | | | | | | | | | | | | - | | | | | | | | | | | | 16,311,527 | |
| | | | | | | | | | | | | | | | | |
Net Assets | | $ | | | | | 1,255,792,456 | | | | | | | $ | | | | | 381,773,422 | | | | | | | $ | | | | | 373,802,374�� | | | | | | | $ | | | | | 1,272,057,362 | | | | | | | $ | | | | | (757,286,625) | | | | (d | ) | | $ | | | | | 2,526,138,989 | |
| | | | | | | | | | | | | | | | | | | | | | | | | | | | | | | | | | | | | | | | | | | | |
| | | | | | | - | | | | | | | | | | | | - | | | | | | | | | | | | - | | | | | | | | | | | | - | | | | | | | | | | | | - | | | | | | | | | | | | | |
Net assets by class: | | | | | | | | | | | | | | | | | | | - | | | | | | | | | | | | - | | | | | | | | | | | | - | | | | | | | | | | | | | | | | | | | | | | | | | |
Class I2 | | $ | | | | | - | | | | | | | $ | | | | | - | | | | | | | $ | | | | | - | | | | | | | $ | | | | | 1,272,057,362 | | | | | | | $ | | | | | - | | | | | | | $ | | | | | 1,272,057,362 | |
Class I3 | | | | | | | 498,595,319 | | | | | | | | | | | | - | | | | | | | | | | | | - | | | | | | | | | | | | - | | | | | | | | | | | | (89,488) | | | | (c | ) | | | | | | | 498,505,831 | |
Class R | | | | | | | - | | | | | | | | | | | | 381,773,422 | | | | | | | | | | | | - | | | | | | | | | | | | - | | | | | | | | | | | | - | | | | | | | | | | | | 381,773,422 | |
Class R4 | | | | | | | - | | | | | | | | | | | | - | | | | | | | | | | | | 373,802,374 | | | | | | | | | | | | - | | | | | | | | | | | | - | | | | | | | | | | | | 373,802,374 | |
Shares outstanding (unlimited shares, no par value): | | | | | | | | | | | | | | | | | | | | | | | | | | | | | | | | | | | | | | | | | | | | | | | | | | | | | | | | | | | | | | | | | | | | |
Class I2 | | | | | | | - | | | | | | | | | | | | - | | | | | | | | | | | | - | | | | | | | | | | | | 122,559,850 | | | | | | | | | | | | - | | | | | | | | | | | | 122,559,850 | |
Class I3 | | | | | | | 48,034,231 | | | | | | | | | | | | - | | | | | | | | | | | | - | | | | | | | | | | | | - | | | | | | | | | | | | - | | | | | | | | | | | | 48,034,231 | |
Class R | | | | | | | - | | | | | | | | | | | | 28,698,327 | | | | | | | | | | | | - | | | | | | | | | | | | - | | | | | | | | | | | | 8,081,386 | | | | (e | ) | | | | | | | 36,779,713 | |
Class R4 | | | | | | | - | | | | | | | | | | | | - | | | | | | | | | | | | 33,963,361 | | | | | | | | | | | | - | | | | | | | | | | | | 2,048,428 | | | | (e | ) | | | | | | | 36,011,789 | |
Net asset value per share: | | | | | | | | | | | | | | | | | | | | | | | | | | | | | | | | | | | | | | | | | | | | | | | | | | | | | | | | | | | | | | | | | | | | |
Class I2 | | $ | | | | | - | | | | | | | $ | | | | | - | | | | | | | $ | | | | | - | | | | | | | $ | | | | | 10.38 | | | | | | | $ | | | | | - | | | | | | | $ | | | | | 10.38 | |
Class I3 | | | | | | | 10.38 | | | | | | | | | | | | - | | | | | | | | | | | | - | | | | | | | | | | | | 10.38 | | | | | | | | | | | | (10.38) | | | | (f | ) | | | | | | | 10.38 | |
Class R | | | | | | | - | | | | | | | | | | | | 13.30 | | | | | | | | | | | | - | | | | | | | | | | | | 10.38 | | | | | | | | | | | | (13.30) | | | | (f | ) | | | | | | | 10.38 | |
Class R4 | | | | | | | - | | | | | | | | | | | | - | | | | | | | | | | | | 11.01 | | | | | | | | | | | | 10.38 | | | | | | | | | | | | (11.01) | | | | (f | ) | | | | | | | 10.38 | |
| | | | | | | | | | | |
| | | | | | | | | | | | | | | | | | | | | | | | | | | | | | | | | | | | | | | | | | | | |
Investments, at cost | | $ | | | | | 1,470,226,142 | | | | | | | $ | | | | | - | | | | | | | $ | | | | | - | | | | | | | $ | | | | | 1,435,461,283 | | | | | | | | | | | | - | | | | | | | $ | | | | | 2,905,687,425 | |
Securities loaned, at value | | | | | | | 84,321,136 | | | | | | | | | | | | - | | | | | | | | | | | | - | | | | | | | | | | | | 41,340,047 | | | | | | | | | | | | - | | | | | | | | | | | | 125,661,183 | |
Repurchase agreements, at cost | | | | | | | 23,956,669 | | | | | | | | | | | | - | | | | | | | | | | | | - | | | | | | | | | | | | 34,059,776 | | | | | | | | | | | | - | | | | | | | | | | | | 58,016,445 | |
(a)-(l) See Note 2 of the Notes to the Pro Forma Financial Statements.
THE NOTES TO THE PRO FORMA FINANCIAL STATEMENTS ARE AN INTEGRAL PART OF THIS REPORT.
S-12
Reorganization Between TPP Master, TPFG Feeder, TPFG II Feeder and TAF Destination
PRO FORMA STATEMENT OF OPERATIONS
For the twelve-month period ended June 30, 2016
| | | | | | | | | | | | | | | | | | | | | | | | | | | | | | | | | | | | | | | | | | | | | | | | | | | | | | | | | | | | | | | | | | | | |
| | | | | | TPP Master | | | | | | | | | TPFG Feeder | | | | | | | | | TPFG II Feeder | | | | | | | | | TAF Destination | | | | | | | | | Adjustments | | | | | | | | | Combined Pro
Forma Destination | |
Investment Income: | | | | | | | | | | | | | | | | | | | | | | | | | | | | | | | | | | | | | | | | | | | | | | | | | | | | | | | | | | | | | | | | | | | | |
| | | | | | | | | | | | | | | | | |
Dividend income | | $ | | | | | 157,335 | | | | | | | $ | | | | | 47,035 | | | | | | | $ | | | | | 45,633 | | | | | | | $ | | | | | 37,500 | | | | | | | $ | | | | | (92,668) | | | | (b) | | | $ | | | | | 194,835 | |
Interest income | | | | | | | 36,081,641 | | | | | | | | | | | | 10,782,389 | | | | | | | | | | | | 10,460,530 | | | | | | | | | | | | 22,821,265 | | | | | | | | | | | | (21,242,919) | | | | (b) | | | | | | | | 58,902,906 | |
Net income (loss) from securities lending | | | | | | | 144,956 | | | | | | | | | | | | 43,267 | | | | | | | | | | | | 42,176 | | | | | | | | | | | | 38,066 | | | | | | | | | | | | (85,443) | | | | (b) | | | | | | | | 183,022 | |
Withholding taxes on foreign income | | | | | | | 998 | | | | | | | | | | | | 288 | | | | | | | | | | | | 293 | | | | | | | | | | | | - | | | | | | | | | | | | (581) | | | | (b) | | | | | | | | 998 | |
Expenses (net of waiver and/or reimbursement) | | | | | | | - | | | | | | | | | | | | (1,438,994) | | | | | | | | | | | | (1,396,085) | | | | | | | | | | | | - | | | | | | | | | | | | 2,835,079 | | | | (b) | | | | | | | | - | |
| | | | | | | | | | | | | | | | | | | | | | | | | | | | | | | | | | | | | | | | | | | | |
Total investment income (loss) | | | | | | | 36,384,930 | | | | | | | | | | | | 9,433,985 | | | | | | | | | | | | 9,152,547 | | | | | | | | | | | | 22,896,831 | | | | | | | | | | | | (18,586,532) | | | | | | | | | | | | 59,281,761 | |
| | | | | | | | | | | | | | | | | | | | | | | | | | | | | | | | | | | | | | | | | | | | |
| | | | | | | | | | | | | | | | | |
Expenses: | | | | | | | | | | | | | | | | | | | | | | | | | | | | | | | | | | | | | | | | | | | | | | | | | | | | | | | | | | | | | | | | | | | | |
Investment advisory fees | | | | | | | 4,537,004 | | | | | | | | | | | | - | | | | | | | | | | | | - | | | | | | | | | | | | 1,871,769 | | | | | | | | | | | | 540,329 | | | | (g) | | | | | | | | 6,949,102 | |
Investment management fees | | | | | | | - | | | | | | | | | | | | - | | | | | | | | | | | | - | | | | | | | | | | | | 1,526,013 | | | | | | | | | | | | - | | | | | | | | | | | | 1,526,013 | |
Administration/Investment advisory fees | | | | | | | - | | | | | | | | | | | | 1,160,357 | | | | | | | | | | | | 187,740 | | | | | | | | | | | | - | | | | | | | | | | | | (1,348,097) | | | | (h) | | | | | | | | - | |
Distribution and service fees: | | | | | | | | | | | | | | | | | | | | | | | | | | | | | | | | | | | | | | | | | | | | | | | | | | | | | | | | | | | | | | | | | | | | |
Class R | | | | | | | - | | | | | | | | | | | | 966,965 | | | | | | | | | | | | - | | | | | | | | | | | | - | | | | | | | | | | | | 964,275 | | | | (i) | | | | | | | | 1,931,240 | |
Class R4 | | | | | | | - | | | | | | | | | | | | - | | | | | | | | | | | | 938,700 | | | | | | | | | | | | - | | | | | | | | | | | | (1,328) | | | | (i) | | | | | | | | 937,372 | |
Administration fees | | | | | | | - | | | | | | | | | | | | - | | | | | | | | | | | | - | | | | | | | | | | | | 158,052 | | | | | | | | | | | | (158,052) | | | | (h) | | | | | | | | - | |
Transfer agent fees: | | | | | | | | | | | | | | | | | | | | | | | | | | | | | | | | | | | | | | | | | | | | | | | | | | | | | | | | | | | | | | | | | | | | |
Class I2 | | | | | | | - | | | | | | | | | | | | - | | | | | | | | | | | | - | | | | | | | | | | | | 70,229 | | | | | | | | | | | | | | | | | | | | | | | | 70,229 | |
Trustee, CCO and deferred compensation fees | | | | | | | 21,214 | | | | | | | | | | | | 7,557 | | | | | | | | | | | | 6,874 | | | | | | | | | | | | 13,889 | | | | | | | | | | | | - | | | | | | | | | | | | 49,534 | |
Audit and tax fees | | | | | | | 28,189 | | | | | | | | | | | | 18,224 | | | | | | | | | | | | 17,430 | | | | | | | | | | | | 35,454 | | | | | | | | | | | | (36,266) | | | | (j) | | | | | | | | 63,031 | |
Custody fees | | | | | | | 159,825 | | | | | | | | | | | | 11,276 | | | | | | | | | | | | 11,278 | | | | | | | | | | | | 93,829 | | | | | | | | | | | | (85,295) | | | | (k) | | | | | | | | 190,913 | |
Legal fees | | | | | | | 45,708 | | | | | | | | | | | | 16,652 | | | | | | | | | | | | 14,455 | | | | | | | | | | | | 26,712 | | | | | | | | | | | | - | | | | | | | | | | | | 103,527 | |
Printing and shareholder reports fees | | | | | | | 5,285 | | | | | | | | | | | | 50,880 | | | | | | | | | | | | 28,130 | | | | | | | | | | | | 6,102 | | | | | | | | | | | | - | | | | | | | | | | | | 90,397 | |
Registration fees | | | | | | | - | | | | | | | | | | | | 30,590 | | | | | | | | | | | | 35,315 | | | | | | | | | | | | 29 | | | | | | | | | | | | | | | | | | | | | | | | 65,934 | |
Other | | | | | | | 22,109 | | | | | | | | | | | | 10,863 | | | | | | | | | | | | 10,957 | | | | | | | | | | | | 11,114 | | | | | | | | | | | | - | | | | | | | | | | | | 55,043 | |
| | | | | | | | | | | | | | | | | | | | | | | | | | | | | | | | | | | | | | | | | | | | |
Total expenses before waiver and/or reimbursement and recapture | | | | | | | 4,819,334 | | | | | | | | | | | | 2,273,364 | | | | | | | | | | | | 1,250,879 | | | | | | | | | | | | 3,813,192 | | | | | | | | | | | | (124,435) | | | | | | | | | | | | 12,032,334 | |
Expenses waived and/or reimbursed: | | | | | | | | | | | | | | | | | | | | | | | | | | | | | | | | | | | | | | | | | | | | | | | | | | | | | | | | | | | | | | | | | | | | |
Class I3 | | | | | | | - | | | | | | | | | | | | - | | | | | | | | | | | | - | | | | | | | | | | | | - | | | | | | | | | | | | (41,202) | | | | (l) | | | | | | | | (41,202) | |
Class R4 | | | | | | | - | | | | | | | | | | | | - | | | | | | | | | | | | (206,122) | | | | | | | | | | | | - | | | | | | | | | | | | 177,152 | | | | (l) | | | | | | | | (28,970) | |
| | | | | | | | | | | | | | | | | | | | | | | | | | | | | | | | | | | | | | | | | | | | | | | | | | | | | | | | | | | | | | | | | | | | |
Net expenses | | | | | | | 4,819,334 | | | | | | | | | | | | 2,273,364 | | | | | | | | | | | | 1,044,757 | | | | | | | | | | | | 3,813,192 | | | | | | | | | | | | 11,516 | | | | | | | | | | | | 11,962,163 | |
| | | | | | | | | | | | | | | | | |
Net investment income (loss) | | | | | | | 31,565,596 | | | | | | | | | | | | 7,160,621 | | | | | | | | | | | | 8,107,790 | | | | | | | | | | | | 19,083,639 | | | | | | | | | | | | (18,598,048) | | | | | | | | | | | | 47,319,598 | |
| | | | | | | | | | | | | | | | | | | | | | | | | | | | | | | | | | | | | | | | | | | | |
| | | | | | | | | | | | | | | | | |
Net realized gain (loss) on: | | | | | | | | | | | | | | | | | | | | | | | | | | | | | | | | | | | | | | | | | | | | | | | | | | | | | | | | | | | | | | | | | | | | |
Allocated from series portfolio | | | | | | | - | | | | | | | | | | | | 1,507,924 | | | | | | | | | | | | 1,439,764 | | | | | | | | | | | | - | | | | | | | | | | | | (2,947,688) | | | | (b) | | | | | | | | - | |
Investments | | | | | | | 4,998,589 | | | | | | | | | | | | - | | | | | | | | | | | | - | | | | | | | | | | | | 3,531,489 | | | | | | | | | | | | - | | | | | | | | | | | | 8,530,078 | |
| | | | | | | | | | | | | | | | | | | | | | | | | | | | | | | | | | | | | | | | | | | | |
Net realized gain (loss) | | | | | | | 4,998,589 | | | | | | | | | | | | 1,507,924 | | | | | | | | | | | | 1,439,764 | | | | | | | | | | | | 3,531,489 | | | | | | | | | | | | (2,947,688) | | | | | | | | | | | | 8,530,078 | |
| | | | | | | | | | | | | | | | | | | | | | | | | | | | | | | | | | | | | | | | | | | | |
| | | | | | | | | | | | | | | | | |
Net change in unrealized appreciation (depreciation) on: | | | | | | | | | | | | | | | | | | | | | | | | | | | | | | | | | | | | | | | | | | | | | | | | | | | | | | | | | | | | | | | | | | | | |
Allocated from series portfolio | | | | | | | - | | | | | | | | | | | | 9,804,587 | | | | | | | | | | | | 9,414,907 | | | | | | | | | | | | - | | | | | | | | | | | | (19,219,494) | | | | (b) | | | | | | | | - | |
Investments | | | | | | | 32,516,525 | | | | | | | | | | | | - | | | | | | | | | | | | - | | | | | | | | | | | | 34,540,547 | | | | | | | | | | | | - | | | | | | | | | | | | 67,057,072 | |
| | | | | | | | | | | | | | | | | | | | | | | | | | | | | | | | | | | | | | | | | | | | |
Net change in unrealized appreciation (depreciation) | | | | | | | 32,516,525 | | | | | | | | | | | | 9,804,587 | | | | | | | | | | | | 9,414,907 | | | | | | | | | | | | 34,540,547 | | | | | | | | | | | | (19,219,494) | | | | | | | | | | | | 67,057,072 | |
| | | | | | | | | | | | | | | | | | | | | | | | | | | | | | | | | | | | | | | | | | | | |
| | | | | | | | | | | | | | | | | |
Net realized and change in unrealized gain (loss) | | | | | | | 37,515,114 | | | | | | | | | | | | 11,312,511 | | | | | | | | | | | | 10,854,671 | | | | | | | | | | | | 38,072,036 | | | | | | | | | | | | (22,167,182) | | | | | | | | | | | | 75,587,150 | |
| | | | | | | | | | | | | | | | | | | | | | | | | | | | | | | | | | | | | | | | | | | | |
| | | | | | | | | | | | | | | | | |
Net increase (decrease) in net assets resulting from operations | | $ | | | | | 69,080,710 | | | | | | | $ | | | | | 18,473,132 | | | | | | | $ | | | | | 18,962,461 | | | | | | | $ | | | | | 57,155,675 | | | | | | | $ | | | | | (40,765,230) | | | | | | | $ | | | | | 122,906,748 | |
| | | | | | | | | | | | | | | | | | | | | | | | | | | | | | | | | | | | | | | | | | | | |
(a)-(l) See Note 2 of the Notes to the Pro Forma Financial Statements.
THE NOTES TO THE PRO FORMA FINANCIAL STATEMENTS ARE AN INTEGRAL PART OF THIS REPORT.
S-13
Group Two Reorganization Between:
TRANSAMERICA PARTNERS GOVERNMENT MONEY MARKET
TRANSAMERICA PARTNERS INSTITUTIONAL GOVERNMENT MONEY MARKET
TRANSAMERICA PARTNERS GOVERNMENT MONEY MARKET PORTFOLIO
AND
TRANSAMERICA GOVERNMENT MONEY MARKET
PRO FORMA SCHEDULE OF INVESTMENTS
At June 30, 2016
Reorganization Between TPP Master and TAF
PRO FORMA SCHEDULE OF INVESTMENTS
At June 30, 2016
| | | | | | | | | | | | | | | | | | | | | | | | | | | | | | | | | | | | | | | | | | | | | | | | | | | | | | |
| | | | | | | | | | | TPP Master | | | | | TAF Destination | | | | | Adjustments | | | | | Combined Pro Forma Destination | |
| | | | | | | | | | | | | | | | | |
| | | Coupon Rate | | | Maturity Date | | | | | Principal | | | | | Value | | | | | Principal | | | | | Value | | | | | Principal | | | Value | | | | | Principal | | | | | Value | |
| | | | | | | | | | | | | | | | | | | | | | | | | | | | |
U.S. Government Agency Obligations - 8.8 % | | | | | | | | | | | | | | | | | | | | | | | | | | | | | | | | | | | | | | | | | | | | | | | | | | | | | | |
Federal Farm Credit Banks | | | 0.48 | % | | | 03/29/2017 | | | | | $ | 10,125,000 | | | | | $ | 10,121,462 | | | | | $ | 2,700,000 | | | | | $ | 2,699,057 | | | | | | | | | | | | | | | $ | 12,825,000 | | | | | $ | 12,820,519 | |
Federal Farm Credit Banks | | | 0.48 | % | | | 04/20/2017 | | | | | | 350,000 | | | | | | 349,858 | | | | | | 100,000 | | | | | | 99,959 | | | | | | | | | | | | | | | | 450,000 | | | | | | 449,817 | |
Federal Farm Credit Banks | | | 0.49 | % | | | 02/13/2017 | | | | | | 2,410,000 | | | | | | 2,409,561 | | | | | | 640,000 | | | | | | 639,883 | | | | | | | | | | | | | | | | 3,050,000 | | | | | | 3,049,444 | |
Federal Farm Credit Banks | | | 0.50 | % | | | 04/17/2017 | | | | | | 5,950,000 | | | | | | 5,949,094 | | | | | | 1,580,000 | | | | | | 1,579,759 | | | | | | | | | | | | | | | | 7,530,000 | | | | | | 7,528,853 | |
Federal Farm Credit Banks | | | 0.50 | % | | | 06/22/2017 | | | | | | 12,100,000 | | | | | | 12,098,807 | | | | | | 3,200,000 | | | | | | 3,199,684 | | | | | | | | | | | | | | | | 15,300,000 | | | | | | 15,298,491 | |
Federal Farm Credit Banks | | | 0.57 | % | | | 11/13/2017 | | | | | | 12,100,000 | | | | | | 12,100,859 | | | | | | 3,200,000 | | | | | | 3,200,227 | | | | | | | | | | | | | | | | 15,300,000 | | | | | | 15,301,086 | |
Federal Farm Credit Banks | | | 0.58 | % | | | 08/01/2017 | | | | | | 2,740,000 | | | | | | 2,740,308 | | | | | | 720,000 | | | | | | 720,081 | | | | | | | | | | | | | | | | 3,460,000 | | | | | | 3,460,389 | |
Federal Home Loan Banks | | | 0.61 | % | | | 10/04/2017 | | | | | | 24,000,000 | | | | | | 24,004,864 | | | | | | 6,500,000 | | | | | | 6,501,317 | | | | | | | | | | | | | | | | 30,500,000 | | | | | | 30,506,181 | |
Federal Home Loan Banks | | | 0.64 | % | | | 08/25/2017 | | | | | | 9,600,000 | | | | | | 9,604,841 | | | | | | 2,600,000 | | | | | | 2,601,315 | | | | | | | | | | | | | | | | 12,200,000 | | | | | | 12,206,153 | |
| | | | | | | | | | | | | | | | | | | | | | | | | | | | |
Total U.S. Government Agency Obligations | | | | | | | | | | | | | | | | | | | 79,379,654 | | | | | | | | | | | | 21,241,282 | | | | | | | | | | - | | | | | | | | | | | | 100,620,936 | |
| | | | | | | | | | | | | | | | | | | | | | | | | | | | |
| | | | | | | | | | | | | | | | | | | Total Cost ($79,379,654) | | | | | | | | | | | | Total Cost ($21,241,282) | | | | | | | | | | | | | | | | | | | | | | Total Cost ($100,620,936) | |
Short-Term U.S. Government Agency Obligations - 49.3 % | | | | | | | | | | | | | | | | | | | | | | | | | | | | | | | | | | | | | | | | | | | | | | | | | | | | | | |
Federal Agricultural Mortgage Corp. | | | 0.49 | % | | | 05/09/2017 | | | | | | 12,200,000 | | | | | | 12,198,943 | | | | | | 3,400,000 | | | | | | 3,399,705 | | | | | | | | | | | | | | | | 15,600,000 | | | | | | 15,598,648 | |
Federal Agricultural Mortgage Corp. Discount Notes | | | 0.40 | % | | | 10/11/2016 | | | | | | 24,750,000 | | | | | | 24,722,651 | | | | | | 6,750,000 | | | | | | 6,742,541 | | | | | | | | | | | | | | | | 31,500,000 | | | | | | 31,465,192 | |
Federal Agricultural Mortgage Corp. Discount Notes | | | 0.43 | % | | | 09/08/2016 | | | | | | 2,885,000 | | | | | | 2,882,678 | | | | | | 760,000 | | | | | | 759,388 | | | | | | | | | | | | | | | | 3,645,000 | | | | | | 3,642,066 | |
Federal Farm Credit Banks | | | 0.47 | % | | | 02/15/2017 | | | | | | 24,100,000 | | | | | | 24,098,467 | | | | | | 6,400,000 | | | | | | 6,399,593 | | | | | | | | | | | | | | | | 30,500,000 | | | | | | 30,498,060 | |
Federal Farm Credit Discount Notes | | | 0.49 | % | | | 11/01/2016 | | | | | | 24,500,000 | | | | | | 24,459,820 | | | | | | 6,250,000 | | | | | | 6,239,750 | | | | | | | | | | | | | | | | 30,750,000 | | | | | | 30,699,570 | |
Federal Farm Credit Discount Notes | | | 0.50 | % | | | 11/14/2016 | | | | | | 12,100,000 | | | | | | 12,077,602 | | | | | | 3,200,000 | | | | | | 3,194,076 | | | | | | | | | | | | | | | | 15,300,000 | | | | | | 15,271,678 | |
Federal Home Loan Bank Discount Notes | | | 0.30 | % | | | 07/29/2016 | | | | | | 11,228,000 | | | | | | 11,225,468 | | | | | | 3,013,000 | | | | | | 3,012,320 | | | | | | | | | | | | | | | | 14,241,000 | | | | | | 14,237,788 | |
Federal Home Loan Bank Discount Notes | | | 0.31 | % | | | 07/29/2016 | | | | | | 15,583,000 | | | | | | 15,579,364 | | | | | | 4,182,000 | | | | | | 4,181,024 | | | | | | | | | | | | | | | | 19,765,000 | | | | | | 19,760,388 | |
Federal Home Loan Bank Discount Notes | | | 0.33 | % | | | 08/10/2016 | | | | | | 14,750,000 | | | | | | 14,744,756 | | | | | | 4,100,000 | | | | | | 4,098,542 | | | | | | | | | | | | | | | | 18,850,000 | | | | | | 18,843,298 | |
Federal Home Loan Bank Discount Notes | | | 0.33 | % | | | 08/16/2016 | | | | | | 29,700,000 | | | | | | 29,687,856 | | | | | | 7,400,000 | | | | | | 7,396,974 | | | | | | | | | | | | | | | | 37,100,000 | | | | | | 37,084,830 | |
Federal Home Loan Bank Discount Notes | | | 0.33 | % | | | 08/19/2016 | | | | | | 26,000,000 | | | | | | 25,988,499 | | | | | | 7,000,000 | | | | | | 6,996,903 | | | | | | | | | | | | | | | | 33,000,000 | | | | | | 32,985,402 | |
Federal Home Loan Bank Discount Notes | | | 0.35 | % | | | 07/11/2016 | | | | | | 24,100,000 | | | | | | 24,097,724 | | | | | | 6,400,000 | | | | | | 6,399,396 | | | | | | | | | | | | | | | | 30,500,000 | | | | | | 30,497,120 | |
Federal Home Loan Bank Discount Notes | | | 0.35 | % | | | 07/06/2016 | | | | | | 43,800,000 | | | | | | 43,797,921 | | | | | | 11,375,000 | | | | | | 11,374,460 | | | | | | | | | | | | | | | | 55,175,000 | | | | | | 55,172,381 | |
Federal Home Loan Bank Discount Notes | | | 0.40 | % | | | 09/09/2016 | | | | | | 24,000,000 | | | | | | 23,981,613 | | | | | | 8,000,000 | | | | | | 7,993,871 | | | | | | | | | | | | | | | | 32,000,000 | | | | | | 31,975,484 | |
Federal Home Loan Bank Discount Notes | | | 0.46 | % | | | 09/02/2016 | | | | | | 22,500,000 | | | | | | 22,482,084 | | | | | | 6,200,000 | | | | | | 6,195,063 | | | | | | | | | | | | | | | | 28,700,000 | | | | | | 28,677,147 | |
Federal Home Loan Bank Discount Notes | | | 0.55 | % | | | 11/10/2016 | | | | | | 24,000,000 | | | | | | 23,952,480 | | | | | | 6,500,000 | | | | | | 6,487,130 | | | | | | | | | | | | | | | | 30,500,000 | | | | | | 30,439,610 | |
Federal Home Loan Banks | | | 0.39 | % | | | 07/22/2016 | | | | | | 19,300,000 | | | | | | 19,300,135 | | | | | | 5,100,000 | | | | | | 5,100,036 | | | | | | | | | | | | | | | | 24,400,000 | | | | | | 24,400,171 | |
Federal Home Loan Banks | | | 0.41 | % | | | 09/02/2016 | | | | | | 29,400,000 | | | | | | 29,400,000 | | | | | | 7,900,000 | | | | | | 7,900,000 | | | | | | | | | | | | | | | | 37,300,000 | | | | | | 37,300,000 | |
Federal Home Loan Banks | | | 0.47 | % | | | 06/01/2017 | | | | | | 12,200,000 | | | | | | 12,198,302 | | | | | | 3,400,000 | | | | | | 3,399,527 | | | | | | | | | | | | | | | | 15,600,000 | | | | | | 15,597,829 | |
Federal Home Loan Banks | | | 0.47 | % | | | 01/06/2017 | | | | | | 14,900,000 | | | | | | 14,900,000 | | | | | | 4,000,000 | | | | | | 4,000,000 | | | | | | | | | | | | | | | | 18,900,000 | | | | | | 18,900,000 | |
Federal Home Loan Banks | | | 0.48 | % | | | 08/01/2016 | | | | | | - | | | | | | - | | | | | | 1,000,000 | | | | | | 1,000,091 | | | | | | | | | | | | | | | | 1,000,000 | | | | | | 1,000,091 | |
Federal Home Loan Banks | | | 0.51 | % | | | 04/19/2017 | | | | | | 19,300,000 | | | | | | 19,300,000 | | | | | | 5,100,000 | | | | | | 5,100,000 | | | | | | | | | | | | | | | | 24,400,000 | | | | | | 24,400,000 | |
Federal Home Loan Banks | | | 0.55 | % | | | 10/12/2016 | | | | | | 9,600,000 | | | | | | 9,602,284 | | | | | | 2,600,000 | | | | | | 2,600,619 | | | | | | | | | | | | | | | | 12,200,000 | | | | | | 12,202,903 | |
| | | | | | | | | | | | | | | | | | | | | | | | | | | | |
Total Short-Term U.S. Government Agency Obligations | | | | | | | | | | | | | | | | | | | 440,678,647 | | | | | | | | | | | | 119,971,009 | | | | | | | | | | | | | | | | | | | | | | 560,649,656 | |
| | | | | | | | | | | | | | | | | | | | | | | | | | | | |
| | | | | | | | | | | | | | | | | | | Total Cost ($440,678,647) | | | | | | | | | | | | Total Cost ($119,971,009) | | | | | | | | | | | | | | | | | | | | | | Total Cost ($560,649,656) | |
| | | | | | | | | | | | | | | | | |
| | | | | | | | | | | Principal | | | | | Value | | | | | Principal | | | | | Value | | | | | Principal | | | Value | | | | | Principal | | | | | Value | |
| | | | | | | | | | | | | | | | | | | | | | | | | | | | |
Repurchase Agreements - 42.1 % | | | | | | | | | | | | | | | | | | | | | | | | | | | | | | | | | | | | | | | | | | | | | | | | | | | | | | |
Barclays Capital, Inc. | | | 0.38 | % | | | 08/09/2016 | | | | | $ | 34,000,000 | | | | | $ | 34,000,000 | | | | | $ | 9,200,000 | | | | | $ | 9,200,000 | | | | | | | | | | | | | | | $ | 43,200,000 | | | | | $ | 43,200,000 | |
Barclays Capital, Inc. | | | 0.40 | % | | | 07/01/2016 | | | | | | 71,100,000 | | | | | | 71,100,000 | | | | | | 19,000,000 | | | | | | 19,000,000 | | | | | | | | | | | | | | | | 90,100,000 | | | | | | 90,100,000 | |
Goldman Sachs & Co. | | | 0.42 | % | | | 07/01/2016 | | | | | | 35,200,000 | | | | | | 35,200,000 | | | | | | 9,400,000 | | | | | | 9,400,000 | | | | | | | | | | | | | | | | 44,600,000 | | | | | | 44,600,000 | |
ING Financial Markets LLC | | | 0.29 | % | | | 07/01/2016 | | | | | | 80,600,000 | | | | | | 80,600,000 | | | | | | 22,900,000 | | | | | | 22,900,000 | | | | | | | | | | | | | | | | 103,500,000 | | | | | | 103,500,000 | |
Jefferies LLC | | | 0.65 | % | | | 07/01/2016 | | | | | | 46,900,000 | | | | | | 46,900,000 | | | | | | 12,600,000 | | | | | | 12,600,000 | | | | | | | | | | | | | | | | 59,500,000 | | | | | | 59,500,000 | |
Nomura Securities International, Inc. | | | 0.42 | % | | | 07/01/2016 | | | | | | 106,700,000 | | | | | | 106,700,000 | | | | | | 30,000,000 | | | | | | 30,000,000 | | | | | | | | | | | | | | | | 136,700,000 | | | | | | 136,700,000 | |
State Street Bank & Trust Co. | | | 0.03 | % | | | 07/01/2016 | | | | | | 385,031 | | | | | | 385,031 | | | | | | 360,522 | | | | | | 360,522 | | | | | | | | | | | | | | | | 745,553 | | | | | | 745,553 | |
| | | | | | | | | | | | | | | | | | | | | | | | | | | | |
Total Repurchase Agreements | | | | | | | | | | | | | | | | | | | 374,885,031 | | | | | | | | | | | | 103,460,522 | | | | | | | | | | | | | | | | | | | | | | 478,345,553 | |
| | | | | | | | | | | | | | | | | | | | | | | | | | | | |
| | | | | | | | | | | | | | | | | | | Total Cost ($374,885,031) | | | | | | | | | | | | Total Cost ($103,460,522) | | | | | | | | | | | | | | | | | | | | | | Total Cost ($478,345,553) | |
| | | | | | | | | |
| | | | | | | | | | | | | | | | | | | | | | | | | | | | |
Total Investments | | | | | | | | | | | | | | | | | | | 894,943,332 | | | | | | | | | | | | 244,672,813 | | | | | | | | | | | | | | | | | | | | | | 1,139,616,145 | |
| | | | | | | | | | | | | | | | | | | | | | | | | | | | |
| | | | | | | | | | | | | | | | | | | Total Cost ($894,943,332) | | | | | | | | | | | | Total Cost ($244,672,813) | | | | | | | | | | | | | | | | | | | | | | Total Cost ($1,139,616,145) | |
| | | | | | | | | | | | | | | | | |
Other Assets and Liabilities - (0.2)% | | | | | | | | | | | | | | | | | | | (116,907) | | | | | | | | | | | | 188,014 | | | | | | | | | | (2,354,820) | (a) (c) | | | | | | | | | | | (2,283,713) | |
| | | | | | | | | | | | | | | | | | | | | | | | | | | | | | | | | | | | | | | | | | | | | | | | | | |
Net Assets | | | | | | | | | | | | | | | | | | | $894,826,425 | | | | | | | | | | | | $244,860,827 | | | | | | | | | | ($2,354,820) | | | | | | | | | | | | $1,137,332,432 | |
| | | | | | | | | | | | | | | | | | | | | | | | | | | | | | | | | | | | | | | | | | | | | | | | | | |
VALUATION SUMMARY:
| | | | | | | | | | | | | | | | | | | | | | | | | | | | | | | | | | | | | | | | | | | | | | | | | | | | | | | | |
| Investments | | Level 1 - Unadjusted
Quoted Prices | | | Level 2 - Other Significant Observable Inputs | | | Level 3 - Significant Unobservable Inputs | | | Value | | | | | | Level 1 - Unadjusted
Quoted Prices | | | Level 2 - Other Significant Observable Inputs | | | Level 3 - Significant Unobservable Inputs | | | Value | | | | | | Level 1 - Unadjusted
Quoted Prices | | | Level 2 - Other Significant Observable Inputs | | | Level 3 - Significant Unobservable Inputs | | | Value | |
U.S. Government Agency Obligations | | $ | - | | | $ | 79,379,654 | | | $ | - | | | $ | 79,379,654 | | | | | | | $ | - | | | $ | 21,241,282 | | | $ | - | | | $ | 21,241,282 | | | | | | | $ | - | | | $ | 100,620,936 | | | $ | - | | | $ | 100,620,936 | |
Short-Term U.S. Government Agency Obligations | | | - | | | | 440,678,647 | | | | - | | | | 440,678,647 | | | | | | | | - | | | | 119,971,009 | | | | - | | | | 119,971,009 | | | | | | | | - | | | | 560,649,656 | | | | - | | | | 560,649,656 | |
Repurchase Agreements | | | - | | | | 374,885,031 | | | | - | | | | 374,885,031 | | | | | | | | - | | | | 103,460,522 | | | | - | | | | 103,460,522 | | | | | | | | - | | | | 478,345,553 | | | | - | | | | 478,345,553 | |
Total Investments | | $ | - | | | $ | 894,943,332 | | | $ | - | | | $ | 894,943,332 | | | | | | | $ | - | | | $ | 244,672,813 | | | $ | - | | | $ | 244,672,813 | | | | | | | $ | - | | | $ | 1,139,616,145 | | | $ | - | | | $ | 1,139,616,145 | |
(a)-(l) See Note 2 of the Notes to the Pro Forma Financial Statements.
As of June 30, 2016, all securities held by the Target Master Portfolio would comply with the investment restrictions of the Destination Fund.
S-14
Reorganization Between TPP Master, TPFG Feeder, TPFG II Feeder and TAF Destination
PRO FORMA STATEMENT OF ASSETS AND LIABILITIES
At June 30, 2016
| | | | | | | | | | | | | | | | | | | | | | | | | | | | | | | | | | | | | | | | | | | | | | | | | | | | | | | | | | | | | | | | | | | | |
| | | | | | TPP Master | | | | | | | | | TPFG Feeder | | | | | | | | | TPFG II Feeder | | | | | | | | | TAF Destination | | | | | | | | | Adjustments | | | | | | | | | Combined Pro Forma Destination | |
Assets: | | | | | | | | | | | | | | | | | | | | | | | | | | | | | | | | | | | | | | | | | | | | | | | | | | | | | | | | | | | | | | | | | | | | |
Investments, at value | | | $ | | | | 520,058,301 | | | | | | | $ | | | | | - | | | | | | | $ | | | | | - | | | | | | | $ | | | | | 141,212,291 | | | | | | | $ | | | | | - | | | | | | | $ | | | | | 661,270,592 | |
Repurchase agreements, at value | | | | | | | 374,885,031 | | | | | | | | | | | | - | | | | | | | | | | | | - | | | | | | | | | | | | 103,460,522 | | | | | | | | | | | | - | | | | | | | | | | | | 478,345,553 | |
Investments in Series Portfolio, at value | | | | | | | - | | | | | | | | | | | | 554,347,664 | | | | | | | | | | | | 228,744,559 | | | | | | | | | | | | - | | | | | | | | | | | | (783,092,223) | | | | (b) | | | | | | | | - | |
Cash | | | | | | | - | | | | | | | | | | | | - | | | | | | | | | | | | - | | | | | | | | | | | | - | | | | | | | | | | | | - | | | | | | | | | | | | - | |
Cash on deposit with broker | | | | | | | - | | | | | | | | | | | | - | | | | | | | | | | | | - | | | | | | | | | | | | - | | | | | | | | | | | | - | | | | | | | | | | | | - | |
Foreign currency, at value | | | | | | | - | | | | | | | | | | | | - | | | | | | | | | | | | - | | | | | | | | | | | | - | | | | | | | | | | | | - | | | | | | | | | | | | - | |
Receivables: | | | | | | | - | | | | | | | | | | | | - | | | | | | | | | | | | - | | | | | | | | | | | | - | | | | | | | | | | | | - | | | | | | | | | | | | | |
Shares of beneficial interest sold | | | | | | | - | | | | | | | | | | | | 2,745,611 | | | | | | | | | | | | - | | | | | | | | | | | | 952,742 | | | | | | | | | | | | - | | | | | | | | | | | | 3,698,353 | |
Investments sold | | | | | | | - | | | | | | | | | | | | - | | | | | | | | | | | | - | | | | | | | | | | | | - | | | | | | | | | | | | - | | | | | | | | | | | | - | |
When-issued, delay-delivery, and forward commitment securities sold | | | | | | | - | | | | | | | | | | | | - | | | | | | | | | | | | - | | | | | | | | | | | | - | | | | | | | | | | | | - | | | | | | | | | | | | - | |
Interest | | | | | | | 109,018 | | | | | | | | | | | | - | | | | | | | | | | | | - | | | | | | | | | | | | 29,865 | | | | | | | | | | | | - | | | | | | | | | | | | 138,883 | |
Dividends | | | | | | | - | | | | | | | | | | | | - | | | | | | | | | | | | - | | | | | | | | | | | | - | | | | | | | | | | | | - | | | | | | | | | | | | - | |
Tax reclaims | | | | | | | - | | | | | | | | | | | | - | | | | | | | | | | | | - | | | | | | | | | | | | - | | | | | | | | | | | | - | | | | | | | | | | | | - | |
Net income from securities lending | | | | | | | - | | | | | | | | | | | | - | | | | | | | | | | | | - | | | | | | | | | | | | - | | | | | | | | | | | | - | | | | | | | | | | | | - | |
Due from advisor | | | | | | | - | | | | | | | | | | | | 30,326 | | | | | | | | | | | | 27,281 | | | | | | | | | | | | - | | | | | | | | | | | | - | | | | | | | | | | | | 57,607 | |
Money market waiver due from advisor | | | | | | | - | | | | | | | | | | | | 174,349 | | | | | | | | | | | | 15,847 | | | | | | | | | | | | - | | | | | | | | | | | | - | | | | | | | | | | | | 190,196 | |
Due from distributor | | | | | | | - | | | | | | | | | | | | - | | | | | | | | | | | | - | | | | | | | | | | | | 299,039 | | | | | | | | | | | | - | | | | | | | | | | | | 299,039 | |
Variation margin receivable | | | | | | | - | | | | | | | | | | | | - | | | | | | | | | | | | - | | | | | | | | | | | | - | | | | | | | | | | | | - | | | | | | | | | | | | - | |
Other | | | | | | | - | | | | | | | | | | | | - | | | | | | | | | | | | - | | | | | | | | | | | | - | | | | | | | | | | | | - | | | | | | | | | | | | - | |
Prepaid Expenses | | | | | | | 3,300 | | | | | | | | | | | | 2,378 | | | | | | | | | | | | 872 | | | | | | | | | | | | 20,999 | | | | | | | | | | | | - | | | | | | | | | | | | 27,549 | |
OTC swap agreements, at value | | | | | | | - | | | | | | | | | | | | - | | | | | | | | | | | | - | | | | | | | | | | | | - | | | | | | | | | | | | - | | | | | | | | | | | | - | |
Unrealized appreciation on forward foreign currency contracts | | | | | | | - | | | | | | | | | | | | - | | | | | | | | | | | | - | | | | | | | | | | | | - | | | | | | | | | | | | - | | | | | | | | | | | | - | |
| | | | | | | | | | | | | | | | | | | | | | | | | | | | | | | | | | | | | | | | | | | | |
Total assets | | | $ | | | | 895,055,650 | | | | | | | $ | | | | | 557,300,328 | | | | | | | $ | | | | | 228,788,559 | | | | | | | $ | | | | | 245,975,458 | | | | | | | $ | | | | | (783,092,223) | | | | | | | $ | | | | | 1,144,027,772 | |
| | | | | | | | | | | | | | | | | | | | | | | | | | | | | | | | | | | | | | | | | | | | |
| | | | | | | | | | | | | | | | | |
Liabilities: | | | | | | | | | | | | | | | | | | | | | | | | | | | | | | | | | | | | | | | | | | | | | | | | | | | | | | | | | | | | | | | | | | | | |
Due to custodian | | | | | | | - | | | | | | | | | | | | - | | | | | | | | | | | | - | | | | | | | | | | | | - | | | | | | | | | | | | - | | | | | | | | | | | | - | |
Cash deposit due to broker | | | | | | | - | | | | | | | | | | | | - | | | | | | | | | | | | - | | | | | | | | | | | | - | | | | | | | | | | | | - | | | | | | | | | | | | - | |
Payables and other liabilities: | | | | | | | | | | | | | | | | | | | | | | | | | | | | | | | | | | | | | | | | | | | | | | | | | | | | | | | | | | | | | | | | | | | | |
Shares of beneficial interest redeemed | | | | | | | - | | | | | | | | | | | | - | | | | | | | | | | | | 4,931,429 | | | | | | | | | | | | 565,078 | | | | | | | | | | | | - | | | | | | | | | | | | 5,496,507 | |
Investments purchased | | | | | | | - | | | | | | | | | | | | - | | | | | | | | | | | | - | | | | | | | | | | | | - | | | | | | | | | | | | - | | | | | | | | | | | | - | |
When-issued, delay-delivery, and forward commitment securities purchased | | | | | | | - | | | | | | | | | | | | - | | | | | | | | | | | | - | | | | | | | | | | | | - | | | | | | | | | | | | - | | | | | | | | | | | | - | |
Investment advisory fees | | | | | | | 179,432 | | | | | | | | | | | | - | | | | | | | | | | | | - | | | | | | | | | | | | - | | | | | | | | | | | | - | | | | | | | | | | | | 179,432 | |
Investment management fees | | | | | | | - | | | | | | | | | | | | - | | | | | | | | | | | | - | | | | | | | | | | | | 36,019 | | | | | | | | | | | | - | | | | | | | | | | | | 36,019 | |
Administration/Investment advisory fees | | | | | | | - | | | | | | | | | | | | 135,958 | | | | | | | | | | | | 9,349 | | | | | | | | | | | | - | | | | | | | | | | | | - | | | | | | | | | | | | 145,307 | |
Administration fees | | | | | | | - | | | | | | | | | | | | - | | | | | | | | | | | | - | | | | | | | | | | | | - | | | | | | | | | | | | - | | | | | | | | | | | | - | |
Distribution and service fees | | | | | | | - | | | | | | | | | | | | 113,299 | | | | | | | | | | | | 46,744 | | | | | | | | | | | | 471,636 | | | | | | | | | | | | - | | | | | | | | | | | | 631,679 | |
Transfer agent fees | | | | | | | - | | | | | | | | | | | | - | | | | | | | | | | | | - | | | | | | | | | | | | 29,355 | | | | | | | | | | | | - | | | | | | | | | | | | 29,355 | |
Trustee, CCO and deferred compensation fees | | | | | | | 1,944 | | | | | | | | | | | | 1,594 | | | | | | | | | | | | 592 | | | | | | | | | | | | 46 | | | | | | | | | | | | - | | | | | | | | | | | | 4,176 | |
Audit and tax fees | | | | | | | 11,943 | | | | | | | | | | | | 10,265 | | | | | | | | | | | | 6,995 | | | | | | | | | | | | 4,712 | | | | | | | | | | | | - | | | | | | | | | | | | 33,915 | |
Custody and accounting fees | | | | | | | 13,973 | | | | | | | | | | | | 3,316 | | | | | | | | | | | | 3,316 | | | | | | | | | | | | - | | | | | | | | | | | | - | | | | | | | | | | | | 20,605 | |
Legal fees | | | | | | | 12,037 | | | | | | | | | | | | 7,444 | | | | | | | | | | | | 4,076 | | | | | | | | | | | | 1,541 | | | | | | | | | | | | - | | | | | | | | | | | | 25,098 | |
Printing and shareholder reports fees | | | | | | | 4,991 | | | | | | | | | | | | 2,229 | | | | | | | | | | | | - | | | | | | | | | | | | - | | | | | | | | | | | | - | | | | | | | | | | | | 7,220 | |
Registration fees | | | | | | | - | | | | | | | | | | | | 8,408 | | | | | | | | | | | | 7,585 | | | | | | | | | | | | 5,242 | | | | | | | | | | | | - | | | | | | | | | | | | 21,235 | |
Dividends, interest and fees for borrowings from securities sold short | | | | | | | - | | | | | | | | | | | | - | | | | | | | | | | | | - | | | | | | | | | | | | - | | | | | | | | | | | | - | | | | | | | | | | | | - | |
Interest | | | | | | | - | | | | | | | | | | | | - | | | | | | | | | | | | - | | | | | | | | | | | | - | | | | | | | | | | | | - | | | | | | | | | | | | - | |
Distribution payable to shareholders | | | | | | | - | | | | | | | | | | | | - | | | | | | | | | | | | - | | | | | | | | | | | | 247 | | | | | | | | | | | | - | | | | | | | | | | | | 247 | |
Other | | | | | | | 4,905 | | | | | | | | | | | | 4,149 | | | | | | | | | | | | 1,706 | | | | | | | | | | | | 755 | | | | | | | | | | | | 53,030 | | | | (c) | | | | | | | | 64,545 | |
Collateral for securities on loan | | | | | | | - | | | | | | | | | | | | - | | | | | | | | | | | | - | | | | | | | | | | | | - | | | | | | | | | | | | - | | | | | | | | | | | | - | |
Securities sold short, at value | | | | | | | - | | | | | | | | | | | | - | | | | | | | | | | | | - | | | | | | | | | | | | - | | | | | | | | | | | | - | | | | | | | | | | | | - | |
Written options and swaptions, at value | | | | | | | - | | | | | | | | | | | | - | | | | | | | | | | | | - | | | | | | | | | | | | - | | | | | | | | | | | | - | | | | | | | | | | | | - | |
OTC swap agreements, at value | | | | | | | - | | | | | | | | | | | | - | | | | | | | | | | | | - | | | | | | | | | | | | - | | | | | | | | | | | | - | | | | | | | | | | | | - | |
Unrealized depreciation on forward foreign currency contracts | | | | | | | - | | | | | | | | | | | | - | | | | | | | | | | | | - | | | | | | | | | | | | - | | | | | | | | | | | | - | | | | | | | | | | | | - | |
| | | | | | | | | | | | | | | | | | | | | | | | | | | | | | | | | | | | | | | | | | | | |
Total liabilities | | | | | | | 229,225 | | | | | | | | | | | | 286,662 | | | | | | | | | | | | 5,011,792 | | | | | | | | | | | | 1,114,631 | | | | | | | | | | | | 53,030 | | | | | | | | | | | | 6,695,340 | |
| | | | | | | | | | | | | | | | | | | | | | | | | | | | | | | | | | | | | | | | | | | | |
Net Assets | | | $ | | | | 894,826,425 | | | | | | | $ | | | | | 557,013,666 | | | | | | | $ | | | | | 223,776,767 | | | | | | | $ | | | | | 244,860,827 | | | | | | | $ | | | | | (783,145,253) | | | | | | | $ | | | | | 1,137,332,432 | |
| | | | | | | | | | | | | | | | | | | | | | | | | | | | | | | | | | | | | | | | | | | | |
| | | | | | | | | | | | | | | | | |
Net Assets Consist of: | | | | | | | | | | | | | | | | | | | | | | | | | | | | | | | | | | | | | | | | | | | | | | | | | | | | | | | | | | | | | | | | | | | | |
Paid-in capital | | | $ | | | | 591,563,546 | | | | | | | | | | | | 557,192,917 | | | | | | | | | | | | 223,975,486 | | | | | | | | | | | | 244,861,418 | | | | | | | $ | | | | | (480,260,344) | | | | (d) | | | $ | | | | | 1,137,333,023 | |
Undistributed (distributions in excess of) net investment income (loss) | | | | | | | 303,875,380 | | | | | | | | | | | | (17,846) | | | | | | | | | | | | (7,010) | | | | | | | | | | | | - | | | | | | | | | | | | (303,850,524) | | | | (d) | | | | | | | | - | |
Accumulated net realized gain (loss) | | | | | | | (612,501) | | | | | | | | | | | | (161,405) | | | | | | | | | | | | (191,709) | | | | | | | | | | | | (591) | | | | | | | | | | | | 965,615 | | | | (d) | | | | | | | | (591) | |
Net unrealized appreciation (depreciation) on: | | | | | | | | | | | | | | | | | | | | | | | | | | | | | | | | | | | | | | | | | | | | | | | | | | | | | | | | | | | | | | | | | | | | |
Investments | | | | | | | - | | | | | | | | | | | | - | | | | | | | | | | | | - | | | | | | | | | | | | - | | | | | | | | | | | | - | | | | | | | | | | | | - | |
Allocated from Series Portfolio | | | | | | | - | | | | | | | | | | | | - | | | | | | | | | | | | - | | | | | | | | | | | | - | | | | | | | | | | | | - | | | | | | | | | | | | - | |
Securities sold short | | | | | | | - | | | | | | | | | | | | - | | | | | | | | | | | | - | | | | | | | | | | | | - | | | | | | | | | | | | - | | | | | | | | | | | | - | |
Written options and swaptions | | | | | | | - | | | | | | | | | | | | - | | | | | | | | | | | | - | | | | | | | | | | | | - | | | | | | | | | | | | - | | | | | | | | | | | | - | |
Swap agreements | | | | | | | - | | | | | | | | | | | | - | | | | | | | | | | | | - | | | | | | | | | | | | - | | | | | | | | | | | | - | | | | | | | | | | | | - | |
Futures contracts | | | | | | | - | | | | | | | | | | | | - | | | | | | | | | | | | - | | | | | | | | | | | | - | | | | | | | | | | | | - | | | | | | | | | | | | - | |
Translation of assets and liabilities denominated in foreign currencies | | | | | | | - | | | | | | | | | | | | - | | | | | | | | | | | | - | | | | | | | | | | | | - | | | | | | | | | | | | - | | | | | | | | | | | | - | |
| | | | | | | | | | | | | | | | | | | | | | | | | | | | | | | | | | | | | | | | | | | | | | | | |
| | | | | | | | | | | | | | | | | |
Net Assets | | | $ | | | | 894,826,425 | | | | | | | $ | | | | | 557,013,666 | | | | | | | $ | | | | | 223,776,767 | | | | | | | $ | | | | | 244,860,827 | | | | | | | $ | | | | | (783,145,253) | | | | | | | $ | | | | | 1,137,332,432 | |
| | | | | | | | | | | | | | | | | | | | | | | | | | | | | | | | | | | | | | | | | | | | |
| | | | | | - | | | | | | | | | - | | | | | | | | | - | | | | | | | | | - | | | | | | | | | - | | | | | | | | | | |
Net assets by class: | | | | | | | | | | | | | | | | | | | - | | | | | | | | | | | | - | | | | | | | | | | | | - | | | | | | | | | | | | | | | | | | | | | | | | | |
Class A | | | $ | | | | - | | | | | | | $ | | | | | - | | | | | | | $ | | | | | - | | | | | | | $ | | | | | 165,185,193 | | | | | | | $ | | | | | - | | | | | | | $ | | | | | 165,185,193 | |
Class B | | | | | | | - | | | | | | | | | | | | - | | | | | | | | | | | | - | | | | | | | | | | | | 1,758,099 | | | | | | | | | | | | - | | | | | | | | | | | | 1,758,099 | |
Class C | | | | | | | - | | | | | | | | | | | | - | | | | | | | | | | | | - | | | | | | | | | | | | 26,344,102 | | | | | | | | | | | | - | | | | | | | | | | | | 26,344,102 | |
Class I | | | | | | | - | | | | | | | | | | | | - | | | | | | | | | | | | - | | | | | | | | | | | | 21,311,385 | | | | | | | | | | | | - | | | | | | | | | | | | 21,311,385 | |
Class I2 | | | | | | | - | | | | | | | | | | | | - | | | | | | | | | | | | - | | | | | | | | | | | | 30,262,048 | | | | | | | | | | | | - | | | | | | | | | | | | 30,262,048 | |
Class I3 | | | | | | | 111,734,202 | | | | | | | | | | | | - | | | | | | | | | | | | - | | | | | | | | | | | | - | | | | | | | | | | | | (53,030) | | | | (c) | | | | | | | | 111,681,172 | |
Class T | | | | | | | - | | | | | | | | | | | | - | | | | | | | | | | | | - | | | | | | | | | | | | - | | | | | | | | | | | | - | | | | | | | | | | | | - | |
Class R | | | | | | | - | | | | | | | | | | | | 557,013,666 | | | | | | | | | | | | - | | | | | | | | | | | | - | | | | | | | | | | | | - | | | | | | | | | | | | 557,013,666 | |
Class R4 | | | | | | | - | | | | | | | | | | | | - | | | | | | | | | | | | 223,776,767 | | | | | | | | | | | | - | | | | | | | | | | | | - | | | | | | | | | | | | 223,776,767 | |
Class R6 | | | | | | | - | | | | | | | | | | | | - | | | | | | | | | | | | - | | | | | | | | | | | | - | | | | | | | | | | | | - | | | | | | | | | | | | - | |
Shares outstanding (unlimited shares, no par value): | | | | | | | | | | | | | | | | | | | | | | | | | | | | | | | | | | | | | | | | | | | | | | | | | | | | | | | | | | | | | | | | | | | | |
Class A | | | | | | | - | | | | | | | | | | | | - | | | | | | | | | | | | - | | | | | | | | | | | | 165,184,898 | | | | | | | | | | | | - | | | | | | | | | | | | 165,184,898 | |
Class B | | | | | | | - | | | | | | | | | | | | - | | | | | | | | | | | | - | | | | | | | | | | | | 1,757,770 | | | | | | | | | | | | - | | | | | | | | | | | | 1,757,770 | |
Class C | | | | | | | - | | | | | | | | | | | | - | | | | | | | | | | | | - | | | | | | | | | | | | 26,340,590 | | | | | | | | | | | | - | | | | | | | | | | | | 26,340,590 | |
Class I | | | | | | | - | | | | | | | | | | | | - | | | | | | | | | | | | - | | | | | | | | | | | | 21,312,170 | | | | | | | | | | | | - | | | | | | | | | | | | 21,312,170 | |
Class I2 | | | | | | | - | | | | | | | | | | | | - | | | | | | | | | | | | - | | | | | | | | | | | | 30,261,663 | | | | | | | | | | | | - | | | | | | | | | | | | 30,261,663 | |
Class I3 | | | | | | | 111,734,202 | | | | | | | | | | | | - | | | | | | | | | | | | - | | | | | | | | | | | | - | | | | | | | | | | | | - | | | | | | | | | | | | 111,734,202 | |
Class T | | | | | | | - | | | | | | | | | | | | - | | | | | | | | | | | | - | | | | | | | | | | | | - | | | | | | | | | | | | - | | | | | | | | | | | | - | |
Class R | | | | | | | - | | | | | | | | | | | | 557,013,663 | | | | | | | | | | | | - | | | | | | | | | | | | - | | | | | | | | | | | | 3 | | | | (e) | | | | | | | | 557,013,666 | |
Class R4 | | | | | | | - | | | | | | | | | | | | - | | | | | | | | | | | | 223,776,768 | | | | | | | | | | | | - | | | | | | | | | | | | (1) | | | | (e) | | | | | | | | 223,776,767 | |
Class R6 | | | | | | | - | | | | | | | | | | | | - | | | | | | | | | | | | - | | | | | | | | | | | | - | | | | | | | | | | | | - | | | | | | | | | | | | - | |
Net asset value per share: | | | | | | | | | | | | | | | | | | | | | | | | | | | | | | | | | | | | | | | | | | | | | | | | | | | | | | | | | | | | | | | | | | | | |
Class A | | | $ | | | | - | | | | | | | $ | | | | | - | | | | | | | $ | | | | | - | | | | | | | $ | | | | | 1.00 | | | | | | | | | | | | - | | | | | | | $ | | | | | 1.00 | |
Class B | | | | | | | - | | | | | | | | | | | | - | | | | | | | | | | | | - | | | | | | | | | | | | 1.00 | | | | | | | | | | | | - | | | | | | | | | | | | 1.00 | |
Class C | | | | | | | - | | | | | | | | | | | | - | | | | | | | | | | | | - | | | | | | | | | | | | 1.00 | | | | | | | | | | | | - | | | | | | | | | | | | 1.00 | |
Class I | | | | | | | - | | | | | | | | | | | | - | | | | | | | | | | | | - | | | | | | | | | | | | 1.00 | | | | | | | | | | | | - | | | | | | | | | | | | 1.00 | |
Class I2 | | | | | | | - | | | | | | | | | | | | - | | | | | | | | | | | | - | | | | | | | | | | | | 1.00 | | | | | | | | | | | | - | | | | | | | | | | | | 1.00 | |
Class I3 | | | | | | | 1.00 | | | | | | | | | | | | - | | | | | | | | | | | | - | | | | | | | | | | | | 1.00 | | | | | | | | | | | | (1.00) | | | | (f) | | | | | | | | 1.00 | |
Class T | | | | | | | - | | | | | | | | | | | | - | | | | | | | | | | | | - | | | | | | | | | | | | - | | | | | | | | | | | | - | | | | | | | | | | | | - | |
Class R | | | | | | | - | | | | | | | | | | | | 1.00 | | | | | | | | | | | | - | | | | | | | | | | | | 1.00 | | | | | | | | | | | | (1.00) | | | | (f) | | | | | | | | 1.00 | |
Class R4 | | | | | | | - | | | | | | | | | | | | - | | | | | | | | | | | | 1.00 | | | | | | | | | | | | 1.00 | | | | | | | | | | | | (1.00) | | | | (f) | | | | | | | | 1.00 | |
Class R6 | | | | | | | - | | | | | | | | | | | | - | | | | | | | | | | | | - | | | | | | | | | | | | - | | | | | | | | | | | | - | | | | | | | | | | | | - | |
Maximum offering price per share: | | | | | | | | | | | | | | | | | | | | | | | | | | | | | | | | | | | | | | | | | | | | | | | | | | | | | | | | | | | | | | | | | | | | |
Class A | | | $ | | | | - | | | | | | | $ | | | | | - | | | | | | | $ | | | | | - | | | | | | | $ | | | | | 1.00 | | | | | | | | | | | | - | | | | | | | $ | | | | | 1.00 | |
| | | | | | | | | | | | | | | | | | | | | | | | | | | | | | | | | | | | | | | | | | | | | | | | | | | | | | | | | | | | | | | | | | | | |
| | | | | | | | | | | | | | | | | | | | | | | | | | | | | | | | | | | | | | | | | | | | |
Investments, at cost | | | $ | | | | 520,058,301 | | | | | | | $ | | | | | - | | | | | | | $ | | | | | - | | | | | | | $ | | | | | 141,212,291 | | | | | | | | | | | | - | | | | | | | $ | | | | | 661,270,592 | |
Securities loaned, at value | | | | | | | - | | | | | | | | | | | | - | | | | | | | | | | | | - | | | | | | | | | | | | - | | | | | | | | | | | | - | | | | | | | | | | | | - | |
Repurchase agreements, at cost | | | | | | | 374,885,031 | | | | | | | | | | | | - | | | | | | | | | | | | - | | | | | | | | | | | | 103,460,522 | | | | | | | | | | | | - | | | | | | | | | | | | 478,345,553 | |
Foreign currency, at cost | | | | | | | - | | | | | | | | | | | | - | | | | | | | | | | | | - | | | | | | | | | | | | - | | | | | | | | | | | | - | | | | | | | | | | | | - | |
Premium received on written options and swaptions | | | | | | | - | | | | | | | | | | | | - | | | | | | | | | | | | - | | | | | | | | | | | | - | | | | | | | | | | | | - | | | | | | | | | | | | - | |
(a)-(l) See Note 2 of the Notes to the Pro Forma Financial Statements.
THE NOTES TO THE PRO FORMA FINANCIAL STATEMENTS ARE AN INTEGRAL PART OF THIS REPORT.
S-15
Reorganization Between TPP Master, TPFG Feeder, TPFG II Feeder and TAF Destination
PRO FORMA STATEMENT OF OPERATIONS
For the twelve-month period ended June 30, 2016
| | | | | | | | | | | | | | | | | | | | | | | | | | | | | | | | | | | | | | | | | | | | | | | | | | | | | | | | | | | | | | | | | | |
| | | | | | TPP Master | | | | | | | | | TPFG Feeder | | | | | | | | | TPFG II Feeder | | | | | | | | | TAF Destination | | | | | | | | | Adjustments | | | | | | | | Combined Pro Forma Destination | |
Investment Income: | | | | | | | | | | | | | | | | | | | | | | | | | | | | | | | | | | | | | | | | | | | | | | | | | | | | | | | | | | | | | | | | | | |
| | | | | | | | | | | | | | | | | |
Dividend income | | | $ | | | | - | | | | | | | $ | | | | | - | | | | | | | $ | | | | | - | | | | | | | $ | | | | | - | | | | | | | $ | | | | | - | | | | | $ | | | | | - | |
Interest income | | | | | | | 3,390,908 | | | | | | | | | | | | 2,122,041 | | | | | | | | | | | | 892,532 | | | | | | | | | | | | 824,335 | | | | | | | | | | | | (3,014,573) | | | (b) | | | | | | | 4,215,243 | |
Net income (loss) from securities lending | | | | | | | - | | | | | | | | | | | | - | | | | | | | | | | | | - | | | | | | | | | | | | - | | | | | | | | | | | | - | | | | | | | | | | - | |
Withholding taxes on foreign income | | | | | | | - | | | | | | | | | | | | - | | | | | | | | | | | | - | | | | | | | | | | | | - | | | | | | | | | | | | - | | | | | | | | | | - | |
Expenses (net of waiver and/or reimbursement) | | | | | | | - | | | | | | | | | | | | (1,470,294) | | | | | | | | | | | | (624,361) | | | | | | | | | | | | - | | | | | | | | | | | | 2,094,655 | | | (b) | | | | | | | - | |
| | | | | | | | | | | | | | | | | | | | | | | | | | | | | | | | | | | | | | | | | | |
Total investment income (loss) | | | | | | | 3,390,908 | | | | | | | | | | | | 651,747 | | | | | | | | | | | | 268,171 | | | | | | | | | | | | 824,335 | | | | | | | | | | | | (919,918) | | | | | | | | | | 4,215,243 | |
| | | | | | | | | | | | | | | | | | | | | | | | | | | | | | | | | | | | | | | | | | |
| | | | | | | | | | | | | | | | | |
Expenses: | | | | | | | | | | | | | | | | | | | | | | | | | | | | | | | | | | | | | | | | | | | | | | | | | | | | | | | | | | | | | | | | | | |
Investment advisory fees | | | | | | | 2,142,379 | | | | | | | | | | | | - | | | | | | | | | | | | - | | | | | | | | | | | | 509,260 | | | | | | | | | | | | 44,190 | | | (g) | | | | | | | 2,695,829 | |
Investment management fees | | | | | | | - | | | | | | | | | | | | - | | | | | | | | | | | | - | | | | | | | | | | | | 275,270 | | | | | | | | | | | | - | | | | | | | | | | 275,270 | |
Administration/Investment advisory fees | | | | | | | - | | | | | | | | | | | | 1,602,768 | | | | | | | | | | | | 113,513 | | | | | | | | | | | | - | | | | | | | | | | | | (1,716,281) | | | (h) | | | | | | | - | |
Distribution and service fees: | | | | | | | | | | | | | | | | | | | | | | | | | | | | | | | | | | | | | | | | | | | | | | | | | | | | | | | | | | | | | | | | | | |
Class A | | | | | | | - | | | | | | | | | | | | - | | | | | | | | | | | | - | | | | | | | | | | | | 312,102 | | | | | | | | | | | | (216) | | | (i) | | | | | | | 311,886 | |
Class B | | | | | | | - | | | | | | | | | | | | - | | | | | | | | | | | | - | | | | | | | | | | | | 22,333 | | | | | | | | | | | | (24) | | | (i) | | | | | | | 22,309 | |
Class C | | | | | | | - | | | | | | | | | | | | - | | | | | | | | | | | | - | | | | | | | | | | | | 237,019 | | | | | | | | | | | | (216) | | | (i) | | | | | | | 236,803 | |
Class I | | | | | | | - | | | | | | | | | | | | - | | | | | | | | | | | | - | | | | | | | | | | | | - | | | | | | | | | | | | - | | | | | | | | | | - | |
Class I2 | | | | | | | - | | | | | | | | | | | | - | | | | | | | | | | | | - | | | | | | | | | | | | - | | | | | | | | | | | | - | | | | | | | | | | - | |
Class I3 | | | | | | | - | | | | | | | | | | | | - | | | | | | | | | | | | - | | | | | | | | | | | | - | | | | | | | | | | | | - | | | | | | | | | | - | |
Class T | | | | | | | - | | | | | | | | | | | | - | | | | | | | | | | | | - | | | | | | | | | | | | - | | | | | | | | | | | | - | | | | | | | | | | - | |
Class R | | | | | | | - | | | | | | | | | | | | 1,335,640 | | | | | | | | | | | | - | | | | | | | | | | | | - | | | | | | | | | | | | 1,332,092 | | | (i) | | | | | | | 2,667,732 | |
Class R4 | | | | | | | - | | | | | | | | | | | | - | | | | | | | | | | | | 567,564 | | | | | | | | | | | | - | | | | | | | | | | | | (786) | | | (i) | | | | | | | 566,778 | |
Class R6 | | | | | | | - | | | | | | | | | | | | - | | | | | | | | | | | | - | | | | | | | | | | | | - | | | | | | | | | | | | - | | | | | | | | | | - | |
Administration fees | | | | | | | - | | | | | | | | | | | | - | | | | | | | | | | | | - | | | | | | | | | | | | 37,485 | | | | | | | | | | | | (37,485) | | | (h) | | | | | | | - | |
Transfer agent fees: | | | | | | | | | | | | | | | | | | | | | | | | | | | | | | | | | | | | | | | | | | | | | | | | | | | | | | | | | | | | | | | | | | |
Class A | | | | | | | - | | | | | | | | | | | | - | | | | | | | | | | | | - | | | | | | | | | | | | 228,070 | | | | | | | | | | | | - | | | | | | | | | | 228,070 | |
Class B | | | | | | | - | | | | | | | | | | | | - | | | | | | | | | | | | - | | | | | | | | | | | | 5,929 | | | | | | | | | | | | | | | | | | | | | | 5,929 | |
Class C | | | | | | | - | | | | | | | | | | | | - | | | | | | | | | | | | - | | | | | | | | | | | | 31,698 | | | | | | | | | | | | - | | | | | | | | | | 31,698 | |
Class I | | | | | | | - | | | | | | | | | | | | - | | | | | | | | | | | | - | | | | | | | | | | | | 45,029 | | | | | | | | | | | | | | | | | | | | | | 45,029 | |
Class I2 | | | | | | | - | | | | | | | | | | | | - | | | | | | | | | | | | - | | | | | | | | | | | | 2,590 | | | | | | | | | | | | | | | | | | | | | | 2,590 | |
Class I3 | | | | | | | - | | | | | | | | | | | | - | | | | | | | | | | | | - | | | | | | | | | | | | - | | | | | | | | | | | | | | | | | | | | | | - | |
Class T | | | | | | | - | | | | | | | | | | | | - | | | | | | | | | | | | - | | | | | | | | | | | | - | | | | | | | | | | | | - | | | | | | | | | | - | |
Class R | | | | | | | - | | | | | | | | | | | | - | | | | | | | | | | | | - | | | | | | | | | | | | - | | | | | | | | | | | | | | | | | | | | | | - | |
Class R4 | | | | | | | - | | | | | | | | | | | | - | | | | | | | | | | | | - | | | | | | | | | | | | - | | | | | | | | | | | | | | | | | | | | | | - | |
Class R6 | | | | | | | - | | | | | | | | | | | | - | | | | | | | | | | | | - | | | | | | | | | | | | - | | | | | | | | | | | | | | | | | | | | | | - | |
Trustee, CCO and deferred compensation fees | | | | | | | 14,103 | | | | | | | | | | | | 10,471 | | | | | | | | | | | | 3,936 | | | | | | | | | | | | 2,876 | | | | | | | | | | | | - | | | | | | | | | | 31,386 | |
Audit and tax fees | | | | | | | 19,944 | | | | | | | | | | | | 21,332 | | | | | | | | | | | | 12,583 | | | | | | | | | | | | 13,320 | | | | | | | | | | | | (23,009) | | | (j) | | | | | | | 44,170 | |
Custody fees | | | | | | | 141,314 | | | | | | | | | | | | 20,339 | | | | | | | | | | | | 20,332 | | | | | | | | | | | | 82,070 | | | | | | | | | | | | (117,800) | | | (k) | | | | | | | 146,255 | |
Legal fees | | | | | | | 23,787 | | | | | | | | | | | | 20,532 | | | | | | | | | | | | 7,391 | | | | | | | | | | | | 4,282 | | | | | | | | | | | | - | | | | | | | | | | 55,992 | |
Printing and shareholder reports fees | | | | | | | 2,516 | | | | | | | | | | | | 80,994 | | | | | | | | | | | | 19,761 | | | | | | | | | | | | 18,599 | | | | | | | | | | | | - | | | | | | | | | | 121,870 | |
Registration fees | | | | | | | - | | | | | | | | | | | | 37,830 | | | | | | | | | | | | 45,574 | | | | | | | | | | | | 68,855 | | | | | | | | | | | | | | | | | | | | | | 152,259 | |
Dividends, interest and fees for borrowings from securities sold short | | | | | | | - | | | | | | | | | | | | - | | | | | | | | | | | | - | | | | | | | | | | | | - | | | | | | | | | | | | | | | | | | | | | | - | |
Interest | | | | | | | - | | | | | | | | | | | | - | | | | | | | | | | | | - | | | | | | | | | | | | - | | | | | | | | | | | | - | | | | | | | | | | - | |
Other | | | | | | | 13,439 | | | | | | | | | | | | 13,936 | | | | | | | | | | | | 6,772 | | | | | | | | | | | | 5,790 | | | | | | | | | | | | - | | | | | | | | | | 39,937 | |
| | | | | | | | | | | | | | | | | | | | | | | | | | | | | | | | | | | | | | | | | | |
Total expenses before waiver and/or reimbursement and recapture | | | | | | | 2,357,482 | | | | | | | | | | | | 3,143,842 | | | | | | | | | | | | 797,426 | | | | | | | | | | | | 1,902,577 | | | | | | | | | | | | (519,535) | | | | | | | | | | 7,681,792 | |
Expenses waived and/or reimbursed: | | | | | | | | | | | | | | | | | | | | | | | | | | | | | | | | | | | | | | | | | | | | | | | | | | | | | | | | | | | | | | | | | | |
Series Portfolio | | | | | | | - | | | | | | | | | | | | 47,474 | | | | | | | | | | | | 22,008 | | | | | | | | | | | | (266,384) | | | | | | | | | | | | 196,902 | | | (l) | | | | | | | - | |
Class A | | | | | | | - | | | | | | | | | | | | - | | | | | | | | | | | | - | | | | | | | | | | | | (517,445) | | | | | | | | | | | | 469,298 | | | (l) | | | | | | | (48,147) | |
Class B | | | | | | | - | | | | | | | | | | | | - | | | | | | | | | | | | - | | | | | | | | | | | | (28,153) | | | | | | | | | | | | 25,441 | | | (l) | | | | | | | (2,712) | |
Class C | | | | | | | - | | | | | | | | | | | | - | | | | | | | | | | | | - | | | | | | | | | | | | (265,157) | | | | | | | | | | | | 265,157 | | | (l) | | | | | | | - | |
Class I | | | | | | | - | | | | | | | | | | | | - | | | | | | | | | | | | - | | | | | | | | | | | | (44,249) | | | | | | | | | | | | 28,258 | | | (l) | | | | | | | (15,991) | |
Class I2 | | | | | | | - | | | | | | | | | | | | - | | | | | | | | | | | | - | | | | | | | | | | | | (1,939) | | | | | | | | | | | | 1,939 | | | (l) | | | | | | | - | |
Class I3 | | | | | | | - | | | | | | | | | | | | - | | | | | | | | | | | | - | | | | | | | | | | | | - | | | | | | | | | | | | (34,183) | | | (l) | | | | | | | (34,183) | |
Class T | | | | | | | - | | | | | | | | | | | | - | | | | | | | | | | | | - | | | | | | | | | | | | - | | | | | | | | | | | | - | | | | | | | | | | - | |
Class R | | | | | | | - | | | | | | | | | | | | (2,558,720) | | | | | | | | | | | | - | | | | | | | | | | | | - | | | | | | | | | | | | 2,367,826 | | | (l) | | | | | | | (190,894) | |
Class R4 | | | | | | | - | | | | | | | | | | | | - | | | | | | | | | | | | (603,322) | | | | | | | | | | | | - | | | | | | | | | | | | 408,853 | | | (l) | | | | | | | (194,469) | |
Class R6 | | | | | | | - | | | | | | | | | | | | - | | | | | | | | | | | | - | | | | | | | | | | | | - | | | | | | | | | | | | - | | | | | | | | | | - | |
Recapture of previously waived and/or reimbursed fees: | | | | | | | | | | | | | | | | | | | | | | | | | | | | | | | | | | | | | | | | | | | | | | | | | | | | | | | | | | | | | | | | | | |
Fund level | | | | | | | - | | | | | | | | | | | | - | | | | | | | | | | | | - | | | | | | | | | | | | 32,976 | | | | | | | | | | | | - | | | | | | | | | | 32,976 | |
Class A | | | | | | | - | | | | | | | | | | | | - | | | | | | | | | | | | - | | | | | | | | | | | | 655 | | | | | | | | | | | | - | | | | | | | | | | 655 | |
Class B | | | | | | | - | | | | | | | | | | | | - | | | | | | | | | | | | - | | | | | | | | | | | | 1 | | | | | | | | | | | | - | | | | | | | | | | 1 | |
Class C | | | | | | | - | | | | | | | | | | | | - | | | | | | | | | | | | - | | | | | | | | | | | | 589 | | | | | | | | | | | | - | | | | | | | | | | 589 | |
Class I | | | | | | | - | | | | | | | | | | | | - | | | | | | | | | | | | - | | | | | | | | | | | | - | | | | | | | | | | | | - | | | | | | | | | | - | |
Class I2 | | | | | | | - | | | | | | | | | | | | - | | | | | | | | | | | | - | | | | | | | | | | | | - | | | | | | | | | | | | - | | | | | | | | | | - | |
Class I3 | | | | | | | - | | | | | | | | | | | | - | | | | | | | | | | | | - | | | | | | | | | | | | - | | | | | | | | | | | | - | | | | | | | | | | - | |
Class T | | | | | | | - | | | | | | | | | | | | - | | | | | | | | | | | | - | | | | | | | | | | | | - | | | | | | | | | | | | - | | | | | | | | | | - | |
Class R | | | | | | | - | | | | | | | | | | | | 36,994 | | | | | | | | | | | | - | | | | | | | | | | | | - | | | | | | | | | | | | - | | | | | | | | | | 36,994 | |
Class R4 | | | | | | | - | | | | | | | | | | | | - | | | | | | | | | | | | 59,068 | | | | | | | | | | | | - | | | | | | | | | | | | - | | | | | | | | | | 59,068 | |
Class R6 | | | | | | | - | | | | | | | | | | | | - | | | | | | | | | | | | - | | | | | | | | | | | | - | | | | | | | | | | | | - | | | | | | | | | | - | |
| | | | | | | | | | | | | | | | | | | | | | | | | | | | | | | | | | | | | | | | | | | | | | | | | | |
Net expenses | | | | | | | 2,357,482 | | | | | | | | | | | | 669,590 | | | | | | | | | | | | 275,180 | | | | | | | | | | | | 813,471 | | | | | | | | | | | | 3,209,956 | | | | | | | | | | 7,325,679 | |
| | | | | | | | | | | | | | | | | |
Net investment income (loss) | | | | | | | 1,033,426 | | | | | | | | | | | | (17,843) | | | | | | | | | | | | (7,009) | | | | | | | | | | | | 10,864 | | | | | | | | | | | | (4,129,874) | | | | | | | | | | (3,110,436) | |
| | | | | | | | | | | | | | | | | | | | | | | | | | | | | | | | | | | | | | | | | | |
| | | | | | | | | | | | | | | | | |
Net realized gain (loss) on: | | | | | | | | | | | | | | | | | | | | | | | | | | | | | | | | | | | | | | | | | | | | | | | | | | | | | | | | | | | | | | | | | | |
Allocated from series portfolio | | | | | | | - | | | | | | | | | | | | 15,936 | | | | | | | | | | | | 6,554 | | | | | | | | | | | | - | | | | | | | | | | | | (22,490) | | | (b) | | | | | | | - | |
Investments | | | | | | | 25,084 | | | | | | | | | | | | - | | | | | | | | | | | | - | | | | | | | | | | | | - | | | | | | | | | | | | - | | | | | | | | | | 25,084 | |
Securities sold short | | | | | | | - | | | | | | | | | | | | - | | | | | | | | | | | | - | | | | | | | | | | | | - | | | | | | | | | | | | - | | | | | | | | | | - | |
Written options and swaptions | | | | | | | - | | | | | | | | | | | | - | | | | | | | | | | | | - | | | | | | | | | | | | - | | | | | | | | | | | | - | | | | | | | | | | - | |
Swap agreements | | | | | | | - | | | | | | | | | | | | - | | | | | | | | | | | | - | | | | | | | | | | | | - | | | | | | | | | | | | - | | | | | | | | | | - | |
Futures contracts | | | | | | | - | | | | | | | | | | | | - | | | | | | | | | | | | - | | | | | | | | | | | | - | | | | | | | | | | | | - | | | | | | | | | | - | |
Foreign currency transactions | | | | | | | - | | | | | | | | | | | | - | | | | | | | | | | | | - | | | | | | | | | | | | - | | | | | | | | | | | | - | | | | | | | | | | - | |
| | | | | | | | | | | | | | | | | | | | | | | | | | | | | | | | | | | | | | | | | | |
Net realized gain (loss) | | | | | | | 25,084 | | | | | | | | | | | | 15,936 | | | | | | | | | | | | 6,554 | | | | | | | | | | | | - | | | | | | | | | | | | (22,490) | | | | | | | | | | 25,084 | |
| | | | | | | | | | | | | | | | | | | | | | | | | | | | | | | | | | | | | | | | | | |
| | | | | | | | | | | | | | | | | |
Net change in unrealized appreciation (depreciation) on: | | | | | | | | | | | | | | | | | | | | | | | | | | | | | | | | | | | | | | | | | | | | | | | | | | | | | | | | | | | | | | | | | | |
Allocated from series portfolio | | | | | | | - | | | | | | | | | | | | - | | | | | | | | | | | | - | | | | | | | | | | | | - | | | | | | | | | | | | - | | | | | | | | | | - | |
Investments | | | | | | | - | | | | | | | | | | | | - | | | | | | | | | | | | - | | | | | | | | | | | | - | | | | | | | | | | | | - | | | | | | | | | | - | |
Securities sold short | | | | | | | - | | | | | | | | | | | | - | | | | | | | | | | | | - | | | | | | | | | | | | - | | | | | | | | | | | | - | | | | | | | | | | - | |
Written options and swaptions | | | | | | | - | | | | | | | | | | | | - | | | | | | | | | | | | - | | | | | | | | | | | | - | | | | | | | | | | | | - | | | | | | | | | | - | |
Swap agreements | | | | | | | - | | | | | | | | | | | | - | | | | | | | | | | | | - | | | | | | | | | | | | - | | | | | | | | | | | | - | | | | | | | | | | - | |
Futures contracts | | | | | | | - | | | | | | | | | | | | - | | | | | | | | | | | | - | | | | | | | | | | | | - | | | | | | | | | | | | - | | | | | | | | | | - | |
Translation of assets and liabilities denominated in foreign cuurencies | | | | | | | - | | | | | | | | | | | | - | | | | | | | | | | | | - | | | | | | | | | | | | - | | | | | | | | | | | | - | | | | | | | | | | - | |
| | | | | | | | | | | | | | | | | | | | | | | | | | | | | | | | | | | | | | | | | | |
Net change in unrealized appreciation (depreciation) | | | | | | | - | | | | | | | | | | | | - | | | | | | | | | | | | - | | | | | | | | | | | | - | | | | | | | | | | | | - | | | | | | | | | | - | |
| | | | | | | | | | | | | | | | | | | | | | | | | | | | | | | | | | | | | | | | | | |
| | | | | | | | | | | | | | | | | |
Net realized and change in unrealized gain (loss) | | | | | | | 25,084 | | | | | | | | | | | | 15,936 | | | | | | | | | | | | 6,554 | | | | | | | | | | | | - | | | | | | | | | | | | (22,490) | | | | | | | | | | 25,084 | |
| | | | | | | | | | | | | | | | | | | | | | | | | | | | | | | | | | | | | | | | | | |
| | | | | | | | | | | | | | | | | |
Net increase (decrease) in net assets resulting from operations | | | $ | | | | 1,058,510 | | | | | | | $ | | | | | (1,907) | | | | | | | $ | | | | | (455) | | | | | | | $ | | | | | 10,864 | | | | | | | $ | | | | | (4,152,364) | | | | | $ | | | | | (3,085,352) | |
| | | | | | | | | | | | | | | | | | | | | | | | | | | | | | | | | | | | | | | | | | |
(a)-(l) See Note 2 of the Notes to the Pro Forma Financial Statements.
THE NOTES TO THE PRO FORMA FINANCIAL STATEMENTS ARE AN INTEGRAL PART OF THIS REPORT.
S-16
Group Three Reorganization Between:
TRANSAMERICA PARTNERS HIGH YIELD BOND
TRANSAMERICA PARTNERS INSTITUTIONAL HIGH YIELD BOND
TRANSAMERICA PARTNERS HIGH YIELD BOND PORTFOLIO
AND
TRANSAMERICA HIGH YIELD BOND
PRO FORMA SCHEDULE OF INVESTMENTS
At June 30, 2016
Reorganization Between TPP Master and TAF
PRO FORMA SCHEDULE OF INVESTMENTS
At June 30, 2016
| | | | | | | | | | | | | | | | | | | | | | | | | | | | | | | | | | | | | | | | | | | | | | | | | | | | | | |
| | | | | | | | | | | TPP Master | | | | | TAF Destination | | | | | Adjustments | | | | | Combined Pro Forma Destination | |
| | | | | | | | | | | | | | | | | |
| | | Coupon Rate | | | Maturity Date | | | | | Principal | | | | | Value | | | | | Principal | | | | | Value | | | | | Principal | | | Value | | | | | Principal | | | | | Value | |
| | | | | | | | | | | | | | | | | | | | | | | | | | | | |
Corporate Debt Securities - 92.7 % | | | | | | | | | | | | | | | | | | | | | | | | | | | | | | | | | | | | | | | | | | | | | | | | | | | | | | |
Aerospace & Defense | | | | | | | | | | | | | | | | | | | | | | | | | | | | | | | | | | | | | | | | | | | | | | | | | | | | | | |
Bombardier, Inc. | | | 6.00 | % | | | 10/15/2022 | | | | | $ | 4,387,000 | | | | | $ | 3,750,885 | | | | | $ | 5,145,000 | | | | | $ | 4,398,975 | | | | | | | | | | | | | | | $ | 9,532,000 | | | | | $ | 8,149,860 | |
Bombardier, Inc. | | | 6.13 | % | | | 01/15/2023 | | | | | | 930,000 | | | | | | 792,825 | | | | | | - | | | | | | - | | | | | | | | | | | | | | | | 930,000 | | | | | | 792,825 | |
Bombardier, Inc. | | | 7.50 | % | | | 03/15/2025 | | | | | | 691,000 | | | | | | 597,715 | | | | | | - | | | | | | - | | | | | | | | | | | | | | | | 691,000 | | | | | | 597,715 | |
Bombardier, Inc. | | | 7.75 | % | | | 03/15/2020 | | | | | | 1,812,000 | | | | | | 1,780,290 | | | | | | 5,148,000 | | | | | | 5,057,910 | | | | | | | | | | | | | | | | 6,960,000 | | | | | | 6,838,200 | |
Triumph Group, Inc. | | | 5.25 | % | | | 06/01/2022 | | | | | | 2,244,000 | | | | | | 2,064,480 | | | | | | 3,138,000 | | | | | | 2,886,960 | | | | | | | | | | | | | | | | 5,382,000 | | | | | | 4,951,440 | |
Airlines | | | | | | | | | | | | | | | | | | | | | | | | | | | | | | | | | | | | | | | | | | | | | | | | | | | | | | |
American Airlines Group, Inc. | | | 4.63 | % | | | 03/01/2020 | | | | | | 1,000,000 | | | | | | 955,000 | | | | | | 1,740,000 | | | | | | 1,661,700 | | | | | | | | | | | | | | | | 2,740,000 | | | | | | 2,616,700 | |
American Airlines Group, Inc. | | | 5.50 | % | | | 10/01/2019 | | | | | | 2,874,000 | | | | | | 2,845,260 | | | | | | 2,980,000 | | | | | | 2,950,200 | | | | | | | | | | | | | | | | 5,854,000 | | | | | | 5,795,460 | |
American Airlines Pass-Through Trust | | | 5.60 | % | | | 01/15/2022 | | | | | | 2,087,421 | | | | | | 2,150,044 | | | | | | 4,532,209 | | | | | | 4,668,175 | | | | | | | | | | | | | | | | 6,619,630 | | | | | | 6,818,219 | |
American Airlines Pass-Through Trust | | | 5.63 | % | | | 01/15/2021 | | | | | | - | | | | | | - | | | | | | 2,696,668 | | | | | | 2,777,568 | | | | | | | | | | | | | | | | 2,696,668 | | | | | | 2,777,568 | |
American Airlines Pass-Through Trust | | | 6.00 | % | | | 01/15/2017 | | | | | | - | | | | | | - | | | | | | 1,104,345 | | | | | | 1,118,149 | | | | | | | | | | | | | | | | 1,104,345 | | | | | | 1,118,149 | |
American Airlines Pass-Through Trust | | | 6.13 | % | | | 07/15/2018 | | | | | | 7,155,000 | | | | | | 7,405,425 | | | | | | 2,810,000 | | | | | | 2,908,350 | | | | | | | | | | | | | | | | 9,965,000 | | | | | | 10,313,775 | |
Continental Airlines Pass-Through Certificates | | | 6.13 | % | | | 04/29/2018 | | | | | | 3,220,000 | | | | | | 3,389,050 | | | | | | 2,224,000 | | | | | | 2,340,760 | | | | | | | | | | | | | | | | 5,444,000 | | | | | | 5,729,810 | |
Continental Airlines Pass-Through Trust | | | 5.50 | % | | | 04/29/2022 | | | | | | - | | | | | | - | | | | | | 832,297 | | | | | | 857,266 | | | | | | | | | | | | | | | | 832,297 | | | | | | 857,266 | |
Continental Airlines Pass-Through Trust | | | 6.90 | % | | | 10/19/2023 | | | | | | 588,292 | | | | | | 614,060 | | | | | | 4,601,888 | | | | | | 4,803,451 | | | | | | | | | | | | | | | | 5,190,180 | | | | | | 5,417,511 | |
United Airlines Pass-Through Trust | | | 4.63 | % | | | 03/03/2024 | | | | | | 732,229 | | | | | | 734,059 | | | | | | 1,017,513 | | | | | | 1,020,057 | | | | | | | | | | | | | | | | 1,749,742 | | | | | | 1,754,116 | |
United Continental Holdings, Inc. | | | 6.38 | % | | | 06/01/2018 | | | | | | 1,185,000 | | | | | | 1,235,362 | | | | | | 661,000 | | | | | | 689,092 | | | | | | | | | | | | | | | | 1,846,000 | | | | | | 1,924,454 | |
US Airways Pass-Through Trust | | | 5.45 | % | | | 06/03/2018 | | | | | | - | | | | | | - | | | | | | 881,000 | | | | | | 898,620 | | | | | | | | | | | | | | | | 881,000 | | | | | | 898,620 | |
US Airways Pass-Through Trust | | | 6.75 | % | | | 12/03/2022 | | | | | | 580,629 | | | | | | 621,273 | | | | | | 2,367,441 | | | | | | 2,533,161 | | | | | | | | | | | | | | | | 2,948,070 | | | | | | 3,154,434 | |
Auto Components | | | | | | | | | | | | | | | | | | | | | | | | | | | | | | | | | | | | | | | | | | | | | | | | | | | | | | |
Goodyear Tire & Rubber Co. | | | 5.00 | % | | | 05/31/2026 | | | | | | 1,500,000 | | | | | | 1,528,125 | | | | | | 2,000,000 | | | | | | 2,037,500 | | | | | | | | | | | | | | | | 3,500,000 | | | | | | 3,565,625 | |
Automobiles | | | | | | | | | | | | | | | | | | | | | | | | | | | | | | | | | | | | | | | | | | | | | | | | | | | | | | |
Fiat Chrysler Automobiles NV | | | 4.50 | % | | | 04/15/2020 | | | | | | 430,000 | | | | | | 434,838 | | | | | | - | | | | | | - | | | | | | | | | | | | | | | | 430,000 | | | | | | 434,838 | |
Fiat Chrysler Automobiles NV | | | 5.25 | % | | | 04/15/2023 | | | | | | 1,450,000 | | | | | | 1,440,937 | | | | | | 2,575,000 | | | | | | 2,558,905 | | | | | | | | | | | | | | | | 4,025,000 | | | | | | 3,999,842 | |
Banks | | | | | | | | | | | | | | | | | | | | | | | | | | | | | | | | | | | | | | | | | | | | | | | | | | | | | | |
Bank of America Corp. | | | 8.00 | % | | | 01/30/2018 | | | | | | 3,947,000 | | | | | | 3,922,331 | | | | | | 6,133,000 | | | | | | 6,094,669 | | | | | | | | | | | | | | | | 10,080,000 | | | | | | 10,017,000 | |
Barclays PLC | | | 6.63 | % | | | 09/15/2019 | | | | | | 2,336,000 | | | | | | 2,084,880 | | | | | | 1,765,000 | | | | | | 1,575,263 | | | | | | | | | | | | | | | | 4,101,000 | | | | | | 3,660,143 | |
Barclays PLC | | | 8.25 | % | | | 12/15/2018 | | | | | | 1,843,000 | | | | | | 1,801,459 | | | | | | 3,867,000 | | | | | | 3,779,838 | | | | | | | | | | | | | | | | 5,710,000 | | | | | | 5,581,297 | |
BNP Paribas SA | | | 7.63 | % | | | 03/30/2021 | | | | | | 768,000 | | | | | | 768,000 | | | | | | 1,055,000 | | | | | | 1,055,000 | | | | | | | | | | | | | | | | 1,823,000 | | | | | | 1,823,000 | |
CIT Group, Inc. | | | 4.25 | % | | | 08/15/2017 | | | | | | - | | | | | | - | | | | | | 1,500,000 | | | | | | 1,527,750 | | | | | | | | | | | | | | | | 1,500,000 | | | | | | 1,527,750 | |
CIT Group, Inc. | | | 5.00 | % | | | 05/15/2017 | | | | | | - | | | | | | - | | | | | | 450,000 | | | | | | 457,313 | | | | | | | | | | | | | | | | 450,000 | | | | | | 457,313 | |
CIT Group, Inc. | | | 5.00 | % | | | 08/15/2022 | | | | | | 385,000 | | | | | | 391,738 | | | | | | - | | | | | | - | | | | | | | | | | | | | | | | 385,000 | | | | | | 391,738 | |
CIT Group, Inc. | | | 5.25 | % | | | 03/15/2018 | | | | | | - | | | | | | 1,571,177 | | | | | | 1,583,000 | | | | | | 1,630,933 | | | | | | | | | | | | | | | | 1,583,000 | | | | | | 3,202,110 | |
CIT Group, Inc. | | | 5.38 | % | | | 05/15/2020 | | | | | | 1,525,000 | | | | | | 198,075 | | | | | | - | | | | | | - | | | | | | | | | | | | | | | | 1,525,000 | | | | | | 198,075 | |
CIT Group, Inc. | | | 5.50 | % | | | 02/15/2019 | | | | | | - | | | | | | 2,395,912 | | | | | | 1,950,000 | | | | | | 2,040,187 | | | | | | | | | | | | | | | | 1,950,000 | | | | | | 4,436,099 | |
Citigroup, Inc. | | | 6.30 | % | | | 05/15/2024 | | | | | | 3,900,000 | | | | | | 3,880,110 | | | | | | 4,678,000 | | | | | | 4,654,142 | | | | | | | | | | | | | | | | 8,578,000 | | | | | | 8,534,252 | |
JPMorgan Chase & Co. | | | 5.00 | % | | | 07/01/2019 | | | | | | 2,852,000 | | | | | | 1,926,844 | | | | | | - | | | | | | - | | | | | | | | | | | | | | | | 2,852,000 | | | | | | 1,926,844 | |
JPMorgan Chase & Co. | | | 7.90 | % | | | 04/30/2018 | | | | | | 2,015,000 | | | | | | 2,909,040 | | | | | | 3,576,000 | | | | | | 3,647,520 | | | | | | | | | | | | | | | | 5,591,000 | | | | | | 6,556,560 | |
Lloyds Banking Group PLC | | | 7.50 | % | | | 06/27/2024 | | | | | | 2,525,000 | | | | | | 2,468,187 | | | | | | 3,450,000 | | | | | | 3,372,374 | | | | | | | | | | | | | | | | 5,975,000 | | | | | | 5,840,561 | |
Beverages | | | | | | | | | | | | | | | | | | | | | | | | | | | | | | | | | | | | | | | | | | | | | | | | | | | | | | |
Cott Beverages, Inc. | | | 5.38 | % | | | 07/01/2022 | | | | | | 4,099,000 | | | | | | 4,099,000 | | | | | | 5,149,000 | | | | | | 5,149,000 | | | | | | | | | | | | | | | | 9,248,000 | | | | | | 9,248,000 | |
Cott Beverages, Inc. | | | 6.75 | % | | | 01/01/2020 | | | | | | 2,484,000 | | | | | | 2,589,570 | | | | | | 3,825,000 | | | | | | 3,987,563 | | | | | | | | | | | | | | | | 6,309,000 | | | | | | 6,577,133 | |
Biotechnology | | | | | | | | | | | | | | | | | | | | | | | | | | | | | | | | | | | | | | | | | | | | | | | | | | | | | | |
Concordia International Corp. | | | 7.00 | % | | | 04/15/2023 | | | | | | 1,499,000 | | | | | | 1,277,898 | | | | | | 2,241,000 | | | | | | 1,910,453 | | | | | | | | | | | | | | | | 3,740,000 | | | | | | 3,188,351 | |
Building Products | | | | | | | | | | | | | | | | | | | | | | | | | | | | | | | | | | | | | | | | | | | | | | | | | | | | | | |
Associated Materials LLC / AMH New Finance, Inc. | | | 9.13 | % | | | 11/01/2017 | | | | | | 7,646,000 | | | | | | 6,804,940 | | | | | | 10,018,000 | | | | | | 8,916,020 | | | | | | | | | | | | | | | | 17,664,000 | | | | | | 15,720,960 | |
Builders FirstSource, Inc. | | | 7.63 | % | | | 06/01/2021 | | | | | | 2,415,000 | | | | | | 2,523,675 | | | | | | - | | | | | | - | | | | | | | | | | | | | | | | 2,415,000 | | | | | | 2,523,675 | |
Builders FirstSource, Inc. | | | 10.75 | % | | | 08/15/2023 | | | | | | 4,070,000 | | | | | | 4,426,125 | | | | | | 5,150,000 | | | | | | 5,600,625 | | | | | | | | | | | | | | | | 9,220,000 | | | | | | 10,026,750 | |
Griffon Corp. | | | 5.25 | % | | | 03/01/2022 | | | | | | 1,300,000 | | | | | | 1,283,750 | | | | | | 2,650,000 | | | | | | 2,616,875 | | | | | | | | | | | | | | | | 3,950,000 | | | | | | 3,900,625 | |
Griffon Corp. | | | 5.25 | % | | | 03/01/2022 | | | | | | 3,975,000 | | | | | | 3,925,312 | | | | | | 4,490,000 | | | | | | 4,433,874 | | | | | | | | | | | | | | | | 8,465,000 | | | | | | 8,359,186 | |
Norbord, Inc. | | | 6.25 | % | | | 04/15/2023 | | | | | | 2,237,000 | | | | | | 2,292,925 | | | | | | 2,691,000 | | | | | | 2,758,275 | | | | | | | | | | | | | | | | 4,928,000 | | | | | | 5,051,200 | |
Ply Gem Industries, Inc. | | | 6.50 | % | | | 02/01/2022 | | | | | | 1,605,000 | | | | | | 1,580,925 | | | | | | 200,000 | | | | | | 197,000 | | | | | | | | | | | | | | | | 1,805,000 | | | | | | 1,777,925 | |
Ply Gem Industries, Inc. | | | 6.50 | % | | | 02/01/2022 | | | | | | 1,437,000 | | | | | | 1,393,890 | | | | | | 3,947,000 | | | | | | 3,828,590 | | | | | | | | | | | | | | | | 5,384,000 | | | | | | 5,222,480 | |
Capital Markets | | | | | | | | | | | | | | | | | | | | | | | | | | | | | | | | | | | | | | | | | | | | | | | | | | | | | | |
Credit Suisse Group AG | | | 6.25 | % | | | 12/18/2024 | | | | | | 807,000 | | | | | | 759,450 | | | | | | 543,000 | | | | | | 511,005 | | | | | | | | | | | | | | | | 1,350,000 | | | | | | 1,270,455 | |
Credit Suisse Group AG | | | 7.50 | % | | | 12/11/2023 | | | | | | 4,022,000 | | | | | | 4,042,110 | | | | | | 5,895,000 | | | | | | 5,924,475 | | | | | | | | | | | | | | | | 9,917,000 | | | | | | 9,966,585 | |
Deutsche Bank AG | | | 7.50 | % | | | 04/30/2025 | | | | | | 2,200,000 | | | | | | 1,839,750 | | | | | | 3,400,000 | | | | | | 2,843,250 | | | | | | | | | | | | | | | | 5,600,000 | | | | | | 4,683,000 | |
Goldman Sachs Capital II | | | 4.00 | % | | | 08/01/2016 | | | | | | 5,876,000 | | | | | | 4,400,654 | | | | | | 6,562,000 | | | | | | 4,914,413 | | | | | | | | | | | | | | | | 12,438,000 | | | | | | 9,315,067 | |
Morgan Stanley | | | 5.45 | % | | | 07/15/2019 | | | | | | 5,876,000 | | | | | | 2,851,200 | | | | | | - | | | | | | - | | | | | | | | | | | | | | | | 5,876,000 | | | | | | 2,851,200 | |
Morgan Stanley | | | 5.55 | % | | | 07/15/2020 | | | | | | 320,000 | | | | | | 316,992 | | | | | | 4,000,000 | | | | | | 3,962,400 | | | | | | | | | | | | | | | | 4,320,000 | | | | | | 4,279,392 | |
Chemicals | | | | | | | | | | | | | | | | | | | | | | | | | | | | | | | | | | | | | | | | | | | | | | | | | | | | | | |
Hexion, Inc. | | | 6.63 | % | | | 04/15/2020 | | | | | | 6,738,000 | | | | | | 5,634,989 | | | | | | 10,225,000 | | | | | | 8,551,168 | | | | | | | | | | | | | | | | 16,963,000 | | | | | | 14,186,157 | |
Hexion, Inc. | | | 10.00 | % | | | 04/15/2020 | | | | | | 1,201,000 | | | | | | 1,122,935 | | | | | | 620,000 | | | | | | 579,700 | | | | | | | | | | | | | | | | 1,821,000 | | | | | | 1,702,635 | |
Tronox Finance LLC | | | 7.50 | % | | | 03/15/2022 | | | | | | 2,217,000 | | | | | | 1,596,240 | | | | | | 3,100,000 | | | | | | 2,232,000 | | | | | | | | | | | | | | | | 5,317,000 | | | | | | 3,828,240 | |
Commercial Services & Supplies | | | | | | | | | | | | | | | | | | | | | | | | | | | | | | | | | | | | | | | | | | | | | | | | | | | | | | |
Avis Budget Car Rental LLC / Avis Budget Finance, Inc. | | | 5.25 | % | | | 03/15/2025 | | | | | | 2,052,000 | | | | | | 1,857,060 | | | | | | 2,750,000 | | | | | | 2,488,750 | | | | | | | | | | | | | | | | 4,802,000 | | | | | | 4,345,810 | |
Avis Budget Car Rental LLC / Avis Budget Finance, Inc. | | | 5.50 | % | | | 04/01/2023 | | | | | | 1,081,000 | | | | | | 1,064,785 | | | | | | 2,850,000 | | | | | | 2,807,250 | | | | | | | | | | | | | | | | 3,931,000 | | | | | | 3,872,035 | |
Construction & Engineering | | | | | | | | | | | | | | | | | | | | | | | | | | | | | | | | | | | | | | | | | | | | | | | | | | | | | | |
Abengoa Finance SAU | | | 7.75 | % | | | 02/01/2020 | | | | | | - | | | | | | - | | | | | | 1,606,000 | | | | | | 68,255 | | | | | | | | | | | | | | | | 1,606,000 | | | | | | 68,255 | |
Abengoa Greenfield SA | | | 6.50 | % | | | 10/01/2019 | | | | | | 1,767,000 | | | | | | 70,680 | | | | | | 2,490,000 | | | | | | 99,600 | | | | | | | | | | | | | | | | 4,257,000 | | | | | | 170,280 | |
Ashton Woods USA LLC / Ashton Woods Finance Co. | | | 6.88 | % | | | 02/15/2021 | | | | | | 4,673,000 | | | | | | 4,194,017 | | | | | | 6,724,000 | | | | | | 6,034,789 | | | | | | | | | | | | | | | | 11,397,000 | | | | | | 10,228,806 | |
Brookfield Residential Properties, Inc. | | | 6.38 | % | | | 05/15/2025 | | | | | | 2,147,000 | | | | | | 1,959,138 | | | | | | 2,867,000 | | | | | | 2,616,138 | | | | | | | | | | | | | | | | 5,014,000 | | | | | | 4,575,276 | |
Brookfield Residential Properties, Inc. | | | 6.50 | % | | | 12/15/2020 | | | | | | 814,000 | | | | | | 811,965 | | | | | | - | | | | | | - | | | | | | | | | | | | | | | | 814,000 | | | | | | 811,965 | |
K Hovnanian Enterprises, Inc. | | | 7.00 | % | | | 01/15/2019 | | | | | | 1,785,000 | | | | | | 1,213,800 | | | | | | 3,515,000 | | | | | | 2,390,200 | | | | | | | | | | | | | | | | 5,300,000 | | | | | | 3,604,000 | |
K Hovnanian Enterprises, Inc. | | | 7.25 | % | | | 10/15/2020 | | | | | | 1,250,000 | | | | | | 1,081,250 | | | | | | 5,630,000 | | | | | | 4,869,950 | | | | | | | | | | | | | | | | 6,880,000 | | | | | | 5,951,200 | |
K Hovnanian Enterprises, Inc. | | | 8.00 | % | | | 11/01/2019 | | | | | | 1,800,000 | | | | | | 1,233,000 | | | | | | 1,450,000 | | | | | | 993,250 | | | | | | | | | | | | | | | | 3,250,000 | | | | | | 2,226,250 | |
K Hovnanian Enterprises, Inc. | | | 9.13 | % | | | 11/15/2020 | | | | | | 6,000,000 | | | | | | 4,080,000 | | | | | | 2,977,000 | | | | | | 2,024,360 | | | | | | | | | | | | | | | | 8,977,000 | | | | | | 6,104,360 | |
Consumer Finance | | | | | | | | | | | | | | | | | | | | | | | | | | | | | | | | | | | | | | | | | | | | | | | | | | | | | | |
Ally Financial, Inc. | | | 3.25 | % | | | 02/13/2018 | | | | | | 872,000 | | | | | | 872,000 | | | | | | - | | | | | | - | | | | | | | | | | | | | | | | 872,000 | | | | | | 872,000 | |
Ally Financial, Inc. | | | 4.75 | % | | | 09/10/2018 | | | | | | - | | | | | | - | | | | | | 2,825,000 | | | | | | 2,881,500 | | | | | | | | | | | | | | | | 2,825,000 | | | | | | 2,881,500 | |
Ally Financial, Inc. | | | 5.50 | % | | | 02/15/2017 | | | | | | 1,700,000 | | | | | | 1,725,500 | | | | | | - | | | | | | - | | | | | | | | | | | | | | | | 1,700,000 | | | | | | 1,725,500 | |
Ally Financial, Inc. | | | 5.75 | % | | | 11/20/2025 | | | | | | 1,366,000 | | | | | | 1,369,415 | | | | | | 1,761,000 | | | | | | 1,765,403 | | | | | | | | | | | | | | | | 3,127,000 | | | | | | 3,134,818 | |
Ally Financial, Inc. | | | 6.25 | % | | | 12/01/2017 | | | | | | 2,830,000 | | | | | | 2,964,425 | | | | | | - | | | | | | - | | | | | | | | | | | | | | | | 2,830,000 | | | | | | 2,964,425 | |
Ally Financial, Inc. | | | 7.50 | % | | | 09/15/2020 | | | | | | - | | | | | | - | | | | | | 2,518,000 | | | | | | 2,807,570 | | | | | | | | | | | | | | | | 2,518,000 | | | | | | 2,807,570 | |
Ally Financial, Inc. | | | 8.00 | % | | | 03/15/2020 | | | | | | 282,000 | | | | | | 317,250 | | | | | | 2,163,000 | | | | | | 2,433,375 | | | | | | | | | | | | | | | | 2,445,000 | | | | | | 2,750,625 | |
Ally Financial, Inc. | | | 8.00 | % | | | 11/01/2031 | | | | | | 942,000 | | | | | | 1,090,365 | | | | | | 1,539,000 | | | | | | 1,781,393 | | | | | | | | | | | | | | | | 2,481,000 | | | | | | 2,871,758 | |
Ally Financial, Inc. | | | 8.00 | % | | | 12/31/2018 | | | | | | 375,000 | | | | | | 409,688 | | | | | | - | | | | | | - | | | | | | | | | | | | | | | | 375,000 | | | | | | 409,688 | |
Altice Financing SA | | | 6.63 | % | | | 02/15/2023 | | | | | | 2,539,000 | | | | | | 2,492,968 | | | | | | 3,575,000 | | | | | | 3,510,185 | | | | | | | | | | | | | | | | 6,114,000 | | | | | | 6,003,153 | |
Altice Financing SA | | | 7.50 | % | | | 05/15/2026 | | | | | | 1,570,000 | | | | | | 1,538,600 | | | | | | 2,150,000 | | | | | | 2,107,000 | | | | | | | | | | | | | | | | 3,720,000 | | | | | | 3,645,600 | |
Altice US Finance I Corp. | | | 5.38 | % | | | 07/15/2023 | | | | | | 980,000 | | | | | | 972,650 | | | | | | 1,295,000 | | | | | | 1,285,288 | | | | | | | | | | | | | | | | 2,275,000 | | | | | | 2,257,938 | |
Navient Corp. | | | 4.88 | % | | | 06/17/2019 | | | | | | - | | | | | | - | | | | | | 2,261,000 | | | | | | 2,181,865 | | | | | | | | | | | | | | | | 2,261,000 | | | | | | 2,181,865 | |
Navient Corp. | | | 5.00 | % | | | 10/26/2020 | | | | | | - | | | | | | - | | | | | | 98,000 | | | | | | 91,875 | | | | | | | | | | | | | | | | 98,000 | | | | | | 91,875 | |
Navient Corp. | | | 5.00 | % | | | 06/15/2018 | | | | | | - | | | | | | - | | | | | | 1,700,000 | | | | | | 1,691,500 | | | | | | | | | | | | | | | | 1,700,000 | | | | | | 1,691,500 | |
Navient Corp. | | | 5.50 | % | | | 01/15/2019 | | | | | | 2,630,000 | | | | | | 2,634,997 | | | | | | - | | | | | | - | | | | | | | | | | | | | | | | 2,630,000 | | | | | | 2,634,997 | |
Navient Corp. | | | 5.88 | % | | | 10/25/2024 | | | | | | 2,126,000 | | | | | | 1,817,730 | | | | | | 3,429,000 | | | | | | 2,931,795 | | | | | | | | | | | | | | | | 5,555,000 | | | | | | 4,749,525 | |
OneMain Financial Holdings LLC | | | 6.75 | % | | | 12/15/2019 | | | | | | 1,847,000 | | | | | | 1,800,825 | | | | | | 2,688,000 | | | | | | 2,620,800 | | | | | | | | | | | | | | | | 4,535,000 | | | | | | 4,421,625 | |
OneMain Financial Holdings LLC | | | 7.25 | % | | | 12/15/2021 | | | | | | 3,079,000 | | | | | | 2,948,142 | | | | | | 4,046,000 | | | | | | 3,874,044 | | | | | | | | | | | | | | | | 7,125,000 | | | | | | 6,822,186 | |
Springleaf Finance Corp. | | | 6.00 | % | | | 06/01/2020 | | | | | | 3,589,000 | | | | | | 3,360,201 | | | | | | 3,625,000 | | | | | | 3,393,906 | | | | | | | | | | | | | | | | 7,214,000 | | | | | | 6,754,107 | |
Springleaf Finance Corp. | | | 7.75 | % | | | 10/01/2021 | | | | | | 1,987,000 | | | | | | 1,912,488 | | | | | | 6,772,000 | | | | | | 6,518,050 | | | | | | | | | | | | | | | | 8,759,000 | | | | | | 8,430,538 | |
Springleaf Finance Corp. | | | 8.25 | % | | | 12/15/2020 | | | | | | 4,694,000 | | | | | | 4,705,735 | | | | | | 2,720,000 | | | | | | 2,726,800 | | | | | | | | | | | | | | | | 7,414,000 | | | | | | 7,432,535 | |
Containers & Packaging | | | | | | | | | | | | | | | | | | | | | | | | | | | | | | | | | | | | | | | | | | | | | | | | | | | | | | |
Ardagh Packaging Finance PLC / Ardagh Holdings USA, Inc. | | | 3.65 | % | | | 12/15/2019 | | | | | | 3,620,000 | | | | | | 3,633,575 | | | | | | 5,050,000 | | | | | | 5,068,938 | | | | | | | | | | | | | | | | 8,670,000 | | | | | | 8,702,513 | |
Ardagh Packaging Finance PLC / Ardagh Holdings USA, Inc. | | | 4.63 | % | | | 05/15/2023 | | | | | | 550,000 | | | | | | 541,750 | | | | | | 763,000 | | �� | | | | 751,555 | | | | | | | | | | | | | | | | 1,313,000 | | | | | | 1,293,305 | |
Ardagh Packaging Finance PLC / Ardagh Holdings USA, Inc. | | | 7.00 | % | | | 11/15/2020 | | | | | | 774,706 | | | | | | 759,212 | | | | | | - | | | | | | - | | | | | | | | | | | | | | | | 774,706 | | | | | | 759,212 | |
Ardagh Packaging Finance PLC / Ardagh Holdings USA, Inc. | | | 7.25 | % | | | 05/15/2024 | | | | | | 535,000 | | | | | | 546,034 | | | | | | 750,000 | | | | | | 765,469 | | | | | | | | | | | | | | | | 1,285,000 | | | | | | 1,311,503 | |
Ball Corp. | | | 4.38 | % | | | 12/15/2020 | | | | | | 958,000 | | | | | | 1,007,696 | | | | | | 1,185,000 | | | | | | 1,246,472 | | | | | | | | | | | | | | | | 2,143,000 | | | | | | 2,254,168 | |
Ball Corp. | | | 5.25 | % | | | 07/01/2025 | | | | | | 2,466,000 | | | | | | 2,570,805 | | | | | | 2,832,000 | | | | | | 2,952,360 | | | | | | | | | | | | | | | | 5,298,000 | | | | | | 5,523,165 | |
Beverage Packaging Holdings Luxembourg II SA / Beverage Packaging Holdings II Issuer, Inc. | | | 5.63 | % | | | 12/15/2016 | | | | | | 645,000 | | | | | | 646,613 | | | | | | - | | | | | | - | | | | | | | | | | | | | | | | 645,000 | | | | | | 646,613 | |
Coveris Holdings SA | | | 7.88 | % | | | 11/01/2019 | | | | | | 3,200,000 | | | | | | 3,108,000 | | | | | | 3,955,000 | | | | | | 3,841,294 | | | | | | | | | | | | | | | | 7,155,000 | | | | | | 6,949,294 | |
S-17
| | | | | | | | | | | | | | | | | | | | | | | | | | | | | | | | | | | | | | | | | | | | | | | | | | | | | | |
| | | | | | | | | | | TPP Master | | | | | TAF Destination | | | | | Adjustments | | | | | Combined Pro Forma Destination | |
| | | | | | | | | | | | | | | | | |
| | | Coupon Rate | | | Maturity Date | | | | | Principal | | | | | Value | | | | | Principal | | | | | Value | | | | | Principal | | | Value | | | | | Principal | | | | | Value | |
| | | | | | | | | | | | | | | | | | | | | | | | | | | | |
Owens-Brockway Glass Container, Inc. | | | 5.88 | % | | | 08/15/2023 | | | | | $ | 1,617,000 | | | | | $ | 1,698,529 | | | | | $ | 2,263,000 | | | | | $ | 2,377,100 | | | | | | | | | | | | | | | $ | 3,880,000 | | | | | $ | 4,075,629 | |
Owens-Brockway Glass Container, Inc. | | | 6.38 | % | | | 08/15/2025 | | | | | | 539,000 | | | | | | 563,255 | | | | | | 931,000 | | | | | | 972,895 | | | | | | | | | | | | | | | | 1,470,000 | | | | | | 1,536,150 | |
Reynolds Group Issuer, Inc. / Reynolds Group Issuer LLC | | | 5.13 | % | | | 07/15/2023 | | | | | | 955,000 | | | | | | 966,937 | | | | | | 1,313,000 | | | | | | 1,329,412 | | | | | | | | | | | | | | | | 2,268,000 | | | | | | 2,296,349 | |
Reynolds Group Issuer, Inc. / Reynolds Group Issuer LLC | | | 7.00 | % | | | 07/15/2024 | | | | | | 495,000 | | | | | | 509,603 | | | | | | 681,000 | | | | | | 701,090 | | | | | | | | | | | | | | | | 1,176,000 | | | | | | 1,210,693 | |
Diversified Financial Services | | | | | | | | | | | | | | | | | | | | | | | | | | | | | | | | | | | | | | | | | | | | | | | | | | | | | | |
AerCap Ireland Capital, Ltd. / AerCap Global Aviation Trust | | | 3.95 | % | | | 02/01/2022 | | | | | | - | | | | | | - | | | | | | 795,000 | | | | | | 795,000 | | | | | | | | | | | | | | | | 795,000 | | | | | | 795,000 | |
AerCap Ireland Capital, Ltd. / AerCap Global Aviation Trust | | | 4.25 | % | | | 07/01/2020 | | | | | | 800,000 | | | | | | 814,000 | | | | | | 900,000 | | | | | | 915,750 | | | | | | | | | | | | | | | | 1,700,000 | | | | | | 1,729,750 | |
AerCap Ireland Capital, Ltd. / AerCap Global Aviation Trust | | | 4.63 | % | | | 07/01/2022 | | | | | | 1,691,000 | | | | | | 1,731,719 | | | | | | 275,000 | | | | | | 281,622 | | | | | | | | | | | | | | | | 1,966,000 | | | | | | 2,013,341 | |
AerCap Ireland Capital, Ltd. / AerCap Global Aviation Trust | | | 4.63 | % | | | 10/30/2020 | | | | | | - | | | | | | - | | | | | | 300,000 | | | | | | 311,025 | | | | | | | | | | | | | | | | 300,000 | | | | | | 311,025 | |
Denali International LLC / Denali Finance Corp. | | | 5.63 | % | | | 10/15/2020 | | | | | | 7,530,000 | | | | | | 7,898,970 | | | | | | 9,736,000 | | | | | | 10,213,064 | | | | | | | | | | | | | | | | 17,266,000 | | | | | | 18,112,034 | |
Glen Meadow Pass-Through Trust | | | 6.51 | % | | | 02/12/2067 | | | | | | 6,373,000 | | | | | | 4,588,560 | | | | | | 7,316,000 | | | | | | 5,267,520 | | | | | | | | | | | | | | | | 13,689,000 | | | | | | 9,856,080 | |
ILFC E-Capital Trust I | | | 3.98 | % | | | 12/21/2065 | | | | | | 4,780,000 | | | | | | 3,752,300 | | | | | | 6,576,000 | | | | | | 5,162,160 | | | | | | | | | | | | | | | | 11,356,000 | | | | | | 8,914,460 | |
ILFC E-Capital Trust II | | | 4.23 | % | | | 12/21/2065 | | | | | | 875,000 | | | | | | 691,250 | | | | | | - | | | | | | - | | | | | | | | | | | | | | | | 875,000 | | | | | | 691,250 | |
Jefferies Finance LLC / JFIN Co-Issuer Corp. | | | 7.50 | % | | | 04/15/2021 | | | | | | 2,441,000 | | | | | | 2,191,652 | | | | | | 3,313,000 | | | | | | 2,974,577 | | | | | | | | | | | | | | | | 5,754,000 | | | | | | 5,166,229 | |
Diversified Telecommunication Services | | | | | | | | | | | | | | | | | | | | | | | | | | | | | | | | | | | | | | | | | | | | | | | | | | | | | | |
CenturyLink, Inc. | | | 6.45 | % | | | 06/15/2021 | | | | | | 594,000 | | | | | | 603,653 | | | | | | 798,000 | | | | | | 812,963 | | | | | | | | | | | | | | | | 1,392,000 | | | | | | 1,416,616 | |
CenturyLink, Inc. | | | 7.50 | % | | | 04/01/2024 | | | | | | 1,430,000 | | | | | | 1,442,512 | | | | | | 1,975,000 | | | | | | 1,992,280 | | | | | | | | | | | | | | | | 3,405,000 | | | | | | 3,434,792 | |
CenturyLink, Inc. | | | 7.60 | % | | | 09/15/2039 | | | | | | - | | | | | | - | | | | | | 7,786,000 | | | | | | 6,559,705 | | | | | | | | | | | | | | | | 7,786,000 | | | | | | 6,559,705 | |
CenturyLink, Inc. | | | 7.65 | % | | | 03/15/2042 | | | | | | 12,462,000 | | | | | | 10,530,390 | | | | | | 6,944,000 | | | | | | 5,867,680 | | | | | | | | | | | | | | | | 19,406,000 | | | | | | 16,398,070 | |
Frontier Communications Corp. | | | 6.88 | % | | | 01/15/2025 | | | | | | 318,000 | | | | | | 266,921 | | | | | | 500,000 | | | | | | 419,688 | | | | | | | | | | | | | | | | 818,000 | | | | | | 686,609 | |
Frontier Communications Corp. | | | 7.63 | % | | | 04/15/2024 | | | | | | 4,566,000 | | | | | | 4,040,910 | | | | | | 5,710,000 | | | | | | 5,053,350 | | | | | | | | | | | | | | | | 10,276,000 | | | | | | 9,094,260 | |
Frontier Communications Corp. | | | 9.00 | % | | | 08/15/2031 | | | | | | 3,778,000 | | | | | | 3,322,279 | | | | | | 4,583,000 | | | | | | 4,030,176 | | | | | | | | | | | | | | | | 8,361,000 | | | | | | 7,352,455 | |
Frontier Communications Corp. | | | 10.50 | % | | | 09/15/2022 | | | | | | 1,238,000 | | | | | | 1,309,959 | | | | | | 1,060,000 | | | | | | 1,121,613 | | | | | | | | | | | | | | | | 2,298,000 | | | | | | 2,431,572 | |
Frontier Communications Corp. | | | 11.00 | % | | | 09/15/2025 | | | | | | 581,000 | | | | | | 601,335 | | | | | | 526,000 | | | | | | 544,410 | | | | | | | | | | | | | | | | 1,107,000 | | | | | | 1,145,745 | |
Hughes Satellite Systems Corp. | | | 6.50 | % | | | 06/15/2019 | | | | | | 12,462,000 | | | | | | 2,201,040 | | | | | | 3,021,000 | | | | | | 3,262,680 | | | | | | | | | | | | | | | | 15,483,000 | | | | | | 5,463,720 | |
Hughes Satellite Systems Corp. | | | 7.63 | % | | | 06/15/2021 | | | | | | 1,302,000 | | | | | | 1,401,115 | | | | | | 1,196,000 | | | | | | 1,287,046 | | | | | | | | | | | | | | | | 2,498,000 | | | | | | 2,688,161 | |
Intelsat Jackson Holdings SA | | | 7.25 | % | | | 10/15/2020 | | | | | | 4,464,000 | | | | | | 3,180,600 | | | | | | 570,000 | | | | | | 406,125 | | | | | | | | | | | | | | | | 5,034,000 | | | | | | 3,586,725 | |
Intelsat Jackson Holdings SA | | | 7.25 | % | | | 04/01/2019 | | | | | | - | | | | | | - | | | | | | 3,575,000 | | | | | | 2,609,750 | | | | | | | | | | | | | | | | 3,575,000 | | | | | | 2,609,750 | |
Intelsat Jackson Holdings SA | | | 7.50 | % | | | 04/01/2021 | | | | | | - | | | | | | - | | | | | | 633,000 | | | | | | 436,770 | | | | | | | | | | | | | | | | 633,000 | | | | | | 436,770 | |
Intelsat Jackson Holdings SA | | | 8.00 | % | | | 02/15/2024 | | | | | | 525,000 | | | | | | 517,125 | | | | | | 722,000 | | | | | | 711,170 | | | | | | | | | | | | | | | | 1,247,000 | | | | | | 1,228,295 | |
Neptune Finco Corp. | | | 6.63 | % | | | 10/15/2025 | | | | | | 752,000 | | | | | | 789,600 | | | | | | 2,290,000 | | | | | | 2,404,500 | | | | | | | | | | | | | | | | 3,042,000 | | | | | | 3,194,100 | |
Neptune Finco Corp. | | | 10.13 | % | | | 01/15/2023 | | | | | | 752,000 | | | | | | 842,240 | | | | | | - | | | | | | - | | | | | | | | | | | | | | | | 752,000 | | | | | | 842,240 | |
Neptune Finco Corp. | | | 10.88 | % | | | 10/15/2025 | | | | | | 950,000 | | | | | | 1,085,964 | | | | | | 875,000 | | | | | | 1,000,230 | | | | | | | | | | | | | | | | 1,825,000 | | | | | | 2,086,194 | |
Numericable-SFR SA | | | 7.38 | % | | | 05/01/2026 | | | | | | 2,538,000 | | | | | | 2,509,447 | | | | | | 3,361,000 | | | | | | 3,323,188 | | | | | | | | | | | | | | | | 5,899,000 | | | | | | 5,832,635 | |
Sprint Capital Corp. | | | 6.90 | % | | | 05/01/2019 | | | | | | - | | | | | | - | | | | | | 3,343,000 | | | | | | 3,192,565 | | | | | | | | | | | | | | | | 3,343,000 | | | | | | 3,192,565 | |
Sprint Capital Corp. | | | 8.75 | % | | | 03/15/2032 | | | | | | 1,090,000 | | | | | | 931,950 | | | | | | 1,386,000 | | | | | | 1,185,030 | | | | | | | | | | | | | | | | 2,476,000 | | | | | | 2,116,980 | |
UPCB Finance IV, Ltd. | | | 5.38 | % | | | 01/15/2025 | | | | | | 2,750,000 | | | | | | 2,722,500 | | | | | | 3,140,000 | | | | | | 3,108,600 | | | | | | | | | | | | | | | | 5,890,000 | | | | | | 5,831,100 | |
Virgin Media Finance PLC | | | 5.75 | % | | | 01/15/2025 | | | | | | 3,425,000 | | | | | | 3,279,437 | | | | | | 3,975,000 | | | | | | 3,806,063 | | | | | | | | | | | | | | | | 7,400,000 | | | | | | 7,085,500 | |
Virgin Media Finance PLC | | | 6.38 | % | | | 04/15/2023 | | | | | | 1,820,000 | | | | | | 1,820,000 | | | | | | 4,035,000 | | | | | | 4,035,000 | | | | | | | | | | | | | | | | 5,855,000 | | | | | | 5,855,000 | |
Virgin Media Secured Finance PLC | | | 5.25 | % | | | 01/15/2026 | | | | | | 1,750,000 | | | | | | 1,693,125 | | | | | | 1,405,000 | | | | | | 1,359,338 | | | | | | | | | | | | | | | | 3,155,000 | | | | | | 3,052,463 | |
Virgin Media Secured Finance PLC | | | 5.50 | % | | | 08/15/2026 | | | | | | 675,000 | | | | | | 656,438 | | | | | | 900,000 | | | | | | 875,250 | | | | | | | | | | | | | | | | 1,575,000 | | | | | | 1,531,688 | |
Wind Acquisition Finance SA | | | 4.75 | % | | | 07/15/2020 | | | | | | 2,500,000 | | | | | | 2,450,000 | | | | | | 2,950,000 | | | | | | 2,891,000 | | | | | | | | | | | | | | | | 5,450,000 | | | | | | 5,341,000 | |
Wind Acquisition Finance SA | | | 7.38 | % | | | 04/23/2021 | | | | | | 4,935,000 | | | | | | 4,700,587 | | | | | | 6,136,000 | | | | | | 5,844,539 | | | | | | | | | | | | | | | | 11,071,000 | | | | | | 10,545,126 | |
Windstream Services LLC | | | 7.75 | % | | | 10/15/2020 | | | | | | - | | | | | | - | | | | | | 1,927,000 | | | | | | 1,888,460 | | | | | | | | | | | | | | | | 1,927,000 | | | | | | 1,888,460 | |
Windstream Services LLC | | | 7.75 | % | | | 10/01/2021 | | | | | | 4,602,000 | | | | | | 4,337,385 | | | | | | 3,020,000 | | | | | | 2,846,350 | | | | | | | | | | | | | | | | 7,622,000 | | | | | | 7,183,735 | |
Electric Utilities | | | | | | | | | | | | | | | | | | | | | | | | | | | | | | | | | | | | | | | | | | | | | | | | | | | | | | |
Elwood Energy LLC | | | 8.16 | % | | | 07/05/2026 | | | | | | 2,563,074 | | | | | | 2,819,381 | | | | | | 3,777,281 | | | | | | 4,155,009 | | | | | | | | | | | | | | | | 6,340,355 | | | | | | 6,974,390 | |
Homer City Generation, LP | | | 8.14 | % | | | 10/01/2019 | | | | | | - | | | | | | - | | | | | | 2,220,483 | | | | | | 1,287,880 | | | | | | | | | | | | | | | | 2,220,483 | | | | | | 1,287,880 | |
Homer City Generation, LP | | | 8.73 | % | | | 10/01/2026 | | | | | | 7,089,700 | | | | | | 4,112,026 | | | | | | 6,137,938 | | | | | | 3,560,004 | | | | | | | | | | | | | | | | 13,227,638 | | | | | | 7,672,030 | �� |
Red Oak Power LLC | | | 9.20 | % | | | 11/30/2029 | | | | | | 1,325,000 | | | | | | 1,371,375 | | | | | | 4,740,000 | | | | | | 4,905,900 | | | | | | | | | | | | | | | | 6,065,000 | | | | | | 6,277,275 | |
Terraform Global Operating LLC | | | 9.75 | % | | | 08/15/2022 | | | | | | 3,244,000 | | | | | | 2,935,820 | | | | | | 3,956,000 | | | | | | 3,580,180 | | | | | | | | | | | | | | | | 7,200,000 | | | | | | 6,516,000 | |
Electronic Equipment, Instruments & Components | | | | | | | | | | | | | | | | | | | | | | | | | | | | | | | | | | | | | | | | | | | | | | | | | | | | | | |
Belden, Inc. | | | 5.50 | % | | | 09/01/2022 | | | | | | 2,514,000 | | | | | | 2,532,855 | | | | | | 3,250,000 | | | | | | 3,274,375 | | | | | | | | | | | | | | | | 5,764,000 | | | | | | 5,807,230 | |
Sanmina Corp. | | | 4.38 | % | | | 06/01/2019 | | | | | | 1,835,000 | | | | | | 1,876,288 | | | | | | 1,071,000 | | | | | | 1,095,098 | | | | | | | | | | | | | | | | 2,906,000 | | | | | | 2,971,386 | |
Energy Equipment & Services | | | | | | | | | | | | | | | | | | | | | | | | | | | | | | | | | | | | | | | | | | | | | | | | | | | | | | |
CSI Compressco, LP / Compressco Finance, Inc. | | | 7.25 | % | | | 08/15/2022 | | | | | | 2,453,000 | | | | | | 2,011,460 | | | | | | 3,349,000 | | | | | | 2,746,180 | | | | | | | | | | | | | | | | 5,802,000 | | | | | | 4,757,640 | |
Genesis Energy, LP / Genesis Energy Finance Corp. | | | 6.75 | % | | | 08/01/2022 | | | | | | 3,390,000 | | | | | | 3,288,300 | | | | | | 3,790,000 | | | | | | 3,676,300 | | | | | | | | | | | | | | | | 7,180,000 | | | | | | 6,964,600 | |
Noble Holding International, Ltd. | | | 6.05 | % | | | 03/01/2041 | | | | | | 1,491,000 | | | | | | 894,600 | | | | | | 2,022,000 | | | | | | 1,213,200 | | | | | | | | | | | | | | | | 3,513,000 | | | | | | 2,107,800 | |
Noble Holding International, Ltd. | | | 7.95 | % | | | 04/01/2045 | | | | | | 1,275,000 | | | | | | 895,688 | | | | | | 1,723,000 | | | | | | 1,210,408 | | | | | | | | | | | | | | | | 2,998,000 | | | | | | 2,106,096 | |
NuStar Logistics, LP | | | 4.80 | % | | | 09/01/2020 | | | | | | 3,924,000 | | | | | | 3,806,280 | | | | | | 4,236,000 | | | | | | 4,108,920 | | | | | | | | | | | | | | | | 8,160,000 | | | | | | 7,915,200 | |
NuStar Logistics, LP | | | 6.75 | % | | | 02/01/2021 | | | | | | 42,000 | | | | | | 42,420 | | | | | | 2,590,000 | | | | | | 2,615,900 | | | | | | | | | | | | | | | | 2,632,000 | | | | | | 2,658,320 | |
NuStar Logistics, LP | | | 8.15 | % | | | 04/15/2018 | | | | | | 2,000,000 | | | | | | 2,120,000 | | | | | | 960,000 | | | | | | 1,017,600 | | | | | | | | | | | | | | | | 2,960,000 | | | | | | 3,137,600 | |
Regency Energy Partners, LP / Regency Energy Finance Corp. | | | 5.75 | % | | | 09/01/2020 | | | | | | - | | | | | | - | | | | | | 4,165,000 | | | | | | 4,372,075 | | | | | | | | | | | | | | | | 4,165,000 | | | | | | 4,372,075 | |
Regency Energy Partners, LP / Regency Energy Finance Corp. | | | 5.88 | % | | | 03/01/2022 | | | | | | 4,470,000 | | | | | | 4,781,304 | | | | | | 1,783,000 | | | | | | 1,907,173 | | | | | | | | | | | | | | | | 6,253,000 | | | | | | 6,688,477 | |
Rowan Cos., Inc. | | | 4.88 | % | | | 06/01/2022 | | | | | | 2,296,000 | | | | | | 2,009,000 | | | | | | 3,162,000 | | | | | | 2,766,750 | | | | | | | | | | | | | | | | 5,458,000 | | | | | | 4,775,750 | |
Sabine Pass Liquefaction LLC | | | 5.63 | % | | | 02/01/2021 | | | | | | 1,615,000 | | | | | | 1,631,150 | | | | | | 1,794,000 | | | | | | 1,811,940 | | | | | | | | | | | | | | | | 3,409,000 | | | | | | 3,443,090 | |
Sabine Pass Liquefaction LLC | | | 5.63 | % | | | 03/01/2025 | | | | | | 1,925,000 | | | | | | 1,917,781 | | | | | | 3,000,000 | | | | | | 2,988,750 | | | | | | | | | | | | | | | | 4,925,000 | | | | | | 4,906,531 | |
Sabine Pass Liquefaction LLC | | | 5.88 | % | | | 06/30/2026 | | | | | | 1,986,000 | | | | | | 1,993,447 | | | | | | 2,682,000 | | | | | | 2,692,057 | | | | | | | | | | | | | | | | 4,668,000 | | | | | | 4,685,504 | |
Transocean, Inc. | | | 8.13 | % | | | 12/15/2021 | | | | | | 3,721,000 | | | | | | 3,144,245 | | | | | | 5,069,000 | | | | | | 4,283,305 | | | | | | | | | | | | | | | | 8,790,000 | | | | | | 7,427,550 | |
Weatherford International LLC | | | 6.80 | % | | | 06/15/2037 | | | | | | 2,144,000 | | | | | | 1,581,865 | | | | | | 2,326,000 | | | | | | 1,716,146 | | | | | | | | | | | | | | | | 4,470,000 | | | | | | 3,298,011 | |
Weatherford International, Ltd. | | | 6.75 | % | | | 09/15/2040 | | | | | | 1,875,000 | | | | | | 1,387,500 | | | | | | 2,852,000 | | | | | | 2,110,480 | | | | | | | | | | | | | | | | 4,727,000 | | | | | | 3,497,980 | |
Food & Staples Retailing | | | | | | | | | | | | | | | | | | | | | | | | | | | | | | | | | | | | | | | | | | | | | | | | | | | | | | |
Albertsons Cos. LLC / Safeway, Inc. | | | 6.63 | % | | | 06/15/2024 | | | | | | 711,000 | | | | | | 734,108 | | | | | | 962,000 | | | | | | 993,265 | | | | | | | | | | | | | | | | 1,673,000 | | | | | | 1,727,373 | |
Rite Aid Corp. | | | 6.13 | % | | | 04/01/2023 | | | | | | 1,764,000 | | | | | | 1,883,070 | | | | | | 1,675,000 | | | | | | 1,788,063 | | | | | | | | | | | | | | | | 3,439,000 | | | | | | 3,671,133 | |
Rite Aid Corp. | | | 6.75 | % | | | 06/15/2021 | | | | | | 2,253,000 | | | | | | 2,371,282 | | | | | | 3,302,000 | | | | | | 3,475,354 | | | | | | | | | | | | | | | | 5,555,000 | | | | | | 5,846,636 | |
Food Products | | | | | | | | | | | | | | | | | | | | | | | | | | | | | | | | | | | | | | | | | | | | | | | | | | | | | | |
Aramark Services, Inc. | | | 5.75 | % | | | 03/15/2020 | | | | | | 205,000 | | | | | | 211,150 | | | | | | 174,000 | | | | | | 179,220 | | | | | | | | | | | | | | | | 379,000 | | | | | | 390,370 | |
JBS USA LLC / JBS USA Finance, Inc. | | | 5.75 | % | | | 06/15/2025 | | | | | | 1,160,000 | | | | | | 1,090,400 | | | | | | 330,000 | | | | | | 310,200 | | | | | | | | | | | | | | | | 1,490,000 | | | | | | 1,400,600 | |
JBS USA LLC / JBS USA Finance, Inc. | | | 7.25 | % | | | 06/01/2021 | | | | | | 2,140,000 | | | | | | 2,214,900 | | | | | | - | | | | | | - | | | | | | | | | | | | | | | | 2,140,000 | | | | | | 2,214,900 | |
JBS USA LLC / JBS USA Finance, Inc. | | | 7.25 | % | | | 06/01/2021 | | | | | | - | | | | | | - | | | | | | 2,523,000 | | | | | | 2,611,305 | | | | | | | | | | | | | | | | 2,523,000 | | | | | | 2,611,305 | |
Pilgrim's Pride Corp. | | | 5.75 | % | | | 03/15/2025 | | | | | | 1,009,000 | | | | | | 1,006,477 | | | | | | 2,105,000 | | | | | | 2,099,737 | | | | | | | | | | | | | | | | 3,114,000 | | | | | | 3,106,214 | |
Post Holdings, Inc. | | | 6.75 | % | | | 12/01/2021 | | | | | | 4,845,000 | | | | | | 5,123,587 | | | | | | - | | | | | | - | | | | | | | | | | | | | | | | 4,845,000 | | | | | | 5,123,587 | |
Post Holdings, Inc. | | | 7.38 | % | | | 02/15/2022 | | | | | | 827,000 | | | | | | 869,384 | | | | | | 6,372,000 | | | | | | 6,698,565 | | | | | | | | | | | | | | | | 7,199,000 | | | | | | 7,567,949 | |
Post Holdings, Inc. | | | 8.00 | % | | | 07/15/2025 | | | | | | 458,000 | | | | | | 507,808 | | | | | | 715,000 | | | | | | 792,756 | | | | | | | | | | | | | | | | 1,173,000 | | | | | | 1,300,564 | |
Gas Utilities | | | | | | | | | | | | | | | | | | | | | | | | | | | | | | | | | | | | | | | | | | | | | | | | | | | | | | |
Ferrellgas, LP / Ferrellgas Finance Corp. | | | 6.75 | % | | | 06/15/2023 | | | | | | 2,516,000 | | | | | | 2,207,790 | | | | | | 3,432,000 | | | | | | 3,011,580 | | | | | | | | | | | | | | | | 5,948,000 | | | | | | 5,219,370 | |
Health Care Equipment & Supplies | | | | | | | | | | | | | | | | | | | | | | | | | | | | | | | | | | | | | | | | | | | | | | | | | | | | | | |
Crimson Merger Sub, Inc. | | | 6.63 | % | | | 05/15/2022 | | | | | | 3,330,000 | | | | | | 2,747,250 | | | | | | 4,556,000 | | | | | | 3,758,700 | | | | | | | | | | | | | | | | 7,886,000 | | | | | | 6,505,950 | |
DJO Finco, Inc. / DJO Finance LLC | | | 8.13 | % | | | 06/15/2021 | | | | | | 2,345,000 | | | | | | 2,028,425 | | | | | | 3,221,000 | | | | | | 2,786,165 | | | | | | | | | | | | | | | | 5,566,000 | | | | | | 4,814,590 | |
Hologic, Inc. | | | 5.25 | % | | | 07/15/2022 | | | | | | 2,139,000 | | | | | | 2,235,255 | | | | | | 2,608,000 | | | | | | 2,725,360 | | | | | | | | | | | | | | | | 4,747,000 | | | | | | 4,960,615 | |
Mallinckrodt International Finance SA | | | 4.75 | % | | | 04/15/2023 | | | | | | 3,250,000 | | | | | | 2,632,500 | | | | | | 3,955,000 | | | | | | 3,203,550 | | | | | | | | | | | | | | | | 7,205,000 | | | | | | 5,836,050 | |
Mallinckrodt International Finance SA / Mallinckrodt CB LLC | | | 5.50 | % | | | 04/15/2025 | | | | | | - | | | | | | - | | | | | | 2,675,000 | | | | | | 2,386,421 | | | | | | | | | | | | | | | | 2,675,000 | | | | | | 2,386,421 | |
Mallinckrodt International Finance SA / Mallinckrodt CB LLC | | | 5.75 | % | | | 08/01/2022 | | | | | | 3,982,000 | | | | | | 3,782,900 | | | | | | 3,611,000 | | | | | | 3,430,450 | | | | | | | | | | | | | | | | 7,593,000 | | | | | | 7,213,350 | |
Health Care Providers & Services | | | | | | | | | | | | | | | | | | | | | | | | | | | | | | | | | | | | | | | | | | | | | | | | | | | | | | |
CHS / Community Health Systems, Inc. | | | 6.88 | % | | | 02/01/2022 | | | | | | 7,498,000 | | | | | | 6,560,750 | | | | | | 7,722,000 | | | | | | 6,756,750 | | | | | | | | | | | | | | | | 15,220,000 | | | | | | 13,317,500 | |
CHS / Community Health Systems, Inc. | | | 7.13 | % | | | 07/15/2020 | | | | | | 2,295,000 | | | | | | 2,127,672 | | | | | | 7,490,000 | | | | | | 6,943,904 | | | | | | | | | | | | | | | | 9,785,000 | | | | | | 9,071,576 | |
CHS / Community Health Systems, Inc. | | | 8.00 | % | | | 11/15/2019 | | | | | | 2,104,000 | | | | | | 2,059,290 | | | | | | 2,900,000 | | | | | | 2,838,375 | | | | | | | | | | | | | | | | 5,004,000 | | | | | | 4,897,665 | |
DaVita HealthCare Partners, Inc. | | | 5.75 | % | | | 08/15/2022 | | | | | | 2,229,000 | | | | | | 2,332,091 | | | | | | 4,835,000 | | | | | | 5,058,619 | | | | | | | | | | | | | | | | 7,064,000 | | | | | | 7,390,710 | |
HCA Holdings, Inc. | | | 6.25 | % | | | 02/15/2021 | | | | | | 8,043,000 | | | | | | 8,585,902 | | | | | | 6,185,000 | | | | | | 6,602,487 | | | | | | | | | | | | | | | | 14,228,000 | | | | | | 15,188,389 | |
HCA, Inc. | | | 5.25 | % | | | 04/15/2025 | | | | | | - | | | | | | - | | | | | | 2,679,000 | | | | | | 2,799,555 | | | | | | | | | | | | | | | | 2,679,000 | | | | | | 2,799,555 | |
HCA, Inc. | | | 5.25 | % | | | 06/15/2026 | | | | | | - | | | | | | - | | | | | | 2,415,000 | | | | | | 2,507,072 | | | | | | | | | | | | | | | | 2,415,000 | | | | | | 2,507,072 | |
HCA, Inc. | | | 5.88 | % | | | 02/15/2026 | | | | | | 1,270,000 | | | | | | 1,317,625 | | | | | | - | | | | | | - | | | | | | | | | | | | | | | | 1,270,000 | | | | | | 1,317,625 | |
HCA, Inc. | | | 7.50 | % | | | 02/15/2022 | | | | | | 3,410,000 | | | | | | 3,877,170 | | | | | | 5,561,000 | | | | | | 6,322,857 | | | | | | | | | | | | | | | | 8,971,000 | | | | | | 10,200,027 | |
HealthSouth Corp. | | | 5.75 | % | | | 11/01/2024 | | | | | | 2,295,000 | | | | | | 2,304,180 | | | | | | 3,893,000 | | | | | | 3,908,572 | | | | | | | | | | | | | | | | 6,188,000 | | | | | | 6,212,752 | |
HealthSouth Corp. | | | 5.75 | % | | | 09/15/2025 | | | | | | 1,278,000 | | | | | | 1,265,220 | | | | | | 1,195,000 | | | | | | 1,183,050 | | | | | | | | | | | | | | | | 2,473,000 | | | | | | 2,448,270 | |
LifePoint Health, Inc. | | | 5.38 | % | | | 05/01/2024 | | | | | | - | | | | | | - | | | | | | 2,834,000 | | | | | | 2,841,085 | | | | | | | | | | | | | | | | 2,834,000 | | | | | | 2,841,085 | |
LifePoint Health, Inc. | | | 5.50 | % | | | 12/01/2021 | | | | | | 3,940,000 | | | | | | 4,107,450 | | | | | | 1,477,000 | | | | | | 1,539,773 | | | | | | | | | | | | | | | | 5,417,000 | | | | | | 5,647,223 | |
LifePoint Health, Inc. | | | 5.88 | % | | | 12/01/2023 | | | | | | - | | | | | | - | | | | | | 886,000 | | | | | | 921,440 | | | | | | | | | | | | | | | | 886,000 | | | | | | 921,440 | |
Tenet Healthcare Corp. | | | 4.38 | % | | | 10/01/2021 | | | | | | 1,200,000 | | | | | | 1,191,000 | | | | | | 3,045,000 | | | | | | 3,022,163 | | | | | | | | | | | | | | | | 4,245,000 | | | | | | 4,213,163 | |
Tenet Healthcare Corp. | | | 5.00 | % | | | 03/01/2019 | | | | | | 745,000 | | | | | | 720,787 | | | | | | 2,042,000 | | | | | | 1,975,634 | | | | | | | | | | | | | | | | 2,787,000 | | | | | | 2,696,421 | |
Tenet Healthcare Corp. | | | 5.50 | % | | | 03/01/2019 | | | | | | 1,135,000 | | | | | | 1,117,975 | | | | | | 1,600,000 | | | | | | 1,576,000 | | | | | | | | | | | | | | | | 2,735,000 | | | | | | 2,693,975 | |
Tenet Healthcare Corp. | | | 6.00 | % | | | 10/01/2020 | | | | | | 1,410,000 | | | | | | 1,487,550 | | | | | | 1,293,000 | | | | | | 1,364,115 | | | | | | | | | | | | | | | | 2,703,000 | | | | | | 2,851,665 | |
Tenet Healthcare Corp. | | | 6.75 | % | | | 06/15/2023 | | | | | | 1,034,000 | | | | | | 990,055 | | | | | | 1,367,000 | | | | | | 1,308,903 | | | | | | | | | | | | | | | | 2,401,000 | | | | | | 2,298,958 | |
Tenet Healthcare Corp. | | | 8.13 | % | | | 04/01/2022 | | | | | | 4,042,000 | | | | | | 4,142,242 | | | | | | 4,211,000 | | | | | | 4,315,433 | | | | | | | | | | | | | | | | 8,253,000 | | | | | | 8,457,675 | |
Hotels, Restaurants & Leisure | | | | | | | | | | | | | | | | | | | | | | | | | | | | | | | | | | | | | | | | | | | | | | | | | | | | | | |
Boyd Gaming Corp. | | | 6.38 | % | | | 04/01/2026 | | | | | | 445,000 | | | | | | 465,025 | | | | | | 635,000 | | | | | | 663,575 | | | | | | | | | | | | | | | | 1,080,000 | | | | | | 1,128,600 | |
Boyd Gaming Corp. | | | 6.88 | % | | | 05/15/2023 | | | | | | 3,145,000 | | | | | | 3,349,425 | | | | | | 4,633,000 | | | | | | 4,934,145 | | | | | | | | | | | | | | | | 7,778,000 | | | | | | 8,283,570 | |
FelCor Lodging, LP | | | 5.63 | % | | | 03/01/2023 | | | | | | 2,680,000 | | | | | | 2,680,000 | | | | | | 3,655,000 | | | | | | 3,655,000 | | | | | | | | | | | | | | | | 6,335,000 | | | | | | 6,335,000 | |
International Game Technology PLC | | | 6.25 | % | | | 02/15/2022 | | | | | | 231,000 | | | | | | 234,754 | | | | | | 1,479,000 | | | | | | 1,503,034 | | | | | | | | | | | | | | | | 1,710,000 | | | | | | 1,737,788 | |
S-18
| | | | | | | | | | | | | | | | | | | | | | | | | | | | | | | | | | | | | | | | | | | | | | | | | | | | | | |
| | | | | | | | | | | TPP Master | | | | | TAF Destination | | | | | Adjustments | | | | | Combined Pro Forma Destination | |
| | | | | | | | | | | | | | | | | |
| | | Coupon Rate | | | Maturity Date | | | | | Principal | | | | | Value | | | | | Principal | | | | | Value | | | | | Principal | | | Value | | | | | Principal | | | | | Value | |
| | | | | | | | | | | | | | | | | | | | | | | | | | | | |
International Game Technology PLC | | | 6.50 | % | | | 02/15/2025 | | | | | $ | 8,218,000 | | | | | $ | 8,279,635 | | | | | $ | 9,162,000 | | | | | $ | 9,230,715 | | | | | | | | | | | | | | | $ | 17,380,000 | | | | | $ | 17,510,350 | |
MGM Growth Properties Operating Partnership, LP / MGP Escrow Co-Issuer, Inc. | | | 5.63 | % | | | 05/01/2024 | | | | | | 271,000 | | | | | | 286,583 | | | | | | 370,000 | | | | | | 391,275 | | | | | | | | | | | | | | | | 641,000 | | | | | | 677,858 | |
MGM Resorts International | | | 6.00 | % | | | 03/15/2023 | | | | | | 1,232,000 | | | | | | 1,299,760 | | | | | | 3,410,000 | | | | | | 3,597,550 | | | | | | | | | | | | | | | | 4,642,000 | | | | | | 4,897,310 | |
MGM Resorts International | | | 6.63 | % | | | 12/15/2021 | | | | | | 3,185,000 | | | | | | 3,463,687 | | | | | | 4,410,000 | | | | | | 4,795,874 | | | | | | | | | | | | | | | | 7,595,000 | | | | | | 8,259,561 | |
MGM Resorts International | | | 6.75 | % | | | 10/01/2020 | | | | | | - | | | | | | - | | | | | | 2,134,000 | | | | | | 2,331,395 | | | | | | | | | | | | | | | | 2,134,000 | | | | | | 2,331,395 | |
MGM Resorts International | | | 7.75 | % | | | 03/15/2022 | | | | | | 3,385,000 | | | | | | 3,825,050 | | | | | | - | | | | | | - | | | | | | | | | | | | | | | | 3,385,000 | | | | | | 3,825,050 | |
MGM Resorts International | | | 11.38 | % | | | 03/01/2018 | | | | | | 1,911,000 | | | | | | 2,173,763 | | | | | | 1,331,000 | | | | | | 1,514,013 | | | | | | | | | | | | | | | | 3,242,000 | | | | | | 3,687,776 | |
NCL Corp., Ltd. | | | 4.63 | % | | | 11/15/2020 | | | | | | 2,630,000 | | | | | | 2,625,056 | | | | | | 3,565,000 | | | | | | 3,558,298 | | | | | | | | | | | | | | | | 6,195,000 | | | | | | 6,183,354 | |
New Cotai LLC / New Cotai Capital Corp. | | | 10.63 | % | | | 05/01/2019 | | | | | | 2,668,206 | | | | | | 1,600,368 | | | | | | - | | | | | | - | | | | | | | | | | | | | | | | 2,668,206 | | | | | | 1,600,368 | |
Scientific Games International, Inc. | | | 7.00 | % | | | 01/01/2022 | | | | | | 683,000 | | | | | | 686,415 | | | | | | 1,050,000 | | | | | | 1,055,250 | | | | | | | | | | | | | | | | 1,733,000 | | | | | | 1,741,665 | |
Scientific Games International, Inc. | | | 10.00 | % | | | 12/01/2022 | | | | | | 7,477,000 | | | | | | 6,075,062 | | | | | | 10,124,000 | | | | | | 8,225,750 | | | | | | | | | | | | | | | | 17,601,000 | | | | | | 14,300,812 | |
Studio City Finance, Ltd. | | | 8.50 | % | | | 12/01/2020 | | | | | | 3,325,000 | | | | | | 3,358,250 | | | | | | 3,820,000 | | | | | | 3,858,200 | | | | | | | | | | | | | | | | 7,145,000 | | | | | | 7,216,450 | |
Viking Cruises, Ltd. | | | 6.25 | % | | | 05/15/2025 | | | | | | 1,424,000 | | | | | | 1,075,120 | | | | | | 3,502,000 | | | | | | 2,644,010 | | | | | | | | | | | | | | | | 4,926,000 | | | | | | 3,719,130 | |
Viking Cruises, Ltd. | | | 8.50 | % | | | 10/15/2022 | | | | | | 5,205,000 | | | | | | 4,437,262 | | | | | | 5,171,000 | | | | | | 4,408,277 | | | | | | | | | | | | | | | | 10,376,000 | | | | | | 8,845,539 | |
Waterford Gaming LLC / Waterford Gaming Financial Corp. | | | 8.63 | % | | | 09/15/2049 | | | | | | 1,066,313 | | | | | | - | | | | | | - | | | | | | - | | | | | | | | | | | | | | | | 1,066,313 | | | | | | - | |
Household Durables | | | | | | | | | | | | | | | | | | | | | | | | | | | | | | | | | | | | | | | | | | | | | | | | | | | | | | |
Beazer Homes USA, Inc. | | | 5.75 | % | | | 06/15/2019 | | | | | | 3,139,000 | | | | | | 2,856,490 | | | | | | 675,000 | | | | | | 614,250 | | | | | | | | | | | | | | | | 3,814,000 | | | | | | 3,470,740 | |
Beazer Homes USA, Inc. | | | 6.63 | % | | | 04/15/2018 | | | | | | - | | | | | | - | | | | | | 17,000 | | | | | | 17,298 | | | | | | | | | | | | | | | | 17,000 | | | | | | 17,298 | |
Beazer Homes USA, Inc. | | | 7.25 | % | | | 02/01/2023 | | | | | | 925,000 | | | | | | 756,187 | | | | | | 6,761,000 | | | | | | 5,527,117 | | | | | | | | | | | | | | | | 7,686,000 | | | | | | 6,283,304 | |
Beazer Homes USA, Inc. | | | 7.50 | % | | | 09/15/2021 | | | | | | 1,824,000 | | | | | | 1,577,760 | | | | | | 784,000 | | | | | | 678,160 | | | | | | | | | | | | | | | | 2,608,000 | | | | | | 2,255,920 | |
Beazer Homes USA, Inc. | | | 9.13 | % | | | 05/15/2019 | | | | | | 2,020,000 | | | | | | 1,994,750 | | | | | | 2,812,000 | | | | | | 2,776,850 | | | | | | | | | | | | | | | | 4,832,000 | | | | | | 4,771,600 | |
KB Home | | | 7.00 | % | | | 12/15/2021 | | | | | | 1,975,000 | | | | | | 1,984,875 | | | | | | 2,306,000 | | | | | | 2,317,530 | | | | | | | | | | | | | | | | 4,281,000 | | | | | | 4,302,405 | |
KB Home | | | 7.25 | % | | | 06/15/2018 | | | | | | - | | | | | | - | | | | | | 2,765,000 | | | | | | 2,958,550 | | | | | | | | | | | | | | | | 2,765,000 | | | | | | 2,958,550 | |
KB Home | | | 7.63 | % | | | 05/15/2023 | | | | | | 2,998,000 | | | | | | 3,042,970 | | | | | | 3,480,000 | | | | | | 3,532,200 | | | | | | | | | | | | | | | | 6,478,000 | | | | | | 6,575,170 | |
KB Home | | | 8.00 | % | | | 03/15/2020 | | | | | | 910,000 | | | | | | 973,700 | | | | | | 990,000 | | | | | | 1,059,300 | | | | | | | | | | | | | | | | 1,900,000 | | | | | | 2,033,000 | |
KB Home | | | 9.10 | % | | | 09/15/2017 | | | | | | 1,158,000 | | | | | | 1,233,270 | | | | | | - | | | | | | - | | | | | | | | | | | | | | | | 1,158,000 | | | | | | 1,233,270 | |
Meritage Homes Corp. | | | 4.50 | % | | | 03/01/2018 | | | | | | 6,072,000 | | | | | | 6,163,080 | | | | | | 2,098,000 | | | | | | 2,129,470 | | | | | | | | | | | | | | | | 8,170,000 | | | | | | 8,292,550 | |
Meritage Homes Corp. | | | 7.00 | % | | | 04/01/2022 | | | | | | - | | | | | | - | | | | | | 115,000 | | | | | | 124,200 | | | | | | | | | | | | | | | | 115,000 | | | | | | 124,200 | |
Meritage Homes Corp. | | | 7.15 | % | | | 04/15/2020 | | | | | | - | | | | | | - | | | | | | 3,883,000 | | | | | | 4,164,518 | | | | | | | | | | | | | | | | 3,883,000 | | | | | | 4,164,518 | |
Tempur Sealy International, Inc. | | | 5.50 | % | | | 06/15/2026 | | | | | | 1,300,000 | | | | | | 1,277,250 | | | | | | 1,861,000 | | | | | | 1,828,433 | | | | | | | | | | | | | | | | 3,161,000 | | | | | | 3,105,683 | |
Tempur Sealy International, Inc. | | | 5.63 | % | | | 10/15/2023 | | | | | | 2,136,000 | | | | | | 2,200,080 | | | | | | 2,797,000 | | | | | | 2,880,910 | | | | | | | | | | | | | | | | 4,933,000 | | | | | | 5,080,990 | |
Household Products | | | | | | | | | | | | | | | | | | | | | | | | | | | | | | | | | | | | | | | | | | | | | | | | | | | | | | |
Kronos Acquisition Holdings, Inc. | | | 9.00 | % | | | 08/15/2023 | | | | | | 1,740,000 | | | | | | 1,705,200 | | | | | | 2,365,000 | | | | | | 2,317,700 | | | | | | | | | | | | | | | | 4,105,000 | | | | | | 4,022,900 | |
Reynolds Group Issuer, Inc. / Reynolds Group Issuer LLC | | | 5.75 | % | | | 10/15/2020 | | | | | | - | | | | | | - | | | | | | 745,000 | | | | | | 769,213 | | | | | | | | | | | | | | | | 745,000 | | | | | | 769,213 | |
Reynolds Group Issuer, Inc. / Reynolds Group Issuer LLC | | | 6.88 | % | | | 02/15/2021 | | | | | | 3,693,000 | | | | | | 3,803,790 | | | | | | 1,210,000 | | | | | | 1,246,300 | | | | | | | | | | | | | | | | 4,903,000 | | | | | | 5,050,090 | |
Reynolds Group Issuer, Inc. / Reynolds Group Issuer LLC | | | 7.13 | % | | | 04/15/2019 | | | | | | 2,472,000 | | | | | | 2,509,080 | | | | | | - | | | | | | - | | | | | | | | | | | | | | | | 2,472,000 | | | | | | 2,509,080 | |
Reynolds Group Issuer, Inc. / Reynolds Group Issuer LLC | | | 9.88 | % | | | 08/15/2019 | | | | | | 2,210,000 | | | | | | 2,281,825 | | | | | | 6,542,000 | | | | | | 6,754,615 | | | | | | | | | | | | | | | | 8,752,000 | | | | | | 9,036,440 | |
Independent Power & Renewable Electricity Producers | | | | | | | | | | | | | | | | | | | | | | | | | | | | | | | | | | | | | | | | | | | | | | | | | | | | | | |
Calpine Corp. | | | 5.25 | % | | | 06/01/2026 | | | | | | 1,727,000 | | | | | | 1,722,683 | | | | | | 2,336,000 | | | | | | 2,330,160 | | | | | | | | | | | | | | | | 4,063,000 | | | | | | 4,052,843 | |
Calpine Corp. | | | 5.38 | % | | | 01/15/2023 | | | | | | 370,000 | | | | | | 360,750 | | | | | | 500,000 | | | | | | 487,500 | | | | | | | | | | | | | | | | 870,000 | | | | | | 848,250 | |
Calpine Corp. | | | 5.75 | % | | | 01/15/2025 | | | | | | 1,778,000 | | | | | | 1,729,105 | | | | | | 2,635,000 | | | | | | 2,562,538 | | | | | | | | | | | | | | | | 4,413,000 | | | | | | 4,291,643 | |
Calpine Corp. | | | 6.00 | % | | | 01/15/2022 | | | | | | 2,597,000 | | | | | | 2,720,357 | | | | | | 3,560,000 | | | | | | 3,729,100 | | | | | | | | | | | | | | | | 6,157,000 | | | | | | 6,449,457 | |
NRG Energy, Inc. | | | 6.63 | % | | | 03/15/2023 | | | | | | - | | | | | | - | | | | | | 1,500,000 | | | | | | 1,477,500 | | | | | | | | | | | | | | | | 1,500,000 | | | | | | 1,477,500 | |
NRG Energy, Inc. | | | 7.25 | % | | | 05/15/2026 | | | | | | 2,906,000 | | | | | | 2,891,470 | | | | | | 1,223,000 | | | | | | 1,216,885 | | | | | | | | | | | | | | | | 4,129,000 | | | | | | 4,108,355 | |
NRG Energy, Inc. | | | 7.88 | % | | | 05/15/2021 | | | | | | 6,278,000 | | | | | | 6,497,730 | | | | | | 10,746,000 | | | | | | 11,122,110 | | | | | | | | | | | | | | | | 17,024,000 | | | | | | 17,619,840 | |
NRG Energy, Inc. | | | 8.25 | % | | | 09/01/2020 | | | | | | 2,045,000 | | | | | | 2,114,673 | | | | | | 596,000 | | | | | | 616,306 | | | | | | | | | | | | | | | | 2,641,000 | | | | | | 2,730,979 | |
Insurance | | | | | | | | | | | | | | | | | | | | | | | | | | | | | | | | | | | | | | | | | | | | | | | | | | | | | | |
Genworth Holdings, Inc. | | | 4.80 | % | | | 02/15/2024 | | | | | | - | | | | | | - | | | | | | 2,000,000 | | | | | | 1,495,000 | | | | | | | | | | | | | | | | 2,000,000 | | | | | | 1,495,000 | |
Genworth Holdings, Inc. | | | 4.90 | % | | | 08/15/2023 | | | | | | 577,000 | | | | | | 434,193 | | | | | | 1,857,000 | | | | | | 1,397,393 | | | | | | | | | | | | | | | | 2,434,000 | | | | | | 1,831,586 | |
Genworth Holdings, Inc. | | | 7.20 | % | | | 02/15/2021 | | | | | | 1,023,000 | | | | | | 861,878 | | | | | | 3,515,000 | | | | | | 2,961,388 | | | | | | | | | | | | | | | | 4,538,000 | | | | | | 3,823,266 | |
Genworth Holdings, Inc. | | | 7.63 | % | | | 09/24/2021 | | | | | | 4,494,000 | | | | | | 3,825,517 | | | | | | 1,426,000 | | | | | | 1,213,882 | | | | | | | | | | | | | | | | 5,920,000 | | | | | | 5,039,399 | |
Lincoln National Corp. | | | 2.99 | % | | | 05/17/2066 | | | | | | 8,111,000 | | | | | | 5,596,590 | | | | | | 10,839,000 | | | | | | 7,478,910 | | | | | | | | | | | | | | | | 18,950,000 | | | | | | 13,075,500 | |
IT Services | | | | | | | | | | | | | | | | | | | | | | | | | | | | | | | | | | | | | | | | | | | | | | | | | | | | | | |
First Data Corp. | | | 5.00 | % | | | 01/15/2024 | | | | | | 1,072,000 | | | | | | 1,074,680 | | | | | | 1,451,000 | | | | | | 1,454,628 | | | | | | | | | | | | | | | | 2,523,000 | | | | | | 2,529,308 | |
First Data Corp. | | | 5.75 | % | | | 01/15/2024 | | | | | | 2,320,000 | | | | | | 2,302,600 | | | | | | 2,000,000 | | | | | | 1,985,000 | | | | | | | | | | | | | | | | 4,320,000 | | | | | | 4,287,600 | |
First Data Corp. | | | 6.75 | % | | | 11/01/2020 | | | | | | 6,218,000 | | | | | | 6,494,639 | | | | | | 7,521,000 | | | | | | 7,855,609 | | | | | | | | | | | | | | | | 13,739,000 | | | | | | 14,350,248 | |
First Data Corp. | | | 7.00 | % | | | 12/01/2023 | | | | | | 986,000 | | | | | | 998,325 | | | | | | 1,355,000 | | | | | | 1,371,938 | | | | | | | | | | | | | | | | 2,341,000 | | | | | | 2,370,263 | |
Machinery | | | | | | | | | | | | | | | | | | | | | | | | | | | | | | | | | | | | | | | | | | | | | | | | | | | | | | |
CNH Industrial Capital LLC | | | 3.88 | % | | | 07/16/2018 | | | | | | 1,110,000 | | | | | | 1,115,550 | | | | | | 2,515,000 | | | | | | 2,527,575 | | | | | | | | | | | | | | | | 3,625,000 | | | | | | 3,643,125 | |
Meritor, Inc. | | | 6.25 | % | | | 02/15/2024 | | | | | | 1,852,000 | | | | | | 1,583,460 | | | | | | 2,328,000 | | | | | | 1,990,440 | | | | | | | | | | | | | | | | 4,180,000 | | | | | | 3,573,900 | |
Meritor, Inc. | | | 6.75 | % | | | 06/15/2021 | | | | | | 910,000 | | | | | | 850,850 | | | | | | 1,047,000 | | | | | | 978,945 | | | | | | | | | | | | | | | | 1,957,000 | | | | | | 1,829,795 | |
Wise Metals Group LLC / Wise Alloys Finance Corp. | | | 8.75 | % | | | 12/15/2018 | | | | | | 1,616,000 | | | | | | 1,486,720 | | | | | | 2,192,000 | | | | | | 2,016,640 | | | | | | | | | | | | | | | | 3,808,000 | | | | | | 3,503,360 | |
Media | | | | | | | | | | | | | | | | | | | | | | | | | | | | | | | | | | | | | | | | | | | | | | | | | | | | | | |
Adelphia Communications Corp. | | | 9.25 | % | | | 10/01/2049 | | | | | | 1,305,000 | | | | | | 6,525 | | | | | | - | | | | | | - | | | | | | | | | | | | | | | | 1,305,000 | | | | | | 6,525 | |
Adelphia Communications Corp. | | | 10.25 | % | | | 06/15/2049 | | | | | | 840,000 | | | | | | 4,200 | | | | | | - | | | | | | - | | | | | | | | | | | | | | | | 840,000 | | | | | | 4,200 | |
Adelphia Communications Corp. | | | 10.25 | % | | | 11/01/2049 | | | | | | 620,000 | | | | | | 3,100 | | | | | | - | | | | | | - | | | | | | | | | | | | | | | | 620,000 | | | | | | 3,100 | |
Cablevision Systems Corp. | | | 5.88 | % | | | 09/15/2022 | | | | | | 1,456,000 | | | | | | 1,304,576 | | | | | | 3,274,000 | | | | | | 2,933,504 | | | | | | | | | | | | | | | | 4,730,000 | | | | | | 4,238,080 | |
Cablevision Systems Corp. | | | 7.75 | % | | | 04/15/2018 | | | | | | 3,805,000 | | | | | | 4,073,709 | | | | | | 3,999,000 | | | | | | 4,281,409 | | | | | | | | | | | | | | | | 7,804,000 | | | | | | 8,355,118 | |
Cablevision Systems Corp. | | | 8.00 | % | | | 04/15/2020 | | | | | | 3,129,000 | | | | | | 3,208,821 | | | | | | 3,987,000 | | | | | | 4,088,708 | | | | | | | | | | | | | | | | 7,116,000 | | | | | | 7,297,529 | |
CCO Holdings LLC / CCO Holdings Capital Corp. | | | 5.13 | % | | | 02/15/2023 | | | | | | - | | | | | | - | | | | | | 2,675,000 | | | | | | 2,716,489 | | | | | | | | | | | | | | | | 2,675,000 | | | | | | 2,716,489 | |
CCO Holdings LLC / CCO Holdings Capital Corp. | | | 5.25 | % | | | 09/30/2022 | | | | | | 885,000 | | | | | | 908,231 | | | | | | - | | | | | | - | | | | | | | | | | | | | | | | 885,000 | | | | | | 908,231 | |
CCO Holdings LLC / CCO Holdings Capital Corp. | | | 5.50 | % | | | 05/01/2026 | | | | | | 419,000 | | | | | | 425,285 | | | | | | 488,000 | | | | | | 495,320 | | | | | | | | | | | | | | | | 907,000 | | | | | | 920,605 | |
CCO Holdings LLC / CCO Holdings Capital Corp. | | | 5.75 | % | | | 01/15/2024 | | | | | | 60,000 | | | | | | 63,144 | | | | | | - | | | | | | - | | | | | | | | | | | | | | | | 60,000 | | | | | | 63,144 | |
CCO Holdings LLC / CCO Holdings Capital Corp. | | | 5.75 | % | | | 02/15/2026 | | | | | | 1,750,000 | | | | | | 1,802,500 | | | | | | 400,000 | | | | | | 412,000 | | | | | | | | | | | | | | | | 2,150,000 | | | | | | 2,214,500 | |
CCO Holdings LLC / CCO Holdings Capital Corp. | | | 5.88 | % | | | 04/01/2024 | | | | | | - | | | | | | - | | | | | | 1,000,000 | | | | | | 1,037,500 | | | | | | | | | | | | | | | | 1,000,000 | | | | | | 1,037,500 | |
Cequel Communications Holdings I LLC / Cequel Capital Corp. | | | 6.38 | % | | | 09/15/2020 | | | | | | 1,400,000 | | | | | | 1,423,520 | | | | | | 1,003,000 | | | | | | 1,019,850 | | | | | | | | | | | | | | | | 2,403,000 | | | | | | 2,443,370 | |
Cequel Communications Holdings I LLC / Cequel Capital Corp. | | | 7.75 | % | | | 07/15/2025 | | | | | | 500,000 | | | | | | 521,250 | | | | | | 550,000 | | | | | | 573,375 | | | | | | | | | | | | | | | | 1,050,000 | | | | | | 1,094,625 | |
Clear Channel Worldwide Holdings, Inc. | | | 6.50 | % | | | 11/15/2022 | | | | | | 2,798,000 | | | | | | 2,693,075 | | | | | | 4,389,000 | | | | | | 4,224,413 | | | | | | | | | | | | | | | | 7,187,000 | | | | | | 6,917,488 | |
Clear Channel Worldwide Holdings, Inc. | | | 6.50 | % | | | 11/15/2022 | | | | | | 1,751,000 | | | | | | 1,751,000 | | | | | | 2,900,000 | | | | | | 2,900,000 | | | | | | | | | | | | | | | | 4,651,000 | | | | | | 4,651,000 | |
Clear Channel Worldwide Holdings, Inc. | | | 7.63 | % | | | 03/15/2020 | | | | | | 385,000 | | | | | | 351,313 | | | | | | 3,071,000 | | | | | | 2,802,288 | | | | | | | | | | | | | | | | 3,456,000 | | | | | | 3,153,601 | |
Clear Channel Worldwide Holdings, Inc. | | | 7.63 | % | | | 03/15/2020 | | | | | | 8,431,000 | | | | | | 8,022,096 | | | | | | 7,827,000 | | | | | | 7,447,390 | | | | | | | | | | | | | | | | 16,258,000 | | | | | | 15,469,486 | |
CSC Holdings LLC | | �� | 6.75 | % | | | 11/15/2021 | | | | | | 185,000 | | | | | | 188,700 | | | | | | - | | | | | | - | | | | | | | | | | | | | | | | 185,000 | | | | | | 188,700 | |
DISH DBS Corp. | | | 5.00 | % | | | 03/15/2023 | | | | | | 750,000 | | | | | | 682,500 | | | | | | 2,820,000 | | | | | | 2,566,200 | | | | | | | | | | | | | | | | 3,570,000 | | | | | | 3,248,700 | |
DISH DBS Corp. | | | 5.88 | % | | | 07/15/2022 | | | | | | 1,970,000 | | | | | | 1,915,825 | | | | | | 1,030,000 | | | | | | 1,001,675 | | | | | | | | | | | | | | | | 3,000,000 | | | | | | 2,917,500 | |
DISH DBS Corp. | | | 5.88 | % | | | 11/15/2024 | | | | | | 1,904,000 | | | | | | 1,770,720 | | | | | | 7,719,000 | | | | | | 7,178,670 | | | | | | | | | | | | | | | | 9,623,000 | | | | | | 8,949,390 | |
DISH DBS Corp. | | | 6.75 | % | | | 06/01/2021 | | | | | | 3,215,000 | | | | | | 3,331,544 | | | | | | - | | | | | | - | | | | | | | | | | | | | | | | 3,215,000 | | | | | | 3,331,544 | |
DISH DBS Corp. | | | 7.75 | % | | | 07/01/2026 | | | | | | 1,230,000 | | | | | | 1,266,900 | | | | | | 913,000 | | | | | | 940,390 | | | | | | | | | | | | | | | | 2,143,000 | | | | | | 2,207,290 | |
DISH DBS Corp. | | | 7.88 | % | | | 09/01/2019 | | | | | | 3,253,000 | | | | | | 3,586,432 | | | | | | 3,950,000 | | | | | | 4,354,874 | | | | | | | | | | | | | | | | 7,203,000 | | | | | | 7,941,306 | |
iHeartCommunications, Inc. | | | 9.00 | % | | | 03/01/2021 | | | | | | 250,000 | | | | | | 176,250 | | | | | | 440,000 | | | | | | 310,200 | | | | | | | | | | | | | | | | 690,000 | | | | | | 486,450 | |
iHeartCommunications, Inc. | | | 10.63 | % | | | 03/15/2023 | | | | | | 1,748,000 | | | | | | 1,210,490 | | | | | | 2,082,000 | | | | | | 1,441,785 | | | | | | | | | | | | | | | | 3,830,000 | | | | | | 2,652,275 | |
Regal Entertainment Group | | | 5.75 | % | | | 02/01/2025 | | | | | | 1,893,000 | | | | | | 1,864,605 | | | | | | 1,657,000 | | | | | | 1,632,145 | | | | | | | | | | | | | | | | 3,550,000 | | | | | | 3,496,750 | |
Regal Entertainment Group | | | 5.75 | % | | | 06/15/2023 | | | | | | 345,000 | | | | | | 347,588 | | | | | | 1,365,000 | | | | | | 1,375,238 | | | | | | | | | | | | | | | | 1,710,000 | | | | | | 1,722,826 | |
Unitymedia GmbH | | | 6.13 | % | | | 01/15/2025 | | | | | | 2,106,000 | | | | | | 2,158,439 | | | | | | 3,076,000 | | | | | | 3,152,592 | | | | | | | | | | | | | | | | 5,182,000 | | | | | | 5,311,031 | |
Univision Communications, Inc. | | | 5.13 | % | | | 02/15/2025 | | | | | | 898,000 | | | | | | 887,898 | | | | | | 1,444,000 | | | | | | 1,427,755 | | | | | | | | | | | | | | | | 2,342,000 | | | | | | 2,315,653 | |
Univision Communications, Inc. | | | 6.75 | % | | | 09/15/2022 | | | | | | 9,061,000 | | | | | | 9,559,355 | | | | | | 8,066,000 | | | | | | 8,509,630 | | | | | | | | | | | | | | | | 17,127,000 | | | | | | 18,068,985 | |
Metals & Mining | | | | | | | | | | | | | | | | | | | | | | | | | | | | | | | | | | | | | | | | | | | | | | | | | | | | | | |
ArcelorMittal | | | 8.00 | % | | | 10/15/2039 | | | | | | 3,333,000 | | | | | | 3,233,010 | | | | | | 4,255,000 | | | | | | 4,127,350 | | | | | | | | | | | | | | | | 7,588,000 | | | | | | 7,360,360 | |
Constellium NV | | | 5.75 | % | | | 05/15/2024 | | | | | | 2,949,000 | | | | | | 2,322,337 | | | | | | 3,299,000 | | | | | | 2,597,962 | | | | | | | | | | | | | | | | 6,248,000 | | | | | | 4,920,299 | |
Constellium NV | | | 7.88 | % | | | 04/01/2021 | | | | | | 646,000 | | | | | | 666,187 | | | | | | 908,000 | | | | | | 936,374 | | | | | | | | | | | | | | | | 1,554,000 | | | | | | 1,602,561 | |
Constellium NV | | | 8.00 | % | | | 01/15/2023 | | | | | | 1,318,000 | | | | | | 1,159,840 | | | | | | 2,130,000 | | | | | | 1,874,400 | | | | | | | | | | | | | | | | 3,448,000 | | | | | | 3,034,240 | |
FMG Resources Pty, Ltd. | | | 9.75 | % | | | 03/01/2022 | | | | | | 856,000 | | | | | | 944,810 | | | | | | 946,000 | | | | | | 1,044,148 | | | | | | | | | | | | | | | | 1,802,000 | | | | | | 1,988,958 | |
Freeport-McMoRan, Inc. | | | 5.45 | % | | | 03/15/2043 | | | | | | 2,750,000 | | | | | | 2,206,875 | | | | | | 3,800,000 | | | | | | 3,049,500 | | | | | | | | | | | | | | | | 6,550,000 | | | | | | 5,256,375 | |
Novelis, Inc. | | | 8.38 | % | | | 12/15/2017 | | | | | | 2,045,000 | | | | | | 2,091,012 | | | | | | 700,000 | | | | | | 715,750 | | | | | | | | | | | | | | | | 2,745,000 | | | | | | 2,806,762 | |
Novelis, Inc. | | | 8.75 | % | | | 12/15/2020 | | | | | | 307,000 | | | | | | 320,048 | | | | | | 2,545,000 | | | | | | 2,653,163 | | | | | | | | | | | | | | | | 2,852,000 | | | | | | 2,973,211 | |
Teck Resources, Ltd. | | | 3.75 | % | | | 02/01/2023 | | | | | | 691,000 | | | | | | 525,160 | | | | | | 882,000 | | | | | | 670,320 | | | | | | | | | | | | | | | | 1,573,000 | | | | | | 1,195,480 | |
Teck Resources, Ltd. | | | 6.00 | % | | | 08/15/2040 | | | | | | 635,000 | | | | | | 444,500 | | | | | | 790,000 | | | | | | 553,000 | | | | | | | | | | | | | | | | 1,425,000 | | | | | | 997,500 | |
Teck Resources, Ltd. | | | 6.25 | % | | | 07/15/2041 | | | | | | 2,040,000 | | | | | | 1,448,400 | | | | | | 1,973,000 | | | | | | 1,400,830 | | | | | | | | | | | | | | | | 4,013,000 | | | | | | 2,849,230 | |
Teck Resources, Ltd. | | | 8.00 | % | | | 06/01/2021 | | | | | | 415,000 | | | | | | 427,450 | | | | | | 563,000 | | | | | | 579,890 | | | | | | | | | | | | | | | | 978,000 | | | | | | 1,007,340 | |
Teck Resources, Ltd. | | | 8.50 | % | | | 06/01/2024 | | | | | | 415,000 | | | | | | 430,563 | | | | | | 563,000 | | | | | | 584,113 | | | | | | | | | | | | | | | | 978,000 | | | | | | 1,014,676 | |
Multiline Retail | | | | | | | | | | | | | | | | | | | | | | | | | | | | | | | | | | | | | | | | | | | | | | | | | | | | | | |
Dollar Tree, Inc. | | | 5.25 | % | | | 03/01/2020 | | | | | | 207,000 | | | | | | 213,210 | | | | | | 333,000 | | | | | | 342,990 | | | | | | | | | | | | | | | | 540,000 | | | | | | 556,200 | |
Dollar Tree, Inc. | | | 5.75 | % | | | 03/01/2023 | | | | | | 1,117,000 | | | | | | 1,186,813 | | | | | | 1,138,000 | | | | | | 1,209,125 | | | | | | | | | | | | | | | | 2,255,000 | | | | | | 2,395,938 | |
Oil, Gas & Consumable Fuels | | | | | | | | | | | | | | | | | | | | | | | | | | | | | | | | | | | | | | | | | | | | | | | | | | | | | | |
Antero Resources Corp. | | | 5.38 | % | | | 11/01/2021 | | | | | | 861,000 | | | | | | 841,628 | | | | | | 1,360,000 | | | | | | 1,329,400 | | | | | | | | | | | | | | | | 2,221,000 | | | | | | 2,171,028 | |
Berry Petroleum Co. LLC | | | 6.38 | % | | | 09/15/2022 | | | | | | 1,625,000 | | | | | | 560,625 | | | | | | - | | | | | | - | | | | | | | | | | | | | | | | 1,625,000 | | | | | | 560,625 | |
BreitBurn Energy Partners, LP / BreitBurn Finance Corp. | | | 7.88 | % | | | 04/15/2022 | | | | | | 3,505,000 | | | | | | 701,000 | | | | | | 4,169,000 | | | | | | 833,800 | | | | | | | | | | | | | | | | 7,674,000 | | | | | | 1,534,800 | |
Carrizo Oil & Gas, Inc. | | | 7.50 | % | | | 09/15/2020 | | | | | | 1,749,000 | | | | | | 1,770,862 | | | | | | 2,481,000 | | | | | | 2,512,012 | | | | | | | | | | | | | | | | 4,230,000 | | | | | | 4,282,874 | |
Chesapeake Energy Corp. | | | 8.00 | % | | | 12/15/2022 | | | | | | 3,216,000 | | | | | | 2,725,560 | | | | | | 4,383,000 | | | | | | 3,714,593 | | | | | | | | | | | | | | | | 7,599,000 | | | | | | 6,440,153 | |
CITGO Holding, Inc. | | | 10.75 | % | | | 02/15/2020 | | | | | | 4,231,000 | | | | | | 4,252,155 | | | | | | 3,857,000 | | | | | | 3,876,285 | | | | | | | | | | | | | | | | 8,088,000 | | | | | | 8,128,440 | |
S-19
| | | | | | | | | | | | | | | | | | | | | | | | | | | | | | | | | | | | | | | | | | | | | | | | | | | | | | |
| | | | | | | | | | | TPP Master | | | | | TAF Destination | | | | | Adjustments | | | | | Combined Pro Forma Destination | |
| | | | | | | | | | | | | | | | | |
| | | Coupon Rate | | | Maturity Date | | | | | Principal | | | | | Value | | | | | Principal | | | | | Value | | | | | Principal | | | Value | | | | | Principal | | | | | Value | |
| | | | | | | | | | | | | | | | | | | | | | | | | | | | |
CITGO Petroleum Corp. | | | 6.25 | % | | | 08/15/2022 | | | | | $ | 1,988,000 | | | | | $ | 1,903,510 | | | | | $ | 2,901,000 | | | | | $ | 2,777,708 | | | | | | | | | | | | | | | $ | 4,889,000 | | | | | $ | 4,681,218 | |
Concho Resources, Inc. | | | 5.50 | % | | | 04/01/2023 | | | | | | 2,076,000 | | | | | | 2,081,190 | | | | | | 2,784,000 | | | | | | 2,790,960 | | | | | | | | | | | | | | | | 4,860,000 | | | | | | 4,872,150 | |
Continental Resources, Inc. | | | 4.50 | % | | | 04/15/2023 | | | | | | 1,220,000 | | | | | | 1,137,650 | | | | | | 1,669,000 | | | | | | 1,556,343 | | | | | | | | | | | | | | | | 2,889,000 | | | | | | 2,693,993 | |
Continental Resources, Inc. | | | 5.00 | % | | | 09/15/2022 | | | | | | 1,694,000 | | | | | | 1,655,885 | | | | | | 2,328,000 | | | | | | 2,275,620 | | | | | | | | | | | | | | | | 4,022,000 | | | | | | 3,931,505 | |
Denbury Resources, Inc. | | | 5.50 | % | | | 05/01/2022 | | | | | | 1,087,000 | | | | | | 733,725 | | | | | | 1,105,000 | | | | | | 745,875 | | | | | | | | | | | | | | | | 2,192,000 | | | | | | 1,479,600 | |
EnLink Midstream Partners, LP | | | 4.15 | % | | | 06/01/2025 | | | | | | 908,000 | | | | | | 836,824 | | | | | | 1,240,000 | | | | | | 1,142,799 | | | | | | | | | | | | | | | | 2,148,000 | | | | | | 1,979,623 | |
EnLink Midstream Partners, LP | | | 5.05 | % | | | 04/01/2045 | | | | | | 2,391,000 | | | | | | 1,953,710 | | | | | | 3,302,000 | | | | | | 2,698,097 | | | | | | | | | | | | | | | | 5,693,000 | | | | | | 4,651,807 | |
EP Energy LLC / Everest Acquisition Finance, Inc. | | | 9.38 | % | | | 05/01/2020 | | | | | | 867,000 | | | | | | 613,403 | | | | | | 1,173,000 | | | | | | 829,898 | | | | | | | | | | | | | | | | 2,040,000 | | | | | | 1,443,301 | |
Freeport-McMoran Oil & Gas LLC / FCX Oil & Gas, Inc. | | | 6.50 | % | | | 11/15/2020 | | | | | | 766,000 | | | | | | 767,624 | | | | | | 956,000 | | | | | | 958,027 | | | | | | | | | | | | | | | | 1,722,000 | | | | | | 1,725,651 | |
Freeport-McMoran Oil & Gas LLC / FCX Oil & Gas, Inc. | | | 6.75 | % | | | 02/01/2022 | | | | | | 1,284,000 | | | | | | 1,258,722 | | | | | | 1,783,000 | | | | | | 1,747,898 | | | | | | | | | | | | | | | | 3,067,000 | | | | | | 3,006,620 | |
Freeport-McMoran Oil & Gas LLC / FCX Oil & Gas, Inc. | | | 6.88 | % | | | 02/15/2023 | | | | | | 1,279,000 | | | | | | 1,234,235 | | | | | | 1,777,000 | | | | | | 1,714,805 | | | | | | | | | | | | | | | | 3,056,000 | | | | | | 2,949,040 | |
Kinder Morgan, Inc. | | | 7.75 | % | | | 01/15/2032 | | | | | | - | | | | | | - | | | | | | 1,922,000 | | | | | | 2,163,709 | | | | | | | | | | | | | | | | 1,922,000 | | | | | | 2,163,709 | |
Kinder Morgan, Inc. | | | 8.05 | % | | | 10/15/2030 | | | | | | 2,000,000 | | | | | | 2,197,412 | | | | | | 486,000 | | | | | | 533,971 | | | | | | | | | | | | | | | | 2,486,000 | | | | | | 2,731,383 | |
Linn Energy LLC / Linn Energy Finance Corp. | | | 6.25 | % | | | 11/01/2019 | | | | | | - | | | | | | - | | | | | | 6,460,000 | | | | | | 1,082,050 | | | | | | | | | | | | | | | | 6,460,000 | | | | | | 1,082,050 | |
Linn Energy LLC / Linn Energy Finance Corp. | | | 6.50 | % | | | 05/15/2019 | | | | | | - | | | | | | - | | | | | | 1,350,000 | | | | | | 237,938 | | | | | | | | | | | | | | | | 1,350,000 | | | | | | 237,938 | |
Linn Energy LLC / Linn Energy Finance Corp. | | | 7.75 | % | | | 02/01/2021 | | | | | | 4,085,000 | | | | | | 694,450 | | | | | | 3,333,000 | | | | | | 566,610 | | | | | | | | | | | | | | | | 7,418,000 | | | | | | 1,261,060 | |
Linn Energy LLC / Linn Energy Finance Corp. | | | 8.63 | % | | | 04/15/2020 | | | | | | 3,225,000 | | | | | | 552,281 | | | | | | - | | | | | | - | | | | | | | | | | | | | | | | 3,225,000 | | | | | | 552,281 | |
Oasis Petroleum, Inc. | | | 6.50 | % | | | 11/01/2021 | | | | | | 365,000 | | | | | | 333,063 | | | | | | 706,000 | | | | | | 644,225 | | | | | | | | | | | | | | | | 1,071,000 | | | | | | 977,288 | |
Oasis Petroleum, Inc. | | | 7.25 | % | | | 02/01/2019 | | | | | | 1,613,000 | | | | | | 1,544,447 | | | | | | 1,411,000 | | | | | | 1,351,032 | | | | | | | | | | | | | | | | 3,024,000 | | | | | | 2,895,479 | |
ONEOK, Inc. | | | 7.50 | % | | | 09/01/2023 | | | | | | 2,181,000 | | | | | | 2,322,765 | | | | | | 3,027,000 | | | | | | 3,223,755 | | | | | | | | | | | | | | | | 5,208,000 | | | | | | 5,546,520 | |
Peabody Energy Corp. | | | 6.25 | % | | | 11/15/2021 | | | | | | 420,000 | | | | | | 55,650 | | | | | | 516,000 | | | | | | 68,370 | | | | | | | | | | | | | | | | 936,000 | | | | | | 124,020 | |
Peabody Energy Corp. | | | 6.50 | % | | | 09/15/2020 | | | | | | 1,000,000 | | | | | | 132,500 | | | | | | 1,440,000 | | | | | | 190,800 | | | | | | | | | | | | | | | | 2,440,000 | | | | | | 323,300 | |
Peabody Energy Corp. | | | 10.00 | % | | | 03/15/2022 | | | | | | 1,414,000 | | | | | | 187,355 | | | | | | 1,992,000 | | | | | | 263,940 | | | | | | | | | | | | | | | | 3,406,000 | | | | | | 451,295 | |
Rose Rock Midstream, LP / Rose Rock Finance Corp. | | | 5.63 | % | | | 11/15/2023 | | | | | | 1,495,000 | | | | | | 1,300,650 | | | | | | 2,018,000 | | | | | | 1,755,660 | | | | | | | | | | | | | | | | 3,513,000 | | | | | | 3,056,310 | |
SM Energy Co. | | | 5.63 | % | | | 06/01/2025 | | | | | | - | | | | | | - | | | | | | 929,000 | | | | | | 798,940 | | | | | | | | | | | | | | | | 929,000 | | | | | | 798,940 | |
SM Energy Co. | | | 6.13 | % | | | 11/15/2022 | | | | | | 3,265,000 | | | | | | 2,999,719 | | | | | | - | | | | | | - | | | | | | | | | | | | | | | | 3,265,000 | | | | | | 2,999,719 | |
SM Energy Co. | | | 6.50 | % | | | 11/15/2021 | | | | | | - | | | | | | - | | | | | | 3,027,000 | | | | | | 2,837,813 | | | | | | | | | | | | | | | | 3,027,000 | | | | | | 2,837,813 | |
SM Energy Co. | | | 6.50 | % | | | 01/01/2023 | | | | | | - | | | | | | - | | | | | | 723,000 | | | | | | 672,390 | | | | | | | | | | | | | | | | 723,000 | | | | | | 672,390 | |
Sunoco, LP / Sunoco Finance Corp. | | | 5.50 | % | | | 08/01/2020 | | | | | | 3,329,000 | | | | | | 3,287,387 | | | | | | 3,552,000 | | | | | | 3,507,599 | | | | | | | | | | | | | | | | 6,881,000 | | | | | | 6,794,986 | |
Sunoco, LP / Sunoco Finance Corp. | | | 6.25 | % | | | 04/15/2021 | | | | | | 621,000 | | | | | | 619,448 | | | | | | 662,000 | | | | | | 660,345 | | | | | | | | | | | | | | | | 1,283,000 | | | | | | 1,279,793 | |
Sunoco, LP / Sunoco Finance Corp. | | | 6.38 | % | | | 04/01/2023 | | | | | | 2,760,000 | | | | | | 2,739,300 | | | | | | 3,825,000 | | | | | | 3,796,313 | | | | | | | | | | | | | | | | 6,585,000 | | | | | | 6,535,613 | |
Targa Resources Partners, LP / Targa Resources Partners Finance Corp. | | | 5.00 | % | | | 01/15/2018 | | | | | | 1,545,000 | | | | | | 1,572,037 | | | | | | 2,142,000 | | | | | | 2,179,484 | | | | | | | | | | | | | | | | 3,687,000 | | | | | | 3,751,521 | |
Targa Resources Partners, LP / Targa Resources Partners Finance Corp. | | | 6.75 | % | | | 03/15/2024 | | | | | | 1,685,000 | | | | | | 1,727,125 | | | | | | 1,695,000 | | | | | | 1,737,375 | | | | | | | | | | | | | | | | 3,380,000 | | | | | | 3,464,500 | |
Tesoro Logistics, LP / Tesoro Logistics Finance Corp. | | | 6.38 | % | | | 05/01/2024 | | | | | | 1,115,000 | | | | | | 1,167,963 | | | | | | 1,525,000 | | | | | | 1,597,438 | | | | | | | | | | | | | | | | 2,640,000 | | | | | | 2,765,401 | |
Whiting Petroleum Corp. | | | 5.75 | % | | | 03/15/2021 | | | | | | 1,785,000 | | | | | | 1,610,962 | | | | | | 2,060,000 | | | | | | 1,859,149 | | | | | | | | | | | | | | | | 3,845,000 | | | | | | 3,470,111 | |
WPX Energy, Inc. | | | 8.25 | % | | | 08/01/2023 | | | | | | 2,100,000 | | | | | | 2,105,250 | | | | | | 2,865,000 | | | | | | 2,872,163 | | | | | | | | | | | | | | | | 4,965,000 | | | | | | 4,977,413 | |
Paper & Forest Products | | | | | | | | | | | | | | | | | | | | | | | | | | | | | | | | | | | | | | | | | | | | | | | | | | | | | | |
Boise Cascade Co. | | | 6.38 | % | | | 11/01/2020 | | | | | | 2,410,000 | | | | | | 2,458,200 | | | | | | 3,705,000 | | | | | | 3,779,100 | | | | | | | | | | | | | | | | 6,115,000 | | | | | | 6,237,300 | |
Personal Products | | | | | | | | | | | | | | | | | | | | | | | | | | | | | | | | | | | | | | | | | | | | | | | | | | | | | | |
Revlon Consumer Products Corp. | | | 5.75 | % | | | 02/15/2021 | | | | | | 4,540,000 | | | | | | 4,381,100 | | | | | | 5,000,000 | | | | | | 4,825,000 | | | | | | | | | | | | | | | | 9,540,000 | | | | | | 9,206,100 | |
Pharmaceuticals | | | | | | | | | | | | | | | | | | | | | | | | | | | | | | | | | | | | | | | | | | | | | | | | | | | | | | |
Endo, Ltd. / Endo Finance LLC | | | 6.00 | % | | | 07/15/2023 | | | | | | 3,180,000 | | | | | | 2,782,500 | | | | | | 5,732,000 | | | | | | 5,015,500 | | | | | | | | | | | | | | | | 8,912,000 | | | | | | 7,798,000 | |
Valeant Pharmaceuticals International, Inc. | | | 5.63 | % | | | 12/01/2021 | | | | | | 1,150,000 | | | | | | 948,750 | | | | | | 1,430,000 | | | | | | 1,179,750 | | | | | | | | | | | | | | | | 2,580,000 | | | | | | 2,128,500 | |
Valeant Pharmaceuticals International, Inc. | | | 5.88 | % | | | 05/15/2023 | | | | | | 2,853,000 | | | | | | 2,303,798 | | | | | | 7,787,000 | | | | | | 6,288,003 | | | | | | | | | | | | | | | | 10,640,000 | | | | | | 8,591,801 | |
Valeant Pharmaceuticals International, Inc. | | | 6.38 | % | | | 10/15/2020 | | | | | | 5,367,000 | | | | | | 4,615,620 | | | | | | 3,842,000 | | | | | | 3,304,120 | | | | | | | | | | | | | | | | 9,209,000 | | | | | | 7,919,740 | |
Valeant Pharmaceuticals International, Inc. | | | 7.50 | % | | | 07/15/2021 | | | | | | 830,000 | | | | | | 731,956 | | | | | | 1,453,000 | | | | | | 1,281,364 | | | | | | | | | | | | | | | | 2,283,000 | | | | | | 2,013,320 | |
Professional Services | | | | | | | | | | | | | | | | | | | | | | | | | | | | | | | | | | | | | | | | | | | | | | | | | | | | | | |
Ceridian HCM Holding, Inc. | | | 11.00 | % | | | 03/15/2021 | | | | | | 3,599,000 | | | | | | 3,581,005 | | | | | | 4,941,000 | | | | | | 4,916,295 | | | | | | | | | | | | | | | | 8,540,000 | | | | | | 8,497,300 | |
Real Estate Investment Trusts | | | | | | | | | | | | | | | | | | | | | | | | | | | | | | | | | | | | | | | | | | | | | | | | | | | | | | |
CBL & Associates, LP | | | 5.25 | % | | | 12/01/2023 | | | | | | 3,139,000 | | | | | | 2,978,098 | | | | | | 4,217,000 | | | | | | 4,000,841 | | | | | | | | | | | | | | | | 7,356,000 | | | | | | 6,978,939 | |
Communications Sales & Leasing, Inc. / CSL Capital LLC | | | 8.25 | % | | | 10/15/2023 | | | | | | 1,065,000 | | | | | | 1,080,315 | | | | | | 1,525,000 | | | | | | 1,546,930 | | | | | | | | | | | | | | | | 2,590,000 | | | | | | 2,627,245 | |
Equinix, Inc. | | | 5.88 | % | | | 01/15/2026 | | | | | | 2,127,000 | | | | | | 2,216,068 | | | | | | - | | | | | | - | | | | | | | | | | | | | | | | 2,127,000 | | | | | | 2,216,068 | |
Iron Mountain US Holdings, Inc. | | | 5.38 | % | | | 06/01/2026 | | | | | | 1,436,000 | | | | | | 1,392,920 | | | | | | 1,930,000 | | | | | | 1,872,100 | | | | | | | | | | | | | | | | 3,366,000 | | | | | | 3,265,020 | |
Iron Mountain, Inc. | | | 4.38 | % | | | 06/01/2021 | | | | | | 875,000 | | | | | | 881,562 | | | | | | 1,184,000 | | | | | | 1,192,879 | | | | | | | | | | | | | | | | 2,059,000 | | | | | | 2,074,441 | |
VEREIT Operating Partnership, LP | | | 4.13 | % | | | 06/01/2021 | | | | | | 940,000 | | | | | | 980,533 | | | | | | 1,270,000 | | | | | | 1,324,762 | | | | | | | | | | | | | | | | 2,210,000 | | | | | | 2,305,295 | |
Road & Rail | | | | | | | | | | | | | | | | | | | | | | | | | | | | | | | | | | | | | | | | | | | | | | | | | | | | | | |
Aviation Capital Group Corp. | | | 6.75 | % | | | 04/06/2021 | | | | | | 2,779,000 | | | | | | 3,140,270 | | | | | | 3,741,000 | | | | | | 4,227,330 | | | | | | | | | | | | | | | | 6,520,000 | | | | | | 7,367,600 | |
Hertz Corp. | | | 5.88 | % | | | 10/15/2020 | | | | | | - | | | | | | - | | | | | | 2,891,000 | | | | | | 2,963,275 | | | | | | | | | | | | | | | | 2,891,000 | | | | | | 2,963,275 | |
Hertz Corp. | | | 6.75 | % | | | 04/15/2019 | | | | | | - | | | | | | - | | | | | | 4,050,000 | | | | | | 4,134,665 | | | | | | | | | | | | | | | | 4,050,000 | | | | | | 4,134,665 | |
Hertz Corp. | | | 7.38 | % | | | 01/15/2021 | | | | | | 2,724,000 | | | | | | 2,812,530 | | | | | | - | | | | | | - | | | | | | | | | | | | | | | | 2,724,000 | | | | | | 2,812,530 | |
Hertz Corp. | | | 7.50 | % | | | 10/15/2018 | | | | | | 735,000 | | | | | | 748,781 | | | | | | - | | | | | | - | | | | | | | | | | | | | | | | 735,000 | | | | | | 748,781 | |
Semiconductors & Semiconductor Equipment | | | | | | | | | | | | | | | | | | | | | | | | | | | | | | | | | | | | | | | | | | | | | | | | | | | | | | |
Micron Technology, Inc. | | | 7.50 | % | | | 09/15/2023 | | | | | | 469,000 | | | | | | 498,313 | | | | | | 639,000 | | | | | | 678,938 | | | | | | | | | | | | | | | | 1,108,000 | | | | | | 1,177,251 | |
Software | | | | | | | | | | | | | | | | | | | | | | | | | | | | | | | | | | | | | | | | | | | | | | | | | | | | | | |
Ensemble S Merger Sub, Inc. | | | 9.00 | % | | | 09/30/2023 | | | | | | 960,000 | | | | | | 948,000 | | | | | | 1,150,000 | | | | | | 1,135,625 | | | | | | | | | | | | | | | | 2,110,000 | | | | | | 2,083,625 | |
Infor US, Inc. | | | 5.75 | % | | | 08/15/2020 | | | | | | 776,000 | | | | | | 812,860 | | | | | | 1,288,000 | | | | | | 1,349,180 | | | | | | | | | | | | | | | | 2,064,000 | | | | | | 2,162,040 | |
Infor US, Inc. | | | 6.50 | % | | | 05/15/2022 | | | | | | 3,253,000 | | | | | | 3,072,068 | | | | | | 3,539,000 | | | | | | 3,342,161 | | | | | | | | | | | | | | | | 6,792,000 | | | | | | 6,414,229 | |
Specialty Retail | | | | | | | | | | | | | | | | | | | | | | | | | | | | | | | | | | | | | | | | | | | | | | | | | | | | | | |
Claire's Stores, Inc. | | | 6.13 | % | | | 03/15/2020 | | | | | | - | | | | | | - | | | | | | 600,000 | | | | | | 306,000 | | | | | | | | | | | | | | | | 600,000 | | | | | | 306,000 | |
Claire's Stores, Inc. | | | 9.00 | % | | | 03/15/2019 | | | | | | 5,226,000 | | | | | | 3,109,470 | | | | | | 5,986,000 | | | | | | 3,561,670 | | | | | | | | | | | | | | | | 11,212,000 | | | | | | 6,671,140 | |
L Brands, Inc. | | | 6.75 | % | | | 07/01/2036 | | | | | | 2,345,000 | | | | | | 2,343,523 | | | | | | 3,250,000 | | | | | | 3,247,953 | | | | | | | | | | | | | | | | 5,595,000 | | | | | | 5,591,476 | |
L Brands, Inc. | | | 6.88 | % | | | 11/01/2035 | | | | | | 2,176,000 | | | | | | 2,203,200 | | | | | | 2,968,000 | | | | | | 3,005,100 | | | | | | | | | | | | | | | | 5,144,000 | | | | | | 5,208,300 | |
Men's Wearhouse, Inc. | | | 7.00 | % | | | 07/01/2022 | | | | | | 2,494,000 | | | | | | 2,094,960 | | | | | | 2,505,000 | | | | | | 2,104,200 | | | | | | | | | | | | | | | | 4,999,000 | | | | | | 4,199,160 | |
Technology Hardware, Storage & Peripherals | | | | | | | | | | | | | | | | | | | | | | | | | | | | | | | | | | | | | | | | | | | | | | | | | | | | | | |
Diamond 1 Finance Corp. / Diamond 2 Finance Corp. | | | 5.45 | % | | | 06/15/2023 | | | | | | 1,603,000 | | | | | | 1,663,230 | | | | | | 2,173,000 | | | | | | 2,254,646 | | | | | | | | | | | | | | | | 3,776,000 | | | | | | 3,917,876 | |
Diamond 1 Finance Corp. / Diamond 2 Finance Corp. | | | 5.88 | % | | | 06/15/2021 | | | | | | 754,000 | | | | | | 768,908 | | | | | | 1,031,000 | | | | | | 1,051,385 | | | | | | | | | | | | | | | | 1,785,000 | | | | | | 1,820,293 | |
Diamond 1 Finance Corp. / Diamond 2 Finance Corp. | | | 7.13 | % | | | 06/15/2024 | | | | | | 754,000 | | | | | | 787,493 | | | | | | 1,031,000 | | | | | | 1,076,798 | | | | | | | | | | | | | | | | 1,785,000 | | | | | | 1,864,291 | |
Diamond 1 Finance Corp. / Diamond 2 Finance Corp. | | | 8.35 | % | | | 07/15/2046 | | | | | | 1,152,000 | | | | | | 1,238,526 | | | | | | 1,560,000 | | | | | | 1,677,170 | | | | | | | | | | | | | | | | 2,712,000 | | | | | | 2,915,696 | |
Diebold, Inc. | | | 8.50 | % | | | 04/15/2024 | | | | | | 2,754,000 | | | | | | 2,733,345 | | | | | | 3,725,000 | | | | | | 3,697,063 | | | | | | | | | | | | | | | | 6,479,000 | | | | | | 6,430,408 | |
Riverbed Technology, Inc. | | | 8.88 | % | | | 03/01/2023 | | | | | | 2,704,000 | | | | | | 2,798,640 | | | | | | 3,866,000 | | | | | | 4,001,310 | | | | | | | | | | | | | | | | 6,570,000 | | | | | | 6,799,950 | |
Seagate HDD | | | 4.88 | % | | | 06/01/2027 | | | | | | 1,445,000 | | | | | | 1,046,570 | | | | | | 635,000 | | | | | | 459,911 | | | | | | | | | | | | | | | | 2,080,000 | | | | | | 1,506,481 | |
Seagate HDD Cayman | | | 4.75 | % | | | 06/01/2023 | | | | | | 2,924,000 | | | | | | 2,471,481 | | | | | | 3,522,000 | | | | | | 2,976,934 | | | | | | | | | | | | | | | | 6,446,000 | | | | | | 5,448,415 | |
Seagate HDD Cayman | | | 4.75 | % | | | 01/01/2025 | | | | | | 1,050,000 | | | | | | 830,813 | | | | | | 1,350,000 | | | | | | 1,068,188 | | | | | | | | | | | | | | | | 2,400,000 | | | | | | 1,899,001 | |
Seagate HDD Cayman | | | 5.75 | % | | | 12/01/2034 | | | | | | - | | | | | | - | | | | | | 1,900,000 | | | | | | 1,334,750 | | | | | | | | | | | | | | | | 1,900,000 | | | | | | 1,334,750 | |
Western Digital Corp. | | | 7.38 | % | | | 04/01/2023 | | | | | | 1,785,000 | | | | | | 1,901,025 | | | | | | 2,400,000 | | | | | | 2,556,000 | | | | | | | | | | | | | | | | 4,185,000 | | | | | | 4,457,025 | |
Western Digital Corp. | | | 10.50 | % | | | 04/01/2024 | | | | | | 2,357,000 | | | | | | 2,521,990 | | | | | | 3,222,000 | | | | | | 3,447,540 | | | | | | | | | | | | | | | | 5,579,000 | | | | | | 5,969,530 | |
Textiles, Apparel & Luxury Goods | | | | | | | | | | | | | | | | | | | | | | | | | | | | | | | | | | | | | | | | | | | | | | | | | | | | | | |
Levi Strauss & Co. | | | 6.88 | % | | | 05/01/2022 | | | | | | 5,431,000 | | | | | | 5,763,649 | | | | | | 6,209,000 | | | | | | 6,589,301 | | | | | | | | | | | | | | | | 11,640,000 | | | | | | 12,352,950 | |
Trading Companies & Distributors | | | | | | | | | | | | | | | | | | | | | | | | | | | | | | | | | | | | | | | | | | | | | | | | | | | | | | |
International Lease Finance Corp. | | | 5.88 | % | | | 04/01/2019 | | | | | | - | | | | | | - | | | | | | 1,250,000 | | | | | | 1,332,813 | | | | | | | | | | | | | | | | 1,250,000 | | | | | | 1,332,813 | |
United Rentals North America, Inc. | | | 5.50 | % | | | 07/15/2025 | | | | | | 7,360,000 | | | | | | 7,249,600 | | | | | | 4,807,000 | | | | | | 4,734,895 | | | | | | | | | | | | | | | | 12,167,000 | | | | | | 11,984,495 | |
United Rentals North America, Inc. | | | 7.63 | % | | | 04/15/2022 | | | | | | 2,188,000 | | | | | | 2,335,690 | | | | | | 7,970,000 | | | | | | 8,507,975 | | | | | | | | | | | | | | | | 10,158,000 | | | | | | 10,843,665 | |
Wireless Telecommunication Services | | | | | | | | | | | | | | | | | | | | | | | | | | | | | | | | | | | | | | | | | | | | | | | | | | | | | | |
Sprint Communications, Inc. | | | 6.00 | % | | | 11/15/2022 | | | | | | 2,470,000 | | | | | | 1,943,643 | | | | | | - | | | | | | - | | | | | | | | | | | | | | | | 2,470,000 | | | | | | 1,943,643 | |
Sprint Communications, Inc. | | | 9.00 | % | | | 11/15/2018 | | | | | | 6,075,000 | | | | | | 6,469,875 | | | | | | 3,025,000 | | | | | | 3,221,625 | | | | | | | | | | | | | | | | 9,100,000 | | | | | | 9,691,500 | |
Sprint Communications, Inc. | | | 9.13 | % | | | 03/01/2017 | | | | | | 995,000 | | | | | | 1,025,367 | | | | | | - | | | | | | - | | | | | | | | | | | | | | | | 995,000 | | | | | | 1,025,367 | |
Sprint Communications, Inc. | | | 11.50 | % | | | 11/15/2021 | | | | | | - | | | | | | - | | | | | | 4,758,000 | | | | | | 4,700,904 | | | | | | | | | | | | | | | | 4,758,000 | | | | | | 4,700,904 | |
Sprint Corp. | | | 7.25 | % | | | 09/15/2021 | | | | | | 1,570,000 | | | | | | 1,338,425 | | | | | | - | | | | | | - | | | | | | | | | | | | | | | | 1,570,000 | | | | | | 1,338,425 | |
Sprint Corp. | | | 7.63 | % | | | 02/15/2025 | | | | | | 2,047,000 | | | | | | 1,619,689 | | | | | | - | | | | | | - | | | | | | | | | | | | | | | | 2,047,000 | | | | | | 1,619,689 | |
Sprint Corp. | | | 7.88 | % | | | 09/15/2023 | | | | | | 8,612,000 | | | | | | 7,040,310 | | | | | | 14,065,000 | | | | | | 11,498,138 | | | | | | | | | | | | | | | | 22,677,000 | | | | | | 18,538,448 | |
T-Mobile USA, Inc. | | | 6.13 | % | | | 01/15/2022 | | | | | | - | | | | | | - | | | | | | 702,000 | | | | | | 736,223 | | | | | | | | | | | | | | | | 702,000 | | | | | | 736,223 | |
T-Mobile USA, Inc. | | | 6.63 | % | | | 04/01/2023 | | | | | | - | | | | | | - | | | | | | 1,881,000 | | | | | | 1,992,694 | | | | | | | | | | | | | | | | 1,881,000 | | | | | | 1,992,694 | |
T-Mobile USA, Inc. | | | 6.63 | % | | | 04/28/2021 | | | | | | 1,360,000 | | | | | | 1,421,200 | | | | | | - | | | | | | - | | | | | | | | | | | | | | | | 1,360,000 | | | | | | 1,421,200 | |
T-Mobile USA, Inc. | | | 6.73 | % | | | 04/28/2022 | | | | | | 4,671,000 | | | | | | 4,911,790 | | | | | | 4,939,000 | | | | | | 5,193,605 | | | | | | | | | | | | | | | | 9,610,000 | | | | | | 10,105,395 | |
T-Mobile USA, Inc. | | | 6.84 | % | | | 04/28/2023 | | | | | | 455,000 | | | | | | 480,594 | | | | | | - | | | | | | - | | | | | | | | | | | | | | | | 455,000 | | | | | | 480,594 | |
| | | | | | | | | | | | | | | | | | | | | | | | | | | | |
Total Corporate Debt Securities | | | | | | | | | | | | | | | | | | | 744,084,810 | | | | | | | | | | | | 958,140,830 | | | | | | | | | | | | | | | | | | | | | | 1,702,225,640 | |
| | | | | | | | | | | | | | | | | | | | | | | | | | | | |
| | | | | | | | | | | | | | | | | | | Total Cost ($793,385,338) | | | | | | | | | | | | Total Cost ($1,016,910,219) | | | | | | | | | | | | | | | | | | | | | | Total Cost ($1,810,295,557) | |
Loan Assignments - 1.2 % | | | | | | | | | | | | | | | | | | | | | | | | | | | | | | | | | | | | | | | | | | | | | | | | | | | | | | |
Containers & Packaging | | | | | | | | | | | | | | | | | | | | | | | | | | | | | | | | | | | | | | | | | | | | | | | | | | | | | | |
Anchor Glass Container Corp. | | | 4.75 | % | | | 07/01/2022 | | | | | | 748,125 | | | | | | 745,881 | | | | | | 2,593,500 | | | | | | 2,585,720 | | | | | | | | | | | | | | | | 3,341,625 | | | | | | 3,331,601 | |
Household Products | | | | | | | | | | | | | | | | | | | | | | | | | | | | | | | | | | | | | | | | | | | | | | | | | | | | | | |
KIK Custom Products, Inc. | | | TBD | | | | 08/26/2022 | | | | | | 1,300,000 | | | | | | 1,279,958 | | | | | | - | | | | | | - | | | | | | | | | | | | | | | | 1,300,000 | | | | | | 1,279,958 | |
IT Services | | | | | | | | | | | | | | | | | | | | | | | | | | | | | | | | | | | | | | | | | | | | | | | | | | | | | | |
First Data Corp. | | | 4.45 | % | | | 03/24/2021 | | | | | | 1,000,000 | | | | | | 995,750 | | | | | | 2,650,000 | | | | | | 2,638,737 | | | | | | | | | | | | | | | | 3,650,000 | | | | | | 3,634,487 | |
Marine | | | | | | | | | | | | | | | | | | | | | | | | | | | | | | | | | | | | | | | | | | | | | | | | | | | | | | |
Commercial Barge Line Co. | | | 9.75 | % | | | 11/12/2020 | | | | | | 1,999,688 | | | | | | 1,839,712 | | | | | | 2,704,763 | | | | | | 2,488,381 | | | | | | | | | | | | | | | | 4,704,451 | | | | | | 4,328,093 | |
Metals & Mining | | | | | | | | | | | | | | | | | | | | | | | | | | | | | | | | | | | | | | | | | | | | | | | | | | | | | | |
Atkore International, Inc. | | | 4.50 | % | | | 04/09/2021 | | | | | | - | | | | | | - | | | | | | 656,600 | | | | | | 650,581 | | | | | | | | | | | | | | | | 656,600 | | | | | | 650,581 | |
Atkore International, Inc. | | | 7.75 | % | | | 04/28/2023 | | | | | | - | | | | | | - | | | | | | 580,000 | | | | | | 573,475 | | | | | | | | | | | | | | | | 580,000 | | | | | | 573,475 | |
S-20
| | | | | | | | | | | | | | | | | | | | | | | | | | | | | | | | | | | | | | | | | | | | | | | | | | | | | | |
| | | | | | | | | | | TPP Master | | | | | TAF Destination | | | | | Adjustments | | | | | Combined Pro Forma Destination | |
| | | | | | | | | | | | | | | | | |
| | | Coupon Rate | | | Maturity Date | | | | | Principal | | | | | Value | | | | | Principal | | | | | Value | | | | | Principal | | | Value | | | | | Principal | | | | | Value | |
| | | | | | | | | | | | | | | | | | | | | | | | | | | | |
Oil, Gas & Consumable Fuels | | | | | | | | | | | | | | | | | | | | | | | | | | | | | | | | | | | | | | | | | | | | | | | | | | | | | | |
CITGO Holding, Inc. | | | 9.50 | % | | | 05/12/2018 | | | | | $ | - | | | | | $ | - | | | | | $ | 2,261,833 | | | | | $ | 2,275,026 | | | | | | | | | | | | | | | $ | 2,261,833 | | | | | $ | 2,275,026 | |
Software | | | | | | | | | | | | | | | | | | | | | | | | | | | | | | | | | | | | | | | | | | | | | | | | | | | | | | |
BMC Software Finance, Inc. | | | TBD | | | | 09/10/2020 | | | | | | 2,550,000 | | | | | | 2,265,517 | | | | | | 3,761,111 | | | | | | 3,341,514 | | | | | | | | | | | | | | | | 6,311,111 | | | | | | 5,607,031 | |
| | | | | | | | | | | | | | | | | | | | | | | | | | | | |
Total Loan Assignments | | | | | | | | | | | | | | | | | | | 7,126,818 | | | | | | | | | | | | 14,553,434 | | | | | | | | | | | | | | | | | | | | | | 21,680,252 | |
| | | | | | | | | | | | | | | | | | | | | | | | | | | | |
| | | | | | | | | | | | | | | | | | | Total Cost ($7,210,692) | | | | | | | | | | | | Total Cost ($15,080,249) | | | | | | | | | | | | | | | | | | | | | | Total Cost ($22,290,941) | |
| | | | | | | | | | | | | | | | | |
| | | | | | | | | | | Shares | | | | | Value | | | | | Shares | | | | | Value | | | | | | | | | | | | | Shares | | | | | Value | |
| | | | | | | | | | | | | | | | | | | | | | | | | | | | |
Common Stocks - 0.0 % | | | | | | | | | | | | | | | | | | | | | | | | | | | | | | | | | | | | | | | | | | | | | | | | | | | | | | |
IT Services | | | | | | | | | | | | | | | | | | | | | | | | | | | | | | | | | | | | | | | | | | | | | | | | | | | | | | |
Unisys Corp. | | | | | | | | | | | | | - | | | | | | - | | | | | | 61,972 | | | | | | 451,156 | | | | | | | | | | | | | | | | 61,972 | | | | | | 451,156 | |
Media | | | | | | | | | | | | | | | | | | | | | | | | | | | | | | | | | | | | | | | | | | | | | | | | | | | | | | |
New Cotai LLC / New Cotai Capital Corp. | | | | | | | | | | | | | 6 | | | | | | 185,250 | | | | | | - | | | | | | - | | | | | | | | | | | | | | | | 6 | | | | | | 185,250 | |
| | | | | | | | | | | | | | | | | | | | | | | | | | | | |
Total Common Stocks | | | | | | | | | | | | | | | | | | | 185,250 | | | | | | 61,972 | | | | | | 451,156 | | | | | | | | | | | | | | | | | | | | | | 636,406 | |
| | | | | | | | | | | | | | | | | | | | | | | | | | | | |
| | | | | | | | | | | | | | | | | | | Total Cost ($185,250) | | | | | | | | | | | | Total Cost ($1,487,453) | | | | | | | | | | | | | | | | | | | | | | Total Cost ($1,672,703) | |
Preferred Stock - 1.1 % | | | | | | | | | | | | | | | | | | | | | | | | | | | | | | | | | | | | | | | | | | | | | | | | | | | | | | |
Banks | | | | | | | | | | | | | | | | | | | | | | | | | | | | | | | | | | | | | | | | | | | | | | | | | | | | | | |
GMAC Capital Trust I | | | 6.41 | % | | | | | | | | | 343,750 | | | | | | 8,531,875 | | | | | | 476,625 | | | | | | 11,829,833 | | | | | | | | | | | | | | | | 820,375 | | | | | | 20,361,708 | |
| | | | | | | | | | | | | | | | | | | | | | | | | | | | |
Total Preferred Stock | | | | | | | | | | | | | | | | | | | 8,531,875 | | | | | | | | | | | | 11,829,833 | | | | | | | | | | | | | | | | | | | | | | 20,361,708 | |
| | | | | | | | | | | | | | | | | | | | | | | | | | | | |
| | | | | | | | | | | | | | | | | | | Total Cost ($8,711,435) | | | | | | | | | | | | Total Cost ($12,232,642) | | | | | | | | | | | | | | | | | | | | | | Total Cost ($20,944,077) | |
Warrant - 0% | | | | | | | | | | | | | | | | | | | | | | | | | | | | | | | | | | | | | | | | | | | | | | | | | | | | | | |
Food Products | | | | | | | | | | | | | | | | | | | | | | | | | | | | | | | | | | | | | | | | | | | | | | | | | | | | | | |
American Seafoods Group LLC | | | | | | | 5/15/2018 | | | | | | 1,265 | | | | | | - | | | | | | - | | | | | | - | | | | | | | | | | | | | | | | 1,265 | | | | | | - | |
| | | | | | | | | | | | | | | | | | | | | | | | | | | | |
Total Warrant | | | | | | | | | | | | | | | | | | | - | | | | | | | | | | | | - | | | | | | | | | | | | | | | | | | | | | | - | |
| | | | | | | | | | | | | | | | | | | | | | | | | | | | |
| | | | | | | | | | | | | | | | | | | Total Cost ($0) | | | | | | | | | | | | Total Cost ($0) | | | | | | | | | | | | | | | | | | | | | | Total Cost ($0) | |
Securities Lending Collateral - 8.0 % | | | | | | | | | | | | | | | | | | | | | | | | | | | | | | | | | | | | | | | | | | | | | | | | | | | | | | |
State Street Navigator Securities Lending Trust - Prime Portfolio | | | 0.51 | % | | | | | | | | | - | | | | | | - | | | | | | 147,709,993 | | | | | | 147,709,993 | | | | | | | | | | | | | | | | 147,709,993 | | | | | | 147,709,993 | |
| | | | | | | | | | | | | | | | | | | | | | | | | | | | |
Total Securities Lending Collateral | | | | | | | | | | | | | | | | | | | - | | | | | | | | | | | | 147,709,993 | | | | | | | | | | | | | | | | | | | | | | 147,709,993 | |
| | | | | | | | | | | | | | | | | | | | | | | | | | | | |
| | | | | | | | | | | | | | | | | | | Total Cost ($0) | | | | | | | | | | | | Total Cost ($147,709,993) | | | | | | | | | | | | | | | | | | | | | | Total Cost ($147,709,993) | |
| | | | | | | | | | | | | | | | | |
| | | | | | | | | | | Principal | | | | | Value | | | | | Principal | | | | | Value | | | | | Principal | | | Value | | | | | Principal | | | | | Value | |
| | | | | | | | | | | | | | | | | | | | | | | | | | | | |
Repurchase Agreement - 2.9 % | | | | | | | | | | | | | | | | | | | | | | | | | | | | | | | | | | | | | | | | | | | | | | | | | | | | | | |
State Street Bank & Trust Co. | | | 0.03 | % | | | 07/01/2016 | | | | | $ | 22,677,282 | | | | | | 22,677,282 | | | | | $ | 29,691,824 | | | | | | 29,691,824 | | | | | | | | | | | | | | | $ | 52,369,106 | | | | | | 52,369,106 | |
| | | | | | | | | | | | | | | | | | | | | | | | | | | | |
Total Repurchase Agreement | | | | | | | | | | | | | | | | | | | 22,677,282 | | | | | | | | | | | | 29,691,824 | | | | | | | | | | | | | | | | | | | | | | 52,369,106 | |
| | | | | | | | | | | | | | | | | | | | | | | | | | | | |
| | | | | | | | | | | | | | | | | | | Total Cost ($22,677,282) | | | | | | | | | | | | Total Cost ($29,691,824) | | | | | | | | | | | | | | | | | | | | | | Total Cost ($52,369,106) | |
| | | | | | | | | |
| | | | | | | | | | | | | | | | | | | | | | | | | | | | |
Total Investments | | | | | | | | | | | | | | | | | | | 782,606,035 | | | | | | | | | | | | 1,162,377,070 | | | | | | | | | | | | | | | | | | | | | | 1,944,983,105 | |
| | | | | | | | | | | | | | | | | | | | | | | | | | | | |
| | | | | | | | | | | | | | | | | | | Total Cost ($832,169,997) | | | | | | | | | | | | Total Cost ($1,223,112,380) | | | | | | | | | | | | | | | | | | | | | | Total Cost ($2,055,282,377) | |
| | | | | | | | | | | | | | | | | |
Other Assets and Liabilities - (5.9)% | | | | | | | | | | | | | | | | | | | 9,924,803 | | | | | | | | | | | | (116,065,562) | | | | | | | | | | (3,170,285) | (a) (c) | | | | | | | | | | | (109,311,044) | |
| | | | | | | | | | | | | | | | | | | | | | | | | | | | | | | | | | | | | | | | | | | | | | | | | | | | | | |
Net Assets | | | | | | | | | | | | | | | | | | | $792,530,838 | | | | | | | | | | | | $1,046,311,508 | | | | | | | | | | ($3,170,285) | | | | | | | | | | | | $1,835,672,061 | |
| | | | | | | | | | | | | | | | | | | | | | | | | | | | | | | | | | | | | | | | | | | | | | | | | | | | | | |
VALUATION SUMMARY:
| | | | | | | | | | | | | | | | | | | | | | | | | | | | | | | | | | | | | | | | | | | | | | | | | | | | | | | | |
| Investments | | Level 1 -
Unadjusted Quoted Prices | | | Level 2 - Other Significant Observable Inputs | | | Level 3 - Significant Unobservable Inputs | | | Value | | | | | | Level 1 -
Unadjusted Quoted Prices | | | Level 2 - Other Significant Observable Inputs | | | Level 3 - Significant Unobservable Inputs | | | Value | | | | | | Level 1 -
Unadjusted Quoted Prices | | | Level 2 - Other Significant Observable Inputs | | | Level 3 - Significant Unobservable Inputs | | | Value | |
Corporate Debt Securities | | $ | - | | | $ | 744,084,810 | | | $ | - | | | $ | 744,084,810 | | | | | | | $ | - | | | $ | 958,140,830 | | | $ | - | | | $ | 958,140,830 | | | | | | | $ | - | | | $ | 1,702,225,640 | | | $ | - | | | $ | 1,702,225,640 | |
Loan Assignments | | | - | | | | 7,126,818 | | | | - | | | | 7,126,818 | | | | | | | | - | | | | 14,553,434 | | | | - | | | | 14,553,434 | | | | | | | | - | | | | 21,680,252 | | | | - | | | | 21,680,252 | |
Common Stocks | | | - | | | | - | | | | 185,250 | | | | 185,250 | | | | | | | | 451,156 | | | | - | | | | - | | | | 451,156 | | | | | | | | 451,156 | | | | - | | | | 185,250 | | | | 636,406 | |
Preferred Stock | | | 8,531,875 | | | | - | | | | - | | | | 8,531,875 | | | | | | | | 11,829,833 | | | | - | | | | - | | | | 11,829,833 | | | | | | | | 20,361,708 | | | | - | | | | - | | | | 20,361,708 | |
Warrant | | | - | | | | - | | | | - | | | | - | | | | | | | | | | | | - | | | | - | | | | - | | | | | | | | - | | | | - | | | | - | | | | - | |
Securities Lending Collateral | | | - | | | | - | | | | - | | | | - | | | | | | | | 147,709,993 | | | | - | | | | - | | | | 147,709,993 | | | | | | | | 147,709,993 | | | | - | | | | - | | | | 147,709,993 | |
Repurchase Agreement | | | - | | | | 22,677,282 | | | | - | | | | 22,677,282 | | | | | | | | - | | | | 29,691,824 | | | | - | | | | 29,691,824 | | | | | | | | - | | | | 52,369,106 | | | | - | | | | 52,369,106 | |
Total Investments | | $ | 8,531,875 | | | $ | 773,888,910 | | | $ | 185,250 | | | $ | 782,606,035 | | | | | | | $ | 159,990,982 | | | $ | 1,002,386,088 | | | $ | - | | | $ | 1,162,377,070 | | | | | | | $ | 168,522,857 | | | $ | 1,776,274,998 | | | $ | 185,250 | | | $ | 1,944,983,105 | |
(a)-(l) See Note 2 of the Notes to the Pro Forma Financial Statements.
As of June 30, 2016, all securities held by the Target Master Portfolio would comply with the investment restrictions of the Destination Fund.
S-21
Reorganization Between TPP Master, TPFG Feeder, TPFG II Feeder and TAF Destination
PRO FORMA STATEMENT OF ASSETS AND LIABILITIES
At June 30, 2016
| | | | | | | | | | | | | | | | | | | | | | | | | | |
| | | | | TPP Master | | | | TPFG Feeder | | | | TPFG II Feeder | | | | TAF Destination | | | | Adjustments | | | | | | Combined Pro Forma
Destination |
Assets: | | | | | | | | | | | | | | | | | | | | | | | | | | |
Investments, at value | | $ | | 759,928,753 | | $ | | - | | $ | | - | | $ | | 1,132,685,246 | | $ | | - | | | | $ | | 1,892,613,999 |
Repurchase agreements, at value | | | | 22,677,282 | | | | - | | | | - | | | | 29,691,824 | | | | - | | | | | | 52,369,106 |
Investments in Series Portfolio, at value | | | | - | | | | 117,130,359 | | | | 336,538,327 | | | | - | | | | (453,668,686) | | (b) | | | | - |
Cash | | | | 75,220 | | | | - | | | | - | | | | 173,174 | | | | - | | | | | | 248,394 |
Cash on deposit with broker | | | | - | | | | - | | | | - | | | | - | | | | - | | | | | | - |
Foreign currency, at value | | | | - | | | | - | | | | - | | | | - | | | | - | | | | | | - |
Receivables: | | | | - | | | | - | | | | - | | | | - | | | | - | | | | | | |
Shares of beneficial interest sold | | | | - | | | | 13 | | | | - | | | | 6,053,585 | | | | - | | | | | | 6,053,598 |
Investments sold | | | | 2,652,248 | | | | - | | | | - | | | | 11,607,899 | | | | - | | | | | | 14,260,147 |
When-issued, delay-delivery, and forward commitment securities sold | | | | - | | | | - | | | | - | | | | - | | | | - | | | | | | - |
Interest | | | | 13,333,482 | | | | - | | | | - | | | | 17,023,861 | | | | - | | | | | | 30,357,343 |
Dividends | | | | - | | | | - | | | | - | | | | - | | | | - | | | | | | - |
Tax reclaims | | | | - | | | | - | | | | - | | | | - | | | | - | | | | | | - |
Net income from securities lending | | | | - | | | | - | | | | - | | | | 64,327 | | | | - | | | | | | 64,327 |
Due from advisor | | | | - | | | | 7,588 | | | | 14,226 | | | | - | | | | - | | | | | | 21,814 |
Money market waiver due from advisor | | | | - | | | | - | | | | - | | | | - | | | | - | | | | | | - |
Variation margin receivable | | | | - | | | | - | | | | - | | | | - | | | | - | | | | | | - |
Other | | | | - | | | | - | | | | - | | | | 15,539 | | | | - | | | | | | 15,539 |
Prepaid Expenses | | | | 2,426 | | | | 433 | | | | 1,137 | | | | 1,171 | | | | - | | | | | | 5,167 |
OTC swap agreements, at value | | | | - | | | | - | | | | - | | | | - | | | | - | | | | | | - |
Unrealized appreciation on forward foreign currency contracts | | | | - | | | | - | | | | - | | | | - | | | | - | | | | | | - |
| | | | | | | | | | | | | | |
Total assets | | $ | | 798,669,411 | | $ | | 117,138,393 | | $ | | 336,553,690 | | $ | | 1,197,316,626 | | $ | | (453,668,686) | | | | $ | | 1,996,009,434 |
| | | | | | | | | | | | | | |
| | | | | | | | | | | | | |
Liabilities: | | | | | | | | | | | | | | | | | | | | | | | | | | |
Due to custodian | | | | - | | | | - | | | | - | | | | - | | | | - | | | | | | - |
Cash deposit due to broker | | | | - | | | | - | | | | - | | | | - | | | | - | | | | | | - |
Payables and other liabilities: | | | | | | | | | | | | | | | | | | | | | | | | | | |
Shares of beneficial interest redeemed | | | | - | | | | 73,631 | | | | 2,838,884 | | | | 1,143,646 | | | | - | | | | | | 4,056,161 |
Investments purchased | | | | 2,145,964 | | | | - | | | | - | | | | 1,324,410 | | | | - | | | | | | 3,470,374 |
When-issued, delay-delivery, and forward commitment securities purchased | | | | 3,568,938 | | | | - | | | | - | | | | - | | | | - | | | | | | 3,568,938 |
Investment advisory fees | | | | 356,014 | | | | - | | | | - | | | | - | | | | - | | | | | | 356,014 |
Investment management fees | | | | - | | | | - | | | | - | | | | 510,318 | | | | - | | | | | | 510,318 |
Administration/Investment advisory fees | | | | - | | | | 28,879 | | | | 13,669 | | | | - | | | | - | | | | | | 42,548 |
Administration fees | | | | - | | | | - | | | | - | | | | - | | | | - | | | | | | - |
Distribution and service fees | | | | - | | | | 24,066 | | | | 68,347 | | | | 72,361 | | | | - | | | | | | 164,774 |
Transfer agent fees | | | | - | | | | - | | | | - | | | | 135,371 | | | | - | | | | | | 135,371 |
Trustee, CCO and deferred compensation fees | | | | 1,268 | | | | 229 | | | | 519 | | | | 508 | | | | - | | | | | | 2,524 |
Audit and tax fees | | | | 12,115 | | | | 5,622 | | | | 8,590 | | | | 17,566 | | | | - | | | | | | 43,893 |
Custody and accounting fees | | | | 29,993 | | | | 1,831 | | | | 1,831 | | | | 51,581 | | | | - | | | | | | 85,236 |
Legal fees | | | | 13,869 | | | | 2,220 | | | | 6,109 | | | | 16,579 | | | | - | | | | | | 38,777 |
Printing and shareholder reports fees | | | | 5,278 | | | | 5,604 | | | | 5,367 | | | | - | | | | - | | | | | | 16,249 |
Registration fees | | | | - | | | | 4,796 | | | | 10,140 | | | | 22,633 | | | | - | | | | | | 37,569 |
Dividends, interest and fees for borrowings from securities sold short | | | | - | | | | - | | | | - | | | | - | | | | - | | | | | | - |
Interest | | | | - | | | | - | | | | - | | | | - | | | | - | | | | | | - |
Distribution payable to shareholders | | | | - | | | | - | | | | - | | | | - | | | | - | | | | | | - |
Other | | | | 5,134 | | | | 905 | | | | 2,954 | | | | 152 | | | | 89,489 | | (c) | | | | 98,634 |
Collateral for securities on loan | | | | - | | | | - | | | | - | | | | 147,709,993 | | | | - | | | | | | 147,709,993 |
Securities sold short, at value | | | | - | | | | - | | | | - | | | | - | | | | - | | | | | | - |
Written options and swaptions, at value | | | | - | | | | - | | | | - | | | | - | | | | - | | | | | | - |
OTC swap agreements, at value | | | | - | | | | - | | | | - | | | | - | | | | - | | | | | | - |
Unrealized depreciation on forward foreign currency contracts | | | | - | | | | - | | | | - | | | | - | | | | - | | | | | | - |
| | | | | | | | | | | | | | |
Total liabilities | | | | 6,138,573 | | | | 147,783 | | | | 2,956,410 | | | | 151,005,118 | | | | 89,489 | | | | | | 160,337,373 |
| | | | | | | | | | | | | | |
Net Assets | | $ | | 792,530,838 | | $ | | 116,990,610 | | $ | | 333,597,280 | | $ | | 1,046,311,508 | | $ | | (453,758,175) | | | | $ | | 1,835,672,061 |
| | | | | | | | | | | | | | |
| | | | | | | | | | | | | |
Net Assets Consist of: | | | | | | | | | | | | | | | | | | | | | | | | | | |
Paid-in capital | | $ | | 203,584,128 | | | | 140,125,835 | | | | 361,489,776 | | | | 1,126,282,163 | | $ | | 109,095,801 | | (d) | | $ | | 1,940,577,703 |
Undistributed (distributions in excess of) net investment income (loss) | | | | 675,630,369 | | | | (22,477) | | | | (46,046) | | | | 237,142 | | | | (675,561,846) | | (d) | | | | 237,142 |
Accumulated net realized gain (loss) | | | | (37,119,697) | | | | (16,502,043) | | | | (9,522,168) | | | | (19,472,487) | | | | 63,143,908 | | (d) | | | | (19,472,487) |
Net unrealized appreciation (depreciation) on: | | | | | | | | | | | | | | | | | | | | | | | | | | |
Investments | | | | (49,563,962) | | | | - | | | | - | | | | (60,735,310) | | | | 49,563,962 | | (d) | | | | (60,735,310) |
Allocated from Series Portfolio | | | | - | | | | (6,610,705) | | | | (18,324,282) | | | | - | | | | - | | | | | | (24,934,987) |
Securities sold short | | | | - | | | | - | | | | - | | | | - | | | | - | | | | | | - |
Written options and swaptions | | | | - | | | | - | | | | - | | | | - | | | | - | | | | | | - |
Swap agreements | | | | - | | | | - | | | | - | | | | - | | | | - | | | | | | - |
Futures contracts | | | | - | | | | - | | | | - | | | | - | | | | - | | | | | | - |
Translation of assets and liabilities denominated in foreign currencies | | | | - | | | | - | | | | - | | | | - | | | | - | | | | | | - |
| | | | | | | | | | | | | | | | |
| | | | | | | | | | | | | |
Net Assets | | $ | | 792,530,838 | | $ | | 116,990,610 | | $ | | 333,597,280 | | $ | | 1,046,311,508 | | $ | | (453,758,175) | | | | $ | | 1,835,672,061.00 |
| | | | | | | | | | | | | | |
| | | | - | | | | - | | | | - | | | | - | | | | - | | | | | | |
| | | | | | | | | | | | | |
Net assets by class: | | | | | | | | - | | | | - | | | | - | | | | | | | | | | |
Class A | | $ | | - | | $ | | - | | $ | | - | | $ | | 104,904,928 | | $ | | - | | | | $ | | 104,904,928 |
Class B | | | | - | | | | - | | | | - | | | | 2,828,252 | | | | - | | | | | | 2,828,252 |
Class C | | | | - | | | | - | | | | - | | | | 50,475,370 | | | | - | | | | | | 50,475,370 |
Class I | | | | - | | | | - | | | | - | | | | 123,514,119 | | | | - | | | | | | 123,514,119 |
Class I2 | | | | - | | | | - | | | | - | | | | 761,898,198 | | | | - | | | | | | 761,898,198 |
Class I3 | | | | 338,862,152 | | | | - | | | | - | | | | - | | | | (89,489) | | (c) | | | | 338,772,663 |
Class T | | | | - | | | | - | | | | - | | | | - | | | | - | | | | | | - |
Class R | | | | - | | | | 116,990,610 | | | | - | | | | - | | | | - | | | | | | 116,990,610 |
Class R4 | | | | - | | | | - | | | | 333,597,280 | | | | - | | | | - | | | | | | 333,597,280 |
Class R6 | | | | - | | | | - | | | | - | | | | 2,690,641 | | | | - | | | | | | 2,690,641 |
Shares outstanding (unlimited shares, no par value): | | | | | | | | | | | | | | | | | | | | | | | | | | |
Class A | | | | - | | | | - | | | | - | | | | 12,019,178 | | | | - | | | | | | 12,019,178 |
Class B | | | | - | | | | - | | | | - | | | | 323,810 | | | | - | | | | | | 323,810 |
Class C | | | | - | | | | - | | | | - | | | | 5,812,258 | | | | - | | | | | | 5,812,258 |
Class I | | | | - | | | | - | | | | - | | | | 14,048,124 | | | | - | | | | | | 14,048,124 |
Class I2 | | | | - | | | | - | | | | - | | | | 86,477,326 | | | | - | | | | | | 86,477,326 |
Class I3 | | | | 38,463,354 | | | | - | | | | - | | | | - | | | | - | | | | | | 38,463,354 |
Class T | | | | - | | | | - | | | | - | | | | - | | | | - | | | | | | - |
Class R | | | | - | | | | 14,215,857 | | | | - | | | | - | | | | (936,560) | | (e) | | | | 13,279,297 |
Class R4 | | | | - | | | | - | | | | 40,567,434 | | | | - | | | | (2,701,681) | | (e) | | | | 37,865,753 |
Class R6 | | | | - | | | | - | | | | - | | | | 305,328 | | | | - | | | | | | 305,328 |
Net asset value per share: | | | | | | | | | | | | | | | | | | | | | | | | | | |
Class A | | $ | | - | | $ | | - | | $ | | - | | $ | | 8.73 | | | | - | | | | $ | | 8.73 |
Class B | | | | - | | | | - | | | | - | | | | 8.73 | | | | - | | | | | | 8.73 |
Class C | | | | - | | | | - | | | | - | | | | 8.68 | | | | - | | | | | | 8.68 |
Class I | | | | - | | | | - | | | | - | | | | 8.79 | | | | - | | | | | | 8.79 |
Class I2 | | | | - | | | | - | | | | - | | | | 8.81 | | | | - | | | | | | 8.81 |
Class I3 | | | | 8.81 | | | | - | | | | - | | | | 8.81 | | | | (8.81) | | (f) | | | | 8.81 |
Class T | | | | - | | | | - | | | | - | | | | - | | | | - | | | | | | - |
Class R | | | | - | | | | 8.23 | | | | - | | | | 8.81 | | | | (8.23) | | (f) | | | | 8.81 |
Class R4 | | | | - | | | | - | | | | 8.22 | | | | 8.81 | | | | (8.22) | | (f) | | | | 8.81 |
Class R6 | | | | - | | | | - | | | | - | | | | 8.81 | | | | - | | | | | | 8.81 |
Maximum offering price per share: | | | | | | | | | | | | | | | | | | | | | | | | | | |
Class A | | $ | | - | | $ | | - | | $ | | - | | $ | | 9.17 | | | | - | | | | $ | | 9.17 |
| | | | | | | | | | | | | | | | | | | | | | | | | | |
| | | | | | | | | | | | | | |
Investments, at cost | | $ | | 809,492,715 | | $ | | - | | $ | | - | | $ | | 1,193,420,556 | | | | - | | | | $ | | 2,002,913,271 |
Securities loaned, at value | | | | - | | | | - | | | | - | | | | 144,672,079 | | | | - | | | | | | 144,672,079 |
Repurchase agreements, at cost | | | | 22,677,282 | | | | - | | | | - | | | | 29,691,824 | | | | - | | | | | | 52,369,106 |
Foreign currency, at cost | | | | - | | | | - | | | | - | | | | - | | | | - | | | | | | - |
Premium received on written options and swaptions | | | | - | | | | - | | | | - | | | | - | | | | - | | | | | | - |
(a)-(l) See Note 2 of the Notes to the Pro Forma Financial Statements.
THE NOTES TO THE PRO FORMA FINANCIAL STATEMENTS ARE AN INTEGRAL PART OF THIS REPORT.
S-22
Reorganization Between TPP Master, TPFG Feeder, TPFG II Feeder and TAF Destination
PRO FORMA STATEMENT OF OPERATIONS
For the twelve-month period ended June 30, 2016
| | | | | | | | | | | | | | | | | | | | | | | | | | | | | | | | | | | | | | | | | | | | | | | | | | | | | | |
| | | | | TPP Master | | | | | | | | TPFG Feeder | | | | | | | | TPFG II Feeder | | | | | | | | TAF Destination | | | | | | | | Adjustments | | | | | | | Combined Pro
Forma Destination | |
Investment Income: | | | | | | | | | | | | | | | | | | | | | | | | | | | | | | | | | | | | | | | | | | | | | | | | | | | | | | |
| | | | | | | | | | | | | | | | | |
Dividend income | | $ | | | 459,681 | | | | | | | $ | | | 70,785 | | | | | | | $ | | | 189,231 | | | | | | | $ | | | 920,277 | | | | | | | $ | | | (260,016) | | | (b) | | $ | | | 1,379,958 | |
Interest income | | | | | 52,397,617 | | | | | | | | | | 8,076,885 | | | | | | | | | | 21,552,394 | | | | | | | | | | 65,939,398 | | | | | | | | | | (29,629,279) | | | (b) | | | | | 118,337,015 | |
Net income (loss) from securities lending | | | | | - | | | | | | | | | | - | | | | | | | | | | - | | | | | | | | | | 462,059 | | | | | | | | | | - | | | | | | | | 462,059 | |
Withholding taxes on foreign income | | | | | - | | | | | | | | | | - | | | | | | | | | | - | | | | | | | | | | - | | | | | | | | | | - | | | | | | | | - | |
Expenses (net of waiver and/or reimbursement) | | | | | - | | | | | | | | | | (699,812) | | | | | | | | | | (1,868,222) | | | | | | | | | | - | | | | | | | | | | 2,568,034 | | | (b) | | | | | - | |
| | | | | | | | | | | | | | | | | | | | | | | | | | | | | | | | | | | | |
Total investment income (loss) | | | | | 52,857,298 | | | | | | | | | | 7,447,858 | | | | | | | | | | 19,873,403 | | | | | | | | | | 67,321,734 | | | | | | | | | | (27,321,261) | | | | | | | | 120,179,032 | |
| | | | | | | | | | | | | | | | | | | | | | | | | | | | | | | | | | | | |
| | | | | | | | | | | | | | | | | |
Expenses: | | | | | | | | | | | | | | | | | | | | | | | | | | | | | | | | | | | | | | | | | | | | | | | | | | | | | | |
Investment advisory fees | | | | | 4,349,648 | | | | | | | | | | - | | | | | | | | | | - | | | | | | | | | | 3,622,635 | | | | | | | | | | 242,632 | | | (g) | | | | | 8,214,915 | |
Investment management fees | | | | | - | | | | | | | | | | - | | | | | | | | | | - | | | | | | | | | | 2,040,624 | | | | | | | | | | - | | | | | | | | 2,040,624 | |
Administration/Investment advisory fees | | | | | - | | | | | | | | | | 365,270 | | | | | | | | | | 162,551 | | | | | | | | | | - | | | | | | | | | | (527,821) | | | (h) | | | | | - | |
Distribution and service fees: | | | | | | | | | | | | | | | | | | | | | | | | | | | | | | | | | | | | | | | | | | | | | | | | | | | | | | |
Class A | | | | | - | | | | | | | | | | - | | | | | | | | | | - | | | | | | | | | | 283,935 | | | | | | | | | | (262) | | | (i) | | | | | 283,673 | |
Class B | | | | | - | | | | | | | | | | - | | | | | | | | | | - | | | | | | | | | | 36,238 | | | | | | | | | | (41) | | | (i) | | | | | 36,197 | |
Class C | | | | | - | | | | | | | | | | - | | | | | | | | | | - | | | | | | | | | | 541,127 | | | | | | | | | | (538) | | | (i) | | | | | 540,589 | |
Class I | | | | | - | | | | | | | | | | - | | | | | | | | | | - | | | | | | | | | | - | | | | | | | | | | - | | | | | | | | - | |
Class I2 | | | | | - | | | | | | | | | | - | | | | | | | | | | - | | | | | | | | | | - | | | | | | | | | | - | | | | | | | | - | |
Class I3 | | | | | - | | | | | | | | | | - | | | | | | | | | | - | | | | | | | | | | - | | | | | | | | | | - | | | | | | | | - | |
Class T | | | | | - | | | | | | | | | | - | | | | | | | | | | - | | | | | | | | | | - | | | | | | | | | | - | | | | | | | | - | |
Class R | | | | | - | | | | | | | | | | 304,392 | | | | | | | | | | - | | | | | | | | | | - | | | | | | | | | | 303,517 | | | (i) | | | | | 607,909 | |
Class R4 | | | | | - | | | | | | | | | | - | | | | | | | | | | 812,756 | | | | | | | | | | - | | | | | | | | | | (1,152) | | | (i) | | | | | 811,604 | |
Class R6 | | | | | - | | | | | | | | | | - | | | | | | | | | | - | | | | | | | | | | - | | | | | | | | | | - | | | | | | | | - | |
Administration fees | | | | | - | | | | | | | | | | - | | | | | | | | | | - | | | | | | | | | | 192,868 | | | | | | | | | | (192,868) | | | (h) | | | | | - | |
Transfer agent fees: | | | | | | | | | | | | | | | | | | | | | | | | | | | | | | | | | | | | | | | | | | | | | | | | | | | | | | |
Class A | | | | | - | | | | | | | | | | - | | | | | | | | | | - | | | | | | | | | | 162,287 | | | | | | | | | | - | | | | | | | | 162,287 | |
Class B | | | | | - | | | | | | | | | | - | | | | | | | | | | - | | | | | | | | | | 7,005 | | | | | | | | | | - | | | | | | | | 7,005 | |
Class C | | | | | - | | | | | | | | | | - | | | | | | | | | | - | | | | | | | | | | 61,179 | | | | | | | | | | - | | | | | | | | 61,179 | |
Class I | | | | | - | | | | | | | | | | - | | | | | | | | | | - | | | | | | | | | | 115,368 | | | | | | | | | | - | | | | | | | | 115,368 | |
Class I2 | | | | | - | | | | | | | | | | - | | | | | | | | | | - | | | | | | | | | | 55,377 | | | | | | | | | | - | | | | | | | | 55,377 | |
Class I3 | | | | | - | | | | | | | | | | - | | | | | | | | | | - | | | | | | | | | | - | | | | | | | | | | - | | | | | | | | - | |
Class T | | | | | - | | | | | | | | | | - | | | | | | | | | | - | | | | | | | | | | - | | | | | | | | | | - | | | | | | | | - | |
Class R | | | | | - | | | | | | | | | | - | | | | | | | | | | - | | | | | | | | | | - | | | | | | | | | | - | | | | | | | | - | |
Class R4 | | | | | - | | | | | | | | | | - | | | | | | | | | | - | | | | | | | | | | - | | | | | | | | | | - | | | | | | | | - | |
Class R6 | | | | | - | | | | | | | | | | - | | | | | | | | | | - | | | | | | | | | | 41 | | | | | | | | | | - | | | | | | | | 41 | |
Trustee, CCO and deferred compensation fees | | | | | 12,523 | | | | | | | | | | 2,225 | | | | | | | | | | 5,947 | | | | | | | | | | 14,601 | | | | | | | | | | - | | | | | | | | 35,296 | |
Audit and tax fees | | | | | 25,820 | | | | | | | | | | 10,149 | | | | | | | | | | 16,570 | | | | | | | | | | 32,274 | | | | | | | | | | (31,791) | | | (j) | | | | | 53,022 | |
Custody fees | | | | | 110,024 | | | | | | | | | | 11,267 | | | | | | | | | | 11,275 | | | | | | | | | | 153,335 | | | | | | | | | | (73,337) | | | (k) | | | | | 212,564 | |
Legal fees | | | | | 26,634 | | | | | | | | | | 5,155 | | | | | | | | | | 13,736 | | | | | | | | | | 34,542 | | | | | | | | | | - | | | | | | | | 80,067 | |
Printing and shareholder reports fees | | | | | 3,382 | | | | | | | | | | 13,198 | | | | | | | | | | 29,927 | | | | | | | | | | 129,734 | | | | | | | | | | - | | | | | | | | 176,241 | |
Registration fees | | | | | - | | | | | | | | | | 25,846 | | | | | | | | | | 33,598 | | | | | | | | | | 129,782 | | | | | | | | | | - | | | | | | | | 189,226 | |
Dividends, interest and fees for borrowings from securities sold short | | | | | - | | | | | | | | | | - | | | | | | | | | | - | | | | | | | | | | - | | | | | | | | | | | | | | | | | | - | |
Interest | | | | | - | | | | | | | | | | - | | | | | | | | | | - | | | | | | | | | | - | | | | | | | | | | - | | | | | | | | - | |
Other | | | | | 13,591 | | | | | | | | | | 3,788 | | | | | | | | | | 9,748 | | | | | | | | | | 24,215 | | | | | | | | | | - | | | | | | | | 51,342 | |
| | | | | | | | | | | | | | | | | | | | | | | | | | | | | | | | | | | | |
Total expenses before waiver and/or reimbursement and recapture | | | | | 4,541,622 | | | | | | | | | | 741,290 | | | | | | | | | | 1,096,108 | | | | | | | | | | 7,637,167 | | | | | | | | | | (281,661) | | | | | | | | 13,734,526 | |
Expenses waived and/or reimbursed: | | | | | | | | | | | | | | | | | | | | | | | | | | | | | | | | | | | | | | | | | | | | | | | | | | | | | | |
Fund level | | | | | - | | | | | | | | | | - | | | | | | | | | | - | | | | | | | | | | - | | | | | | | | | | - | | | | | | | | - | |
Class A | | | | | - | | | | | | | | | | - | | | | | | | | | | - | | | | | | | | | | - | | | | | | | | | | - | | | | | | | | - | |
Class B | | | | | - | | | | | | | | | | - | | | | | | | | | | - | | | | | | | | | | - | | | | | | | | | | - | | | | | | | | - | |
Class C | | | | | - | | | | | | | | | | - | | | | | | | | | | - | | | | | | | | | | - | | | | | | | | | | - | | | | | | | | - | |
Class I | | | | | - | | | | | | | | | | - | | | | | | | | | | - | | | | | | | | | | - | | | | | | | | | | - | | | | | | | | - | |
Class I2 | | | | | - | | | | | | | | | | - | | | | | | | | | | - | | | | | | | | | | - | | | | | | | | | | - | | | | | | | | - | |
Class I3 | | | | | - | | | | | | | | | | - | | | | | | | | | | - | | | | | | | | | | - | | | | | | | | | | (49,254) | | | (l) | | | | | (49,254) | |
Class T | | | | | - | | | | | | | | | | - | | | | | | | | | | - | | | | | | | | | | - | | | | | | | | | | - | | | | | | | | - | |
Class R | | | | | - | | | | | | | | | | (101,751) | | | | | | | | | | - | | | | | | | | | | - | | | | | | | | | | 84,317 | | | (l) | | | | | (17,434) | |
Class R4 | | | | | - | | | | | | | | | | - | | | | | | | | | | (200,894) | | | | | | | | | | - | | | | | | | | | | 154,343 | | | (l) | | | | | (46,551) | |
Class R6 | | | | | - | | | | | | | | | | - | | | | | | | | | | - | | | | | | | | | | - | | | | | | | | | | - | | | | | | | | - | |
Recapture of previously waived and/or reimbursed fees: | | | | | | | | | | | | | | | | | | | | | | | | | | | | | | | | | | | | | | | | | | | | | | | | | | | | | | |
Fund level | | | | | - | | | | | | | | | | - | | | | | | | | | | - | | | | | | | | | | - | | | | | | | | | | - | | | | | | | | - | |
Class A | | | | | - | | | | | | | | | | - | | | | | | | | | | - | | | | | | | | | | - | | | | | | | | | | - | | | | | | | | - | |
Class B | | | | | - | | | | | | | | | | - | | | | | | | | | | - | | | | | | | | | | - | | | | | | | | | | - | | | | | | | | - | |
Class C | | | | | - | | | | | | | | | | - | | | | | | | | | | - | | | | | | | | | | - | | | | | | | | | | - | | | | | | | | - | |
Class I | | | | | - | | | | | | | | | | - | | | | | | | | | | - | | | | | | | | | | - | | | | | | | | | | - | | | | | | | | - | |
Class I2 | | | | | - | | | | | | | | | | - | | | | | | | | | | - | | | | | | | | | | - | | | | | | | | | | - | | | | | | | | - | |
Class I3 | | | | | - | | | | | | | | | | - | | | | | | | | | | - | | | | | | | | | | - | | | | | | | | | | - | | | | | | | | - | |
Class T | | | | | - | | | | | | | | | | - | | | | | | | | | | - | | | | | | | | | | - | | | | | | | | | | - | | | | | | | | - | |
Class R | | | | | - | | | | | | | | | | - | | | | | | | | | | - | | | | | | | | | | - | | | | | | | | | | - | | | | | | | | - | |
Class R4 | | | | | - | | | | | | | | | | - | | | | | | | | | | - | | | | | | | | | | - | | | | | | | | | | - | | | | | | | | - | |
Class R6 | | | | | - | | | | | | | | | | - | | | | | | | | | | - | | | | | | | | | | - | | | | | | | | | | - | | | | | | | | - | |
| | | | | | | | | | | | | | | | | | | | | | | | | | | | | | | | | | | | | | | | | | |
Net expenses | | | | | 4,541,622 | | | | | | | | | | 639,539 | | | | | | | | | | 895,214 | | | | | | | | | | 7,637,167 | | | | | | | | | | (92,255) | | | | | | | | 13,621,287 | |
| | | | | | | | | | | | | | | | | |
Net investment income (loss) | | | | | 48,315,676 | | | | | | | | | | 6,808,319 | | | | | | | | | | 18,978,189 | | | | | | | | | | 59,684,567 | | | | | | | | | | (27,229,006) | | | | | | | | 106,557,745 | |
| | | | | | | | | | | | | | | | | | | | | | | | | | | | | | | | | | | | |
| | | | | | | | | | | | | | | | | |
Net realized gain (loss) on: | | | | | | | | | | | | | | | | | | | | | | | | | | | | | | | | | | | | | | | | | | | | | | | | | | | | | | |
Allocated from series portfolio | | | | | - | | | | | | | | | | (2,432,826) | | | | | | | | | | (6,529,153) | | | | | | | | | | - | | | | | | | | | | 8,961,979 | | | (b) | | | | | - | |
Investments | | | | | (15,811,434) | | | | | | | | | | - | | | | | | | | | | - | | | | | | | | | | (16,288,977) | | | | | | | | | | - | | | | | | | | (32,100,411) | |
Securities sold short | | | | | - | | | | | | | | | | - | | | | | | | | | | - | | | | | | | | | | - | | | | | | | | | | - | | | | | | | | - | |
Written options and swaptions | | | | | - | | | | | | | | | | - | | | | | | | | | | - | | | | | | | | | | - | | | | | | | | | | - | | | | | | | | - | |
Swap agreements | | | | | - | | | | | | | | | | - | | | | | | | | | | - | | | | | | | | | | - | | | | | | | | | | - | | | | | | | | - | |
Futures contracts | | | | | - | | | | | | | | | | - | | | | | | | | | | - | | | | | | | | | | - | | | | | | | | | | - | | | | | | | | - | |
Foreign currency transactions | | | | | - | | | | | | | | | | - | | | | | | | | | | - | | | | | | | | | | - | | | | | | | | | | - | | | | | | | | - | |
| | | | | | | | | | | | | | | | | | | | | | | | | | | | | | | | | | | | |
Net realized gain (loss) | | | | | (15,811,434) | | | | | | | | | | (2,432,826) | | | | | | | | | | (6,529,153) | | | | | | | | | | (16,288,977) | | | | | | | | | | 8,961,979 | | | | | | | | (32,100,411) | |
| | | | | | | | | | | | | | | | | | | | | | | | | | | | | | | | | | | | |
| | | | | | | | | | | | | | | | | |
Net change in unrealized appreciation (depreciation) on: | | | | | | | | | | | | | | | | | | | | | | | | | | | | | | | | | | | | | | | | | | | | | | | | | | | | | | |
Allocated from series portfolio | | | | | - | | | | | | | | | | (4,951,137) | | | | | | | | | | (12,349,190) | | | | | | | | | | - | | | | | | | | | | 17,300,327 | | | (b) | | | | | - | |
Investments | | | | | (31,406,997) | | | | | | | | | | - | | | | | | | | | | - | | | | | | | | | | (44,298,233) | | | | | | | | | | - | | | | | | | | (75,705,230) | |
Securities sold short | | | | | - | | | | | | | | | | - | | | | | | | | | | - | | | | | | | | | | - | | | | | | | | | | - | | | | | | | | - | |
Written options and swaptions | | | | | - | | | | | | | | | | - | | | | | | | | | | - | | | | | | | | | | - | | | | | | | | | | - | | | | | | | | - | |
Swap agreements | | | | | - | | | | | | | | | | - | | | | | | | | | | - | | | | | | | | | | - | | | | | | | | | | - | | | | | | | | - | |
Futures contracts | | | | | - | | | | | | | | | | - | | | | | | | | | | - | | | | | | | | | | - | | | | | | | | | | - | | | | | | | | - | |
Translation of assets and liabilities denominated in foreign currencies | | | | | - | | | | | | | | | | - | | | | | | | | | | - | | | | | | | | | | - | | | | | | | | | | - | | | | | | | | - | |
| | | | | | | | | | | | | | | | | | | | | | | | | | | | | | | | | | | | |
Net change in unrealized appreciation (depreciation) | | | | | (31,406,997) | | | | | | | | | | (4,951,137) | | | | | | | | | | (12,349,190) | | | | | | | | | | (44,298,233) | | | | | | | | | | 17,300,327 | | | | | | | | (75,705,230) | |
| | | | | | | | | | | | | | | | | | | | | | | | | | | | | | | | | | | | |
| | | | | | | | | | | | | | | | | |
Net realized and change in unrealized gain (loss) | | | | | (47,218,431) | | | | | | | | | | (7,383,963) | | | | | | | | | | (18,878,343) | | | | | | | | | | (60,587,210) | | | | | | | | | | 26,262,306 | | | | | | | | (107,805,641) | |
| | | | | | | | | | | | | | | | | | | | | | | | | | | | | | | | | | | | |
| | | | | | | | | | | | | | | | | |
Net increase (decrease) in net assets resulting from operations | | $ | | | 1,097,245 | | | | | | | $ | | | (575,644) | | | | | | | $ | | | 99,846 | | | | | | | $ | | | (902,643) | | | | | | | $ | | | (966,700) | | | | | $ | | | (1,247,896) | |
| | | | | | | | | | | | | | | | | | | | | | | | | | | | | | | | | | | | |
(a)-(l) See Note 2 of the Notes to the Pro Forma Financial Statements.
THE NOTES TO THE PRO FORMA FINANCIAL STATEMENTS ARE AN INTEGRAL PART OF THIS REPORT.
S-23
Group Four Reorganization Between:
TRANSAMERICA PARTNERS INTERNATIONAL EQUITY
TRANSAMERICA PARTNERS INSTITUTIONAL INTERNATIONAL EQUITY
TRANSAMERICA PARTNERS INTERNATIONAL EQUITY PORTFOLIO
AND
TRANSAMERICA INTERNATIONAL EQUITY
PRO FORMA SCHEDULE OF INVESTMENTS
At June 30, 2016
Reorganization Between TPP Master and TAF
PRO FORMA SCHEDULE OF INVESTMENTS
At June 30, 2016
| | | | | | | | | | | | | | | | | | | | | | | | | | | | | | | | | | | | | | | | | | | | | | | | | | | | | | | | | | | | | | |
| | | | | | | | | | | TPP Master | | | | | TAF Destination | | | | | Adjustments | | | | | Combined Pro Forma Destination | |
| | | | | | | | | | | | | | | | | | |
| | | Coupon Rate | | | Maturity Date | | | | | Shares | | | | | | Value | | | | | Shares | | | | | | Value | | | | | Shares | | | | | | Value | | | | | Shares | | | | | Value | |
| | | | | | | | | | | | | | | | | | | | | | |
Common Stocks -94.5 % | | | | | | | | | | | | | | | | | | | | | | | | | | | | | | | | | | | | | | | | | | | | | | | | | | | | | | | | | | | | | | |
Argentina | | | | | | | | | | | | | | | | | | | | | | | | | | | | | | | | | | | | | | | | | | | | | | | | | | | | | | | | | | | | | | |
Arcos Dorados Holdings, Inc. | | | | | | | | | | | | | 487,900 | | | | | | | $ | 2,327,283 | | | | | | - | | | | | | | $ | - | | | | | | | | | | | | | | | | | | | | 487,900 | | | | | $ | 2,327,283 | |
Australia | | | | | | | | | | | | | | | | | | | | | | | | | | | | | | | | | | | | | | | | | | | | | | | | | | | | | | | | | | | | | | |
Asciano, Ltd. | | | | | | | | | | | | | 108,313 | | | | | | | | 718,634 | | | | | | 1,598,933 | | | | | | | | 10,608,580 | | | | | | | | | | | | | | | | | | | | 1,707,246 | | | | | | 11,327,214 | |
BHP Billiton PLC | | | | | | | | | | | | | 84,700 | | | | | | | | 2,149,686 | | | | | | 482,869 | | | | | | | | 12,255,215 | | | | | | | | | | | | | | | | | | | | 567,569 | | | | | | 14,404,901 | |
Challenger, Ltd. | | | | | | | | | | | | | 615,639 | | | | | | | | 4,022,111 | | | | | | 4,892,961 | | | | | | | | 31,966,835 | | | | | | | | | | | | | | | | | | | | 5,508,600 | | | | | | 35,988,946 | |
Sonic Healthcare, Ltd. | | | | | | | | | | | | | 164,400 | | | | | | | | 2,666,094 | | | | | | 1,592,700 | | | | | | | | 25,829,007 | | | | | | | | | | | | | | | | | | | | 1,757,100 | | | | | | 28,495,101 | |
South32, Ltd. | | | | | | | | | | | | | - | | | | | | | | - | | | | | | 15,278,100 | | | | | | | | 17,917,934 | | | | | | | | | | | | | | | | | | | | 15,278,100 | | | | | | 17,917,934 | |
Belgium | | | | | | | | | | | | | | | | | | | | | | | | | | | | | | | | | | | | | | | | | | | | | | | | | | | | | | | | | | | | | | |
Groupe Bruxelles Lambert SA | | | | | | | | | | | | | - | | | | | | | | - | | | | | | 314,920 | | | | | | | | 25,825,244 | | | | | | | | | | | | | | | | | | | | 314,920 | | | | | | 25,825,244 | |
Brazil | | | | | | | | | | | | | | | | | | | | | | | | | | | | | | | | | | | | | | | | | | | | | | | | | | | | | | | | | | | | | | |
Localiza Rent a Car SA | | | | | | | | | | | | | 179,300 | | | | | | | | 1,925,676 | | | | | | - | | | | | | | | - | | | | | | | | | | | | | | | | | | | | 179,300 | | | | | | 1,925,676 | |
Marfrig Global Foods SA | | | | | | | | | | | | | 2,060,000 | | | | | | | | 3,604,022 | | | | | | - | | | | | | | | - | | | | | | | | | | | | | | | | | | | | 2,060,000 | | | | | | 3,604,022 | |
Canada | | | | | | | | | | | | | | | | | | | | | | | | | | | | | | | | | | | | | | | | | | | | | | | | | | | | | | | | | | | | | | |
Canadian Imperial Bank of Commerce | | | | | | | | | | | | | 17,700 | | | | | | | | 1,329,469 | | | | | | - | | | | | | | | - | | | | | | | | | | | | | | | | | | | | 17,700 | | | | | | 1,329,469 | |
Canadian National Railway Co. | | | | | | | | | | | | | 73,300 | | | | | | | | 4,328,385 | | | | | | - | | | | | | | | - | | | | | | | | | | | | | | | | | | | | 73,300 | | | | | | 4,328,385 | |
Fairfax Financial Holdings, Ltd. | | | | | | | | | | | | | 7,600 | | | | | | | | 4,093,276 | | | | | | - | | | | | | | | - | | | | | | | | | | | | | | | | | | | | 7,600 | | | | | | 4,093,276 | |
Hudson's Bay Co. | | | | | | | | | | | | | 290,300 | | | | | | | | 3,503,059 | | | | | | - | | | | | | | | - | | | | | | | | | | | | | | | | | | | | 290,300 | | | | | | 3,503,059 | |
Newalta Corp. | | | | | | | | | | | | | 178,300 | | | | | | | | 296,718 | | | | | | - | | | | | | | | - | | | | | | | | | | | | | | | | | | | | 178,300 | | | | | | 296,718 | |
Suncor Energy, Inc. | | | | | | | | | | | | | 201,300 | | | | | | | | 5,584,266 | | | | | | - | | | | | | | | - | | | | | | | | | | | | | | | | | | | | 201,300 | | | | | | 5,584,266 | |
Chile | | | | | | | | | | | | | | | | | | | | | | | | | | | | | | | | | | | | | | | | | | | | | | | | | | | | | | | | | | | | | | |
Banco Santander Chile | | | | | | | | | | | | | 137,000 | | | | | | | | 2,653,690 | | | | | | - | | | | | | | | - | | | | | | | | | | | | | | | | | | | | 137,000 | | | | | | 2,653,690 | |
China | | | | | | | | | | | | | | | | | | | | | | | | | | | | | | | | | | | | | | | | | | | | | | | | | | | | | | | | | | | | | | |
Fosun International, Ltd. | | | | | | | | | | | | | 3,028,536 | | | | | | | | 3,930,597 | | | | | | - | | | | | | | | - | | | | | | | | | | | | | | | | | | | | 3,028,536 | | | | | | 3,930,597 | |
Minth Group, Ltd. | | | | | | | | | | | | | 600,000 | | | | | | | | 1,941,197 | | | | | | - | | | | | | | | - | | | | | | | | | | | | | | | | | | | | 600,000 | | | | | | 1,941,197 | |
PICC Property & Casualty Co., Ltd. | | | | | | | | | | | | | 900,000 | | | | | | | | 1,421,321 | | | | | | - | | | | | | | | - | | | | | | | | | | | | | | | | | | | | 900,000 | | | | | | 1,421,321 | |
Shenzhen Expressway Co., Ltd. | | | | | | | | | | | | | 2,226,000 | | | | | | | | 2,036,921 | | | | | | - | | | | | | | | - | | | | | | | | | | | | | | | | | | | | 2,226,000 | | | | | | 2,036,921 | |
Sinotrans, Ltd. | | | | | | | | | | | | | 3,050,000 | | | | | | | | 1,361,711 | | | | | | - | | | | | | | | - | | | | | | | | | | | | | | | | | | | | 3,050,000 | | | | | | 1,361,711 | |
Czech Republic | | | | | | | | | | | | | | | | | | | | | | | | | | | | | | | | | | | | | | | | | | | | | | | | | | | | | | | | | | | | | | |
Komercni Banka AS | | | | | | | | | | | | | 45,000 | | | | | | | | 1,687,233 | | | | | | - | | | | | | | | - | | | | | | | | | | | | | | | | | | | | 45,000 | | | | | | 1,687,233 | |
Denmark | | | | | | | | | | | | | | | | | | | | | | | | | | | | | | | | | | | | | | | | | | | | | | | | | | | | | | | | | | | | | | |
TDC A/S | | | | | | | | | | | | | 188,800 | | | | | | | | 925,209 | | | | | | 1,785,624 | | | | | | | | 8,750,396 | | | | | | | | | | | | | | | | | | | | 1,974,424 | | | | | | 9,675,605 | |
France | | | | | | | | | | | | | | | | | | | | | | | | | | | | | | | | | | | | | | | | | | | | | | | | | | | | | | | | | | | | | | |
Arkema SA | | | | | | | | | | | | | 46,495 | | | | | | | | 3,554,667 | | | | | | 297,294 | | | | | | | | 22,728,918 | | | | | | | | | | | | | | | | | | | | 343,789 | | | | | | 26,283,585 | |
Bollore SA | | | | | | | | | | | | | 826,900 | | | | | | | | 2,783,772 | | | | | | 3,923,500 | | | | | | | | 13,208,525 | | | | | | | | | | | | | | | | | | | | 4,750,400 | | | | | | 15,992,297 | |
Engie SA | | | | | | | | | | | | | 305,800 | | | | | | | | 4,910,126 | | | | | | 2,685,000 | | | | | | | | 43,112,127 | | | | | | | | | | | | | | | | | | | | 2,990,800 | | | | | | 48,022,253 | |
Rexel SA | | | | | | | | | | | | | 190,024 | | | | | | | | 2,389,056 | | | | | | 2,039,934 | | | | | | | | 25,646,844 | | | | | | | | | | | | | | | | | | | | 2,229,958 | | | | | | 28,035,900 | |
Sanofi | | | | | | | | | | | | | 63,201 | | | | | | | | 5,250,908 | | | | | | 560,600 | | | | | | | | 46,576,147 | | | | | | | | | | | | | | | | | | | | 623,801 | | | | | | 51,827,055 | |
TOTAL SA | | | | | | | | | | | | | - | | | | | | | | - | | | | | | 517,200 | | | | | | | | 24,802,838 | | | | | | | | | | | | | | | | | | | | 517,200 | | | | | | 24,802,838 | |
Veolia Environnement SA | | | | | | | | | | | | | 200,070 | | | | | | | | 4,320,431 | | | | | | 1,895,681 | | | | | | | | 40,936,470 | | | | | | | | | | | | | | | | | | | | 2,095,751 | | | | | | 45,256,901 | |
Vivendi SA | | | | | | | | | | | | | 151,200 | | | | | | | | 2,828,757 | | | | | | 1,692,224 | | | | | | | | 31,659,327 | | | | | | | | | | | | | | | | | | | | 1,843,424 | | | | | | 34,488,084 | |
Germany | | | | | | | | | | | | | | | | | | | | | | | | | | | | | | | | | | | | | | | | | | | | | | | | | | | | | | | | | | | | | | |
Allianz SE | | | | | | | | | | | | | 19,302 | | | | | | | | 2,753,573 | | | | | | 167,300 | | | | | | | | 23,866,585 | | | | | | | | | | | | | | | | | | | | 186,602 | | | | | | 26,620,158 | |
Bayer AG | | | | | | | | | | | | | 8,231 | | | | | | | | 826,679 | | | | | | 78,465 | | | | | | | | 7,880,617 | | | | | | | | | | | | | | | | | | | | 86,696 | | | | | | 8,707,296 | |
Deutsche Boerse AG | | | | | | | | | | | | | 27,700 | | | | | | | | 2,275,685 | | | | | | 334,300 | | | | | | | | 27,464,314 | | | | | | | | | | | | | | | | | | | | 362,000 | | | | | | 29,739,999 | |
Merck KGaA | | | | | | | | | | | | | 36,000 | | | | | | | | 3,659,145 | | | | | | 302,200 | | | | | | | | 30,716,489 | | | | | | | | | | | | | | | | | | | | 338,200 | | | | | | 34,375,634 | |
METRO AG | | | | | | | | | | | | | 100,524 | | | | | | | | 3,091,724 | | | | | | 891,200 | | | | | | | | 27,409,820 | | | | | | | | | | | | | | | | | | | | 991,724 | | | | | | 30,501,544 | |
SAP SE | | | | | | | | | | | | | 50,900 | | | | | | | | 3,822,851 | | | | | | 469,047 | | | | | | | | 35,227,836 | | | | | | | | | | | | | | | | | | | | 519,947 | | | | | | 39,050,687 | |
Siemens AG | | | | | | | | | | | | | 41,787 | | | | | | | | 4,288,230 | | | | | | 381,300 | | | | | | | | 39,129,440 | | | | | | | | | | | | | | | | | | | | 423,087 | | | | | | 43,417,670 | |
Talanx AG | | | | | | | | | | | | | - | | | | | | | | - | | | | | | 624,951 | | | | | | | | 18,612,915 | | | | | | | | | | | | | | | | | | | | 624,951 | | | | | | 18,612,915 | |
TUI AG | | | | | | | | | | | | | 137,400 | | | | | | | | 1,560,734 | | | | | | 1,852,572 | | | | | | | | 21,043,463 | | | | | | | | | | | | | | | | | | | | 1,989,972 | | | | | | 22,604,197 | |
Greece | | | | | | | | | | | | | | | | | | | | | | | | | | | | | | | | | | | | | | | | | | | | | | | | | | | | | | | | | | | | | | |
OPAP SA | | | | | | | | | | | | | 263,500 | | | | | | | | 1,836,468 | | | | | | - | | | | | | | | - | | | | | | | | | | | | | | | | | | | | 263,500 | | | | | | 1,836,468 | |
Hong Kong | | | | | | | | | | | | | | | | | | | | | | | | | | | | | | | | | | | | | | | | | | | | | | | | | | | | | | | | | | | | | | |
Cheung Kong Property Holdings, Ltd. | | | | | | | | | | | | | 437,000 | | | | | | | | 2,759,071 | | | | | | 3,919,000 | | | | | | | | 24,743,251 | | | | | | | | | | | | | | | | | | | | 4,356,000 | | | | | | 27,502,322 | |
China Mobile, Ltd. | | | | | | | | | | | | | 340,000 | | | | | | | | 3,932,863 | | | | | | - | | | | | | | | - | | | | | | | | | | | | | | | | | | | | 340,000 | | | | | | 3,932,863 | |
China Resources Beer Holdings Co., Ltd. | | | | | | | | | | | | | 1,260,000 | | | | | | | | 2,747,517 | | | | | | - | | | | | | | | - | | | | | | | | | | | | | | | | | | | | 1,260,000 | | | | | | 2,747,517 | |
CK Hutchison Holdings, Ltd. | | | | | | | | | | | | | 308,000 | | | | | | | | 3,388,141 | | | | | | 2,921,100 | | | | | | | | 32,133,439 | | | | | | | | | | | | | | | | | | | | 3,229,100 | | | | | | 35,521,580 | |
First Pacific Co., Ltd. | | | | | | | | | | | | | 2,650,000 | | | | | | | | 1,913,613 | | | | | | 11,815,012 | | | | | | | | 8,531,833 | | | | | | | | | | | | | | | | | | | | 14,465,012 | | | | | | 10,445,446 | |
Guangdong Investment, Ltd. | | | | | | | | | | | | | 2,322,000 | | | | | | | | 3,562,775 | | | | | | 20,990,100 | | | | | | | | 32,206,285 | | | | | | | | | | | | | | | | | | | | 23,312,100 | | | | | | 35,769,060 | |
Noble Group, Ltd. | | | | | | | | | | | | | 6,990,500 | | | | | | | | 1,058,564 | | | | | | 34,084,200 | | | | | | | | 5,161,336 | | | | | | | | | | | | | | | | | | | | 41,074,700 | | | | | | 6,219,900 | |
Shun Tak Holdings, Ltd. | | | | | | | | | | | | | 1,526,000 | | | | | | | | 482,748 | | | | | | - | | | | | | | | - | | | | | | | | | | | | | | | | | | | | 1,526,000 | | | | | | 482,748 | |
India | | | | | | | | | | | | | | | | | | | | | | | | | | | | | | | | | | | | | | | | | | | | | | | | | | | | | | | | | | | | | | |
Cairn India, Ltd. | | | | | | | | | | | | | 1,617,457 | | | | | | | | 3,389,542 | | | | | | - | | | | | | | | - | | | | | | | | | | | | | | | | | | | | 1,617,457 | | | | | | 3,389,542 | |
Hindustan Zinc, Ltd. | | | | | | | | | | | | | 500,000 | | | | | | | | 1,344,532 | | | | | | - | | | | | | | | - | | | | | | | | | | | | | | | | | | | | 500,000 | | | | | | 1,344,532 | |
Indonesia | | | | | | | | | | | | | | | | | | | | | | | | | | | | | | | | | | | | | | | | | | | | | | | | | | | | | | | | | | | | | | |
AKR Corporindo Tbk PT | | | | | | | | | | | | | 3,250,000 | | | | | | | | 1,578,141 | | | | | | - | | | | | | | | - | | | | | | | | | | | | | | | | | | | | 3,250,000 | | | | | | 1,578,141 | |
Ireland | | | | | | | | | | | | | | | | | | | | | | | | | | | | | | | | | | | | | | | | | | | | | | | | | | | | | | | | | | | | | | |
DCC PLC | | | | | | | | | | | | | 21,000 | | | | | | | | 1,847,991 | | | | | | 171,300 | | | | | | | | 15,074,328 | | | | | | | | | | | | | | | | | | | | 192,300 | | | | | | 16,922,319 | |
Ryanair Holdings PLC | | | | | | | | | | | | | 34,860 | | | | | | | | 2,424,165 | | | | | | 172,912 | | | | | | | | 12,024,300 | | | | | | | | | | | | | | | | | | | | 207,772 | | | | | | 14,448,465 | |
Smurfit Kappa Group PLC | | | | | | | | | | | | | 195,215 | | | | | | | | 4,298,313 | | | | | | 1,115,600 | | | | | | | | 24,563,676 | | | | | | | | | | | | | | | | | | | | 1,310,815 | | | | | | 28,861,989 | |
Israel | | | | | | | | | | | | | | | | | | | | | | | | | | | | | | | | | | | | | | | | | | | | | | | | | | | | | | | | | | | | | | |
Teva Pharmaceutical Industries, Ltd. | | | | | | | | | | | | | 91,700 | | | | | | | | 4,606,091 | | | | | | 940,500 | | | | | | | | 47,241,315 | | | | | | | | | | | | | | | | | | | | 1,032,200 | | | | | | 51,847,406 | |
Italy | | | | | | | | | | | | | | | | | | | | | | | | | | | | | | | | | | | | | | | | | | | | | | | | | | | | | | | | | | | | | | |
Azimut Holding SpA | | | | | | | | | | | | | 58,700 | | | | | | | | 957,740 | | | | | | 1,001,686 | | | | | | | | 16,343,366 | | | | | | | | | | | | | | | | | | | | 1,060,386 | | | | | | 17,301,106 | |
Davide Campari | | | | | | | | | | | | | - | | | | | | | | - | | | | | | 981,841 | | | | | | | | 9,718,845 | | | | | | | | | | | | | | | | | | | | 981,841 | | | | | | 9,718,845 | |
Davide Campari-Milano SpA | | | | | | | | | | | | | - | | | | | | | | - | | | | | | 534,648 | | | | | | | | 5,292,261 | | | | | | | | | | | | | | | | | | | | 534,648 | | | | | | 5,292,261 | |
Eni SpA | | | | | | | | | | | | | 324,215 | | | | | | | | 5,222,186 | | | | | | 1,864,900 | | | | | | | | 30,038,261 | | | | | | | | | | | | | | | | | | | | 2,189,115 | | | | | | 35,260,447 | |
Mediobanca SpA | | | | | | | | | | | | | 428,500 | | | | | | | | 2,468,929 | | | | | | 4,252,492 | | | | | | | | 24,501,985 | | | | | | | | | | | | | | | | | | | | 4,680,992 | | | | | | 26,970,914 | |
Prysmian SpA | | | | | | | | | | | | | 147,638 | | | | | | | | 3,240,528 | | | | | | 896,149 | | | | | | | | 19,669,704 | | | | | | | | | | | | | | | | | | | | 1,043,787 | | | | | | 22,910,232 | |
Japan | | | | | | | | | | | | | | | | | | | | | | | | | | | | | | | | | | | | | | | | | | | | | | | | | | | | | | | | | | | | | | |
Aisin Seiki Co., Ltd. | | | | | | | | | | | | | 92,700 | | | | | | | | 3,775,974 | | | | | | - | | | | | | | | - | | | | | | | | | | | | | | | | | | | | 92,700 | | | | | | 3,775,974 | |
Astellas Pharma, Inc. | | | | | | | | | | | | | 203,100 | | | | | | | | 3,185,083 | | | | | | 2,389,500 | | | | | | | | 37,472,951 | | | | | | | | | | | | | | | | | | | | 2,592,600 | | | | | | 40,658,034 | |
Bridgestone Corp. | | | | | | | | | | | | | 61,500 | | | | | | | | 1,976,421 | | | | | | 681,200 | | | | | | | | 21,891,677 | | | | | | | | | | | | | | | | | | | | 742,700 | | | | | | 23,868,098 | |
Coca-Cola East Japan Co., Ltd. | | | | | | | | | | | | | - | | | | | | | | - | | | | | | 1,576,200 | | | | | | | | 30,167,775 | | | | | | | | | | | | | | | | | | | | 1,576,200 | | | | | | 30,167,775 | |
Daiwa Securities Group, Inc. | | | | | | | | | | | | | 620,000 | | | | | | | | 3,266,389 | | | | | | 5,338,500 | | | | | | | | 28,125,189 | | | | | | | | | | | | | | | | | | | | 5,958,500 | | | | | | 31,391,578 | |
Denka Co., Ltd. | | | | | | | | | | | | | - | | | | | | | | - | | | | | | 4,262,300 | | | | | | | | 17,237,041 | | | | | | | | | | | | | | | | | | | | 4,262,300 | | | | | | 17,237,041 | |
Electric Power Development Co., Ltd. | | | | | | | | | | | | | 62,200 | | | | | | | | 1,449,153 | | | | | | 744,300 | | | | | | | | 17,340,910 | | | | | | | | | | | | | | | | | | | | 806,500 | | | | | | 18,790,063 | |
FamilyMart Co., Ltd. | | | | | | | | | | | | | - | | | | | | | | - | | | | | | 476,100 | | | | | | | | 29,014,138 | | | | | | | | | | | | | | | | | | | | 476,100 | | | | | | 29,014,138 | |
FANUC Corp. | | | | | | | | | | | | | 22,500 | | | | | | | | 3,660,148 | | | | | | 172,600 | | | | | | | | 28,077,401 | | | | | | | | | | | | | | | | | | | | 195,100 | | | | | | 31,737,549 | |
FUJIFILM Holdings Corp. | | | | | | | | | | | | | 124,200 | | | | | | | | 4,819,012 | | | | | | 552,500 | | | | | | | | 21,437,232 | | | | | | | | | | | | | | | | | | | | 676,700 | | | | | | 26,256,244 | |
Hitachi, Ltd. | | | | | | | | | | | | | 833,800 | | | | | | | | 3,493,501 | | | | | | 8,632,800 | | | | | | | | 36,170,183 | | | | | | | | | | | | | | | | | | | | 9,466,600 | | | | | | 39,663,684 | |
S-24
| | | | | | | | | | | | | | | | | | | | | | | | | | | | | | | | | | | | | | | | | | | | | | | | | | | | | | | | | | | | | | |
| | | | | | | | | | | TPP Master | | | | | TAF Destination | | | | | Adjustments | | | | | Combined Pro Forma Destination | |
| | | | | | | | | | | | | | | | | | |
| | | Coupon Rate | | | Maturity Date | | | | | Shares | | | | | | Value | | | | | Shares | | | | | | Value | | | | | Shares | | | | | | Value | | | | | Shares | | | | | Value | |
| | | | | | | | | | | | | | | | | | | | | | | | | | | | |
Japan Airlines Co., Ltd. | | | | | | | | | | | | | 99,500 | | | | | | | $ | 3,201,173 | | | | | | 756,800 | | | | | | | $ | 24,348,219 | | | | | | | | | | | | | | | | | | | | 856,300 | | | | | $ | 27,549,392 | |
Komatsu, Ltd. | | | | | | | | | | | | | 128,900 | | | | | | | | 2,239,208 | | | | | | 898,600 | | | | | | | | 15,610,182 | | | | | | | | | | | | | | | | | | | | 1,027,500 | | | | | | 17,849,390 | |
Kuraray Co., Ltd. | | | | | | | | | | | | | 334,700 | | | | | | | | 3,993,464 | | | | | | 2,107,200 | | | | | | | | 25,142,000 | | | | | | | | | | | | | | | | | | | | 2,441,900 | | | | | | 29,135,464 | |
Mitsubishi Corp. | | | | | | | | | | | | | - | | | | | | | | - | | | | | | 918,600 | | | | | | | | 16,174,092 | | | | | | | | | | | | | | | | | | | | 918,600 | | | | | | 16,174,092 | |
Mitsubishi Heavy Industries, Ltd. | | | | | | | | | | | | | 615,000 | | | | | | | | 2,473,051 | | | | | | 5,628,800 | | | | | | | | 22,634,650 | | | | | | | | | | | | | | | | | | | | 6,243,800 | | | | | | 25,107,701 | |
MS&AD Insurance Group Holdings, Inc. | | | | | | | | | | | | | 168,700 | | | | | | | | 4,371,036 | | | | | | 1,222,500 | | | | | | | | 31,675,112 | | | | | | | | | | | | | | | | | | | | 1,391,200 | | | | | | 36,046,148 | |
NEC Corp. | | | | | | | | | | | | | 1,533,000 | | | | | | | | 3,571,681 | | | | | | 12,222,800 | | | | | | | | 28,477,460 | | | | | | | | | | | | | | | | | | | | 13,755,800 | | | | | | 32,049,141 | |
Nippon Telegraph & Telephone Corp. | | | | | | | | | | | | | 108,400 | | | | | | | | 5,083,405 | | | | | | 457,100 | | | | | | | | 21,435,651 | | | | | | | | | | | | | | | | | | | | 565,500 | | | | | | 26,519,056 | |
ORIX Corp. | | | | | | | | | | | | | 374,200 | | | | | | | | 4,842,323 | | | | | | 2,619,200 | | | | | | | | 33,893,670 | | | | | | | | | | | | | | | | | | | | 2,993,400 | | | | | | 38,735,993 | |
Resona Holdings, Inc. | | | | | | | | | | | | | 928,400 | | | | | | | | 3,393,221 | | | | | | 5,586,300 | | | | | | | | 20,417,436 | | | | | | | | | | | | | | | | | | | | 6,514,700 | | | | | | 23,810,657 | |
SoftBank Group Corp. | | | | | | | | | | | | | 81,900 | | | | | | | | 4,631,611 | | | | | | 745,000 | | | | | | | | 42,131,258 | | | | | | | | | | | | | | | | | | | | 826,900 | | | | | | 46,762,869 | |
Sony Corp. | | | | | | | | | | | | | 189,900 | | | | | | | | 5,594,829 | | | | | | 1,504,400 | | | | | | | | 44,322,590 | | | | | | | | | | | | | | | | | | | | 1,694,300 | | | | | | 49,917,419 | |
Square Enix Holdings Co., Ltd. | | | | | | | | | | | | | - | | | | | | | | - | | | | | | 414,400 | | | | | | | | 13,452,655 | | | | | | | | | | | | | | | | | | | | 414,400 | | | | | | 13,452,655 | |
Sumitomo Mitsui Financial Group, Inc. | | | | | | | | | | | | | 109,500 | | | | | | | | 3,161,817 | | | | | | 1,003,200 | | | | | | | | 28,967,443 | | | | | | | | | | | | | | | | | | | | 1,112,700 | | | | | | 32,129,260 | |
Toyota Motor Corp. | | | | | | | | | | | | | - | | | | | | | | - | | | | | | 548,100 | | | | | | | | 27,020,507 | | | | | | | | | | | | | | | | | | | | 548,100 | | | | | | 27,020,507 | |
Macau | | | | | | | | | | | | | | | | | | | | | | | | | | | | | | | | | | | | | | | | | | | | | | | | | | | | | | | | | | | | | | |
MGM China Holdings, Ltd. | | | | | | | | | | | | | 1,359,572 | | | | | | | | 1,771,670 | | | | | | 9,612,200 | | | | | | | | 12,525,741 | | | | | | | | | | | | | | | | | | | | 10,971,772 | | | | | | 14,297,411 | |
Mexico | | | | | | | | | | | | | | | | | | | | | | | | | | | | | | | | | | | | | | | | | | | | | | | | | | | | | | | | | | | | | | |
Alpek SAB de CV | | | | | | | | | | | | | 1,133,400 | | | | | | | | 1,859,186 | | | | | | - | | | | | | | | - | | | | | | | | | | | | | | | | | | | | 1,133,400 | | | | | | 1,859,186 | |
Credito Real SAB de CV SOFOM ENR | | | | | | | | | | | | | 808,773 | | | | | | | | 1,548,310 | | | | | | - | | | | | | | | - | | | | | | | | | | | | | | | | | | | | 808,773 | | | | | | 1,548,310 | |
Fomento Economico Mexicano SAB de CV | | | | | | | | | | | | | 20,000 | | | | | | | | 1,849,800 | | | | | | - | | | | | | | | - | | | | | | | | | | | | | | | | | | | | 20,000 | | | | | | 1,849,800 | |
Grupo Aeroportuario del Centro Norte SAB de CV | | | | | | | | | | | | | 51,320 | | | | | | | | 305,828 | | | | | | - | | | | | | | | - | | | | | | | | | | | | | | | | | | | | 51,320 | | | | | | 305,828 | |
Grupo Televisa SAB | | | | | | | | | | | | | 68,000 | | | | | | | | 1,770,720 | | | | | | 846,671 | | | | | | | | 22,047,313 | | | | | | | | | | | | | | | | | | | | 914,671 | | | | | | 23,818,033 | |
Netherlands | | | | | | | | | | | | | | | | | | | | | | | | | | | | | | | | | | | | | | | | | | | | | | | | | | | | | | | | | | | | | | |
Akzo Nobel NV | | | | | | | | | | | | | - | | | | | | | | - | | | | | | 370,794 | | | | | | | | 23,034,007 | | | | | | | | | | | | | | | | | | | | 370,794 | | | | | | 23,034,007 | |
Boskalis Westminster | | | | | | | | | | | | | 63,294 | | | | | | | | 2,159,757 | | | | | | 465,600 | | | | | | | | 15,887,492 | | | | | | | | | | | | | | | | | | | | 528,894 | | | | | | 18,047,249 | |
Delta Lloyd NV | | | | | | | | | | | | | 296,668 | | | | | | | | 1,042,398 | | | | | | 4,924,758 | | | | | | | | 17,304,045 | | | | | | | | | | | | | | | | | | | | 5,221,426 | | | | | | 18,346,443 | |
Heineken Holding NV | | | | | | | | | | | | | 40,044 | | | | | | | | 3,244,430 | | | | | | 454,600 | | | | | | | | 36,832,438 | | | | | | | | | | | | | | | | | | | | 494,644 | | | | | | 40,076,868 | |
Koninklijke Philips NV | | | | | | | | | | | | | 175,571 | | | | | | | | 4,360,529 | | | | | | 1,749,356 | | | | | | | | 43,447,476 | | | | | | | | | | | | | | | | | | | | 1,924,927 | | | | | | 47,808,005 | |
Steinhoff International Holdings NV | | | | | | | | | | | | | 452,600 | | | | | | | | 2,605,892 | | | | | | - | | | | | | | | - | | | | | | | | | | | | | | | | | | | | 452,600 | | | | | | 2,605,892 | |
Steinhoff International Holdings NV | | | | | | | | | | | | | - | | | | | | | | - | | | | | | 1,539,137 | | | | | | | | 8,829,523 | | | | | | | | | | | | | | | | | | | | 1,539,137 | | | | | | 8,829,523 | |
Nigeria | | | | | | | | | | | | | | | | | | | | | | | | | | | | | | | | | | | | | | | | | | | | | | | | | | | | | | | | | | | | | | |
Guaranty Trust Bank PLC | | | | | | | | | | | | | 16,340,000 | | | | | | | | 1,351,753 | | | | | | - | | | | | | | | - | | | | | | | | | | | | | | | | | | | | 16,340,000 | | | | | | 1,351,753 | |
Panama | | | | | | | | | | | | | | | | | | | | | | | | | | | | | | | | | | | | | | | | | | | | | | | | | | | | | | | | | | | | | | |
Copa Holdings SA | | | | | | | | | | | | | 8,900 | | | | | | | | 465,114 | | | | | | - | | | | | | | | - | | | | | | | | | | | | | | | | | | | | 8,900 | | | | | | 465,114 | |
Republic of Korea | | | | | | | | | | | | | | | | | | | | | | | | | | | | | | | | | | | | | | | | | | | | | | | | | | | | | | | | | | | | | | |
Korean Reinsurance Co. | | | | | | | | | | | | | 134,102 | | | | | | | | 1,426,681 | | | | | | - | | | | | | | | - | | | | | | | | | | | | | | | | | | | | 134,102 | | | | | | 1,426,681 | |
Samsung Electronics Co., Ltd. | | | | | | | | | | | | | - | | | | | | | | - | | | | | | 22,000 | | | | | | | | 27,397,725 | | | | | | | | | | | | | | | | | | | | 22,000 | | | | | | 27,397,725 | |
SK Telecom Co., Ltd. | | | | | | | | | | | | | 18,600 | | | | | | | | 3,494,322 | | | | | | 117,750 | | | | | | | | 22,121,311 | | | | | | | | | | | | | | | | | | | | 136,350 | | | | | | 25,615,633 | |
Russian Federation | | | | | | | | | | | | | | | | | | | | | | | | | | | | | | | | | | | | | | | | | | | | | | | | | | | | | | | | | | | | | | |
Lukoil PJSC | | | | | | | | | | | | | 74,980 | | | | | | | | 3,128,915 | | | | | | - | | | | | | | | - | | | | | | | | | | | | | | | | | | | | 74,980 | | | | | | 3,128,915 | |
Singapore | | | | | | | | | | | | | | | | | | | | | | | | | | | | | | | | | | | | | | | | | | | | | | | | | | | | | | | | | | | | | | |
DBS Group Holdings, Ltd. | | | | | | | | | | | | | 317,000 | | | | | | | | 3,737,720 | | | | | | 3,175,800 | | | | | | | | 37,445,589 | | | | | | | | | | | | | | | | | | | | 3,492,800 | | | | | | 41,183,309 | |
Spain | | | | | | | | | | | | | | | | | | | | | | | | | | | | | | | | | | | | | | | | | | | | | | | | | | | | | | | | | | | | | | |
Aena SA | | | | | | | | | | | | | 28,700 | | | | | | | | 3,804,197 | | | | | | 252,400 | | | | | | | | 33,455,729 | | | | | | | | | | | | | | | | | | | | 281,100 | | | | | | 37,259,926 | |
Sweden | | | | | | | | | | | | | | | | | | | | | | | | | | | | | | | | | | | | | | | | | | | | | | | | | | | | | | | | | | | | | | |
Investor AB | | | | | | | | | | | | | 164,281 | | | | | | | | 5,519,149 | | | | | | 1,000,291 | | | | | | | | 33,605,558 | | | | | | | | | | | | | | | | | | | | 1,164,572 | | | | | | 39,124,707 | |
Svenska Cellulosa AB SCA | | | | | | | | | | | | | 75,297 | | | | | | | | 2,419,342 | | | | | | 506,380 | | | | | | | | 16,270,325 | | | | | | | | | | | | | | | | | | | | 581,677 | | | | | | 18,689,667 | |
Telefonaktiebolaget LM Ericsson | | | | | | | | | | | | | 458,800 | | | | | | | | 3,524,755 | | | | | | 3,981,355 | | | | | | | | 30,586,971 | | | | | | | | | | | | | | | | | | | | 4,440,155 | | | | | | 34,111,726 | |
Switzerland | | | | | | | | | | | | | | | | | | | | | | | | | | | | | | | | | | | | | | | | | | | | | | | | | | | | | | | | | | | | | | |
GAM Holding AG | | | | | | | | | | | | | 231,177 | | | | | | | | 2,467,897 | | | | | | 1,040,800 | | | | | | | | 11,110,914 | | | | | | | | | | | | | | | | | | | | 1,271,977 | | | | | | 13,578,811 | |
Nestle SA | | | | | | | | | | | | | 60,764 | | | | | | | | 4,707,892 | | | | | | 558,762 | | | | | | | | 43,291,932 | | | | | | | | | | | | | | | | | | | | 619,526 | | | | | | 47,999,824 | |
Novartis AG | | | | | | | | | | | | | 55,815 | | | | | | | | 4,606,886 | | | | | | 507,300 | | | | | | | | 41,871,778 | | | | | | | | | | | | | | | | | | | | 563,115 | | | | | | 46,478,664 | |
UBS Group AG | | | | | | | | | | | | | 291,474 | | | | | | | | 3,782,046 | | | | | | 2,229,200 | | | | | | | | 28,925,177 | | | | | | | | | | | | | | | | | | | | 2,520,674 | | | | | | 32,707,223 | |
Taiwan | | | | | | | | | | | | | | | | | | | | | | | | | | | | | | | | | | | | | | | | | | | | | | | | | | | | | | | | | | | | | | |
ChipMOS TECHNOLOGIES Bermuda, Ltd. | | | | | | | | | | | | | 176,100 | | | | | | | | 3,189,171 | | | | | | - | | | | | | | | - | | | | | | | | | | | | | | | | | | | | 176,100 | | | | | | 3,189,171 | |
Mega Financial Holding Co., Ltd. | | | | | | | | | | | | | 3,200,000 | | | | | | | | 2,420,388 | | | | | | - | | | | | | | | - | | | | | | | | | | | | | | | | | | | | 3,200,000 | | | | | | 2,420,388 | |
Realtek Semiconductor Corp. | | | | | | | | | | | | | 700,000 | | | | | | | | 2,183,212 | | | | | | - | | | | | | | | - | | | | | | | | | | | | | | | | | | | | 700,000 | | | | | | 2,183,212 | |
Yuanta Financial Holding Co., Ltd. | | | | | | | | | | | | | 1,865,510 | | | | | | | | 605,762 | | | | | | - | | | | | | | | - | | | | | | | | | | | | | | | | | | | | 1,865,510 | | | | | | 605,762 | |
Thailand | | | | | | | | | | | | | | | | | | | | | | | | | | | | | | | | | | | | | | | | | | | | | | | | | | | | | | | | | | | | | | |
Thai Union Group PCL | | | | | | | | | | | | | 4,285,000 | | | | | | | | 2,682,698 | | | | | | - | | | | | | | | - | | | | | | | | | | | | | | | | | | | | 4,285,000 | | | | | | 2,682,698 | |
Turkey | | | | | | | | | | | | | | | | | | | | | | | | | | | | | | | | | | | | | | | | | | | | | | | | | | | | | | | | | | | | | | |
Tofas Turk Otomobil Fabrikasi AS | | | | | | | | | | | | | 331,535 | | | | | | | | 2,726,010 | | | | | | - | | | | | | | | - | | | | | | | | | | | | | | | | | | | | 331,535 | | | | | | 2,726,010 | |
United Kingdom | | | | | | | | | | | | | | | | | | | | | | | | | | | | | | | | | | | | | | | | | | | | | | | | | | | | | | | | | | | | | | |
Aviva PLC | | | | | | | | | | | | | 626,375 | | | | | | | | 3,301,801 | | | | | | 5,152,526 | | | | | | | | 27,160,431 | | | | | | | | | | | | | | | | | | | | 5,778,901 | | | | | | 30,462,232 | |
Barclays PLC | | | | | | | | | | | | | 879,600 | | | | | | | | 1,635,955 | | | | | | 6,525,900 | | | | | | | | 12,137,421 | | | | | | | | | | | | | | | | | | | | 7,405,500 | | | | | | 13,773,376 | |
GKN PLC | | | | | | | | | | | | | 971,300 | | | | | | | | 3,511,688 | | | | | | 10,225,330 | | | | | | | | 36,969,182 | | | | | | | | | | | | | | | | | | | | 11,196,630 | | | | | | 40,480,870 | |
HSBC Holdings PLC | | | | | | | | | | | | | 597,200 | | | | | | | | 3,661,305 | | | | | | 4,138,600 | | | | | | | | 25,372,868 | | | | | | | | | | | | | | | | | | | | 4,735,800 | | | | | | 29,034,173 | |
IG Group Holdings PLC | | | | | | | | | | | | | - | | | | | | | | - | | | | | | 1,689,032 | | | | | | | | 18,289,288 | | | | | | | | | | | | | | | | | | | | 1,689,032 | | | | | | 18,289,288 | |
Imperial Brands PLC | | | | | | | | | | | | | 62,694 | | | | | | | | 3,400,065 | | | | | | 536,200 | | | | | | | | 29,079,579 | | | | | | | | | | | | | | | | | | | | 598,894 | | | | | | 32,479,644 | |
Inchcape PLC | | | | | | | | | | | | | 272,188 | | | | | | | | 2,288,645 | | | | | | 2,524,508 | | | | | | | | 21,226,887 | | | | | | | | | | | | | | | | | | | | 2,796,696 | | | | | | 23,515,532 | |
Johnson Matthey PLC | | | | | | | | | | | | | 73,224 | | | | | | | | 2,746,428 | | | | | | 499,473 | | | | | | | | 18,733,842 | | | | | | | | | | | | | | | | | | | | 572,697 | | | | | | 21,480,270 | |
Kingfisher PLC | | | | | | | | | | | | | 781,120 | | | | | | | | 3,354,975 | | | | | | 5,174,901 | | | | | | | | 22,226,625 | | | | | | | | | | | | | | | | | | | | 5,956,021 | | | | | | 25,581,600 | |
National Grid PLC | | | | | | | | | | | | | 211,784 | | | | | | | | 3,114,352 | | | | | | 1,682,046 | | | | | | | | 24,735,027 | | | | | | | | | | | | | | | | | | | | 1,893,830 | | | | | | 27,849,379 | |
Savills PLC | | | | | | | | | | | | | - | | | | | | | | - | | | | | | 954,991 | | | | | | | | 7,813,920 | | | | | | | | | | | | | | | | | | | | 954,991 | | | | | | 7,813,920 | |
Sky PLC | | | | | | | | | | | | | 324,060 | | | | | | | | 3,682,435 | | | | | | 1,953,200 | | | | | | | | 22,195,061 | | | | | | | | | | | | | | | | | | | | 2,277,260 | | | | | | 25,877,496 | |
UBM PLC | | | | | | | | | | | | | - | | | | | | | | - | | | | | | 2,449,049 | | | | | | | | 21,003,757 | | | | | | | | | | | | | | | | | | | | 2,449,049 | | | | | | 21,003,757 | |
Unilever PLC | | | | | | | | | | | | | 68,758 | | | | | | | | 3,294,549 | | | | | | 672,158 | | | | | | | | 32,206,544 | | | | | | | | | | | | | | | | | | | | 740,916 | | | | | | 35,501,093 | |
Vodafone Group PLC | | | | | | | | | | | | | - | | | | | | | | - | | | | | | 9,140,520 | | | | | | | | 27,868,137 | | | | | | | | | | | | | | | | | | | | 9,140,520 | | | | | | 27,868,137 | |
United States | | | | | | | | | | | | | | | | | | | | | | | | | | | | | | | | | | | | | | | | | | | | | | | | | | | | | | | | | | | | | | |
Flextronics International, Ltd. | | | | | | | | | | | | | 348,100 | | | | | | | | 4,107,580 | | | | | | 2,391,897 | | | | | | | | 28,224,385 | | | | | | | | | | | | | | | | | | | | 2,739,997 | | | | | | 32,331,965 | |
| | | | | | | | | | | | | | | | | | | | | | | | | | | | | | | | |
Total Common Stocks | | | | | | | | | | | | | | | | | | | | | 344,927,522 | | | | | | | | | | | | | | 2,464,291,491 | | | | | | | | | | | | | | | | | | | | | | | | | | 2,809,219,013 | |
| | | | | | | | | | | | | | | | | | | | | | | | | | | | | | | | |
| | | | | | | | | | | | | | | | | | | | | Total Cost ($388,262,037) | | | | | | | | | | | | | | Total Cost ($2,683,810,155) | | | | | | | | | | | | | | | | | | | | | | | | | | Total Cost ($3,072,072,192) | |
Preferred Stocks -1.3 % | | | | | | | | | | | | | | | | | | | | | | | | | | | | | | | | | | | | | | | | | | | | | | | | | | | | | | | | | | | | | | |
Brazil | | | | | | | | | | | | | | | | | | | | | | | | | | | | | | | | | | | | | | | | | | | | | | | | | | | | | | | | | | | | | | |
Itausa -Investimentos Itau SA | | | 4.43% | | | | | | | | | | 615,722 | | | | | | | | 1,454,824 | | | | | | - | | | | | | | | - | | | | | | | | | | | | | | | | | | | | 615,722 | | | | | | 1,454,824 | |
Germany | | | | | | | | | | | | | | | | | | | | | | | | | | | | | | | | | | | | | | | | | | | | | | | | | | | | | | | | | | | | | | |
Porsche Automobil Holding SE | | | 2.36% | | | | | | | | | | 38,900 | | | | | | | | 1,798,029 | | | | | | 182,140 | | | | | | | | 8,418,844 | | | | | | | | | | | | | | | | | | | | 221,040 | | | | | | 10,216,873 | |
Republic of Korea | | | | | | | | | | | | | | | | | | | | | | | | | | | | | | | | | | | | | | | | | | | | | | | | | | | | | | | | | | | | | | |
Hyundai Motor Co. | | | 3.31% | | | | | | | | | | 34,900 | | | | | | | | 2,875,553 | | | | | | 228,630 | | | | | | | | 18,837,753 | | | | | | | | | | | | | | | | | | | | 263,530 | | | | | | 21,713,306 | |
Samsung Electronics Co., Ltd. | | | 1.76% | | | | | | | | | | 4,186 | | | | | | | | 4,318,223 | | | | | | - | | | | | | | | - | | | | | | | | | | | | | | | | | | | | 4,186 | | | | | | 4,318,223 | |
| | | | | | | | | | | | | | | | | | | | | | | | | | | | | | | | |
Total Preferred Stocks | | | | | | | | | | | | | | | | | | | | | 10,446,629 | | | | | | | | | | | | | | 27,256,597 | | | | | | | | | | | | | | | | | | | | | | | | | | 37,703,226 | |
| | | | | | | | | | | | | | | | | | | | | | | | | | | | | | | | |
| | | | | | | | | | | | | | | | | | | | | Total Cost ($13,058,585) | | | | | | | | | | | | | | Total Cost ($37,227,099) | | | | | | | | | | | | | | | | | | | | | | | | | | Total Cost ($50,285,684) | |
Right -0.1% | | | | | | | | | | | | | | | | | | | | | | | | | | | | | | | | | | | | | | | | | | | | | | | | | | | | | | | | | | | | | | |
Hong Kong | | | | | | | | | | | | | | | | | | | | | | | | | | | | | | | | | | | | | | | | | | | | | | | | | | | | | | | | | | | | | | |
Noble Group, Ltd. | | | | | | | | | | | | | 6,990,500 | | | | | | | | 487,747 | | | | | | 34,084,200 | | | | | | | | 2,378,152 | | | | | | | | | | | | | | | | | | | | 41,074,700 | | | | | | 2,865,899 | |
| | | | | | | | | | | | | | | | | | | | | | | | | | | | | | | | |
Total Right | | | | | | | | | | | | | | | | | | | | | 487,747 | | | | | | | | | | | | | | 2,378,152 | | | | | | | | | | | | | | | | | | | | | | | | | | 2,865,899 | |
| | | | | | | | | | | | | | | | | | | | | | | | | | | | | | | | |
| | | | | | | | | | | | | | | | | | | | | Total Cost ($1,328,513) | | | | | | | | | | | | | | Total Cost ($6,311,203) | | | | | | | | | | | | | | | | | | | | | | | | | | Total Cost ($7,639,716) | |
S-25
| | | | | | | | | | | | | | | | | | | | | | | | | | | | | | | | | | | | | | | | | | | | | | | | | | | | | | | | | | | | | | |
| | | | | | | | | | | TPP Master | | | | | TAF Destination | | | | | Adjustments | | | | | Combined Pro Forma Destination | |
| | | | | | | | | | | | | | | | | | |
| | | Coupon Rate | | | Maturity Date | | | | | Shares | | | | | | Value | | | | | Shares | | | | | | Value | | | | | Shares | | | | | | Value | | | | | Shares | | | | | Value | |
| | | | | | | | | | | | | | | | | | | | | | |
Securities Lending Collateral - 4.0 % | | | | | | | | | | | | | | | | | | | | | | | | | | | | | | | | | | | | | | | | | | | | | | | | | | | | | | | | | | | | | | |
State Street Navigator Securities Lending Trust - Prime Portfolio | | | 0.51% | | | | | | | | | | 14,566,658 | | | | | | | $ | 14,566,658 | | | | | | 105,976,380 | | | | | | | $ | 105,976,381 | | | | | | | | | | | | | | | | | | | | 120,543,038 | | | | | $ | 120,543,039 | |
| | | | | | | | | | | | | | | | | | | | | | | | | | | | | | | | |
Total Securities Lending Collateral | | | | | | | | | | | | | | | | | | | | | 14,566,658 | | | | | | | | | | | | | | 105,976,381 | | | | | | | | | | | | | | | | | | | | | | | | | | 120,543,039 | |
| | | | | | | | | | | | | | | | | | | | | | | | | | | | | | | | |
| | | | | | | | | | | | | | | | | | | | | Total Cost ($14,566,658) | | | | | | | | | | | | | | Total Cost ($105,976,381) | | | | | | | | | | | | | | | | | | | | | | | | | | Total Cost ($120,543,039) | |
| | | | | | | | | | | | | | | | | | |
| | | | | | | | | | | Principal | | | | | | Value | | | | | Principal | | | | | | Value | | | | | Principal | | | | | | Value | | | | | Principal | | | | | Value | |
| | | | | | | | | | | | | | | | | | | | | | | | | | | | | | | | |
Repurchase Agreement - 3.8 % | | | | | | | | | | | | | | | | | | | | | | | | | | | | | | | | | | | | | | | | | | | | | | | | | | | | | | | | | | | | | | |
State Street Bank & Trust Co. | | | 0.03% | | | | 07/01/2016 | | | | | | $3,020,235 | | | | | | | | 3,020,235 | | | | | | $111,217,211 | | | | | | | | 111,217,211 | | | | | | | | | | | | | | | | | | | | $114,237,446 | | | | | | 114,237,446 | |
| | | | | | | | | | | | | | | | | | | | | | | | | | | | | | | | |
Total Repurchase Agreement | | | | | | | | | | | | | | | | | | | | | 3,020,235 | | | | | | | | | | | | | | 111,217,211 | | | | | | | | | | | | | | | | | | | | | | | | | | 114,237,446 | |
| | | | | | | | | | | | | | | | | | | | | | | | | | | | | | | | |
| | | | | | | | | | | | | | | | | | | | | Total Cost ($3,020,235) | | | | | | | | | | | | | | Total Cost ($111,217,211) | | | | | | | | | | | | | | | | | | | | | | | | | | Total Cost ($114,237,446) | |
| | | | | | | | | | |
| | | | | | | | | | | | | | | | | | | | | | | | | | | | | | | | |
Total Investments | | | | | | | | | | | | | | | | | | | | | 373,448,791 | | | | | | | | | | | | | | 2,711,119,832 | | | | | | | | | | | | | | | | | | | | | | | | | | 3,084,568,623 | |
| | | | | | | | | | | | | | | | | | | | | | | | | | | | | | | | |
| | | | | | | | | | | | | | | | | | | | | Total Cost ($420,236,028) | | | | | | | | | | | | | | Total Cost ($2,944,542,049) | | | | | | | | | | | | | | | | | | | | | | | | | | Total Cost ($3,364,778,077) | |
Other Assets and Liabilities - (3.7)% | | | | | | | | | | | | | | | | | | | | | (13,395,143) | | | | | | | | | | | | | | (97,354,335) | | | | | | | | | | | | | | (326,390)(a)(c) | | | | | | | | | | | | (111,075,868) | |
| | | | | | | | | | | | | | | | | | | | | | | | | | | | | | | | | | | | | | | | | | | | | | | | | | | | | | | | | | | | | | |
Net Assets | | | | | | | | | | | | | | | | | | | | | $360,053,648 | | | | | | | | | | | | | | $2,613,765,497 | | | | | | | | | | | | | | (326,390) | | | | | | | | | | | | $2,973,492,755 | |
| | | | | | | | | | | | | | | | | | | | | | | | | | | | | | | | | | | | | | | | | | | | | | | | | | | | | | | | | | | | | | |
VALUATION SUMMARY:
| | | | | | | | | | | | | | | | | | | | | | | | | | | | | | | | | | | | | | | | | | | | | | | | | | | | | | | | |
| Investments | | Level 1 - Unadjusted
Quoted Prices | | | Level 2 - Other Significant Observable Inputs | | | Level 3 - Significant Unobservable Inputs | | | Value | | | | | | Level 1 - Unadjusted Quoted Prices | | | Level 2 - Other Significant Observable Inputs | | | Level 3 - Significant Unobservable Inputs | | | Value | | | | | | Level 1 - Unadjusted Quoted Prices | | | Level 2 - Other Significant Observable Inputs | | | Level 3 - Significant Unobservable Inputs | | | Value | |
Common Stocks | | $ | 57,050,410 | | | $ | 287,877,112 | | | $ | - | | | $ | 344,927,522 | | | | | | | $ | 121,792,528 | | | $ | 2,342,498,963 | | | $ | - | | | $ | 2,464,291,491 | | | | | | | $ | 178,842,938 | | | $ | 2,630,376,075 | | | $ | - | | | $ | 2,809,219,013 | |
Preferred Stocks | | | 1,454,824 | | | | 8,991,805 | | | | - | | | | 10,446,629 | | | | | | | | | | | | 27,256,597 | | | | - | | | | 27,256,597 | | | | | | | | 1,454,824 | | | | 36,248,402 | | | | - | | | | 37,703,226 | |
Right | | | - | | | | 487,747 | | | | - | | | | 487,747 | | | | | | | | - | | | | 2,378,152 | | | | - | | | | 2,378,152 | | | | | | | | - | | | | 2,865,899 | | | | - | | | | 2,865,899 | |
Securities Lending Collateral | | | 14,566,658 | | | | - | | | | - | | | | 14,566,658 | | | | | | | | 105,976,381 | | | | - | | | | - | | | | 105,976,381 | | | | | | | | 120,543,039 | | | | - | | | | - | | | | 120,543,039 | |
Repurchase Agreement | | | - | | | | 3,020,235 | | | | - | | | | 3,020,235 | | | | | | | | - | | | | 111,217,211 | | | | - | | | | 111,217,211 | | | | | | | | - | | | | 114,237,446 | | | | - | | | | 114,237,446 | |
Total Investments | | $ | 73,071,892 | | | $ | 300,376,899 | | | $ | - | | | $ | 373,448,791 | | | | | | | $ | 227,768,909 | | | $ | 2,483,350,923 | | | $ | - | | | $ | 2,711,119,832 | | | | | | | $ | 300,840,801 | | | $ | 2,783,727,822 | | | $ | - | | | $ | 3,084,568,623 | |
(a)-(l) See Note 2 of the Notes to the Pro Forma Financial Statements.
As of June 30, 2016, all securities held by the Target Master Portfolio would comply with the investment restrictions of the Destination Fund.
S-26
Reorganization Between TPP Master, TPFG Feeder, TPFG II Feeder and TAF Destination
PRO FORMA STATEMENT OF ASSETS AND LIABILITIES
At June 30, 2016
| | | | | | | | | | | | | | | | | | | | | | | | | | | | | | | | | | |
| | | | | TPP Master | | | | | | TPFG Feeder | | | | | | TPFG II Feeder | | | | | | TAF Destination | | | | | | Adjustments | | | | | | Combined Pro Forma
Destination |
Assets: | | | | | | | | | | | | | | | | | | | | | | | | | | | | | | | | | | |
Investments, at value | | $ | | 370,428,556 | | | | $ | | - | | | | $ | | - | | | | $ | | 2,599,902,621 | | | | $ | | - | | | | $ | | 2,970,331,177 |
Repurchase agreements, at value | | | | 3,020,235 | | | | | | - | | | | | | - | | | | | | 111,217,211 | | | | | | - | | | | | | 114,237,446 |
Investments in Series Portfolio, at value | | | | - | | | | | | 138,251,826 | | | | | | 40,354,488 | | | | | | - | | | | | | (178,606,314) | | (b) | | | | - |
Foreign currency, at value | | | | 361,851 | | | | | | - | | | | | | - | | | | | | 2,055,282 | | | | | | - | | | | | | 2,417,133 |
Receivables: | | | | - | | | | | | - | | | | | | - | | | | | | - | | | | | | | | | | | | |
Shares of beneficial interest sold | | | | - | | | | | | - | | | | | | 8,743 | | | | | | 7,907,360 | | | | | | - | | | | | | 7,916,103 |
Investments sold | | | | 533,551 | | | | | | - | | | | | | - | | | | | | 7,562,777 | | | | | | | | | | | | 8,096,328 |
Interest | | | | 2 | | | | | | - | | | | | | - | | | | | | 93 | | | | | | - | | | | | | 95 |
Dividends | | | | 640,469 | | | | | | - | | | | | | - | | | | | | 6,306,578 | | | | | | - | | | | | | 6,947,047 |
Tax reclaims | | | | 841,355 | | | | | | - | | | | | | - | | | | | | 2,562,502 | | | | | | - | | | | | | 3,403,857 |
Net income from securities lending | | | | 15,209 | | | | | | - | | | | | | - | | | | | | 146,639 | | | | | | - | | | | | | 161,848 |
Due from advisor | | | | - | | | | | | 3,688 | | | | | | 3,340 | | | | | | | | | | | | - | | | | | | 7,028 |
Prepaid Expenses | | | | 1,146 | | | | | | 505 | | | | | | 134 | | | | | | 81,223 | | | | | | - | | | | | | 83,008 |
Total assets | | $ | | 375,842,374 | | | | $ | | 138,256,019 | | | | $ | | 40,366,705 | | | | $ | | 2,737,742,286 | | | | $ | | (178,606,314) | | | | $ | | 3,113,601,070 |
| | | | | | | | | | | | | | | | | |
Liabilities: | | | | | | | | | | | | | | | | | | | | | | | | | | | | | | | | | | |
Payables and other liabilities: | | | | | | | | | | | | | | | | | | | | | | | | | | | | | | | | | | |
Shares of beneficial interest redeemed | | | | - | | | | | | 29,685 | | | | | | - | | | | | | 2,745,691 | | | | | | - | | | | | | 2,775,376 |
Investments purchased | | | | 910,985 | | | | | | - | | | | | | - | | | | | | 13,206,159 | | | | | | - | | | | | | 14,117,144 |
Investment advisory fees | | | | 222,294 | | | | | | - | | | | | | - | | | | | | 1,588,310 | | | | | | - | | | | | | 1,810,604 |
Administration/Investment advisory fees | | | | - | | | | | | 34,565 | | | | | | 1,698 | | | | | | - | | | | | | - | | | | | | 36,263 |
Distribution and service fees | | | | - | | | | | | 28,804 | | | | | | 8,489 | | | | | | 118,475 | | | | | | - | | | | | | 155,768 |
Transfer agent fees | | | | - | | | | | | - | | | | | | - | | | | | | 213,042 | | | | | | - | | | | | | 213,042 |
Trustee, CCO and deferred compensation fees | | | | 852 | | | | | | 318 | | | | | | 92 | | | | | | - | | | | | | - | | | | | | 1,262 |
Audit and tax fees | | | | 20,048 | | | | | | 6,125 | | | | | | 4,470 | | | | | | 18,159 | | | | | | - | | | | | | 48,802 |
Custody and accounting fees | | | | 53,028 | | | | | | 1,831 | | | | | | 1,831 | | | | | | - | | | | | | - | | | | | | 56,690 |
Legal fees | | | | 7,780 | | | | | | 3,075 | | | | | | 912 | | | | | | 14,954 | | | | | | - | | | | | | 26,721 |
Printing and shareholder reports fees | | | | 3,127 | | | | | | 7,528 | | | | | | 1,173 | | | | | | 40,276 | | | | | | - | | | | | | 52,104 |
Registration fees | | | | - | | | | | | 6,544 | | | | | | 5,265 | | | | | | 47,931 | | | | | | - | | | | | | 59,740 |
Other | | | | 3,954 | | | | | | 1,274 | | | | | | 257 | | | | | | 7,411 | | | | | | 198,864 | | (c) | | | | 211,760 |
Collateral for securities on loan | | | | 14,566,658 | | | | | | - | | | | | | - | | | | | | 105,976,381 | | | | | | - | | | | | | 120,543,039 |
Total liabilities | | | | 15,788,726 | | | | | | 119,749 | | | | | | 24,187 | | | | | | 123,976,789 | | | | | | 198,864 | | | | | | 140,108,315 |
Net Assets | | $ | | 360,053,648 | | | | $ | | 138,136,270 | | | | $ | | 40,342,518 | | | | $ | | 2,613,765,497 | | | | $ | | (178,805,178) | | | | $ | | 2,973,492,755 |
| | | | | | | | | | | | | | | | | | | | | | | | | | | | | | | | | | |
| | | | | | | | | | | | | | | | | |
Net Assets Consist of: | | | | | | | | | | | | | | | | | | | | | | | | | | | | | | | | | | |
Paid-in capital | | $ | | (163,020,994) | | | | | | 268,479,537 | | | | | | 324,959,562 | | | | | | 2,799,262,665 | | | | $ | | (37,566,771) | | (d) | | $ | | 3,192,113,999 |
Undistributed (distributions in excess of) net investment income (loss) | | | | 309,812,581 | | | | | | 96,000 | | | | | | 29,865 | | | | | | 29,840,836 | | | | | | (309,938,446) | | (d) | | | | 29,840,836 |
Accumulated net realized gain (loss) | | | | 260,172,690 | | | | | | (145,987,066) | | | | | | (235,975,034) | | | | | | 18,256,984 | | | | | | 121,789,410 | | (d) | | | | 18,256,984 |
Net unrealized appreciation (depreciation) on: | | | | | | | | | | | | | | | | | | | | | | | | | | | | | | | | | | |
Investments | | | | (46,787,237) | | | | | | - | | | | | | - | | | | | | (233,422,217) | | | | | | 46,787,237 | | (d) | | | | (233,422,217) |
Allocated from Series Portfolio | | | | - | | | | | | 15,547,799 | | | | | | (48,671,875) | | | | | | - | | | | | | - | | | | | | (33,124,076) |
Translation of assets and liabilities denominated in foreign currencies | | | | (123,392) | | | | | | - | | | | | | - | | | | | | (172,771) | | | | | | 123,392 | | (d) | | | | (172,771) |
| | | | | | | | | | | | | | | | | |
Net Assets | | $ | | 360,053,648 | | | | $ | | 138,136,270 | | | | $ | | 40,342,518 | | | | $ | | 2,613,765,497 | | | | $ | | (178,805,178) | | | | $ | | 2,973,492,755 |
| | | | | | | | | | | | | | | | | | | | | | | | | | | | | | | | | | |
| | | | - | | | | | | - | | | | | | - | | | | | | - | | | | | | - | | | | | | |
Net assets by class: | | | | | | | | | | - | | | | | | - | | | | | | - | | | | | | | | | | | | |
Class A | | $ | | - | | | | $ | | - | | | | $ | | - | | | | $ | | 317,845,170 | | | | $ | | - | | | | $ | | 317,845,170 |
Class C | | | | - | | | | | | - | | | | | | - | | | | | | 61,787,370 | | | | | | - | | | | | | 61,787,370 |
Class I | | | | - | | | | | | - | | | | | | - | | | | | | 1,404,486,032 | | | | | | - | | | | | | 1,404,486,032 |
Class I2 | | | | - | | | | | | - | | | | | | - | | | | | | 821,057,838 | | | | | | - | | | | | | 821,057,838 |
Class I3 | | | | 181,447,334 | | | | | | - | | | | | | - | | | | | | - | | | | | | (198,864) | | (c) | | | | 181,248,470 |
Class R | | | | - | | | | | | 138,136,270 | | | | | | - | | | | | | - | | | | | | - | | | | | | 138,136,270 |
Class R4 | | | | - | | | | | | - | | | | | | 40,342,518 | | | | | | - | | | | | | - | | | | | | 40,342,518 |
Class R6 | | | | - | | | | | | - | | | | | | - | | | | | | 8,589,087 | | | | | | - | | | | | | 8,589,087 |
Shares outstanding (unlimited shares, no par value): | | | | | | | | | | | | | | | | | | | | | | | | | | | | | | | | | | |
Class A | | | | - | | | | | | - | | | | | | - | | | | | | 20,416,237 | | | | | | - | | | | | | 20,416,237 |
Class C | | | | - | | | | | | - | | | | | | - | | | | | | 4,024,009 | | | | | | - | | | | | | 4,024,009 |
Class I | | | | - | | | | | | - | | | | | | - | | | | | | 89,008,062 | | | | | | - | | | | | | 89,008,062 |
Class I2 | | | | - | | | | | | - | | | | | | - | | | | | | 51,985,928 | | | | | | - | | | | | | 51,985,928 |
Class I3 | | | | 11,491,281 | | | | | | - | | | | | | - | | | | | | - | | | | | | - | | | | | | 11,491,281 |
Class R | | | | - | | | | | | 14,391,652 | | | | | | - | | | | | | - | | | | | | (5,643,313) | | (e) | | | | 8,748,339 |
Class R4 | | | | - | | | | | | - | | | | | | 6,605,145 | | | | | | - | | | | | | (4,050,204) | | (e) | | | | 2,554,941 |
Class R6 | | | | - | | | | | | - | | | | | | - | | | | | | 538,892 | | | | | | - | | | | | | 538,892 |
Net asset value per share: | | | | | | | | | | | | | | | | | | | | | | | | | | | | | | | | | | |
Class A | | $ | | - | | | | $ | | - | | | | $ | | - | | | | $ | | 15.57 | | | | | | - | | | | $ | | 15.57 |
Class C | | | | - | | | | | | - | | | | | | - | | | | | | 15.35 | | | | | | - | | | | | | 15.35 |
Class I | | | | - | | | | | | - | | | | | | - | | | | | | 15.78 | | | | | | - | | | | | | 15.78 |
Class I2 | | | | - | | | | | | - | | | | | | - | | | | | | 15.79 | | | | | | - | | | | | | 15.79 |
Class I3 | | | | 15.79 | | | | | | - | | | | | | - | | | | | | 15.79 | | | | | | (15.81) | | (f) | | | | 15.77 |
Class R | | | | - | | | | | | 9.60 | | | | | | - | | | | | | 15.79 | | | | | | (9.60) | | (f) | | | | 15.79 |
Class R4 | | | | - | | | | | | - | | | | | | 6.11 | | | | | | 15.79 | | | | | | (6.11) | | (f) | | | | 15.79 |
Class R6 | | | | - | | | | | | - | | | | | | - | | | | | | 15.94 | | | | | | - | | | | | | 15.94 |
Maximum offering price per share: | | | | | | | | | | | | | | | | | | | | | | | | | | | | | | | | | | |
Class A | | $ | | - | | | | $ | | - | | | | $ | | - | | | | $ | | 16.48 | | | | | | - | | | | $ | | 16.48 |
| | | | | | | | | | | | | | | | | | | | | | | | | | | | | | | | | | |
| | | | | | | | | | | | | | | | | | | | | | | | | | | | | | | | | | |
Investments, at cost | | $ | | 417,215,793 | | | | $ | | - | | | | $ | | - | | | | $ | | 2,833,324,838 | | | | | | - | | | | $ | | 3,250,540,631 |
Securities loaned, at value | | | | 13,564,877 | | | | | | - | | | | | | - | | | | | | 99,304,321 | | | | | | - | | | | | | 112,869,198 |
Repurchase agreements, at cost | | | | 3,020,235 | | | | | | - | | | | | | - | | | | | | 111,217,211 | | | | | | - | | | | | | 114,237,446 |
Foreign currency, at cost | | | | 396,021 | | | | | | - | | | | | | - | | | | | | 2,064,580 | | | | | | - | | | | | | 2,460,601 |
(a)-(l) See Note 2 of the Notes to the Pro Forma Financial Statements.
THE NOTES TO THE PRO FORMA FINANCIAL STATEMENTS ARE AN INTEGRAL PART OF THIS REPORT.
S-27
Reorganization Between TPP Master, TPFG Feeder, TPFG II Feeder and TAF Destination
PRO FORMA STATEMENT OF OPERATIONS
For the twelve-month period ended June 30, 2016
| | | | | | | | | | | | | | | | | | | | | | | | | | | | | | | | | | |
| | | | | TPP Master | | | | | | TPFG Feeder | | | | | | TPFG II Feeder | | | | | | TAF Destination | | | | | | Adjustments | | | | | | Combined Pro
Forma Destination |
Investment Income: | | | | | | | | | | | | | | | | | | | | | | | | | | | | | | | | | | |
| | | | | | | | | | | | | | | | | |
Dividend income | | $ | | 12,542,731 | | | | $ | | 4,760,037 | | | | $ | | 1,368,405 | | | | $ | | 75,083,174 | | | | $ | | (6,128,442) | | (b) | | $ | | 87,625,905 |
Interest income | | | | 41,990 | | | | | | 15,720 | | | | | | 4,406 | | | | | | 19,182 | | | | | | (20,126) | | (b) | | | | 61,172 |
Net income (loss) from securities lending | | | | 506,634 | | | | | | 191,569 | | | | | | 54,531 | | | | | | 1,719,814 | | | | | | (246,100) | | (b) | | | | 2,226,448 |
Withholding taxes on foreign income | | | | (1,290,177) | | | | | | (489,966) | | | | | | (140,622) | | | | | | (6,782,492) | | | | | | 630,588 | | (b) | | | | (8,072,669) |
Expenses (net of waiver and/or reimbursement) | | | | - | | | | | | (1,247,138) | | | | | | (353,856) | | | | | | - | | | | | | 1,600,994 | | (b) | | | | - |
Total investment income (loss) | | | | 11,801,178 | | | | | | 3,230,222 | | | | | | 932,864 | | | | | | 70,039,678 | | | | | | (4,163,086) | | | | | | 81,840,856 |
| | | | | | | | | | | | | | | | | |
Expenses: | | | | | | | | | | | | | | | | | | | | | | | | | | | | | | | | | | |
Investment advisory fees | | | | 2,972,905 | | | | | | - | | | | | | - | | | | | | 9,229,106 | | | | | | 480,944 | | (g) | | | | 12,682,955 |
Investment management fees | | | | - | | | | | | - | | | | | | - | | | | | | 6,347,051 | | | | | | - | | | | | | 6,347,051 |
Administration/Investment advisory fees | | | | - | | | | | | 456,474 | | | | | | 21,570 | | | | | | - | | | | | | (478,044) | | (h) | | | | - |
Distribution and service fees: | | | | | | | | | | | | | | | | | | | | | | | | | | | | | | | | | | |
Class A | | | | - | | | | | | - | | | | | | - | | | | | | 699,470 | | | | | | (520) | | (i) | | | | 698,950 |
Class C | | | | - | | | | | | - | | | | | | - | | | | | | 603,562 | | | | | | (527) | | (i) | | | | 603,035 |
Class R | | | | - | | | | | | 380,395 | | | | | | - | | | | | | - | | | | | | 379,280 | | (i) | | | | 759,675 |
Class R4 | | | | - | | | | | | - | | | | | | 107,851 | | | | | | - | | | | | | (155) | | (i) | | | | 107,696 |
Administration fees | | | | - | | | | | | - | | | | | | - | | | | | | 382,681 | | | | | | (382,681) | | (h) | | | | - |
Transfer agent fees: | | | | | | | | | | | | | | | | | | | | | | | | | | | | | | | | | | |
Class A | | | | - | | | | | | - | | | | | | - | | | | | | 684,679 | | | | | | - | | | | | | 684,679 |
Class C | | | | - | | | | | | - | | | | | | - | | | | | | 93,218 | | | | | | - | | | | | | 93,218 |
Class I | | | | - | | | | | | - | | | | | | - | | | | | | 1,191,358 | | | | | | | | | | | | 1,191,358 |
Class I2 | | | | - | | | | | | - | | | | | | - | | | | | | 52,108 | | | | | | | | | | | | 52,108 |
Class R6 | | | | - | | | | | | - | | | | | | - | | | | | | 148 | | | | | | | | | | | | 148 |
Trustee, CCO and deferred compensation fees | | | | 6,053 | | | | | | 2,768 | | | | | | 668 | | | | | | 33,389 | | | | | | - | | | | | | 42,878 |
Audit and tax fees | | | | 45,059 | | | | | | 11,245 | | | | | | 7,533 | | | | | | 34,792 | | | | | | (25,923) | | (j) | | | | 72,706 |
Custody fees | | | | 241,474 | | | | | | 11,268 | | | | | | 11,265 | | | | | | 826,897 | | | | | | (233,920) | | (k) | | | | 856,984 |
Legal fees | | | | 10,525 | | | | | | 6,953 | | | | | | 1,105 | | | | | | 67,065 | | | | | | - | | | | | | 85,648 |
Printing and shareholder reports fees | | | | 1,730 | | | | | | 20,921 | | | | | | 2,760 | | | | | | 256,772 | | | | | | - | | | | | | 282,183 |
Registration fees | | | | - | | | | | | 26,436 | | | | | | 19,453 | | | | | | 221,204 | | | | | | | | | | | | 267,093 |
Other | | | | 13,864 | | | | | | 4,863 | | | | | | 1,662 | | | | | | 35,659 | | | | | | - | | | | | | 56,048 |
Total expenses before waiver and/or reimbursment and recapture | | | | 3,291,610 | | | | | | 921,323 | | | | | | 173,867 | | | | | | 20,759,159 | | | | | | (261,545) | | | | | | 24,884,414 |
Expenses waived and/or reimbursed: | | | | | | | | | | | | | | | | | | | | | | | | | | | | | | | | | | |
Class A | | | | - | | | | | | - | | | | | | - | | | | | | (94,570) | | | | | | 94,570 | | (l) | | | | - |
Class C | | | | - | | | | | | - | | | | | | - | | | | | | (1,261) | | | | | | 1,261 | | (l) | | | | - |
Class R | | | | - | | | | | | (35,701) | | | | | | - | | | | | | - | | | | | | 35,701 | | (l) | | | | - |
Class R4 | | | | - | | | | | | - | | | | | | (30,855) | | | | | | - | | | | | | 30,855 | | (l) | | | | - |
Recapture of previously waived and/or reimbursed fees: | | | | | | | | | | | | | | | | | | | | | | | | | | | | | | | | | | |
Class A | | | | - | | | | | | - | | | | | | - | | | | | | 207,941 | | | | | | - | | | | | | 207,941 |
Class C | | | | - | | | | | | - | | | | | | - | | | | | | 1,261 | | | | | | - | | | | | | 1,261 |
Net expenses | | | | 3,291,610 | | | | | | 885,622 | | | | | | 143,012 | | | | | | 20,872,530 | | | | | | (99,158) | | | | | | 25,093,616 |
| | | | | | | | | | | | | | | | | |
Net investment income (loss) | | | | 8,509,568 | | | | | | 2,344,600 | | | | | | 789,852 | | | | | | 49,167,148 | | | | | | (4,063,928) | | | | | | 56,747,240 |
| | | | | | | | | | | | | | | | | |
Net realized gain (loss) on: | | | | | | | | | | | | | | | | | | | | | | | | | | | | | | | | | | |
Allocated from series portfolio | | | | - | | | | | | (4,628,865) | | | | | | (1,348,912) | | | | | | - | | | | | | 5,977,777 | | (b) | | | | - |
Investments | | | | (12,220,532) | | | | | | - | | | | | | - | | | | | | 9,635,379 | | | | | | - | | | | | | (2,585,153) |
Foreign currency transactions | | | | (161,053) | | | | | | - | | | | | | - | | | | | | 293,518 | | | | | | - | | | | | | 132,465 |
Net realized gain (loss) | | | | (12,381,585) | | | | | | (4,628,865) | | | | | | (1,348,912) | | | | | | 9,928,897 | | | | | | 5,977,777 | | | | | | (2,452,688) |
| | | | | | | | | | | | | | | | | |
Net change in unrealized appreciation (depreciation) on: | | | | | | | | | | | | | | | | | | | | | | | | | | | | | | | | | | |
Allocated from series portfolio | | | | - | | | | | | (17,887,215) | | | | | | (4,941,088) | | | | | | - | | | | | | 22,828,303 | | (b) | | | | - |
Investments | | | | (46,914,312) | | | | | | - | | | | | | - | | | | | | (263,837,728) | | | | | | - | | | | | | (310,752,040) |
Translation of assets and liabilities denominated in foreign cuurencies | | | | (43,477) | | | | | | - | | | | | | - | | | | | | (97,178) | | | | | | - | | | | | | (140,655) |
Net change in unrealized appreciation (depreciation) | | | | (46,957,789) | | | | | | (17,887,215) | | | | | | (4,941,088) | | | | | | (263,934,906) | | | | | | 22,828,303 | | | | | | (310,892,695) |
| | | | | | | | | | | | | | | | | |
Net realized and change in unrealized gain (loss) | | | | (59,339,374) | | | | | | (22,516,080) | | | | | | (6,290,000) | | | | | | (254,006,009) | | | | | | 28,806,080 | | | | | | (313,345,383) |
| | | | | | | | | | | | | | | | | |
Net increase (decrease) in net assets resulting from operations | | $ | | (50,829,806) | | | | $ | | (20,171,480) | | | | $ | | (5,500,148) | | | | $ | | (204,838,861) | | | | $ | | 24,742,152 | | | | $ | | (256,598,143) |
| | | | | | | | | | | | | | | | | | | | | | | | | | | | | | | | | | |
(a)-(l) See Note 2 of the Notes to the Pro Forma Financial Statements.
THE NOTES TO THE PRO FORMA FINANCIAL STATEMENTS ARE AN INTEGRAL PART OF THIS REPORT.
S-28
Group Five Reorganization Between:
TRANSAMERICA PARTNERS MID GROWTH
TRANSAMERICA PARTNERS INSTITUTIONAL MID GROWTH
TRANSAMERICA PARTNERS MID GROWTH PORTFOLIO
AND
TRANSAMERICA MID CAP GROWTH
PRO FORMA SCHEDULE OF INVESTMENTS
At June 30, 2016
Reorganization Between TPP Master and TAF
PRO FORMA SCHEDULE OF INVESTMENTS
At June 30, 2016
| | | | | | | | | | | | | | | | | | | | | | | | | | | | | | | | | | | | | | | | | | | | | | | | | | | | | | | | | | |
| | | | | | | | | | | TPP Master | | | | | TAF Destination | | | | | Adjustments | | | | | Combined Pro Forma Destination | |
| | | Coupon Rate | | | Maturity Date | | | | | Shares | | | | | | Value | | | | | Shares | | | | | Value | | | | | Shares | | | | | Value | | | | | Shares | | | | | Value | |
| | | | | | | | | | | | | | | | | | | | | | | | | | | | |
Common Stocks - 98.9 % | | | | | | | | | | | | | | | | | | | | | | | | | | | | | | | | | | | | | | | | | | | | | | | | | | | | | | | | | | |
Aerospace & Defense | | | | | | | | | | | | | | | | | | | | | | | | | | | | | | | | | | | | | | | | | | | | | | | | | | | | | | | | | | |
B/E Aerospace, Inc. | | | | | | | | | | | | | 39,159 | | | | | | | $ | 1,808,167 | | | | | | 212,184 | | | | | $ | 9,797,596 | | | | | | | | | | | | | | | | | | 251,343 | | | | | $ | 11,605,763 | |
Spirit Aerosystems Holdings, Inc. | | | | | | | | | | | | | 46,963 | | | | | | | | 2,019,409 | | | | | | 236,633 | | | | | | 10,175,219 | | | | | | | | | | | | | | | | | | 283,596 | | | | | | 12,194,628 | |
Airlines | | | | | | | | | | | | | | | | | | | | | | | | | | | | | | | | | | | | | | | | | | | | | | | | | | | | | | | | | | |
JetBlue Airways Corp. | | | | | | | | | | | | | 117,541 | | | | | | | | 1,946,479 | | | | | | 606,444 | | | | | | 10,042,713 | | | | | | | | | | | | | | | | | | 723,985 | | | | | | 11,989,192 | |
Banks | | | | | | | | | | | | | | | | | | | | | | | | | | | | | | | | | | | | | | | | | | | | | | | | | | | | | | | | | | |
CIT Group, Inc. | | | | | | | | | | | | | 74,412 | | | | | | | | 2,374,487 | | | | | | 383,479 | | | | | | 12,236,815 | | | | | | | | | | | | | | | | | | 457,891 | | | | | | 14,611,302 | |
First Republic Bank | | | | | | | | | | | | | 22,307 | | | | | | | | 1,561,267 | | | | | | 114,139 | | | | | | 7,988,589 | | | | | | | | | | | | | | | | | | 136,446 | | | | | | 9,549,856 | |
SVB Financial Group | | | | | | | | | | | | | 15,614 | | | | | | | | 1,485,828 | | | | | | 74,062 | | | | | | 7,047,740 | | | | | | | | | | | | | | | | | | 89,676 | | | | | | 8,533,568 | |
Biotechnology | | | | | | | | | | | | | | | | | | | | | | | | | | | | | | | | | | | | | | | | | | | | | | | | | | | | | | | | | | |
BioMarin Pharmaceutical, Inc. | | | | | | | | | | | | | 26,307 | | | | | | | | 2,046,685 | | | | | | 134,956 | | | | | | 10,499,577 | | | | | | | | | | | | | | | | | | 161,263 | | | | | | 12,546,262 | |
Chemicals | | | | | | | | | | | | | | | | | | | | | | | | | | | | | | | | | | | | | | | | | | | | | | | | | | | | | | | | | | |
RPM International, Inc. | | | | | | | | | | | | | 44,528 | | | | | | | | 2,224,174 | | | | | | 227,214 | | | | | | 11,349,339 | | | | | | | | | | | | | | | | | | 271,742 | | | | | | 13,573,513 | |
Communications Equipment | | | | | | | | | | | | | | | | | | | | | | | | | | | | | | | | | | | | | | | | | | | | | | | | | | | | | | | | | | |
F5 Networks, Inc. | | | | | | | | | | | | | 24,507 | | | | | | | | 2,789,877 | | | | | | 128,054 | | | | | | 14,577,667 | | | | | | | | | | | | | | | | | | 152,561 | | | | | | 17,367,544 | |
Motorola Solutions, Inc. | | | | | | | | | | | | | 32,388 | | | | | | | | 2,136,636 | | | | | | 166,829 | | | | | | 11,005,709 | | | | | | | | | | | | | | | | | | 199,217 | | | | | | 13,142,345 | |
Construction Materials | | | | | | | | | | | | | | | | | | | | | | | | | | | | | | | | | | | | | | | | | | | | | | | | | | | | | | | | | | |
Eagle Materials, Inc. | | | | | | | | | | | | | 28,031 | | | | | | | | 2,162,592 | | | | | | 143,303 | | | | | | 11,055,827 | | | | | | | | | | | | | | | | | | 171,334 | | | | | | 13,218,419 | |
Consumer Finance | | | | | | | | | | | | | | | | | | | | | | | | | | | | | | | | | | | | | | | | | | | | | | | | | | | | | | | | | | |
Ally Financial, Inc. | | | | | | | | | | | | | 115,570 | | | | | | | | 1,972,780 | | | | | | 627,191 | | | | | | 10,706,150 | | | | | | | | | | | | | | | | | | 742,761 | | | | | | 12,678,930 | |
Discover Financial Services | | | | | | | | | | | | | 46,545 | | | | | | | | 2,494,346 | | | | | | 239,514 | | | | | | 12,835,555 | | | | | | | | | | | | | | | | | | 286,059 | | | | | | 15,329,901 | |
Diversified Consumer Services | | | | | | | | | | | | | | | | | | | | | | | | | | | | | | | | | | | | | | | | | | | | | | | | | | | | | | | | | | |
ServiceMaster Global Holdings, Inc. | | | | | | | | | | | | | 73,928 | | | | | | | | 2,942,334 | | | | | | 385,328 | | | | | | 15,336,054 | | | | | | | | | | | | | | | | | | 459,256 | | | | | | 18,278,388 | |
Diversified Telecommunication Services | | | | | | | | | | | | | | | | | | | | | | | | | | | | | | | | | | | | | | | | | | | | | | | | | | | | | | | | | | |
Level 3 Communications, Inc. | | | | | | | | | | | | | 34,777 | | | | | | | | 1,790,668 | | | | | | 188,869 | | | | | | 9,724,865 | | | | | | | | | | | | | | | | | | 223,646 | | | | | | 11,515,533 | |
Food Products | | | | | | | | | | | | | | | | | | | | | | | | | | | | | | | | | | | | | | | | | | | | | | | | | | | | | | | | | | |
WhiteWave Foods Co. | | | | | | | | | | | | | 73,065 | | | | | | | | 3,429,671 | | | | | | 373,570 | | | | | | 17,535,376 | | | | | | | | | | | | | | | | | | 446,635 | | | | | | 20,965,047 | |
Health Care Equipment & Supplies | | | | | | | | | | | | | | | | | | | | | | | | | | | | | | | | | | | | | | | | | | | | | | | | | | | | | | | | | | |
Align Technology, Inc. | | | | | | | | | | | | | 31,287 | | | | | | | | 2,520,168 | | | | | | 158,215 | | | | | | 12,744,218 | | | | | | | | | | | | | | | | | | 189,502 | | | | | | 15,264,386 | |
Boston Scientific Corp. | | | | | | | | | | | | | 102,126 | | | | | | | | 2,386,684 | | | | | | 524,760 | | | | | | 12,263,641 | | | | | | | | | | | | | | | | | | 626,886 | | | | | | 14,650,325 | |
DexCom, Inc. | | | | | | | | | | | | | 15,736 | | | | | | | | 1,248,337 | | | | | | 81,088 | | | | | | 6,432,711 | | | | | | | | | | | | | | | | | | 96,824 | | | | | | 7,681,048 | |
Health Care Providers & Services | | | | | | | | | | | | | | | | | | | | | | | | | | | | | | | | | | | | | | | | | | | | | | | | | | | | | | | | | | |
Cardinal Health, Inc. | | | | | | | | | | | | | 21,681 | | | | | | | | 1,691,335 | | | | | | 111,406 | | | | | | 8,690,782 | | | | | | | | | | | | | | | | | | 133,087 | | | | | | 10,382,117 | |
Laboratory Corp. of America Holdings | | | | | | | | | | | | | 20,214 | | | | | | | | 2,633,278 | | | | | | 103,868 | | | | | | 13,530,884 | | | | | | | | | | | | | | | | | | 124,082 | | | | | | 16,164,162 | |
Team Health Holdings, Inc. | | | | | | | | | | | | | 54,507 | | | | | | | | 2,216,799 | | | | | | 279,619 | | | | | | 11,372,105 | | | | | | | | | | | | | | | | | | 334,126 | | | | | | 13,588,904 | |
Universal Health Services, Inc. | | | | | | | | | | | | | 20,312 | | | | | | | | 2,723,839 | | | | | | 104,378 | | | | | | 13,997,090 | | | | | | | | | | | | | | | | | | 124,690 | | | | | | 16,720,929 | |
Hotels, Restaurants & Leisure | | | | | | | | | | | | | | | | | | | | | | | | | | | | | | | | | | | | | | | | | | | | | | | | | | | | | | | | | | |
Wyndham Worldwide Corp. | | | | | | | | | | | | | 41,676 | | | | | | | | 2,968,581 | | | | | | 213,083 | | | | | | 15,177,902 | | | | | | | | | | | | | | | | | | 254,759 | | | | | | 18,146,483 | |
Household Durables | | | | | | | | | | | | | | | | | | | | | | | | | | | | | | | | | | | | | | | | | | | | | | | | | | | | | | | | | | |
Whirlpool Corp. | | | | | | | | | | | | | 10,718 | | | | | | | | 1,786,048 | | | | | | 55,133 | | | | | | 9,187,363 | | | | | | | | | | | | | | | | | | 65,851 | | | | | | 10,973,411 | |
Insurance | | | | | | | | | | | | | | | | | | | | | | | | | | | | | | | | | | | | | | | | | | | | | | | | | | | | | | | | | | |
Hartford Financial Services Group, Inc. | | | | | | | | | | | | | 47,092 | | | | | | | | 2,089,943 | | | | | | 240,773 | | | | | | 10,685,506 | | | | | | | | | | | | | | | | | | 287,865 | | | | | | 12,775,449 | |
Internet Software & Services | | | | | | | | | | | | | | | | | | | | | | | | | | | | | | | | | | | | | | | | | | | | | | | | | | | | | | | | | | |
IAC/InterActiveCorp | | | | | | | | | | | | | 53,815 | | | | | | | | 3,029,784 | | | | | | 272,699 | | | | | | 15,352,954 | | | | | | | | | | | | | | | | | | 326,514 | | | | | | 18,382,738 | |
IT Services | | | | | | | | | | | | | | | | | | | | | | | | | | | | | | | | | | | | | | | | | | | | | | | | | | | | | | | | | | |
Sabre Corp. | | | | | | | | | | | | | 108,597 | | | | | | | | 2,909,314 | | | | | | 564,515 | | | | | | 15,123,357 | | | | | | | | | | | | | | | | | | 673,112 | | | | | | 18,032,671 | |
Life Sciences Tools & Services | | | | | | | | | | | | | | | | | | | | | | | | | | | | | | | | | | | | | | | | | | | | | | | | | | | | | | | | | | |
Bio-Techne Corp. | | | | | | | | | | | | | 26,791 | | | | | | | | 3,021,221 | | | | | | 136,965 | | | | | | 15,445,543 | | | | | | | | | | | | | | | | | | 163,756 | | | | | | 18,466,764 | |
Machinery | | | | | | | | | | | | | | | | | | | | | | | | | | | | | | | | | | | | | | | | | | | | | | | | | | | | | | | | | | |
Ingersoll-Rand PLC | | | | | | | | | | | | | 29,867 | | | | | | | | 1,901,931 | | | | | | 162,206 | | | | | | 10,329,278 | | | | | | | | | | | | | | | | | | 192,073 | | | | | | 12,231,209 | |
Media | | | | | | | | | | | | | | | | | | | | | | | | | | | | | | | | | | | | | | | | | | | | | | | | | | | | | | | | | | |
Starz | | | | | | | | | | | | | 74,627 | | | | | | | | 2,232,840 | | | | | | 384,580 | | | | | | 11,506,634 | | | | | | | | | | | | | | | | | | 459,207 | | | | | | 13,739,474 | |
Multiline Retail | | | | | | | | | | | | | | | | | | | | | | | | | | | | | | | | | | | | | | | | | | | | | | | | | | | | | | | | | | |
Dollar General Corp. | | | | | | | | | | | | | 39,296 | | | | | | | | 3,693,824 | | | | | | 200,529 | | | | | | 18,849,726 | | | | | | | | | | | | | | | | | | 239,825 | | | | | | 22,543,550 | |
Oil, Gas & Consumable Fuels | | | | | | | | | | | | | | | | | | | | | | | | | | | | | | | | | | | | | | | | | | | | | | | | | | | | | | | | | | |
EQT Corp. | | | | | | | | | | | | | 52,076 | | | | | | | | 4,032,245 | | | | | | 267,591 | | | | | | 20,719,571 | | | | | | | | | | | | | | | | | | 319,667 | | | | | | 24,751,816 | |
Pharmaceuticals | | | | | | | | | | | | | | | | | | | | | | | | | | | | | | | | | | | | | | | | | | | | | | | | | | | | | | | | | | |
Mylan NV | | | | | | | | | | | | | 72,991 | | | | | | | | 3,156,131 | | | | | | 369,879 | | | | | | 15,993,568 | | | | | | | | | | | | | | | | | | 442,870 | | | | | | 19,149,699 | |
Professional Services | | | | | | | | | | | | | | | | | | | | | | | | | | | | | | | | | | | | | | | | | | | | | | | | | | | | | | | | | | |
Equifax, Inc. | | | | | | | | | | | | | 19,886 | | | | | | | | 2,553,362 | | | | | | 101,226 | | | | | | 12,997,418 | | | | | | | | | | | | | | | | | | 121,112 | | | | | | 15,550,780 | |
Semiconductors & Semiconductor Equipment | | | | | | | | | | | | | | | | | | | | | | | | | | | | | | | | | | | | | | | | | | | | | | | | | | | | | | | | | | |
NXP Semiconductors NV | | | | | | | | | | | | | 27,519 | | | | | | | | 2,155,838 | | | | | | 141,974 | | | | | | 11,122,243 | | | | | | | | | | | | | | | | | | 169,493 | | | | | | 13,278,081 | |
Skyworks Solutions, Inc. | | | | | | | | | | | | | 24,527 | | | | | | | | 1,552,069 | | | | | | 126,540 | | | | | | 8,007,451 | | | | | | | | | | | | | | | | | | 151,067 | | | | | | 9,559,520 | |
Software | | | | | | | | | | | | | | | | | | | | | | | | | | | | | | | | | | | | | | | | | | | | | | | | | | | | | | | | | | |
Fortinet, Inc. | | | | | | | | | | | | | 73,882 | | | | | | | | 2,333,932 | | | | | | 373,929 | | | | | | 11,812,417 | | | | | | | | | | | | | | | | | | 447,811 | | | | | | 14,146,349 | |
Specialty Retail | | | | | | | | | | | | | | | | | | | | | | | | | | | | | | | | | | | | | | | | | | | | | | | | | | | | | | | | | | |
Foot Locker, Inc. | | | | | | | | | | | | | 43,337 | | | | | | | | 2,377,468 | | | | | | 226,679 | | | | | | 12,435,610 | | | | | | | | | | | | | | | | | | 270,016 | | | | | | 14,813,078 | |
Signet Jewelers, Ltd. | | | | | | | | | | | | | 11,729 | | | | | | | | 966,587 | | | | | | 58,126 | | | | | | 4,790,164 | | | | | | | | | | | | | | | | | | 69,855 | | | | | | 5,756,751 | |
Trading Companies & Distributors | | | | | | | | | | | | | | | | | | | | | | | | | | | | | | | | | | | | | | | | | | | | | | | | | | | | | | | | | | |
Air Lease Corp. | | | | | | | | | | | | | 111,475 | | | | | | | | 2,985,301 | | | | | | 597,527 | | | | | | 16,001,773 | | | | | | | | | | | | | | | | | | 709,002 | | | | | | 18,987,074 | |
| | | | | | | | | | | | | | | | | | | | | | | | | | | | | | | | |
Total Common Stocks | | | | | | | | | | | | | | | | | | | | | 96,352,259 | | | | | | | | | | | | 496,484,700 | | | | | | | | | | | | | | | | | | | | | | | | 592,836,959 | |
| | | | | | | | | | | | | | | | | | | | | | | | | | | | | | | | |
| | | | | | | | | | | | | | | | | | | | | Total Cost ($92,887,502) | | | | | | | | | | | | Total Cost ($506,348,618) | | | | | | | | | | | | | | | | | | | | | | | | Total Cost ($599,236,120) | |
Securities Lending Collateral - 6.1 % | | | | | | | | | | | | | | | | | | | | | | | | | | | | | | | | | | | | | | | | | | | | | | | | | | | | | | | | | | |
State Street Navigator Securities Lending Trust - Prime Portfolio | | | 0.51 | % | | | | | | | | | 6,606,709 | | | | | | | | 6,606,709 | | | | | | 30,014,441 | | | | | | 30,014,441 | | | | | | | | | | | | | | | | | | 36,621,150 | | | | | | 36,621,150 | |
| | | | | | | | | | | | | | | | | | | | | | | | | | | | | | | | |
Total Securities Lending Collateral | | | | | | | | | | | | | | | | | | | | | 6,606,709 | | | | | | | | | | | | 30,014,441 | | | | | | | | | | | | | | | | | | | | | | | | 36,621,150 | |
| | | | | | | | | | | | | | | | | | | | | | | | | | | | | | | | |
| | | | | | | | | | | | | | | | | | | | | Total Cost ($6,606,709) | | | | | | | | | | | | Total Cost ($30,014,441) | | | | | | | | | | | | | | | | | | | | | | | | Total Cost ($36,621,150) | |
| | | | | | | | | | | | | | | | | | |
| | | | | | | | | | | Principal | | | | | | Value | | | | | Principal | | | | | Value | | | | | Principal | | | | | Value | | | | | Principal | | | | | Value | |
| | | | | | | | | | | | | | | | | | | | | | | | | | | | | | | | |
Repurchase Agreement - 0.2 % | | | | | | | | | | | | | | | | | | | | | | | | | | | | | | | | | | | | | | | | | | | | | | | | | | | | | | | | | | |
State Street Bank & Trust Co. | | | 0.03 | % | | | 07/01/2016 | | | | | | - | | | | | | | | - | | | | | $ | 1,193,412 | | | | | | 1,193,412 | | | | | | | | | | | | | | | | | $ | 1,193,412 | | | | | | 1,193,412 | |
| | | | | | | | | | | | | | | | | | | | | | | | | | | | | | | | |
Total Repurchase Agreement | | | | | | | | | | | | | | | | | | | | | - | | | | | | | | | | | | 1,193,412 | | | | | | | | | | | | | | | | | | | | | | | | 1,193,412 | |
| | | | | | | | | | | | | | | | | | | | | | | | | | | | | | | | |
| | | | | | | | | | | | | | | | | | | | | Total Cost ($0) | | | | | | | | | | | | Total Cost ($1,193,412) | | | | | | | | | | | | | | | | | | | | | | | | Total Cost ($1,193,412) | |
| | | | | | | | | | |
| | | | | | | | | | | | | | | | | | | | | | | | | | | | | | | | |
Total Investments | | | | | | | | | | | | | | | | | | | | | 102,958,968 | | | | | | | | | | | | 527,692,553 | | | | | | | | | | | | | | | | | | | | | | | | 630,651,521 | |
| | | | | | | | | | | | | | | | | | | | | | | | | | | | | | | | |
| | | | | | | | | | | | | | | | | | | | | Total Cost ($99,494,211) | | | | | | | | | | | | Total Cost ($537,556,471) | | | | | | | | | | | | | | | | | | | | | | | | Total Cost ($637,050,682) | |
| | | | | | | | | | | | | | | | | | |
Other Assets and Liabilities - (5.2)% | | | | | | | | | | | | | | | | | | | | | (5,445,496) | | | | | | | | | | | | (25,388,521) | | | | | | | | | | | | (175,717)(a)(c) | | | | | | | | | | | | (31,009,734) | |
| | | | | | | | | | | | | | | | | | | | | | | | | | | | | | | | | | | | | | | | | | | | | | | | | | | | | | | | | | |
Net Assets | | | | | | | | | | | | | | | | | | | | | $97,513,472 | | | | | | | | | | | | $502,304,032 | | | | | | | | | | | | ($175,717) | | | | | | | | | | | | $599,641,787 | |
| | | | | | | | | | | | | | | | | | | | | | | | | | | | | | | | | | | | | | | | | | | | | | | | | | | | | | | | | | |
VALUATION SUMMARY:
| | | | | | | | | | | | | | | | | | | | | | | | | | | | | | | | | | | | | | | | | | | | | | | | | | | | | | | | |
| Investments | | Level 1 -
Unadjusted Quoted Prices | | | Level 2 - Other Significant Observable Inputs | | | Level 3 - Significant Unobservable Inputs | | | Value | | | | | | Level 1 -
Unadjusted Quoted Prices | | | Level 2 - Other Significant Observable Inputs | | | Level 3 - Significant Unobservable Inputs | | | Value | | | | | | Level 1 -
Unadjusted Quoted Prices | | | Level 2 - Other Significant Observable Inputs | | | Level 3 - Significant Unobservable Inputs | | | Value | |
Common Stocks | | $ | 96,352,259 | | | $ | - | | | $ | - | | | $ | 96,352,259 | | | | | | | $ | 496,484,700 | | | $ | - | | | $ | - | | | $ | 496,484,700 | | | | | | | $ | 592,836,959 | | | $ | - | | | $ | - | | | $ | 592,836,959 | |
Securities Lending Collateral | | | 6,606,709 | | | | - | | | | - | | | | 6,606,709 | | | | | | | | 30,014,441 | | | | - | | | | - | | | | 30,014,441 | | | | | | | | 36,621,150 | | | | - | | | | - | | | | 36,621,150 | |
Repurchase Agreement | | | - | | | | - | | | | - | | | | - | | | | | | | | - | | | | 1,193,412 | | | | - | | | | 1,193,412 | | | | | | | | - | | | | 1,193,412 | | | | - | | | | 1,193,412 | |
Total Investments | | $ | 102,958,968 | | | $ | - | | | $ | - | | | $ | 102,958,968 | | | | | | | $ | 526,499,141 | | | $ | 1,193,412 | | | $ | - | | | $ | 527,692,553 | | | | | | | $ | 629,458,109 | | | $ | 1,193,412 | | | $ | - | | | $ | 630,651,521 | |
(a)-(l) See Note 2 of the Notes to the Pro Forma Financial Statements.
As of June 30, 2016, all securities held by the Target Master Portfolio would comply with the investment restrictions of the Destination Fund.
S-29
Reorganization Between TPP Master, TPFG Feeder, TPFG II Feeder and TAF Destination
PRO FORMA STATEMENT OF ASSETS AND LIABILITIES
At June 30, 2016
| | | | | | | | | | | | | | | | | | | | | | | | | | | | | | | | | | |
| | | | | TPP Master | | | | | | TPFG Feeder | | | | | | TPFG II Feeder | | | | | | TAF Destination | | | | | | Adjustments | | | | | | Combined Pro Forma Destination |
Assets: | | | | | | | | | | | | | | | | | | | | | | | | | | | | | | | | | | |
Investments, at value | | $ | | 102,958,968 | | | | $ | | - | | | | $ | | - | | | | $ | | 526,499,141 | | | | $ | | - | | | | $ | | 629,458,109 |
Repurchase agreements, at value | | | | - | | | | | | - | | | | | | - | | | | | | 1,193,412 | | | | | | - | | | | | | 1,193,412 |
Investments in Series Portfolio, at value | | | | - | | | | | | 48,668,002 | | | | | | 15,771,348 | | | | | | - | | | | | | (64,439,350) | | (b) | | | | - |
Cash | | | | - | | | | | | - | | | | | | - | | | | | | 52,459 | | | | | | - | | | | | | 52,459 |
Receivables: | | | | | | | | | | | | | | | | | | | | | | | | | | | | | | | | | | |
Shares of beneficial interest sold | | | | - | | | | | | - | | | | | | 2,959 | | | | | | 10,003 | | | | | | - | | | | | | 12,962 |
Investments sold | | | | 2,228,701 | | | | | | - | | | | | | - | | | | | | 4,685,656 | | | | | | - | | | | | | 6,914,357 |
Dividends | | | | 41,882 | | | | | | - | | | | | | - | | | | | | 214,764 | | | | | | - | | | | | | 256,646 |
Net income from securities lending | | | | 3,633 | | | | | | - | | | | | | - | | | | | | 8,574 | | | | | | - | | | | | | 12,207 |
Due from adviser | | | | - | | | | | | 7,002 | | | | | | 10,018 | | | | | | - | | | | | | - | | | | | | 17,020 |
Prepaid Expenses | | | | 286 | | | | | | 168 | | | | | | 48 | | | | | | 1,233 | | | | | | - | | | | | | 1,735 |
OTC swap agreements, at value | | | | - | | | | | | - | | | | | | - | | | | | | 5,521 | | | | | | - | | | | | | 5,521 |
| | | | | | | | | | | | | | | | | | | | | | |
Total assets | | $ | | 105,233,470 | | | | $ | | 48,675,172 | | | | $ | | 15,784,373 | | | | $ | | 532,670,763 | | | | $ | | (64,439,350) | | | | $ | | 637,924,428 |
| | | | | | | | | | | | | | | | | | | | | | |
| | | | | | | | | | | | | | | | | |
Liabilities: | | | | | | | | | | | | | | | | | | | | | | | | | | | | | | | | | | |
Due to custodian | | | | 1,036,516 | | | | | | - | | | | | | - | | | | | | - | | | | | | - | | | | | | 1,036,516 |
Payables and other liabilities: | | | | | | | | | | | | | | | | | | | | | | | | | | | | | | | | | | |
Shares of beneficial interest redeemed | | | | - | | | | | | 25,572 | | | | | | - | | | | | | - | | | | | | - | | | | | | 25,572 |
Investment advisory fees | | | | 57,633 | | | | | | - | | | | | | - | | | | | | - | | | | | | - | | | | | | 57,633 |
Investment management fees | | | | - | | | | | | - | | | | | | - | | | | | | 311,662 | | | | | | - | | | | | | 311,662 |
Administration/Investment advisory fees | | | | - | | | | | | 12,189 | | | | | | 670 | | | | | | - | | | | | | - | | | | | | 12,859 |
Distribution and service fees | | | | - | | | | | | 10,157 | | | | | | 3,350 | | | | | | - | | | | | | - | | | | | | 13,507 |
Transfer agent fees | | | | - | | | | | | - | | | | | | - | | | | | | 3,387 | | | | | | - | | | | | | 3,387 |
Trustee, CCO and deferred compensation fees | | | | 208 | | | | | | 115 | | | | | | 36 | | | | | | 46 | | | | | | - | | | | | | 405 |
Audit and tax fees | | | | 11,936 | | | | | | 4,695 | | | | | | 4,103 | | | | | | 13,976 | | | | | | - | | | | | | 34,710 |
Custody and accounting fees | | | | 2,992 | | | | | | 1,831 | | | | | | 1,831 | | | | | | - | | | | | | - | | | | | | 6,654 |
Legal fees | | | | 2,106 | | | | | | 1,138 | | | | | | 385 | | | | | | 1,914 | | | | | | - | | | | | | 5,543 |
Printing and shareholder reports fees | | | | 782 | | | | | | 2,903 | | | | | | 539 | | | | | | 1,562 | | | | | | - | | | | | | 5,786 |
Registration fees | | | | - | | | | | | - | | | | | | - | | | | | | 17,984 | | | | | | - | | | | | | 17,984 |
Distribution payable to shareholders | | | | - | | | | | | - | | | | | | - | | | | | | 1,707 | | | | | | - | | | | | | 1,707 |
Other | | | | 1,116 | | | | | | 339 | | | | | | 112 | | | | | | 52 | | | | | | 125,947 | | (c) | | | | 127,566 |
Collateral for securities on loan | | | | 6,606,709 | | | | | | - | | | | | | - | | | | | | 30,014,441 | | | | | | - | | | | | | 36,621,150 |
| | | | | | | | | | | | | | | | | | | | | | |
Total liabilities | | | | 7,719,998 | | | | | | 58,939 | | | | | | 11,026 | | | | | | 30,366,731 | | | | | | 125,947 | | | | | | 38,282,641 |
| | | | | | | | | | | | | | | | | | | | | | |
Net Assets | | $ | | 97,513,472 | | | | $ | | 48,616,233 | | | | $ | | 15,773,347 | | | | $ | | 502,304,032 | | | | $ | | (64,565,297) | | | | $ | | 599,641,787 |
| | | | | | | | | | | | | | | | | | | | | | |
| | | | | | | | | | | | | | | | | |
Net Assets Consist of: | | | | | | | | | | | | | | | | | | | | | | | | | | | | | | | | | | |
Paid-in capital | | $ | | (88,762,128) | | | | | | 52,701,678 | | | | | | 17,133,624 | | | | | | 534,158,736 | | | | $ | | 121,324,712 | | (d) | | $ | | 636,556,622 |
Undistributed (distributions in excess of) net investment income (loss) | | | | (4,873,857) | | | | | | (142,301) | | | | | | (14,377) | | | | | | (340,973) | | | | | | 5,030,535 | | (d) | | | | (340,973) |
Accumulated net realized gain (loss) | | | | 187,684,700 | | | | | | (756,518) | | | | | | 527,605 | | | | | | (21,649,813) | | | | | | (187,455,787) | | (d) | | | | (21,649,813) |
Net unrealized appreciation (depreciation) on: | | | | | | | | | | | | | | | | | | | | | | | | | | | | | | | | | | |
Investments | | | | 3,464,757 | | | | | | - | | | | | | - | | | | | | (9,863,918) | | | | | | (3,464,757) | | (d) | | | | (9,863,918) |
Allocated from Series Portfolio | | | | - | | | | | | (3,186,626) | | | | | | (1,873,505) | | | | | | - | | | | | | - | | | | | | (5,060,131) |
| | | | | | | | | | | | | | | | | |
Net Assets | | $ | | 97,513,472 | | | | $ | | 48,616,233 | | | | $ | | 15,773,347 | | | | $ | | 502,304,032 | | | | $ | | (64,565,297) | | | | $ | | 599,641,787 |
| | | | | | | | | | | | | | | | | | | | | | |
| | | | | | | | | | | | | | | | | |
Net assets by class: | | | | | | | | | | | | | | | | | | | | | | | | | | | | | | | | | | |
Class A | | $ | | - | | | | $ | | - | | | | $ | | - | | | | $ | | 4,204,545 | | | | $ | | - | | | | $ | | 4,204,545 |
Class C | | | | - | | | | | | - | | | | | | - | | | | | | 699,823 | | | | | | - | | | | | | 699,823 |
Class I | | | | - | | | | | | - | | | | | | - | | | | | | 395,094 | | | | | | - | | | | | | 395,094 |
Class I2 | | | | - | | | | | | - | | | | | | - | | | | | | 497,004,570 | | | | | | - | | | | | | 497,004,570 |
Class I3 | | | | 33,074,122 | | | | | | - | | | | | | - | | | | | | - | | | | | | (125,947) | | (c) | | | | 32,948,175 |
Class R | | | | - | | | | | | 48,616,233 | | | | | | - | | | | | | - | | | | | | - | | | | | | 48,616,233 |
Class R4 | | | | - | | | | | | - | | | | | | 15,773,347 | | | | | | - | | | | | | - | | | | | | 15,773,347 |
Shares outstanding (unlimited shares, no par value): | | | | | | | | | | | | | | | | | | | | | | | | | | | | | | | | | | |
Class A | | | | - | | | | | | - | | | | | | - | | | | | | 382,976 | | | | | | - | | | | | | 382,976 |
Class C | | | | - | | | | | | - | | | | | | - | | | | | | 64,807 | | | | | | - | | | | | | 64,807 |
Class I | | | | - | | | | | | - | | | | | | - | | | | | | 35,805 | | | | | | - | | | | | | 35,805 |
Class I2 | | | | - | | | | | | - | | | | | | - | | | | | | 44,940,256 | | | | | | - | | | | | | 44,940,256 |
Class I3 | | | | 2,990,427 | | | | | | - | | | | | | - | | | | | | - | | | | | | - | | | | | | 2,990,427 |
Class R | | | | - | | | | | | 5,480,346 | | | | | | - | | | | | | - | | | | | | (1,084,665) | | (e) | | | | 4,395,681 |
Class R4 | | | | - | | | | | | - | | | | | | 1,504,918 | | | | | | - | | | | | | (78,756) | | (e) | | | | 1,426,162 |
Net asset value per share: | | | | | | | | | | | | | | | | | | | | | | | | | | | | | | | | | | |
Class A | | $ | | - | | | | $ | | - | | | | $ | | - | | | | $ | | 10.98 | | | | | | - | | | | $ | | 10.98 |
Class C | | | | - | | | | | | - | | | | | | - | | | | | | 10.80 | | | | | | - | | | | | | 10.80 |
Class I | | | | - | | | | | | - | | | | | | - | | | | | | 11.03 | | | | | | - | | | | | | 11.03 |
Class I2 | | | | - | | | | | | - | | | | | | - | | | | | | 11.06 | | | | | | - | | | | | | 11.06 |
Class I3 | | | | 11.06 | | | | | | - | | | | | | - | | | | | | 11.06 | | | | | | (11.09) | | (f) | | | | 11.03 |
Class R | | | | - | | | | | | 8.87 | | | | | | - | | | | | | 11.06 | | | | | | (8.88) | | (f) | | | | 11.05 |
Class R4 | | | | - | | | | | | - | | | | | | 10.48 | | | | | | 11.06 | | | | | | (10.48) | | (f) | | | | 11.06 |
Maximum offering price per share: | | | | | | | | | | | | | | | | | | | | | | | | | | | | | | | | | | |
Class A | | $ | | - | | | | $ | | - | | | | $ | | - | | | | $ | | 11.62 | | | | | | - | | | | $ | | 11.62 |
| | | | | | | | | | | |
| | | | | | | | | | | | | | | | | | | | | | |
Investments, at cost | | $ | | 99,494,211 | | | | $ | | - | | | | $ | | - | | | | $ | | 536,363,059 | | | | | | - | | | | $ | | 635,857,270 |
Securities loaned, at value | | | | 6,458,330 | | | | | | - | | | | | | - | | | | | | 29,364,219 | | | | | | - | | | | | | 35,822,549 |
Repurchase agreements, at cost | | | | - | | | | | | - | | | | | | - | | | | | | 1,193,412 | | | | | | - | | | | | | 1,193,412 |
(a)-(l) See Note 2 of the Notes to the Pro Forma Financial Statements.
THE NOTES TO THE PRO FORMA FINANCIAL STATEMENTS ARE AN INTEGRAL PART OF THIS REPORT.
S-30
Reorganization Between TPP Master, TPFG Feeder, TPFG II Feeder and TAF Destination
PRO FORMA STATEMENT OF OPERATIONS
For the twelve-month period ended June 30, 2016
| | | | | | | | | | | | | | | | | | | | | | | | | | | | | | | | | | |
| | | | | TPP Master | | | | | | TPFG Feeder | | | | | | TPFG II Feeder | | | | | | TAF Destination | | | | | | Adjustments | | | | | | Combined Pro Forma Destination |
Investment Income: | | | | | | | | | | | | | | | | | | | | | | | | | | | | | | | | | | |
| | | | | | | | | | | | | | | | | |
Dividend income | | $ | | 847,111 | | | | $ | | 425,980 | | | | $ | | 134,199 | | | | $ | | 3,330,509 | | | | $ | | (560,179) | | (b) | | $ | | 4,177,620 |
Interest income | | | | 72 | | | | | | 37 | | | | | | 12 | | | | | | 686 | | | | | | (49) | | (b) | | | | 758 |
Net income (loss) from securities lending | | | | 39,881 | | | | | | 20,048 | | | | | | 6,335 | | | | | | 90,490 | | | | | | (26,383) | | (b) | | | | 130,371 |
Withholding taxes on foreign income | | | | (9,502) | | | | | | (4,797) | | | | | | (1,489) | | | | | | - | | | | | | 6,286 | | (b) | | | | (9,502) |
Expenses (net of waiver and/or reimbursement) | | | | - | | | | | | (407,174) | | | | | | (128,185) | | | | | | (19,841) | | | | | | 535,359 | | (b) | | | | (19,841) |
| | | | | | | | | | | | | | | | | | | | | | |
Total investment income (loss) | | | | 877,562 | | | | | | 34,094 | | | | | | 10,872 | | | | | | 3,401,844 | | | | | | (44,966) | | | | | | 4,279,406 |
| | | | | | | | | | | | | | | | | | | | | | |
| | | | | | | | | | | | | | | | | |
Expenses: | | | | | | | | | | | | | | | | | | | | | | | | | | | | | | | | | | |
Investment advisory fees | | | | 776,861 | | | | | | - | | | | | | - | | | | | | 2,064,249 | | | | | | 114,427 | | (g) | | | | 2,955,537 |
Investment management fees | | | | - | | | | | | - | | | | | | - | | | | | | 1,259,453 | | | | | | - | | | | | | 1,259,453 |
Administration/Investment advisory fees | | | | - | | | | | | 162,686 | | | | | | 8,525 | | | | | | - | | | | | | (171,211) | | (h) | | | | - |
Distribution and service fees: | | | | | | | | | | | | | | | | | | | | | | | | | | | | | | | | | | |
Class A | | | | - | | | | | | - | | | | | | - | | | | | | 7,157 | | | | | | (5) | | (i) | | | | 7,152 |
Class C | | | | - | | | | | | - | | | | | | - | | | | | | 8,167 | | | | | | (9) | | (i) | | | | 8,158 |
Class R | | | | - | | | | | | 135,572 | | | | | | - | | | | | | - | | | | | | 135,163 | | (i) | | | | 270,735 |
Class R4 | | | | - | | | | | | - | | | | | | 42,631 | | | | | | - | | | | | | (63) | | (i) | | | | 42,568 |
Administration fees | | | | - | | | | | | - | | | | | | - | | | | | | 84,256 | | | | | | (84,256) | | (h) | | | | - |
Transfer agent fees: | | | | | | | | | | | | | | | | | | | | | | | | | | | | | | | | | | |
Class A | | | | - | | | | | | - | | | | | | - | | | | | | 4,559 | | | | | | - | | | | | | 4,559 |
Class C | | | | - | | | | | | - | | | | | | - | | | | | | 1,664 | | | | | | - | | | | | | 1,664 |
Class I | | | | - | | | | | | - | | | | | | - | | | | | | 606 | | | | | | | | | | | | 606 |
Class I2 | | | | - | | | | | | - | | | | | | - | | | | | | 33,788 | | | | | | | | | | | | 33,788 |
Trustee, CCO and deferred compensation fees | | | | 1,743 | | | | | | 1,018 | | | | | | 277 | | | | | | 7,257 | | | | | | - | | | | | | 10,295 |
Audit and tax fees | | | | 22,655 | | | | | | 8,175 | | | | | | 6,860 | | | | | | 23,730 | | | | | | (23,234) | | (j) | | | | 38,186 |
Custody fees | | | | 21,954 | | | | | | 11,266 | | | | | | 11,264 | | | | | | 39,801 | | | | | | (36,404) | | (k) | | | | 47,881 |
Legal fees | | | | 4,191 | | | | | | 2,566 | | | | | | 551 | | | | | | 13,980 | | | | | | - | | | | | | 21,288 |
Printing and shareholder reports fees | | | | (19) | | | | | | 8,212 | | | | | | 1,318 | | | | | | 9,252 | | | | | | - | | | | | | 18,763 |
Registration fees | | | | - | | | | | | 17,866 | | | | | | 17,026 | | | | | | 61,523 | | | | | | | | | | | | 96,415 |
Other | | | | 1,868 | | | | | | 2,033 | | | | | | 1,042 | | | | | | 7,664 | | | | | | - | | | | | | 12,607 |
| | | | | | | | | | | | | | | | | | | | | | |
Total expenses before waiver and/or reimbursement and recapture | | | | 829,253 | | | | | | 349,394 | | | | | | 89,494 | | | | | | 3,627,106 | | | | | | (65,592) | | | | | | 4,829,655 |
Expenses waived and/or reimbursed: | | | | | | | | | | | | | | | | | | | | | | | | | | | | | | | | | | |
Fund level | | | | (20,010) | | | | | | - | | | | | | - | | | | | | - | | | | | | 20,010 | | (l) | | | | - |
Class A | | | | - | | | | | | - | | | | | | - | | | | | | (1) | | | | | | 1 | | (l) | | | | - |
Class I | | | | - | | | | | | - | | | | | | - | | | | | | (230) | | | | | | 230 | | (l) | | | | - |
Class I3 | | | | - | | | | | | - | | | | | | - | | | | | | - | | | | | | (15,967) | | (l) | | | | (15,967) |
Class R | | | | - | | | | | | (24,468) | | | | | | - | | | | | | - | | | | | | 24,468 | | (l) | | | | - |
Class R4 | | | | - | | | | | | - | | | | | | (55,680) | | | | | | - | | | | | | 39,730 | | (l) | | | | (15,950) |
Recapture of previously waived and/or reimbursed fees: | | | | | | | | | | | | | | | | | | | | | | | | | | | | | | | | | | |
Class A | | | | - | | | | | | - | | | | | | - | | | | | | 53 | | | | | | - | | | | | | 53 |
Class I | | | | - | | | | | | - | | | | | | - | | | | | | 178 | | | | | | - | | | | | | 178 |
| | | | | | | | | | | | | | | | | | | | | | | | | | | | | | | | | | |
Net expenses | | | | 809,243 | | | | | | 324,926 | | | | | | 33,814 | | | | | | 3,627,106 | | | | | | 2,880 | | | | | | 4,797,969 |
| | | | | | | | | | | | | | | | | |
Net investment income (loss) | | | | 68,319 | | | | | | (290,832) | | | | | | (22,942) | | | | | | (225,262) | | | | | | (47,846) | | | | | | (518,563) |
| | | | | | | | | | | | | | | | | | | | | | |
| | | | | | | | | | | | | | | | | |
Net realized gain (loss) on: | | | | | | | | | | | | | | | | | | | | | | | | | | | | | | | | | | |
Allocated from series portfolio | | | | - | | | | | | (542,122) | | | | | | (168,882) | | | | | | - | | | | | | 711,004 | | (b) | | | | - |
Investments | | | | (1,055,438) | | | | | | - | | | | | | - | | | | | | (32,402,767) | | | | | | - | | | | | | (33,458,205) |
| | | | | | | | | | | | | | | | | | | | | | |
Net realized gain (loss) | | | | (1,055,438) | | | | | | (542,122) | | | | | | (168,882) | | | | | | (32,402,767) | | | | | | 711,004 | | | | | | (33,458,205) |
| | | | | | | | | | | | | | | | | | | | | | |
| | | | | | | | | | | | | | | | | |
Net change in unrealized appreciation (depreciation) on: | | | | | | | | | | | | | | | | | | | | | | | | | | | | | | | | | | |
Allocated from series portfolio | | | | - | | | | | | (6,534,560) | | | | | | (1,933,678) | | | | | | - | | | | | | 8,468,238 | | (b) | | | | - |
Investments | | | | (12,750,567) | | | | | | - | | | | | | - | | | | | | (19,781,037) | | | | | | - | | | | | | (32,531,604) |
| | | | | | | | | | | | | | | | | | | | | | |
Net change in unrealized appreciation (depreciation) | | | | (12,750,567) | | | | | | (6,534,560) | | | | | | (1,933,678) | | | | | | (19,781,037) | | | | | | 8,468,238 | | | | | | (32,531,604) |
| | | | | | | | | | | | | | | | | | | | | | |
| | | | | | | | | | | | | | | | | |
Net realized and change in unrealized gain (loss) | | | | (13,806,005) | | | | | | (7,076,682) | | | | | | (2,102,560) | | | | | | (52,183,804) | | | | | | 9,179,242 | | | | | | (65,989,809) |
| | | | | | | | | | | | | | | | | | | | | | |
| | | | | | | | | | | | | | | | | |
Net increase (decrease) in net assets resulting from operations | | $ | | (13,737,686) | | | | $ | | (7,367,514) | | | | $ | | (2,125,502) | | | | $ | | (52,409,066) | | | | $ | | 9,131,396 | | | | $ | | (66,508,372) |
| | | | | | | | | | | | | | | | | | | | | | |
(a)-(l) See Note 2 of the Notes to the Pro Forma Financial Statements.
THE NOTES TO THE PRO FORMA FINANCIAL STATEMENTS ARE AN INTEGRAL PART OF THIS REPORT.
S-31
Group Six Reorganization Between:
TRANSAMERICA PARTNERS MID VALUE
TRANSAMERICA PARTNERS INSTITUTIONAL MID VALUE
TRANSAMERICA PARTNERS MID VALUE PORTFOLIO
AND
TRANSAMERICA MID CAP VALUE OPPORTUNITIES
PRO FORMA SCHEDULE OF INVESTMENTS
At June 30, 2016
Reorganization Between TPP Master and TAF
PRO FORMA SCHEDULE OF INVESTMENTS
At June 30, 2016
| | | | | | | | | | | | | | | | | | | | | | | | | | | | | | | | | | | | | | | | | | | | | | | | |
| | | | | | | | | | | TPP Master | | | | | TAF Destination | | | | | Adjustments | | | | | Combined Pro Forma Destination | |
| | | Coupon
Rate | | | Maturity Date | | | | | Shares | | | Value | | | | | Shares | | | Value | | | | | Shares | | | Value | | | | | Shares | | | Value | |
| | | | | | | | | | | | | | | | | | | | | | | | | | | | | | | | |
Common Stocks - 95.1 % | | | | | | | | | | | | | | | | | | | | | | | | | | | | | | | | | | | | | | | | | | | | | | | | |
Aerospace & Defense | | | | | | | | | | | | | | | | | | | | | | | | | | | | | | | | | | | | | | | | | | | | | | | | |
BWX Technologies, Inc. | | | | | | | | | | | | | 61,800 | | | $ | 2,210,586 | | | | | | 282,700 | | | $ | 10,112,179 | | | | | | | | | | | | | | | | 344,500 | | | $ | 12,322,765 | |
Airlines | | | | | | | | | | | | | | | | | | | | | | | | | | | | | | | | | | | | | | | | | | | | | | | | |
Alaska Air Group, Inc. | | | | | | | | | | | | | 53,600 | | | | 3,124,344 | | | | | | 178,100 | | | | 10,381,449 | | | | | | | | | | | | | | | | 231,700 | | | | 13,505,793 | |
Copa Holdings SA | | | | | | | | | | | | | 45,300 | | | | 2,367,378 | | | | | | 142,000 | | | | 7,420,920 | | | | | | | | | | | | | | | | 187,300 | | | | 9,788,298 | |
Banks | | | | | | | | | | | | | | | | | | | | | | | | | | | | | | | | | | | | | | | | | | | | | | | | |
CIT Group, Inc. | | | | | | | | | | | | | 282,500 | | | | 9,014,575 | | | | | | 642,800 | | | | 20,511,748 | | | | | | | | | | | | | | | | 925,300 | | | | 29,526,323 | |
Citizens Financial Group, Inc. | | | | | | | | | | | | | 148,336 | | | | 2,963,753 | | | | | | - | | | | - | | | | | | | | | | | | | | | | 148,336 | | | | 2,963,753 | |
Fifth Third Bancorp | | | | | | | | | | | | | 281,010 | | | | 4,942,966 | | | | | | - | | | | - | | | | | | | | | | | | | | | | 281,010 | | | | 4,942,966 | |
First Republic Bank | | | | | | | | | | | | | 118,606 | | | | 8,301,234 | | | | | | 167,000 | | | | 11,688,330 | | | | | | | | | | | | | | | | 285,606 | | | | 19,989,564 | |
Huntington Bancshares, Inc. | | | | | | | | | | | | | 185,819 | | | | 1,661,222 | | | | | | - | | | | - | | | | | | | | | | | | | | | | 185,819 | | | | 1,661,222 | |
M&T Bank Corp. | | | | | | | | | | | | | 56,935 | | | | 6,731,425 | | | | | | - | | | | - | | | | | | | | | | | | | | | | 56,935 | | | | 6,731,425 | |
SunTrust Banks, Inc. | | | | | | | | | | | | | 138,385 | | | | 5,684,856 | | | | | | - | | | | - | | | | | | | | | | | | | | | | 138,385 | | | | 5,684,856 | |
Zions Bancorporation | | | | | | | | | | | | | 42,640 | | | | 1,071,543 | | | | | | - | | | | - | | | | | | | | | | | | | | | | 42,640 | | | | 1,071,543 | |
Beverages | | | | | | | | | | | | | | | | | | | | | | | | | | | | | | | | | | | | | | | | | | | | | | | | |
Constellation Brands, Inc. | | | | | | | | | | | | | 23,696 | | | | 3,919,318 | | | | | | - | | | | - | | | | | | | | | | | | | | | | 23,696 | | | | 3,919,318 | |
Dr. Pepper Snapple Group, Inc. | | | | | | | | | | | | | 49,117 | | | | 4,746,176 | | | | | | - | | | | - | | | | | | | | | | | | | | | | 49,117 | | | | 4,746,176 | |
Molson Coors Brewing Co. | | | | | | | | | | | | | 22,200 | | | | 2,245,086 | | | | | | 53,400 | | | | 5,400,342 | | | | | | | | | | | | | | | | 75,600 | | | | 7,645,428 | |
Biotechnology | | | | | | | | | | | | | | | | | | | | | | | | | | | | | | | | | | | | | | | | | | | | | | | | |
United Therapeutics Corp. | | | | | | | | | | | | | 62,200 | | | | 6,588,224 | | | | | | 155,200 | | | | 16,438,784 | | | | | | | | | | | | | | | | 217,400 | | | | 23,027,008 | |
Building Products | | | | | | | | | | | | | | | | | | | | | | | | | | | | | | | | | | | | | | | | | | | | | | | | |
Fortune Brands Home & Security, Inc. | | | | | | | | | | | | | 68,721 | | | | 3,983,756 | | | | | | - | | | | - | | | | | | | | | | | | | | | | 68,721 | | | | 3,983,756 | |
Capital Markets | | | | | | | | | | | | | | | | | | | | | | | | | | | | | | | | | | | | | | | | | | | | | | | | |
Ameriprise Financial, Inc. | | | | | | | | | | | | | 25,710 | | | | 2,310,044 | | | | | | - | | | | - | | | | | | | | | | | | | | | | 25,710 | | | | 2,310,044 | |
Invesco, Ltd. | | | | | | | | | | | | | 111,062 | | | | 2,836,523 | | | | | | - | | | | - | | | | | | | | | | | | | | | | 111,062 | | | | 2,836,523 | |
Legg Mason, Inc. | | | | | | | | | | | | | 47,279 | | | | 1,394,258 | | | | | | - | | | | - | | | | | | | | | | | | | | | | 47,279 | | | | 1,394,258 | |
Northern Trust Corp. | | | | | | | | | | | | | 50,362 | | | | 3,336,986 | | | | | | - | | | | - | | | | | | | | | | | | | | | | 50,362 | | | | 3,336,986 | |
Raymond James Financial, Inc. | | | | | | | | | | | | | 47,960 | | | | 2,364,428 | | | | | | - | | | | - | | | | | | | | | | | | | | | | 47,960 | | | | 2,364,428 | |
T. Rowe Price Group, Inc. | | | | | | | | | | | | | 63,572 | | | | 4,638,849 | | | | | | - | | | | - | | | | | | | | | | | | | | | | 63,572 | | | | 4,638,849 | |
Chemicals | | | | | | | | | | | | | | | | | | | | | | | | | | | | | | | | | | | | | | | | | | | | | | | | |
Sherwin-Williams Co. | | | | | | | | | | | | | 9,318 | | | | 2,736,417 | | | | | | - | | | | - | | | | | | | | | | | | | | | | 9,318 | | | | 2,736,417 | |
Communications Equipment | | | | | | | | | | | | | | | | | | | | | | | | | | | | | | | | | | | | | | | | | | | | | | | | |
ARRIS International PLC | | | | | | | | | | | | | 328,900 | | | | 6,893,744 | | | | | | 696,900 | | | | 14,607,024 | | | | | | | | | | | | | | | | 1,025,800 | | | | 21,500,768 | |
CommScope Holding Co., Inc. | | | | | | | | | | | | | 101,341 | | | | 3,144,611 | | | | | | - | | | | - | | | | | | | | | | | | | | | | 101,341 | | | | 3,144,611 | |
EchoStar Corp. | | | | | | | | | | | | | 137,824 | | | | 5,471,613 | | | | | | 252,200 | | | | 10,012,340 | | | | | | | | | | | | | | | | 390,024 | | | | 15,483,953 | |
Consumer Finance | | | | | | | | | | | | | | | | | | | | | | | | | | | | | | | | | | | | | | | | | | | | | | | | |
Ally Financial, Inc. | | | | | | | | | | | | | 137,604 | | | | 2,348,900 | | | | | | - | | | | - | | | | | | | | | | | | | | | | 137,604 | | | | 2,348,900 | |
Containers & Packaging | | | | | | | | | | | | | | | | | | | | | | | | | | | | | | | | | | | | | | | | | | | | | | | | |
Ball Corp. | | | | | | | | | | | | | 90,771 | | | | 6,561,836 | | | | | | 73,024 | | | | 5,278,905 | | | | | | | | | | | | | | | | 163,795 | | | | 11,840,741 | |
Bemis Co., Inc. | | | | | | | | | | | | | 83,600 | | | | 4,304,564 | | | | | | 290,400 | | | | 14,952,696 | | | | | | | | | | | | | | | | 374,000 | | | | 19,257,260 | |
Rexam PLC | | | | | | | | | | | | | 138,488 | | | | 5,958,446 | | | | | | 246,266 | | | | 10,595,595 | | | | | | | | | | | | | | | | 384,754 | | | | 16,554,041 | |
Silgan Holdings, Inc. | | | | | | | | | | | | | 89,912 | | | | 4,626,871 | | | | | | - | | | | - | | | | | | | | | | | | | | | | 89,912 | | | | 4,626,871 | |
WestRock Co. | | | | | | | | | | | | | 123,508 | | | | 4,800,756 | | | | | | - | | | | - | | | | | | | | | | | | | | | | 123,508 | | | | 4,800,756 | |
Distributors | | | | | | | | | | | | | | | | | | | | | | | | | | | | | | | | | | | | | | | | | | | | | | | | |
Genuine Parts Co. | | | | | | | | | | | | | 45,542 | | | | 4,611,127 | | | | | | - | | | | - | | | | | | | | | | | | | | | | 45,542 | | | | 4,611,127 | |
Diversified Consumer Services | | | | | | | | | | | | | | | | | | | | | | | | | | | | | | | | | | | | | | | | | | | | | | | | |
H&R Block, Inc. | | | | | | | | | | | | | 236,000 | | | | 5,428,000 | | | | | | 555,100 | | | | 12,767,300 | | | | | | | | | | | | | | | | 791,100 | | | | 18,195,300 | |
Electric Utilities | | | | | | | | | | | | | | | | | | | | | | | | | | | | | | | | | | | | | | | | | | | | | | | | |
Alliant Energy Corp. | | | | | | | | | | | | | 278,400 | | | | 11,052,480 | | | | | | 697,400 | | | | 27,686,780 | | | | | | | | | | | | | | | | 975,800 | | | | 38,739,260 | |
Edison International | | | | | | | | | | | | | 75,363 | | | | 5,853,444 | | | | | | - | | | | - | | | | | | | | | | | | | | | | 75,363 | | | | 5,853,444 | |
FirstEnergy Corp. | | | | | | | | | | | | | 129,300 | | | | 4,513,863 | | | | | | 323,000 | | | | 11,275,930 | | | | | | | | | | | | | | | | 452,300 | | | | 15,789,793 | |
PPL Corp. | | | | | | | | | | | | | 309,400 | | | | 11,679,850 | | | | | | 773,450 | | | | 29,197,737 | | | | | | | | | | | | | | | | 1,082,850 | | | | 40,877,587 | |
Westar Energy, Inc. | | | | | | | | | | | | | 67,559 | | | | 3,789,385 | | | | | | - | | | | - | | | | | | | | | | | | | | | | 67,559 | | | | 3,789,385 | |
Xcel Energy, Inc. | | | | | | | | | | | | | 286,454 | | | | 12,827,410 | | | | | | 368,900 | | | | 16,519,342 | | | | | | | | | | | | | | | | 655,354 | | | | 29,346,752 | |
Electrical Equipment | | | | | | | | | | | | | | | | | | | | | | | | | | | | | | | | | | | | | | | | | | | | | | | | |
AMETEK, Inc. | | | | | | | | | | | | | 87,708 | | | | 4,054,741 | | | | | | - | | | | - | | | | | | | | | | | | | | | | 87,708 | | | | 4,054,741 | |
Hubbell, Inc. | | | | | | | | | | | | | 44,272 | | | | 4,669,368 | | | | | | - | | | | - | | | | | | | | | | | | | | | | 44,272 | | | | 4,669,368 | |
Regal Beloit Corp. | | | | | | | | | | | | | 64,906 | | | | 3,573,075 | | | | | | - | | | | - | | | | | | | | | | | | | | | | 64,906 | | | | 3,573,075 | |
Electronic Equipment, Instruments & Components | | | | | | | | | | | | | | | | | | | | | | | | | | | | | | | | | | | | | | | | | | | | | | | | |
Amphenol Corp. | | | | | | | | | | | | | 71,221 | | | | 4,083,100 | | | | | | - | | | | - | | | | | | | | | | | | | | | | 71,221 | | | | 4,083,100 | |
Arrow Electronics, Inc. | | | | | | | | | | | | | 98,611 | | | | 6,104,021 | | | | | | - | | | | - | | | | | | | | | | | | | | | | 98,611 | | | | 6,104,021 | |
Avnet, Inc. | | | | | | | | | | | | | 157,900 | | | | 6,396,529 | | | | | | 394,000 | | | | 15,960,940 | | | | | | | | | | | | | | | | 551,900 | | | | 22,357,469 | |
CDW Corp. | | | | | | | | | | | | | 32,731 | | | | 1,311,858 | | | | | | - | | | | - | | | | | | | | | | | | | | | | 32,731 | | | | 1,311,858 | |
Keysight Technologies, Inc. | | | | | | | | | | | | | 81,172 | | | | 2,361,294 | | | | | | - | | | | - | | | | | | | | | | | | | | | | 81,172 | | | | 2,361,294 | |
Energy Equipment & Services | | | | | | | | | | | | | | | | | | | | | | | | | | | | | | | | | | | | | | | | | | | | | | | | |
Nabors Industries, Ltd. | | | | | | | | | | | | | 195,600 | | | | 1,965,780 | | | | | | 1,168,463 | | | | 11,743,053 | | | | | | | | | | | | | | | | 1,364,063 | | | | 13,708,833 | |
Food & Staples Retailing | | | | | | | | | | | | | | | | | | | | | | | | | | | | | | | | | | | | | | | | | | | | | | | | |
Casey's General Stores, Inc. | | | | | | | | | | | | | 19,500 | | | | 2,564,445 | | | | | | 22,100 | | | | 2,906,371 | | | | | | | | | | | | | | | | 41,600 | | | | 5,470,816 | |
Kroger Co. | | | | | | | | | | | | | 152,435 | | | | 5,608,084 | | | | | | - | | | | - | | | | | | | | | | | | | | | | 152,435 | | | | 5,608,084 | |
Rite Aid Corp. | | | | | | | | | | | | | 142,559 | | | | 1,067,767 | | | | | | - | | | | - | | | | | | | | | | | | | | | | 142,559 | | | | 1,067,767 | |
Sysco Corp. | | | | | | | | | | | | | 62,100 | | | | 3,150,954 | | | | | | 304,100 | | | | 15,430,034 | | | | | | | | | | | | | | | | 366,200 | | | | 18,580,988 | |
Whole Foods Market, Inc. | | | | | | | | | | | | | 277,100 | | | | 8,872,742 | | | | | | 730,010 | | | | 23,374,920 | | | | | | | | | | | | | | | | 1,007,110 | | | | 32,247,662 | |
Food Products | | | | | | | | | | | | | | | | | | | | | | | | | | | | | | | | | | | | | | | | | | | | | | | | |
ConAgra Foods, Inc. | | | | | | | | | | | | | 95,600 | | | | 4,570,636 | | | | | | 271,100 | | | | 12,961,291 | | | | | | | | | | | | | | | | 366,700 | | | | 17,531,927 | |
Kellogg Co. | | | | | | | | | | | | | 83,300 | | | | 6,801,445 | | | | | | 207,300 | | | | 16,926,045 | | | | | | | | | | | | | | | | 290,600 | | | | 23,727,490 | |
TreeHouse Foods, Inc. | | | | | | | | | | | | | 17,000 | | | | 1,745,050 | | | | | | - | | | | - | | | | | | | | | | | | | | | | 17,000 | | | | 1,745,050 | |
Gas Utilities | | | | | | | | | | | | | | | | | | | | | | | | | | | | | | | | | | | | | | | | | | | | | | | | |
National Fuel Gas Co. | | | | | | | | | | | | | 71,630 | | | | 4,074,314 | | | | | | - | | | | - | | | | | | | | | | | | | | | | 71,630 | | | | 4,074,314 | |
Questar Corp. | | | | | | | | | | | | | 112,211 | | | | 2,846,793 | | | | | | - | | | | - | | | | | | | | | | | | | | | | 112,211 | | | | 2,846,793 | |
Health Care Equipment & Supplies | | | | | | | | | | | | | | | | | | | | | | | | | | | | | | | | | | | | | | | | | | | | | | | | |
DENTSPLY SIRONA, Inc. | | | | | | | | | | | | | 86,402 | | | | 5,360,380 | | | | | | 216,095 | | | | 13,406,534 | | | | | | | | | | | | | | | | 302,497 | | | | 18,766,914 | |
Health Care Providers & Services | | | | | | | | | | | | | | | | | | | | | | | | | | | | | | | | | | | | | | | | | | | | | | | | |
AmerisourceBergen Corp. | | | | | | | | | | | | | 53,347 | | | | 4,231,484 | | | | | | - | | | | - | | | | | | | | | | | | | | | | 53,347 | | | | 4,231,484 | |
Cardinal Health, Inc. | | | | | | | | | | | | | 112,200 | | | | 8,752,722 | | | | | | 279,400 | | | | 21,795,994 | | | | | | | | | | | | | | | | 391,600 | | | | 30,548,716 | |
Cigna Corp. | | | | | | | | | | | | | 22,083 | | | | 2,826,403 | | | | | | - | | | | - | | | | | | | | | | | | | | | | 22,083 | | | | 2,826,403 | |
Henry Schein, Inc. | | | | | | | | | | | | | 19,346 | | | | 3,420,373 | | | | | | - | | | | - | | | | | | | | | | | | | | | | 19,346 | | | | 3,420,373 | |
Humana, Inc. | | | | | | | | | | | | | 22,576 | | | | 4,060,971 | | | | | | - | | | | - | | | | | | | | | | | | | | | | 22,576 | | | | 4,060,971 | |
S-32
| | | | | | | | | | | | | | | | | | | | | | | | | | | | | | | | | | | | | | | | | | | | | | | | |
| | | | | | | | | | | TPP Master | | | | | TAF Destination | | | | | Adjustments | | | | | Combined Pro Forma Destination | |
| | | Coupon
Rate | | | Maturity Date | | | | | Shares | | | Value | | | | | Shares | | | Value | | | | | Shares | | | Value | | | | | Shares | | | Value | |
| | | | | | | | | | | | | | | | | | | | | | | | | | | | | | | | |
Laboratory Corp. of America Holdings | | | | | | | | | | | | | 83,200 | | | $ | 10,838,464 | | | | | | 219,300 | | | $ | 28,568,211 | | | | | | | | | | | | | | | | 302,500 | | | $ | 39,406,675 | |
MEDNAX, Inc. | | | | | | | | | | | | | 87,500 | | | | 6,337,625 | | | | | | 240,600 | | | | 17,426,658 | | | | | | | | | | | | | | | | 328,100 | | | | 23,764,283 | |
Universal Health Services, Inc. | | | | | | | | | | | | | 23,117 | | | | 3,099,990 | | | | | | - | | | | - | | | | | | | | | | | | | | | | 23,117 | | | | 3,099,990 | |
Hotels, Restaurants & Leisure | | | | | | | | | | | | | | | | | | | | | | | | | | | | | | | | | | | | | | | | | | | | | | | | |
Aramark | | | | | | | | | | | | | 125,900 | | | | 4,207,578 | | | | | | 313,900 | | | | 10,490,538 | | | | | | | | | | | | | | | | 439,800 | | | | 14,698,116 | |
Hilton Worldwide Holdings, Inc. | | | | | | | | | | | | | 182,036 | | | | 4,101,271 | | | | | | - | | | | - | | | | | | | | | | | | | | | | 182,036 | | | | 4,101,271 | |
Marriott International, Inc. | | | | | | | | | | | | | 40,786 | | | | 2,710,638 | | | | | | - | | | | - | | | | | | | | | | | | | | | | 40,786 | | | | 2,710,638 | |
Household Durables | | | | | | | | | | | | | | | | | | | | | | | | | | | | | | | | | | | | | | | | | | | | | | | | |
Mohawk Industries, Inc. | | | | | | | | | | | | | 38,864 | | | | 7,374,833 | | | | | | - | | | | - | | | | | | | | | | | | | | | | 38,864 | | | | 7,374,833 | |
Newell Brands, Inc. | | | | | | | | | | | | | 114,927 | | | | 5,582,004 | | | | | | - | | | | - | | | | | | | | | | | | | | | | 114,927 | | | | 5,582,004 | |
Household Products | | | | | | | | | | | | | | | | | | | | | | | | | | | | | | | | | | | | | | | | | | | | | | | | |
Energizer Holdings, Inc. | | | | | | | | | | | | | 41,126 | | | | 2,117,578 | | | | | | - | | | | - | | | | | | | | | | | | | | | | 41,126 | | | | 2,117,578 | |
Industrial Conglomerates | | | | | | | | | | | | | | | | | | | | | | | | | | | | | | | | | | | | | | | | | | | | | | | | |
Carlisle Cos., Inc. | | | | | | | | | | | | | 50,491 | | | | 5,335,889 | | | | | | - | | | | - | | | | | | | | | | | | | | | | 50,491 | | | | 5,335,889 | |
Insurance | | | | | | | | | | | | | | | | | | | | | | | | | | | | | | | | | | | | | | | | | | | | | | | | |
Alleghany Corp. | | | | | | | | | | | | | 21,425 | | | | 11,774,751 | | | | | | 41,700 | | | | 22,917,486 | | | | | | | | | | | | | | | | 63,125 | | | | 34,692,237 | |
Allstate Corp. | | | | | | | | | | | | | 153,000 | | | | 10,702,350 | | | | | | 345,600 | | | | 24,174,720 | | | | | | | | | | | | | | | | 498,600 | | | | 34,877,070 | |
Assured Guaranty, Ltd. | | | | | | | | | | | | | 165,700 | | | | 4,203,809 | | | | | | 437,200 | | | | 11,091,764 | | | | | | | | | | | | | | | | 602,900 | | | | 15,295,573 | |
Brown & Brown, Inc. | | | | | | | | | | | | | 92,300 | | | | 3,458,481 | | | | | | 148,000 | | | | 5,545,560 | | | | | | | | | | | | | | | | 240,300 | | | | 9,004,041 | |
Chubb, Ltd. | | | | | | | | | | | | | 16,713 | | | | 2,184,556 | | | | | | - | | | | - | | | | | | | | | | | | | | | | 16,713 | | | | 2,184,556 | |
Fairfax Financial Holdings, Ltd. | | | | | | | | | | | | | 15,500 | | | | 8,354,810 | | | | | | 30,300 | | | | 16,332,306 | | | | | | | | | | | | | | | | 45,800 | | | | 24,687,116 | |
FNF Group | | | | | | | | | | | | | 280,600 | | | | 10,522,500 | | | | | | 527,724 | | | | 19,789,650 | | | | | | | | | | | | | | | | 808,324 | | | | 30,312,150 | |
Hartford Financial Services Group, Inc. | | | | | | | | | | | | | 109,642 | | | | 4,865,912 | | | | | | - | | | | - | | | | | | | | | | | | | | | | 109,642 | | | | 4,865,912 | |
Loews Corp. | | | | | | | | | | | | | 409,631 | | | | 16,831,738 | | | | | | 533,400 | | | | 21,917,406 | | | | | | | | | | | | | | | | 943,031 | | | | 38,749,144 | |
Marsh & McLennan Cos., Inc. | | | | | | | | | | | | | 86,905 | | | | 5,949,516 | | | | | | - | | | | - | | | | | | | | | | | | | | | | 86,905 | | | | 5,949,516 | |
Progressive Corp. | | | | | | | | | | | | | 344,395 | | | | 11,537,232 | | | | | | 720,600 | | | | 24,140,100 | | | | | | | | | | | | | | | | 1,064,995 | | | | 35,677,332 | |
Unum Group | | | | | | | | | | | | | 111,290 | | | | 3,537,909 | | | | | | - | | | | - | | | | | | | | | | | | | | | | 111,290 | | | | 3,537,909 | |
Willis Towers Watson PLC | | | | | | | | | | | | | 64,747 | | | | 8,048,700 | | | | | | 204,819 | | | | 25,461,050 | | | | | | | | | | | | | | | | 269,566 | | | | 33,509,750 | |
WR Berkley Corp. | | | | | | | | | | | | | 25,813 | | | | 1,546,715 | | | | | | - | | | | - | | | | | | | | | | | | | | | | 25,813 | | | | 1,546,715 | |
XL Group PLC | | | | | | | | | | | | | 125,876 | | | | 4,192,930 | | | | | | - | | | | - | | | | | | | | | | | | | | | | 125,876 | | | | 4,192,930 | |
Internet & Catalog Retail | | | | | | | | | | | | | | | | | | | | | | | | | | | | | | | | | | | | | | | | | | | | | | | | |
Expedia, Inc. | | | | | | | | | | | | | 48,040 | | | | 5,106,652 | | | | | | - | | | | - | | | | | | | | | | | | | | | | 48,040 | | | | 5,106,652 | |
Liberty Ventures | | | | | | | | | | | | | 234,900 | | | | 8,707,743 | | | | | | 587,400 | | | | 21,774,918 | | | | | | | | | | | | | | | | 822,300 | | | | 30,482,661 | |
Internet Software & Services | | | | | | | | | | | | | | | | | | | | | | | | | | | | | | | | | | | | | | | | | | | | | | | | |
Match Group, Inc. | | | | | | | | | | | | | 90,622 | | | | 1,366,127 | | | | | | - | | | | - | | | | | | | | | | | | | | | | 90,622 | | | | 1,366,127 | |
IT Services | | | | | | | | | | | | | | | | | | | | | | | | | | | | | | | | | | | | | | | | | | | | | | | | |
Amdocs, Ltd. | | | | | | | | | | | | | 108,500 | | | | 6,262,620 | | | | | | 243,400 | | | | 14,049,048 | | | | | | | | | | | | | | | | 351,900 | | | | 20,311,668 | |
Jack Henry & Associates, Inc. | | | | | | | | | | | | | 58,393 | | | | 5,095,957 | | | | | | - | | | | - | | | | | | | | | | | | | | | | 58,393 | | | | 5,095,957 | |
Western Union Co. | | | | | | | | | | | | | 263,800 | | | | 5,059,684 | | | | | | 637,000 | | | | 12,217,660 | | | | | | | | | | | | | | | | 900,800 | | | | 17,277,344 | |
Life Sciences Tools & Services | | | | | | | | | | | | | | | | | | | | | | | | | | | | | | | | | | | | | | | | | | | | | | | | |
Bio-Rad Laboratories, Inc. | | | | | | | | | | | | | 45,444 | | | | 6,499,401 | | | | | | 86,600 | | | | 12,385,532 | | | | | | | | | | | | | | | | 132,044 | | | | 18,884,933 | |
Machinery | | | | | | | | | | | | | | | | | | | | | | | | | | | | | | | | | | | | | | | | | | | | | | | | |
IDEX Corp. | | | | | | | | | | | | | 49,418 | | | | 4,057,218 | | | | | | - | | | | - | | | | | | | | | | | | | | | | 49,418 | | | | 4,057,218 | |
Rexnord Corp. | | | | | | | | | | | | | 120,601 | | | | 2,367,397 | | | | | | - | | | | - | | | | | | | | | | | | | | | | 120,601 | | | | 2,367,397 | |
Snap-on, Inc. | | | | | | | | | | | | | 25,262 | | | | 3,986,849 | | | | | | - | | | | - | | | | | | | | | | | | | | | | 25,262 | | | | 3,986,849 | |
Media | | | | | | | | | | | | | | | | | | | | | | | | | | | | | | | | | | | | | | | | | | | | | | | | |
AMC Networks, Inc. | | | | | | | | | | | | | 71,200 | | | | 4,301,904 | | | | | | 177,300 | | | | 10,712,466 | | | | | | | | | | | | | | | | 248,500 | | | | 15,014,370 | |
CBS Corp. | | | | | | | | | | | | | 49,901 | | | | 2,716,611 | | | | | | - | | | | - | | | | | | | | | | | | | | | | 49,901 | | | | 2,716,611 | |
Discovery Communications, Inc. | | | | | | | | | | | | | 314,900 | | | | 7,510,365 | | | | | | 794,100 | | | | 18,939,285 | | | | | | | | | | | | | | | | 1,109,000 | | | | 26,449,650 | |
DISH Network Corp. | | | | | | | | | | | | | 74,155 | | | | 3,885,722 | | | | | | - | | | | - | | | | | | | | | | | | | | | | 74,155 | | | | 3,885,722 | |
Liberty Braves Group | | | | | | | | | | | | | 58,455 | | | | 856,950 | | | | | | 142,623 | | | | 2,090,853 | | | | | | | | | | | | | | | | 201,078 | | | | 2,947,803 | |
Liberty Media Group | | | | | | | | | | | | | 116,900 | | | | 2,217,593 | | | | | | 290,150 | | | | 5,504,146 | | | | | | | | | | | | | | | | 407,050 | | | | 7,721,739 | |
Liberty SiriusXM Group | | | | | | | | | | | | | 213,200 | | | | 6,581,484 | | | | | | 564,600 | | | | 17,429,202 | | | | | | | | | | | | | | | | 777,800 | | | | 24,010,686 | |
Madison Square Garden Co. | | | | | | | | | | | | | 51,933 | | | | 8,958,962 | | | | | | 118,666 | | | | 20,471,071 | | | | | | | | | | | | | | | | 170,599 | | | | 29,430,033 | |
MSG Networks, Inc. | | | | | | | | | | | | | 328,600 | | | | 5,040,724 | | | | | | 491,400 | | | | 7,538,076 | | | | | | | | | | | | | | | | 820,000 | | | | 12,578,800 | |
News Corp. | | | | | | | | | | | | | 274,800 | | | | 3,118,980 | | | | | | 221,200 | | | | 2,510,620 | | | | | | | | | | | | | | | | 496,000 | | | | 5,629,600 | |
News Corp. | | | | | | | | | | | | | 479,500 | | | | 5,595,765 | | | | | | 1,151,400 | | | | 13,436,838 | | | | | | | | | | | | | | | | 1,630,900 | | | | 19,032,603 | |
TEGNA, Inc. | | | | | | | | | | | | | 122,361 | | | | 2,835,104 | | | | | | - | | | | - | | | | | | | | | | | | | | | | 122,361 | | | | 2,835,104 | |
Time, Inc. | | | | | | | | | | | | | 66,565 | | | | 1,095,660 | | | | | | - | | | | - | | | | | | | | | | | | | | | | 66,565 | | | | 1,095,660 | |
Multiline Retail | | | | | | | | | | | | | | | | | | | | | | | | | | | | | | | | | | | | | | | | | | | | | | | | |
Kohl's Corp. | | | | | | | | | | | | | 124,626 | | | | 4,725,818 | | | | | | - | | | | - | | | | | | | | | | | | | | | | 124,626 | | | | 4,725,818 | |
Nordstrom, Inc. | | | | | | | | | | | | | 63,339 | | | | 2,410,049 | | | | | | - | | | | - | | | | | | | | | | | | | | | | 63,339 | | | | 2,410,049 | |
Multi-Utilities | | | | | | | | | | | | | | | | | | | | | | | | | | | | | | | | | | | | | | | | | | | | | | | | |
CenterPoint Energy, Inc. | | | | | | | | | | | | | 234,907 | | | | 5,637,768 | | | | | | - | | | | - | | | | | | | | | | | | | | | | 234,907 | | | | 5,637,768 | |
CMS Energy Corp. | | | | | | | | | | | | | 267,126 | | | | 12,250,398 | | | | | | 458,700 | | | | 21,035,982 | | | | | | | | | | | | | | | | 725,826 | | | | 33,286,380 | |
SCANA Corp. | | | | | | | | | | | | | 76,200 | | | | 5,765,292 | | | | | | 187,900 | | | | 14,216,514 | | | | | | | | | | | | | | | | 264,100 | | | | 19,981,806 | |
Sempra Energy | | | | | | | | | | | | | 48,060 | | | | 5,479,801 | | | | | | - | | | | - | | | | | | | | | | | | | | | | 48,060 | | | | 5,479,801 | |
WEC Energy Group, Inc. | | | | | | | | | | | | | 197,912 | | | | 12,923,654 | | | | | | 261,400 | | | | 17,069,420 | | | | | | | | | | | | | | | | 459,312 | | | | 29,993,074 | |
Oil, Gas & Consumable Fuels | | | | | | | | | | | | | | | | | | | | | | | | | | | | | | | | | | | | | | | | | | | | | | | | |
Columbia Pipeline Group, Inc. | | | | | | | | | | | | | 251,918 | | | | 6,421,390 | | | | | | - | | | | - | | | | | | | | | | | | | | | | 251,918 | | | | 6,421,390 | |
Energen Corp. | | | | | | | | | | | | | 171,482 | | | | 8,267,147 | | | | | | - | | | | - | | | | | | | | | | | | | | | | 171,482 | | | | 8,267,147 | |
EQT Corp. | | | | | | | | | | | | | 110,938 | | | | 8,589,929 | | | | | | - | | | | - | | | | | | | | | | | | | | | | 110,938 | | | | 8,589,929 | |
Marathon Petroleum Corp. | | | | | | | | | | | | | 190,400 | | | | 7,227,584 | | | | | | 473,900 | | | | 17,989,244 | | | | | | | | | | | | | | | | 664,300 | | | | 25,216,828 | |
PBF Energy, Inc. | | | | | | | | | | | | | 86,963 | | | | 2,067,980 | | | | | | - | | | | - | | | | | | | | | | | | | | | | 86,963 | | | | 2,067,980 | |
Southwestern Energy Co. | | | | | | | | | | | | | 187,239 | | | | 2,355,467 | | | | | | - | | | | - | | | | | | | | | | | | | | | | 187,239 | | | | 2,355,467 | |
Personal Products | | | | | | | | | | | | | | | | | | | | | | | | | | | | | | | | | | | | | | | | | | | | | | | | |
Edgewell Personal Care Co. | | | | | | | | | | | | | 43,386 | | | | 3,662,212 | | | | | | - | | | | - | | | | | | | | | | | | | | | | 43,386 | | | | 3,662,212 | |
Professional Services | | | | | | | | | | | | | | | | | | | | | | | | | | | | | | | | | | | | | | | | | | | | | | | | |
Equifax, Inc. | | | | | | | | | | | | | 13,138 | | | | 1,686,919 | | | | | | - | | | | - | | | | | | | | | | | | | | | | 13,138 | | | | 1,686,919 | |
Real Estate Investment Trusts | | | | | | | | | | | | | | | | | | | | | | | | | | | | | | | | | | | | | | | | | | | | | | | | |
American Campus Communities, Inc. | | | | | | | | | | | | | 54,268 | | | | 2,869,149 | | | | | | - | | | | - | | | | | | | | | | | | | | | | 54,268 | | | | 2,869,149 | |
American Homes 4 Rent | | | | | | | | | | | | | 110,161 | | | | 2,256,097 | | | | | | - | | | | - | | | | | | | | | | | | | | | | 110,161 | | | | 2,256,097 | |
Annaly Capital Management, Inc. | | | | | | | | | | | | | 1,263,000 | | | | 13,981,410 | | | | | | 3,156,900 | | | | 34,946,883 | | | | | | | | | | | | | | | | 4,419,900 | | | | 48,928,293 | |
AvalonBay Communities, Inc. | | | | | | | | | | | | | 22,981 | | | | 4,145,543 | | | | | | - | | | | - | | | | | | | | | | | | | | | | 22,981 | | | | 4,145,543 | |
Boston Properties, Inc. | | | | | | | | | | | | | 30,528 | | | | 4,026,643 | | | | | | - | | | | - | | | | | | | | | | | | | | | | 30,528 | | | | 4,026,643 | |
Brixmor Property Group, Inc. | | | | | | | | | | | | | 133,445 | | | | 3,530,955 | | | | | | - | | | | - | | | | | | | | | | | | | | | | 133,445 | | | | 3,530,955 | |
Crown Castle International Corp. | | | | | | | | | | | | | 55,300 | | | | 5,609,079 | | | | | | 146,000 | | | | 14,808,780 | | | | | | | | | | | | | | | | 201,300 | | | | 20,417,859 | |
Essex Property Trust, Inc. | | | | | | | | | | | | | 9,257 | | | | 2,111,429 | | | | | | - | | | | - | | | | | | | | | | | | | | | | 9,257 | | | | 2,111,429 | |
General Growth Properties, Inc. | | | | | | | | | | | | | 73,017 | | | | 2,177,367 | | | | | | - | | | | - | | | | | | | | | | | | | | | | 73,017 | | | | 2,177,367 | |
HCP, Inc. | | | | | | | | | | | | | 45,775 | | | | 1,619,520 | | | | | | - | | | | - | | | | | | | | | | | | | | | | 45,775 | | | | 1,619,520 | |
Kimco Realty Corp. | | | | | | | | | | | | | 143,999 | | | | 4,518,689 | | | | | | - | | | | - | | | | | | | | | | | | | | | | 143,999 | | | | 4,518,689 | |
Outfront Media, Inc. | | | | | | | | | | | | | 107,858 | | | | 2,606,928 | | | | | | - | | | | - | | | | | | | | | | | | | | | | 107,858 | | | | 2,606,928 | |
Rayonier, Inc. | | | | | | | | | | | | | 100,031 | | | | 2,624,813 | | | | | | - | | | | - | | | | | | | | | | | | | | | | 100,031 | | | | 2,624,813 | |
Regency Centers Corp. | | | | | | | | | | | | | 35,450 | | | | 2,968,228 | | | | | | - | | | | - | | | | | | | | | | | | | | | | 35,450 | | | | 2,968,228 | |
Vornado Realty Trust | | | | | | | | | | | | | 45,384 | | | | 4,543,846 | | | | | | - | | | | - | | | | | | | | | | | | | | | | 45,384 | | | | 4,543,846 | |
S-33
| | | | | | | | | | | | | | | | | | | | | | | | | | | | | | | | | | | | | | | | | | | | | | | | |
| | | | | | | | | | | TPP Master | | | | | TAF Destination | | | | | Adjustments | | | | | Combined Pro Forma Destination | |
| | | Coupon
Rate | | | Maturity Date | | | | | Shares | | | Value | | | | | Shares | | | Value | | | | | Shares | | | Value | | | | | Shares | | | Value | |
| | | | | | | | | | | | | | | | | | | | | | | | | | | | | | | | |
Weyerhaeuser Co. | | | | | | | | | | | | | 97,125 | | | $ | 2,891,411 | | | | | | - | | | $ | - | | | | | | | | | | | | | | | | 97,125 | | | $ | 2,891,411 | |
WP Carey, Inc. | | | | | | | | | | | | | 19,249 | | | | 1,336,266 | | | | | | - | | | | - | | | | | | | | | | | | | | | | 19,249 | | | | 1,336,266 | |
Semiconductors & Semiconductor Equipment | | | | | | | | | | | | | | | | | | | | | | | | | | | | | | | | | | | | | | | | | | | | | | | | |
Analog Devices, Inc. | | | | | | | | | | | | | 66,741 | | | | 3,780,210 | | | | | | - | | | | - | | | | | | | | | | | | | | | | 66,741 | | | | 3,780,210 | |
KLA-Tencor Corp. | | | | | | | | | | | | | 75,305 | | | | 5,516,092 | | | | | | - | | | | - | | | | | | | | | | | | | | | | 75,305 | | | | 5,516,092 | |
Lam Research Corp. | | | | | | | | | | | | | 38,700 | | | | 3,253,122 | | | | | | 104,700 | | | | 8,801,082 | | | | | | | | | | | | | | | | 143,400 | | | | 12,054,204 | |
Micron Technology, Inc. | | | | | | | | | | | | | 352,000 | | | | 4,843,520 | | | | | | 1,178,000 | | | | 16,209,280 | | | | | | | | | | | | | | | | 1,530,000 | | | | 21,052,800 | |
Xilinx, Inc. | | | | | | | | | | | | | 30,878 | | | | 1,424,402 | | | | | | - | | | | - | | | | | | | | | | | | | | | | 30,878 | | | | 1,424,402 | |
Software | | | | | | | | | | | | | | | | | | | | | | | | | | | | | | | | | | | | | | | | | | | | | | | | |
CA, Inc. | | | | | | | | | | | | | 198,100 | | | | 6,503,623 | | | | | | 483,400 | | | | 15,870,022 | | | | | | | | | | | | | | | | 681,500 | | | | 22,373,645 | |
Citrix Systems, Inc. | | | | | | | | | | | | | 37,500 | | | | 3,003,375 | | | | | | 119,800 | | | | 9,594,782 | | | | | | | | | | | | | | | | 157,300 | | | | 12,598,157 | |
Synopsys, Inc. | | | | | | | | | | | | | 241,642 | | | | 13,067,999 | | | | | | 309,200 | | | | 16,721,536 | | | | | | | | | | | | | | | | 550,842 | | | | 29,789,535 | |
Specialty Retail | | | | | | | | | | | | | | | | | | | | | | | | | | | | | | | | | | | | | | | | | | | | | | | | |
AutoZone, Inc. | | | | | | | | | | | | | 5,796 | | | | 4,601,097 | | | | | | - | | | | - | | | | | | | | | | | | | | | | 5,796 | | | | 4,601,097 | |
Bed Bath & Beyond, Inc. | | | | | | | | | | | | | 226,025 | | | | 9,768,800 | | | | | | 364,400 | | | | 15,749,368 | | | | | | | | | | | | | | | | 590,425 | | | | 25,518,168 | |
Best Buy Co., Inc. | | | | | | | | | | | | | 122,932 | | | | 3,761,719 | | | | | | - | | | | - | | | | | | | | | | | | | | | | 122,932 | | | | 3,761,719 | |
Gap, Inc. | | | | | | | | | | | | | 163,999 | | | | 3,480,059 | | | | | | - | | | | - | | | | | | | | | | | | | | | | 163,999 | | | | 3,480,059 | |
Tiffany & Co. | | | | | | | | | | | | | 53,081 | | | | 3,218,832 | | | | | | - | | | | - | | | | | | | | | | | | | | | | 53,081 | | | | 3,218,832 | |
Technology Hardware, Storage & Peripherals | | | | | | | | | | | | | | | | | | | | | | | | | | | | | | | | | | | | | | | | | | | | | | | | |
NetApp, Inc. | | | | | | | | | | | | | 316,912 | | | | 7,792,866 | | | | | | 702,500 | | | | 17,274,475 | | | | | | | | | | | | | | | | 1,019,412 | | | | 25,067,341 | |
Western Digital Corp. | | | | | | | | | | | | | 109,950 | | | | 5,196,237 | | | | | | 274,700 | | | | 12,982,322 | | | | | | | | | | | | | | | | 384,650 | | | | 18,178,559 | |
Textiles, Apparel & Luxury Goods | | | | | | | | | | | | | | | | | | | | | | | | | | | | | | | | | | | | | | | | | | | | | | | | |
Fossil Group, Inc. | | | | | | | | | | | | | 148,900 | | | | 4,248,117 | | | | | | 336,000 | | | | 9,586,080 | | | | | | | | | | | | | | | | 484,900 | | | | 13,834,197 | |
Michael Kors Holdings, Ltd. | | | | | | | | | | | | | 85,600 | | | | 4,235,488 | | | | | | 245,300 | | | | 12,137,444 | | | | | | | | | | | | | | | | 330,900 | | | | 16,372,932 | |
PVH Corp. | | | | | | | | | | | | | 40,599 | | | | 3,825,644 | | | | | | - | | | | - | | | | | | | | | | | | | | | | 40,599 | | | | 3,825,644 | |
VF Corp. | | | | | | | | | | | | | 28,318 | | | | 1,741,274 | | | | | | - | | | | - | | | | | | | | | | | | | | | | 28,318 | | | | 1,741,274 | |
Thrifts & Mortgage Finance | | | | | | | | | | | | | | | | | | | | | | | | | | | | | | | | | | | | | | | | | | | | | | | | |
Ocwen Financial Corp. | | | | | | | | | | | | | 495,051 | | | | 846,537 | | | | | | 1,204,000 | | | | 2,058,840 | | | | | | | | | | | | | | | | 1,699,051 | | | | 2,905,377 | |
Trading Companies & Distributors | | | | | | | | | | | | | | | | | | | | | | | | | | | | | | | | | | | | | | | | | | | | | | | | |
MSC Industrial Direct Co., Inc. | | | | | | | | | | | | | 54,835 | | | | 3,869,158 | | | | | | - | | | | - | | | | | | | | | | | | | | | | 54,835 | | | | 3,869,158 | |
| | | | | | | | | | | | | | | | | | | | | | | | | | | | | | | | | | | | |
Total Common Stocks | | | | | | | | | | | | | | | | | 811,425,379 | | | | | | | | | | 1,013,319,801 | | | | | | | | | | | | | | | | | | | | 1,824,745,180 | |
| | | | | | | | | | | | | | | | | | | | | | | | | | | | | | | | | | | | |
| | | | | | | | | | | | | | | | | Total Cost ($705,951,099) | | | | | | | | | | Total Cost ($943,177,508) | | | | | | | | | | | | | | | | | | | | Total Cost ($1,649,128,607) | |
Securities Lending Collateral - 11.0 % | | | | | | | | | | | | | | | | | | | | | | | | | | | | | | | | | | | | | | | | | | | | | | | | |
State Street Navigator Securities Lending Trust - Prime Portfolio | | | 0.51 | % | | | | | | | | | 101,585,922 | | | | 101,585,922 | | | | | | 110,222,008 | | | | 110,222,008 | | | | | | | | | | | | | | | | 211,807,930 | | | | 211,807,930 | |
| | | | | | | | | | | | | | | | | | | | | | | | | | | | | | | | | | | | |
Total Securities Lending Collateral | | | | | | | | | | | | | | | | | 101,585,922 | | | | | | | | | | 110,222,008 | | | | | | | | | | | | | | | | | | | | 211,807,930 | |
| | | | | | | | | | | | | | | | | | | | | | | | | | | | | | | | | | | | |
| | | | | | | | | | | | | | | | | Total Cost ($101,585,922) | | | | | | | | | | Total Cost ($110,222,008) | | | | | | | | | | | | | | | | | | | | Total Cost ($211,807,930) | |
| | | | | | | | | | | | | | |
| | | | | | | | | | | Principal | | | Value | | | | | Principal | | | Value | | | | | Principal | | | Value | | | | | Principal | | | Value | |
| | | | | | | | | | | | | | | | | | | | | | | | | | | | | | | | | | | | |
Repurchase Agreement - 4.9 % | | | | | | | | | | | | | | | | | | | | | | | | | | | | | | | | | | | | | | | | | | | | | | | | |
State Street Bank & Trust Co. | | | 0.03 | % | | | 07/01/2016 | | | | | $ | 30,157,614 | | | | 30,157,614 | | | | | $ | 64,621,092 | | | | 64,621,092 | | | | | | | | | | | | | | | $ | 94,778,706 | | | | 94,778,706 | |
| | | | | | | | | | | | | | | | | | | | | | | | | | | | | | | | | | | | |
Total Repurchase Agreement | | | | | | | | | | | | | | | | | 30,157,614 | | | | | | | | | | 64,621,092 | | | | | | | | | | | | | | | | | | | | 94,778,706 | |
| | | | | | | | | | | | | | | | | | | | | | | | | | | | | | | | | | | | |
| | | | | | | | | | | | | | | | | Total Cost ($30,157,614) | | | | | | | | | | Total Cost ($64,621,092) | | | | | | | | | | | | | | | | | | | | Total Cost ($94,778,706) | |
| | | | | | | | | | | |
| | | | | | | | | | | | | | | | | | | | | | | | | | | | | | | | | | | | |
Total Investments | | | | | | | | | | | | | | | | | 943,168,915 | | | | | | | | | | 1,188,162,901 | | | | | | | | | | | | | | | | | | | | 2,131,331,816 | |
| | | | | | | | | | | | | | | | | | | | | | | | | | | | | | | | | | | | |
| | | | | | | | | | | | | | | | | Total Cost ($837,694,635) | | | | | | | | | | Total Cost ($1,118,020,608) | | | | | | | | | | | | | | | | | | | | Total Cost ($1,955,715,243) | |
| | | | | | | | | | | | | | |
Other Assets and Liabilities - (11.0)% | | | | | | | | | | | | | | | | | (99,078,222 | ) | | | | | | | | | (106,157,628 | ) | | | | | | | | | (6,890,511 | ) (a)(c) | | | | | | | | | (212,126,361 | ) |
| | | | | | | | | | | | | | | | | | | | | | | | | | | | | | | | | | | | | | | | | | | | | | | | |
Net Assets | | | | | | | | | | | | | | | | | $844,090,693 | | | | | | | | | | $1,082,005,273 | | | | | | | | | | ($6,890,511 | ) | | | | | | | | | $1,919,205,455 | |
| | | | | | | | | | | | | | | | | | | | | | | | | | | | | | | | | | | | | | | | | | | | | | | | |
VALUATION SUMMARY:
| | | | | | | | | | | | | | | | | | | | | | | | | | | | | | | | | | | | | | | | | | | | | | | | | | | | | | | | |
| Investments | | Level 1 - Unadjusted
Quoted Prices | | | Level 2 - Other Significant Observable Inputs | | | Level 3 - Significant Unobservable Inputs | | | Value | | | | | | Level 1 - Unadjusted
Quoted Prices | | | Level 2 - Other Significant Observable Inputs | | | Level 3 - Significant Unobservable Inputs | | | Value | | | | | | Level 1 - Unadjusted
Quoted Prices | | | Level 2 - Other Significant Observable Inputs | | | Level 3 - Significant Unobservable Inputs | | | Value | |
Common Stocks | | $ | 811,425,379 | | | $ | - | | | $ | - | | | $ | 811,425,379 | | | | | | | $ | 1,013,319,801 | | | $ | - | | | $ | - | | | $ | 1,013,319,801 | | | | | | | $ | 1,824,745,180 | | | $ | - | | | $ | - | | | $ | 1,824,745,180 | |
Securities Lending Collateral | | | 101,585,922 | | | | - | | | | - | | | | 101,585,922 | | | | | | | | 110,222,008 | | | | - | | | | - | | | | 110,222,008 | | | | | | | | 211,807,930 | | | | - | | | | - | | | | 211,807,930 | |
Repurchase Agreement | | | - | | | | 30,157,614 | | | | - | | | | 30,157,614 | | | | | | | | - | | | | 64,621,092 | | | | - | | | | 64,621,092 | | | | | | | | - | | | | 94,778,706 | | | | - | | | | 94,778,706 | |
Total Investments | | $ | 913,011,301 | | | $ | 30,157,614 | | | $ | - | | | $ | 943,168,915 | | | | | | | $ | 1,123,541,809 | | | $ | 64,621,092 | | | $ | - | | | $ | 1,188,162,901 | | | | | | | $ | 2,036,553,110 | | | $ | 94,778,706 | | | $ | - | | | $ | 2,131,331,816 | |
(a)-(l) See Note 2 of the Notes to the Pro Forma Financial Statements.
As of June 30, 2016, all securities held by the Target Master Portfolio would comply with the investment restrictions of the Destination Fund.
S-34
Reorganization Between TPP Master, TPFG Feeder, TPFG II Feeder and TAF Destination
PRO FORMA STATEMENT OF ASSETS AND LIABILITIES
At June 30, 2016
| | | | | | | | | | | | | | | | | | | | | | | | | | | | | | | | | | |
| | | | | TPP Master | | | | | | TPFG Feeder | | | | | | TPFG II Feeder | | | | | | TAF Destination | | | | | | Adjustments | | | | | | Combined Pro Forma
Destination |
Assets: | | | | | | | | | | | | | | | | | | | | | | | | | | | | | | | | | | |
Investments, at value | | $ | | 913,011,301 | | | | $ | | - | | | | $ | | - | | | | $ | | 1,123,541,809 | | | | $ | | - | | | | $ | | 2,036,553,110 |
Repurchase agreements, at value | | | | 30,157,614 | | | | | | - | | | | | | - | | | | | | 64,621,092 | | | | | | - | | | | | | 94,778,706 |
Investments in Series Portfolio, at value | | | | - | | | | | | 129,093,124 | | | | | | 434,614,479 | | | | | | - | | | | | | (563,707,603) | | (b) | | | | - |
Cash | | | | 201 | | | | | | - | | | | | | - | | | | | | - | | | | | | - | | | | | | 201 |
Cash on deposit with broker | | | | - | | | | | | - | | | | | | - | | | | | | - | | | | | | - | | | | | | - |
Foreign currency, at value | | | | - | | | | | | - | | | | | | - | | | | | | - | | | | | | - | | | | | | - |
Receivables: | | | | - | | | | | | - | | | | | | - | | | | | | - | | | | | | | | | | | | |
Shares of beneficial interest sold | | | | - | | | | | | - | | | | | | - | | | | | | 2,129,379 | | | | | | - | | | | | | 2,129,379 |
Investments sold | | | | 3,744,816 | | | | | | - | | | | | | - | | | | | | 347,221 | | | | | | - | | | | | | 4,092,037 |
When-issued, delay-delivery, and forward commitment securities sold | | | | - | | | | | | - | | | | | | - | | | | | | - | | | | | | - | | | | | | - |
Interest | | | | 25 | | | | | | - | | | | | | - | | | | | | 54 | | | | | | - | | | | | | 79 |
Dividends | | | | 1,508,934 | | | | | | - | | | | | | - | | | | | | 2,483,713 | | | | | | - | | | | | | 3,992,647 |
Tax reclaims | | | | - | | | | | | - | | | | | | - | | | | | | - | | | | | | - | | | | | | - |
Net income from securities lending | | | | 42,692 | | | | | | - | | | | | | - | | | | | | 19,716 | | | | | | - | | | | | | 62,408 |
Due from advisor | | | | - | | | | | | 8,497 | | | | | | 51,205 | | | | | | - | | | | | | - | | | | | | 59,702 |
Money market waiver due from advisor | | | | - | | | | | | - | | | | | | - | | | | | | - | | | | | | - | | | | | | - |
Variation margin receivable | | | | - | | | | | | - | | | | | | - | | | | | | - | | | | | | - | | | | | | - |
Other | | | | - | | | | | | - | | | | | | - | | | | | | - | | | | | | - | | | | | | - |
Prepaid Expenses | | | | 2,727 | | | | | | 468 | | | | | | 1,611 | | | | | | 14,630 | | | | | | - | | | | | | 19,436 |
OTC swap agreements, at value | | | | - | | | | | | - | | | | | | - | | | | | | - | | | | | | - | | | | | | - |
Unrealized appreciation on forward foreign currency contracts | | | | - | | | | | | - | | | | | | - | | | | | | - | | | | | | - | | | | | | - |
| | | | | | | | | | | | | | | | | | | | | | |
Total assets | | $ | | 948,468,310 | | | | $ | | 129,102,089 | | | | $ | | 434,667,295 | | | | $ | | 1,193,157,614 | | | | $ | | (563,707,603) | | | | $ | | 2,141,687,705 |
| | | | | | | | | | | | | | | | | | | | | | |
| | | | | | | | | | | | | | | | | |
Liabilities: | | | | | | | | | | | | | | | | | | | | | | | | | | | | | | | | | | |
Due to custodian | | | | - | | | | | | - | | | | | | - | | | | | | - | | | | | | - | | | | | | - |
Cash deposit due to broker | | | | - | | | | | | - | | | | | | - | | | | | | - | | | | | | - | | | | | | - |
Payables and other liabilities: | | | | | | | | | | | | | | | | | | | | | | | | | | | | | | | | | | |
Shares of beneficial interest redeemed | | | | - | | | | | | 48,394 | | | | | | 6,602,374 | | | | | | 255,893 | | | | | | - | | | | | | 6,906,661 |
Investments purchased | | | | 2,274,932 | | | | | | - | | | | | | - | | | | | | - | | | | | | - | | | | | | 2,274,932 |
When-issued, delay-delivery, and forward commitment securities purchased | | | | - | | | | | | - | | | | | | - | | | | | | - | | | | | | - | | | | | | - |
Investment advisory fees | | | | 459,543 | | | | | | - | | | | | | - | | | | | | 607,968 | | | | | | - | | | | | | 1,067,511 |
Investment management fees | | | | - | | | | | | - | | | | | | - | | | | | | - | | | | | | - | | | | | | - |
Administration/Investment advisory fees | | | | - | | | | | | 32,186 | | | | | | 17,514 | | | | | | - | | | | | | - | | | | | | 49,700 |
Administration fees | | | | - | | | | | | - | | | | | | - | | | | | | - | | | | | | - | | | | | | - |
Distribution and service fees | | | | - | | | | | | 26,822 | | | | | | 87,569 | | | | | | 13,248 | | | | | | - | | | | | | 127,639 |
Transfer agent fees | | | | - | | | | | | - | | | | | | - | | | | | | 24,446 | | | | | | - | | | | | | 24,446 |
Trustee, CCO and deferred compensation fees | | | | 1,416 | | | | | | 276 | | | | | | 769 | | | | | | - | | | | | | - | | | | | | 2,461 |
Audit and tax fees | | | | 12,068 | | | | | | 5,892 | | | | | | 9,112 | | | | | | 15,629 | | | | | | - | | | | | | 42,701 |
Custody and accounting fees | | | | 18,303 | | | | | | 1,831 | | | | | | 1,831 | | | | | | - | | | | | | - | | | | | | 21,965 |
Legal fees | | | | 13,839 | | | | | | 2,804 | | | | | | 6,434 | | | | | | 2,158 | | | | | | - | | | | | | 25,235 |
Printing and shareholder reports fees | | | | 5,694 | | | | | | 7,648 | | | | | | 6,816 | | | | | | 4,398 | | | | | | - | | | | | | 24,556 |
Registration fees | | | | - | | | | | | - | | | | | | - | | | | | | 6,481 | | | | | | - | | | | | | 6,481 |
Dividends, interest and fees for borrowings from securities sold short | | | | - | | | | | | - | | | | | | - | | | | | | - | | | | | | - | | | | | | - |
Interest | | | | - | | | | | | - | | | | | | - | | | | | | - | | | | | | - | | | | | | - |
Distribution payable to shareholders | | | | - | | | | | | - | | | | | | - | | | | | | - | | | | | | - | | | | | | - |
Other | | | | 5,900 | | | | | | 1,134 | | | | | | 3,398 | | | | | | 112 | | | | | | 89,488 | | (c) | | | | 100,032 |
Collateral for securities on loan | | | | 101,585,922 | | | | | | - | | | | | | - | | | | | | 110,222,008 | | | | | | - | | | | | | 211,807,930 |
Securities sold short, at value | | | | - | | | | | | - | | | | | | - | | | | | | - | | | | | | - | | | | | | - |
Written options and swaptions, at value | | | | - | | | | | | - | | | | | | - | | | | | | - | | | | | | - | | | | | | - |
OTC swap agreements, at value | | | | - | | | | | | - | | | | | | - | | | | | | - | | | | | | - | | | | | | - |
Unrealized depreciation on forward foreign currency contracts | | | | - | | | | | | - | | | | | | - | | | | | | - | | | | | | - | | | | | | - |
| | | | | | | | | | | | | | | | | | | | | | |
Total liabilities | | | | 104,377,617 | | | | | | 126,987 | | | | | | 6,735,817 | | | | | | 111,152,341 | | | | | | 89,488 | | | | | | 222,482,250 |
| | | | | | | | | | | | | | | | | | | | | | |
Net Assets | | $ | | 844,090,693 | | | | $ | | 128,975,102 | | | | $ | | 427,931,478 | | | | $ | | 1,082,005,273 | | | | $ | | (563,797,091) | | | | $ | | 1,919,205,455 |
| | | | | | | | | | | | | | | | | | | | | | |
| | | | | | | | | | | | | | | | | |
Net Assets Consist of: | | | | | | | | | | | | | | | | | | | | | | | | | | | | | | | | | | |
Paid-in capital | | $ | | (5,839,024) | | | | | | 92,687,201 | | | | | | 375,222,702 | | | | | | 995,599,998 | | | | $ | | 306,576,935 | | (d) | | $ | | 1,764,247,812 |
Undistributed (distributions in excess of) net investment income (loss) | | | | 124,765,100 | | | | | | (163,707) | | | | | | (528,542) | | | | | | 6,640,166 | | | | | | (124,072,851) | | (d) | | | | 6,640,166 |
Accumulated net realized gain (loss) | | | | 619,690,337 | | | | | | 5,323,109 | | | | | | 15,813,449 | | | | | | 9,622,815 | | | | | | (640,826,895) | | (d) | | | | 9,622,815 |
Net unrealized appreciation (depreciation) on: | | | | | | | | | | | | | | | | | | | | | | | | | | | | | | | | | | |
Investments | | | | 105,474,280 | | | | | | - | | | | | | - | | | | | | 70,142,294 | | | | | | (105,474,280) | | (d) | | | | 70,142,294 |
Allocated from Series Portfolio | | | | - | | | | | | 31,128,499 | | | | | | 37,423,869 | | | | | | - | | | | | | - | | | | | | 68,552,368 |
Securities sold short | | | | - | | | | | | - | | | | | | - | | | | | | - | | | | | | - | | | | | | - |
Written options and swaptions | | | | - | | | | | | - | | | | | | - | | | | | | - | | | | | | - | | | | | | - |
Swap agreements | | | | - | | | | | | - | | | | | | - | | | | | | - | | | | | | - | | | | | | - |
Futures contracts | | | | - | | | | | | - | | | | | | - | | | | | | - | | | | | | - | | | | | | - |
Translation of assets and liabilities denominated in foreign currencies | | | | - | | | | | | - | | | | | | - | | | | | | - | | | | | | - | | | | | | - |
| | | | | | | | | | | | | | | | | | | | | | |
| | | | | | | | | | | | | | | | | |
Net Assets | | $ | | 844,090,693 | | | | $ | | 128,975,102 | | | | $ | | 427,931,478 | | | | $ | | 1,082,005,273 | | | | $ | | (563,797,091) | | | | $ | | 1,919,205,455 |
| | | | | | | | | | | | | | | | | | | | | | |
| | | | | - | | | | | | - | | | | | | - | | | | | | - | | | | | | - | | | | | | |
Net assets by class: | | | | | | | | | | - | | | | | | - | | | | | | - | | | | | | | | | | | | |
Class A | | $ | | - | | | | $ | | - | | | | $ | | - | | | | $ | | 50,417,868 | | | | $ | | - | | | | $ | | 50,417,868 |
Class B | | | | - | | | | | | - | | | | | | - | | | | | | - | | | | | | - | | | | | | - |
Class C | | | | - | | | | | | - | | | | | | - | | | | | | 4,020,938 | | | | | | - | | | | | | 4,020,938 |
Class I | | | | - | | | | | | - | | | | | | - | | | | | | 231,896,631 | | | | | | - | | | | | | 231,896,631 |
Class I2 | | | | - | | | | | | - | | | | | | - | | | | | | 795,669,836 | | | | | | - | | | | | | 795,669,836 |
Class I3 | | | | 280,383,090 | | | | | | - | | | | | | - | | | | | | - | | | | | | (89,488) | | (c) | | | | 280,293,602 |
Class T | | | | - | | | | | | - | | | | | | - | | | | | | - | | | | | | - | | | | | | - |
Class R | | | | - | | | | | | 128,975,102 | | | | | | - | | | | | | - | | | | | | - | | | | | | 128,975,102 |
Class R4 | | | | - | | | | | | - | | | | | | 427,931,478 | | | | | | - | | | | | | - | | | | | | 427,931,478 |
Class R6 | | | | - | | | | | | - | | | | | | - | | | | | | - | | | | | | - | | | | | | - |
Shares outstanding (unlimited shares, no par value): | | | | | | | | | | | | | | | | | | | | | | | | | | | | | | | | | | |
Class A | | | | - | | | | | | - | | | | | | - | | | | | | 4,382,734 | | | | | | - | | | | | | 4,382,734 |
Class B | | | | - | | | | | | - | | | | | | - | | | | | | - | | | | | | - | | | | | | - |
Class C | | | | - | | | | | | - | | | | | | - | | | | | | 351,606 | | | | | | - | | | | | | 351,606 |
Class I | | | | - | | | | | | - | | | | | | - | | | | | | 20,084,673 | | | | | | - | | | | | | 20,084,673 |
Class I2 | | | | - | | | | | | - | | | | | | - | | | | | | 68,857,112 | | | | | | - | | | | | | 68,857,112 |
Class I3 | | | | 24,254,593 | | | | | | - | | | | | | - | | | | | | - | | | | | | - | | | | | | 24,254,593 |
Class T | | | | - | | | | | | - | | | | | | - | | | | | | - | | | | | | - | | | | | | - |
Class R | | | | - | | | | | | 6,038,918 | | | | | | - | | | | | | - | | | | | | 5,118,098 | | (e) | | | | 11,157,016 |
Class R4 | | | | - | | | | | | - | | | | | | 24,264,737 | | | | | | - | | | | | | 12,753,557 | | (e) | | | | 37,018,294 |
Class R6 | | | | - | | | | | | - | | | | | | - | | | | | | - | | | | | | - | | | | | | - |
Net asset value per share: | | | | | | | | | | | | | | | | | | | | | | | | | | | | | | | | | | |
Class A | | $ | | - | | | | $ | | - | | | | $ | | - | | | | $ | | 11.50 | | | | | | - | | | | $ | | 11.50 |
Class B | | | | - | | | | | | - | | | | | | - | | | | | | | | | | | | - | | | | | | - |
Class C | | | | - | | | | | | - | | | | | | - | | | | | | 11.44 | | | | | | - | | | | | | 11.44 |
Class I | | | | - | | | | | | - | | | | | | - | | | | | | 11.55 | | | | | | - | | | | | | 11.55 |
Class I2 | | | | - | | | | | | - | | | | | | - | | | | | | 11.56 | | | | | | - | | | | | | 11.56 |
Class I3 | | | | 11.56 | | | | | | - | | | | | | - | | | | | | 11.56 | | | | | | (11.56) | | (f) | | | | 11.56 |
Class T | | | | - | | | | | | - | | | | | | - | | | | | | | | | | | | - | | | | | | - |
Class R | | | | - | | | | | | 21.36 | | | | | | - | | | | | | 11.56 | | | | | | (21.37) | | (f) | | | | 11.55 |
Class R4 | | | | - | | | | | | - | | | | | | 17.64 | | | | | | 11.56 | | | | | | (17.64) | | (f) | | | | 11.56 |
Class R6 | | | | - | | | | | | - | | | | | | - | | | | | | | | | | | | - | | | | | | - |
Maximum offering price per share: | | | | | | | | | | | | | | | | | | | | | | | | | | | | | | | | | | |
Class A | | $ | | - | | | | $ | | - | | | | $ | | - | | | | $ | | 25.56 | | | | | | - | | | | $ | | 25.56 |
| | | | | | | | | | | |
| | | | | | | | | | | | | | | | | | | | | | |
Investments, at cost | | $ | | 807,537,021 | | | | $ | | - | | | | $ | | - | | | | $ | | 1,053,399,516 | | | | | | - | | | | $ | | 1,860,936,537 |
Securities loaned, at value | | | | 99,214,860 | | | | | | - | | | | | | - | | | | | | 107,221,846 | | | | | | - | | | | | | 206,436,706 |
Repurchase agreements, at cost | | | | 30,157,614 | | | | | | - | | | | | | - | | | | | | 64,621,092 | | | | | | - | | | | | | 94,778,706 |
Foreign currency, at cost | | | | - | | | | | | - | | | | | | - | | | | | | - | | | | | | - | | | | | | - |
Premium received on written options and swaptions | | | | - | | | | | | - | | | | | | - | | | | | | - | | | | | | - | | | | | | - |
(a)-(l) See Note 2 of the Notes to the Pro Forma Financial Statements.
THE NOTES TO THE PRO FORMA FINANCIAL STATEMENTS ARE AN INTEGRAL PART OF THIS REPORT.
S-35
Reorganization Between TPP Master, TPFG Feeder, TPFG II Feeder and TAF Destination
PRO FORMA STATEMENT OF OPERATIONS
For the twelve-month period ended June 30, 2016
| | | | | | | | | | | | | | | | | | | | | | | | | | | | | | | | | | |
| | | | | TPP Master | | | | | | TPFG Feeder | | | | | | TPFG II Feeder | | | | | | TAF Destination | | | | | | Adjustments | | | | | | Combined Pro
Forma Destination |
Investment Income: | | | | | | | | | | | | | | | | | | | | | | | | | | | | | | | | | | |
| | | | | | | | | | | | | | | | | |
Dividend income | | $ | | 16,886,042 | | | | $ | | 2,834,515 | | | | $ | | 8,054,623 | | | | $ | | 17,509,253 | | | | $ | | (10,889,138) | | (b) | | $ | | 34,395,295 |
Interest income | | | | 6,959 | | | | | | 1,134 | | | | | | 3,433 | | | | | | 10,779 | | | | | | (4,567) | | (b) | | | | 17,738 |
Net income (loss) from securities lending | | | | 525,015 | | | | | | 87,347 | | | | | | 252,924 | | | | | | 415,464 | | | | | | (340,271) | | (b) | | | | 940,479 |
Withholding taxes on foreign income | | | | (119,810) | | | | | | (19,915) | | | | | | (57,707) | | | | | | (80,608) | | | | | | 77,622 | | (b) | | | | (200,418) |
Expenses (net of waiver and/or reimbursement) | | | | - | | | | | | (956,474) | | | | | | (2,738,429) | | | | | | - | | | | | | 3,694,903 | | (b) | | | | - |
| | | | | | | | | | | | | | | | | | | | | | |
Total investment income (loss) | | | | 17,298,206 | | | | | | 1,946,607 | | | | | | 5,514,844 | | | | | | 17,854,888 | | | | | | (7,461,451) | | | | | | 35,153,094 |
| | | | | | | | | | | | | | | | | | | | | | |
| | | | | | | | | | | | | | | | | |
Expenses: | | | | | | | | | | | | | | | | | | | | | | | | | | | | | | | | | | |
Investment advisory fees | | | | 5,540,087 | | | | | | - | | | | | | - | | | | | | 2,815,951 | | | | | | 371,885 | | (g) | | | | 8,727,923 |
Investment management fees | | | | - | | | | | | - | | | | | | - | | | | | | 2,384,407 | | | | | | - | | | | | | 2,384,407 |
Administration/Investment advisory fees | | | | - | | | | | | 415,439 | | | | | | 198,031 | | | | | | - | | | | | | (613,470) | | (h) | | | | - |
Distribution and service fees: | | | | | | | | | | | | | | | | | | | | | | | | | | | | | | | | | | |
Class A | | | | - | | | | | | - | | | | | | - | | | | | | 65,456 | | | | | | (30) | | (i) | | | | 65,426 |
Class B | | | | - | | | | | | - | | | | | | - | | | | | | - | | | | | | - | | | | | | - |
Class C | | | | - | | | | | | - | | | | | | - | | | | | | 18,990 | | | | | | (10) | | (i) | | | | 18,980 |
Class I | | | | - | | | | | | - | | | | | | - | | | | | | - | | | | | | - | | | | | | - |
Class I2 | | | | - | | | | | | - | | | | | | - | | | | | | - | | | | | | - | | | | | | - |
Class I3 | | | | - | | | | | | - | | | | | | - | | | | | | - | | | | | | - | | | | | | - |
Class T | | | | - | | | | | | - | | | | | | - | | | | | | - | | | | | | - | | | | | | - |
Class R | | | | - | | | | | | 346,199 | | | | | | - | | | | | | - | | | | | | 345,200 | | (i) | | | | 691,399 |
Class R4 | | | | - | | | | | | - | | | | | | 990,156 | | | | | | - | | | | | | (1,316) | | (i) | | | | 988,840 |
Class R6 | | | | - | | | | | | - | | | | | | - | | | | | | - | | | | | | - | | | | | | - |
Administration fees | | | | - | | | | | | - | | | | | | - | | | | | | 124,092 | | | | | | (124,092) | | (h) | | | | - |
Transfer agent fees: | | | | | | | | | | | | | | | | | | | | | | | | | | | | | | | | | | |
Class A | | | | - | | | | | | - | | | | | | - | | | | | | 28,794 | | | | | | - | | | | | | 28,794 |
Class B | | | | - | | | | | | - | | | | | | - | | | | | | - | | | | | | | | | | | | - |
Class C | | | | - | | | | | | - | | | | | | - | | | | | | 2,530 | | | | | | - | | | | | | 2,530 |
Class I | | | | - | | | | | | - | | | | | | - | | | | | | 145,030 | | | | | | | | | | | | 145,030 |
Class I2 | | | | - | | | | | | - | | | | | | - | | | | | | 54,973 | | | | | | | | | | | | 54,973 |
Class I3 | | | | - | | | | | | - | | | | | | - | | | | | | - | | | | | | | | | | | | - |
Class T | | | | - | | | | | | - | | | | | | - | | | | | | - | | | | | | - | | | | | | - |
Class R | | | | - | | | | | | - | | | | | | - | | | | | | - | | | | | | | | | | | | - |
Class R4 | | | | - | | | | | | - | | | | | | - | | | | | | - | | | | | | | | | | | | - |
Class R6 | | | | - | | | | | | - | | | | | | - | | | | | | - | | | | | | | | | | | | - |
Trustee, CCO and deferred compensation fees | | | | 12,611 | | | | | | 2,465 | | | | | | 6,413 | | | | | | 11,402 | | | | | | - | | | | | | 32,891 |
Audit and tax fees | | | | 15,858 | | | | | | 10,768 | | | | | | 16,801 | | | | | | 27,964 | | | | | | (23,234) | | (j) | | | | 48,157 |
Custody fees | | | | 97,101 | | | | | | 11,268 | | | | | | 11,281 | | | | | | 53,998 | | | | | | (57,678) | | (k) | | | | 115,970 |
Legal fees | | | | 30,500 | | | | | | 6,208 | | | | | | 13,482 | | | | | | 21,268 | | | | | | - | | | | | | 71,458 |
Printing and shareholder reports fees | | | | 2,810 | | | | | | 19,591 | | | | | | 27,841 | | | | | | 33,157 | | | | | | - | | | | | | 83,399 |
Registration fees | | | | - | | | | | | 19,383 | | | | | | 41,390 | | | | | | 55,651 | | | | | | | | | | | | 116,424 |
Dividends, interest and fees for borrowings from securities sold short | | | | - | | | | | | - | | | | | | - | | | | | | - | | | | | | | | | | | | - |
Interest | | | | - | | | | | | - | | | | | | - | | | | | | - | | | | | | - | | | | | | - |
Other | | | | 13,698 | | | | | | 4,501 | | | | | | 10,876 | | | | | | 11,619 | | | | | | - | | | | | | 40,694 |
| | | | | | | | | | | | | | | | | | | | | | |
Total expenses before waiver and/or reimbursment and recapture | | | | 5,712,665 | | | | | | 835,822 | | | | | | 1,316,271 | | | | | | 5,855,282 | | | | | | (102,745) | | | | | | 13,617,295 |
Expenses waived and/or reimbursed: | | | | | | | | | | | | | | | | | | | | | | | | | | | | | | | | | | |
Fund level | | | | - | | | | | | - | | | | | | - | | | | | | - | | | | | | - | | | | | | - |
Class A | | | | - | | | | | | - | | | | | | - | | | | | | (6) | | | | | | 6 | | (l) | | | | - |
Class B | | | | - | | | | | | - | | | | | | - | | | | | | - | | | | | | - | | | | | | - |
Class C | | | | - | | | | | | - | | | | | | - | | | | | | - | | | | | | - | | | | | | - |
Class I | | | | - | | | | | | - | | | | | | - | | | | | | - | | | | | | - | | | | | | - |
Class I2 | | | | - | | | | | | - | | | | | | - | | | | | | - | | | | | | - | | | | | | - |
Class I3 | | | | - | | | | | | - | | | | | | - | | | | | | - | | | | | | (93,779) | | (l) | | | | (93,779) |
Class T | | | | - | | | | | | - | | | | | | - | | | | | | - | | | | | | - | | | | | | - |
Class R | | | | - | | | | | | (61,270) | | | | | | - | | | | | | - | | | | | | 61,270 | | (l) | | | | - |
Class R4 | | | | - | | | | | | - | | | | | | (490,052) | | | | | | - | | | | | | 165,463 | | (l) | | | | (324,589) |
Class R6 | | | | - | | | | | | - | | | | | | - | | | | | | - | | | | | | - | | | | | | - |
Recapture of previously waived and/or reimbursed fees: | | | | | | | | | | | | | | | | | | | | | | | | | | | | | | | | | | |
Fund level | | | | - | | | | | | - | | | | | | - | | | | | | - | | | | | | - | | | | | | - |
Class A | | | | - | | | | | | - | | | | | | - | | | | | | 6 | | | | | | - | | | | | | 6 |
Class B | | | | - | | | | | | - | | | | | | - | | | | | | - | | | | | | - | | | | | | - |
Class C | | | | - | | | | | | - | | | | | | - | | | | | | - | | | | | | - | | | | | | - |
Class I | | | | - | | | | | | - | | | | | | - | | | | | | 104 | | | | | | - | | | | | | 104 |
Class I2 | | | | - | | | | | | - | | | | | | - | | | | | | - | | | | | | - | | | | | | - |
Class I3 | | | | - | | | | | | - | | | | | | - | | | | | | - | | | | | | - | | | | | | - |
Class T | | | | - | | | | | | - | | | | | | - | | | | | | - | | | | | | - | | | | | | - |
Class R | | | | - | | | | | | - | | | | | | - | | | | | | - | | | | | | - | | | | | | - |
Class R4 | | | | - | | | | | | - | | | | | | - | | | | | | - | | | | | | - | | | | | | - |
Class R6 | | | | - | | | | | | - | | | | | | - | | | | | | - | | | | | | - | | | | | | - |
| | | | | | | | | | | | | | | | | | | | | | | | | | |
Net expenses | | | | 5,712,665 | | | | | | 774,552 | | | | | | 826,219 | | | | | | 5,855,386 | | | | | | 30,215 | | | | | | 13,199,037 |
| | | | | | | | | | | | | | | | | |
Net investment income (loss) | | | | 11,585,541 | | | | | | 1,172,055 | | | | | | 4,688,625 | | | | | | 11,999,502 | | | | | | (7,491,666) | | | | | | 21,954,057 |
| | | | | | | | | | | | | | | | | | | | | | |
| | | | | | | | | | | | | | | | | |
Net realized gain (loss) on: | | | | | | | | | | | | | | | | | | | | | | | | | | | | | | | | | | |
Allocated from series portfolio | | | | - | | | | | | 8,126,319 | | | | | | 23,196,631 | | | | | | - | | | | | | (31,322,950) | | (b) | | | | - |
Investments | | | | 48,420,625 | | | | | | - | | | | | | - | | | | | | 12,530,431 | | | | | | - | | | | | | 60,951,056 |
Securities sold short | | | | - | | | | | | - | | | | | | - | | | | | | - | | | | | | - | | | | | | - |
Written options and swaptions | | | | - | | | | | | - | | | | | | - | | | | | | - | | | | | | - | | | | | | - |
Swap agreements | | | | - | | | | | | - | | | | | | - | | | | | | - | | | | | | - | | | | | | - |
Futures contracts | | | | - | | | | | | - | | | | | | - | | | | | | - | | | | | | - | | | | | | - |
Foreign currency transactions | | | | (2,033) | | | | | | - | | | | | | - | | | | | | (716) | | | | | | - | | | | | | (2,749) |
| | | | | | | | | | | | | | | | | | | | | | |
Net realized gain (loss) | | | | 48,418,592 | | | | | | 8,126,319 | | | | | | 23,196,631 | | | | | | 12,529,715 | | | | | | (31,322,950) | | | | | | 60,948,307 |
| | | | | | | | | | | | | | | | | | | | | | |
| | | | | | | | | | | | | | | | | |
Net change in unrealized appreciation (depreciation) on: | | | | | | | | | | | | | | | | | | | | | | | | | | | | | | | | | | |
Allocated from series portfolio | | | | - | | | | | | (3,705,838) | | | | | | (6,600,336) | | | | | | - | | | | | | 10,306,174 | | (b) | | | | - |
Investments | | | | (18,152,796) | | | | | | - | | | | | | - | | | | | | 69,518,700 | | | | | | - | | | | | | 51,365,904 |
Securities sold short | | | | - | | | | | | - | | | | | | - | | | | | | - | | | | | | - | | | | | | - |
Written options and swaptions | | | | - | | | | | | - | | | | | | - | | | | | | - | | | | | | - | | | | | | - |
Swap agreements | | | | - | | | | | | - | | | | | | - | | | | | | - | | | | | | - | | | | | | - |
Futures contracts | | | | - | | | | | | - | | | | | | - | | | | | | - | | | | | | - | | | | | | - |
Translation of assets and liabilities denominated in foreign currencies | | | | 328 | | | | | | - | | | | | | - | | | | | | 374 | | | | | | - | | | | | | 702 |
| | | | | | | | | | | | | | | | | | | | | | |
Net change in unrealized appreciation (depreciation) | | | | (18,152,468) | | | | | | (3,705,838) | | | | | | (6,600,336) | | | | | | 69,519,074 | | | | | | 10,306,174 | | | | | | 51,366,606 |
| | | | | | | | | | | | | | | | | | | | | | |
| | | | | | | | | | | | | | | | | |
Net realized and change in unrealized gain (loss) | | | | 30,266,124 | | | | | | 4,420,481 | | | | | | 16,596,295 | | | | | | 82,048,789 | | | | | | (21,016,776) | | | | | | 112,314,913 |
| | | | | | | | | | | | | | | | | | | | | | |
| | | | | | | | | | | | | | | | | |
Net increase (decrease) in net assets resulting from operations | | $ | | 41,851,665 | | | | $ | | 5,592,536 | | | | $ | | 21,284,920 | | | | $ | | 94,048,291 | | | | $ | | (28,508,442) | | | | $ | | 134,268,970 |
| | | | | | | | | | | | | | | | | | | | | | |
(a)-(l) See Note 2 of the Notes to the Pro Forma Financial Statements.
THE NOTES TO THE PRO FORMA FINANCIAL STATEMENTS ARE AN INTEGRAL PART OF THIS REPORT.
S-36
Group Seven Reorganization Between:
TRANSAMERICA PARTNERS SMALL CORE
TRANSAMERICA PARTNERS INSTITUTIONAL SMALL CORE
TRANSAMERICA PARTNERS SMALL CORE PORTFOLIO
AND
TRANSAMERICA SMALL CAP CORE
PRO FORMA SCHEDULE OF INVESTMENTS
At June 30, 2016
Reorganization Between TPP Master and TAF
PRO FORMA SCHEDULE OF INVESTMENTS
At June 30, 2016
| | | | | | | | | | | | | | | | | | | | | | | | | | | | | | | | | | | | | | | | | | | | | | | | | | | | | | | | | | | | |
| | | | | | | | | | | TPP Master | | | | | TAF Destination | | | | | Adjustments | | | | | Combined Pro Forma Destination | |
| | | Coupon
Rate | | | Maturity
Date | | | | | Shares | | | | | | Value | | | | | Shares | | | | | | Value | | | | | Shares | | | Value | | | | | Shares | | | | | | Value | |
| | | | | | | | | | | | | | | | | | | | | | |
Common Stocks - 98.6 % | | | | | | | | | | | | | | | | | | | | | | | | | | | | | | | | | | | | | | | | | | | | | | | | | | | | | | | | | | | | |
Aerospace & Defense | | | | | | | | | | | | | | | | | | | | | | | | | | | | | | | | | | | | | | | | | | | | | | | | | | | | | | | | | | | | |
Ducommun, Inc. | | | | | | | | | | | | | 27,990 | | | | | | | $ | 553,642 | | | | | | 11,180 | | | | | | | $ | 221,140 | | | | | | | | | | | | | | | | 39,170 | | | | | | | $ | 774,782 | |
Air Freight & Logistics | | | | | | | | | | | | | | | | | | | | | | | | | | | | | | | | | | | | | | | | | | | | | | | | | | | | | | | | | | | | |
Atlas Air Worldwide Holdings, Inc. | | | | | | | | | | | | | 19,125 | | | | | | | | 792,157 | | | | | | 7,640 | | | | | | | | 316,449 | | | | | | | | | | | | | | | | 26,765 | | | | | | | | 1,108,606 | |
Hub Group, Inc. | | | | | | | | | | | | | 20,367 | | | | | | | | 781,482 | | | | | | 8,555 | | | | | | | | 328,255 | | | | | | | | | | | | | | | | 28,922 | | | | | | | | 1,109,737 | |
Auto Components | | | | | | | | | | | | | | | | | | | | | | | | | | | | | | | | | | | | | | | | | | | | | | | | | | | | | | | | | | | | |
Cooper Tire & Rubber Co. | | | | | | | | | | | | | 25,950 | | | | | | | | 773,829 | | | | | | 10,160 | | | | | | | | 302,971 | | | | | | | | | | | | | | | | 36,110 | | | | | | | | 1,076,800 | |
Dana Holding Corp. | | | | | | | | | | | | | 65,360 | | | | | | | | 690,202 | | | | | | 27,200 | | | | | | | | 287,232 | | | | | | | | | | | | | | | | 92,560 | | | | | | | | 977,434 | |
Superior Industries International, Inc. | | | | | | | | | | | | | 29,905 | | | | | | | | 800,856 | | | | | | 11,945 | | | | | | | | 319,887 | | | | | | | | | | | | | | | | 41,850 | | | | | | | | 1,120,743 | |
Tower International, Inc. | | | | | | | | | | | | | 37,580 | | | | | | | | 773,396 | | | | | | 15,330 | | | | | | | | 315,491 | | | | | | | | | | | | | | | | 52,910 | | | | | | | | 1,088,887 | |
Banks | | | | | | | | | | | | | | | | | | | | | | | | | | | | | | | | | | | | | | | | | | | | | | | | | | | | | | | | | | | | |
Banc of California, Inc. | | | | | | | | | | | | | 42,050 | | | | | | | | 761,105 | | | | | | 16,800 | | | | | | | | 304,080 | | | | | | | | | | | | | | | | 58,850 | | | | | | | | 1,065,185 | |
Bryn Mawr Bank Corp. | | | | | | | | | | | | | 19,694 | | | | | | | | 575,065 | | | | | | 7,900 | | | | | | | | 230,680 | | | | | | | | | | | | | | | | 27,594 | | | | | | | | 805,745 | |
Cathay General Bancorp | | | | | | | | | | | | | 27,805 | | | | | | | | 784,101 | | | | | | 11,110 | | | | | | | | 313,302 | | | | | | | | | | | | | | | | 38,915 | | | | | | | | 1,097,403 | |
Central Pacific Financial Corp. | | | | | | | | | | | | | 33,585 | | | | | | | | 792,606 | | | | | | 13,415 | | | | | | | | 316,594 | | | | | | | | | | | | | | | | 47,000 | | | | | | | | 1,109,200 | |
Customers Bancorp, Inc. | | | | | | | | | | | | | 32,045 | | | | | | | | 805,291 | | | | | | 12,550 | | | | | | | | 315,382 | | | | | | | | | | | | | | | | 44,595 | | | | | | | | 1,120,673 | |
Enterprise Financial Services Corp. | | | | | | | | | | | | | 18,485 | | | | | | | | 515,547 | | | | | | 7,310 | | | | | | | | 203,876 | | | | | | | | | | | | | | | | 25,795 | | | | | | | | 719,423 | |
Franklin Financial Network, Inc. | | | | | | | | | | | | | 17,935 | | | | | | | | 562,442 | | | | | | 7,165 | | | | | | | | 224,694 | | | | | | | | | | | | | | | | 25,100 | | | | | | | | 787,136 | |
Great Western Bancorp, Inc. | | | | | | | | | | | | | 24,990 | | | | | | | | 788,185 | | | | | | 10,230 | | | | | | | | 322,654 | | | | | | | | | | | | | | | | 35,220 | | | | | | | | 1,110,839 | |
Hanmi Financial Corp. | | | | | | | | | | | | | 29,110 | | | | | | | | 683,794 | | | | | | 11,630 | | | | | | | | 273,189 | | | | | | | | | | | | | | | | 40,740 | | | | | | | | 956,983 | |
Heartland Financial USA, Inc. | | | | | | | | | | | | | 17,270 | | | | | | | | 609,457 | | | | | | 6,830 | | | | | | | | 241,031 | | | | | | | | | | | | | | | | 24,100 | | | | | | | | 850,488 | |
Heritage Financial Corp. | | | | | | | | | | | | | 29,795 | | | | | | | | 523,796 | | | | | | 11,785 | | | | | | | | 207,180 | | | | | | | | | | | | | | | | 41,580 | | | | | | | | 730,976 | |
Independent Bank Group, Inc. | | | | | | | | | | | | | 16,310 | | | | | | | | 699,862 | | | | | | 6,545 | | | | | | | | 280,846 | | | | | | | | | | | | | | | | 22,855 | | | | | | | | 980,708 | |
LegacyTexas Financial Group, Inc. | | | | | | | | | | | | | 29,320 | | | | | | | | 789,001 | | | | | | 11,710 | | | | | | | | 315,116 | | | | | | | | | | | | | | | | 41,030 | | | | | | | | 1,104,117 | |
Pacific Premier Bancorp, Inc. | | | | | | | | | | | | | 27,930 | | | | | | | | 670,320 | | | | | | 11,435 | | | | | | | | 274,440 | | | | | | | | | | | | | | | | 39,365 | | | | | | | | 944,760 | |
PacWest Bancorp | | | | | | | | | | | | | 20,735 | | | | | | | | 824,838 | | | | | | 8,285 | | | | | | | | 329,577 | | | | | | | | | | | | | | | | 29,020 | | | | | | | | 1,154,415 | |
Preferred Bank | | | | | | | | | | | | | 18,535 | | | | | | | | 535,198 | | | | | | 7,330 | | | | | | | | 211,654 | | | | | | | | | | | | | | | | 25,865 | | | | | | | | 746,852 | |
PrivateBancorp, Inc. | | | | | | | | | | | | | 20,030 | | | | | | | | 881,921 | | | | | | 8,180 | | | | | | | | 360,165 | | | | | | | | | | | | | | | | 28,210 | | | | | | | | 1,242,086 | |
SVB Financial Group | | | | | | | | | | | | | 7,855 | | | | | | | | 747,482 | | | | | | 3,120 | | | | | | | | 296,899 | | | | | | | | | | | | | | | | 10,975 | | | | | | | | 1,044,381 | |
State Bank Financial Corp. | | | | | | | | | | | | | 27,800 | | | | | | | | 565,730 | | | | | | 10,995 | | | | | | | | 223,748 | | | | | | | | | | | | | | | | 38,795 | | | | | | | | 789,478 | |
TCF Financial Corp. | | | | | | | | | | | | | 62,435 | | | | | | | | 789,803 | | | | | | 24,945 | | | | | | | | 315,554 | | | | | | | | | | | | | | | | 87,380 | | | | | | | | 1,105,357 | |
Biotechnology | | | | | | | | | | | | | | | | | | | | | | | | | | | | | | | | | | | | | | | | | | | | | | | | | | | | | | | | | | | | |
AMAG Pharmaceuticals, Inc. | | | | | | | | | | | | | 33,110 | | | | | | | | 791,991 | | | | | | 13,230 | | | | | | | | 316,462 | | | | | | | | | | | | | | | | 46,340 | | | | | | | | 1,108,453 | |
Emergent BioSolutions, Inc. | | | | | | | | | | | | | 26,305 | | | | | | | | 739,697 | | | | | | 10,510 | | | | | | | | 295,541 | | | | | | | | | | | | | | | | 36,815 | | | | | | | | 1,035,238 | |
Myriad Genetics, Inc. | | | | | | | | | | | | | 23,715 | | | | | | | | 725,679 | | | | | | 9,285 | | | | | | | | 284,121 | | | | | | | | | | | | | | | | 33,000 | | | | | | | | 1,009,800 | |
PDL Biopharma, Inc. | | | | | | | | | | | | | 266,725 | | | | | | | | 837,516 | | | | | | 104,450 | | | | | | | | 327,973 | | | | | | | | | | | | | | | | 371,175 | | | | | | | | 1,165,489 | |
United Therapeutics Corp. | | | | | | | | | | | | | 7,975 | | | | | | | | 844,712 | | | | | | 3,185 | | | | | | | | 337,355 | | | | | | | | | | | | | | | | 11,160 | | | | | | | | 1,182,067 | |
Capital Markets | | | | | | | | | | | | | | | | | | | | | | | | | | | | | | | | | | | | | | | | | | | | | | | | | | | | | | | | | | | | |
Legg Mason, Inc. | | | | | | | | | | | | | 25,520 | | | | | | | | 752,585 | | | | | | 9,580 | | | | | | | | 282,514 | | | | | | | | | | | | | | | | 35,100 | | | | | | | | 1,035,099 | |
Waddell & Reed Financial, Inc. | | | | | | | | | | | | | 43,545 | | | | | | | | 749,845 | | | | | | 17,055 | | | | | | | | 293,687 | | | | | | | | | | | | | | | | 60,600 | | | | | | | | 1,043,532 | |
Chemicals | | | | | | | | | | | | | | | | | | | | | | | | | | | | | | | | | | | | | | | | | | | | | | | | | | | | | | | | | | | | |
Cabot Corp. | | | | | | | | | | | | | 16,920 | | | | | | | | 772,567 | | | | | | 6,560 | | | | | | | | 299,530 | | | | | | | | | | | | | | | | 23,480 | | | | | | | | 1,072,097 | |
HB Fuller Co. | | | | | | | | | | | | | 17,620 | | | | | | | | 775,104 | | | | | | 7,040 | | | | | | | | 309,690 | | | | | | | | | | | | | | | | 24,660 | | | | | | | | 1,084,794 | |
Koppers Holdings, Inc. | | | | | | | | | | | | | 27,005 | | | | | | | | 829,863 | | | | | | 10,785 | | | | | | | | 331,423 | | | | | | | | | | | | | | | | 37,790 | | | | | | | | 1,161,286 | |
Minerals Technologies, Inc. | | | | | | | | | | | | | 13,645 | | | | | | | | 775,036 | | | | | | 5,720 | | | | | | | | 324,896 | | | | | | | | | | | | | | | | 19,365 | | | | | | | | 1,099,932 | |
Stepan Co. | | | | | | | | | | | | | 13,405 | | | | | | | | 798,000 | | | | | | 5,455 | | | | | | | | 324,736 | | | | | | | | | | | | | | | | 18,860 | | | | | | | | 1,122,736 | |
Commercial Services & Supplies | | | | | | | | | | | | | | | | | | | | | | | | | | | | | | | | | | | | | | | | | | | | | | | | | | | | | | | | | | | | |
ACCO Brands Corp. | | | | | | | | | | | | | 77,170 | | | | | | | | 797,166 | | | | | | 30,820 | | | | | | | | 318,371 | | | | | | | | | | | | | | | | 107,990 | | | | | | | | 1,115,537 | |
Brady Corp. | | | | | | | | | | | | | 26,380 | | | | | | | | 806,173 | | | | | | 10,540 | | | | | | | | 322,102 | | | | | | | | | | | | | | | | 36,920 | | | | | | | | 1,128,275 | |
Brink's Co. | | | | | | | | | | | | | 27,285 | | | | | | | | 777,350 | | | | | | 10,190 | | | | | | | | 290,313 | | | | | | | | | | | | | | | | 37,475 | | | | | | | | 1,067,663 | |
Ennis, Inc. | | | | | | | | | | | | | 37,220 | | | | | | | | 713,879 | | | | | | 14,870 | | | | | | | | 285,207 | | | | | | | | | | | | | | | | 52,090 | | | | | | | | 999,086 | |
Essendant, Inc. | | | | | | | | | | | | | 25,950 | | | | | | | | 793,032 | | | | | | 10,365 | | | | | | | | 316,754 | | | | | | | | | | | | | | | | 36,315 | | | | | | | | 1,109,786 | |
Herman Miller, Inc. | | | | | | | | | | | | | 25,765 | | | | | | | | 770,116 | | | | | | 10,190 | | | | | | | | 304,579 | | | | | | | | | | | | | | | | 35,955 | | | | | | | | 1,074,695 | |
Pitney Bowes, Inc. | | | | | | | | | | | | | 46,000 | | | | | | | | 818,800 | | | | | | 18,015 | | | | | | | | 320,667 | | | | | | | | | | | | | | | | 64,015 | | | | | | | | 1,139,467 | |
Quad/Graphics, Inc. | | | | | | | | | | | | | 36,725 | | | | | | | | 855,325 | | | | | | 15,190 | | | | | | | | 353,775 | | | | | | | | | | | | | | | | 51,915 | | | | | | | | 1,209,100 | |
R.R. Donnelley & Sons Co. | | | | | | | | | | | | | 49,525 | | | | | | | | 837,963 | | | | | | 19,205 | | | | | | | | 324,949 | | | | | | | | | | | | | | | | 68,730 | | | | | | | | 1,162,912 | |
Steelcase, Inc. | | | | | | | | | | | | | 57,705 | | | | | | | | 783,057 | | | | | | 22,375 | | | | | | | | 303,629 | | | | | | | | | | | | | | | | 80,080 | | | | | | | | 1,086,686 | |
Tetra Tech, Inc. | | | | | | | | | | | | | 26,270 | | | | | | | | 807,671 | | | | | | 10,610 | | | | | | | | 326,204 | | | | | | | | | | | | | | | | 36,880 | | | | | | | | 1,133,875 | |
Communications Equipment | | | | | | | | | | | | | | | | | | | | | | | | | | | | | | | | | | | | | | | | | | | | | | | | | | | | | | | | | | | | |
Brocade Communications Systems, Inc. | | | | | | | | | | | | | 86,301 | | | | | | | | 792,243 | | | | | | 34,475 | | | | | | | | 316,481 | | | | | | | | | | | | | | | | 120,776 | | | | | | | | 1,108,724 | |
Digi International, Inc. | | | | | | | | | | | | | 53,555 | | | | | | | | 574,645 | | | | | | 20,975 | | | | | | | | 225,062 | | | | | | | | | | | | | | | | 74,530 | | | | | | | | 799,707 | |
Extreme Networks, Inc. | | | | | | | | | | | | | 161,755 | | | | | | | | 548,350 | | | | | | 66,610 | | | | | | | | 225,807 | | | | | | | | | | | | | | | | 228,365 | | | | | | | | 774,157 | |
Ixia | | | | | | | | | | | | | 80,485 | | | | | | | | 790,363 | | | | | | 33,425 | | | | | | | | 328,234 | | | | | | | | | | | | | | | | 113,910 | | | | | | | | 1,118,597 | |
NETGEAR, Inc. | | | | | | | | | | | | | 16,910 | | | | | | | | 803,901 | | | | | | 6,755 | | | | | | | | 321,133 | | | | | | | | | | | | | | | | 23,665 | | | | | | | | 1,125,034 | |
Polycom, Inc. | | | | | | | | | | | | | 70,000 | | | | | | | | 787,500 | | | | | | 26,305 | | | | | | | | 295,931 | | | | | | | | | | | | | | | | 96,305 | | | | | | | | 1,083,431 | |
Construction & Engineering | | | | | | | | | | | | | | | | | | | | | | | | | | | | | | | | | | | | | | | | | | | | | | | | | | | | | | | | | | | | |
AECOM | | | | | | | | | | | | | 24,285 | | | | | | | | 771,535 | | | | | | 9,700 | | | | | | | | 308,168 | | | | | | | | | | | | | | | | 33,985 | | | | | | | | 1,079,703 | |
Aegion Corp. | | | | | | | | | | | | | 35,420 | | | | | | | | 691,044 | | | | | | 14,150 | | | | | | | | 276,066 | | | | | | | | | | | | | | | | 49,570 | | | | | | | | 967,110 | |
Chicago Bridge & Iron Co. NV | | | | | | | | | | | | | 22,540 | | | | | | | | 780,560 | | | | | | 8,915 | | | | | | | | 308,726 | | | | | | | | | | | | | | | | 31,455 | | | | | | | | 1,089,286 | |
EMCOR Group, Inc. | | | | | | | | | | | | | 16,255 | | | | | | | | 800,722 | | | | | | 6,345 | | | | | | | | 312,554 | | | | | | | | | | | | | | | | 22,600 | | | | | | | | 1,113,276 | |
KBR, Inc. | | | | | | | | | | | | | 54,775 | | | | | | | | 725,221 | | | | | | 21,240 | | | | | | | | 281,218 | | �� | | | | | | | | | | | | | | 76,015 | | | | | | | | 1,006,439 | |
MYR Group, Inc. | | | | | | | | | | | | | 33,125 | | | | | | | | 797,650 | | | | | | 13,905 | | | | | | | | 334,832 | | | | | | | | | | | | | | | | 47,030 | | | | | | | | 1,132,482 | |
Quanta Services, Inc. | | | | | | | | | | | | | 34,185 | | | | | | | | 790,357 | | | | | | 13,655 | | | | | | | | 315,704 | | | | | | | | | | | | | | | | 47,840 | | | | | | | | 1,106,061 | |
Tutor Perini Corp. | | | | | | | | | | | | | 34,115 | | | | | | | | 803,408 | | | | | | 13,625 | | | | | | | | 320,869 | | | | | | | | | | | | | | | | 47,740 | | | | | | | | 1,124,277 | |
Consumer Finance | | | | | | | | | | | | | | | | | | | | | | | | | | | | | | | | | | | | | | | | | | | | | | | | | | | | | | | | | | | | |
Navient Corp. | | | | | | | | | | | | | 66,735 | | | | | | | | 797,483 | | | | | | 26,980 | | | | | | | | 322,411 | | | | | | | | | | | | | | | | 93,715 | | | | | | | | 1,119,894 | |
Nelnet, Inc. | | | | | | | | | | | | | 19,835 | | | | | | | | 689,266 | | | | | | 7,845 | | | | | | | | 272,614 | | | | | | | | | | | | | | | | 27,680 | | | | | | | | 961,880 | |
Containers & Packaging | | | | | | | | | | | | | | | | | | | | | | | | | | | | | | | | | | | | | | | | | | | | | | | | | | | | | | | | | | | | |
Greif, Inc. | | | | | | | | | | | | | 20,585 | | | | | | | | 767,203 | | | | | | 8,225 | | | | | | | | 306,546 | | | | | | | | | | | | | | | | 28,810 | | | | | | | | 1,073,749 | |
Sonoco Products Co. | | | | | | | | | | | | | 16,890 | | | | | | | | 838,757 | | | | | | 6,690 | | | | | | | | 332,225 | | | | | | | | | | | | | | | | 23,580 | | | | | | | | 1,170,982 | |
Diversified Consumer Services | | | | | | | | | | | | | | | | | | | | | | | | | | | | | | | | | | | | | | | | | | | | | | | | | | | | | | | | | | | | |
American Public Education, Inc. | | | | | | | | | | | | | 24,670 | | | | | | | | 693,227 | | | | | | 9,855 | | | | | | | | 276,926 | | | | | | | | | | | | | | | | 34,525 | | | | | | | | 970,153 | |
Capella Education Co. | | | | | | | | | | | | | 16,158 | | | | | | | | 850,557 | | | | | | 6,505 | | | | | | | | 342,423 | | | | | | | | | | | | | | | | 22,663 | | | | | | | | 1,192,980 | |
DeVry Education Group, Inc. | | | | | | | | | | | | | 39,190 | | | | | | | | 699,150 | | | | | | 17,815 | | | | | | | | 317,820 | | | | | | | | | | | | | | | | 57,005 | | | | | | | | 1,016,970 | |
K12, Inc. | | | | | | | | | | | | | 48,427 | | | | | | | | 604,853 | | | | | | 18,965 | | | | | | | | 236,873 | | | | | | | | | | | | | | | | 67,392 | | | | | | | | 841,726 | |
Regis Corp. | | | | | | | | | | | | | 53,455 | | | | | | | | 665,515 | | | | | | 21,355 | | | | | | | | 265,870 | | | | | | | | | | | | | | | | 74,810 | | | | | | | | 931,385 | |
Strayer Education, Inc. | | | | | | | | | | | | | 16,784 | | | | | | | | 824,598 | | | | | | 6,510 | | | | | | | | 319,836 | | | | | | | | | | | | | | | | 23,294 | | | | | | | | 1,144,434 | |
Diversified Telecommunication Services | | | | | | | | | | | | | | | | | | | | | | | | | | | | | | | | | | | | | | | | | | | | | | | | | | | | | | | | | | | | |
Inteliquent, Inc. | | | | | | | | | | | | | 38,950 | | | | | | | | 774,715 | | | | | | 15,560 | | | | | | | | 309,488 | | | | | | | | | | | | | | | | 54,510 | | | | | | | | 1,084,203 | |
Vonage Holdings Corp. | | | | | | | | | | | | | 141,370 | | | | | | | | 862,357 | | | | | | 56,475 | | | | | | | | 344,498 | | | | | | | | | | | | | | | | 197,845 | | | | | | | | 1,206,855 | |
Electric Utilities | | | | | | | | | | | | | | | | | | | | | | | | | | | | | | | | | | | | | | | | | | | | | | | | | | | | | | | | | | | | |
ALLETE, Inc. | | | | | | | | | | | | | 13,340 | | | | | | | | 862,164 | | | | | | 5,555 | | | | | | | | 359,020 | | | | | | | | | | | | | | | | 18,895 | | | | | | | | 1,221,184 | |
Electrical Equipment | | | | | | | | | | | | | | | | | | | | | | | | | | | | | | | | | | | | | | | | | | | | | | | | | | | | | | | | | | | | |
General Cable Corp. | | | | | | | | | | | | | 58,030 | | | | | | | | 737,562 | | | | | | 22,850 | | | | | | | | 290,423 | | | | | | | | | | | | | | | | 80,880 | | | | | | | | 1,027,985 | |
Regal Beloit Corp. | | | | | | | | | | | | | 14,045 | | | | | | | | 773,177 | | | | | | 5,445 | | | | | | | | 299,747 | | | | | | | | | | | | | | | | 19,490 | | | | | | | | 1,072,924 | |
Electronic Equipment, Instruments & Components | | | | | | | | | | | | | | | | | | | | | | | | | | | | | | | | | | | | | | | | | | | | | | | | | | | | | | | | | | | | |
AVX Corp. | | | | | | | | | | | | | 40,985 | | | | | | | | 556,576 | | | | | | 17,430 | | | | | | | | 236,699 | | | | | | | | | | | | | | | | 58,415 | | | | | | | | 793,275 | |
Benchmark Electronics, Inc. | | | | | | | | | | | | | 36,795 | | | | | | | | 778,214 | | | | | | 14,700 | | | | | | | | 310,905 | | | | | | | | | | | | | | | | 51,495 | | | | | | | | 1,089,119 | |
Celestica, Inc. | | | | | | | | | | | | | 67,865 | | | | | | | | 631,145 | | | | | | 27,110 | | | | | | | | 252,123 | | | | | | | | | | | | | | | | 94,975 | | | | | | | | 883,268 | |
Coherent, Inc. | | | | | | | | | | | | | 8,945 | | | | | | | | 820,972 | | | | | | 3,470 | | | | | | | | 318,477 | | | | | | | | | | | | | | | | 12,415 | | | | | | | | 1,139,449 | |
Insight Enterprises, Inc. | | | | | | | | | | | | | 30,070 | | | | | | | | 781,820 | | | | | | 12,010 | | | | | | | | 312,260 | | | | | | | | | | | | | | | | 42,080 | | | | | | | | 1,094,080 | |
Methode Electronics, Inc. | | | | | | | | | | | | | 25,770 | | | | | | | | 882,107 | | | | | | 10,795 | | | | | | | | 369,513 | | | | | | | | | | | | | | | | 36,565 | | | | | | | | 1,251,620 | |
MTS Systems Corp. | | | | | | | | | | | | | 17,145 | | | | | | | | 751,637 | | | | | | 6,715 | | | | | | | | 294,386 | | | | | | | | | | | | | | | | 23,860 | | | | | | | | 1,046,023 | |
Orbotech, Ltd. | | | | | | | | | | | | | 31,300 | | | | | | | | 799,715 | | | | | | 12,855 | | | | | | | | 328,445 | | | | | | | | | | | | | | | | 44,155 | | | | | | | | 1,128,160 | |
S-37
| | | | | | | | | | | | | | | | | | | | | | | | | | | | | | | | | | | | | | | | | | | | | | | | | | | | | | | | | | | | |
| | | | | | | | | | | TPP Master | | | | | TAF Destination | | | | | Adjustments | | | | | Combined Pro Forma Destination | |
| | | Coupon
Rate | | | Maturity
Date | | | | | Shares | | | | | | Value | | | | | Shares | | | | | | Value | | | | | Shares | | | Value | | | | | Shares | | | | | | Value | |
| | | | | | | | | | | | | | | | | | | | | | |
Plexus Corp. | | | | | | | | | | | | | 18,300 | | | | | | | $ | 790,560 | | | | | | 7,310 | | | | | | | $ | 315,792 | | | | | | | | | | | | | | | | 25,610 | | | | | | | $ | 1,106,352 | |
Rogers Corp. | | | | | | | | | | | | | 13,310 | | | | | | | | 813,241 | | | | | | 5,315 | | | | | | | | 324,747 | | | | | | | | | | | | | | | | 18,625 | | | | | | | | 1,137,988 | |
Sanmina Corp. | | | | | | | | | | | | | 29,265 | | | | | | | | 784,595 | | | | | | 11,690 | | | | | | | | 313,409 | | | | | | | | | | | | | | | | 40,955 | | | | | | | | 1,098,004 | |
ScanSource, Inc. | | | | | | | | | | | | | 21,320 | | | | | | | | 791,185 | | | | | | 8,545 | | | | | | | | 317,105 | | | | | | | | | | | | | | | | 29,865 | | | | | | | | 1,108,290 | |
SYNNEX Corp. | | | | | | | | | | | | | 8,765 | | | | | | | | 831,097 | | | | | | 3,500 | | | | | | | | 331,870 | | | | | | | | | | | | | | | | 12,265 | | | | | | | | 1,162,967 | |
Tech Data Corp. | | | | | | | | | | | | | 9,870 | | | | | | | | 709,160 | | | | | | 3,940 | | | | | | | | 283,089 | | | | | | | | | | | | | | | | 13,810 | | | | | | | | 992,249 | |
TTM Technologies, Inc. | | | | | | | | | | | | | 102,039 | | | | | | | | 768,354 | | | | | | 40,935 | | | | | | | | 308,241 | | | | | | | | | | | | | | | | 142,974 | | | | | | | | 1,076,595 | |
VeriFone Systems, Inc. | | | | | | | | | | | | | 42,265 | | | | | | | | 783,593 | | | | | | 16,885 | | | | | | | | 313,048 | | | | | | | | | | | | | | | | 59,150 | | | | | | | | 1,096,641 | |
Vishay Intertechnology, Inc. | | | | | | | | | | | | | 62,555 | | | | | | | | 775,056 | | | | | | 24,285 | | | | | | | | 300,891 | | | | | | | | | | | | | | | | 86,840 | | | | | | | | 1,075,947 | |
Energy Equipment & Services | | | | | | | | | | | | | | | | | | | | | | | | | | | | | | | | | | | | | | | | | | | | | | | | | | | | | | | | | | | | |
Diamond Offshore Drilling, Inc. | | | | | | | | | | | | | 31,870 | | | | | | | | 775,397 | | | | | | 12,730 | | | | | | | | 309,721 | | | | | | | | | | | | | | | | 44,600 | | | | | | | | 1,085,118 | |
Ensco PLC | | | | | | | | | | | | | 76,450 | | | | | | | | 742,330 | | | | | | 30,540 | | | | | | | | 296,543 | | | | | | | | | | | | | | | | 106,990 | | | | | | | | 1,038,873 | |
Matrix Service Co. | | | | | | | | | | | | | 43,910 | | | | | | | | 724,076 | | | | | | 17,825 | | | | | | | | 293,934 | | | | | | | | | | | | | | | | 61,735 | | | | | | | | 1,018,010 | |
McDermott International, Inc. | | | | | | | | | | | | | 160,660 | | | | | | | | 793,660 | | | | | | 64,180 | | | | | | | | 317,049 | | | | | | | | | | | | | | | | 224,840 | | | | | | | | 1,110,709 | |
Nabors Industries, Ltd. | | | | | | | | | | | | | 76,385 | | | | | | | | 767,669 | | | | | | 30,515 | | | | | | | | 306,676 | | | | | | | | | | | | | | | | 106,900 | | | | | | | | 1,074,345 | |
Noble Corp. PLC | | | | | | | | | | | | | 89,780 | | | | | | | | 739,787 | | | | | | 35,865 | | | | | | | | 295,528 | | | | | | | | | | | | | | | | 125,645 | | | | | | | | 1,035,315 | |
Rowan Cos. PLC | | | | | | | | | | | | | 42,155 | | | | | | | | 744,457 | | | | | | 16,840 | | | | | | | | 297,394 | | | | | | | | | | | | | | | | 58,995 | | | | | | | | 1,041,851 | |
Transocean, Ltd. | | | | | | | | | | | | | 72,295 | | | | | | | | 859,588 | | | | | | 28,880 | | | | | | | | 343,383 | | | | | | | | | | | | | | | | 101,175 | | | | | | | | 1,202,971 | |
Food & Staples Retailing | | | | | | | | | | | | | | | | | | | | | | | | | | | | | | | | | | | | | | | | | | | | | | | | | | | | | | | | | | | | |
SpartanNash Co. | | | | | | | | | | | | | 27,240 | | | | | | | | 832,999 | | | | | | 10,565 | | | | | | | | 323,078 | | | | | | | | | | | | | | | | 37,805 | | | | | | | | 1,156,077 | |
SUPERVALU, Inc. | | | | | | | | | | | | | 175,195 | | | | | | | | 826,921 | | | | | | 68,605 | | | | | | | | 323,815 | | | | | | | | | | | | | | | | 243,800 | | | | | | | | 1,150,736 | |
United Natural Foods, Inc. | | | | | | | | | | | | | 18,020 | | | | | | | | 843,336 | | | | | | 7,200 | | | | | | | | 336,960 | | | | | | | | | | | | | | | | 25,220 | | | | | | | | 1,180,296 | |
Food Products | | | | | | | | | | | | | | | | | | | | | | | | | | | | | | | | | | | | | | | | | | | | | | | | | | | | | | | | | | | | |
Dean Foods Co. | | | | | | | | | | | | | 44,675 | | | | | | | | 808,171 | | | | | | 17,670 | | | | | | | | 319,650 | | | | | | | | | | | | | | | | 62,345 | | | | | | | | 1,127,821 | |
Fresh Del Monte Produce, Inc. | | | | | | | | | | | | | 14,975 | | | | | | | | 815,089 | | | | | | 5,980 | | | | | | | | 325,491 | | | | | | | | | | | | | | | | 20,955 | | | | | | | | 1,140,580 | |
Lancaster Colony Corp. | | | | | | | | | | | | | 6,550 | | | | | | | | 835,845 | | | | | | 2,615 | | | | | | | | 333,700 | | | | | | | | | | | | | | | | 9,165 | | | | | | | | 1,169,545 | |
Sanderson Farms, Inc. | | | | | | | | | | | | | 9,940 | | | | | | | | 861,202 | | | | | | 3,970 | | | | | | | | 343,961 | | | | | | | | | | | | | | | | 13,910 | | | | | | | | 1,205,163 | |
Gas Utilities | | | | | | | | | | | | | | | | | | | | | | | | | | | | | | | | | | | | | | | | | | | | | | | | | | | | | | | | | | | | |
Southwest Gas Corp. | | | | | | | | | | | | | 11,025 | | | | | | | | 867,778 | | | | | | 4,405 | | | | | | | | 346,718 | | | | | | | | | | | | | | | | 15,430 | | | | | | | | 1,214,496 | |
Health Care Equipment & Supplies | | | | | | | | | | | | | | | | | | | | | | | | | | | | | | | | | | | | | | | | | | | | | | | | | | | | | | | | | | | | |
Analogic Corp. | | | | | | | | | | | | | 9,465 | | | | | | | | 751,900 | | | | | | 3,860 | | | | | | | | 306,638 | | | | | | | | | | | | | | | | 13,325 | | | | | | | | 1,058,538 | |
AngioDynamics, Inc. | | | | | | | | | | | | | 41,480 | | | | | | | | 596,068 | | | | | | 16,570 | | | | | | | | 238,111 | | | | | | | | | | | | | | | | 58,050 | | | | | | | | 834,179 | |
Anika Therapeutics, Inc. | | | | | | | | | | | | | 16,130 | | | | | | | | 865,374 | | | | | | 6,445 | | | | | | | | 345,774 | | | | | | | | | | | | | | | | 22,575 | | | | | | | | 1,211,148 | |
Haemonetics Corp. | | | | | | | | | | | | | 27,315 | | | | | | | | 791,862 | | | | | | 10,915 | | | | | | | | 316,426 | | | | | | | | | | | | | | | | 38,230 | | | | | | | | 1,108,288 | |
ICU Medical, Inc. | | | | | | | | | | | | | 7,620 | | | | | | | | 859,155 | | | | | | 3,075 | | | | | | | | 346,706 | | | | | | | | | | | | | | | | 10,695 | | | | | | | | 1,205,861 | |
LeMaitre Vascular, Inc. | | | | | | | | | | | | | 35,235 | | | | | | | | 502,803 | | | | | | 13,935 | | | | | | | | 198,852 | | | | | | | | | | | | | | | | 49,170 | | | | | | | | 701,655 | |
Meridian Bioscience, Inc. | | | | | | | | | | | | | 43,480 | | | | | | | | 847,860 | | | | | | 17,025 | | | | | | | | 331,988 | | | | | | | | | | | | | | | | 60,505 | | | | | | | | 1,179,848 | |
Merit Medical Systems, Inc. | | | | | | | | | | | | | 40,485 | | | | | | | | 802,817 | | | | | | 15,700 | | | | | | | | 311,331 | | | | | | | | | | | | | | | | 56,185 | | | | | | | | 1,114,148 | |
Natus Medical, Inc. | | | | | | | | | | | | | 22,550 | | | | | | | | 852,390 | | | | | | 9,010 | | | | | | | | 340,578 | | | | | | | | | | | | | | | | 31,560 | | | | | | | | 1,192,968 | |
OraSure Technologies, Inc. | | | | | | | | | | | | | 120,085 | | | | | | | | 709,702 | | | | | | 47,025 | | | | | | | | 277,918 | | | | | | | | | | | | | | | | 167,110 | | | | | | | | 987,620 | |
SurModics, Inc. | | | | | | | | | | | | | 24,070 | | | | | | | | 565,164 | | | | | | 9,615 | | | | | | | | 225,760 | | | | | | | | | | | | | | | | 33,685 | | | | | | | | 790,924 | |
Health Care Providers & Services | | | | | | | | | | | | | | | | | | | | | | | | | | | | | | | | | | | | | | | | | | | | | | | | | | | | | | | | | | | | |
Aceto Corp. | | | | | | | | | | | | | 35,845 | | | | | | | | 784,647 | | | | | | 13,900 | | | | | | | | 304,271 | | | | | | | | | | | | | | | | 49,745 | | | | | | | | 1,088,918 | |
Almost Family, Inc. | | | | | | | | | | | | | 16,160 | | | | | | | | 688,578 | | | | | | 6,455 | | | | | | | | 275,047 | | | | | | | | | | | | | | | | 22,615 | | | | | | | | 963,625 | |
Amedisys, Inc. | | | | | | | | | | | | | 16,190 | | | | | | | | 817,271 | | | | | | 6,465 | | | | | | | | 326,353 | | | | | | | | | | | | | | | | 22,655 | | | | | | | | 1,143,624 | |
Amsurg Corp. | | | | | | | | | | | | | 10,090 | | | | | | | | 782,379 | | | | | | 4,140 | | | | | | | | 321,016 | | | | | | | | | | | | | | | | 14,230 | | | | | | | | 1,103,395 | |
Chemed Corp. | | | | | | | | | | | | | 5,932 | | | | | | | | 808,591 | | | | | | 2,300 | | | | | | | | 313,513 | | | | | | | | | | | | | | | | 8,232 | | | | | | | | 1,122,104 | |
Community Health Systems, Inc. | | | | | | | | | | | | | 59,335 | | | | | | | | 714,987 | | | | | | 23,705 | | | | | | | | 285,645 | | | | | | | | | | | | | | | | 83,040 | | | | | | | | 1,000,632 | |
HealthSouth Corp. | | | | | | | | | | | | | 20,190 | | | | | | | | 783,776 | | | | | | 8,140 | | | | | | | | 315,995 | | | | | | | | | | | | | | | | 28,330 | | | | | | | | 1,099,771 | |
Healthways, Inc. | | | | | | | | | | | | | 46,930 | | | | | | | | 542,041 | | | | | | 18,745 | | | | | | | | 216,505 | | | | | | | | | | | | | | | | 65,675 | | | | | | | | 758,546 | |
Kindred Healthcare, Inc. | | | | | | | | | | | | | 61,135 | | | | | | | | 690,214 | | | | | | 28,410 | | | | | | | | 320,749 | | | | | | | | | | | | | | | | 89,545 | | | | | | | | 1,010,963 | |
Landauer, Inc. | | | | | | | | | | | | | 14,265 | | | | | | | | 587,147 | | | | | | 5,700 | | | | | | | | 234,612 | | | | | | | | | | | | | | | | 19,965 | | | | | | | | 821,759 | |
LHC Group, Inc. | | | | | | | | | | | | | 19,210 | | | | | | | | 831,409 | | | | | | 7,675 | | | | | | | | 332,174 | | | | | | | | | | | | | | | | 26,885 | | | | | | | | 1,163,583 | |
LifePoint Health, Inc. | | | | | | | | | | | | | 11,950 | | | | | | | | 781,171 | | | | | | 4,635 | | | | | | | | 302,990 | | | | | | | | | | | | | | | | 16,585 | | | | | | | | 1,084,161 | |
Magellan Health, Inc. | | | | | | | | | | | | | 11,885 | | | | | | | | 781,676 | | | | | | 4,700 | | | | | | | | 309,119 | | | | | | | | | | | | | | | | 16,585 | | | | | | | | 1,090,795 | |
Molina Healthcare, Inc. | | | | | | | | | | | | | 16,095 | | | | | | | | 803,140 | | | | | | 6,430 | | | | | | | | 320,857 | | | | | | | | | | | | | | | | 22,525 | | | | | | | | 1,123,997 | |
Owens & Minor, Inc. | | | | | | | | | | | | | 21,750 | | | | | | | | 813,015 | | | | | | 8,810 | | | | | | | | 329,318 | | | | | | | | | | | | | | | | 30,560 | | | | | | | | 1,142,333 | |
PharMerica Corp. | | | | | | | | | | | | | 33,880 | | | | | | | | 835,481 | | | | | | 13,140 | | | | | | | | 324,032 | | | | | | | | | | | | | | | | 47,020 | | | | | | | | 1,159,513 | |
Triple-S Management Corp. | | | | | | | | | | | | | 27,997 | | | | | | | | 683,967 | | | | | | 11,185 | | | | | | | | 273,250 | | | | | | | | | | | | | | | | 39,182 | | | | | | | | 957,217 | |
US Physical Therapy, Inc. | | | | | | | | | | | | | 13,855 | | | | | | | | 834,210 | | | | | | 5,535 | | | | | | | | 333,262 | | | | | | | | | | | | | | | | 19,390 | | | | | | | | 1,167,472 | |
VCA, Inc. | | | | | | | | | | | | | 12,175 | | | | | | | | 823,152 | | | | | | 4,865 | | | | | | | | 328,923 | | | | | | | | | | | | | | | | 17,040 | | | | | | | | 1,152,075 | |
WellCare Health Plans, Inc. | | | | | | | | | | | | | 7,705 | | | | | | | | 826,592 | | | | | | 3,080 | | | | | | | | 330,422 | | | | | | | | | | | | | | | | 10,785 | | | | | | | | 1,157,014 | |
Health Care Technology | | | | | | | | | | | | | | | | | | | | | | | | | | | | | | | | | | | | | | | | | | | | | | | | | | | | | | | | | | | | |
Allscripts Healthcare Solutions, Inc. | | | | | | | | | | | | | 60,520 | | | | | | | | 768,604 | | | | | | 23,470 | | | | | | | | 298,069 | | | | | | | | | | | | | | | | 83,990 | | | | | | | | 1,066,673 | |
HMS Holdings Corp. | | | | | | | | | | | | | 44,840 | | | | | | | | 789,632 | | | | | | 17,915 | | | | | | | | 315,483 | | | | | | | | | | | | | | | | 62,755 | | | | | | | | 1,105,115 | |
Quality Systems, Inc. | | | | | | | | | | | | | 68,225 | | | | | | | | 812,560 | | | | | | 27,255 | | | | | | | | 324,607 | | | | | | | | | | | | | | | | 95,480 | | | | | | | | 1,137,167 | |
Hotels, Restaurants & Leisure | | | | | | | | | | | | | | | | | | | | | | | | | | | | | | | | | | | | | | | | | | | | | | | | | | | | | | | | | | | | |
Bob Evans Farms, Inc. | | | | | | | | | | | | | 20,765 | | | | | | | | 788,032 | | | | | | 8,295 | | | | | | | | 314,795 | | | | | | | | | | | | | | | | 29,060 | | | | | | | | 1,102,827 | |
Brinker International, Inc. | | | | | | | | | | | | | 16,500 | | | | | | | | 751,245 | | | | | | 6,525 | | | | | | | | 297,083 | | | | | | | | | | | | | | | | 23,025 | | | | | | | | 1,048,328 | |
Cheesecake Factory, Inc. | | | | | | | | | | | | | 16,700 | | | | | | | | 803,938 | | | | | | 6,540 | | | | | | | | 314,836 | | | | | | | | | | | | | | | | 23,240 | | | | | | | | 1,118,774 | |
Household Durables | | | | | | | | | | | | | | | | | | | | | | | | | | | | | | | | | | | | | | | | | | | | | | | | | | | | | | | | | | | | |
Ethan Allen Interiors, Inc. | | | | | | | | | | | | | 24,975 | | | | | | | | 825,174 | | | | | | 10,535 | | | | | | | | 348,076 | | | | | | | | | | | | | | | | 35,510 | | | | | | | | 1,173,250 | |
iRobot Corp. | | | | | | | | | | | | | 22,785 | | | | | | | | 799,298 | | | | | | 9,100 | | | | | | | | 319,228 | | | | | | | | | | | | | | | | 31,885 | | | | | | | | 1,118,526 | |
La-Z-Boy, Inc. | | | | | | | | | | | | | 29,405 | | | | | | | | 818,047 | | | | | | 11,900 | | | | | | | | 331,058 | | | | | | | | | | | | | | | | 41,305 | | | | | | | | 1,149,105 | |
Independent Power & Renewable Electricity Producers | | | | | | | | | | | | | | | | | | | | | | | | | | | | | | | | | | | | | | | | | | | | | | | | | | | | | | | | | | | | |
NRG Energy, Inc. | | | | | | | | | | | | | 52,805 | | | | | | | | 791,547 | | | | | | 20,680 | | | | | | | | 309,993 | | | | | | | | | | | | | | | | 73,485 | | | | | | | | 1,101,540 | |
Insurance | | | | | | | | | | | | | | | | | | | | | | | | | | | | | | | | | | | | | | | | | | | | | | | | | | | | | | | | | | | | |
Aspen Insurance Holdings, Ltd. | | | | | | | | | | | | | 16,850 | | | | | | | | 781,503 | | | | | | 6,665 | | | | | | | | 309,123 | | | | | | | | | | | | | | | | 23,515 | | | | | | | | 1,090,626 | |
Employers Holdings, Inc. | | | | | | | | | | | | | 27,030 | | | | | | | | 784,411 | | | | | | 10,480 | | | | | | | | 304,130 | | | | | | | | | | | | | | | | 37,510 | | | | | | | | 1,088,541 | |
Hanover Insurance Group, Inc. | | | | | | | | | | | | | 9,610 | | | | | | | | 813,198 | | | | | | 3,765 | | | | | | | | 318,594 | | | | | | | | | | | | | | | | 13,375 | | | | | | | | 1,131,792 | |
Old Republic International Corp. | | | | | | | | | | | | | 42,970 | | | | | | | | 828,891 | | | | | | 16,995 | | | | | | | | 327,834 | | | | | | | | | | | | | | | | 59,965 | | | | | | | | 1,156,725 | |
United Fire Group, Inc. | | | | | | | | | | | | | 16,438 | | | | | | | | 697,464 | | | | | | 6,565 | | | | | | | | 278,553 | | | | | | | | | | | | | | | | 23,003 | | | | | | | | 976,017 | |
Internet & Catalog Retail | | | | | | | | | | | | | | | | | | | | | | | | | | | | | | | | | | | | | | | | | | | | | | | | | | | | | | | | | | | | |
Blue Nile, Inc. | | | | | | | | | | | | | 25,805 | | | | | | | | 706,541 | | | | | | 10,105 | | | | | | | | 276,675 | | | | | | | | | | | | | | | | 35,910 | | | | | | | | 983,216 | |
Internet Software & Services | | | | | | | | | | | | | | | | | | | | | | | | | | | | | | | | | | | | | | | | | | | | | | | | | | | | | | | | | | | | |
Bankrate, Inc. | | | | | | | | | | | | | 105,935 | | | | | | | | 792,394 | | | | | | 42,320 | | | | | | | | 316,554 | | | | | | | | | | | | | | | | 148,255 | | | | | | | | 1,108,948 | |
DHI Group, Inc. | | | | | | | | | | | | | 99,560 | | | | | | | | 620,259 | | | | | | 39,770 | | | | | | | | 247,767 | | | | | | | | | | | | | | | | 139,330 | | | | | | | | 868,026 | |
EarthLink Holdings Corp. | | | | | | | | | | | | | 125,635 | | | | | | | | 804,064 | | | | | | 50,190 | | | | | | | | 321,216 | | | | | | | | | | | | | | | | 175,825 | | | | | | | | 1,125,280 | |
MeetMe, Inc. | | | | | | | | | | | | | 173,510 | | | | | | | | 924,808 | | | | | | 69,315 | | | | | | | | 369,449 | | | | | | | | | | | | | | | | 242,825 | | | | | | | | 1,294,257 | |
Monster Worldwide, Inc. | | | | | | | | | | | | | 258,335 | | | | | | | | 617,421 | | | | | | 103,200 | | | | | | | | 246,648 | | | | | | | | | | | | | | | | 361,535 | | | | | | | | 864,069 | |
IT Services | | | | | | | | | | | | | | | | | | | | | | | | | | | | | | | | | | | | | | | | | | | | | | | | | | | | | | | | | | | | |
Convergys Corp. | | | | | | | | | | | | | 28,925 | | | | | | | | 723,125 | | | | | | 11,215 | | | | | | | | 280,375 | | | | | | | | | | | | | | | | 40,140 | | | | | | | | 1,003,500 | |
CSG Systems International, Inc. | | | | | | | | | | | | | 19,593 | | | | | | | | 789,794 | | | | | | 7,600 | | | | | | | | 306,356 | | | | | | | | | | | | | | | | 27,193 | | | | | | | | 1,096,150 | |
Hackett Group, Inc. | | | | | | | | | | | | | 49,745 | | | | | | | | 689,963 | | | | | | 17,550 | | | | | | | | 243,419 | | | | | | | | | | | | | | | | 67,295 | | | | | | | | 933,382 | |
Leidos Holdings, Inc. | | | | | | | | | | | | | 17,385 | | | | | | | | 832,220 | | | | | | 6,945 | | | | | | | | 332,457 | | | | | | | | | | | | | | | | 24,330 | | | | | | | | 1,164,677 | |
ManTech International Corp. | | | | | | | | | | | | | 22,230 | | | | | | | | 840,738 | | | | | | 8,880 | | | | | | | | 335,842 | | | | | | | | | | | | | | | | 31,110 | | | | | | | | 1,176,580 | |
Sykes Enterprises, Inc. | | | | | | | | | | | | | 25,633 | | | | | | | | 742,332 | | | | | | 10,525 | | | | | | | | 304,804 | | | | | | | | | | | | | | | | 36,158 | | | | | | | | 1,047,136 | |
Teradata Corp. | | | | | | | | | | | | | 28,855 | | | | | | | | 723,395 | | | | | | 11,525 | | | | | | | | 288,932 | | | | | | | | | | | | | | | | 40,380 | | | | | | | | 1,012,327 | |
Life Sciences Tools & Services | | | | | | | | | | | | | | | | | | | | | | | | | | | | | | | | | | | | | | | | | | | | | | | | | | | | | | | | | | | | |
Bio-Rad Laboratories, Inc. | | | | | | | | | | | | | 5,740 | | | | | | | | 820,935 | | | | | | 2,225 | | | | | | | | 318,219 | | | | | | | | | | | | | | | | 7,965 | | | | | | | | 1,139,154 | |
Bruker Corp. | | | | | | | | | | | | | 33,775 | | | | | | | | 768,043 | | | | | | 13,495 | | | | | | | | 306,876 | | | | | | | | | | | | | | | | 47,270 | | | | | | | | 1,074,919 | |
Cambrex Corp. | | | | | | | | | | | | | 16,645 | | | | | | | | 861,046 | | | | | | 6,650 | | | | | | | | 344,005 | | | | | | | | | | | | | | | | 23,295 | | | | | | | | 1,205,051 | |
Charles River Laboratories International, Inc. | | | | | | | | | | | | | 9,155 | | | | | | | | 754,738 | | | | | | 3,800 | | | | | | | | 313,272 | | | | | | | | | | | | | | | | 12,955 | | | | | | | | 1,068,010 | |
ICON PLC | | | | | | | | | | | | | 12,225 | | | | | | | | 855,872 | | | | | | 5,100 | | | | | | | | 357,051 | | | | | | | | | | | | | | | | 17,325 | | | | | | | | 1,212,923 | |
Luminex Corp. | | | | | | | | | | | | | 41,755 | | | | | | | | 844,704 | | | | | | 16,350 | | | | | | | | 330,761 | | | | | | | | | | | | | | | | 58,105 | | | | | | | | 1,175,465 | |
PAREXEL International Corp. | | | | | | | | | | | | | 13,620 | | | | | | | | 856,426 | | | | | | 5,525 | | | | | | | | 347,412 | | | | | | | | | | | | | | | | 19,145 | | | | | | | | 1,203,838 | |
Machinery | | | | | | | | | | | | | | | | | | | | | | | | | | | | | | | | | | | | | | | | | | | | | | | | | | | | | | | | | | | | |
AGCO Corp. | | | | | | | | | | | | | 15,155 | | | | | | | | 714,255 | | | | | | 5,875 | | | | | | | | 276,889 | | | | | | | | | | | | | | | �� | 21,030 | | | | | | | | 991,144 | |
Alamo Group, Inc. | | | | | | | | | | | | | 12,860 | | | | | | | | 848,374 | | | | | | 4,785 | | | | | | | | 315,666 | | | | | | | | | | | | | | | | 17,645 | | | | | | | | 1,164,040 | |
Altra Industrial Motion Corp. | | | | | | | | | | | | | 29,175 | | | | | | | | 787,142 | | | | | | 12,015 | | | | | | | | 324,165 | | | | | | | | | | | | | | | | 41,190 | | | | | | | | 1,111,307 | |
Briggs & Stratton Corp. | | | | | | | | | | | | | 39,030 | | | | | | | | 826,655 | | | | | | 15,285 | | | | | | | | 323,736 | | | | | | | | | | | | | | | | 54,315 | | | | | | | | 1,150,391 | |
Joy Global, Inc. | | | | | | | | | | | | | 36,210 | | | | | | | | 765,479 | | | | | | 14,465 | | | | | | | | 305,790 | | | | | | | | | | | | | | | | 50,675 | | | | | | | | 1,071,269 | |
Kennametal, Inc. | | | | | | | | | | | | | 33,410 | | | | | | | | 738,695 | | | | | | 13,345 | | | | | | | | 295,058 | | | | | | | | | | | | | | | | 46,755 | | | | | | | | 1,033,753 | |
Timken Co. | | | | | | | | | | | | | 24,900 | | | | | | | | 763,434 | | | | | | 9,750 | | | | | | | | 298,935 | | | | | | | | | | | | | | | | 34,650 | | | | | | | | 1,062,369 | |
Wabash National Corp. | | | | | | | | | | | | | 63,335 | | | | | | | | 804,355 | | | | | | 24,710 | | | | | | | | 313,817 | | | | | | | | | | | | | | | | 88,045 | | | | | | | | 1,118,172 | |
S-38
| | | | | | | | | | | | | | | | | | | | | | | | | | | | | | | | | | | | | | | | | | | | | | | | | | | | | | | | | | | | |
| | | | | | | | | | | TPP Master | | | | | TAF Destination | | | | | Adjustments | | | | | Combined Pro Forma Destination | |
| | | Coupon
Rate | | | Maturity
Date | | | | | Shares | | | | | | Value | | | | | Shares | | | | | | Value | | | | | Shares | | | Value | | | | | Shares | | | | | | Value | |
| | | | | | | | | | | | | | | | | | | | | | |
Metals & Mining | | | | | | | | | | | | | | | | | | | | | | | | | | | | | | | | | | | | | | | | | | | | | | | | | | | | | | | | | | | | |
Carpenter Technology Corp. | | | | | | | | | | | | | 24,037 | | | | | | | $ | 791,538 | | | | | | 9,600 | | | | | | | $ | 316,128 | | | | | | | | | | | | | | | | 33,637 | | | | | | | $ | 1,107,666 | |
Commercial Metals Co. | | | | | | | | | | | | | 49,800 | | | | | | | | 841,620 | | | | | | 20,090 | | | | | | | | 339,521 | | | | | | | | | | | | | | | | 69,890 | | | | | | | | 1,181,141 | |
Haynes International, Inc. | | | | | | | | | | | | | 20,895 | | | | | | | | 670,312 | | | | | | 8,265 | | | | | | | | 265,141 | | | | | | | | | | | | | | | | 29,160 | | | | | | | | 935,453 | |
Kaiser Aluminum Corp. | | | | | | | | | | | | | 8,940 | | | | | | | | 808,265 | | | | | | 3,735 | | | | | | | | 337,681 | | | | | | | | | | | | | | | | 12,675 | | | | | | | | 1,145,946 | |
Materion Corp. | | | | | | | | | | | | | 31,980 | | | | | | | | 791,825 | | | | | | 12,775 | | | | | | | | 316,309 | | | | | | | | | | | | | | | | 44,755 | | | | | | | | 1,108,134 | |
Olympic Steel, Inc. | | | | | | | | | | | | | 32,900 | | | | | | | | 898,499 | | | | | | 13,145 | | | | | | | | 358,990 | | | | | | | | | | | | | | | | 46,045 | | | | | | | | 1,257,489 | |
Reliance Steel & Aluminum Co. | | | | | | | | | | | | | 10,525 | | | | | | | | 809,373 | | | | | | 4,205 | | | | | | | | 323,365 | | | | | | | | | | | | | | | | 14,730 | | | | | | | | 1,132,738 | |
Schnitzer Steel Industries, Inc. | | | | | | | | | | | | | 48,000 | | | | | | | | 844,800 | | | | | | 17,995 | | | | | | | | 316,712 | | | | | | | | | | | | | | | | 65,995 | | | | | | | | 1,161,512 | |
Worthington Industries, Inc. | | | | | | | | | | | | | 20,700 | | | | | | | | 875,610 | | | | | | 8,270 | | | | | | | | 349,821 | | | | | | | | | | | | | | | | 28,970 | | | | | | | | 1,225,431 | |
Multi-Utilities | | | | | | | | | | | | | | | | | | | | | | | | | | | | | | | | | | | | | | | | | | | | | | | | | | | | | | | | | | | | |
Avista Corp. | | | | | | | | | | | | | 19,715 | | | | | | | | 883,232 | | | | | | 7,645 | | | | | | | | 342,496 | | | | | | | | | | | | | | | | 27,360 | | | | | | | | 1,225,728 | |
MDU Resources Group, Inc. | | | | | | | | | | | | | 34,730 | | | | | | | | 833,520 | | | | | | 13,875 | | | | | | | | 333,000 | | | | | | | | | | | | | | | | 48,605 | | | | | | | | 1,166,520 | |
Multiline Retail | | | | | | | | | | | | | | | | | | | | | | | | | | | | | | | | | | | | | | | | | | | | | | | | | | | | | | | | | | | | |
Big Lots, Inc. | | | | | | | | | | | | | 16,730 | | | | | | | | 838,341 | | | | | | 7,085 | | | | | | | | 355,028 | | | | | | | | | | | | | | | | 23,815 | | | | | | | | 1,193,369 | |
Dillard's, Inc. | | | | | | | | | | | | | 13,725 | | | | | | | | 831,735 | | | | | | 5,480 | | | | | | | | 332,088 | | | | | | | | | | | | | | | | 19,205 | | | | | | | | 1,163,823 | |
Fred's, Inc. | | | | | | | | | | | | | 37,975 | | | | | | | | 611,777 | | | | | | 15,170 | | | | | | | | 244,389 | | | | | | | | | | | | | | | | 53,145 | | | | | | | | 856,166 | |
Oil, Gas & Consumable Fuels | | | | | | | | | | | | | | | | | | | | | | | | | | | | | | | | | | | | | | | | | | | | | | | | | | | | | | | | | | | | |
Aegean Marine Petroleum Network, Inc. | | | | | | | | | | | | | 119,195 | | | | | | | | 655,572 | | | | | | 47,620 | | | | | | | | 261,910 | | | | | | | | | | | | | | | | 166,815 | | | | | | | | 917,482 | |
Alon USA Energy, Inc. | | | | | | | | | | | | | 120,495 | | | | | | | | 780,808 | | | | | | 48,135 | | | | | | | | 311,915 | | | | | | | | | | | | | | | | 168,630 | | | | | | | | 1,092,723 | |
CVR Energy, Inc. | | | | | | | | | | | | | 40,675 | | | | | | | | 630,463 | | | | | | 18,825 | | | | | | | | 291,788 | | | | | | | | | | | | | | | | 59,500 | | | | | | | | 922,251 | |
DHT Holdings, Inc. | | | | | | | | | | | | | 148,340 | | | | | | | | 746,150 | | | | | | 58,090 | | | | | | | | 292,193 | | | | | | | | | | | | | | | | 206,430 | | | | | | | | 1,038,343 | |
Renewable Energy Group, Inc. | | | | | | | | | | | | | 96,055 | | | | | | | | 848,166 | | | | | | 38,375 | | | | | | | | 338,851 | | | | | | | | | | | | | | | | 134,430 | | | | | | | | 1,187,017 | |
Tsakos Energy Navigation, Ltd. | | | | | | | | | | | | | 154,630 | | | | | | | | 725,215 | | | | | | 61,770 | | | | | | | | 289,701 | | | | | | | | | | | | | | | | 216,400 | | | | | | | | 1,014,916 | |
World Fuel Services Corp. | | | | | | | | | | | | | 17,450 | | | | | | | | 828,700 | | | | | | 7,295 | | | | | | | | 346,440 | | | | | | | | | | | | | | | | 24,745 | | | | | | | | 1,175,140 | |
Paper & Forest Products | | | | | | | | | | | | | | | | | | | | | | | | | | | | | | | | | | | | | | | | | | | | | | | | | | | | | | | | | | | | |
Domtar Corp. | | | | | | | | | | | | | 22,090 | | | | | | | | 773,371 | | | | | | 8,650 | | | | | | | | 302,837 | | | | | | | | | | | | | | | | 30,740 | | | | | | | | 1,076,208 | |
Mercer International, Inc. | | | | | | | | | | | | | 64,395 | | | | | | | | 513,872 | | | | | | 25,835 | | | | | | | | 206,163 | | | | | | | | | | | | | | | | 90,230 | | | | | | | | 720,035 | |
P.H. Glatfelter Co. | | | | | | | | | | | | | 32,870 | | | | | | | | 642,937 | | | | | | 13,130 | | | | | | | | 256,823 | | | | | | | | | | | | | | | | 46,000 | | | | | | | | 899,760 | |
Personal Products | | | | | | | | | | | | | | | | | | | | | | | | | | | | | | | | | | | | | | | | | | | | | | | | | | | | | | | | | | | | |
Medifast, Inc. | | | | | | | | | | | | | 25,105 | | | | | | | | 835,243 | | | | | | 10,030 | | | | | | | | 333,698 | | | | | | | | | | | | | | | | 35,135 | | | | | | | | 1,168,941 | |
Nu Skin Enterprises, Inc. | | | | | | | | | | | | | 17,335 | | | | | | | | 800,704 | | | | | | 6,925 | | | | | | | | 319,866 | | | | | | | | | | | | | | | | 24,260 | | | | | | | | 1,120,570 | |
Pharmaceuticals | | | | | | | | | | | | | | | | | | | | | | | | | | | | | | | | | | | | | | | | | | | | | | | | | | | | | | | | | | | | |
Impax Laboratories, Inc. | | | | | | | | | | | | | 27,175 | | | | | | | | 783,184 | | | | | | 10,855 | | | | | | | | 312,841 | | | | | | | | | | | | | | | | 38,030 | | | | | | | | 1,096,025 | |
SciClone Pharmaceuticals, Inc. | | | | | | | | | | | | | 61,370 | | | | | | | | 801,492 | | | | | | 25,690 | | | | | | | | 335,511 | | | | | | | | | | | | | | | | 87,060 | | | | | | | | 1,137,003 | |
Professional Services | | | | | | | | | | | | | | | | | | | | | | | | | | | | | | | | | | | | | | | | | | | | | | | | | | | | | | | | | | | | |
FTI Consulting, Inc. | | | | | | | | | | | | | 19,640 | | | | | | | | 798,955 | | | | | | 7,845 | | | | | | | | 319,135 | | | | | | | | | | | | | | | | 27,485 | | | | | | | | 1,118,090 | |
ICF International, Inc. | | | | | | | | | | | | | 16,780 | | | | | | | | 686,302 | | | | | | 6,705 | | | | | | | | 274,235 | | | | | | | | | | | | | | | | 23,485 | | | | | | | | 960,537 | |
Insperity, Inc. | | | | | | | | | | | | | 10,910 | | | | | | | | 842,579 | | | | | | 4,360 | | | | | | | | 336,723 | | | | | | | | | | | | | | | | 15,270 | | | | | | | | 1,179,302 | |
Kelly Services, Inc. | | | | | | | | | | | | | 35,010 | | | | | | | | 664,140 | | | | | | 13,985 | | | | | | | | 265,295 | | | | | | | | | | | | | | | | 48,995 | | | | | | | | 929,435 | |
Kforce, Inc. | | | | | | | | | | | | | 33,705 | | | | | | | | 569,277 | | | | | | 13,330 | | | | | | | | 225,144 | | | | | | | | | | | | | | | | 47,035 | | | | | | | | 794,421 | |
Resources Connection, Inc. | | | | | | | | | | | | | 38,325 | | | | | | | | 566,444 | | | | | | 15,975 | | | | | | | | 236,111 | | | | | | | | | | | | | | | | 54,300 | | | | | | | | 802,555 | |
Real Estate Investment Trusts | | | | | | | | | | | | | | | | | | | | | | | | | | | | | | | | | | | | | | | | | | | | | | | | | | | | | | | | | | | | |
Agree Realty Corp. | | | | | | | | | | | | | 18,330 | | | | | | | | 884,239 | | | | | | 7,325 | | | | | | | | 353,358 | | | | | | | | | | | | | | | | 25,655 | | | | | | | | 1,237,597 | |
Anworth Mortgage Asset Corp. | | | | | | | | | | | | | 149,445 | | | | | | | | 702,391 | | | | | | 59,700 | | | | | | | | 280,590 | | | | | | | | | | | | | | | | 209,145 | | | | | | | | 982,981 | |
ARMOUR Residential REIT, Inc. | | | | | | | | | | | | | 38,900 | | | | | | | �� | 778,000 | | | | | | 15,085 | | | | | | | | 301,700 | | | | | | | | | | | | | | | | 53,985 | | | | | | | | 1,079,700 | |
Ashford Hospitality Trust, Inc. | | | | | | | | | | | | | 120,805 | | | | | | | | 648,723 | | | | | | 49,740 | | | | | | | | 267,104 | | | | | | | | | | | | | | | | 170,545 | | | | | | | | 915,827 | |
Capstead Mortgage Corp. | | | | | | | | | | | | | 83,890 | | | | | | | | 813,733 | | | | | | 32,850 | | | | | | | | 318,645 | | | | | | | | | | | | | | | | 116,740 | | | | | | | | 1,132,378 | |
CBL & Associates Properties, Inc. | | | | | | | | | | | | | 75,380 | | | | | | | | 701,788 | | | | | | 29,520 | | | | | | | | 274,831 | | | | | | | | | | | | | | | | 104,900 | | | | | | | | 976,619 | |
Chesapeake Lodging Trust | | | | | | | | | | | | | 35,130 | | | | | | | | 816,772 | | | | | | 14,035 | | | | | | | | 326,314 | | | | | | | | | | | | | | | | 49,165 | | | | | | | | 1,143,086 | |
Corporate Office Properties Trust | | | | | | | | | | | | | 29,465 | | | | | | | | 871,280 | | | | | | 11,770 | | | | | | | | 348,039 | | | | | | | | | | | | | | | | 41,235 | | | | | | | | 1,219,319 | |
DiamondRock Hospitality Co. | | | | | | | | | | | | | 82,190 | | | | | | | | 742,176 | | | | | | 32,215 | | | | | | | | 290,901 | | | | | | | | | | | | | | | | 114,405 | | | | | | | | 1,033,077 | |
Dynex Capital, Inc. | | | | | | | | | | | | | 85,180 | | | | | | | | 591,149 | | | | | | 33,690 | | | | | | | | 233,809 | | | | | | | | | | | | | | | | 118,870 | | | | | | | | 824,958 | |
EPR Properties | | | | | | | | | | | | | 10,980 | | | | | | | | 885,866 | | | | | | 4,385 | | | | | | | | 353,782 | | | | | | | | | | | | | | | | 15,365 | | | | | | | | 1,239,648 | |
First Potomac Realty Trust | | | | | | | | | | | | | 61,735 | | | | | | | | 567,962 | | | | | | 24,665 | | | | | | | | 226,918 | | | | | | | | | | | | | | | | 86,400 | | | | | | | | 794,880 | |
Geo Group, Inc. | | | | | | | | | | | | | 24,335 | | | | | | | | 831,770 | | | | | | 9,940 | | | | | | | | 339,749 | | | | | | | | | | | | | | | | 34,275 | | | | | | | | 1,171,519 | |
Getty Realty Corp. | | | | | | | | | | | | | 33,220 | | | | | | | | 712,569 | | | | | | 13,270 | | | | | | | | 284,642 | | | | | | | | | | | | | | | | 46,490 | | | | | | | | 997,211 | |
Gladstone Commercial Corp. | | | | | | | | | | | | | 34,225 | | | | | | | | 578,060 | | | | | | 14,430 | | | | | | | | 243,723 | | | | | | | | | | | | | | | | 48,655 | | | | | | | | 821,783 | |
Hersha Hospitality Trust | | | | | | | | | | | | | 44,595 | | | | | | | | 764,804 | | | | | | 17,465 | | | | | | | | 299,525 | | | | | | | | | | | | | | | | 62,060 | | | | | | | | 1,064,329 | |
Invesco Mortgage Capital, Inc. | | | | | | | | | | | | | 58,520 | | | | | | | | 801,139 | | | | | | 23,770 | | | | | | | | 325,411 | | | | | | | | | | | | | | | | 82,290 | | | | | | | | 1,126,550 | |
Investors Real Estate Trust | | | | | | | | | | | | | 111,365 | | | | | | | | 720,532 | | | | | | 44,490 | | | | | | | | 287,850 | | | | | | | | | | | | | | | | 155,855 | | | | | | | | 1,008,382 | |
LaSalle Hotel Properties | | | | | | | | | | | | | 33,860 | | | | | | | | 798,419 | | | | | | 13,840 | | | | | | | | 326,347 | | | | | | | | | | | | | | | | 47,700 | | | | | | | | 1,124,766 | |
Medical Properties Trust, Inc. | | | | | | | | | | | | | 54,470 | | | | | | | | 828,489 | | | | | | 21,760 | | | | | | | | 330,970 | | | | | | | | | | | | | | | | 76,230 | | | | | | | | 1,159,459 | |
MFA Financial, Inc. | | | | | | | | | | | | | 110,835 | | | | | | | | 805,770 | | | | | | 42,980 | | | | | | | | 312,465 | | | | | | | | | | | | | | | | 153,815 | | | | | | | | 1,118,235 | |
National Health Investors, Inc. | | | | | | | | | | | | | 11,565 | | | | | | | | 868,416 | | | | | | 4,620 | | | | | | | | 346,916 | | | | | | | | | | | | | | | | 16,185 | | | | | | | | 1,215,332 | |
Piedmont Office Realty Trust, Inc. | | | | | | | | | | | | | 40,440 | | | | | | | | 871,078 | | | | | | 15,680 | | | | | | | | 337,747 | | | | | | | | | | | | | | | | 56,120 | | | | | | | | 1,208,825 | |
Resource Capital Corp. | | | | | | | | | | | | | 54,335 | | | | | | | | 698,748 | | | | | | 21,705 | | | | | | | | 279,126 | | | | | | | | | | | | | | | | 76,040 | | | | | | | | 977,874 | |
RLJ Lodging Trust | | | | | | | | | | | | | 35,300 | | | | | | | | 757,185 | | | | | | 13,690 | | | | | | | | 293,651 | | | | | | | | | | | | | | | | 48,990 | | | | | | | | 1,050,836 | |
Select Income REIT | | | | | | | | | | | | | 32,640 | | | | | | | | 848,314 | | | | | | 13,405 | | | | | | | | 348,396 | | | | | | | | | | | | | | | | 46,045 | | | | | | | | 1,196,710 | |
Summit Hotel Properties, Inc. | | | | | | | | | | | | | 63,990 | | | | | | | | 847,228 | | | | | | 25,560 | | | | | | | | 338,414 | | | | | | | | | | | | | | | | 89,550 | | | | | | | | 1,185,642 | |
Sunstone Hotel Investors, Inc. | | | | | | | | | | | | | 66,250 | | | | | | | | 799,637 | | | | | | 26,465 | | | | | | | | 319,433 | | | | | | | | | | | | | | | | 92,715 | | | | | | | | 1,119,070 | |
Tanger Factory Outlet Centers, Inc. | | | | | | | | | | | | | 21,665 | | | | | | | | 870,500 | | | | | | 9,110 | | | | | | | | 366,040 | | | | | | | | | | | | | | | | 30,775 | | | | | | | | 1,236,540 | |
Two Harbors Investment Corp. | | | | | | | | | | | | | 96,050 | | | | | | | | 822,188 | | | | | | 37,245 | | | | | | | | 318,817 | | | | | | | | | | | | | | | | 133,295 | | | | | | | | 1,141,005 | |
Road & Rail | | | | | | | | | | | | | | | | | | | | | | | | | | | | | | | | | | | | | | | | | | | | | | | | | | | | | | | | | | | | |
ArcBest Corp. | | | | | | | | | | | | | 41,411 | | | | | | | | 672,929 | | | | | | 16,545 | | | | | | | | 268,856 | | | | | | | | | | | | | | | | 57,956 | | | | | | | | 941,785 | |
Swift Transportation Co. | | | | | | | | | | | | | 51,930 | | | | | | | | 800,241 | | | | | | 21,260 | | | | | | | | 327,617 | | | | | | | | | | | | | | | | 73,190 | | | | | | | | 1,127,858 | |
Semiconductors & Semiconductor Equipment | | | | | | | | | | | | | | | | | | | | | | | | | | | | | | | | | | | | | | | | | | | | | | | | | | | | | | | | | | | | |
Alpha & Omega Semiconductor, Ltd. | | | | | | | | | | | | | 39,235 | | | | | | | | 546,544 | | | | | | 16,395 | | | | | | | | 228,382 | | | | | | | | | | | | | | | | 55,630 | | | | | | | | 774,926 | |
Cirrus Logic, Inc. | | | | | | | | | | | | | 20,110 | | | | | | | | 780,067 | | | | | | 8,035 | | | | | | | | 311,678 | | | | | | | | | | | | | | | | 28,145 | | | | | | | | 1,091,745 | |
FormFactor, Inc. | | | | | | | | | | | | | 76,450 | | | | | | | | 687,285 | | | | | | 30,540 | | | | | | | | 274,555 | | | | | | | | | | | | | | | | 106,990 | | | | | | | | 961,840 | |
Kulicke & Soffa Industries, Inc. | | | | | | | | | | | | | 58,695 | | | | | | | | 714,318 | | | | | | 23,550 | | | | | | | | 286,604 | | | | | | | | | | | | | | | | 82,245 | | | | | | | | 1,000,922 | |
MaxLinear, Inc. | | | | | | | | | | | | | 42,485 | | | | | | | | 763,880 | | | | | | 17,700 | | | | | | | | 318,246 | | | | | | | | | | | | | | | | 60,185 | | | | | | | | 1,082,126 | |
MKS Instruments, Inc. | | | | | | | | | | | | | 19,240 | | | | | | | | 828,474 | | | | | | 7,685 | | | | | | | | 330,916 | | | | | | | | | | | | | | | | 26,925 | | | | | | | | 1,159,390 | |
Silicon Laboratories, Inc. | | | | | | | | | | | | | 16,255 | | | | | | | | 792,269 | | | | | | 6,490 | | | | | | | | 316,323 | | | | | | | | | | | | | | | | 22,745 | | | | | | | | 1,108,592 | |
Teradyne, Inc. | | | | | | | | | | | | | 40,640 | | | | | | | | 800,202 | | | | | | 16,235 | | | | | | | | 319,667 | | | | | | | | | | | | | | | | 56,875 | | | | | | | | 1,119,869 | |
Software | | | | | | | | | | | | | | | | | | | | | | | | | | | | | | | | | | | | | | | | | | | | | | | | | | | | | | | | | | | | |
Mentor Graphics Corp. | | | | | | | | | | | | | 38,055 | | | | | | | | 809,049 | | | | | | 15,050 | | | | | | | | 319,963 | | | | | | | | | | | | | | | | 53,105 | | | | | | | | 1,129,012 | |
Nuance Communications, Inc. | | | | | | | | | | | | | 50,780 | | | | | | | | 793,692 | | | | | | 20,285 | | | | | | | | 317,055 | | | | | | | | | | | | | | | | 71,065 | | | | | | | | 1,110,747 | |
Specialty Retail | | | | | | | | | | | | | | | | | | | | | | | | | | | | | | | | | | | | | | | | | | | | | | | | | | | | | | | | | | | | |
Abercrombie & Fitch Co. | | | | | | | | | | | | | 42,635 | | | | | | | | 759,329 | | | | | | 17,035 | | | | | | | | 303,393 | | | | | | | | | | | | | | | | 59,670 | | | | | | | | 1,062,722 | |
American Eagle Outfitters, Inc. | | | | | | | | | | | | | 53,655 | | | | | | | | 854,724 | | | | | | 21,435 | | | | | | | | 341,460 | | | | | | | | | | | | | | | | 75,090 | | | | | | | | 1,196,184 | |
Caleres, Inc. | | | | | | | | | | | | | 34,850 | | | | | | | | 843,719 | | | | | | 14,175 | | | | | | | | 343,177 | | | | | | | | | | | | | | | | 49,025 | | | | | | | | 1,186,896 | |
Chico's FAS, Inc. | | | | | | | | | | | | | 74,300 | | | | | | | | 795,753 | | | | | | 29,095 | | | | | | | | 311,607 | | | | | | | | | | | | | | | | 103,395 | | | | | | | | 1,107,360 | |
Children's Place, Inc. | | | | | | | | | | | | | 10,740 | | | | | | | | 861,133 | | | | | | 4,395 | | | | | | | | 352,391 | | | | | | | | | | | | | | | | 15,135 | | | | | | | | 1,213,524 | |
Citi Trends, Inc. | | | | | | | | | | | | | 30,440 | | | | | | | | 472,733 | | | | | | 12,040 | | | | | | | | 186,981 | | | | | | | | | | | | | | | | 42,480 | | | | | | | | 659,714 | |
DSW, Inc. | | | | | | | | | | | | | 37,945 | | | | | | | | 803,675 | | | | | | 14,860 | | | | | | | | 314,735 | | | | | | | | | | | | | | | | 52,805 | | | | | | | | 1,118,410 | |
Express, Inc. | | | | | | | | | | | | | 50,525 | | | | | | | | 733,118 | | | | | | 19,785 | | | | | | | | 287,080 | | | | | | | | | | | | | | | | 70,310 | | | | | | | | 1,020,198 | |
Finish Line, Inc. | | | | | | | | | | | | | 49,085 | | | | | | | | 991,026 | | | | | | 19,610 | | | | | | | | 395,926 | | | | | | | | | | | | | | | | 68,695 | | | | | | | | 1,386,952 | |
Genesco, Inc. | | | | | | | | | | | | | 12,535 | | | | | | | | 806,126 | | | | | | 5,270 | | | | | | | | 338,914 | | | | | | | | | | | | | | | | 17,805 | | | | | | | | 1,145,040 | |
Guess?, Inc. | | | | | | | | | | | | | 53,866 | | | | | | | | 810,683 | | | | | | 21,520 | | | | | | | | 323,876 | | | | | | | | | | | | | | | | 75,386 | | | | | | | | 1,134,559 | |
Hibbett Sports, Inc. | | | | | | | | | | | | | 23,210 | | | | | | | | 807,476 | | | | | | 9,180 | | | | | | | | 319,372 | | | | | | | | | | | | | | | | 32,390 | | | | | | | | 1,126,848 | |
Kirkland's, Inc. | | | | | | | | | | | | | 36,030 | | | | | | | | 528,920 | | | | | | 14,250 | | | | | | | | 209,190 | | | | | | | | | | | | | | | | 50,280 | | | | | | | | 738,110 | |
Pier 1 Imports, Inc. | | | | | | | | | | | | | 141,125 | | | | | | | | 725,383 | | | | | | 56,380 | | | | | | | | 289,793 | | | | | | | | | | | | | | | | 197,505 | | | | | | | | 1,015,176 | |
Rent-A-Center, Inc. | | | | | | | | | | | | | 65,785 | | | | | | | | 807,840 | | | | | | 25,760 | | | | | | | | 316,333 | | | | | | | | | | | | | | | | 91,545 | | | | | | | | 1,124,173 | |
Shoe Carnival, Inc. | | | | | | | | | | | | | 27,750 | | | | | | | | 695,415 | | | | | | 11,085 | | | | | | | | 277,790 | | | | | | | | | | | | | | | | 38,835 | | | | | | | | 973,205 | |
Urban Outfitters, Inc. | | | | | | | | | | | | | 30,640 | | | | | | | | 842,600 | | | | | | 12,495 | | | | | | | | 343,613 | | | | | | | | | | | | | | | | 43,135 | | | | | | | | 1,186,213 | |
Vitamin Shoppe, Inc. | | | | | | | | | | | | | 26,990 | | | | | | | | 825,084 | | | | | | 10,465 | | | | | | | | 319,915 | | | | | | | | | | | | | | | | 37,455 | | | | | | | | 1,144,999 | |
Williams-Sonoma, Inc. | | | | | | | | | | | | | 15,150 | | | | | | | | 789,770 | | | | | | 6,195 | | | | | | | | 322,945 | | | | | | | | | | | | | | | | 21,345 | | | | | | | | 1,112,715 | |
Zumiez, Inc. | | | | | | | | | | | | | 55,460 | | | | | | | | 793,633 | | | | | | 22,305 | | | | | | | | 319,185 | | | | | | | | | | | | | | | | 77,765 | | | | | | | | 1,112,818 | |
Technology Hardware, Storage & Peripherals | | | | | | | | | | | | | | | | | | | | | | | | | | | | | | | | | | | | | | | | | | | | | | | | | | | | | | | | | | | | |
Cray, Inc. | | | | | | | | | | | | | 26,410 | | | | | | | | 790,187 | | | | | | 10,340 | | | | | | | | 309,373 | | | | | | | | | | | | | | | | 36,750 | | | | | | | | 1,099,560 | |
S-39
| | | | | | | | | | | | | | | | | | | | | | | | | | | | | | | | | | | | | | | | | | | | | | | | | | | | | | | | | | | | |
| | | | | | | | | | | TPP Master | | | | | TAF Destination | | | | | Adjustments | | | | | Combined Pro Forma Destination | |
| | | Coupon
Rate | | | Maturity
Date | | | | | Shares | | | | | | Value | | | | | Shares | | | | | | Value | | | | | Shares | | | Value | | | | | Shares | | | | | | Value | |
| | | | | | | | | | | | | | | | | | | | | | | | | |
Textiles, Apparel & Luxury Goods | | | | | | | | | | | | | | | | | | | | | | | | | | | | | | | | | | | | | | | | | | | | | | | | | | | | | | | | | | | | |
Movado Group, Inc. | | | | | | | | | | | | | 33,940 | | | | | | | $ | 735,819 | | | | | | 13,290 | | | | | | | $ | 288,127 | | | | | | | | | | | | | | | | 47,230 | | | | | | | $ | 1,023,946 | |
Perry Ellis International, Inc. | | | | | | | | | | | | | 27,895 | | | | | | | | 561,248 | | | | | | 11,145 | | | | | | | | 224,236 | | | | | | | | | | | | | | | | 39,040 | | | | | | | | 785,484 | |
Thrifts & Mortgage Finance | | | | | | | | | | | | | | | | | | | | | | | | | | | | | | | | | | | | | | | | | | | | | | | | | | | | | | | | | | | | |
First Defiance Financial Corp. | | | | | | | | | | | | | 13,725 | | | | | | | | 533,216 | | | | | | 5,320 | | | | | | | | 206,682 | | | | | | | | | | | | | | | | 19,045 | | | | | | | | 739,898 | |
HomeStreet, Inc. | | | | | | | | | | | | | 31,100 | | | | | | | | 619,512 | | | | | | 12,300 | | | | | | | | 245,016 | | | | | | | | | | | | | | | | 43,400 | | | | | | | | 864,528 | |
Meta Financial Group, Inc. | | | | | | | | | | | | | 11,513 | | | | | | | | 586,703 | | | | | | 4,620 | | | | | | | | 235,434 | | | | | | | | | | | | | | | | 16,133 | | | | | | | | 822,137 | |
Trading Companies & Distributors | | | | | | | | | | | | | | | | | | | | | | | | | | | | | | | | | | | | | | | | | | | | | | | | | | | | | | | | | | | | |
Applied Industrial Technologies, Inc. | | | | | | | | | | | | | 17,730 | | | | | | | | 800,332 | | | | | | 7,080 | | | | | | | | 319,591 | | �� | | | | | | | | | | | | | | 24,810 | | | | | | | | 1,119,923 | |
DXP Enterprises, Inc. | | | | | | | | | | | | | 48,753 | | | | | | | | 727,882 | | | | | | 19,560 | | | | | | | | 292,031 | | | | | | | | | | | | | | | | 68,313 | | | | | | | | 1,019,913 | |
WESCO International, Inc. | | | | | | | | | | | | | 14,195 | | | | | | | | 730,901 | | | | | | 5,615 | | | | | | | | 289,116 | | | | | | | | | | | | | | | | 19,810 | | | | | | | | 1,020,017 | |
Wireless Telecommunication Services | | | | | | | | | | | | | | | | | | | | | | | | | | | | | | | | | | | | | | | | | | | | | | | | | | | | | | | | | | | | |
Shenandoah Telecommunications Co. | | | | | | | | | | | | | 23,220 | | | | | | | | 906,973 | | | | | | 9,275 | | | | | | | | 362,282 | | | | | | | | | | | | | | | | 32,495 | | | | | | | | 1,269,255 | |
| | | | | | | | | | | | | | | | | | | | | | | | | | | | | | | | |
Total Common Stocks | | | | | | | | | | | | | | | | | | | | | 222,621,749 | | | | | | | | | | | | | | 88,922,901 | | | | | | | | | | | | | | | | | | | | | | | | 311,544,650 | |
| | | | | | | | | | | | | | | | | | | | | | | | | | | | | | | | |
| | | | | | | | | | | | | | | | | | | | | Total Cost ($217,726,617) | | | | | | | | | | | | | | Total Cost ($88,039,200) | | | | | | | | | | | | | | | | | | | | | | | | Total Cost ($305,765,817) | |
Master Limited Partnership - 0.3 % | | | | | | | | | | | | | | | | | | | | | | | | | | | | | | | | | | | | | | | | | | | | | | | | | | | | | | | | | | | | |
Capital Markets | | | | | | | | | | | | | | | | | | | | | | | | | | | | | | | | | | | | | | | | | | | | | | | | | | | | | | | | | | | | |
Lazard, Ltd. | | | | | | | | | | | | | 22,060 | | | | | | | | 656,947 | | | | | | 8,725 | | | | | | | | 259,831 | | | | | | | | | | | | | | | | 30,785 | | | | | | | | 916,778 | |
| | | | | | | | | | | | | | | | | | | | | | | | | | | | | | | | |
Total Master Limited Partnership | | | | | | | | | | | | | | | | | | | | | 656,947 | | | | | | | | | | | | | | 259,831 | | | | | | | | | | | | | | | | | | | | | | | | 916,778 | |
| | | | | | | | | | | | | | | | | | | | | | | | | | | | | | | | |
| | | | | | | | | | | | | | | | | | | | | Total Cost ($782,369) | | | | | | | | | | | | | | Total Cost ($308,733) | | | | | | | | | | | | | | | | | | | | | | | | Total Cost ($1,091,102) | |
Securities Lending Collateral - 15.8 % | | | | | | | | | | | | | | | | | | | | | | | | | | | | | | | | | | | | | | | | | | | | | | | | | | | | | | | | | | | | |
State Street Navigator Securities Lending Trust - Prime Portfolio | | | 0.51 | % | | | | | | | | | 39,688,822 | | | | | | | | 39,688,822 | | | | | | 10,398,751 | | | | | | | | 10,398,751 | | | | | | | | | | | | | | | | 50,087,573 | | | | | | | | 50,087,573 | |
| | | | | | | | | | | | | | | | | | | | | | | | | | | | | | | | |
Total Securities Lending Collateral | | | | | | | | | | | | | | | | | | | | | 39,688,822 | | | | | | | | | | | | | | 10,398,751 | | | | | | | | | | | | | | | | | | | | | | | | 50,087,573 | |
| | | | | | | | | | | | | | | | | | | | | | | | | | | | | | | | |
| | | | | | | | | | | | | | | | | | | | | Total Cost ($39,688,822) | | | | | | | | | | | | | | Total Cost ($10,398,751) | | | | | | | | | | | | | | | | | | | | | | | | Total Cost ($50,087,573) | |
| | | | | | | | | | | | | | | | | |
| | | | | | | | | | | Principal | | | | | | Value | | | | | Principal | | | | | | Value | | | | | | | | | | | | | Principal | | | | | | Value | |
| | | | | | | | | | | | | | | | | | | | | | | | | | | | | | | | |
Repurchase Agreement - 1.2 % | | | | | | | | | | | | | | | | | | | | | | | | | | | | | | | | | | | | | | | | | | | | | | | | | | | | | | | | | | | | |
State Street Bank & Trust Co. | | | 0.03 | % | | | 07/01/2016 | | | | | $ | 2,625,396 | | | | | | | | 2,625,396 | | | | | $ | 1,289,842 | | | | | | | | 1,289,842 | | | | | | | | | | | | | | | $ | 3,915,238 | | | | | | | | 3,915,238 | |
| | | | | | | | | | | | | | | | | | | | | | | | | | | | | | | | |
Total Repurchase Agreement | | | | | | | | | | | | | | | | | | | | | 2,625,396 | | | | | | | | | | | | | | 1,289,842 | | | | | | | | | | | | | | | | | | | | | | | | 3,915,238 | |
| | | | | | | | | | | | | | | | | | | | | | | | | | | | | | | | |
| | | | | | | | | | | | | | | | | | | | | Total Cost ($2,625,396) | | | | | | | | | | | | | | Total Cost ($1,289,842) | | | | | | | | | | | | | | | | | | | | | | | | Total Cost ($3,915,238) | |
| | | | | | | | | | | | | | | | | | | | | | | | | | | | | | | | |
Total Investments | | | | | | | | | | | | | | | | | | | | | 265,592,914 | | | | | | | | | | | | | | 100,871,325 | | | | | | | | | | | | | | | | | | | | | | | | 366,464,239 | |
| | | | | | | | | | | | | | | | | | | | | | | | | | | | | | | | |
| | | | | | | | | | | | | | | | | | | | | Total Cost ($260,823,204) | | | | | | | | | | | | | | Total Cost ($100,036,526) | | | | | | | | | | | | | | | | | | | | Total Cost ($360,859,730) | |
Other Assets and Liabilities - (15.9)% | | | | | | | | | | | | | | | | | | | | | (39,703,180 | ) | | | | | | | | | | | | | (10,483,089 | ) | | | | | | | | | (174,354 | ) (a) (c) | | | | | | | | | | | | | (50,360,623 | ) |
| | | | | | | | | | | | | | | | | | | | | | | | | | | | | | | | | | | | | | | | | | | | | | | | | | | | | | | | | | | | |
Net Assets | | | | | | | | | | | | | | | | | | | | | 225,889,734 | | | | | | | | | | | | | $ | 90,388,236 | | | | | | | | | ($ | 174,354 | ) | | | | | | | | | | | | | 316,103,616 | |
| | | | | | | | | | | | | | | | | | | | | | | | | | | | | | | | | | | | | | | | | | | | | | | | | | | | | | | | | | | | |
VALUATION SUMMARY:
| | | | | | | | | | | | | | | | | | | | | | | | | | | | | | | | | | | | | | | | | | | | | | | | | | | | | | | | |
| Investments | | Level 1 - Unadjusted
Quoted Prices | | | Level 2 - Other Significant Observable Inputs | | | Level 3 - Significant Unobservable Inputs | | | Value | | | | | | Level 1 - Unadjusted
Quoted Prices | | | Level 2 - Other Significant Observable Inputs | | | Level 3 - Significant Unobservable Inputs | | | Value | | | | | | Level 1 - Unadjusted
Quoted Prices | | | Level 2 - Other Significant Observable Inputs | | | Level 3 - Significant Unobservable Inputs | | | Value | |
Common Stocks | | $ | 222,621,749 | | | $ | - | | | $ | - | | | $ | 222,621,749 | | | | | | | $ | 88,922,901 | | | $ | - | | | $ | - | | | $ | 88,922,901 | | | | | | | $ | 311,544,650 | | | $ | - | | | $ | - | | | $ | 311,544,650 | |
Master Limited Partnership | | | 656,947 | | | | - | | | | - | | | | 656,947 | | | | | | | | 259,831 | | | | - | | | | - | | | | 259,831 | | | | | | | | 916,778 | | | | - | | | | - | | | | 916,778 | |
Securities Lending Collateral | | | 39,688,822 | | | | - | | | | - | | | | 39,688,822 | | | | | | | | 10,398,751 | | | | - | | | | - | | | | 10,398,751 | | | | | | | | 50,087,573 | | | | - | | | | - | | | | 50,087,573 | |
Repurchase Agreement | | | - | | | | 2,625,396 | | | | - | | | | 2,625,396 | | | | | | | | - | | | | 1,289,842 | | | | - | | | | 1,289,842 | | | | | | | | - | | | | 3,915,238 | | | | - | | | | 3,915,238 | |
Total Investments | | $ | 262,967,518 | | | $ | 2,625,396 | | | $ | - | | | $ | 265,592,914 | | | | | | | $ | 99,581,483 | | | $ | 1,289,842 | | | $ | - | | | $ | 100,871,325 | | | | | | | $ | 362,549,001 | | | $ | 3,915,238 | | | $ | - | | | $ | 366,464,239 | |
(a)-(l) See Note 2 of the Notes to the Pro Forma Financial Statements.
As of June 30, 2016, all securities held by the Target Master Portfolio would comply with the investment restrictions of the Destination Fund.
S-40
Reorganization Between TPP Master, TPFG Feeder, TPFG II Feeder and TAF Destination
PRO FORMA STATEMENT OF ASSETS AND LIABILITIES
At June 30, 2016
| | | | | | | | | | | | | | | | | | | | | | | | | | | | | | | | | | |
| | | | | TPP Master | | | | | | TPFG Feeder | | | | | | TPFG II Feeder | | | | | | TAF Destination | | | | | | Adjustments | | | | | | Combined Pro Forma
Destination |
Assets: | | | | | | | | | | | | | | | | | | | | | | | | | | | | | | | | | | |
Investments, at value | | $ | | 262,967,518 | | | | $ | | - | | | | $ | | - | | | | $ | | 99,581,483 | | | | $ | | - | | | | $ | | 362,549,001 |
Repurchase agreements, at value | | | | 2,625,396 | | | | | | - | | | | | | - | | | | | | 1,289,842 | | | | | | - | | | | | | 3,915,238 |
Investments in Series Portfolio, at value | | | | - | | | | | | 62,075,603 | | | | | | 12,173,750 | | | | | | - | | | | | | (74,249,353) | | (b) | | | | - |
Receivables: | | | | - | | | | | | - | | | | | | - | | | | | | - | | | | | | | | | | | | |
Shares of beneficial interest sold | | | | - | | | | | | 1,915 | | | | | | 4,845 | | | | | | 275 | | | | | | - | | | | | | 7,035 |
Investments sold | | | | 1,509,998 | | | | | | - | | | | | | - | | | | | | 594,420 | | | | | | - | | | | | | 2,104,418 |
Interest | | | | 2 | | | | | | - | | | | | | - | | | | | | 1 | | | | | | - | | | | | | 3 |
Dividends | | | | 427,589 | | | | | | - | | | | | | - | | | | | | 170,687 | | | | | | - | | | | | | 598,276 |
Net income from securities lending | | | | 10,233 | | | | | | - | | | | | | - | | | | | | 1,755 | | | | | | - | | | | | | 11,988 |
Due from advisor | | | | - | | | | | | - | | | | | | 4,260 | | | | | | - | | | | | | - | | | | | | 4,260 |
Other | | | | 652 | | | | | | - | | | | | | - | | | | | | - | | | | | | - | | | | | | 652 |
Prepaid Expenses | | | | - | | | | | | 202 | | | | | | 20 | | | | | | 28 | | | | | | - | | | | | | 250 |
Total assets | | $ | | 267,541,388 | | | | $ | | 62,077,720 | | | | $ | | 12,182,875 | | | | $ | | 101,638,491 | | | | $ | | (74,249,353) | | | | $ | | 369,191,121 |
| | | | | | | | | | | | | | | | | |
Liabilities: | | | | | | | | | | | | | | | | | | | | | | | | | | | | | | | | | | |
Payables and other liabilities: | | | | | | | | | | | | | | | | | | | | | | | | | | | | | | | | | | |
Shares of beneficial interest redeemed | | | | - | | | | | | - | | | | | | - | | | | | | 20,790 | | | | | | - | | | | | | 20,790 |
Investments purchased | | | | 1,780,433 | | | | | | - | | | | | | - | | | | | | 711,671 | | | | | | - | | | | | | 2,492,104 |
Investment advisory fees | | | | 149,501 | | | | | | - | | | | | | - | | | | | | - | | | | | | - | | | | | | 149,501 |
Investment management fees | | | | - | | | | | | - | | | | | | - | | | | | | 61,507 | | | | | | - | | | | | | 61,507 |
Administration/Investment advisory fees | | | | - | | | | | | 15,318 | | | | | | 508 | | | | | | - | | | | | | - | | | | | | 15,826 |
Distribution and service fees | | | | - | | | | | | 12,765 | | | | | | 2,538 | | | | | | 605 | | | | | | - | | | | | | 15,908 |
Transfer agent fees | | | | - | | | | | | - | | | | | | - | | | | | | 680 | | | | | | - | | | | | | 680 |
Trustee, CCO and deferred compensation fees | | | | 422 | | | | | | 124 | | | | | | 30 | | | | | | 371 | | | | | | - | | | | | | 947 |
Audit and tax fees | | | | 12,012 | | | | | | 4,826 | | | | | | 4,077 | | | | | | 13,058 | | | | | | - | | | | | | 33,973 |
Custody and accounting fees | | | | 11,268 | | | | | | 1,831 | | | | | | 1,831 | | | | | | 18,256 | | | | | | - | | | | | | 33,186 |
Legal fees | | | | 4,742 | | | | | | 1,396 | | | | | | 497 | | | | | | 3,912 | | | | | | - | | | | | | 10,547 |
Printing and shareholder reports fees | | | | 1,846 | | | | | | 4,219 | | | | | | 909 | | | | | | 6,003 | | | | | | - | | | | | | 12,977 |
Registration fees | | | | - | | | | | | 3,504 | | | | | | 4,782 | | | | | | 13,558 | | | | | | - | | | | | | 21,844 |
Distribution payable to shareholders | | | | - | | | | | | - | | | | | | - | | | | | | 1,093 | | | | | | - | | | | | | 1,093 |
Other | | | | 2,608 | | | | | | 392 | | | | | | 102 | | | | | | - | | | | | | 125,947 | | (c) | | | | 129,049 |
Collateral for securities on loan | | | | 39,688,822 | | | | | | - | | | | | | - | | | | | | 10,398,751 | | | | | | - | | | | | | 50,087,573 |
Total liabilities | | | | 41,651,654 | | | | | | 44,375 | | | | | | 15,274 | | | | | | 11,250,255 | | | | | | 125,947 | | | | | | 53,087,505 |
Net Assets | | $ | | 225,889,734 | | | | $ | | 62,033,345 | | | | $ | | 12,167,601 | | | | $ | | 90,388,236 | | | | $ | | (74,375,300) | | | | $ | | 316,103,616 |
| | | | | | | | | | | | | | | | | | | | | | | | | | | | | | | | | | |
| | | | | | | | | | | | | | | | | |
Net Assets Consist of: | | | | | | | | | | | | | | | | | | | | | | | | | | | | | | | | | | |
Paid-in capital | | $ | | (748,057,990) | | | | | | 121,309,785 | | | | | | 104,236,881 | | | | | | 104,641,207 | | | | $ | | 835,732,950 | | (d) | | $ | | 417,862,833 |
Undistributed (distributions in excess of) net investment income (loss) | | | | 52,885,831 | | | | | | (53,323) | | | | | | (9,117) | | | | | | 106,739 | | | | | | (52,823,391) | | (d) | | | | 106,739 |
Accumulated net realized gain (loss) | | | | 916,292,183 | | | | | | (20,970,838) | | | | | | (42,806,196) | | | | | | (15,194,508) | | | | | | (852,515,149) | | (d) | | | | (15,194,508) |
Net unrealized appreciation (depreciation) on: | | | | | | | | | | | | | | | | | | | | | | | | | | | | | | | | | | |
Investments | | | | 4,769,710 | | | | | | - | | | | | | - | | | | | | 834,798 | | | | | | (4,769,710) | | (d) | | | | 834,798 |
Allocated from Series Portfolio | | | | - | | | | | | (38,252,279) | | | | | | (49,253,967) | | | | | | - | | | | | | - | | | | | | (87,506,246) |
| | | | | | | | | | | | | | | | | |
Net Assets | | $ | | 225,889,734 | | | | $ | | 62,033,345 | | | | $ | | 12,167,601 | | | | $ | | 90,388,236 | | | | $ | | (74,375,300) | | | | $ | | 316,103,616 |
| | | | | | | | | | | | | | | | | | | | | | | | | | | | | | | | | | |
| | | | | | | | | | | | | | | | | |
Net assets by class: | | | | | | | | | | | | | | | | | | | | | | | | | | | | | | | | | | |
Class A | | $ | | - | | | | $ | | - | | | | $ | | - | | | | $ | | 1,335,657 | | | | $ | | - | | | | $ | | 1,335,657 |
Class C | | | | - | | | | | | - | | | | | | - | | | | | | 394,700 | | | | | | - | | | | | | 394,700 |
Class I | | | | - | | | | | | - | | | | | | - | | | | | | 1,214,499 | | | | | | - | | | | | | 1,214,499 |
Class I2 | | | | - | | | | | | - | | | | | | - | | | | | | 87,443,380 | | | | | | - | | | | | | 87,443,380 |
Class I3 | | | | 151,640,381 | | | | | | - | | | | | | - | | | | | | - | | | | | | (125,947) | | (c) | | | | 151,514,434 |
Class R | | | | - | | | | | | 62,033,345 | | | | | | - | | | | | | - | | | | | | - | | | | | | 62,033,345 |
Class R4 | | | | - | | | | | | - | | | | | | 12,167,601 | | | | | | - | | | | | | - | | | | | | 12,167,601 |
Shares outstanding (unlimited shares, no par value): | | | | | | | | | | | | | | | | | | | | | | | | | | | | | | | | | | |
Class A | | | | - | | | | | | - | | | | | | - | | | | | | 136,473 | | | | | | - | | | | | | 136,473 |
Class C | | | | - | | | | | | - | | | | | | - | | | | | | 40,600 | | | | | | - | | | | | | 40,600 |
Class I | | | | - | | | | | | - | | | | | | - | | | | | | 123,787 | | | | | | - | | | | | | 123,787 |
Class I2 | | | | - | | | | | | - | | | | | | - | | | | | | 8,908,433 | | | | | | - | | | | | | 8,908,433 |
Class I3 | | | | 15,441,994 | | | | | | - | | | | | | - | | | | | | - | | | | | | - | | | | | | 15,441,994 |
Class R | | | | - | | | | | | 2,319,771 | | | | | | - | | | | | | - | | | | | | 3,997,270 | | (e) | | | | 6,317,041 |
Class R4 | | | | - | | | | | | - | | | | | | 859,916 | | | | | | - | | | | | | 379,147 | | (e) | | | | 1,239,063 |
Net asset value per share: | | | | | | | | | | | | | | | | | | | | | | | | | | | | | | | | | | |
Class A | | $ | | - | | | | $ | | - | | | | $ | | - | | | | $ | | 9.79 | | | | | | - | | | | $ | | 9.79 |
Class C | | | | - | | | | | | - | | | | | | - | | | | | | 9.72 | | | | | | - | | | | | | 9.72 |
Class I | | | | - | | | | | | - | | | | | | - | | | | | | 9.81 | | | | | | - | | | | | | 9.81 |
Class I2 | | | | - | | | | | | - | | | | | | - | | | | | | 9.82 | | | | | | - | | | | | | 9.82 |
Class I3 | | | | 9.82 | | | | | | - | | | | | | - | | | | | | 9.82 | | | | | | (9.83) | | (f) | | | | 9.81 |
Class R | | | | - | | | | | | 26.74 | | | | | | - | | | | | | 9.82 | | | | | | (26.76) | | (f) | | | | 9.80 |
Class R4 | | | | - | | | | | | - | | | | | | 14.15 | | | | | | 9.82 | | | | | | (14.15) | | (f) | | | | 9.82 |
Maximum offering price per share: | | | | | | | | | | | | | | | | | | | | | | | | | | | | | | | | | | |
Class A | | $ | | - | | | | $ | | - | | | | $ | | - | | | | $ | | 10.36 | | | | | | - | | | | $ | | 10.36 |
| | | | | | | | | | | | | | | | | | | | | | | | | | | | | | | | | | |
| | | | | | | | | | | | | | | | | | | | | | | | | | | | | | | | | | |
Investments, at cost | | $ | | 258,197,808 | | | | $ | | - | | | | $ | | - | | | | $ | | 98,746,684 | | | | | | - | | | | $ | | 356,944,492 |
Securities loaned, at value | | | | 38,705,043 | | | | | | - | | | | | | - | | | | | | 10,144,754 | | | | | | - | | | | | | 48,849,797 |
Repurchase agreements, at cost | | | | 2,625,396 | | | | | | - | | | | | | - | | | | | | 1,289,842 | | | | | | - | | | | | | 3,915,238 |
(a)-(l) See Note 2 of the Notes to the Pro Forma Financial Statements.
THE NOTES TO THE PRO FORMA FINANCIAL STATEMENTS ARE AN INTEGRAL PART OF THIS REPORT.
S-41
Reorganization Between TPP Master, TPFG Feeder, TPFG II Feeder and TAF Destination
PRO FORMA STATEMENT OF OPERATIONS
For the twelve-month period ended June 30, 2016
| | | | | | | | | | | | | | | | | | | | | | | | | | | | | | | | | | | | | | | | | | | | | | | | | | | | | | | | | | | | | | | | | | | | |
| | | | | | TPP Master | | | | | | | | | TPFG Feeder | | | | | | | | | TPFG II Feeder | | | | | | | | | TAF Destination | | | | | | | | | Adjustments | | | | | | | | | Combined Pro Forma Destination | |
Investment Income: | | | | | | | | | | | | | | | | | | | | | | | | | | | | | | | | | | | | | | | | | | | | | | | | | | | | | | | | | | | | | | | | | | | | |
| | | | | | | | | | | | | | | | | |
Dividend income | | | $ | | | | 4,743,595 | | | | | | | | $ | | | | 1,289,610 | | | | | | | | $ | | | | 258,668 | | | | | | | | $ | | | | 2,798,500 | | | | | | | | $ | | | | (1,548,278) | | | | (b) | | | | $ | | | | 7,542,095 | |
Interest income | | | | | | | 522 | | | | | | | | | | | | 142 | | | | | | | | | | | | 29 | | | | | | | | | | | | 456 | | | | | | | | | | | | (171) | | | | (b) | | | | | | | | 978 | |
Net income (loss) from securities lending | | | | | | | 137,272 | | | | | | | | | | | | 37,410 | | | | | | | | | | | | 7,438 | | | | | | | | | | | | 60,908 | | | | | | | | | | | | (44,848) | | | | (b) | | | | | | | | 198,180 | |
Withholding taxes on foreign income | | | | | | | (11,568) | | | | | | | | | | | | (3,177) | | | | | | | | | | | | (625) | | | | | | | | | | | | (4,895) | | | | | | | | | | | | 3,802 | | | | (b) | | | | | | | | (16,463) | |
Expenses (net of waiver and/or reimbursement) | | | | | | | - | | | | | | | | | | | | (540,786) | | | | | | | | | | | | (107,888) | | | | | | | | | | | | - | | | | | | | | | | | | 648,674 | | | | (b) | | | | | | | | - | |
| | | | | | | | | | | | | | | | | | | | | | | | | | | | | | | | | | | | | | | | | | | | |
Total investment income (loss) | | | | | | | 4,869,821 | | | | | | | | | | | | 783,199 | | | | | | | | | | | | 157,622 | | | | | | | | | | | | 2,854,969 | | | | | | | | | | | | (940,821) | | | | | | | | | | | | 7,724,790 | |
| | | | | | | | | | | | | | | | | | | | | | | | | | | | | | | | | | | | | | | | | | | | |
| | | | | | | | | | | | | | | | | |
Expenses: | | | | | | | | | | | | | | | | | | | | | | | | | | | | | | | | | | | | | | | | | | | | | | | | | | | | | | | | | | | | | | | | | | | | |
Investment advisory fees | | | | | | | 1,892,348 | | | | | | | | | | | | - | | | | | | | | | | | | - | | | | | | | | | | | | 996,430 | | | | | | | | | | | | 64,636 | | | | (g) | | | | | | | | 2,953,414 | |
Investment management fees | | | | | | | - | | | | | | | | | | | | - | | | | | | | | | | | | - | | | | | | | | | | | | 244,758 | | | | | | | | | | | | - | | | | | | | | | | | | 244,758 | |
Administration/Investment advisory fees | | | | | | | - | | | | | | | | | | | | 193,069 | | | | | | | | | | | | 6,432 | | | | | | | | | | | | - | | | | | | | | | | | | (199,501) | | | | (h) | | | | | | | | - | |
Distribution and service fees: | | | | | | | | | | | | | | | | | | | | | | | | | | | | | | | | | | | | | | | | | | | | | | | | | | | | | | | | | | | | | | | | | | | | |
Class A | | | | | | | - | | | | | | | | | | | | - | | | | | | | | | | | | - | | | | | | | | | | | | 1,891 | | | | | | | | | | | | (1) | | | | (i) | | | | | | | | 1,890 | |
Class C | | | | | | | - | | | | | | | | | | | | - | | | | | | | | | | | | - | | | | | | | | | | | | 3,733 | | | | | | | | | | | | (4) | | | | (i) | | | | | | | | 3,729 | |
Class R | | | | | | | - | | | | | | | | | | | | 160,891 | | | | | | | | | | | | - | | | | | | | | | | | | - | | | | | | | | | | | | 160,421 | | | | (i) | | | | | | | | 321,312 | |
Class R4 | | | | | | | - | | | | | | | | | | | | - | | | | | | | | | | | | 32,160 | | | | | | | | | | | | - | | | | | | | | | | | | (46) | | | | (i) | | | | | | | | 32,114 | |
Administration fees | | | | | | | - | | | | | | | | | | | | - | | | | | | | | | | | | - | | | | | | | | | | | | 36,287 | | | | | | | | | | | | (36,287) | | | | (h) | | | | | | | | - | |
Transfer agent fees: | | | | | | | | | | | | | | | | | | | | | | | | | | | | | | | | | | | | | | | | | | | | | | | | | | | | | | | | | | | | | | | | | | | | |
Class A | | | | | | | - | | | | | | | | | | | | - | | | | | | | | | | | | - | | | | | | | | | | | | 1,038 | | | | | | | | | | | | - | | | | | | | | | | | | 1,038 | |
Class C | | | | | | | - | | | | | | | | | | | | - | | | | | | | | | | | | - | | | | | | | | | | | | 477 | | | | | | | | | | | | - | | | | | | | | | | | | 477 | |
Class I | | | | | | | - | | | | | | | | | | | | - | | | | | | | | | | | | - | | | | | | | | | | | | 963 | | | | | | | | | | | | | | | | | | | | | | | | 963 | |
Class I2 | | | | | | | - | | | | | | | | | | | | - | | | | | | | | | | | | - | | | | | | | | | | | | 11,407 | | | | | | | | | | | | | | | | | | | | | | | | 11,407 | |
Trustee, CCO and deferred compensation fees | | | | | | | 3,610 | | | | | | | | | | | | 1,085 | | | | | | | | | | | | 176 | | | | | | | | | | | | 2,553 | | | | | | | | | | | | - | | | | | | | | | | | | 7,424 | |
Audit and tax fees | | | | | | | 21,542 | | | | | | | | | | | | 8,351 | | | | | | | | | | | | 6,777 | | | | | | | | | | | | 22,846 | | | | | | | | | | | | (23,346) | | | | (j) | | | | | | | | 36,170 | |
Custody fees | | | | | | | 55,383 | | | | | | | | | | | | 11,266 | | | | | | | | | | | | 11,264 | | | | | | | | | | | | 60,916 | | | | | | | | | | | | (60,198) | | | | (k) | | | | | | | | 78,631 | |
Legal fees | | | | | | | 8,583 | | | | | | | | | | | | 2,739 | | | | | | | | | | | | 646 | | | | | | | | | | | | 9,228 | | | | | | | | | | | | - | | | | | | | | | | | | 21,196 | |
Printing and shareholder reports fees | | | | | | | 669 | | | | | | | | | | | | 8,514 | | | | | | | | | | | | 2,030 | | | | | | | | | | | | 7,115 | | | | | | | | | | | | - | | | | | | | | | | | | 18,328 | |
Registration fees | | | | | | | - | | | | | | | | | | | | 20,745 | | | | | | | | | | | | 18,984 | | | | | | | | | | | | 29,926 | | | | | | | | | | | | | | | | | | | | | | | | 69,655 | |
Other | | | | | | | 4,195 | | | | | | | | | | | | 2,301 | | | | | | | | | | | | 1,052 | | | | | | | | | | | | 5,916 | | | | | | | | | | | | - | | | | | | | | | | | | 13,464 | |
| | | | | | | | | | | | | | | | | | | | | | | | | | | | | | | | | | | | | | | | | | | | |
Total expenses before waiver and/or reimbursement and recapture | | | | | | | 1,986,330 | | | | | | | | | | | | 408,961 | | | | | | | | | | | | 79,521 | | | | | | | | | | | | 1,435,484 | | | | | | | | | | | | (94,326) | | | | | | | | | | | | 3,815,970 | |
Expenses waived and/or reimbursed: | | | | | | | | | | | | | | | | | | | | | | | | | | | | | | | | | | | | | | | | | | | | | | | | | | | | | | | | | | | | | | | | | | | | |
Fund level | | | | | | | - | | | | | | | | | | | | - | | | | | | | | | | | | - | | | | | | | | | | | | - | | | | | | | | | | | | - | | | | | | | | | | | | - | |
Class A | | | | | | | - | | | | | | | | | | | | - | | | | | | | | | | | | - | | | | | | | | | | | | (546) | | | | | | | | | | | | 546 | | | | (l) | | | | | | | | - | |
Class C | | | | | | | - | | | | | | | | | | | | - | | | | | | | | | | | | - | | | | | | | | | | | | (172) | | | | | | | | | | | | 172 | | | | (l) | | | | | | | | - | |
Class I | | | | | | | - | | | | | | | | | | | | - | | | | | | | | | | | | - | | | | | | | | | | | | (399) | | | | | | | | | | | | 399 | | | | (l) | | | | | | | | - | |
Class I3 | | | | | | | - | | | | | | | | | | | | - | | | | | | | | | | | | - | | | | | | | | | | | | - | | | | | | | | | | | | (52,156) | | | | (l) | | | | | | | | (52,156) | |
Class R4 | | | | | | | - | | | | | | | | | | | | - | | | | | | | | | | | | (45,898) | | | | | | | | | | | | - | | | | | | | | | | | | 41,687 | | | | (l) | | | | | | | | (4,211) | |
Recapture of previously waived and/or reimbursed fees: | | | | | | | | | | | | | | | | | | | | | | | | | | | | | | | | | | | | | | | | | | | | | | | | | | | | | | | | | | | | | | | | | | | | |
Class A | | | | | | | - | | | | | | | | | | | | - | | | | | | | | | | | | - | | | | | | | | | | | | 107 | | | | | | | | | | | | - | | | | | | | | | | | | 107 | |
Class C | | | | | | | - | | | | | | | | | | | | - | | | | | | | | | | | | - | | | | | | | | | | | | 60 | | | | | | | | | | | | - | | | | | | | | | | | | 60 | |
Class I | | | | | | | - | | | | | | | | | | | | - | | | | | | | | | | | | - | | | | | | | | | | | | 147 | | | | | | | | | | | | - | | | | | | | | | | | | 147 | |
| | | | | | | | | | | | | | | | | | | | | | | | | | | | | | | | | | | | | | | | | | | | | | | | | | | | | | | | | | | | | | | | | | | | |
Net expenses | | | | | | | 1,986,330 | | | | | | | | | | | | 408,961 | | | | | | | | | | | | 33,623 | | | | | | | | | | | | 1,434,681 | | | | | | | | | | | | (103,678) | | | | | | | | | | | | 3,759,917 | |
| | | | | | | | | | | | | | | | | |
Net investment income (loss) | | | | | | | 2,883,491 | | | | | | | | | | | | 374,238 | | | | | | | | | | | | 123,999 | | | | | | | | | | | | 1,420,288 | | | | | | | | | | | | (837,143) | | | | | | | | | | | | 3,964,873 | |
| | | | | | | | | | | | | | | | | | | | | | | | | | | | | | | | | | | | | | | | | | | | |
| | | | | | | | | | | | | | | | | |
Net realized gain (loss) on: | | | | | | | | | | | | | | | | | | | | | | | | | | | | | | | | | | | | | | | | | | | | | | | | | | | | | | | | | | | | | | | | | | | | |
Allocated from series portfolio | | | | | | | - | | | | | | | | | | | | (4,653,616) | | | | | | | | | | | | (934,090) | | | | | | | | | | | | - | | | | | | | | | | | | 5,587,706 | | | | (b) | | | | | | | | - | |
Investments | | | | | | | (17,144,620) | | | | | | | | | | | | - | | | | | | | | | | | | - | | | | | | | | | | | | (18,713,068) | | | | | | | | | | | | - | | | | | | | | | | | | (35,857,688) | |
Securities sold short | | | | | | | (144) | | | | | | | | | | | | - | | | | | | | | | | | | - | | | | | | | | | | | | - | | | | | | | | | | | | - | | | | | | | | | | | | (144) | |
Foreign currency transactions | | | | | | | (457) | | | | | | | | | | | | - | | | | | | | | | | | | - | | | | | | | | | | | | (11) | | | | | | | | | | | | - | | | | | | | | | | | | (468) | |
| | | | | | | | | | | | | | | | | | | | | | | | | | | | | | | | | | | | | | | | | | | | |
Net realized gain (loss) | | | | | | | (17,145,221) | | | | | | | | | | | | (4,653,616) | | | | | | | | | | | | (934,090) | | | | | | | | | | | | (18,713,079) | | | | | | | | | | | | 5,587,706 | | | | | | | | | | | | (35,858,300) | |
| | | | | | | | | | | | | | | | | | | | | | | | | | | | | | | | | | | | | | | | | | | | |
| | | | | | | | | | | | | | | | | |
Net change in unrealized appreciation (depreciation) on: | | | | | | | | | | | | | | | | | | | | | | | | | | | | | | | | | | | | | | | | | | | | | | | | | | | | | | | | | | | | | | | | | | | | |
Allocated from series portfolio | | | | | | | - | | | | | | | | | | | | (43,802) | | | | | | | | | | | | (5,137) | | | | | | | | | | | | - | | | | | | | | | | | | 48,939 | | | | (b) | | | | | | | | - | |
Investments | | | | | | | (130,173) | | | | | | | | | | | | - | | | | | | | | | | | | - | | | | | | | | | | | | 2,463,242 | | | | | | | | | | | | - | | | | | | | | | | | | 2,333,069 | |
Translation of assets and liabilities denominated in foreign currencies | | | | | | | - | | | | | | | | | | | | - | | | | | | | | | | | | - | | | | | | | | | | | | 3 | | | | | | | | | | | | - | | | | | | | | | | | | 3 | |
| | | | | | | | | | | | | | | | | | | | | | | | | | | | | | | | | | | | | | | | | | | | |
Net change in unrealized appreciation (depreciation) | | | | | | | (130,173) | | | | | | | | | | | | (43,802) | | | | | | | | | | | | (5,137) | | | | | | | | | | | | 2,463,245 | | | | | | | | | | | | 48,939 | | | | | | | | | | | | 2,333,072 | |
| | | | | | | | | | | | | | | | | | | | | | | | | | | | | | | | | | | | | | | | | | | | |
| | | | | | | | | | | | | | | | | |
Net realized and change in unrealized gain (loss) | | | | | | | (17,275,394) | | | | | | | | | | | | (4,697,418) | | | | | | | | | | | | (939,227) | | | | | | | | | | | | (16,249,834) | | | | | | | | | | | | 5,636,645 | | | | | | | | | | | | (33,525,228) | |
| | | | | | | | | | | | | | | | | | | | | | | | | | | | | | | | | | | | | | | | | | | | |
| | | | | | | | | | | | | | | | | |
Net increase (decrease) in net assets resulting from operations | | | $ | | | | (14,391,903) | | | | | | | | $ | | | | (4,323,180) | | | | | | | | $ | | | | (815,228) | | | | | | | | $ | | | | (14,829,546) | | | | | | | | $ | | | | 4,799,502 | | | | | | | | $ | | | | (29,560,354) | |
| | | | | | | | | | | | | | | | | | | | | | | | | | | | | | | | | | | | | | | | | | | | |
(a)-(l) See Note 2 of the Notes to the Pro Forma Financial Statements.
THE NOTES TO THE PRO FORMA FINANCIAL STATEMENTS ARE AN INTEGRAL PART OF THIS REPORT.
S-42
Group Eight Reorganization Between:
TRANSAMERICA PARTNERS SMALL GROWTH
TRANSAMERICA PARTNERS INSTITUTIONAL SMALL GROWTH
TRANSAMERICA PARTNERS SMALL GROWTH PORTFOLIO
AND
TRANSAMERICA SMALL CAP GROWTH
PRO FORMA SCHEDULE OF INVESTMENTS
At June 30, 2016
Reorganization Between TPP Master and TAF
PRO FORMA SCHEDULE OF INVESTMENTS
At June 30, 2016
| | | | | | | | | | | | | | | | | | | | | | | | | | | | | | | | | | | | | | | | | | | | | | | | | | | | | | | | | | | | | | | | | | | | | | | | |
| | | | | | | | | | | | TPP Master | | | | | | TAF Destination | | | | | | Adjustments | | | | | | Combined Pro Forma Destination | |
| | | | | | | | | | | | | | | | | | |
| | | Coupon Rate | | | Maturity Date | | | | | | Shares | | | | | | Value | | | | | | Shares | | | | | | Value | | | | | | Shares | | | | | | Value | | | | | | Shares | | | | | | Value | |
| | | | | | | | | | | | | | | | | | | | | | | | | | | | |
COMMON STOCKS - 97.5 % | | | | | | | | | | | | | | | | | | | | | | | | | | | | | | | | | | | | | | | | | | | | | | | | | | | | | | | | | | | | | | | | | | | | | | | | |
Auto Components | | | | | | | | | | | | | | | | | | | | | | | | | | | | | | | | | | | | | | | | | | | | | | | | | | | | | | | | | | | | | | | | | | | | | | | | |
Dorman Products, Inc. | | | | | | | | | | | | | | | 18,010 | | | | | | | $ | 1,030,172 | | | | | | | | 98,570 | | | | | | | $ | 5,638,204 | | | | | | | | | | | | | | | | | | | | | | | | 116,580 | | | | | | | $ | 6,668,376 | |
Drew Industries, Inc. | | | | | | | | | | | | | | | 15,310 | | | | | | | | 1,298,900 | | | | | | | | 83,790 | | | | | | | | 7,108,744 | | | | | | | | | | | | | | | | | | | | | | | | 99,100 | | | | | | | | 8,407,644 | |
Motorcar Parts of America, Inc. | | | | | | | | | | | | | | | 35,550 | | | | | | | | 966,249 | | | | | | | | 194,530 | | | | | | | | 5,287,325 | | | | | | | | | | | | | | | | | | | | | | | | 230,080 | | | | | | | | 6,253,574 | |
Banks | | | | | | | | | | | | | | | | | | | | | | | | | | | | | | | | | | | | | | | | | | | | | | | | | | | | | | | | | | | | | | | | | | | | | | | | |
BancorpSouth, Inc. | | | | | | | | | | | | | | | 27,440 | | | | | | | | 622,614 | | | | | | | | 150,190 | | | | | | | | 3,407,811 | | | | | | | | | | | | | | | | | | | | | | | | 177,630 | | | | | | | | 4,030,425 | |
LegacyTexas Financial Group, Inc. | | | | | | | | | | | | | | | 24,385 | | | | | | | | 656,201 | | | | | | | | 133,475 | | | | | | | | 3,591,812 | | | | | | | | | | | | | | | | | | | | | | | | 157,860 | | | | | | | | 4,248,013 | |
Pinnacle Financial Partners, Inc. | | | | | | | | | | | | | | | 33,560 | | | | | | | | 1,639,406 | | | | | | | | 183,710 | | | | | | | | 8,974,233 | | | | | | | | | | | | | | | | | | | | | | | | 217,270 | | | | | | | | 10,613,639 | |
PrivateBancorp, Inc. | | | | | | | | | | | | | | | 45,540 | | | | | | | | 2,005,126 | | | | | | | | 249,300 | | | | | | | | 10,976,679 | | | | | | | | | | | | | | | | | | | | | | | | 294,840 | | | | | | | | 12,981,805 | |
South State Corp. | | | | | | | | | | | | | | | 20,443 | | | | | | | | 1,391,146 | | | | | | | | 111,930 | | | | | | | | 7,616,836 | | | | | | | | | | | | | | | | | | | | | | | | 132,373 | | | | | | | | 9,007,982 | |
Texas Capital Bancshares, Inc. | | | | | | | | | | | | | | | 12,395 | | | | | | | | 579,590 | | | | | | | | 67,829 | | | | | | | | 3,171,684 | | | | | | | | | | | | | | | | | | | | | | | | 80,224 | | | | | | | | 3,751,274 | |
Biotechnology | | | | | | | | | | | | | | | | | | | | | | | | | | | | | | | | | | | | | | | | | | | | | | | | | | | | | | | | | | | | | | | | | | | | | | | | |
Eagle Pharmaceuticals, Inc. | | | | | | | | | | | | | | | 15,880 | | | | | | | | 615,985 | | | | | | | | 86,920 | | | | | | | | 3,371,627 | | | | | | | | | | | | | | | | | | | | | | | | 102,800 | | | | | | | | 3,987,612 | |
Repligen Corp. | | | | | | | | | | | | | | | 31,290 | | | | | | | | 856,095 | | | | | | | | 171,250 | | | | | | | | 4,685,400 | | | | | | | | | | | | | | | | | | | | | | | | 202,540 | | | | | | | | 5,541,495 | |
Building Products | | | | | | | | | | | | | | | | | | | | | | | | | | | | | | | | | | | | | | | | | | | | | | | | | | | | | | | | | | | | | | | | | | | | | | | | |
Advanced Drainage Systems, Inc. | | | | | | | | | | | | | | | 30,910 | | | | | | | | 846,007 | | | | | | | | 169,190 | | | | | | | | 4,630,730 | | | | | | | | | | | | | | | | | | | | | | | | 200,100 | | | | | | | | 5,476,737 | |
Trex Co., Inc. | | | | | | | | | | | | | | | 23,460 | | | | | | | | 1,053,823 | | | | | | | | 128,420 | | | | | | | | 5,768,626 | | | | | | | | | | | | | | | | | | | | | | | | 151,880 | | | | | | | | 6,822,449 | |
Commercial Services & Supplies | | | | | | | | | | | | | | | | | | | | | | | | | | | | | | | | | | | | | | | | | | | | | | | | | | | | | | | | | | | | | | | | | | | | | | | | |
Knoll, Inc. | | | | | | | | | | | | | | | 40,290 | | | | | | | | 978,241 | | | | | | | | 220,535 | | | | | | | | 5,354,590 | | | | | | | | | | | | | | | | | | | | | | | | 260,825 | | | | | | | | 6,332,831 | |
Diversified Financial Services | | | | | | | | | | | | | | | | | | | | | | | | | | | | | | | | | | | | | | | | | | | | | | | | | | | | | | | | | | | | | | | | | | | | | | | | |
MarketAxess Holdings, Inc. | | | | | | | | | | | | | | | 6,880 | | | | | | | | 1,000,352 | | | | | | | | 37,640 | | | | | | | | 5,472,856 | | | | | | | | | | | | | | | | | | | | | | | | 44,520 | | | | | | | | 6,473,208 | |
Diversified Telecommunication Services | | | | | | | | | | | | | | | | | | | | | | | | | | | | | | | | | | | | | | | | | | | | | | | | | | | | | | | | | | | | | | | | | | | | | | | | |
Cogent Communications Holdings, Inc. | | | | | | | | | | | | | | | 31,720 | | | | | | | | 1,270,703 | | | | | | | | 173,630 | | | | | | | | 6,955,618 | | | | | | | | | | | | | | | | | | | | | | | | 205,350 | | | | | | | | 8,226,321 | |
Food Products | | | | | | | | | | | | | | | | | | | | | | | | | | | | | | | | | | | | | | | | | | | | | | | | | | | | | | | | | | | | | | | | | | | | | | | | |
B&G Foods, Inc. | | | | | | | | | | | | | | | 27,090 | | | | | | | | 1,305,738 | | | | | | | | 148,310 | | | | | | | | 7,148,542 | | | | | | | | | | | | | | | | | | | | | | | | 175,400 | | | | | | | | 8,454,280 | |
Calavo Growers, Inc. | | | | | | | | | | | | | | | 21,810 | | | | | | | | 1,461,270 | | | | | | | | 119,360 | | | | | | | | 7,997,120 | | | | | | | | | | | | | | | | | | | | | | | | 141,170 | | | | | | | | 9,458,390 | |
J&J Snack Foods Corp. | | | | | | | | | | | | | | | 9,391 | | | | | | | | 1,120,065 | | | | | | | | 51,400 | | | | | | | | 6,130,478 | | | | | | | | | | | | | | | | | | | | | | | | 60,791 | | | | | | | | 7,250,543 | |
TreeHouse Foods, Inc. | | | | | | | | | | | | | | | 10,710 | | | | | | | | 1,099,381 | | | | | | | | 58,610 | | | | | | | | 6,016,317 | | | | | | | | | | | | | | | | | | | | | | | | 69,320 | | | | | | | | 7,115,698 | |
Health Care Equipment & Supplies | | | | | | | | | | | | | | | | | | | | | | | | | | | | | | | | | | | | | | | | | | | | | | | | | | | | | | | | | | | | | | | | | | | | | | | | |
Cantel Medical Corp. | | | | | | | | | | | | | | | 17,420 | | | | | | | | 1,197,277 | | | | | | | | 95,350 | | | | | | | | 6,553,405 | | | | | | | | | | | | | | | | | | | | | | | | 112,770 | | | | | | | | 7,750,682 | |
Neogen Corp. | | | | | | | | | | | | | | | 22,180 | | | | | | | | 1,247,625 | | | | | | | | 121,430 | | | | | | | | 6,830,437 | | | | | | | | | | | | | | | | | | | | | | | | 143,610 | | | | | | | | 8,078,062 | |
Vascular Solutions, Inc. | | | | | | | | | | | | | | | 14,269 | | | | | | | | 594,446 | | | | | | | | 85,504 | | | | | | | | 3,562,097 | | | | | | | | | | | | | | | | | | | | | | | | 99,773 | | | | | | | | 4,156,543 | |
Health Care Providers & Services | | | | | | | | | | | | | | | | | | | | | | | | | | | | | | | | | | | | | | | | | | | | | | | | | | | | | | | | | | | | | | | | | | | | | | | | |
Aceto Corp. | | | | | | | | | | | | | | | 45,289 | | | | | | | | 991,376 | | | | | | | | 247,910 | | | | | | | | 5,426,750 | | | | | | | | | | | | | | | | | | | | | | | | 293,199 | | | | | | | | 6,418,126 | |
Providence Service Corp. | | | | | | | | | | | | | | | 19,281 | | | | | | | | 865,332 | | | | | | | | 105,560 | | | | | | | | 4,737,533 | | | | | | | | | | | | | | | | | | | | | | | | 124,841 | | | | | | | | 5,602,865 | |
Health Care Technology | | | | | | | | | | | | | | | | | | | | | | | | | | | | | | | | | | | | | | | | | | | | | | | | | | | | | | | | | | | | | | | | | | | | | | | | |
Medidata Solutions, Inc. | | | | | | | | | | | | | | | 29,599 | | | | | | | | 1,387,305 | | | | | | | | 162,020 | | | | | | | | 7,593,877 | | | | | | | | | | | | | | | | | | | | | | | | 191,619 | | | | | | | | 8,981,182 | |
Hotels, Restaurants & Leisure | | | | | | | | | | | | | | | | | | | | | | | | | | | | | | | | | | | | | | | | | | | | | | | | | | | | | | | | | | | | | | | | | | | | | | | | |
Popeyes Louisiana Kitchen, Inc. | | | | | | | | | | | | | | | 21,648 | | | | | | | | 1,182,847 | | | | | | | | 118,486 | | | | | | | | 6,474,075 | | | | | | | | | | | | | | | | | | | | | | | | 140,134 | | | | | | | | 7,656,922 | |
Sonic Corp. | | | | | | | | | | | | | | | 50,342 | | | | | | | | 1,361,751 | | | | | | | | 275,560 | | | | | | | | 7,453,898 | | | | | | | | | | | | | | | | | | | | | | | | 325,902 | | | | | | | | 8,815,649 | |
Internet Software & Services | | | | | | | | | | | | | | | | | | | | | | | | | | | | | | | | | | | | | | | | | | | | | | | | | | | | | | | | | | | | | | | | | | | | | | | | |
LogMeIn, Inc. | | | | | | | | | | | | | | | 18,680 | | | | | | | | 1,184,872 | | | | | | | | 102,250 | | | | | | | | 6,485,717 | | | | | | | | | | | | | | | | | | | | | | | | 120,930 | | | | | | | | 7,670,589 | |
SPS Commerce, Inc. | | | | | | | | | | | | | | | 18,170 | | | | | | | | 1,101,102 | | | | | | | | 99,470 | | | | | | | | 6,027,882 | | | | | | | | | | | | | | | | | | | | | | | | 117,640 | | | | | | | | 7,128,984 | |
IT Services | | | | | | | | | | | | | | | | | | | | | | | | | | | | | | | | | | | | | | | | | | | | | | | | | | | | | | | | | | | | | | | | | | | | | | | | |
Luxoft Holding, Inc. | | | | | | | | | | | | | | | 38,800 | | | | | | | | 542,465 | | | | | | | | 212,380 | | | | | | | | 2,968,781 | | | | | | | | | | | | | | | | | | | | | | | | 251,180 | | | | | | | | 3,511,246 | |
MAXIMUS, Inc. | | | | | | | | | | | | | | | 10,428 | | | | | | | | 2,148,356 | | | | | | | | 57,070 | | | | | | | | 11,759,481 | | | | | | | | | | | | | | | | | | | | | | | | 67,498 | | | | | | | | 13,907,837 | |
Life Sciences Tools & Services | | | | | | | | | | | | | | | | | | | | | | | | | | | | | | | | | | | | | | | | | | | | | | | | | | | | | | | | | | | | | | | | | | | | | | | | |
Cambrex Corp. | | | | | | | | | | | | | | | 37,079 | | | | | | | | 1,918,096 | | | | | | | | 202,970 | | | | | | | | 10,499,638 | | | | | | | | | | | | | | | | | | | | | | | | 240,049 | | | | | | | | 12,417,734 | |
ICON PLC | | | | | | | | | | | | | | | 35,530 | | | | | | | | 1,021,446 | | | | | | | | 194,460 | | | | | | | | 5,590,299 | | | | | | | | | | | | | | | | | | | | | | | | 229,990 | | | | | | | | 6,611,745 | |
PRA Health Sciences, Inc. | | | | | | | | | | | | | | | 14,590 | | | | | | | | 1,483,733 | | | | | | | | 79,850 | | | | | | | | 8,120,650 | | | | | | | | | | | | | | | | | | | | | | | | 94,440 | | | | | | | | 9,604,383 | |
Oil, Gas & Consumable Fuels | | | | | | | | | | | | | | | | | | | | | | | | | | | | | | | | | | | | | | | | | | | | | | | | | | | | | | | | | | | | | | | | | | | | | | | | |
Callon Petroleum Co. | | | | | | | | | | | | | | | 58,309 | | | | | | | | 654,810 | | | | | | | | 319,190 | | | | | | | | 3,584,504 | | | | | | | | | | | | | | | | | | | | | | | | 377,499 | | | | | | | | 4,239,314 | |
Matador Resources Co. | | | | | | | | | | | | | | | 31,040 | | | | | | | | 614,592 | | | | | | | | 169,910 | | | | | | | | 3,364,218 | | | | | | | | | | | | | | | | | | | | | | | | 200,950 | | | | | | | | 3,978,810 | |
Memorial Resource Development Corp. | | | | | | | | | | | | | | | 41,240 | | | | | | | | 654,891 | | | | | | | | 226,010 | | | | | | | | 3,589,039 | | | | | | | | | | | | | | | | | | | | | | | | 267,250 | | | | | | | | 4,243,930 | |
Oasis Petroleum, Inc. | | | | | | | | | | | | | | | 32,710 | | | | | | | | 305,511 | | | | | | | | 179,040 | | | | | | | | 1,672,234 | | | | | | | | | | | | | | | | | | | | | | | | 211,750 | | | | | | | | 1,977,745 | |
PDC Energy, Inc. | | | | | | | | | | | | | | | 10,850 | | | | | | | | 625,069 | | | | | | | | 59,410 | | | | | | | | 3,422,610 | | | | | | | | | | | | | | | | | | | | | | | | 70,260 | | | | | | | | 4,047,679 | |
Personal Products | | | | | | | | | | | | | | | | | | | | | | | | | | | | | | | | | | | | | | | | | | | | | | | | | | | | | | | | | | | | | | | | | | | | | | | | |
Inter Parfums, Inc. | | | | | | | | | | | | | | | 27,150 | | | | | | | | 775,676 | | | | | | | | 148,584 | | | | | | | | 4,245,045 | | | | | | | | | | | | | | | | | | | | | | | | 175,734 | | | | | | | | 5,020,721 | |
Pharmaceuticals | | | | | | | | | | | | | | | | | | | | | | | | | | | | | | | | | | | | | | | | | | | | | | | | | | | | | | | | | | | | | | | | | | | | | | | | |
Prestige Brands Holdings, Inc. | | | | | | | | | | | | | | | 36,605 | | | | | | | | 2,027,917 | | | | | | | | 200,370 | | | | | | | | 11,100,498 | | | | | | | | | | | | | | | | | | | | | | | | 236,975 | | | | | | | | 13,128,415 | |
Supernus Pharmaceuticals, Inc. | | | | | | | | | | | | | | | 95,983 | | | | | | | | 1,955,174 | | | | | | | | 525,370 | | | | | | | | 10,701,787 | | | | | | | | | | | | | | | | | | | | | | | | 621,353 | | | | | | | | 12,656,961 | |
Professional Services | | | | | | | | | | | | | | | | | | | | | | | | | | | | | | | | | | | | | | | | | | | | | | | | | | | | | | | | | | | | | | | | | | | | | | | | |
CEB, Inc. | | | | | | | | | | | | | | | 15,604 | | | | | | | | 962,455 | | | | | | | | 85,359 | | | | | | | | 5,264,943 | | | | | | | | | | | | | | | | | | | | | | | | 100,963 | | | | | | | | 6,227,398 | |
WageWorks, Inc. | | | | | | | | | | | | | | | 35,720 | | | | | | | | 2,136,413 | | | | | | | | 195,540 | | | | | | | | 11,695,247 | | | | | | | | | | | | | | | | | | | | | | | | 231,260 | | | | | | | | 13,831,660 | |
Road & Rail | | | | | | | | | | | | | | | | | | | | | | | | | | | | | | | | | | | | | | | | | | | | | | | | | | | | | | | | | | | | | | | | | | | | | | | | |
Knight Transportation, Inc. | | | | | | | | | | | | | | | 38,909 | | | | | | | | 1,034,201 | | | | | | | | 212,980 | | | | | | | | 5,661,008 | | | | | | | | | | | | | | | | | | | | | | | | 251,889 | | | | | | | | 6,695,209 | |
Saia, Inc. | | | | | | | | | | | | | | | 22,710 | | | | | | | | 570,930 | | | | | | | | 124,290 | | | | | | | | 3,124,651 | | | | | | | | | | | | | | | | | | | | | | | | 147,000 | | | | | | | | 3,695,581 | |
S-43
| | | | | | | | | | | | | | | | | | | | | | | | | | | | | | | | | | | | | | | | | | | | | | | | | | | | | | | | | | | | | | | | | | | | | | | | |
| | | | | | | | | | | | TPP Master | | | | | | TAF Destination | | | | | | Adjustments | | | | | | Combined Pro Forma Destination | |
| | | | | | | | | | | | | | | | | | |
| | | Coupon Rate | | | Maturity Date | | | | | | Shares | | | | | | Value | | | | | | Shares | | | | | | Value | | | | | | Shares | | | | | | Value | | | | | | Shares | | | | | | Value | |
| | | | | | | | | | | | | | | | | | | | | | | | | | | | |
Semiconductors & Semiconductor Equipment | | | | | | | | | | | | | | | | | | | | | | | | | | | | | | | | | | | | | | | | | | | | | | | | | | | | | | | | | | | | | | | | | | | | | | | | |
CEVA, Inc. | | | | | | | | | | | | | | | 22,871 | | | | | | | $ | 621,405 | | | | | | | | 130,060 | | | | | | | $ | 3,533,730 | | | | | | | | | | | | | | | | | | | | | | | | 152,931 | | | | | | | $ | 4,155,135 | |
Silicon Laboratories, Inc. | | | | | | | | | | | | | | | 20,960 | | | | | | | | 1,021,590 | | | | | | | | 114,700 | | | | | | | | 5,590,478 | | | | | | | | | | | | | | | | | | | | | | | | 135,660 | | | | | | | | 6,612,068 | |
Software | | | | | | | | | | | | | | | | | | | | | | | | | | | | | | | | | | | | | | | | | | | | | | | | | | | | | | | | | | | | | | | | | | | | | | | | |
BroadSoft, Inc. | | | | | | | | | | | | | | | 19,891 | | | | | | | | 816,128 | | | | | | | | 108,850 | | | | | | | | 4,466,116 | | | | | | | | | | | | | | | | | | | | | | | | 128,741 | | | | | | | | 5,282,244 | |
Callidus Software, Inc. | | | | | | | | | | | | | | | 59,000 | | | | | | | | 1,178,820 | | | | | | | | 322,970 | | | | | | | | 6,452,941 | | | | | | | | | | | | | | | | | | | | | | | | 381,970 | | | | | | | | 7,631,761 | |
Ellie Mae, Inc. | | | | | | | | | | | | | | | 22,250 | | | | | | | | 2,039,212 | | | | | | | | 121,780 | | | | | | | | 11,161,137 | | | | | | | | | | | | | | | | | | | | | | | | 144,030 | | | | | | | | 13,200,349 | |
Pegasystems, Inc. | | | | | | | | | | | | | | | 35,250 | | | | | | | | 949,987 | | | | | | | | 192,940 | | | | | | | | 5,199,733 | | | | | | | | | | | | | | | | | | | | | | | | 228,190 | | | | | | | | 6,149,720 | |
Qualys, Inc. | | | | | | | | | | | | | | | 31,760 | | | | | | | | 946,766 | | | | | | | | 173,850 | | | | | | | | 5,182,469 | | | | | | | | | | | | | | | | | | | | | | | | 205,610 | | | | | | | | 6,129,235 | |
Specialty Retail | | | | | | | | | | | | | | | | | | | | | | | | | | | | | | | | | | | | | | | | | | | | | | | | | | | | | | | | | | | | | | | | | | | | | | | | |
Monro Muffler Brake, Inc. | | | | | | | | | | | | | | | 21,574 | | | | | | | | 1,371,243 | | | | | | | | 118,110 | | | | | | | | 7,507,072 | | | | | | | | | | | | | | | | | | | | | | | | 139,684 | | | | | | | | 8,878,315 | |
Textiles, Apparel & Luxury Goods | | | | | | | | | | | | | | | | | | | | | | | | | | | | | | | | | | | | | | | | | | | | | | | | | | | | | | | | | | | | | | | | | | | | | | | | |
G-III Apparel Group, Ltd. | | | | | | | | | | | | | | | 38,330 | | | | | | | | 1,752,448 | | | | | | | | 209,820 | | | | | | | | 9,592,970 | | | | | | | | | | | | | | | | | | | | | | | | 248,150 | | | | | | | | 11,345,418 | |
Steven Madden, Ltd. | | | | | | | | | | | | | | | 47,740 | | | | | | | | 1,631,753 | | | | | | | | 261,310 | | | | | | | | 8,931,576 | | | | | | | | | | | | | | | | | | | | | | | | 309,050 | | | | | | | | 10,563,329 | |
| | | | | | | | | | | | | | | | | | | | | | | | | | | | | | | | | | | | | | | | |
Total Common Stocks | | | | | | | | | | | | | | | | | | | | | | | 64,672,084 | | | | | | | | | | | | | | | | 354,433,758 | | | | | | | | | | | | | | | | | | | | | | | | | | | | | | | | 419,105,842 | |
| | | | | | | | | | | | | | | | | | | | | | | | | | | | | | | | | | | | | | | | |
| | | | | | | | | | | | | | | | | | | | | | | Total Cost ($57,910,910) | | | | | | | | | | | | | | | | Total Cost ($274,717,913) | | | | | | | | | | | | | | | | | | | | | | | | | | | | | | | | Total Cost ($332,628,823) | |
Securities Lending Collateral - 17.6 % | | | | | | | | | | | | | | | | | | | | | | | | | | | | | | | | | | | | | | | | | | | | | | | | | | | | | | | | | | | | | | | | | | | | | | | | |
State Street Navigator Securities Lending Trust - Prime Portfolio | | | 0.51 | % | | | | | | | | | | | 19,055,166 | | | | | | | | 19,055,166 | | | | | | | | 56,548,558 | | | | | | | | 56,548,558 | | | | | | | | | | | | | | | | | | | | | | | | 75,603,724 | | | | | | | | 75,603,724 | |
| | | | | | | | | | | | | | | | | | | | | | | | | | | | | | | | | | | | | | | | |
Total Securities Lending Collateral | | | | | | | | | | | | | | | | | | | | | | | 19,055,166 | | | | | | | | | | | | | | | | 56,548,558 | | | | | | | | | | | | | | | | | | | | | | | | | | | | | | | | 75,603,724 | |
| | | | | | | | | | | | | | | | | | | | | | | | | | | | | | | | | | | | | | | | |
| | | | | | | | | | | | | | | | | | | | | | | Total Cost ($19,055,166) | | | | | | | | | | | | | | | | Total Cost ($56,548,558) | | | | | | | | | | | | | | | | | | | | | | | | | | | | | | | | Total Cost ($75,603,724) | |
| | | | | | | | | | | | | | | | | | |
| | | | | | | | | | | | Principal | | | | | | Value | | | | | | Principal | | | | | | Value | | | | | | Principal | | | | | | Value | | | | | | Principal | | | | | | Value | |
| | | | | | | | | | | | | | | | | | | | | | | | | | | | | | | | | | | | | | | | |
Repurchase Agreement - 2.1 % | | | | | | | | | | | | | | | | | | | | | | | | | | | | | | | | | | | | | | | | | | | | | | | | | | | | | | | | | | | | | | | | | | | | | | | | |
State Street Bank & Trust Co. | | | 0.03 | % | | | 07/01/2016 | | | | | | | $ | 1,073,112 | | | | | | | | 1,073,112 | | | | | | | $ | 7,889,156 | | | | | | | | 7,889,156 | | | | | | | | | | | | | | | | | | | | | | | $ | 8,962,268 | | | | | | | | 8,962,268 | |
| | | | | | | | | | | | | | | | | | | | | | | | | | | | | | | | | | | | | | | | |
Total Repurchase Agreement | | | | | | | | | | | | | | | | | | | | | | | 1,073,112 | | | | | | | | | | | | | | | | 7,889,156 | | | | | | | | | | | | | | | | | | | | | | | | | | | | | | | | 8,962,268 | |
| | | | | | | | | | | | | | | | | | | | | | | | | | | | | | | | | | | | | | | | |
| | | | | | | | | | | | | | | | | | | | | | | Total Cost ($1,073,112) | | | | | | | | | | | | | | | | Total Cost ($7,889,156) | | | | | | | | | | | | | | | | | | | | | | | | | | | | | | | | Total Cost ($8,962,268) | |
| | | | | | | | | | |
| | | | | | | | | | | | | | | | | | | | | | | | | | | | | | | | | | | | | | | | |
Total Investments | | | | | | | | | | | | | | | | | | | | | | | 84,800,362 | | | | | | | | | | | | | | | | 418,871,472 | | | | | | | | | | | | | | | | | | | | | | | | | | | | | | | | 503,671,834 | |
| | | | | | | | | | | | | | | | | | | | | | | | | | | | | | | | | | | | | | | | |
| | | | | | | | | | | | | | | | | | | | | | | Total Cost ($78,039,188) | | | | | | | | | | | | | | | | Total Cost ($339,155,627) | | | | | | | | | | | | | | | | | | | | | | | | | | | | | | | | Total Cost ($417,194,815) | |
| | | | | | | | | | | | | | | | | | |
Other Assets and Liabilities - (17.2)% | | | | | | | | | | | | | | | | | | | | | | | (18,462,427 | ) | | | | | | | | | | | | | | | (55,245,512 | ) | | | | | | | | | | | | | | | (133,814 | ) (a) (c) | | | | | | | | | | | | | | | (73,841,753 | ) |
| | | | | | | | | | | | | | | | | | | | | | | | | | | | | | | | | | | | | | | | | | | | | | | | | | | | | | | | | | | | | | | | | | | | | | | | |
Net Assets | | | | | | | | | | | | | | | | | | | | | | | $66,337,935 | | | | | | | | | | | | | | | | $363,625,960 | | | | | | | | | | | | | | | | ($133,814 | ) | | | | | | | | | | | | | | | $429,830,081 | |
| | | | | | | | | | | | | | | | | | | | | | | | | | | | | | | | | | | | | | | | | | | | | | | | | | | | | | | | | | | | | | | | | | | | | | | | |
VALUATION SUMMARY:
| | | | | | | | | | | | | | | | | | | | | | | | | | | | | | | | | | | | | | | | | | | | | | | | | | | | | | | | |
| Investments | | Level 1 - Unadjusted
Quoted Prices | | | Level 2 - Other Significant Observable Inputs | | | Level 3 - Significant Unobservable Inputs | | | Value | | | | | | Level 1 - Unadjusted
Quoted Prices | | | Level 2 - Other Significant Observable Inputs | | | Level 3 - Significant Unobservable Inputs | | | Value | | | | | | Level 1 - Unadjusted
Quoted Prices | | | Level 2 - Other Significant Observable Inputs | | | Level 3 - Significant Unobservable Inputs | | | Value | |
Common Stocks | | $ | 64,672,084 | | | $ | - | | | $ | - | | | $ | 64,672,084 | | | | | | | $ | 354,433,758 | | | $ | - | | | $ | - | | | $ | 354,433,758 | | | | | | | $ | 419,105,842 | | | $ | - | | | $ | - | | | $ | 419,105,842 | |
Securities Lending Collateral | | | 19,055,166 | | | | - | | | | - | | | | 19,055,166 | | | | | | | | 56,548,558 | | | | - | | | | - | | | | 56,548,558 | | | | | | | | 75,603,724 | | | | - | | | | - | | | | 75,603,724 | |
Repurchase Agreement | | | - | | | | 1,073,112 | | | | - | | | | 1,073,112 | | | | | | | | - | | | | 7,889,156 | | | | - | | | | 7,889,156 | | | | | | | | - | | | | 8,962,268 | | | | - | | | | 8,962,268 | |
Total Investments | | $ | 83,727,250 | | | $ | 1,073,112 | | | $ | - | | | $ | 84,800,362 | | | | | | | $ | 410,982,316 | | | $ | 7,889,156 | | | $ | - | | | $ | 418,871,472 | | | | | | | $ | 494,709,566 | | | $ | 8,962,268 | | | $ | - | | | $ | 503,671,834 | |
(a)-(l) See Note 2 of the Notes to the Pro Forma Financial Statements.
As of June 30, 2016, all securities held by the Target Master Portfolio would comply with the investment restrictions of the Destination Fund.
S-44
Reorganization Between TPP Master, TPFG Feeder, TPFG II Feeder and TAF Destination
PRO FORMA STATEMENT OF ASSETS AND LIABILITIES
At June 30, 2016
| | | | | | | | | | | | | | | | | | | | | | | | | | | | | | | | | | | | | | | | | | | | | | | | | | | | | | | | | | | | | | | | | | |
| | | | | | TPP Master | | | | | | | | | TPFG Feeder | | | | | | | | | TPFG II Feeder | | | | | | | | | TAF Destination | | | | | | | | | Adjustments | | | | | | | | Combined Pro Forma
Destination | |
Assets: | | | | | | | | | | | | | | | | | | | | | | | | | | | | | | | | | | | | | | | | | | | | | | | | | | | | | | | | | | | | | | | | | | |
Investments, at value | | $ | | | | | 83,727,250 | | | | | | | $ | | | | | - | | | | | | | $ | | | | | - | | | | | | | $ | | | | | 410,982,316 | | | | | | | $ | | | | | - | | | | | $ | | | | | 494,709,566 | |
Repurchase agreements, at value | | | | | | | 1,073,112 | | | | | | | | | | | | - | | | | | | | | | | | | - | | | | | | | | | | | | 7,889,156 | | | | | | | | | | �� | | - | | | | | | | | | | 8,962,268 | |
Investments in Series Portfolio, at value | | | | | | | - | | | | | | | | | | | | 38,508,432 | | | | | | | | | | | | 10,671,631 | | | | | | | | | | | | - | | | | | | | | | | | | (49,180,063) | | | (b) | | | | | | | - | |
Cash | | | | | | | - | | | | | | | | | | | | - | | | | | | | | | | | | - | | | | | | | | | | | | - | | | | | | | | | | | | - | | | | | | | | | | - | |
Cash on deposit with broker | | | | | | | - | | | | | | | | | | | | - | | | | | | | | | | | | - | | | | | | | | | | | | - | | | | | | | | | | | | - | | | | | | | | | | - | |
Foreign currency, at value | | | | | | | - | | | | | | | | | | | | - | | | | | | | | | | | | - | | | | | | | | | | | | - | | | | | | | | | | | | - | | | | | | | | | | - | |
Receivables: | | | | | | | | | | | | | | | | | | | | | | | | | | | | | | | | | | | | | | | | | | | | | | | | | | | | | | | | | | | | | | | | | | |
Shares of beneficial interest sold | | | | | | | - | | | | | | | | | | | | - | | | | | | | | | | | | 1,007 | | | | | | | | | | | | 69,906 | | | | | | | | | | | | - | | | | | | | | | | 70,913 | |
Investments sold | | | | | | | 879,962 | | | | | | | | | | | | - | | | | | | | | | | | | - | | | | | | | | | | | | 2,828,274 | | | | | | | | | | | | - | | | | | | | | | | 3,708,236 | |
When-issued, delay-delivery, and forward commitment securities sold | | | | | | | - | | | | | | | | | | | | - | | | | | | | | | | | | - | | | | | | | | | | | | - | | | | | | | | | | | | - | | | | | | | | | | - | |
Interest | | | | | | | 1 | | | | | | | | | | | | - | | | | | | | | | | | | - | | | | | | | | | | | | 7 | | | | | | | | | | | | - | | | | | | | | | | 8 | |
Dividends | | | | | | | 23,171 | | | | | | | | | | | | - | | | | | | | | | | | | - | | | | | | | | | | | | 126,658 | | | | | | | | | | | | - | | | | | | | | | | 149,829 | |
Tax reclaims | | | | | | | - | | | | | | | | | | | | - | | | | | | | | | | | | - | | | | | | | | | | | | - | | | | | | | | | | | | - | | | | | | | | | | - | |
Net income from securities lending | | | | | | | 4,810 | | | | | | | | | | | | - | | | | | | | | | | | | - | | | | | | | | | | | | 17,795 | | | | | | | | | | | | - | | | | | | | | | | 22,605 | |
Due from advisor | | | | | | | - | | | | | | | | | | | | 1,119 | | | | | | | | | | | | 7,495 | | | | | | | | | | | | - | | | | | | | | | | | | - | | | | | | | | | | 8,614 | |
Money maarket waiver due from advisor | | | | | | | - | | | | | | | | | | | | - | | | | | | | | | | | | - | | | | | | | | | | | | - | | | | | | | | | | | | - | | | | | | | | | | - | |
Variation margin receivable | | | | | | | - | | | | | | | | | | | | - | | | | | | | | | | | | - | | | | | | | | | | | | - | | | | | | | | | | | | - | | | | | | | | | | - | |
Other | | | | | | | - | | | | | | | | | | | | - | | | | | | | | | | | | - | | | | | | | | | | | | | | | | | | | | | | | | - | | | | | | | | | | - | |
Prepaid Expenses | | | | | | | 205 | | | | | | | | | | | | 137 | | | | | | | | | | | | 37 | | | | | | | | | | | | 510 | | | | | | | | | | | | - | | | | | | | | | | 889 | |
OTC swap agreements, at value | | | | | | | - | | | | | | | | | | | | - | | | | | | | | | | | | - | | | | | | | | | | | | - | | | | | | | | | | | | - | | | | | | | | | | - | |
Unrealized appreciation on forward foreign currency contracts | | | | | | | - | | | | | | | | | | | | - | | | | | | | | | | | | - | | | | | | | | | | | | - | | | | | | | | | | | | - | | | | | | | | | | - | |
| | | | | | | | | | | | | | | | | | | | | | | | | | | | | | | | | | | | | | | | | | |
Total assets | | $ | | | | | 85,708,511 | | | | | | | $ | | | | | 38,509,688 | | | | | | | $ | | | | | 10,680,170 | | | | | | | $ | | | | | 421,914,622 | | | | | | | $ | | | | | (49,180,063) | | | | | $ | | | | | 507,632,928 | |
| | | | | | | | | | | | | | | | | | | | | | | | | | | | | | | | | | | | | | | | | | |
| | | | | | | | | | | | | | | | | |
Liabilities: | | | | | | | | | | | | | | | | | | | | | | | | | | | | | | | | | | | | | | | | | | | | | | | | | | | | | | | | | | | | | | | | | | |
Due to custodian | | | | | | | - | | | | | | | | | | | | - | | | | | | | | | | | | - | | | | | | | | | | | | - | | | | | | | | | | | | - | | | | | | | | | | - | |
Cash deposit due to broker | | | | | | | - | | | | | | | | | | | | - | | | | | | | | | | | | - | | | | | | | | | | | | - | | | | | | | | | | | | - | | | | | | | | | | - | |
Payables and other liabilities: | | | | | | | | | | | | | | | | | | | | | | | | | | | | | | | | | | | | | | | | | | | | | | | | | | | | | | | | | | | | | | | | | | |
Shares of beneficial interest redeemed | | | | | | | - | | | | | | | | | | | | 12,835 | | | | | | | | | | | | - | | | | | | | | | | | | 38,399 | | | | | | | | | | | | - | | | | | | | | | | 51,234 | |
Investments purchased | | | | | | | 253,303 | | | | | | | | | | | | - | | | | | | | | | | | | - | | | | | | | | | | | | 1,374,397 | | | | | | | | | | | | - | | | | | | | | | | 1,627,700 | |
When-issued, delay-delivery, and forward commitment securities purchased | | | | | | | - | | | | | | | | | | | | - | | | | | | | | | | | | - | | | | | | | | | | | | - | | | | | | | | | | | | - | | | | | | | | | | - | |
Investment advisory fees | | | | | | | 44,885 | | | | | | | | | | | | - | | | | | | | | | | | | - | | | | | | | | | | | | - | | | | | | | | | | | | - | | | | | | | | | | 44,885 | |
Investment management fees | | | | | | | - | | | | | | | | | | | | - | | | | | | | | | | | | - | | | | | | | | | | | | 256,674 | | | | | | | | | | | | - | | | | | | | | | | 256,674 | |
Administration/Investment advisory fees | | | | | | | - | | | | | | | | | | | | 9,388 | | | | | | | | | | | | 436 | | | | | | | | | | | | - | | | | | | | | | | | | - | | | | | | | | | | 9,824 | |
Administration fees | | | | | | | - | | | | | | | | | | | | - | | | | | | | | | | | | - | | | | | | | | | | | | - | | | | | | | | | | | | - | | | | | | | | | | - | |
Distribution and service fees | | | | | | | - | | | | | | | | | | | | 7,823 | | | | | | | | | | | | 2,180 | | | | | | | | | | | | 1,998 | | | | | | | | | | | | - | | | | | | | | | | 12,001 | |
Transfer agent fees | | | | | | | - | | | | | | | | | | | | - | | | | | | | | | | | | - | | | | | | | | | | | | 2,674 | | | | | | | | | | | | - | | | | | | | | | | 2,674 | |
Trustee, CCO and deferred compensation fees | | | | | | | 130 | | | | | | | | | | | | 86 | | | | | | | | | | | | 19 | | | | | | | | | | | | 599 | | | | | | | | | | | | - | | | | | | | | | | 834 | |
Audit and tax fees | | | | | | | 11,926 | | | | | | | | | | | | 4,438 | | | | | | | | | | | | 3,997 | | | | | | | | | | | | 12,477 | | | | | | | | | | | | - | | | | | | | | | | 32,838 | |
Custody and accounting fees | | | | | | | 3,119 | | | | | | | | | | | | 1,831 | | | | | | | | | | | | 1,831 | | | | | | | | | | | | 12,760 | | | | | | | | | | | | - | | | | | | | | | | 19,541 | |
Legal fees | | | | | | | 1,087 | | | | | | | | | | | | 720 | | | | | | | | | | | | 188 | | | | | | | | | | | | 7,714 | | | | | | | | | | | | - | | | | | | | | | | 9,709 | |
Printing and shareholder reports fees | | | | | | | 395 | | | | | | | | | | | | 1,633 | | | | | | | | | | | | 250 | | | | | | | | | | | | 11,074 | | | | | | | | | | | | - | | | | | | | | | | 13,352 | |
Registration fees | | | | | | | - | | | | | | | | | | | | 4,756 | | | | | | | | | | | | 1,400 | | | | | | | | | | | | 18,958 | | | | | | | | | | | | - | | | | | | | | | | 25,114 | |
Dividends, interest and fees for borrowings from securities sold short | | | | | | | - | | | | | | | | | | | | - | | | | | | | | | | | | - | | | | | | | | | | | | - | | | | | | | | | | | | - | | | | | | | | | | - | |
Interest | | | | | | | - | | | | | | | | | | | | - | | | | | | | | | | | | - | | | | | | | | | | | | - | | | | | | | | | | | | - | | | | | | | | | | - | |
Distribution payable to shareholders | | | | | | | - | | | | | | | | | | | | - | | | | | | | | | | | | - | | | | | | | | | | | | - | | | | | | | | | | | | - | | | | | | | | | | - | |
Other | | | | | | | 565 | | | | | | | | | | | | 240 | | | | | | | | | | | | 70 | | | | | | | | | | | | 2,380 | | | | | | | | | | | | 89,488 | | | (c) | | | | | | | 92,743 | |
Collateral for securities on loan | | | | | | | 19,055,166 | | | | | | | | | | | | - | | | | | | | | | | | | - | | | | | | | | | | | | 56,548,558 | | | | | | | | | | | | - | | | | | | | | | | 75,603,724 | |
Securities sold short, at value | | | | | | | - | | | | | | | | | | | | - | | | | | | | | | | | | - | | | | | | | | | | | | - | | | | | | | | | | | | - | | | | | | | | | | - | |
Written options and swaptions, at value | | | | | | | - | | | | | | | | | | | | - | | | | | | | | | | | | - | | | | | | | | | | | | - | | | | | | | | | | | | - | | | | | | | | | | - | |
OTC swap agreements, at value | | | | | | | - | | | | | | | | | | | | - | | | | | | | | | | | | - | | | | | | | | | | | | - | | | | | | | | | | | | - | | | | | | | | | | - | |
Unrealized depreciation on forward foreign currency contracts | | | | | | | - | | | | | | | | | | | | - | | | | | | | | | | | | - | | | | | | | | | | | | - | | | | | | | | | | | | - | | | | | | | | | | - | |
| | | | | | | | | | | | | | | | | | | | | | | | | | | | | | | | | | | | | | | | | | |
Total liabilities | | | | | | | 19,370,576 | | | | | | | | | | | | 43,750 | | | | | | | | | | | | 10,371 | | | | | | | | | | | | 58,288,662 | | | | | | | | | | | | 89,488 | | | | | | | | | | 77,802,847 | |
| | | | | | | | | | | | | | | | | | | | | | | | | | | | | | | | | | | | | | | | | | |
Net Assets | | $ | | | | | 66,337,935 | | | | | | | $ | | | | | 38,465,938 | | | | | | | $ | | | | | 10,669,799 | | | | | | | $ | | | | | 363,625,960 | | | | | | | $ | | | | | (49,269,551) | | | | | $ | | | | | 429,830,081 | |
| | | | | | | | | | | | | | | | | | | | | | | | | | | | | | | | | | | | | | | | | | |
| | | | | | | | | | | | | | | | | |
Net Assets Consist of: | | | | | | | | | | | | | | | | | | | | | | | | | | | | | | | | | | | | | | | | | | | | | | | | | | | | | | | | | | | | | | | | | | |
Paid-in capital | | $ | | | | | (2,398,053) | | | | | | | | | | | | 36,925,907 | | | | | | | | | | | | 7,595,904 | | | | | | | | | | | | 259,142,072 | | | | | | | $ | | | | | 23,111,373 | | | (d) | | $ | | | | | 324,377,203 | |
Undistributed (distributions in excess of) net investment income (loss) | | | | | | | (4,873,119) | | | | | | | | | | | | (180,253) | | | | | | | | | | | | (28,572) | | | | | | | | | | | | (842,965) | | | | | | | | | | | | 5,081,944 | | | (d) | | | | | | | (842,965) | |
Accumulated net realized gain (loss) | | | | | | | 66,847,933 | | | | | | | | | | | | 2,996,865 | | | | | | | | | | | | 856,896 | | | | | | | | | | | | 25,611,008 | | | | | | | | | | | | (70,701,694) | | | (d) | | | | | | | 25,611,008 | |
Net unrealized appreciation (depreciation) on: | | | | | | | | | | | | | | | | | | | | | | | | | | | | | | | | | | | | | | | | | | | | | | | | | | | | | | | | | | | | | | | | | | |
Investments | | | | | | | 6,761,174 | | | | | | | | | | | | | | | | | | | | | | | | - | | | | | | | | | | | | 79,715,845 | | | | | | | | | | | | (6,761,174) | | | (d) | | | | | | | 79,715,845 | |
Allocated from Series Portfolio | | | | | | | - | | | | | | | | | | | | (1,276,581) | | | | | | | | | | | | 2,245,571 | | | | | | | | | | | | - | | | | | | | | | | | | - | | | | | | | | | | 968,990 | |
Securities sold short | | | | | | | - | | | | | | | | | | | | - | | | | | | | | | | | | - | | | | | | | | | | | | - | | | | | | | | | | | | - | | | | | | | | | | - | |
Written options and swaptions | | | | | | | - | | | | | | | | | | | | - | | | | | | | | | | | | - | | | | | | | | | | | | - | | | | | | | | | | | | - | | | | | | | | | | - | |
Swap agreements | | | | | | | - | | | | | | | | | | | | - | | | | | | | | | | | | - | | | | | | | | | | | | - | | | | | | | | | | | | - | | | | | | | | | | - | |
Futures contracts | | | | | | | - | | | | | | | | | | | | - | | | | | | | | | | | | - | | | | | | | | | | | | - | | | | | | | | | | | | - | | | | | | | | | | - | |
Translation of assets and liabilities denominated in foreign currencies | | | | | | | - | | | | | | | | | | | | - | | | | | | | | | | | | - | | | | | | | | | | | | - | | | | | | | | | | | | - | | | | | | | | | | - | |
| | | | | | | | | | | | | | | | | | | | | | | | | | | | | | | | | | | | | | | | | | |
| | | | | | | | | | | | | | | | | |
Net Assets | | $ | | | | | 66,337,935 | | | | | | | $ | | | | | 38,465,938 | | | | | | | $ | | | | | 10,669,799 | | | | | | | $ | | | | | 363,625,960 | | | | | | | $ | | | | | (49,269,551) | | | | | $ | | | | | 429,830,081 | |
| | | | | | | | | | | | | | | | | | | | | | | | | | | | | | | | | | | | | | | | | | |
| | | | | | | - | | | | | | | | | | | | - | | | | | | | | | | | | - | | | | | | | | | | | | - | | | | | | | | | | | | - | | | | | | | | | | | |
Net assets by class: | | | | | | | | | | | | | | | | | | | - | | | | | | | | | | | | - | | | | | | | | | | | | - | | | | | | | | | | | | | | | | | | | | | | | |
Class A | | $ | | | | | - | | | | | | | $ | | | | | - | | | | | | | $ | | | | | - | | | | | | | $ | | | | | 5,137,203 | | | | | | | $ | | | | | - | | | | | $ | | | | | 5,137,203 | |
Class B | | | | | | | - | | | | | | | | | | | | - | | | | | | | | | | | | - | | | | | | | | | | | | - | | | | | | | | | | | | - | | | | | | | | | | - | |
Class C | | | | | | | - | | | | | | | | | | | | - | | | | | | | | | | | | - | | | | | | | | | | | | 1,236,172 | | | | | | | | | | | | - | | | | | | | | | | 1,236,172 | |
Class I | | | | | | | - | | | | | | | | | | | | - | | | | | | | | | | | | - | | | | | | | | | | | | 1,122,441 | | | | | | | | | | | | - | | | | | | | | | | 1,122,441 | |
Class I2 | | | | | | | - | | | | | | | | | | | | - | | | | | | | | | | | | - | | | | | | | | | | | | 356,130,144 | | | | | | | | | | | | - | | | | | | | | | | 356,130,144 | |
Class I3 | | | | | | | 17,157,872 | | | | | | | | | | | | - | | | | | | | | | | | | - | | | | | | | | | | | | - | | | | | | | | | | | | (89,488) | | | (c) | | | | | | | 17,068,384 | |
Class T | | | | | | | - | | | | | | | | | | | | - | | | | | | | | | | | | - | | | | | | | | | | | | - | | | | | | | | | | | | - | | | | | | | | | | - | |
Class R | | | | | | | - | | | | | | | | | | | | 38,465,938 | | | | | | | | | | | | - | | | | | | | | | | | | - | | | | | | | | | | | | - | | | | | | | | | | 38,465,938 | |
Class R4 | | | | | | | - | | | | | | | | | | | | - | | | | | | | | | | | | 10,669,799 | | | | | | | | | | | | - | | | | | | | | | | | | - | | | | | | | | | | 10,669,799 | |
Class R6 | | | | | | | - | | | | | | | | | | | | - | | | | | | | | | | | | - | | | | | | | | | | | | - | | | | | | | | | | | | - | | | | | | | | | | - | |
Shares outstanding (unlimited shares, no par value): | | | | | | | | | | | | | | | | | | | | | | | | | | | | | | | | | | | | | | | | | | | - | | | | | | | | | | | | | | | | | | | | | | | |
Class A | | | | | | | - | | | | | | | | | | | | - | | | | | | | | | | | | - | | | | | | | | | | | | 425,935 | | | | | | | | | | | | - | | | | | | | | | | 425,935 | |
Class B | | | | | | | - | | | | | | | | | | | | - | | | | | | | | | | | | - | | | | | | | | | | | | - | | | | | | | | | | | | - | | | | | | | | | | - | |
Class C | | | | | | | - | | | | | | | | | | | | - | | | | | | | | | | | | - | | | | | | | | | | | | 105,517 | | | | | | | | | | | | - | | | | | | | | | | 105,517 | |
Class I | | | | | | | - | | | | | | | | | | | | - | | | | | | | | | | | | - | | | | | | | | | | | | 92,002 | | | | | | | | | | | | - | | | | | | | | | | 92,002 | |
Class I2 | | | | | | | - | | | | | | | | | | | | - | | | | | | | | | | | | - | | | | | | | | | | | | 29,046,949 | | | | | | | | | | | | - | | | | | | | | | | 29,046,949 | |
Class I3 | | | | | | | 1,399,500 | | | | | | | | | | | | - | | | | | | | | | | | | - | | | | | | | | | | | | - | | | | | | | | | | | | - | | | | | | | | | | 1,399,500 | |
Class T | | | | | | | - | | | | | | | | | | | | - | | | | | | | | | | | | - | | | | | | | | | | | | - | | | | | | | | | | | | - | | | | | | | | | | - | |
Class R | | | | | | | - | | | | | | | | | | | | 2,279,470 | | | | | | | | | | | | - | | | | | | | | | | | | - | | | | | | | | | | | | 858,045 | | | (e) | | | | | | | 3,137,515 | |
Class R4 | | | | | | | - | | | | | | | | | | | | - | | | | | | | | | | | | 555,477 | | | | | | | | | | | | - | | | | | | | | | | | | 314,817 | | | (e) | | | | | | | 870,294 | |
Class R6 | | | | | | | - | | | | | | | | | | | | - | | | | | | | | | | | | - | | | | | | | | | | | | - | | | | | | | | | | | | - | | | | | | | | | | - | |
Net asset value per share: | | | | | | | | | | | | | | | | | | | | | | | | | | | | | | | | | | | | | | | | | | | | | | | | | | | | | | | | | | | | | | | | | | |
Class A | | $ | | | | | - | | | | | | | $ | | | | | - | | | | | | | $ | | | | | - | | | | | | | $ | | | | | 12.06 | | | | | | | | | | | | - | | | | | $ | | | | | 12.06 | |
Class B | | | | | | | - | | | | | | | | | | | | - | | | | | | | | | | | | - | | | | | | | | | | | | - | | | | | | | | | | | | - | | | | | | | | | | - | |
Class C | | | | | | | - | | | | | | | | | | | | - | | | | | | | | | | | | - | | | | | | | | | | | | 11.72 | | | | | | | | | | | | - | | | | | | | | | | 11.72 | |
Class I | | | | | | | - | | | | | | | | | | | | - | | | | | | | | | | | | - | | | | | | | | | | | | 12.20 | | | | | | | | | | | | - | | | | | | | | | | 12.20 | |
Class I2 | | | | | | | - | | | | | | | | | | | | - | | | | | | | | | | | | - | | | | | | | | | | | | 12.26 | | | | | | | | | | | | - | | | | | | | | | | 12.26 | |
Class I3 | | | | | | | 12.26 | | | | | | | | | | | | - | | | | | | | | | | | | - | | | | | | | | | | | | 12.26 | | | | | | | | | | | | (12.30) | | | (f) | | | | | | | 12.22 | |
Class T | | | | | | | - | | | | | | | | | | | | - | | | | | | | | | | | | - | | | | | | | | | | | | | | | | | | | | | | | | - | | | | | | | | | | - | |
Class R | | | | | | | - | | | | | | | | | | | | 16.87 | | | | | | | | | | | | - | | | | | | | | | | | | 12.26 | | | | | | | | | | | | (16.89) | | | (f) | | | | | | | 12.24 | |
Class R4 | | | | | | | - | | | | | | | | | | | | - | | | | | | | | | | | | 19.21 | | | | | | | | | | | | 12.26 | | | | | | | | | | | | (19.21) | | | (f) | | | | | | | 12.26 | |
Class R6 | | | | | | | - | | | | | | | | | | | | - | | | | | | | | | | | | - | | | | | | | | | | | | | | | | | | | | | | | | - | | | | | | | | | | - | |
Maximum offering price per share: | | | | | | | | | | | | | | | | | | | | | | | | | | | | | | | | | | | | | | | | | | | | | | | | | | | | | | | | | | | | | | | | | | |
Class A | | $ | | | | | - | | | | | | | $ | | | | | - | | | | | | | $ | | | | | - | | | | | | | $ | | | | | 12.76 | | | | | | | | | | | | - | | | | | $ | | | | | 12.76 | |
| | | | | | | | | | | |
| | | | | | | | | | | | | | | | | | | | | | | | | | | | | | | | | | | | | | | | | | |
Investments, at cost | | $ | | | | | 76,966,076 | | | | | | | $ | | | | | - | | | | | | | $ | | | | | - | | | | | | | $ | | | | | 331,266,471 | | | | | | | | | | | | - | | | | | $ | | | | | 408,232,547 | |
Securities loaned, at value | | | | | | | 18,624,241 | | | | | | | | | | | | - | | | | | | | | | | | | - | | | | | | | | | | | | 55,273,891 | | | | | | | | | | | | - | | | | | | | | | | 73,898,132 | |
Repurchase agreements, at cost | | | | | | | 1,073,112 | | | | | | | | | | | | - | | | | | | | | | | | | - | | | | | | | | | | | | 7,889,156 | | | | | | | | | | | | - | | | | | | | | | | 8,962,268 | |
Foreign currency, at cost | | | | | | | - | | | | | | | | | | | | - | | | | | | | | | | | | - | | | | | | | | | | | | - | | | | | | | | | | | | - | | | | | | | | | | - | |
Premium received on written options and swaptions | | | | | | | - | | | | | | | | | | | | - | | | | | | | | | | | | - | | | | | | | | | | | | - | | | | | | | | | | | | - | | | | | | | | | | - | |
(a)-(l) See Note 2 of the Notes to the Pro Forma Financial Statements.
THE NOTES TO THE PRO FORMA FINANCIAL STATEMENTS ARE AN INTEGRAL PART OF THIS REPORT.
S-45
Reorganization Between TPP Master, TPFG Feeder, TPFG II Feeder and TAF Destination
PRO FORMA STATEMENT OF OPERATIONS
For the twelve-month period ended June 30, 2016
| | | | | | | | | | | | | | | | | | | | | | | | | | | | | | | | | | | | | | | | | | | | | | | | | | | | | | | | | | | | | | | | | | | | |
| | | | | | TPP Master | | | | | | | | | TPFG Feeder | | | | | | | | | TPFG II Feeder | | | | | | | | | TAF Destination | | | | | | | | | Adjustments | | | | | | | | | Combined Pro Forma Destination | |
Investment Income: | | | | | | | | | | | | | | | | | | | | | | | | | | | | | | | | | | | | | | | | | | | | | | | | | | | | | | | | | | | | | | | | | | | | |
| | | | | | | | | | | | | | | | | |
Dividend income | | $ | | | | | 289,977 | | | | | | | | $ | | | | 172,491 | | | | | | | | $ | | | | 45,333 | | | | | | | | $ | | | | 1,941,042 | | | | | | | | $ | | | | (217,824) | | | | (b) | | | | $ | | | | 2,231,019 | |
Interest income | | | | | | | 395 | | | | | | | | | | | | 235 | | | | | | | | | | | | 63 | | | | | | | | | | | | 2,124 | | | | | | | | | | | | (298) | | | | (b) | | | | | | | | 2,519 | |
Net income (loss) from securities lending | | | | | | | 56,160 | | | | | | | | | | | | 33,476 | | | | | | | | | | | | 8,761 | | | | | | | | | | | | 304,152 | | | | | | | | | | | | (42,237) | | | | (b) | | | | | | | | 360,312 | |
Withholding taxes on foreign income | | | | | | | - | | | | | | | | | | | | - | | | | | | | | | | | | - | | | | | | | | | | | | - | | | | | | | | | | | | - | | | | | | | | | | | | - | |
Expenses (net of waiver and/or reimbursement) | | | | | | | - | | | | | | | | | | | | (358,428) | | | | | | | | | | | | (93,245) | | | | | | | | | | | | - | | | | | | | | | | | | 451,673 | | | | (b) | | | | | | | | - | |
| | | | | | | | | | | | | | | | | | | | | | | | | | | | | | | | | | | | | | | | | | | | |
Total investment income (loss) | | | | | | | 346,532 | | | | | | | | | | | | (152,226) | | | | | | | | | | | | (39,088) | | | | | | | | | | | | 2,247,318 | | | | | | | | | | | | 191,314 | | | | | | | | | | | | 2,593,850 | |
| | | | | | | | | | | | | | | | | | | | | | | | | | | | | | | | | | | | | | | | | | | | |
| | | | | | | | | | | | | | | | | |
Expenses: | | | | | | | | | | | | | | | | | | | | | | | | | | | | | | | | | | | | | | | | | | | | | | | | | | | | | | | | | | | | | | | | | | | | |
Investment advisory fees | | | | | | | 559,640 | | | | | | | | | | | | - | | | | | | | | | | | | - | | | | | | | | | | | | 2,762,656 | | | | | | | | | | | | 73,985 | | | | (g) | | | | | | | | 3,396,281 | |
Investment management fees | | | | | | | - | | | | | | | | | | | | - | | | | | | | | | | | | - | | | | | | | | | | | | 1,076,072 | | | | | | | | | | | | - | | | | | | | | | | | | 1,076,072 | |
Administration/Investment advisory fees | | | | | | | - | | | | | | | | | | | | 119,378 | | | | | | | | | | | | 5,175 | | | | | | | | | | | | - | | | | | | | | | | | | (124,553) | | | | (h) | | | | | | | | - | |
Distribution and service fees: | | | | | | | | | | | | | | | | | | | | | | | | | | | | | | | | | | | | | | | | | | | | | | | | | | | | | | | | | | | | | | | | | | | | |
Class A | | | | | | | - | | | | | | | | | | | | - | | | | | | | | | | | | - | | | | | | | | | | | | 8,333 | | | | | | | | | | | | (5) | | | | (i) | | | | | | | | 8,328 | |
Class B | | | | | | | - | | | | | | | | | | | | - | | | | | | | | | | | | - | | | | | | | | | | | | - | | | | | | | | | | | | - | | | | | | | | | | | | - | |
Class C | | | | | | | - | | | | | | | | | | | | - | | | | | | | | | | | | - | | | | | | | | | | | | 12,338 | | | | | | | | | | | | (11) | | | | (i) | | | | | | | | 12,327 | |
Class I | | | | | | | - | | | | | | | | | | | | - | | | | | | | | | | | | - | | | | | | | | | | | | - | | | | | | | | | | | | - | | | | | | | | | | | | - | |
Class I2 | | | | | | | - | | | | | | | | | | | | - | | | | | | | | | | | | - | | | | | | | | | | | | - | | | | | | | | | | | | - | | | | | | | | | | | | - | |
Class I3 | | | | | | | - | | | | | | | | | | | | - | | | | | | | | | | | | - | | | | | | | | | | | | - | | | | | | | | | | | | - | | | | | | | | | | | | - | |
Class T | | | | | | | - | | | | | | | | | | | | - | | | | | | | | | | | | - | | | | | | | | | | | | - | | | | | | | | | | | | - | | | | | | | | | | | | - | |
Class R | | | | | | | - | | | | | | | | | | | | 99,482 | | | | | | | | | | | | - | | | | | | | | | | | | - | | | | | | | | | | | | 99,188 | | | | (i) | | | | | | | | 198,670 | |
Class R4 | | | | | | | - | | | | | | | | | | | | - | | | | | | | | | | | | 25,872 | | | | | | | | | | | | - | | | | | | | | | | | | (38) | | | | (i) | | | | | | | | 25,834 | |
Class R6 | | | | | | | - | | | | | | | | | | | | - | | | | | | | | | | | | - | | | | | | | | | | | | - | | | | | | | | | | | | - | | | | | | | | | | | | - | |
Administration fees | | | | | | | - | | | | | | | | | | | | - | | | | | | | | | | | | - | | | | | | | | | | | | 98,181 | | | | | | | | | | | | (98,181) | | | | (h) | | | | | | | | - | |
Transfer agent fees: | | | | | | | | | | | | | | | | | | | | | | | | | | | | | | | | | | | | | | | | | | | | | | | | | | | | | | | | | | | | | | | | | | | | |
Class A | | | | | | | - | | | | | | | | | | | | - | | | | | | | | | | | | - | | | | | | | | | | | | 5,942 | | | | | | | | | | | | - | | | | | | | | | | | | 5,942 | |
Class B | | | | | | | - | | | | | | | | | | | | - | | | | | | | | | | | | - | | | | | | | | | | | | - | | | | | | | | | | | | | | | | | | | | | | | | - | |
Class C | | | | | | | - | | | | | | | | | | | | - | | | | | | | | | | | | - | | | | | | | | | | | | 2,129 | | | | | | | | | | | | - | | | | | | | | | | | | 2,129 | |
Class I | | | | | | | - | | | | | | | | | | | | - | | | | | | | | | | | | - | | | | | | | | | | | | 2,494 | | | | | | | | | | | | | | | | | | | | | | | | 2,494 | |
Class I2 | | | | | | | - | | | | | | | | | | | | - | | | | | | | | | | | | - | | | | | | | | | | | | 34,005 | | | | | | | | | | | | | | | | | | | | | | | | 34,005 | |
Class I3 | | | | | | | - | | | | | | | | | | | | - | | | | | | | | | | | | - | | | | | | | | | | | | - | | | | | | | | | | | | | | | | | | | | | | | | - | |
Class T | | | | | | | - | | | | | | | | | | | | - | | | | | | | | | | | | - | | | | | | | | | | | | - | | | | | | | | | | | | - | | | | | | | | | | | | - | |
Class R | | | | | | | - | | | | | | | | | | | | - | | | | | | | | | | | | - | | | | | | | | | | | | - | | | | | | | | | | | | | | | | | | | | | | | | - | |
Class R4 | | | | | | | - | | | | | | | | | | | | - | | | | | | | | | | | | - | | | | | | | | | | | | - | | | | | | | | | | | | | | | | | | | | | | | | - | |
Class R6 | | | | | | | - | | | | | | | | | | | | - | | | | | | | | | | | | - | | | | | | | | | | | | - | | | | | | | | | | | | | | | | | | | | | | | | - | |
Trustee, CCO and deferred compensation fees | | | | | | | 1,136 | | | | | | | | | | | | 765 | | | | | | | | | | | | 186 | | | | | | | | | | | | 6,791 | | | | | | | | | | | | - | | | | | | | | | | | | 8,878 | |
Audit and tax fees | | | | | | | 21,156 | | | | | | | | | | | | 7,633 | | | | | | | | | | | | 6,636 | | | | | | | | | | | | 19,737 | | | | | | | | | | | | (23,234) | | | | (j) | | | | | | | | 31,928 | |
Custody fees | | | | | | | 21,251 | | | | | | | | | | | | 11,264 | | | | | | | | | | | | 11,263 | | | | | | | | | | | | 58,371 | | | | | | | | | | | | (38,788) | | | | (k) | | | | | | | | 63,361 | |
Legal fees | | | | | | | 645 | | | | | | | | | | | | 1,744 | | | | | | | | | | | | 373 | | | | | | | | | | | | 16,646 | | | | | | | | | | | | - | | | | | | | | | | | | 19,408 | |
Printing and shareholder reports fees | | | | | | | 165 | | | | | | | | | | | | 5,816 | | | | | | | | | | | | (254) | | | | | | | | | | | | 22,255 | | | | | | | | | | | | - | | | | | | | | | | | | 27,982 | |
Registration fees | | | | | | | - | | | | | | | | | | | | 18,255 | | | | | | | | | | | | 18,479 | | | | | | | | | | | | 53,539 | | | | | | | | | | | | | | | | | | | | | | | | 90,273 | |
Dividends, interest and fees for borrowings from securities sold short | | | | | | | - | | | | | | | | | | | | - | | | | | | | | | | | | - | | | | | | | | | | | | - | | | | | | | | | | | | | | | | | | | | | | | | - | |
Interest | | | | | | | - | | | | | | | | | | | | - | | | | | | | | | | | | - | | | | | | | | | | | | - | | | | | | | | | | | | - | | | | | | | | | | | | - | |
Other | | | | | | | 1,147 | | | | | | | | | | | | 1,588 | | | | | | | | | | | | 851 | | | | | | | | | | | | 11,610 | | | | | | | | | | | | - | | | | | | | | | | | | 15,196 | |
| | | | | | | | | | | | | | | | | | | | | | | | | | | | | | | | | | | | | | | | | | | | |
Total expenses before waiver and/or reimbursment and recapture | | | | | | | 605,140 | | | | | | | | | | | | 265,925 | | | | | | | | | | | | 68,581 | | | | | | | | | | | | 4,191,099 | | | | | | | | | | | | (111,637) | | | | | | | | | | | | 5,019,108 | |
Expenses waived and/or reimbursed: | | | | | | | | | | | | | | | | | | | | | | | | | | | | | | | | | | | | | | | | | | | | | | | | | | | | | | | | | | | | | | | | | | | | |
Fund level | | | | | | | (5,520) | | | | | | | | | | | | - | | | | | | | | | | | | - | | | | | | | | | | | | - | | | | | | | | | | | | 5,520 | | | | (l) | | | | | | | | - | |
Class A | | | | | | | - | | | | | | | | | | | | - | | | | | | | | | | | | - | | | | | | | | | | | | - | | | | | | | | | | | | - | | | | | | | | | | | | - | |
Class B | | | | | | | - | | | | | | | | | | | | - | | | | | | | | | | | | - | | | | | | | | | | | | - | | | | | | | | | | | | - | | | | | | | | | | | | - | |
Class C | | | | | | | - | | | | | | | | | | | | - | | | | | | | | | | | | - | | | | | | | | | | | | - | | | | | | | | | | | | - | | | | | | | | | | | | - | |
Class I | | | | | | | - | | | | | | | | | | | | - | | | | | | | | | | | | - | | | | | | | | | | | | - | | | | | | | | | | | | - | | | | | | | | | | | | - | |
Class I2 | | | | | | | - | | | | | | | | | | | | - | | | | | | | | | | | | - | | | | | | | | | | | | - | | | | | | | | | | | | - | | | | | | | | | | | | - | |
Class I3 | | | | | | | - | | | | | | | | | | | | - | | | | | | | | | | | | - | | | | | | | | | | | | - | | | | | | | | | | | | - | | | | | | | | | | | | - | |
Class T | | | | | | | - | | | | | | | | | | | | - | | | | | | | | | | | | - | | | | | | | | | | | | - | | | | | | | | | | | | - | | | | | | | | | | | | - | |
Class R | | | | | | | - | | | | | | | | | | | | (7,561) | | | | | | | | | | | | - | | | | | | | | | | | | - | | | | | | | | | | | | 7,561 | | | | (l) | | | | | | | | - | |
Class R4 | | | | | | | - | | | | | | | | | | | | - | | | | | | | | | | | | (42,816) | | | | | | | | | | | | - | | | | | | | | | | | | 42,816 | | | | (l) | | | | | | | | - | |
Class R6 | | | | | | | - | | | | | | | | | | | | - | | | | | | | | | | | | - | | | | | | | | | | | | - | | | | | | | | | | | | - | | | | | | | | | | | | - | |
Recapture of previously waived and/or reimbursed fees: | | | | | | | | | | | | | | | | | | | | | | | | | | | | | | | | | | | | | | | | | | | | | | | | | | | | | | | | | | | | | | | | | | | | |
Fund level | | | | | | | - | | | | | | | | | | | | - | | | | | | | | | | | | - | | | | | | | | | | | | - | | | | | | | | | | | | - | | | | | | | | | | | | - | |
Class A | | | | | | | - | | | | | | | | | | | | - | | | | | | | | | | | | - | | | | | | | | | | | | - | | | | | | | | | | | | - | | | | | | | | | | | | - | |
Class B | | | | | | | - | | | | | | | | | | | | - | | | | | | | | | | | | - | | | | | | | | | | | | - | | | | | | | | | | | | - | | | | | | | | | | | | - | |
Class C | | | | | | | - | | | | | | | | | | | | - | | | | | | | | | | | | - | | | | | | | | | | | | - | | | | | | | | | | | | - | | | | | | | | | | | | - | |
Class I | | | | | | | - | | | | | | | | | | | | - | | | | | | | | | | | | - | | | | | | | | | | | | - | | | | | | | | | | | | - | | | | | | | | | | | | - | |
Class I2 | | | | | | | - | | | | | | | | | | | | - | | | | | | | | | | | | - | | | | | | | | | | | | - | | | | | | | | | | | | - | | | | | | | | | | | | - | |
Class I3 | | | | | | | - | | | | | | | | | | | | - | | | | | | | | | | | | - | | | | | | | | | | | | - | | | | | | | | | | | | - | | | | | | | | | | | | - | |
Class T | | | | | | | - | | | | | | | | | | | | - | | | | | | | | | | | | - | | | | | | | | | | | | - | | | | | | | | | | | | - | | | | | | | | | | | | - | |
Class R | | | | | | | - | | | | | | | | | | | | - | | | | | | | | | | | | - | | | | | | | | | | | | - | | | | | | | | | | | | - | | | | | | | | | | | | - | |
Class R4 | | | | | | | - | | | | | | | | | | | | - | | | | | | | | | | | | - | | | | | | | | | | | | - | | | | | | | | | | | | - | | | | | | | | | | | | - | |
Class R6 | | | | | | | - | | | | | | | | | | | | - | | | | | | | | | | | | - | | | | | | | | | | | | - | | | | | | | | | | | | - | | | | | | | | | | | | - | |
| | | | | | | | | | | | | | | | | | | | | | | | | | | | | | | | | | | | | | | | | | | | | | | | | | | | |
Net expenses | | | | | | | 599,620 | | | | | | | | | | | | 258,364 | | | | | | | | | | | | 25,765 | | | | | | | | | | | | 4,191,099 | | | | | | | | | | | | (55,740) | | | | | | | | | | | | 5,019,108 | |
| | | | | | | | | | | | | | | | | |
Net investment income (loss) | | | | | | | (253,088) | | | | | | | | | | | | (410,590) | | | | | | | | | | | | (64,853) | | | | | | | | | | | | (1,943,781) | | | | | | | | | | | | 247,054 | | | | | | | | | | | | (2,425,258) | |
| | | | | | | | | | | | | | | | | | | | | | | | | | | | | | | | | | | | | | | | | | | | |
| | | | | | | | | | | | | | | | | |
Net realized gain (loss) on: | | | | | | | | | | | | | | | | | | | | | | | | | | | | | | | | | | | | | | | | | | | | | | | | | | | | | | | | | | | | | | | | | | | | |
Allocated from series portfolio | | | | | | | - | | | | | | | | | | | | 4,066,068 | | | | | | | | | | | | 1,102,458 | | | | | | | | | | | | - | | | | | | | | | | | | (5,168,526) | | | | (b) | | | | | | | | - | |
Investments | | | | | | | 6,901,179 | | | | | | | | | | | | - | | | | | | | | | | | | - | | | | | | | | | | | | 36,899,473 | | | | | | | | | | | | - | | | | | | | | | | | | 43,800,652 | |
Securities sold short | | | | | | | - | | | | | | | | | | | | - | | | | | | | | | | | | - | | | | | | | | | | | | - | | | | | | | | | | | | - | | | | | | | | | | | | - | |
Written options and swaptions | | | | | | | - | | | | | | | | | | | | - | | | | | | | | | | | | - | | | | | | | | | | | | - | | | | | | | | | | | | - | | | | | | | | | | | | - | |
Swap agreements | | | | | | | - | | | | | | | | | | | | - | | | | | | | | | | | | - | | | | | | | | | | | | - | | | | | | | | | | | | - | | | | | | | | | | | | - | |
Futures contracts | | | | | | | - | | | | | | | | | | | | - | | | | | | | | | | | | - | | | | | | | | | | | | - | | | | | | | | | | | | - | | | | | | | | | | | | - | |
Foreign currency transactions | | | | | | | - | | | | | | | | | | | | - | | | | | | | | | | | | - | | | | | | | | | | | | - | | | | | | | | | | | | - | | | | | | | | | | | | - | |
| | | | | | | | | | | | | | | | | | | | | | | | | | | | | | | | | | | | | | | | | | | | |
Net realized gain (loss) | | | | | | | 6,901,179 | | | | | | | | | | | | 4,066,068 | | | | | | | | | | | | 1,102,458 | | | | | | | | | | | | 36,899,473 | | | | | | | | | | | | (5,168,526) | | | | | | | | | | | | 43,800,652 | |
| | | | | | | | | | | | | | | | | | | | | | | | | | | | | | | | | | | | | | | | | | | | |
| | | | | | | | | | | | | | | | | |
Net change in unrealized appreciation (depreciation) on: | | | | | | | | | | | | | | | | | | | | | | | | | | | | | | | | | | | | | | | | | | | | | | | | | | | | | | | | | | | | | | | | | | | | |
Allocated from series portfolio | | | | | | | - | | | | | | | | | | | | (4,036,371) | | | | | | | | | | | | (988,769) | | | | | | | | | | | | - | | | | | | | | | | | | 5,025,140 | | | | (b) | | | | | | | | - | |
Investments | | | | | | | (6,652,622) | | | | | | | | | | | | - | | | | | | | | | | | | - | | | | | | | | | | | | (45,585,214) | | | | | | | | | | | | - | | | | | | | | | | | | (52,237,836) | |
Securities sold short | | | | | | | - | | | | | | | | | | | | - | | | | | | | | | | | | - | | | | | | | | | | | | - | | | | | | | | | | | | - | | | | | | | | | | | | - | |
Written options and swaptions | | | | | | | - | | | | | | | | | | | | - | | | | | | | | | | | | - | | | | | | | | | | | | - | | | | | | | | | | | | - | | | | | | | | | | | | - | |
Swap agreements | | | | | | | - | | | | | | | | | | | | - | | | | | | | | | | | | - | | | | | | | | | | | | - | | | | | | | | | | | | - | | | | | | | | | | | | - | |
Futures contracts | | | | | | | - | | | | | | | | | | | | - | | | | | | | | | | | | - | | | | | | | | | | | | - | | | | | | | | | | | | - | | | | | | | | | | | | - | |
Translation of assets and liabilities denominated in foreign currencies | | | | | | | - | | | | | | | | | | | | - | | | | | | | | | | | | - | | | | | | | | | | | | - | | | | | | | | | | | | - | | | | | | | | | | | | - | |
| | | | | | | | | | | | | | | | | | | | | | | | | | | | | | | | | | | | | | | | | | | | |
Net change in unrealized appreciation (depreciation) | | | | | | | (6,652,622) | | | | | | | | | | | | (4,036,371) | | | | | | | | | | | | (988,769) | | | | | | | | | | | | (45,585,214) | | | | | | | | | | | | 5,025,140 | | | | | | | | | | | | (52,237,836) | |
| | | | | | | | | | | | | | | | | | | | | | | | | | | | | | | | | | | | | | | | | | | | |
| | | | | | | | | | | | | | | | | |
Net realized and change in unrealized gain (loss) | | | | | | | 248,557 | | | | | | | | | | | | 29,697 | | | | | | | | | | | | 113,689 | | | | | | | | | | | | (8,685,741) | | | | | | | | | | | | (143,386) | | | | | | | | | | | | (8,437,184) | |
| | | | | | | | | | | | | | | | | | | | | | | | | | | | | | | | | | | | | | | | | | | | |
| | | | | | | | | | | | | | | | | |
Net increase (decrease) in net assets resulting from operations | | $ | | | | | (4,531) | | | | | | | | $ | | | | (380,893) | | | | | | | | $ | | | | 48,836 | | | | | | | | $ | | | | (10,629,522) | | | | | | | | $ | | | | 103,668 | | | | | | | | $ | | | | (10,862,442) | |
| | | | | | | | | | | | | | | | | | | | | | | | | | | | | | | | | | | | | | | | | | | | |
(a)-(l) See Note 2 of the Notes to the Pro Forma Financial Statements.
THE NOTES TO THE PRO FORMA FINANCIAL STATEMENTS ARE AN INTEGRAL PART OF THIS REPORT.
S-46
Group Nine Reorganization Between:
TRANSAMERICA PARTNERS SMALL VALUE
TRANSAMERICA PARTNERS INSTITUTIONAL SMALL VALUE
TRANSAMERICA PARTNERS SMALL VALUE PORTFOLIO
AND
TRANSAMERICA SMALL CAP VALUE
PRO FORMA SCHEDULE OF INVESTMENTS
At June 30, 2016
Reorganization Between TPP Master and TAF
PRO FORMA SCHEDULE OF INVESTMENTS
At June 30, 2016
| | | | | | | | | | | | | | | | | | | | | | | | | | | | | | | | | | | | | | | | | | | | | | | | | | | | | | |
| | | | | | | | | | | TPP Master | | | | | TAF Destination | | | | | Adjustments | | | | | Combined Pro Forma Destination | |
| | | | | | | | | | | | | | | | | |
| | | Coupon Rate | | | Maturity Date | | | | | Shares | | | | | Value | | | | | Shares | | | | | Value | | | | | Shares | | | Value | | | | | Shares | | | | | Value | |
| | | | | | | | | | | | | | �� | | | | | | | | | | | | | | |
Common Stocks - 96.2 % | | | | | | | | | | | | | | | | | | | | | | | | | | | | | | | | | | | | | | | | | | | | | | | | | | | | | | |
Airlines | | | | | | | | | | | | | | | | | | | | | | | | | | | | | | | | | | | | | | | | | | | | | | | | | | | | | | |
Hawaiian Holdings, Inc. | | | | | | | | | | | | | 12,110 | | | | | $ | 459,696 | | | | | | 55,830 | | | | | $ | 2,119,307 | | | | | | | | | | | | | | | | 67,940 | | | | | $ | 2,579,003 | |
Auto Components | | | | | | | | | | | | | | | | | | | | | | | | | | | | | | | | | | | | | | | | | | | | | | | | | | | | | | |
American Axle & Manufacturing Holdings, Inc. | | | | | | | | | | | | | 54,147 | | | | | | 784,049 | | | | | | 250,873 | | | | | | 3,632,641 | | | | | | | | | | | | | | | | 305,020 | | | | | | 4,416,690 | |
Banks | | | | | | | | | | | | | | | | | | | | | | | | | | | | | | | | | | | | | | | | | | | | | | | | | | | | | | |
1st Source Corp. | | | | | | | | | | | | | 17,970 | | | | | | 582,048 | | | | | | 83,640 | | | | | | 2,709,100 | | | | | | | | | | | | | | | | 101,610 | | | | | | 3,291,148 | |
Banc of California, Inc. | | | | | | | | | | | | | 15,480 | | | | | | 280,188 | | | | | | 72,170 | | | | | | 1,306,277 | | | | | | | | | | | | | | | | 87,650 | | | | | | 1,586,465 | |
Banner Corp. | | | | | | | | | | | | | 17,920 | | | | | | 762,317 | | | | | | 83,080 | | | | | | 3,534,223 | | | | | | | | | | | | | | | | 101,000 | | | | | | 4,296,540 | |
Cardinal Financial Corp. | | | | | | | | | | | | | 38,460 | | | | | | 843,812 | | | | | | 178,030 | | | | | | 3,905,978 | | | | | | | | | | | | | | | | 216,490 | | | | | | 4,749,790 | |
Cathay General Bancorp | | | | | | | | | | | | | 23,070 | | | | | | 650,574 | | | | | | 107,050 | | | | | | 3,018,810 | | | | | | | | | | | | | | | | 130,120 | | | | | | 3,669,384 | |
Customers Bancorp, Inc. | | | | | | | | | | | | | 41,050 | | | | | | 1,031,587 | | | | | | 191,360 | | | | | | 4,808,877 | | | | | | | | | | | | | | | | 232,410 | | | | | | 5,840,464 | |
First Merchants Corp. | | | | | | | | | | | | | 22,270 | | | | | | 555,191 | | | | | | 103,050 | | | | | | 2,569,037 | | | | | | | | | | | | | | | | 125,320 | | | | | | 3,124,228 | |
Glacier Bancorp, Inc. | | | | | | | | | | | | | 40,390 | | | | | | 1,073,566 | | | | | | 186,550 | | | | | | 4,958,499 | | | | | | | | | | | | | | | | 226,940 | | | | | | 6,032,065 | |
Great Southern Bancorp, Inc. | | | | | | | | | | | | | 14,152 | | | | | | 523,200 | | | | | | 65,591 | | | | | | 2,424,899 | | | | | | | | | | | | | | | | 79,743 | | | | | | 2,948,099 | |
Hanmi Financial Corp. | | | | | | | | | | | | | 39,470 | | | | | | 927,150 | | | | | | 182,820 | | | | | | 4,294,442 | | | | | | | | | | | | | | | | 222,290 | | | | | | 5,221,592 | |
Investors Bancorp, Inc. | | | | | | | | | | | | | 87,530 | | | | | | 969,832 | | | | | | 403,700 | | | | | | 4,472,996 | | | | | | | | | | | | | | | | 491,230 | | | | | | 5,442,828 | |
Popular, Inc. | | | | | | | | | | | | | 28,830 | | | | | | 844,719 | | | | | | 133,510 | | | | | | 3,911,843 | | | | | | | | | | | | | | | | 162,340 | | | | | | 4,756,562 | |
TriCo Bancshares | | | | | | | | | | | | | 28,053 | | | | | | 774,263 | | | | | | 132,077 | | | | | | 3,645,325 | | | | | | | | | | | | | | | | 160,130 | | | | | | 4,419,588 | |
Building Products | | | | | | | | | | | | | | | | | | | | | | | | | | | | | | | | | | | | | | | | | | | | | | | | | | | | | | |
Griffon Corp. | | | | | | | | | | | | | 38,650 | | | | | | 651,639 | | | | | | 178,999 | | | | | | 3,017,923 | | | | | | | | | | | | | | | | 217,649 | | | | | | 3,669,562 | |
Capital Markets | | | | | | | | | | | | | | | | | | | | | | | | | | | | | | | | | | | | | | | | | | | | | | | | | | | | | | |
Evercore Partners, Inc. | | | | | | | | | | | | | 16,360 | | | | | | 722,948 | | | | | | 75,370 | | | | | | 3,330,600 | | | | | | | | | | | | | | | | 91,730 | | | | | | 4,053,548 | |
Chemicals | | | | | | | | | | | | | | | | | | | | | | | | | | | | | | | | | | | | | | | | | | | | | | | | | | | | | | |
Cabot Corp. | | | | | | | | | | | | | 19,430 | | | | | | 887,174 | | | | | | 90,290 | | | | | | 4,122,641 | | | | | | | | | | | | | | | | 109,720 | | | | | | 5,009,815 | |
Rayonier Advanced Materials, Inc. | | | | | | | | | | | | | 46,610 | | | | | | 633,430 | | | | | | 214,610 | | | | | | 2,916,550 | | | | | | | | | | | | | | | | 261,220 | | | | | | 3,549,980 | |
Commercial Services & Supplies | | | | | | | | | | | | | | | | | | | | | | | | | | | | | | | | | | | | | | | | | | | | | | | | | | | | | | |
Deluxe Corp. | | | | | | | | | | | | | 19,050 | | | | | | 1,264,349 | | | | | | 88,130 | | | | | | 5,849,188 | | | | | | | | | | | | | | | | 107,180 | | | | | | 7,113,537 | |
Multi-Color Corp. | | | | | | | | | | | | | 11,400 | | | | | | 722,760 | | | | | | 52,980 | | | | | | 3,358,932 | | | | | | | | | | | | | | | | 64,380 | | | | | | 4,081,692 | |
Construction & Engineering | | | | | | | | | | | | | | | | | | | | | | | | | | | | | | | | | | | | | | | | | | | | | | | | | | | | | | |
EMCOR Group, Inc. | | | | | | | | | | | | | 24,740 | | | | | | 1,218,692 | | | | | | 114,830 | | | | | | 5,656,526 | | | | | | | | | | | | | | | | 139,570 | | | | | | 6,875,218 | |
Containers & Packaging | | | | | | | | | | | | | | | | | | | | | | | | | | | | | | | | | | | | | | | | | | | | | | | | | | | | | | |
Owens-Illinois, Inc. | | | | | | | | | | | | | 52,760 | | | | | | 950,208 | | | | | | 244,350 | | | | | | 4,400,744 | | | | | | | | | | | | | | | | 297,110 | | | | | | 5,350,952 | |
Electric Utilities | | | | | | | | | | | | | | | | | | | | | | | | | | | | | | | | | | | | | | | | | | | | | | | | | | | | | | |
PNM Resources, Inc. | | | | | | | | | | | | | 34,120 | | | | | | 1,209,213 | | | | | | 158,200 | | | | | | 5,606,608 | | | | | | | | | | | | | | | | 192,320 | | | | | | 6,815,821 | |
Electronic Equipment, Instruments & Components ePlus, Inc. | | | | | | | | | | | | | 11,329 | | | | | | 926,599 | | | | | | 52,454 | | | | | | 4,290,213 | | | | | | | | | | | | | | | | 63,783 | | | | | | 5,216,812 | |
Orbotech, Ltd. | | | | | | | | | | | | | 33,840 | | | | | | 864,612 | | | | | | 156,710 | | | | | | 4,003,941 | | | | | | | | | | | | | | | | 190,550 | | | | | | 4,868,553 | |
Vishay Intertechnology, Inc. | | | | | | | | | | | | | 49,360 | | | | | | 611,570 | | | | | | 228,980 | | | | | | 2,837,062 | | | | | | | | | | | | | | | | 278,340 | | | | | | 3,448,632 | |
Energy Equipment & Services | | | | | | | | | | | | | | | | | | | | | | | | | | | | | | | | | | | | | | | | | | | | | | | | | | | | | | |
Dril-Quip, Inc. | | | | | | | | | | | | | 10,910 | | | | | | 637,471 | | | | | | 50,210 | | | | | | 2,933,770 | | | | | | | | | | | | | | | | 61,120 | | | | | | 3,571,241 | |
Oceaneering International, Inc. | | | | | | | | | | | | | 16,800 | | | | | | 501,648 | | | | | | 77,480 | | | | | | 2,313,553 | | | | | | | | | | | | | | | | 94,280 | | | | | | 2,815,201 | |
Rowan Cos. PLC | | | | | | | | | | | | | 37,650 | | | | | | 664,899 | | | | | | 169,390 | | | | | | 2,991,427 | | | | | | | | | | | | | | | | 207,040 | | | | | | 3,656,326 | |
Food Products | | | | | | | | | | | | | | | | | | | | | | | | | | | | | | | | | | | | | | | | | | | | | | | | | | | | | | |
John B Sanfilippo & Son, Inc. | | | | | | | | | | | | | 5,870 | | | | | | 250,238 | | | | | | 27,318 | | | | | | 1,164,566 | | | | | | | | | | | | | | | | 33,188 | | | | | | 1,414,804 | |
Gas Utilities | | | | | | | | | | | | | | | | | | | | | | | | | | | | | | | | | | | | | | | | | | | | | | | | | | | | | | |
ONE Gas, Inc. | | | | | | | | | | | | | 18,372 | | | | | | 1,223,391 | | | | | | 84,767 | | | | | | 5,644,635 | | | | | | | | | | | | | | | | 103,139 | | | | | | 6,868,026 | |
Southwest Gas Corp. | | | | | | | | | | | | | 16,950 | | | | | | 1,334,135 | | | | | | 78,300 | | | | | | 6,162,993 | | | | | | | | | | | | | | | | 95,250 | | | | | | 7,497,128 | |
Health Care Equipment & Supplies | | | | | | | | | | | | | | | | | | | | | | | | | | | | | | | | | | | | | | | | | | | | | | | | | | | | | | |
Merit Medical Systems, Inc. | | | | | | | | | | | | | 46,110 | | | | | | 914,361 | | | | | | 212,600 | | | | | | 4,215,858 | | | | | | | | | | | | | | | | 258,710 | | | | | | 5,130,219 | |
Health Care Providers & Services | | | | | | | | | | | | | | | | | | | | | | | | | | | | | | | | | | | | | | | | | | | | | | | | | | | | | | |
HealthSouth Corp. | | | | | | | | | | | | | 17,440 | | | | | | 677,021 | | | | | | 80,740 | | | | | | 3,134,327 | | | | | | | | | | | | | | | | 98,180 | | | | | | 3,811,348 | |
LHC Group, Inc. | | | | | | | | | | | | | 18,920 | | | | | | 818,857 | | | | | | 87,310 | | | | | | 3,778,777 | | | | | | | | | | | | | | | | 106,230 | | | | | | 4,597,634 | |
Molina Healthcare, Inc. | | | | | | | | | | | | | 13,290 | | | | | | 663,171 | | | | | | 61,930 | | | | | | 3,090,307 | | | | | | | | | | | | | | | | 75,220 | | | | | | 3,753,478 | |
Hotels, Restaurants & Leisure | | | | | | | | | | | | | | | | | | | | | | | | | | | | | | | | | | | | | | | | | | | | | | | | | | | | | | |
Bloomin' Brands, Inc. | | | | | | | | | | | | | 52,250 | | | | | | 933,707 | | | | | | 241,860 | | | | | | 4,322,038 | | | | | | | | | | | | | | | | 294,110 | | | | | | 5,255,745 | |
Ruth's Hospitality Group, Inc. | | | | | | | | | | | | | 52,250 | | | | | | 833,388 | | | | | | 241,770 | | | | | | 3,856,232 | | | | | | | | | | | | | | | | 294,020 | | | | | | 4,689,620 | |
Household Durables | | | | | | | | | | | | | | | | | | | | | | | | | | | | | | | | | | | | | | | | | | | | | | | | | | | | | | |
Helen of Troy, Ltd. | | | | | | | | | | | | | 9,820 | | | | | | 1,009,889 | | | | | | 45,520 | | | | | | 4,681,277 | | | | | | | | | | | | | | | | 55,340 | | | | | | 5,691,166 | |
Household Products | | | | | | | | | | | | | | | | | | | | | | | | | | | | | | | | | | | | | | | | | | | | | | | | | | | | | | |
Central Garden & Pet Co. | | | | | | | | | | | | | 36,319 | | | | | | 788,486 | | | | | | 169,085 | | | | | | 3,670,835 | | | | | | | | | | | | | | | | 205,404 | | | | | | 4,459,321 | |
Insurance | | | | | | | | | | | | | | | | | | | | | | | | | | | | | | | | | | | | | | | | | | | | | | | | | | | | | | |
American Equity Investment Life Holding Co. | | | | | | | | | | | | | 56,590 | | | | | | 806,407 | | | | | | 262,040 | | | | | | 3,734,070 | | | | | | | | | | | | | | | | 318,630 | | | | | | 4,540,477 | |
Employers Holdings, Inc. | | | | | | | | | | | | | 40,581 | | | | | | 1,177,661 | | | | | | 185,805 | | | | | | 5,392,061 | | | | | | | | | | | | | | | | 226,386 | | | | | | 6,569,722 | |
Federated National Holding Co. | | | | | | | | | | | | | 20,050 | | | | | | 381,752 | | | | | | 93,020 | | | | | | 1,771,101 | | | | | | | | | | | | | | | | 113,070 | | | | | | 2,152,853 | |
Selective Insurance Group, Inc. | | | | | | | | | | | | | 27,043 | | | | | | 1,033,313 | | | | | | 124,917 | | | | | | 4,773,079 | | | | | | | | | | | | | | | | 151,960 | | | | | | 5,806,392 | |
Internet Software & Services | | | | | | | | | | | | | | | | | | | | | | | | | | | | | | | | | | | | | | | | | | | | | | | | | | | | | | |
j2 Global, Inc. | | | | | | | | | | | | | 14,050 | | | | | | 887,539 | | | | | | 65,140 | | | | | | 4,114,894 | | | | | | | | | | | | | | | | 79,190 | | | | | | 5,002,433 | |
IT Services | | | | | | | | | | | | | | | | | | | | | | | | | | | | | | | | | | | | | | | | | | | | | | | | | | | | | | |
Convergys Corp. | | | | | | | | | | | | | 33,590 | | | | | | 839,750 | | | | | | 155,729 | | | | | | 3,893,225 | | | | | | | | | | | | | | | | 189,319 | | | | | | 4,732,975 | |
Leisure Products | | | | | | | | | | | | | | | | | | | | | | | | | | | | | | | | | | | | | | | | | | | | | | | | | | | | | | |
Nautilus, Inc. | | | | | | | | | | | | | 48,498 | | | | | | 865,204 | | | | | | 224,836 | | | | | | 4,011,074 | | | | | | | | | | | | | | | | 273,334 | | | | | | 4,876,278 | |
Life Sciences Tools & Services | | | | | | | | | | | | | | | | | | | | | | | | | | | | | | | | | | | | | | | | | | | | | | | | | | | | | | |
INC Research Holdings, Inc. | | | | | | | | | | | | | 20,300 | | | | | | 774,039 | | | | | | 93,800 | | | | | | 3,576,594 | | | | | | | | | | | | | | | | 114,100 | | | | | | 4,350,633 | |
Machinery | | | | | | | | | | | | | | | | | | | | | | | | | | | | | | | | | | | | | | | | | | | | | | | | | | | | | | |
Timken Co. | | | | | | | | | | | | | 24,960 | | | | | | 765,274 | | | | | | 115,130 | | | | | | 3,529,886 | | | | | | | | | | | | | | | | 140,090 | | | | | | 4,295,160 | |
Wabash National Corp. | | | | | | | | | | | | | 46,480 | | | | | | 590,296 | | | | | | 214,370 | | | | | | 2,722,499 | | | | | | | | | | | | | | | | 260,850 | | | | | | 3,312,795 | |
Multiline Retail | | | | | | | | | | | | | | | | | | | | | | | | | | | | | | | | | | | | | | | | | | | | | | | | | | | | | | |
Big Lots, Inc. | | | | | | | | | | | | | 14,110 | | | | | | 707,052 | | | | | | 64,900 | | | | | | 3,252,139 | | | | | | | | | | | | | | | | 79,010 | | | | | | 3,959,191 | |
Multi-Utilities | | | | | | | | | | | | | | | | | | | | | | | | | | | | | | | | | | | | | | | | | | | | | | | | | | | | | | |
Black Hills Corp. | | | | | | | | | | | | | 19,630 | | | | | | 1,237,475 | | | | | | 91,040 | | | | | | 5,739,162 | | | | | | | | | | | | | | | | 110,670 | | | | | | 6,976,637 | |
Paper & Forest Products | | | | | | | | | | | | | | | | | | | | | | | | | | | | | | | | | | | | | | | | | | | | | | | | | | | | | | |
Neenah Paper, Inc. | | | | | | | | | | | | | 11,580 | | | | | | 838,045 | | | | | | 53,430 | | | | | | 3,866,729 | | | | | | | | | | | | | | | | 65,010 | | | | | | 4,704,774 | |
Pharmaceuticals | | | | | | | | | | | | | | | | | | | | | | | | | | | | | | | | | | | | | | | | | | | | | | | | | | | | | | |
Prestige Brands Holdings, Inc. | | | | | | | | | | | | | 14,080 | | | | | | 780,032 | | | | | | 65,070 | | | | | | 3,604,878 | | | | | | | | | | | | | | | | 79,150 | | | | | | 4,384,910 | |
Real Estate Investment Trusts | | | | | | | | | | | | | | | | | | | | | | | | | | | | | | | | | | | | | | | | | | | | | | | | | | | | | | |
DCT Industrial Trust, Inc. | | | | | | | | | | | | | 24,980 | | | | | | 1,200,039 | | | | | | 115,910 | | | | | | 5,568,316 | | | | | | | | | | | | | | | | 140,890 | | | | | | 6,768,355 | |
First Industrial Realty Trust, Inc. | | | | | | | | | | | | | 35,810 | | | | | | 996,234 | | | | | | 166,140 | | | | | | 4,622,015 | | | | | | | | | | | | | | | | 201,950 | | | | | | 5,618,249 | |
Monogram Residential Trust, Inc. | | | | | | | | | | | | | 94,611 | | | | | | 965,978 | | | | | | 439,007 | | | | | | 4,482,261 | | | | | | | | | | | | | | | | 533,618 | | | | | | 5,448,239 | |
Ryman Hospitality Properties, Inc. | | | | | | | | | | | | | 12,880 | | | | | | 652,372 | | | | | | 59,400 | | | | | | 3,008,610 | | | | | | | | | | | | | | | | 72,280 | | | | | | 3,660,982 | |
Starwood Property Trust, Inc. | | | | | | | | | | | | | 45,120 | | | | | | 934,886 | | | | | | 208,820 | | | | | | 4,326,750 | | | | | | | | | | | | | | | | 253,940 | | | | | | 5,261,636 | |
STORE Capital Corp. | | | | | | | | | | | | | 40,590 | | | | | | 1,195,376 | | | | | | 188,040 | | | | | | 5,537,778 | | | | | | | | | | | | | | | | 228,630 | | | | | | 6,733,154 | |
Sun Communities, Inc. | | | | | | | | | | | | | 17,150 | | | | | | 1,314,376 | | | | | | 77,980 | | | | | | 5,976,387 | | | | | | | | | | | | | | | | 95,130 | | | | | | 7,290,763 | |
Urban Edge Properties | | | | | | | | | | | | | 38,240 | | | | | | 1,141,847 | | | | | | 177,450 | | | | | | 5,298,657 | | | | | | | | | | | | | | | | 215,690 | | | | | | 6,440,504 | |
Xenia Hotels & Resorts, Inc. | | | | | | | | | | | | | 48,280 | | | | | | 810,138 | | | | | | 223,580 | | | | | | 3,751,672 | | | | | | | | | | | | | | | | 271,860 | | | | | | 4,561,810 | |
Road & Rail | | | | | | | | | | | | | | | | | | | | | | | | | | | | | | | | | | | | | | | | | | | | | | | | | | | | | | |
Swift Transportation Co. | | | | | | | | | | | | | 39,990 | | | | | | 616,246 | | | | | | 185,510 | | | | | | 2,858,709 | | | | | | | | | | | | | | | | 225,500 | | | | | | 3,474,955 | |
Semiconductors & Semiconductor Equipment | | | | | | | | | | | | | | | | | | | | | | | | | | | | | | | | | | | | | | | | | | | | | | | | | | | | | | |
Rudolph Technologies, Inc. | | | | | | | | | | | | | 61,147 | | | | | | 949,613 | | | | | | 282,816 | | | | | | 4,392,132 | | | | | | | | | | | | | | | | 343,963 | | | | | | 5,341,745 | |
Software | | | | | | | | | | | | | | | | | | | | | | | | | | | | | | | | | | | | | | | | | | | | | | | | | | | | | | |
VASCO Data Security International, Inc. | | | | | | | | | | | | | 57,160 | | | | | | 936,852 | | | | | | 264,820 | | | | | | 4,340,400 | | | | | | | | | | | | | | | | 321,980 | | | | | | 5,277,252 | |
Specialty Retail | | | | | | | | | | | | | | | | | | | | | | | | | | | | | | | | | | | | | | | | | | | | | | | | | | | | | | |
Caleres, Inc. | | | | | | | | | | | | | 29,988 | | | | | | 726,010 | | | | | | 138,742 | | | | | | 3,358,944 | | | | | | | | | | | | | | | | 168,730 | | | | | | 4,084,954 | |
Urban Outfitters, Inc. | | | | | | | | | | | | | 25,560 | | | | | | 702,900 | | | | | | 118,610 | | | | | | 3,261,775 | | | | | | | | | | | | | | | | 144,170 | | | | | | 3,964,675 | |
S-47
| | | | | | | | | | | | | | | | | | | | | | | | | | | | | | | | | | | | | | | | | | | | | | | | | | | | | | |
| | | | | | | | | | | TPP Master | | | | | TAF Destination | | | | | Adjustments | | | | | Combined Pro Forma Destination | |
| | | | | | | | | | | | | | | | | |
| | | Coupon Rate | | | Maturity Date | | | | | Shares | | | | | Value | | | | | Shares | | | | | Value | | | | | Shares | | | Value | | | | | Shares | | | | | Value | |
| | | | | | | | | | | | | | | | | | | | | | | | | | | | |
Thrifts & Mortgage Finance | | | | | | | | | | | | | | | | | | | | | | | | | | | | | | | | | | | | | | | | | | | | | | | | | | | | | | |
Dime Community Bancshares, Inc. | | | | | | | | | | | | | 33,770 | | | | | $ | 574,428 | | | | | | 157,200 | | | | | $ | 2,673,972 | | | | | | | | | | | | | | | | 190,970 | | | | | $ | 3,248,400 | |
First Defiance Financial Corp. | | | | | | | | | | | | | 16,733 | | | | | | 650,077 | | | | | | 77,461 | | | | | | 3,009,360 | | | | | | | | | | | | | | | | 94,194 | | | | | | 3,659,437 | |
Washington Federal, Inc. | | | | | | | | | | | | | 47,140 | | | | | | 1,143,616 | | | | | | 218,640 | | | | | | 5,304,206 | | | | | | | | | | | | | | | | 265,780 | | | | | | 6,447,822 | |
Trading Companies & Distributors | | | | | | | | | | | | | | | | | | | | | | | | | | | | | | | | | | | | | | | | | | | | | | | | | | | | | | |
Aircastle, Ltd. | | | | | | | | | | | | | 43,999 | | | | | | 860,620 | | | | | | 203,711 | | | | | | 3,984,587 | | | | | | | | | | | | | | | | 247,710 | | | | | | 4,845,207 | |
H&E Equipment Services, Inc. | | | | | | | | | | | | | 46,430 | | | | | | 883,563 | | | | | | 216,460 | | | | | | 4,119,234 | | | | | | | | | | | | | | | | 262,890 | | | | | | 5,002,797 | |
MRC Global, Inc. | | | | | | | | | | | | | 61,500 | | | | | | 873,915 | | | | | | 284,600 | | | | | | 4,044,166 | | | | | | | | | | | | | | | | 346,100 | | | | | | 4,918,081 | |
| | | | | | | | | | | | | | | | | | | | | | | | | | | | | | | | |
Total Common Stocks | | | | | | | | | | | | | | | | | | | 62,788,973 | | | | | | | | | | | | 290,565,099 | | | | | | | | | | | | | | | | | | | | | | 353,354,072 | |
| | | | | | | | | | | | | | | | | | | | | | | | | | | | | | | | |
| | | | | | | | | | | | | | | | | | | Total Cost ($59,997,340) | | | | | | | | | | | | Total Cost ($269,952,913) | | | | | | | | | | | | | | | | | | | | | | Total Cost ($329,950,253) | |
Master Limited Partnership - 1.1 % | | | | | | | | | | | | | | | | | | | | | | | | | | | | | | | | | | | | | | | | | | | | | | | | | | | | | | |
Oil, Gas & Consumable Fuels | | | | | | | | | | | | | | | | | | | | | | | | | | | | | | | | | | | | | | | | | | | | | | | | | | | | | | |
Tallgrass Energy Partners, LP | | | | | | | | | | | | | 15,210 | | | | | | 699,964 | | | | | | 69,960 | | | | | | 3,219,559 | | | | | | | | | | | | | | | | 85,170 | | | | | | 3,919,523 | |
| | | | | | | | | | | | | | | | | | | | | | | | | | | | | | | | |
Total Master Limited Partnership | | | | | | | | | | | | | | | | | | | 699,964 | | | | | | | | | | | | 3,219,559 | | | | | | | | | | | | | | | | | | | | | | 3,919,523 | |
| | | | | | | | | | | | | | | | | | | | | | | | | | | | | | | | |
| | | | | | | | | | | | | | | | | | | Total Cost ($586,601) | | | | | | | | | | | | Total Cost ($2,698,347) | | | | | | | | | | | | | | | | | | | | | | Total Cost ($3,284,948) | |
Securities Lending Collateral - 11.9 % | | | | | | | | | | | | | | | | | | | | | | | | | | | | | | | | | | | | | | | | | | | | | | | | | | | | | | |
State Street Navigator Securities Lending Trust - Prime Portfolio | | | 0.51 | % | | | | | | | | | 15,660,316 | | | | | | 15,660,316 | | | | | | 28,170,078 | | | | | | 28,170,078 | | | | | | | | | | | | | | | | 43,830,394 | | | | | | 43,830,394 | |
| | | | | | | | | | | | | | | | | | | | | | | | | | | | | | | | |
Total Securities Lending Collateral | | | | | | | | | | | | | | | | | | | 15,660,316 | | | | | | | | | | | | 28,170,078 | | | | | | | | | | | | | | | | | | | | | | 43,830,394 | |
| | | | | | | | | | | | | | | | | | | | | | | | | | | | | | | | |
| | | | | | | | | | | | | | | | | | | Total Cost ($15,660,316) | | | | | | | | | | | | Total Cost ($28,170,078) | | | | | | | | | | | | | | | | | | | | | | Total Cost ($43,830,394) | |
| | | | | | | | | | | | | | | | | |
| | | | | | | | | | | Principal | | | | | Value | | | | | Principal | | | | | Value | | | | | Principal | | | Value | | | | | Principal | | | | | Value | |
| | | | | | | | | | | | | | | | | | | | | | | | | | | | | | | | |
Repurchase Agreement - 1.3 % | | | | | | | | | | | | | | | | | | | | | | | | | | | | | | | | | | | | | | | | | | | | | | | | | | | | | | |
State Street Bank & Trust Co. | | | 0.03 | % | | | 07/01/2016 | | | | | $ | 414,591 | | | | | | 414,591 | | | | | $ | 4,539,352 | | | | | | 4,539,352 | | | | | | | | | | | | | | | $ | 4,953,943 | | | | | | 4,953,943 | |
| | | | | | | | | | |
| | | | | | | | | | | | | | | | | | | | | | | | | | | | | | | | |
Total Repurchase Agreement | | | | | | | | | | | | | | | | | | | 414,591 | | | | | | | | | | | | 4,539,352 | | | | | | | | | | | | | | | | | | | | | | 4,953,943 | |
| | | | | | | | | | | | | | | | | | | | | | | | | | | | | | | | |
| | | | | | | | | | | | | | | | | | | Total Cost ($414,591) | | | | | | | | | | | | Total Cost ($4,539,352) | | | | | | | | | | | | | | | | | | | | | | Total Cost ($4,953,943) | |
| | | | | | | | | | |
| | | | | | | | | | | | | | | | | | | | | | | | | | | | | | | | |
Total Investments | | | | | | | | | | | | | | | | | | | 79,563,844 | | | | | | | | | | | | 326,494,088 | | | | | | | | | | | | | | | | | | | | | | 406,057,932 | |
| | | | | | | | | | | | | | | | | | | | | | | | | | | | | | | | |
| | | | | | | | | | | | | | | | | | | Total Cost ($76,658,848) | | | | | | | | | | | | Total Cost ($305,360,690) | | | | | | | | | | | | | | | | | | | | | | Total Cost ($382,019,538) | |
| | | | | | | | | | | | | | | | | |
Other Assets and Liabilities - (10.5)% | | | | | | | | | | | | | | | | | | | (14,679,696) | | | | | | | | | | | | (23,800,504) | | | | | | | | | | (162,702) | (a)(c) | | | | | | | | | | | (38,642,902) | |
| | | | | | | | | | | | | | | | | | | | | | | | | | | | | | | | | | | | | | | | | | | | | | | | | | | | | | |
Net Assets | | | | | | | | | | | | | | | | | | | $64,884,148 | | | | | | | | | | | | $302,693,584 | | | | | | | | | | ($162,702) | | | | | | | | | | | | $367,415,030 | |
| | | | | | | | | | | | | | | | | | | | | | | | | | | | | | | | | | | | | | | | | | | | | | | | | | | | | | |
VALUATION SUMMARY:
| | | | | | | | | | | | | | | | | | | | | | | | | | | | | | | | | | | | | | | | | | | | | | | | | | | | | | |
| Investments | | Level 1 - Unadjusted
Quoted Prices | | | Level 2 - Other Significant Observable Inputs | | | Level 3 - Significant Unobservable Inputs | | | Value | | | | | | Level 1 - Unadjusted
Quoted Prices | | | Level 2 - Other Significant Observable Inputs | | | Level 3 - Significant Unobservable Inputs | | | Value | | | | | Level 1 - Unadjusted
Quoted Prices | | | Level 2 - Other Significant Observable Inputs | | | Level 3 - Significant Unobservable Inputs | | | Value | |
Common Stocks | | $ | 62,788,973 | | | $ | - | | | $ | - | | | $ | 62,788,973 | | | | | | | $ | 290,565,099 | | | $ | - | | | $ | - | | | $ | 290,565,099 | | | | | $ | 353,354,072 | | | $ | - | | | $ | - | | | $ | 353,354,072 | |
Master Limited Partnership | | | 699,964 | | | | - | | | | - | | | | 699,964 | | | | | | | | 3,219,559 | | | | - | | | | - | | | | 3,219,559 | | | | | | 3,919,523 | | | | - | | | | - | | | | 3,919,523 | |
Securities Lending Collateral | | | 15,660,316 | | | | - | | | | - | | | | 15,660,316 | | | | | | | | 28,170,078 | | | | - | | | | - | | | | 28,170,078 | | | | | | 43,830,394 | | | | - | | | | - | | | | 43,830,394 | |
Repurchase Agreement | | | - | | | | 414,591 | | | | - | | | | 414,591 | | | | | | | | - | | | | 4,539,352 | | | | - | | | | 4,539,352 | | | | | | - | | | | 4,953,943 | | | | - | | | | 4,953,943 | |
Total Investments | | $ | 79,149,253 | | | $ | 414,591 | | | $ | - | | | $ | 79,563,844 | | | | | | | $ | 321,954,736 | | | $ | 4,539,352 | | | $ | - | | | $ | 326,494,088 | | | | | $ | 401,103,989 | | | $ | 4,953,943 | | | $ | - | | | $ | 406,057,932 | |
(a)-(l) See Note 2 of the Notes to the Pro Forma Financial Statements.
As of June 30, 2016, all securities held by the Target Master Portfolio would comply with the investment restrictions of the Destination Fund.
S-48
Reorganization Between TPP Master, TPFG Feeder, TPFG II Feeder and TAF Destination
PRO FORMA STATEMENT OF ASSETS AND LIABILITIES
At June 30, 2016
| | | | | | | | | | | | | | | | | | | | | | | | | | | | | | | | | | | | | | | | | | | | | | | | | | | | | | | | | | | | | | | | | | | | |
| | | | | | TPP Master | | | | | | | | | TPFG Feeder | | | | | | | | | TPFG II Feeder | | | | | | | | | TAF Destination | | | | | | | | | Adjustments | | | | | | | | | Combined Pro Forma
Destination | |
Assets: | | | | | | | | | | | | | | | | | | | | | | | | | | | | | | | | | | | | | | | | | | | | | | | | | | | | | | | | | | | | | | | | | | | | |
Investments, at value | | $ | | | | | 79,149,253 | | | | | | | $ | | | | | - | | | | | | | $ | | | | | - | | | | | | | $ | | | | | 321,954,736 | | | | | | | $ | | | | | - | | | | | | | $ | | | | | 401,103,989 | |
Repurchase agreements, at value | | | | | | | 414,591 | | | | | | | | | | | | - | | | | | | | | | | | | - | | | | | | | | | | | | 4,539,352 | | | | | | | | | | | | - | | | | | | | | | | | | 4,953,943 | |
Investments in Series Portfolio, at value | | | | | | | - | | | | | | | | | | | | 34,471,279 | | | | | | | | | | | | 6,558,246 | | | | | | | | | | | | - | | | | | | | | | | | | (41,029,525) | | | | (b) | | | | | | | | - | |
Cash | | | | | | | - | | | | | | | | | | | | - | | | | | | | | | | | | - | | | | | | | | | | | | - | | | | | | | | | | | | - | | | | | | | | | | | | - | |
Cash on deposit with broker | | | | | | | - | | | | | | | | | | | | - | | | | | | | | | | | | - | | | | | | | | | | | | - | | | | | | | | | | | | - | | | | | | | | | | | | - | |
Foreign currency, at value | | | | | | | - | | | | | | | | | | | | - | | | | | | | | | | | | - | | | | | | | | | | | | - | | | | | | | | | | | | - | | | | | | | | | | | | - | |
Receivables: | | | | | | | - | | | | | | | | | | | | - | | | | | | | | | | | | - | | | | | | | | | | | | - | | | | | | | | | | | | | | | | | | | | | | | | | |
Shares of beneficial interest sold | | | | | | | - | | | | | | | | | | | | - | | | | | | | | | | | | 705 | | | | | | | | | | | | 1,199 | | | | | | | | | | | | - | | | | | | | | | | | | 1,904 | |
Investments sold | | | | | | | 1,229,125 | | | | | | | | | | | | - | | | | | | | | | | | | - | | | | | | | | | | | | 5,646,787 | | | | | | | | | | | | | | | | | | | | | | | | 6,875,912 | |
When-issued, delay-delivery, and forward commitment securities sold | | | | | | | - | | | | | | | | | | | | - | | | | | | | | | | | | - | | | | | | | | | | | | - | | | | | | | | | | | | | | | | | | | | | | | | - | |
Interest | | | | | | | - | | | | | | | | | | | | - | | | | | | | | | | | | - | | | | | | | | | | | | 4 | | | | | | | | | | | | - | | | | | | | | | | | | 4 | |
Dividends | | | | | | | 107,944 | | | | | | | | | | | | - | | | | | | | | | | | | - | | | | | | | | | | | | 498,905 | | | | | | | | | | | | - | | | | | | | | | | | | 606,849 | |
Tax reclaims | | | | | | | - | | | | | | | | | | | | - | | | | | | | | | | | | - | | | | | | | | | | | | - | | | | | | | | | | | | - | | | | | | | | | | | | - | |
Net income from securities lending | | | | | | | 6,589 | | | | | | | | | | | | - | | | | | | | | | | | | - | | | | | | | | | | | | 21,674 | | | | | | | | | | | | - | | | | | | | | | | | | 28,263 | |
Due from advisor | | | | | | | - | | | | | | | | | | | | 6,682 | | | | | | | | | | | | 4,117 | | | | | | | | | | | | - | | | | | | | | | | | | - | | | | | | | | | | | | 10,799 | |
Money market waiver due from advisor | | | | | | | - | | | | | | | | | | | | - | | | | | | | | | | | | - | | | | | | | | | | | | - | | | | | | | | | | | | - | | | | | | | | | | | | - | |
Variation margin receivable | | | | | | | - | | | | | | | | | | | | - | | | | | | | | | | | | - | | | | | | | | | | | | - | | | | | | | | | | | | - | | | | | | | | | | | | - | |
Other | | | | | | | - | | | | | | | | | | | | - | | | | | | | | | | | | - | | | | | | | | | | | | - | | | | | | | | | | | | - | | | | | | | | | | | | - | |
Prepaid Expenses | | | | | | | 200 | | | | | | | | | | | | 123 | | | | | | | | | | | | 22 | | | | | | | | | | | | 192 | | | | | | | | | | | | - | | | | | | | | | | | | 537 | |
OTC swap agreements, at value | | | | | | | - | | | | | | | | | | | | - | | | | | | | | | | | | - | | | | | | | | | | | | - | | | | | | | | | | | | - | | | | | | | | | | | | - | |
Unrealized appreciation on forward foreign currency contracts | | | | | | | - | | | | | | | | | | | | - | | | | | | | | | | | | - | | | | | | | | | | | | - | | | | | | | | | | | | - | | | | | | | | | | | | - | |
| | | | | | | | | | | | | | | | | | | | | | | | | | | | | | | | | | | | | | | | | | | | |
Total assets | | $ | | | | | 80,907,702 | | | | | | | $ | | | | | 34,478,084 | | | | | | | $ | | | | | 6,563,090 | | | | | | | $ | | | | | 332,662,849 | | | | | | | $ | | | | | (41,029,525) | | | | | | | $ | | | | | 413,582,200 | |
| | | | | | | | | | | | | | | | | | | | | | | | | | | | | | | | | | | | | | | | | | | | |
| | | | | | | | | | | | | | | | | |
Liabilities: | | | | | | | | | | | | | | | | | | | | | | | | | | | | | | | | | | | | | | | | | | | | | | | | | | | | | | | | | | | | | | | | | | | | |
Due to custodian | | | | | | | - | | | | | | | | | | | | - | | | | | | | | | | | | - | | | | | | | | | | | | - | | | | | | | | | | | | - | | | | | | | | | | | | - | |
Cash deposit due to broker | | | | | | | - | | | | | | | | | | | | - | | | | | | | | | | | | - | | | | | | | | | | | | - | | | | | | | | | | | | - | | | | | | | | | | | | - | |
Payables and other liabilities: | | | | | | | | | | | | | | | | | | | | | | | | | | | | | | | | | | | | | | | | | | | | | | | | | | | | | | | | | | | | | | | | | | | | |
Shares of beneficial interest redeemed | | | | | | | - | | | | | | | | | | | | 11,961 | | | | | | | | | | | | - | | | | | | | | | | | | 46,197 | | | | | | | | | | | | - | | | | | | | | | | | | 58,158 | |
Investments purchased | | | | | | | 297,934 | | | | | | | | | | | | - | | | | | | | | | | | | - | | | | | | | | | | | | 1,476,707 | | | | | | | | | | | | - | | | | | | | | | | | | 1,774,641 | |
When-issued, delay-delivery, and forward commitment securities purchased | | | | | | | - | | | | | | | | | | | | - | | | | | | | | | | | | - | | | | | | | | | | | | - | | | | | | | | | | | | - | | | | | | | | | | | | - | |
Investment advisory fees | | | | | | | 42,097 | | | | | | | | | | | | - | | | | | | | | | | | | - | | | | | | | | | | | | 209,935 | | | | | | | | | | | | - | | | | | | | | | | | | 252,032 | |
Investment management fees | | | | | | | - | | | | | | | | | | | | - | | | | | | | | | | | | - | | | | | | | | | | | | - | | | | | | | | | | | | - | | | | | | | | | | | | - | |
Administration/Investment advisory fees | | | | | | | - | | | | | | | | | | | | 8,557 | | | | | | | | | | | | 273 | | | | | | | | | | | | - | | | | | | | | | | | | - | | | | | | | | | | | | 8,830 | |
Administration fees | | | | | | | - | | | | | | | | | | | | - | | | | | | | | | | | | - | | | | | | | | | | | | - | | | | | | | | | | | | - | | | | | | | | | | | | - | |
Distribution and service fees | | | | | | | - | | | | | | | | | | | | 7,131 | | | | | | | | | | | | 1,365 | | | | | | | | | | | | 881 | | | | | | | | | | | | - | | | | | | | | | | | | 9,377 | |
Transfer agent fees | | | | | | | - | | | | | | | | | | | | - | | | | | | | | | | | | - | | | | | | | | | | | | 2,090 | | | | | | | | | | | | - | | | | | | | | | | | | 2,090 | |
Trustee, CCO and deferred compensation fees | | | | | | | 121 | | | | | | | | | | | | 72 | | | | | | | | | | | | 14 | | | | | | | | | | | | 562 | | | | | | | | | | | | - | | | | | | | | | | | | 769 | |
Audit and tax fees | | | | | | | 11,928 | | | | | | | | | | | | 4,417 | | | | | | | | | | | | 3,950 | | | | | | | | | | | | 12,289 | | | | | | | | | | | | - | | | | | | | | | | | | 32,584 | |
Custody and accounting fees | | | | | | | 8,830 | | | | | | | | | | | | 1,831 | | | | | | | | | | | | 1,831 | | | | | | | | | | | | 21,724 | | | | | | | | | | | | - | | | | | | | | | | | | 34,216 | |
Legal fees | | | | | | | 851 | | | | | | | | | | | | 750 | | | | | | | | | | | | 142 | | | | | | | | | | | | 5,702 | | | | | | | | | | | | - | | | | | | | | | | | | 7,445 | |
Printing and shareholder reports fees | | | | | | | 454 | | | | | | | | | | | | 427 | | | | | | | | | | | | - | | | | | | | | | | | | 10,481 | | | | | | | | | | | | - | | | | | | | | | | | | 11,362 | |
Registration fees | | | | | | | - | | | | | | | | | | | | | | | | | | | | | | | | 5,401 | | | | | | | | | | | | 10,415 | | | | | | | | | | | | - | | | | | | | | | | | | 15,816 | |
Dividends, interest and fees for borrowings from securities sold short | | | | | | | - | | | | | | | | | | | | - | | | | | | | | | | | | - | | | | | | | | | | | | - | | | | | | | | | | | | - | | | | | | | | | | | | - | |
Interest | | | | | | | - | | | | | | | | | | | | - | | | | | | | | | | | | - | | | | | | | | | | | | - | | | | | | | | | | | | - | | | | | | | | | | | | - | |
Distribution payable to shareholders | | | | | | | - | | | | | | | | | | | | - | | | | | | | | | | | | - | | | | | | | | | | | | - | | | | | | | | | | | | - | | | | | | | | | | | | - | |
Other | | | | | | | 1,023 | | | | | | | | | | | | 230 | | | | | | | | | | | | 52 | | | | | | | | | | | | 2,204 | | | | | | | | | | | | 125,947 | | | | (c) | | | | | | | | 129,456 | |
Collateral for securities on loan | | | | | | | 15,660,316 | | | | | | | | | | | | - | | | | | | | | | | | | - | | | | | | | | | | | | 28,170,078 | | | | | | | | | | | | - | | | | | | | | | | | | 43,830,394 | |
Securities sold short, at value | | | | | | | - | | | | | | | | | | | | - | | | | | | | | | | | | - | | | | | | | | | | | | - | | | | | | | | | | | | - | | | | | | | | | | | | - | |
Written options and swaptions, at value | | | | | | | - | | | | | | | | | | | | - | | | | | | | | | | | | - | | | | | | | | | | | | - | | | | | | | | | | | | - | | | | | | | | | | | | - | |
OTC swap agreements, at value | | | | | | | - | | | | | | | | | | | | - | | | | | | | | | | | | - | | | | | | | | | | | | - | | | | | | | | | | | | - | | | | | | | | | | | | - | |
Unrealized depreciation on forward foreign currency contracts | | | | | | | - | | | | | | | | | | | | - | | | | | | | | | | | | - | | | | | | | | | | | | - | | | | | | | | | | | | - | | | | | | | | | | | | - | |
| | | | | | | | | | | | | | | | | | | | | | | | | | | | | | | | | | | | | | | | | | | | |
Total liabilities | | | | | | | 16,023,554 | | | | | | | | | | | | 35,376 | | | | | | | | | | | | 13,028 | | | | | | | | | | | | 29,969,265 | | | | | | | | | | | | 125,947 | | | | | | | | | | | | 46,167,170 | |
| | | | | | | | | | | | | | | | | | | | | | | | | | | | | | | | | | | | | | | | | | | | |
Net Assets | | $ | | | | | 64,884,148 | | | | | | | $ | | | | | 34,442,708 | | | | | | | $ | | | | | 6,550,062 | | | | | | | $ | | | | | 302,693,584 | | | | | | | $ | | | | | (41,155,472) | | | | | | | $ | | | | | 367,415,030 | |
| | | | | | | | | | | | | | | | | | | | | | | | | | | | | | | | | | | | | | | | | | | | |
| | | | | | | - | | | | | | | | | | | | - | | | | | | | | | | | | - | | | | | | | | | | | | | | | | | | | | | | | | | | | | | | | | | | | | | |
Net Assets Consist of: | | | | | | | | | | | | | | | | | | | | | | | | | | | | | | | | | | | | | | | | | | | | | | | | | | | | | | | | | | | | | | | | | | | | |
Paid-in capital | | $ | | | | | (20,354,611) | | | | | | | | | | | | 42,504,608 | | | | | | | | | | | | 5,159,608 | | | | | | | | | | | | 314,415,202 | | | | | | | $ | | | | | 39,626,656 | | | | (d) | | | $ | | | | | 381,351,463 | |
Undistributed (distributions in excess of) net investment income (loss) | | | | | | | 16,148,937 | | | | | | | | | | | | (29,442) | | | | | | | | | | | | (3,050) | | | | | | | | | | | | 1,547,534 | | | | | | | | | | | | (16,116,445) | | | | (d) | | | | | | | | 1,547,534 | |
Accumulated net realized gain (loss) | | | | | | | 66,184,826 | | | | | | | | | | | | (1,721,474) | | | | | | | | | | | | (2,702,665) | | | | | | | | | | | | (34,402,550) | | | | | | | | | | | | (61,760,687) | | | | (d) | | | | | | | | (34,402,550) | |
Net unrealized appreciation (depreciation) on: | | | | | | | | | | | | | | | | | | | | | | | | | | | | | | | | | | | | | | | | | | | | | | | | | | | | | | | | | | | | | | | | | | | | |
Investments | | | | | | | 2,904,996 | | | | | | | | | | | | - | | | | | | | | | | | | - | | | | | | | | | | | | 21,133,398 | | | | | | | | | | | | (2,904,996) | | | | (d) | | | | | | | | 21,133,398 | |
Allocated from Series Portfolio | | | | | | | - | | | | | | | | | | | | (6,310,984) | | | | | | | | | | | | 4,096,169 | | | | | | | | | | | | - | | | | | | | | | | | | - | | | | | | | | | | | | (2,214,815) | |
Securities sold short | | | | | | | - | | | | | | | | | | | | - | | | | | | | | | | | | - | | | | | | | | | | | | - | | | | | | | | | | | | - | | | | | | | | | | | | - | |
Written options and swaptions | | | | | | | - | | | | | | | | | | | | - | | | | | | | | | | | | - | | | | | | | | | | | | - | | | | | | | | | | | | - | | | | | | | | | | | | - | |
Swap agreements | | | | | | | - | | | | | | | | | | | | - | | | | | | | | | | | | - | | | | | | | | | | | | - | | | | | | | | | | | | - | | | | | | | | | | | | - | |
Futures contracts | | | | | | | - | | | | | | | | | | | | - | | | | | | | | | | | | - | | | | | | | | | | | | - | | | | | | | | | | | | - | | | | | | | | | | | | - | |
Translation of assets and liabilities denominated in foreign currencies | | | | | | | - | | | | | | | | | | | | - | | | | | | | | | | | | - | | | | | | | | | | | | - | | | | | | | | | | | | - | | | | | | | | | | | | - | |
| | | | | | | | | | | | | | | | | | | | | | | | | | | | | | | | | | | | | | | | | | | | |
| | | | | | | | | | | | | | | | | |
Net Assets | | $ | | | | | 64,884,148 | | | | | | | $ | | | | | 34,442,708 | | | | | | | $ | | | | | 6,550,062 | | | | | | | $ | | | | | 302,693,584 | | | | | | | $ | | | | | (41,155,472) | | | | | | | $ | | | | | 367,415,030.00 | |
| | | | | | | | | | | | | | | | | | | | | | | | | | | | | | | | | | | | | | | | | | | | |
| | | | | | | - | | | | | | | | | | | | - | | | | | | | | | | | | - | | | | | | | | | | | | - | | | | | | | | | | | | - | | | | | | | | | | | | | |
Net assets by class: | | | | | | | | | | | | | | | | | | | - | | | | | | | | | | | | - | | | | | | | | | | | | - | | | | | | | | | | | | | | | | | | | | | | | | | |
Class A | | $ | | | | | - | | | | | | | $ | | | | | - | | | | | | | $ | | | | | - | | | | | | | $ | | | | | 1,397,960 | | | | | | | $ | | | | | - | | | | | | | $ | | | | | 1,397,960 | |
Class B | | | | | | | - | | | | | | | | | | | | - | | | | | | | | | | | | - | | | | | | | | | | | | - | | | | | | | | | | | | - | | | | | | | | | | | | - | |
Class C | | | | | | | - | | | | | | | | | | | | - | | | | | | | | | | | | - | | | | | | | | | | | | 719,787 | | | | | | | | | | | | - | | | | | | | | | | | | 719,787 | |
Class I | | | | | | | - | | | | | | | | | | | | - | | | | | | | | | | | | - | | | | | | | | | | | | 427,313 | | | | | | | | | | | | - | | | | | | | | | | | | 427,313 | |
Class I2 | | | | | | | - | | | | | | | | | | | | - | | | | | | | | | | | | - | | | | | | | | | | | | 300,148,524 | | | | | | | | | | | | - | | | | | | | | | | | | 300,148,524 | |
Class I3 | | | | | | | 23,854,623 | | | | | | | | | | | | - | | | | | | | | | | | | - | | | | | | | | | | | | - | | | | | | | | | | | | (125,947) | | | | (c) | | | | | | | | 23,728,676 | |
Class T | | | | | | | - | | | | | | | | | | | | - | | | | | | | | | | | | - | | | | | | | | | | | | - | | | | | | | | | | | | - | | | | | | | | | | | | - | |
Class R | | | | | | | - | | | | | | | | | | | | 34,442,708 | | | | | | | | | | | | - | | | | | | | | | | | | - | | | | | | | | | | | | - | | | | | | | | | | | | 34,442,708 | |
Class R4 | | | | | | | - | | | | | | | | | | | | - | | | | | | | | | | | | 6,550,062 | | | | | | | | | | | | - | | | | | | | | | | | | - | | | | | | | | | | | | 6,550,062 | |
Class R6 | | | | | | | - | | | | | | | | | | | | - | | | | | | | | | | | | - | | | | | | | | | | | | - | | | | | | | | | | | | - | | | | | | | | | | | | - | |
Shares outstanding (unlimited shares, no par value): | | | | | | | | | | | | | | | | | | | | | | | | | | | | | | | | | | | | | | | | | | | | | | | | | | | | | | | | | | | | | | | | | | | | |
Class A | | | | | | | - | | | | | | | | | | | | - | | | | | | | | | | | | - | | | | | | | | | | | | 146,541 | | | | | | | | | | | | - | | | | | | | | | | | | 146,541 | |
Class B | | | | | | | - | | | | | | | | | | | | - | | | | | | | | | | | | - | | | | | | | | | | | | - | | | | | | | | | | | | - | | | | | | | | | | | | - | |
Class C | | | | | | | - | | | | | | | | | | | | - | | | | | | | | | | | | - | | | | | | | | | | | | 75,805 | | | | | | | | | | | | - | | | | | | | | | | | | 75,805 | |
Class I | | | | | | | - | | | | | | | | | | | | - | | | | | | | | | | | | - | | | | | | | | | | | | 44,559 | | | | | | | | | | | | - | | | | | | | | | | | | 44,559 | |
Class I2 | | | | | | | - | | | | | | | | | | | | - | | | | | | | | | | | | - | | | | | | | | | | | | 31,266,401 | | | | | | | | | | | | - | | | | | | | | | | | | 31,266,401 | |
Class I3 | | | | | | | 2,484,857 | | | | | | | | | | | | - | | | | | | | | | | | | - | | | | | | | | | | | | - | | | | | | | | | | | | - | | | | | | | | | | | | 2,484,857 | |
Class T | | | | | | | - | | | | | | | | | | | | - | | | | | | | | | | | | - | | | | | | | | | | | | - | | | | | | | | | | | | - | | | | | | | | | | | | - | |
Class R | | | | | | | - | | | | | | | | | | | | 2,271,092 | | | | | | | | | | | | - | | | | | | | | | | | | - | | | | | | | | | | | | 1,316,690 | | | | (e) | | | | | | | | 3,587,782 | |
Class R4 | | | | | | | - | | | | | | | | | | | | - | | | | | | | | | | | | 317,363 | | | | | | | | | | | | - | | | | | | | | | | | | 364,935 | | | | (e) | | | | | | | | 682,298 | |
Class R6 | | | | | | | - | | | | | | | | | | | | - | | | | | | | | | | | | - | | | | | | | | | | | | - | | | | | | | | | | | | - | | | | | | | | | | | | - | |
Net asset value per share: | | | | | | | | | | | | | | | | | | | | | | | | | | | | | | | | | | | | | | | | | | | | | | | | | | | | | | | | | | | | | | | | | | | | |
Class A | | $ | | | | | - | | | | | | | $ | | | | | - | | | | | | | $ | | | | | - | | | | | | | $ | | | | | 9.54 | | | | | | | | | | | | - | | | | | | | $ | | | | | 9.54 | |
Class B | | | | | | | - | | | | | | | | | | | | - | | | | | | | | | | | | - | | | | | | | | | | | | - | | | | | | | | | | | | - | | | | | | | | | | | | - | |
Class C | | | | | | | - | | | | | | | | | | | | - | | | | | | | | | | | | - | | | | | | | | | | | | 9.50 | | | | | | | | | | | | - | | | | | | | | | | | | 9.50 | |
Class I | | | | | | | - | | | | | | | | | | | | - | | | | | | | | | | | | - | | | | | | | | | | | | 9.59 | | | | | | | | | | | | - | | | | | | | | | | | | 9.59 | |
Class I2 | | | | | | | - | | | | | | | | | | | | - | | | | | | | | | | | | - | | | | | | | | | | | | 9.60 | | | | | | | | | | | | - | | | | | | | | | | | | 9.60 | |
Class I3 | | | | | | | 9.60 | | | | | | | | | | | | - | | | | | | | | | | | | - | | | | | | | | | | | | 9.60 | | | | | | | | | | | | (9.64) | | | | (f) | | | | | | | | 9.56 | |
Class T | | | | | | | - | | | | | | | | | | | | - | | | | | | | | | | | | - | | | | | | | | | | | | - | | | | | | | | | | | | - | | | | | | | | | | | | - | |
Class R | | | | | | | - | | | | | | | | | | | | 15.17 | | | | | | | | | | | | - | | | | | | | | | | | | 9.60 | | | | | | | | | | | | (15.19) | | | | (f) | | | | | | | | 9.58 | |
Class R4 | | | | | | | - | | | | | | | | | | | | - | | | | | | | | | | | | 20.64 | | | | | | | | | | | | 9.60 | | | | | | | | | | | | (20.64) | | | | (f) | | | | | | | | 9.60 | |
Class R6 | | | | | | | - | | | | | | | | | | | | - | | | | | | | | | | | | - | | | | | | | | | | | | - | | | | | | | | | | | | - | | | | | | | | | | | | - | |
Maximum offering price per share: | | | | | | | | | | | | | | | | | | | | | | | | | | | | | | | | | | | | | | | | | | | | | | | | | | | | | | | | | | | | | | | | | | | | |
Class A | | $ | | | | | - | | | | | | | $ | | | | | - | | | | | | | $ | | | | | - | | | | | | | $ | | | | | 10.10 | | | | | | | | | | | | - | | | | | | | $ | | | | | 10.10 | |
| | | | | | | | | | | | | | | | | | | | | | | | | | | | | | | | | | | | | | | | | | | | | | | | | | | | | | | | | | | | | | | | | | | | |
| | | | | | | | | | | | | | | | | | | | | | | | | | | | | | | | | | | | | | | | | | | | |
Investments, at cost | | $ | | | | | 76,244,257 | | | | | | | $ | | | | | - | | | | | | | $ | | | | | - | | | | | | | $ | | | | | 300,821,338 | | | | | | | | | | | | - | | | | | | | $ | | | | | 377,065,595 | |
Securities loaned, at value | | | | | | | 15,284,664 | | | | | | | | | | | | - | | | | | | | | | | | | - | | | | | | | | | | | | 27,572,647 | | | | | | | | | | | | - | | | | | | | | | | | | 42,857,311 | |
Repurchase agreements, at cost | | | | | | | 414,591 | | | | | | | | | | | | - | | | | | | | | | | | | - | | | | | | | | | | | | 4,539,352 | | | | | | | | | | | | - | | | | | | | | | | | | 4,953,943 | |
Foreign currency, at cost | | | | | | | - | | | | | | | | | | | | - | | | | | | | | | | | | - | | | | | | | | | | | | - | | | | | | | | | | | | - | | | | | | | | | | | | - | |
Premium received on written options and swaptions | | | | | | | - | | | | | | | | | | | | - | | | | | | | | | | | | - | | | | | | | | | | | | - | | | | | | | | | | | | - | | | | | | | | | | | | - | |
(a)-(l) See Note 2 of the Notes to the Pro Forma Financial Statements.
THE NOTES TO THE PRO FORMA FINANCIAL STATEMENTS ARE AN INTEGRAL PART OF THIS REPORT.
S-49
Reorganization Between TPP Master, TPFG Feeder, TPFG II Feeder and TAF Destination
PRO FORMA STATEMENT OF OPERATIONS
For the twelve-month period ended June 30, 2016
| | | | | | | | | | | | | | | | | | | | | | | | | | | | | | | | | | | | | | | | | | | | | | | | | | | | | | | | | | | | | | | | | | | | |
| | | | | | TPP Master | | | | | | | | | TPFG Feeder | | | | | | | | | TPFG II Feeder | | | | | | | | | TAF Destination | | | | | | | | | Adjustments | | | | | | | | | Combined Pro
Forma Destination | |
Investment Income: | | | | | | | | | | | | | | | | | | | | | | | | | | | | | | | | | | | | | | | | | | | | | | | | | | | | | | | | | | | | | | | | | | | | |
| | | | | | | | | | | | | | | | | |
Dividend income | | $ | | | | | 1,261,074 | | | | | | | $ | | | | | 681,543 | | | | | | | $ | | | | | 125,594 | | | | | | | $ | | | | | 7,304,740 | | | | | | | $ | | | | | (807,137) | | | | (b) | | | $ | | | | | 8,565,814 | |
Interest income | | | | | | | 287 | | | | | | | | | | | | 156 | | | | | | | | | | | | 29 | | | | | | | | | | | | 2,039 | | | | | | | | | | | | (185) | | | | (b) | | | | | | | | 2,326 | |
Net income (loss) from securities lending | | | | | | | 68,500 | | | | | | | | | | | | 36,873 | | | | | | | | | | | | 6,851 | | | | | | | | | | | | 500,803 | | | | | | | | | | | | (43,724) | | | | (b) | | | | | | | | 569,303 | |
Withholding taxes on foreign income | | | | | | | (938) | | | | | | | | | | | | (509) | | | | | | | | | | | | (93) | | | | | | | | | | | | (2,003) | | | | | | | | | | | | 602 | | | | (b) | | | | | | | | (2,941) | |
Expenses (net of waiver and/or reimbursement) | | | | | | | - | | | | | | | | | | | | (316,019) | | | | | | | | | | | | (58,073) | | | | | | | | | | | | - | | | | | | | | | | | | 374,092 | | | | (b) | | | | | | | | - | |
| | | | | | | | | | | | | | | | | | | | | | | | | | | | | | | | | | | | | | | | | | | | |
Total investment income (loss) | | | | | | | 1,328,923 | | | | | | | | | | | | 402,044 | | | | | | | | | | | | 74,308 | | | | | | | | | | | | 7,805,579 | | | | | | | | | | | | (476,352) | | | | | | | | | | | | 9,134,502 | |
| | | | | | | | | | | | | | | | | | | | | | | | | | | | | | | | | | | | | | | | | | | | |
| | | | | | | | | | | | | | | | | |
Expenses: | | | | | | | | | | | | | | | | | | | | | | | | | | | | | | | | | | | | | | | | | | | | | | | | | | | | | | | | | | | | | | | | | | | | |
Investment advisory fees | | | | | | | 562,673 | | | | | | | | | | | | - | | | | | | | | | | | | - | | | | | | | | | | | | 2,366,443 | | | | | | | | | | | | 7,246 | | | | (g) | | | | | | | | 2,936,362 | |
Investment management fees | | | | | | | - | | | | | | | | | | | | - | | | | | | | | | | | | - | | | | | | | | | | | | 838,814 | | | | | | | | | | | | - | | | | | | | | | | | | 838,814 | |
Administration/Investment advisory fees | | | | | | | - | | | | | | | | | | | | 111,458 | | | | | | | | | | | | 3,410 | | | | | | | | | | | | - | | | | | | | | | | | | (114,868) | | | | (h) | | | | | | | | - | |
Distribution and service fees: | | | | | | | | | | | | | | | | | | | | | | | | | | | | | | | | | | | | | | | | | | | | | | | | | | | | | | | | | | | | | | | | | | | | |
Class A | | | | | | | - | | | | | | | | | | | | - | | | | | | | | | | | | - | | | | | | | | | | | | 2,849 | | | | | | | | | | | | (2) | | | | (i) | | | | | | | | 2,847 | |
Class B | | | | | | | - | | | | | | | | | | | | - | | | | | | | | | | | | - | | | | | | | | | | | | - | | | | | | | | | | | | - | | | | | | | | | | | | - | |
Class C | | | | | | | - | | | | | | | | | | | | - | | | | | | | | | | | | - | | | | | | | | | | | | 8,074 | | | | | | | | | | | | (9) | | | | (i) | | | | | | | | 8,065 | |
Class I | | | | | | | - | | | | | | | | | | | | - | | | | | | | | | | | | - | | | | | | | | | | | | - | | | | | | | | | | | | - | | | | | | | | | | | | - | |
Class I2 | | | | | | | - | | | | | | | | | | | | - | | | | | | | | | | | | - | | | | | | | | | | | | - | | | | | | | | | | | | - | | | | | | | | | | | | - | |
Class I3 | | | | | | | - | | | | | | | | | | | | - | | | | | | | | | | | | - | | | | | | | | | | | | - | | | | | | | | | | | | - | | | | | | | | | | | | - | |
Class T | | | | | | | - | | | | | | | | | | | | - | | | | | | | | | | | | - | | | | | | | | | | | | - | | | | | | | | | | | | - | | | | | | | | | | | | - | |
Class R | | | | | | | - | | | | | | | | | | | | 92,881 | | | | | | | | | | | | - | | | | | | | | | | | | - | | | | | | | | | | | | 92,607 | | | | (i) | | | | | | | | 185,488 | |
Class R4 | | | | | | | - | | | | | | | | | | | | - | | | | | | | | | | | | 17,052 | | | | | | | | | | | | - | | | | | | | | | | | | (24) | | | | (i) | | | | | | | | 17,028 | |
Class R6 | | | | | | | - | | | | | | | | | | | | - | | | | | | | | | | | | - | | | | | | | | | | | | - | | | | | | | | | | | | - | | | | | | | | | | | | - | |
Administration fees | | | | | | | - | | | | | | | | | | | | - | | | | | | | | | | | | - | | | | | | | | | | | | 84,046 | | | | | | | | | | | | (84,046) | | | | (h) | | | | | | | | - | |
Transfer agent fees: | | | | | | | | | | | | | | | | | | | | | | | | | | | | | | | | | | | | | | | | | | | | | | | | | | | | | | | | | | | | | | | | | | | | |
Class A | | | | | | | - | | | | | | | | | | | | - | | | | | | | | | | | | - | | | | | | | | | | | | 2,312 | | | | | | | | | | | | - | | | | | | | | | | | | 2,312 | |
Class B | | | | | | | - | | | | | | | | | | | | - | | | | | | | | | | | | - | | | | | | | | | | | | - | | | | | | | | | | | | | | | | | | | | | | | | - | |
Class C | | | | | | | - | | | | | | | | | | | | - | | | | | | | | | | | | - | | | | | | | | | | | | 1,030 | | | | | | | | | | | | - | | | | | | | | | | | | 1,030 | |
Class I | | | | | | | - | | | | | | | | | | | | - | | | | | | | | | | | | - | | | | | | | | | | | | 655 | | | | | | | | | | | | | | | | | | | | | | | | 655 | |
Class I2 | | | | | | | - | | | | | | | | | | | | - | | | | | | | | | | | | - | | | | | | | | | | | | 28,826 | | | | | | | | | | | | | | | | | | | | | | | | 28,826 | |
Class I3 | | | | | | | - | | | | | | | | | | | | - | | | | | | | | | | | | - | | | | | | | | | | | | - | | | | | | | | | | | | | | | | | | | | | | | | - | |
Class T | | | | | | | - | | | | | | | | | | | | - | | | | | | | | | | | | - | | | | | | | | | | | | - | | | | | | | | | | | | - | | | | | | | | | | | | - | |
Class R | | | | | | | - | | | | | | | | | | | | - | | | | | | | | | | | | - | | | | | | | | | | | | - | | | | | | | | | | | | | | | | | | | | | | | | - | |
Class R4 | | | | | | | - | | | | | | | | | | | | - | | | | | | | | | | | | - | | | | | | | | | | | | - | | | | | | | | | | | | | | | | | | | | | | | | - | |
Class R6 | | | | | | | - | | | | | | | | | | | | - | | | | | | | | | | | | - | | | | | | | | | | | | - | | | | | | | | | | | | | | | | | | | | | | | | - | |
Trustee, CCO and deferred compensation fees | | | | | | | 1,119 | | | | | | | | | | | | 692 | | | | | | | | | | | | 120 | | | | | | | | | | | | 5,100 | | | | | | | | | | | | - | | | | | | | | | | | | 7,031 | |
Audit and tax fees | | | | | | | 22,255 | | | | | | | | | | | | 7,581 | | | | | | | | | | | | 6,531 | | | | | | | | | | | | 18,311 | | | | | | | | | | | | (23,234) | | | | (j) | | | | | | | | 31,444 | |
Custody fees | | | | | | | 29,662 | | | | | | | | | | | | 11,264 | | | | | | | | | | | | 11,264 | | | | | | | | | | | | 65,808 | | | | | | | | | | | | (47,051) | | | | (k) | | | | | | | | 70,947 | |
Legal fees | | | | | | | 6,746 | | | | | | | | | | | | 1,700 | | | | | | | | | | | | 234 | | | | | | | | | | | | 15,272 | | | | | | | | | | | | - | | | | | | | | | | | | 23,952 | |
Printing and shareholder reports fees | | | | | | | 219 | | | | | | | | | | | | 11,341 | | | | | | | | | | | | 3,087 | | | | | | | | | | | | 20,629 | | | | | | | | | | | | - | | | | | | | | | | | | 35,276 | |
Registration fees | | | | | | | - | | | | | | | | | | | | 17,686 | | | | | | | | | | | | 20,263 | | | | | | | | | | | | 52,703 | | | | | | | | | | | | | | | | | | | | | | | | 90,652 | |
Dividends, interest and fees for borrowings from securities sold short | | | | | | | - | | | | | | | | | | | | - | | | | | | | | | | | | - | | | | | | | | | | | | - | | | | | | | | | | | | | | | | | | | | | | | | - | |
Interest | | | | | | | - | | | | | | | | | | | | - | | | | | | | | | | | | - | | | | | | | | | | | | - | | | | | | | | | | | | - | | | | | | | | | | | | - | |
Other | | | | | | | 1,210 | | | | | | | | | | | | 1,570 | | | | | | | | | | | | 773 | | | | | | | | | | | | 11,006 | | | | | | | | | | | | - | | | | | | | | | | | | 14,559 | |
| | | | | | | | | | | | | | | | | | | | | | | | | | | | | | | | | | | | | | | | | | | | |
Total expenses before waiver and/or reimbursement and recapture | | | | | | | 623,884 | | | | | | | | | | | | 256,173 | | | | | | | | | | | | 62,734 | | | | | | | | | | | | 3,521,878 | | | | | | | | | | | | (169,381) | | | | | | | | | | | | 4,295,288 | |
Expenses waived and/or reimbursed: | | | | | | | | | | | | | | | | | | | | | | | | | | | | | | | | | | | | | | | | | | | | | | | | | | | | | | | | | | | | | | | | | | | | |
Fund level | | | | | | | (40,621) | | | | | | | | | | | | - | | | | | | | | | | | | - | | | | | | | | | | | | - | | | | | | | | | | | | 40,621 | | | | (l) | | | | | | | | - | |
Class A | | | | | | | - | | | | | | | | | | | | - | | | | | | | | | | | | - | | | | | | | | | | | | (702) | | | | | | | | | | | | 209 | | | | (l) | | | | | | | | (493) | |
Class B | | | | | | | - | | | | | | | | | | | | - | | | | | | | | | | | | - | | | | | | | | | | | | - | | | | | | | | | | | | - | | | | | | | | | | | | - | |
Class C | | | | | | | - | | | | | | | | | | | | - | | | | | | | | | | | | - | | | | | | | | | | | | - | | | | | | | | | | | | - | | | | | | | | | | | | - | |
Class I | | | | | | | - | | | | | | | | | | | | - | | | | | | | | | | | | - | | | | | | | | | | | | - | | | | | | | | | | | | - | | | | | | | | | | | | - | |
Class I2 | | | | | | | - | | | | | | | | | | | | - | | | | | | | | | | | | - | | | | | | | | | | | | - | | | | | | | | | | | | - | | | | | | | | | | | | - | |
Class I3 | | | | | | | - | | | | | | | | | | | | - | | | | | | | | | | | | - | | | | | | | | | | | | - | | | | | | | | | | | | (9,896) | | | | (l) | | | | | | | | (9,896) | |
Class T | | | | | | | - | | | | | | | | | | | | - | | | | | | | | | | | | - | | | | | | | | | | | | - | | | | | | | | | | | | - | | | | | | | | | | | | - | |
Class R | | | | | | | - | | | | | | | | | | | | (14,896) | | | | | | | | | | | | - | | | | | | | | | | | | - | | | | | | | | | | | | 14,896 | | | | (l) | | | | | | | | - | |
Class R4 | | | | | | | - | | | | | | | | | | | | - | | | | | | | | | | | | (45,775) | | | | | | | | | | | | - | | | | | | | | | | | | 43,036 | | | | (l) | | | | | | | | (2,739) | |
Class R6 | | | | | | | - | | | | | | | | | | | | - | | | | | | | | | | | | - | | | | | | | | | | | | - | | | | | | | | | | | | - | | | | | | | | | | | | - | |
Recapture of previously waived and/or reimbursed fees: | | | | | | | | | | | | | | | | | | | | | | | | | | | | | | | | | | | | | | | | | | | | | | | | | | | | | | | | | | | | | | | | | | | | |
Fund level | | | | | | | - | | | | | | | | | | | | - | | | | | | | | | | | | - | | | | | | | | | | | | - | | | | | | | | | | | | - | | | | | | | | | | | | - | |
Class A | | | | | | | - | | | | | | | | | | | | - | | | | | | | | | | | | - | | | | | | | | | | | | 94 | | | | | | | | | | | | - | | | | | | | | | | | | 94 | |
Class B | | | | | | | - | | | | | | | | | | | | - | | | | | | | | | | | | - | | | | | | | | | | | | - | | | | | | | | | | | | - | | | | | | | | | | | | - | |
Class C | | | | | | | - | | | | | | | | | | | | - | | | | | | | | | | | | - | | | | | | | | | | | | - | | | | | | | | | | | | - | | | | | | | | | | | | - | |
Class I | | | | | | | - | | | | | | | | | | | | - | | | | | | | | | | | | - | | | | | | | | | | | | - | | | | | | | | | | | | - | | | | | | | | | | | | - | |
Class I2 | | | | | | | - | | | | | | | | | | | | - | | | | | | | | | | | | - | | | | | | | | | | | | - | | | | | | | | | | | | - | | | | | | | | | | | | - | |
Class I3 | | | | | | | - | | | | | | | | | | | | - | | | | | | | | | | | | - | | | | | | | | | | | | - | | | | | | | | | | | | - | | | | | | | | | | | | - | |
Class T | | | | | | | - | | | | | | | | | | | | - | | | | | | | | | | | | - | | | | | | | | | | | | - | | | | | | | | | | | | - | | | | | | | | | | | | - | |
Class R | | | | | | | - | | | | | | | | | | | | - | | | | | | | | | | | | - | | | | | | | | | | | | - | | | | | | | | | | | | - | | | | | | | | | | | | - | |
Class R4 | | | | | | | - | | | | | | | | | | | | - | | | | | | | | | | | | - | | | | | | | | | | | | - | | | | | | | | | | | | - | | | | | | | | | | | | - | |
Class R6 | | | | | | | - | | | | | | | | | | | | - | | | | | | | | | | | | - | | | | | | | | | | | | - | | | | | | | | | | | | - | | | | | | | | | | | | - | |
| | | | | | | | | | | | | | | | | | | | | | | | | | | | | | | | | | | | | | | | | | | | |
Net expenses | | | | | | | 583,263 | | | | | | | | | | | | 241,277 | | | | | | | | | | | | 16,959 | | | | | | | | | | | | 3,521,270 | | | | | | | | | | | | (80,514) | | | | | | | | | | | | 4,282,255 | |
| | | | | | | | | | | | | | | | | |
Net investment income (loss) | | | | | | | 745,660 | | | | | | | | | | | | 160,767 | | | | | | | | | | | | 57,349 | | | | | | | | | | | | 4,284,309 | | | | | | | | | | | | (395,838) | | | | | | | | | | | | 4,852,247 | |
| | | | | | | | | | | | | | | | | | | | | | | | | | | | | | | | | | | | | | | | | | | | |
| | | | | | | | | | | | | | | | | |
Net realized gain (loss) on: | | | | | | | | | | | | | | | | | | | | | | | | | | | | | | | | | | | | | | | | | | | | | | | | | | | | | | | | | | | | | | | | | | | | |
Allocated from series portfolio | | | | | | | - | | | | | | | | | | | | 6,305,307 | | | | | | | | | | | | 1,135,468 | | | | | | | | | | | | - | | | | | | | | | | | | (7,440,775) | | | | (b) | | | | | | | | - | |
Investments | | | | | | | 11,577,241 | | | | | | | | | | | | - | | | | | | | | | | | | - | | | | | | | | | | | | (46,431,645) | | | | | | | | | | | | - | | | | | | | | | | | | (34,854,404) | |
Securities sold short | | | | | | | - | | | | | | | | | | | | - | | | | | | | | | | | | - | | | | | | | | | | | | - | | | | | | | | | | | | - | | | | | | | | | | | | - | |
Written options and swaptions | | | | | | | - | | | | | | | | | | | | - | | | | | | | | | | | | - | | | | | | | | | | | | - | | | | | | | | | | | | - | | | | | | | | | | | | - | |
Swap agreements | | | | | | | - | | | | | | | | | | | | - | | | | | | | | | | | | - | | | | | | | | | | | | - | | | | | | | | | | | | - | | | | | | | | | | | | - | |
Futures contracts | | | | | | | - | | | | | | | | | | | | - | | | | | | | | | | | | - | | | | | | | | | | | | - | | | | | | | | | | | | - | | | | | | | | | | | | - | |
Foreign currency transactions | | | | | | | (9,054) | | | | | | | | | | | | - | | | | | | | | | | | | - | | | | | | | | | | | | - | | | | | | | | | | | | - | | | | | | | | | | | | (9,054) | |
| | | | | | | | | | | | | | | | | | | | | | | | | | | | | | | | | | | | | | | | | | | | |
Net realized gain (loss) | | | | | | | 11,568,187 | | | | | | | | | | | | 6,305,307 | | | | | | | | | | | | 1,135,468 | | | | | | | | | | | | (46,431,645) | | | | | | | | | | | | (7,440,775) | | | | | | | | | | | | (34,863,458) | |
| | | | | | | | | | | | | | | | | | | | | | | | | | | | | | | | | | | | | | | | | | | | |
| | | | | | | | | | | | | | | | | |
Net change in unrealized appreciation (depreciation) on: | | | | | | | | | | | | | | | | | | | | | | | | | | | | | | | | | | | | | | | | | | | | | | | | | | | | | | | | | | | | | | | | | | | | |
Allocated from series portfolio | | | | | | | - | | | | | | | | | | | | (11,080,124) | | | | | | | | | | | | (1,962,166) | | | | | | | | | | | | - | | | | | | | | | | | | 17,300,327 | | | | (b) | | | | | | | | 4,258,037 | |
Investments | | | | | | | (20,200,184) | | | | | | | | | | �� | | - | | | | | | | | | | | | - | | | | | | | | | | | | (30,371,424) | | | | | | | | | | | | - | | | | | | | | | | | | (50,571,608) | |
Securities sold short | | | | | | | - | | | | | | | | | | | | - | | | | | | | | | | | | - | | | | | | | | | | | | - | | | | | | | | | | | | - | | | | | | | | | | | | - | |
Written options and swaptions | | | | | | | - | | | | | | | | | | | | - | | | | | | | | | | | | - | | | | | | | | | | | | - | | | | | | | | | | | | - | | | | | | | | | | | | - | |
Swap agreements | | | | | | | - | | | | | | | | | | | | - | | | | | | | | | | | | - | | | | | | | | | | | | - | | | | | | | | | | | | - | | | | | | | | | | | | - | |
Futures contracts | | | | | | | - | | | | | | | | | | | | - | | | | | | | | | | | | - | | | | | | | | | | | | - | | | | | | | | | | | | - | | | | | | | | | | | | - | |
Translation of assets and liabilities denominated in foreign currencies | | | | | | | (35) | | | | | | | | | | | | - | | | | | | | | | | | | - | | | | | | | | | | | | - | | | | | | | | | | | | - | | | | | | | | | | | | (35) | |
| | | | | | | | | | | | | | | | | | | | | | | | | | | | | | | | | | | | | | | | | | | | |
Net change in unrealized appreciation (depreciation) | | | | | | | (20,200,219) | | | | | | | | | | | | (11,080,124) | | | | | | | | | | | | (1,962,166) | | | | | | | | | | | | (30,371,424) | | | | | | | | | | | | 17,300,327 | | | | | | | | | | | | (46,313,606) | |
| | | | | | | | | | | | | | | | | | | | | | | | | | | | | | | | | | | | | | | | | | | | |
| | | | | | | | | | | | | | | | | |
Net realized and change in unrealized gain (loss) | | | | | | | (8,632,032) | | | | | | | | | | | | (4,774,817) | | | | | | | | | | | | (826,698) | | | | | | | | | | | | (76,803,069) | | | | | | | | | | | | 9,859,552 | | | | | | | | | | | | (81,177,064) | |
| | | | | | | | | | | | | | | | | | | | | | | | | | | | | | | | | | | | | | | | | | | | |
| | | | | | | | | | | | | | | | | |
Net increase (decrease) in net assets resulting from operations | | $ | | | | | (7,886,372) | | | | | | | $ | | | | | (4,614,050) | | | | | | | $ | | | | | (769,349) | | | | | | | $ | | | | | (72,518,760) | | | | | | | $ | | | | | 9,463,714 | | | | | | | $ | | | | | (76,324,817) | |
| | | | | | | | | | | | | | | | | | | | | | | | | | | | | | | | | | | | | | | | | | | | |
(a)-(l) See Note 2 of the Notes to the Pro Forma Financial Statements.
THE NOTES TO THE PRO FORMA FINANCIAL STATEMENTS ARE AN INTEGRAL PART OF THIS REPORT.
S-50
NOTES TO THE PRO FORMA FINANCIAL STATEMENTS
NOTE 1 — GENERAL
The accompanying unaudited pro forma financial statements are presented to show the effect of the proposed transfer of substantially all of the assets of each Fund listed in the Target Fund column in the table below (each, a “Target Fund”, and together, the “Target Funds”) in exchange for shares of corresponding Fund listed in the Destination Fund & Shares column (each, a “Destination Fund”, and together, the “Destination Funds”) and the assumption by the Destination Fund of all of the liabilities of the Target Fund as described elsewhere in the Proxy Statement/Prospectus and this SAI. The “Pro Forma Funds” as identified in these financial statements represent the combined Destination Funds after the respective Reorganizations. The accounting survivor of each Reorganization grouping for financial reporting purposes is the Destination Fund except as indicated with an asterisk (*) in the table below. Management believes the accounting survivor of each Reorganization grouping is appropriate in light of the attributes of the applicable Destination Fund and Target Funds.
| | |
Target Fund | | Destination Fund & Shares |
| | | |
| Transamerica Partners Core Bond | | Transamerica Intermediate Bond Class R |
| Transamerica Partners Institutional Core Bond* | | Transamerica Intermediate Bond Class R4 |
| Transamerica Partners Core Bond Portfolio | | Transamerica Intermediate Bond Class I3 |
| | | |
| Transamerica Partners Government Money Market | | Transamerica Government Money Market Class R |
| Transamerica Partners Institutional Government Money Market | | Transamerica Government Money Market Class R4 |
| Transamerica Partners Government Money Market Portfolio | | Transamerica Government Money Market Class I3 |
| | | |
| Transamerica Partners High Yield Bond | | Transamerica High Yield Bond Class R |
| Transamerica Partners Institutional High Yield Bond | | Transamerica High Yield Bond Class R4 |
| Transamerica Partners High Yield Bond Portfolio | | Transamerica High Yield Bond Class I3 |
| | | |
| Transamerica Partners International Equity | | Transamerica International Equity Class R |
| Transamerica Partners Institutional International Equity | | Transamerica International Equity Class R4 |
| Transamerica Partners International Equity Portfolio | | Transamerica International Equity Class I3 |
| | | |
| Transamerica Partners Mid Growth | | Transamerica Mid Cap Growth Class R |
| Transamerica Partners Institutional Mid Growth | | Transamerica Mid Cap Growth Class R4 |
| Transamerica Partners Mid Growth Portfolio | | Transamerica Mid Cap Growth Class I3 |
| | | |
| Transamerica Partners Mid Value | | Transamerica Mid Cap Value Opportunities Class R |
| Transamerica Partners Institutional Mid Value | | Transamerica Mid Cap Value Opportunities Class R4 |
| Transamerica Partners Mid Value Portfolio | | Transamerica Mid Cap Value Opportunities Class I3 |
| | | |
| Transamerica Partners Small Core | | Transamerica Small Cap Core Class R |
| Transamerica Partners Institutional Small Core* | | Transamerica Small Cap Core Class R4 |
| Transamerica Partners Small Core Portfolio | | Transamerica Small Cap Core Class I3 |
| | | |
| Transamerica Partners Small Growth | | Transamerica Small Cap Growth Class R |
| Transamerica Partners Institutional Small Growth | | Transamerica Small Cap Growth Class R4 |
| Transamerica Partners Small Growth Portfolio | | Transamerica Small Cap Growth Class I3 |
| | | |
| Transamerica Partners Small Value | | Transamerica Small Cap Value Class R |
| Transamerica Partners Institutional Small Value* | | Transamerica Small Cap Value Class R4 |
| Transamerica Partners Small Value Portfolio | | Transamerica Small Cap Value Class I3 |
Capitalized terms not otherwise defined in the Notes to the financial statements have the meanings accorded to them in the Proxy Statement/Prospectus or this SAI.
For each Reorganization involving a Target Feeder Fund, for federal income tax purposes, no gain or loss is expected to be recognized by holders or, generally, the Target Feeder Fund, as a result of the Reorganization. The Reorganization of each Target Master Portfolio may be a taxable transaction. The exchange of each Target Master Portfolio’s assets for the applicable class of shares of the corresponding Destination Fund and the Destination Fund’s assumption of the Target Master Portfolio’s liabilities is expected, in most cases, to be a taxable exchange for federal income tax purposes, in which the Target Master Portfolio will recognize gains and losses. In such a case, holders of beneficial interests in the applicable Target Master Portfolio will be required to take into account their allocable shares of the gains and losses recognized by the Target Master Portfolio. Holders of beneficial interests in a Target Master Portfolio may also recognize gain or loss in connection with the applicable Destination Fund’s assumption of the Target Master Portfolio’s liabilities or the distribution of the applicable Destination Fund’s shares in liquidation of the Target Master Portfolio.
S-51
The unaudited pro forma Schedules of Investments and the unaudited Pro Forma Statements of Assets and Liabilities have been prepared as though the Reorganizations had been effective on June 30, 2016. The unaudited pro forma Statements of Operations have been prepared as though the Reorganizations had been effective June 30, 2016 to report operations for the period ended June 30, 2016.
In preparing the Destination Funds’ financial statements in accordance with accounting principles generally accepted in the United States of America (“GAAP”), estimates or assumptions (which could differ from actual results) may be used that affect reported amounts and disclosures.
The accompanying pro forma financial statements should be read in conjunction with the financial statements of the Target Funds and the Destination Funds, which are included in the Target Funds’ and Destination Funds’ annual reports dated December 31, 2015 and October 31, 2015, respectively.
NOTE 2 — PRO FORMA ADJUSTMENTS
Group One Reorganizations:
The Pro Forma adjustments below reflect the impact of each Reorganization.
(a) To adjust for Other Assets and Liabilities associated with the Target Feeder Funds.
(b) To adjust the Pro Forma Fund for investment securities, income and/or gains and losses allocated from the Target Master Portfolio to the Target Feeder Funds.
(c) To adjust the Pro Forma Fund for costs associated with the Reorganization.
(d) To adjust the Pro Forma Fund’s Shares of beneficial interest by the Accumulated net realized gain amounts of the Target Funds, as well as consolidating the Target Master Portfolio and Target Feeder Funds’ structure.
(e) To adjust Shares Outstanding of the Pro Forma Fund based on combining the Target Fund at the Destination Fund’s net asset value.
(f) To adjust Net Asset Value and Offering Price Per Share of the Pro Forma Fund based on combining the Target Fund at the Destination Fund’s net asset value.
(g) To restate management fees using the Destination Fund management fee rates for the Pro Forma Fund at the combined average daily net assets of the Target Funds and Destination Fund.
S-52
(h) To restate administration fees to remove the administration fees. Effective March 1, 2016, Investment advisory and administrative services fees were combined under the Management Agreement providing for a single management fee.
(i) To restate distribution and service fees using the Destination Fund distribution and service fees for the Pro Forma Fund at the combined average daily net assets of the Target Funds and Destination Fund.
(j) To remove duplicate Audit fees.
(k) To remove duplicate Custody fees.
(l) To restate expenses waived and/or reimbursed using the Destination Fund expense cap for the Pro Forma Fund at the combined average daily net assets and combined expenses of the Target Funds and Destination Fund.
Group Two Reorganizations:
The Pro Forma adjustments below reflect the impact of each Reorganization.
(a) To adjust for Other Assets and Liabilities associated with the Target Feeder Funds.
(b) To adjust the Pro Forma Fund for investment securities, income and/or gains and losses allocated from the Target Master Portfolio to the Target Feeder Funds.
(c) To adjust the Pro Forma Fund for costs associated with the Reorganization.
(d) To adjust the Pro Forma Fund’s Shares of beneficial interest by the Accumulated net realized gain amounts of the Target Funds, as well as consolidating the Target Master Portfolio and Target Feeder Funds’ structure.
(e) To adjust Shares Outstanding of the Pro Forma Fund based on combining the Target Fund at the Destination Fund’s net asset value.
(f) To adjust Net Asset Value and Offering Price Per Share of the Pro Forma Fund based on combining the Target Fund at the Destination Fund’s net asset value.
(g) To restate management fees using the Destination Fund management fee rates for the Pro Forma Fund at the combined average daily net assets of the Target Funds and Destination Fund.
(h) To restate administration fees to remove the administration fees. Effective March 1, 2016, Investment advisory and administrative services fees were combined under the Management Agreement providing for a single management fee.
(i) To restate distribution and service fees using the Destination Fund distribution and service fees for the Pro Forma Fund at the combined average daily net assets of the Target Funds and Destination Fund.
(j) To remove duplicate Audit fees.
(k) To remove duplicate Custody fees.
(l) To restate expenses waived and/or reimbursed using the Destination Fund expense cap for the Pro Forma Fund at the combined average daily net assets and combined expenses of the Target Funds and Destination Fund.
S-53
Group Three Reorganizations:
The Pro Forma adjustments below reflect the impact of each Reorganization.
(a) To adjust for Other Assets and Liabilities associated with the Target Feeder Funds.
(b) To adjust the Pro Forma Fund for investment securities, income and/or gains and losses allocated from the Target Master Portfolio to the Target Feeder Funds.
(c) To adjust the Pro Forma Fund for costs associated with the Reorganization.
(d) To adjust the Pro Forma Fund’s Shares of beneficial interest by the Accumulated net realized gain amounts of the Target Funds, as well as consolidating the Target Master Portfolio and Target Feeder Funds’ structure.
(e) To adjust Shares Outstanding of the Pro Forma Fund based on combining the Target Fund at the Destination Fund’s net asset value.
(f) To adjust Net Asset Value and Offering Price Per Share of the Pro Forma Fund based on combining the Target Fund at the Destination Fund’s net asset value.
(g) To restate management fees using the Destination Fund management fee rates for the Pro Forma Fund at the combined average daily net assets of the Target Funds and Destination Fund.
(h) To restate administration fees to remove the administration fees. Effective March 1, 2016, Investment advisory and administrative services fees were combined under the Management Agreement providing for a single management fee.
(i) To restate distribution and service fees using the Destination Fund distribution and service fees for the Pro Forma Fund at the combined average daily net assets of the Target Funds and Destination Fund.
(j) To remove duplicate Audit fees.
(k) To remove duplicate Custody fees.
(l) To restate expenses waived and/or reimbursed using the Destination Fund expense cap for the Pro Forma Fund at the combined average daily net assets and combined expenses of the Target Funds and Destination Fund.
Group Four Reorganizations:
The Pro Forma adjustments below reflect the impact of each Reorganization.
(a) To adjust for Other Assets and Liabilities associated with the Target Feeder Funds.
(b) To adjust the Pro Forma Fund for investment securities, income and/or gains and losses allocated from the Target Master Portfolio to the Target Feeder Funds.
S-54
(c) To adjust the Pro Forma Fund for costs associated with the Reorganization.
(d) To adjust the Pro Forma Fund’s Shares of beneficial interest by the Accumulated net realized gain amounts of the Target Funds, as well as consolidating the Target Master Portfolio and Target Feeder Funds’ structure.
(e) To adjust Shares Outstanding of the Pro Forma Fund based on combining the Target Fund at the Destination Fund’s net asset value.
(f) To adjust Net Asset Value and Offering Price Per Share of the Pro Forma Fund based on combining the Target Fund at the Destination Fund’s net asset value.
(g) To restate management fees using the Destination Fund management fee rates for the Pro Forma Fund at the combined average daily net assets of the Target Funds and Destination Fund.
(h) To restate administration fees to remove the administration fees. Effective March 1, 2016, Investment advisory and administrative services fees were combined under the Management Agreement providing for a single management fee.
(i) To restate distribution and service fees using the Destination Fund distribution and service fees for the Pro Forma Fund at the combined average daily net assets of the Target Funds and Destination Fund.
(j) To remove duplicate Audit fees.
(k) To remove duplicate Custody fees.
(l) To restate expenses waived and/or reimbursed using the Destination Fund expense cap for the Pro Forma Fund at the combined average daily net assets and combined expenses of the Target Funds and Destination Fund.
Group Five Reorganizations:
The Pro Forma adjustments below reflect the impact of each Reorganization.
(a) To adjust for Other Assets and Liabilities associated with the Target Feeder Funds.
(b) To adjust the Pro Forma Fund for investment securities, income and/or gains and losses allocated from the Target Master Portfolio to the Target Feeder Funds.
(c) To adjust the Pro Forma Fund for costs associated with the Reorganization.
(d) To adjust the Pro Forma Fund’s Shares of beneficial interest by the Accumulated net realized gain amounts of the Target Funds, as well as consolidating the Target Master Portfolio and Target Feeder Funds’ structure.
(e) To adjust Shares Outstanding of the Pro Forma Fund based on combining the Target Fund at the Destination Fund’s net asset value.
(f) To adjust Net Asset Value and Offering Price Per Share of the Pro Forma Fund based on combining the Target Fund at the Destination Fund’s net asset value.
S-55
(g) To restate management fees using the Destination Fund management fee rates for the Pro Forma Fund at the combined average daily net assets of the Target Funds and Destination Fund.
(h) To restate administration fees to remove the administration fees. Effective March 1, 2016, Investment advisory and administrative services fees were combined under the Management Agreement providing for a single management fee.
(i) To restate distribution and service fees using the Destination Fund distribution and service fees for the Pro Forma Fund at the combined average daily net assets of the Target Funds and Destination Fund.
(j) To remove duplicate Audit fees.
(k) To remove duplicate Custody fees.
(l) To restate expenses waived and/or reimbursed using the Destination Fund expense cap for the Pro Forma Fund at the combined average daily net assets and combined expenses of the Target Funds and Destination Fund.
Group Six Reorganizations:
The Pro Forma adjustments below reflect the impact of each Reorganization.
(a) To adjust for Other Assets and Liabilities associated with the Target Feeder Funds.
(b) To adjust the Pro Forma Fund for investment securities, income and/or gains and losses allocated from the Target Master Portfolio to the Target Feeder Funds.
(c) To adjust the Pro Forma Fund for costs associated with the Reorganization.
(d) To adjust the Pro Forma Fund’s Shares of beneficial interest by the Accumulated net realized gain amounts of the Target Funds, as well as consolidating the Target Master Portfolio and Target Feeder Funds’ structure.
(e) To adjust Shares Outstanding of the Pro Forma Fund based on combining the Target Fund at the Destination Fund’s net asset value.
(f) To adjust Net Asset Value and Offering Price Per Share of the Pro Forma Fund based on combining the Target Fund at the Destination Fund’s net asset value.
(g) To restate management fees using the Destination Fund management fee rates for the Pro Forma Fund at the combined average daily net assets of the Target Funds and Destination Fund.
(h) To restate administration fees to remove the administration fees. Effective March 1, 2016, Investment advisory and administrative services fees were combined under the Management Agreement providing for a single management fee.
(i) To restate distribution and service fees using the Destination Fund distribution and service fees for the Pro Forma Fund at the combined average daily net assets of the Target Funds and Destination Fund.
(j) To remove duplicate Audit fees.
S-56
(k) To remove duplicate Custody fees.
(l) To restate expenses waived and/or reimbursed using the Destination Fund expense cap for the Pro Forma Fund at the combined average daily net assets and combined expenses of the Target Funds and Destination Fund.
Group Seven Reorganizations:
The Pro Forma adjustments below reflect the impact of each Reorganization.
(a) To adjust for Other Assets and Liabilities associated with the Target Feeder Funds.
(b) To adjust the Pro Forma Fund for investment securities, income and/or gains and losses allocated from the Target Master Portfolio to the Target Feeder Funds.
(c) To adjust the Pro Forma Fund for costs associated with the Reorganization.
(d) To adjust the Pro Forma Fund’s Shares of beneficial interest by the Accumulated net realized gain amounts of the Target Funds, as well as consolidating the Target Master Portfolio and Target Feeder Funds’ structure.
(e) To adjust Shares Outstanding of the Pro Forma Fund based on combining the Target Fund at the Destination Fund’s net asset value.
(f) To adjust Net Asset Value and Offering Price Per Share of the Pro Forma Fund based on combining the Target Fund at the Destination Fund’s net asset value.
(g) To restate management fees using the Destination Fund management fee rates for the Pro Forma Fund at the combined average daily net assets of the Target Funds and Destination Fund.
(h) To restate administration fees to remove the administration fees. Effective March 1, 2016, Investment advisory and administrative services fees were combined under the Management Agreement providing for a single management fee.
(i) To restate distribution and service fees using the Destination Fund distribution and service fees for the Pro Forma Fund at the combined average daily net assets of the Target Funds and Destination Fund.
(j) To remove duplicate Audit fees.
(k) To remove duplicate Custody fees.
(l) To restate expenses waived and/or reimbursed using the Destination Fund expense cap for the Pro Forma Fund at the combined average daily net assets and combined expenses of the Target Funds and Destination Fund.
Group Eight Reorganizations:
The Pro Forma adjustments below reflect the impact of each Reorganization.
(a) To adjust for Other Assets and Liabilities associated with the Target Feeder Funds.
S-57
(b) To adjust the Pro Forma Fund for investment securities, income and/or gains and losses allocated from the Target Master Portfolio to the Target Feeder Funds.
(c) To adjust the Pro Forma Fund for costs associated with the Reorganization.
(d) To adjust the Pro Forma Fund’s Shares of beneficial interest by the Accumulated net realized gain amounts of the Target Funds, as well as consolidating the Target Master Portfolio and Target Feeder Funds’ structure.
(e) To adjust Shares Outstanding of the Pro Forma Fund based on combining the Target Fund at the Destination Fund’s net asset value.
(f) To adjust Net Asset Value and Offering Price Per Share of the Pro Forma Fund based on combining the Target Fund at the Destination Fund’s net asset value.
(g) To restate management fees using the Destination Fund management fee rates for the Pro Forma Fund at the combined average daily net assets of the Target Funds and Destination Fund.
(h) To restate administration fees to remove the administration fees. Effective March 1, 2016, Investment advisory and administrative services fees were combined under the Management Agreement providing for a single management fee.
(i) To restate distribution and service fees using the Destination Fund distribution and service fees for the Pro Forma Fund at the combined average daily net assets of the Target Funds and Destination Fund.
(j) To remove duplicate Audit fees.
(k) To remove duplicate Custody fees.
(l) To restate expenses waived and/or reimbursed using the Destination Fund expense cap for the Pro Forma Fund at the combined average daily net assets and combined expenses of the Target Funds and Destination Fund.
Group Nine Reorganizations:
The Pro Forma adjustments below reflect the impact of each Reorganization.
(a) To adjust for Other Assets and Liabilities associated with the Target Feeder Funds.
(b) To adjust the Pro Forma Fund for investment securities, income and/or gains and losses allocated from the Target Master Portfolio to the Target Feeder Funds.
(c) To adjust the Pro Forma Fund for costs associated with the Reorganization.
(d) To adjust the Pro Forma Fund’s Shares of beneficial interest by the Accumulated net realized gain amounts of the Target Funds, as well as consolidating the Target Master Portfolio and Target Feeder Funds’ structure.
(e) To adjust Shares Outstanding of the Pro Forma Fund based on combining the Target Fund at the Destination Fund’s net asset value.
S-58
(f) To adjust Net Asset Value and Offering Price Per Share of the Pro Forma Fund based on combining the Target Fund at the Destination Fund’s net asset value.
(g) To restate management fees using the Destination Fund management fee rates for the Pro Forma Fund at the combined average daily net assets of the Target Funds and Destination Fund.
(h) To restate administration fees to remove the administration fees. Effective March 1, 2016, Investment advisory and administrative services fees were combined under the Management Agreement providing for a single management fee.
(i) To restate distribution and service fees using the Destination Fund distribution and service fees for the Pro Forma Fund at the combined average daily net assets of the Target Funds and Destination Fund.
(j) To remove duplicate Audit fees.
(k) To remove duplicate Custody fees.
(l) To restate expenses waived and/or reimbursed using the Destination Fund expense cap for the Pro Forma Fund at the combined average daily net assets and combined expenses of the Target Funds and Destination Fund.
NOTE 3 — INVESTMENT MANAGEMENT AND OTHER TRANSACTIONS
Transamerica Asset Management, Inc. (“TAM”) is the Destination Funds’ investment manager. TAM is directly owned by Transamerica Premier Life Insurance Company (“TPLIC”) and AUSA Holding Company (“AUSA”), both of which are indirect, wholly owned subsidiaries of Aegon NV. TPLIC is owned by Commonwealth General Corporation (“Commonwealth”) and Aegon USA, LLC (“Aegon USA”). Commonwealth and AUSA are wholly owned by Aegon USA. Aegon USA is wholly owned by Aegon US Holding Corporation, which is wholly owned by Transamerica Corporation (DE). Transamerica Corporation (DE) is wholly owned by The Aegon Trust, which is wholly owned by Aegon International B.V., which is wholly owned by Aegon NV, a Netherlands corporation, and a publicly traded international insurance group.
Transamerica Fund Services, Inc. (“TFS”) is the Destination Funds’ transfer agent. Transamerica Capital, Inc. (“TCI”) is the Destination Funds’ distributor/principal underwriter. TAM, TFS, and TCI are affiliates of Aegon, NV.
Certain officers and trustees of the Destination Fund are also officers and/or directors of TAM, TFS, and TCI.
S-59
Investment Management Fees
Each Target Fund pays an advisory fee to TAM based on daily average net assets (“ANA”) at the following annual rates:
| | |
| Target Fund | | Rate |
Transamerica Partners Core Bond Portfolio | | 0.35% on the first $2 billion 0.335% in excess of $2 billion |
Transamerica Partners Government Money Market Portfolio | | 0.25% on the first $1 billion 0.24% over $1 billion up to $3 billion 0.23% in excess of $3 billion |
Transamerica Partners High Yield Bond Portfolio | | 0.55% on the first $1.25 billion 0.525% over $1.25 billion up to $2 billion 0.500% in excess of $2 billion |
Transamerica Partners International Equity Portfolio | | 0.74% of the first $500 million 0.72% over $500 million up to $1 billion 0.69% over $1 billion up to $2 billion 0.66% in excess of $2 billion |
Transamerica Partners Mid Growth Portfolio | | 0.72% |
Transamerica Partners Mid Value Portfolio | | 0.67% of the first $750 million 0.665% over $750 million up to $1.5 billion 0.655% over $1.5 billion up to $2 billion 0.6475% over $2 billion |
Transamerica Partners Small Core Portfolio | | 0.80% of the first $300 million 0.77% in excess of $300 million |
Transamerica Partners Small Growth Portfolio | | 0.84% of the first $300 million 0.80% in excess $300 million |
Transamerica Partners Small Value Portfolio | | 0.82% of the first $250 million 0.78% over $250 million up to $500 million 0.75% over $500 million up to $750 million 0.725% in excess of $750 million |
TAM provides general investment advice to each Feeder Fund pursuant to the investment advisory agreement. For its services, each Feeder Fund is allocated investment advisory fees based on the interest owned in the corresponding Master Portfolio. The advisory fees are accrued daily on ANA and payable monthly at an annual rate set forth in the above table. Currently, each Feeder Fund invests all of its assets in a corresponding Master Portfolio, and the fees payable to TAM under the investment advisory agreement are reduced completely by the aggregate advisory fees allocated to the Feeder Funds by the corresponding Master Portfolio.
S-60
TAM has contractually agreed to waive and/or reimburse expenses of the Target Feeder Funds to the extent that the total operating expenses based on daily ANAs exceed the following stated annual operating expense limits. Fee waivers and/or reimbursements are not subject to recapture by TAM in future years.
| | | | |
| Target Fund | | Operating Expense Limit | | Operating Expense Limit
Effective Through |
Transamerica Partners Core Bond | | 1.00% | | May 1, 2017 |
Transamerica Partners Institutional Core Bond | | 0.65% | | May 1, 2017 |
Transamerica Partners Government Money Market | | 0.80% | | May 1, 2017 |
Transamerica Partners Institutional Government Money Market | | 0.50% | | May 1, 2017 |
Transamerica Partners High Yield Bond | | 1.10% | | May 1, 2017 |
Transamerica Partners Institutional High Yield Bond | | 0.85% | | May 1, 2017 |
Transamerica Partners International Equity | | 1.40% | | May 1, 2017 |
Transamerica Partners Institutional International Equity | | 1.15% | | May 1, 2017 |
Transamerica Partners Mid Growth | | 1.35% | | May 1, 2017 |
Transamerica Partners Institutional Mid Growth | | 0.95% | | May 1, 2017 |
Transamerica Partners Mid Value | | 1.25% | | May 1, 2017 |
Transamerica Partners Institutional Mid Value | | 0.90% | | May 1, 2017 |
Transamerica Partners Small Core | | 1.50% | | May 1, 2017 |
Transamerica Partners Institutional Small Core | | 1.10% | | May 1, 2017 |
Transamerica Partners Small Growth | | 1.55% | | May 1, 2017 |
Transamerica Partners Institutional Small Growth | | 1.15% | | May 1, 2017 |
Transamerica Partners Small Value | | 1.50% | | May 1, 2017 |
Transamerica Partners Institutional Small Value | | 1.10% | | May 1, 2017 |
TAM has voluntarily agreed to waive and/or reimburse expenses of the Target Master Portfolios to the extent that the total operating expenses based on daily ANAs exceed the following stated annual operating expense limits. These arrangements are voluntary and may be terminated by TAM at any time. Fee waivers and/or reimbursements are not subject to recapture by TAM in future years.
| | |
| Target Fund | | Operating Expense Limit |
Transamerica Partners Core Bond Portfolio | | 0.40% |
Transamerica Partners Government Money Market Portfolio | | 0.30% |
Transamerica Partners High Yield Bond Portfolio | | 0.60% |
Transamerica Partners International Equity Portfolio | | 0.90% |
Transamerica Partners Mid Growth Portfolio | | 0.75% |
Transamerica Partners Mid Value Portfolio | | 0.70% |
Transamerica Partners Small Core Portfolio | | 0.85% |
Transamerica Partners Small Growth Portfolio | | 0.90% |
Transamerica Partners Small Value Portfolio | | 0.85% |
Each Destination Fund pays a management fee to TAM based on the daily ANA at the following annual rates:
| | |
| Destination Fund | | Rate |
Transamerica Intermediate Bond | | 0.38% of the first $2 billion 0.365% in excess of $2 billion |
Transamerica Government Money Market | | 0.28% of the first $1 billion 0.27% over $1 billion up to $3 billion 0.26% in excess of $3 billion |
Transamerica High Yield Bond | | 0.58% of the first $1.25 billion 0.555% over $1.25 billion up to $2 billion 0.53% in excess of $2 billion |
Transamerica International Equity | | 0.77% of the first $500 million 0.75% over $500 million up to $1 billion 0.72% over $1 billion up to $2 billion 0.69% in excess of $2 billion |
Transamerica Mid Cap Growth | | 0.75% of the first $1 billion 0.73% in excess of $1 billion |
Transamerica Mid Cap Value Opportunities | | 0.70% of the first $750 million 0.695% over $750 million up to $1.5 billion 0.685% over $1.5 billion up to $2 billion 0.6775% in excess of $2 billion |
Transamerica Small Cap Core | | 0.83% of the first $300 million 0.80% in excess of $300 million |
Transamerica Small Cap Growth | | 0.87% of the first $300 million 0.83% in excess of $300 million |
Transamerica Small Cap Value | | 0.85% of the first $250 million 0.81% over $250 million up to $500 million 0.78% over $500 million up to $750 million 0.755% in excess of $750 million |
S-61
TAM has contractually agreed to waive fees and/or reimburse Destination Fund expenses to the extent that the total operating expenses excluding, as applicable, acquired fund fees and expenses, interest, taxes, brokerage commissions, dividend and interest expenses on securities sold short, extraordinary expenses and other expenses not incurred in the ordinary course of the Destination Funds’ business, exceed the following stated annual operating expense limits to the Destination Funds’ daily ANA.TAM is entitled to recapture expenses paid by the Destination Funds for fees waived and/or reimbursed during any of the previous 36 months if on any day or month the estimated annualized Funds operating expenses are less than the stated annual operating expense limit.
| | | | | | | | |
| Destination Fund | | Operating Expense Limit | | Operating Expense
Limit Effective
Through |
| | Class R | | Class R4 | | Class I3 | |
Transamerica Intermediate Bond | | 1.00% | | 0.65% | | 0.40% | | May 1, 2018 |
Transamerica Government Money Market | | 0.80% | | 0.50% | | 0.30% | | May 1, 2018 |
Transamerica High Yield Bond | | 1.10% | | 0.85% | | 0.60% | | May 1, 2018 |
Transamerica International Equity | | 1.40% | | 1.15% | | 0.90% | | May 1, 2018 |
Transamerica Mid Cap Growth | | 1.35% | | 0.95% | | 0.75% | | May 1, 2018 |
Transamerica Mid Cap Value Opportunities | | 1.25% | | 0.90% | | 0.70% | | May 1, 2018 |
Transamerica Small Cap Core | | 1.50% | | 1.10% | | 0.85% | | May 1, 2018 |
Transamerica Small Cap Growth | | 1.55% | | 1.15% | | 0.90% | | May 1, 2018 |
Transamerica Small Cap Value | | 1.50% | | 1.10% | | 0.85% | | May 1, 2018 |
In addition, TAM or any of its affiliates, on a voluntary basis and in addition to any contractual waivers in effect from time to time, have agreed to waive fees and/or reimburse expenses of Transamerica Partners Government Money Market, Transamerica Partners Institutional Government Money Market and one or more classes of Transamerica Government Money Market to such level(s) as the applicable Trust’s officers have determined or may reasonably determine from time to time in order to prevent a negative yield. Any such waiver or expense reimbursement may be discontinued by TAM or its affiliates at any time. TAM or its affiliates are entitled to reimbursement by a fund of any amounts so waived or reimbursed during the previous 36 months. Any such reimbursement shall not result in the fund’s effective daily yield to be negative. There is no guarantee that a fund will be able to prevent a negative yield.
S-62
NOTE 4 — VALUATION PROCEDURES OF THE FUNDS
All investments in securities are recorded at their estimated fair value. The Funds value their investments at the official close of the New York Stock Exchange (“NYSE”), each day the NYSE is open for business.
The Funds utilize various methods to measure the fair value of their investments on a recurring basis. GAAP establishes a hierarchy that prioritizes inputs to valuation methods. The inputs or methodology used for valuing securities are not necessarily an indication of the risk associated with investing in those securities. The three Levels of inputs of the fair value hierarchy are defined as follows:
Level 1—Unadjusted quoted prices in active markets for identical securities.
Level 2—Inputs, other than quoted prices included in Level 1, that are observable, either directly or indirectly. These inputs may include quoted prices for the identical instrument on an inactive market, prices for similar instruments, interest rates, prepayment speeds, credit risk, yield curves, default rates, and similar data.
Level 3—Unobservable inputs, which may include TAM’s internal valuation committee’s (the “Valuation Committee”) own assumptions in determining the fair value of investments. Factors considered in making this determination may include, but are not limited to, information obtained by contacting the sub-adviser, issuer, analysts, or the appropriate stock exchange (for exchange-traded securities), analysis of the issuer’s financial statements or other available documents and, if necessary, available information concerning other securities in similar circumstances.
The inputs used to measure fair value may fall into different Levels of the fair value hierarchy. In such cases, for disclosure purposes, the Level in the fair value hierarchy that is assigned to the fair value measurement of a security is determined based on the lowest Level input that is significant to the fair value measurement in its entirety. Certain investments that are measured at fair value using NAV per share, or its equivalent, practical expedient have not been classified in the fair value levels. The hierarchy classification of inputs used to value the Funds’ investments, at June 30, 2016, is disclosed in the Security Valuation section of each Fund’s Pro Forma Schedule of Investments.
Under supervision and approval of the Board, TAM provides day-to-day valuation functions. TAM formed the Valuation Committee to monitor and implement the fair valuation policies and procedures as approved by the Board. These policies and procedures are reviewed at least annually by the Board. The Valuation Committee, among other tasks, monitors for when market quotations are not readily available or are unreliable and determines in good faith the fair value of the portfolio investments. For instances in which daily market quotes are not readily available, securities may be valued, pursuant to procedures adopted by the Board, with reference to other instruments or indices. Depending on the relative significance of valuation inputs, these instruments may be classified in either Level 2 or Level 3 of the fair value hierarchy.
S-63
The Valuation Committee may employ a market-based approach which may use related or comparable assets or liabilities, recent transactions, market multiples, book values, and other relevant information for the security to determine the fair value of the security. An income-based valuation approach may also be used in which the anticipated future cash flows of the security are discounted to calculate fair value. Discounts may also be applied due to the nature or duration of any restrictions on the disposition of the securities. When the Funds use fair value methods that rely on significant unobservable inputs to determine a security’s value, the Valuation Committee will choose the method that is believed to accurately reflect fair value. These securities are categorized in Level 3 of the fair value hierarchy. The Valuation Committee reviews fair value measurements on a regular and ad hoc basis and may, as deemed appropriate, update the security valuations as well as the fair valuation guidelines. The Board reviews and considers Valuation Committee determinations at its regularly scheduled meetings.
The availability of observable inputs can vary from security to security and is affected by a wide variety of factors, including, but not limited to, the type of security, whether the security is new and not yet established in the marketplace, the liquidity of markets, and other characteristics particular to the security. To the extent that valuation is based on models or inputs that are less observable or unobservable in the market, the determination of fair value requires more judgment. Accordingly, the degree of judgment exercised in determining fair value is generally greatest for instruments categorized in Level 3. Due to the inherent uncertainty of valuation, the Valuation Committee’s determination of values may differ significantly from values that would have been realized had a ready market for investments existed, and the differences could be material. The Valuation Committee employs various methods for calibrating these valuation approaches, including a regular review of valuation methodologies, key inputs and assumptions, transactional back-testing, and reviews of any market related activity.
Fair value measurements: Descriptions of the valuation techniques applied to the Funds’ significant categories of assets and liabilities measured at fair value on a recurring basis are as follows:
Equity securities (common and preferred stocks): Securities are stated at the last reported sales price or closing price on the day of valuation taken from the primary exchange where the security is principally traded. To the extent these securities are actively traded and valuation adjustments are not applied, they are categorized in Level 1 of the fair value hierarchy.
Foreign securities, in which the primary trading market closes at the same time or after the NYSE, are valued based on quotations from the primary market in which they are traded and are categorized in Level 1. Because many foreign securities markets and exchanges close prior to the close of the NYSE, closing prices for foreign securities in those markets or on those exchanges do not reflect the events that occur after that close. Certain foreign securities may be fair valued using a pricing service that considers the correlation of the trading patterns of the foreign security to the intraday trading in the U.S. markets for investments such as American Depositary Receipts, financial futures, exchange-traded funds (“ETF”), and the movement of the certain indices of securities based on a statistical analysis of their historical relationship; such valuations generally are categorized in Level 2.
Preferred stock and other equities traded on inactive markets or valued by reference to similar instruments are also generally categorized in Level 2 or Level 3 if inputs are unobservable.
Investment companies and exchange-traded funds (“ETF”): Investment companies are valued at the NAV of the underlying funds. These securities are actively traded and no valuation adjustments are applied. ETFs are stated at the last reported sale price or closing price on the day of valuation taken from the primary exchange where the security is principally traded. Investment companies and ETFs are generally categorized in Level 1 of the fair value hierarchy. Investments in privately held investment funds with significant restrictions on redemptions where the inputs of NAVs are unobservable will be valued based upon the NAVs of such investments and are categorized in Level 3 of the fair value hierarchy.
Securities lending collateral: Securities lending collateral is invested in a money market fund which is valued at the NAV of the underlying securities and no valuation adjustments are applied. It is categorized in Level 1 of the fair value hierarchy.
Asset-backed securities: The fair value of asset-backed securities is estimated based on models that consider the estimated cash flows of each tranche of the entity, establish a benchmark yield, and develop an estimated tranche specific spread to the benchmark yield based on the unique attributes of the tranche. To the extent the inputs are observable and timely, the values would generally be categorized in Level 2 of the fair value hierarchy; otherwise they would be categorized in Level 3.The hierarchy classification of inputs used to value the Fund’s investments at October 31, 2014, is disclosed in the Valuation Summary of the Schedule of Investments.
Corporate bonds: The fair value of corporate bonds is estimated using various techniques, which consider recently executed transactions in securities of the issuer or comparable issuers, market price quotations (where observable), bond spreads, fundamental data relating to the issuer, and credit default swap spreads adjusted for any basis difference between cash and derivative instruments. While most corporate bonds are categorized in Level 2 of the fair value hierarchy, in instances where lower relative weight is placed on transaction prices, quotations, or similar observable inputs, they are categorized in Level 3.
S-64
Government securities: Government securities are normally valued using a model that incorporates market observable data such as reported sales of similar securities, broker quotes, yields, bids, offers, and reference data. Certain securities are valued by principally using dealer quotations. Government securities generally are categorized in Level 2 of the fair value hierarchy, or Level 3 if inputs are unobservable.
Loan assignments: Loan assignments are normally valued using an income approach, which projects future cash flows and converts those future cash flows to a present value using a discount rate. The resulting present value reflects the likely fair value of the loan. To the extent the inputs are observable and timely, the values would generally be categorized in Level 2 of the fair value hierarchy; otherwise are categorized in Level 3.
Mortgage-backed securities: The fair value of mortgage-backed securities is estimated based on models that consider issuer type, coupon, cash flows, mortgage prepayment projection tables and adjustable rate mortgage evaluations that incorporate index data, periodic life caps and the next coupon reset date. To the extent the inputs are observable and timely, the values would generally be categorized in Level 2 of the fair value hierarchy; otherwise they are categorized in Level 3.
Municipal bonds & notes and variable rate notes: The fair value of municipal bonds & notes and variable rate notes is estimated based on models that consider, among other factors, information received from market makers and broker-dealers, current trades, bid-want lists, offerings, market movements, the liquidity of the bond, state of issuance, benchmark yield curves, and bond or note insurance. To the extent the inputs are observable and timely, the values would generally be categorized in Level 2 of the fair value hierarchy; otherwise they are categorized in Level 3.
Repurchase agreements: Repurchase agreements are valued at cost, which approximates fair value. To the extent the inputs are observable and timely, the values are generally categorized in Level 2 of the fair value hierarchy.
Rights and warrants: Rights and warrants may be priced intrinsically using a model that incorporates the subscription or strike price, the daily market price for the underlying security, and a subscription ratio. If the inputs are unavailable, or if the subscription or strike price is higher than the market price, then the rights or warrants are priced at zero. Rights or warrants are generally categorized in Level 2 of the fair value hierarchy, or Level 3 if inputs are unobservable.
Short-term notes: The Funds, with the exception of money market funds, normally value short-term government and U.S. government agency securities using a model that incorporates market observable data such as reported sales of similar securities, broker quotes, yields, bids, offers and reference data. Certain securities are valued by principally using dealer quotations. Short-term government and U.S. government agency securities generally are categorized in Level 2 of the fair value hierarchy, or Level 3 if inputs are unobservable.
Commercial paper is valued using amortized cost, which approximates fair value. To the extent the inputs are observable and timely, the values are generally categorized in Level 2 of the fair value hierarchy, or Level 3 if inputs are unobservable.
Money market funds value all security positions using amortized cost, which approximates fair value. To the extent the inputs are observable and timely, the values are generally categorized in Level 2 of the fair value hierarchy, or Level 3 if inputs are unobservable.
U.S. government agency securities: U.S. government agency securities are comprised of two main categories consisting of agency issued debt and mortgage pass-throughs. Generally, agency issued debt securities are valued in a manner similar to U.S. government securities. Mortgage pass-throughs include to be announced (“TBA”) securities and mortgage pass-through certificates. Generally, TBA securities and mortgage pass-throughs are valued using dealer quotations. Depending on market activity levels and whether quotations or other observable data are used, these securities are typically categorized in Level 2 of the fair value hierarchy; otherwise they would be categorized in Level 3.
Restricted securities (equity and debt): Restricted securities for which quotations are not readily available are valued at fair value as determined in good faith by the Valuation Committee under the supervision of the Funds’ Board. Restricted securities issued by publicly traded companies are generally valued at a discount to similar publicly traded securities. Restricted securities issued by nonpublic entities may be valued by reference to comparable public entities and/or fundamental data relating to the issuer. Depending on the relative significance of observable valuation inputs, these instruments may be classified in either Level 2 or Level 3 of the fair value hierarchy.
Derivative instruments: Centrally cleared or listed derivatives that are actively traded are valued based on quoted prices from the exchange and are categorized in Level 1 of the fair value hierarchy. Over-the-counter (“OTC”) derivative contracts include forward, swap, swaption, and option contracts related to interest rates, foreign currencies, credit standing of reference entities, equity prices, or commodity prices. Depending on the product and the terms of the transaction, the fair value of the OTC derivative products are modeled taking into account the counterparties’ creditworthiness and using a series of techniques, including simulation models. Many pricing models do not entail material subjectivity because the methodologies employed do not necessitate significant judgments and the pricing inputs are observed from actively quoted markets, as is the case of interest rate swap and option contracts. The majority of OTC derivative products valued by the Funds using pricing models fall into this category and are categorized within Level 2 of the fair value hierarchy or Level 3 if inputs are unobservable.
NOTE 5 — TAX TREATMENT OF THE FUNDS
Each Destination Fund has elected to be treated as a “regulated investment company” for U.S. federal income tax purposes. For the taxable year that includes the closing date of the Reorganizations and for subsequent taxable periods, the Trust reasonably expects that each Destination Fund will meet the requirements of Subchapter M of the Code for qualification as regulated investment companies and will be eligible to, and will, compute its federal income tax under Section 852 of the Code.
S-65
NOTE 6 — COSTS ASSOCIATED WITH THE REORGANIZATION
The costs of the Reorganizations will be shared equally by TAM, on the one hand, and, subject to certain limits, the Target Funds and Destination Funds (and ultimately holders of the Target Funds and Destination Funds) on the other in accordance with an allocation methodology approved by the Boards of the Target Funds and Destination Funds. The estimated Fund costs associated with the Reorganizations, which are considered extraordinary expenses of the Funds and, thus, are not subject to the expense limitations of the Funds discussed in Note 3 above, are as follows:
| | | | |
| | | | |
Transamerica Partners Funds Group | | | |
Transamerica Partners Core Bond: | | $36,458.33 | |
Transamerica Partners Government Money Market: | | None | |
Transamerica Partners High Yield Bond: | | None | |
Transamerica Partners International Equity: | | None | |
Transamerica Partners Mid Growth: | | $36,458.33 | |
Transamerica Partners Mid Value: | | $36,458.33 | |
Transamerica Partners Small Core: | | $36,458.33 | |
Transamerica Partners Small Growth: | | $36,458.33 | |
Transamerica Partners Small Value: | | $36,458.33 | |
Transamerica Partners Funds Group II | | | |
Transamerica Partners Institutional Core Bond: | | None | |
| | | | |
Transamerica Partners Institutional Government Money Market: | | None | |
Transamerica Partners Institutional High Yield Bond: | | None | |
Transamerica Partners Institutional International Equity: | | None | |
Transamerica Partners Institutional Mid Growth: | | None | |
Transamerica Partners Institutional Mid Value: | | None | |
Transamerica Partners Institutional Small Core: | | None | |
Transamerica Partners Institutional Small Growth: | | None | |
Transamerica Partners Institutional Small Value: | | None | |
Transamerica Partners Portfolios | | | |
Transamerica Partners Core Bond Portfolio: | | $39,772.73 | |
Transamerica Partners Government Money Market Portfolio: | | $39,772.73 | |
Transamerica Partners High Yield Bond Portfolio: | | $39,772.73 | |
Transamerica Partners International Equity Portfolio: | | $149,147.73 | |
Transamerica Partners Mid Growth Portfolio: | | $39,772.73 | |
Transamerica Partners Mid Value Portfolio: | | $39,772.73 | |
Transamerica Partners Small Core Portfolio: | | $39,772.73 | |
Transamerica Partners Small Growth Portfolio: | | $39,772.73 | |
Transamerica Partners Small Value Portfolio: | | $39,772.73 | |
Transamerica Funds | | | |
Transamerica Intermediate Bond: | | $13,257.58 | |
Transamerica Government Money Market: | | $13,257.58 | |
Transamerica High Yield Bond: | | $49,715.91 | |
Transamerica International Equity: | | $49,715.91 | |
Transamerica Mid Cap Growth: | | $49,715.91 | |
Transamerica Mid Cap Value Opportunities: | | $13,257.58 | |
Transamerica Small Cap Core: | | $49,715.91 | |
Transamerica Small Cap Growth: | | $13,257.58 | |
Transamerica Small Cap Value: | | $49,715.91 | |
S-66
PART C
OTHER INFORMATION
Provisions relating to indemnification of the Registrant’s Trustees and employees are included in Registrant’s Declaration of Trust and Bylaws, which are incorporated herein by reference.
Pursuant to Rule 484, insofar as indemnification for liability arising under the Securities Act of 1933 (the “Act”) may be permitted to directors, officers and controlling persons of the Registrant pursuant to the foregoing provisions, or otherwise, the registrant has been advised that in the opinion of the Securities and Exchange Commission such indemnification is against public policy as expressed in the Act and is, therefore, unenforceable. In the event that a claim for indemnification against such liabilities (other than the payment by the Registrant of expenses incurred or paid by a director, officer or controlling person of the Registrant in the successful defense of any action, suit or proceeding) is asserted by such director, officer or controlling person in connection with the securities being registered, the Registrant will, unless in the opinion of its counsel the matter has been settled by controlling precedent, submit to a court of appropriate jurisdiction the question whether such indemnification by it is against public policy as expressed in the Act and will be governed by the final adjudication of such issue.
List all exhibits filed as part of the Registration Statement.
| | | | | | | | |
| (1) | | Amended and Restated Declaration of Trust, filed previously with PEA 212 on December 23, 2015. |
| |
| (2) | | Bylaws, filed previously with PEA 89 on February 28, 2008. |
| |
| (3) | | Not applicable. |
| |
| (4) | | Form of Agreement and Plan of Reorganization (See Exhibit A to the Proxy Statement/Prospectus). |
| |
| (5) | | See Exhibits 1 and 2 |
| | |
| (6) | | (a) | | Management Agreement |
| | | |
| | | | (i) | | Management Agreement between Registrant and Transamerica Asset Management, Inc. (“TAM”) filed previously with PEA 213 on February 25, 2016. |
| | | |
| | | | (ii) | | Amended Schedule A to Management Agreement dated July 31, 2016, filed previously with PEA 230 on September 29, 2016. |
| | | |
| | | | (iii) | | Amended Schedule A to be filed by subsequent amendment. |
| | |
| | (b) | | Sub-Advisory Agreements |
| | | |
| | | | (i) | | Sub-Advisory Agreement between TAM and Ranger Investment Management, L.P., filed previously with PEA 159 on August 30, 2012. |
| | | | |
| | | | | | (a) | | Amendment to Sub-Advisory Agreement, filed previously with PEA 216 on April 29, 2016. |
| | | |
| | | | (ii) | | Sub-Advisory Agreement between TAM and Systematic Financial Management L.P., filed previously with PEA 126 on April 29, 2011. |
| | | | |
| | | | | | (a) | | Amendment to Sub-Advisory Agreement, filed previously with PEA 179 on October 31, 2013. |
| | | | |
| | | | | | (b) | | Amendment to Sub-Advisory Agreement, filed previously with PEA 216. |
| | | |
| | | | (iv) | | Sub-Advisory Agreement between TAM and Boston Advisors, LLC, filed previously with PEA 213. |
| | | | |
| | | | | | (a) | | Amendment to Sub-Advisory Agreement, filed previously with PEA 216. |
| | | |
| | | | (iv) | | Sub-Advisory Agreement between TAM and Thompson, Siegel & Walmsley LLC, filed previously with PEA 122 on February 28, 2011. |
| | | | |
| | | | | | (a) | | Amendment to Sub-Advisory Agreement, filed previously with PEA 183 on February 28, 2014. |
| | | | |
| | | | | | (b) | | Amendment to Sub-Advisory Agreement, filed previously with PEA 185 on April 29, 2014. |
| | | | |
| | | | | | (c) | | Amendment to Sub-Advisory Agreement, filed previously with PEA 216. |
| | | |
| | | | (v) | | Sub-Advisory Agreement between TAM and Quantum Capital Management, filed previously with PEA 179. |
| | | | |
| | | | | | (a) | | Amendment to Sub-Advisory Agreement, filed previously with PEA 216. |
1
| | | | | | | | |
| | | |
| | | | (vi) | | Sub-Advisory Agreement between TAM and Aegon USA Investment Management, LLC, filed previously with PEA 126. |
| | | | |
| | | | | | (a) | | Amendment to Sub-Advisory Agreement, filed previously with PEA 213. |
| | | | |
| | | | | | (b) | | Amendment to Sub-Advisory Agreement, filed previously with PEA 216. |
| | | | |
| | | | | | (c) | | Amendment to Sub-Advisory Agreement, filed previously with PEA 230. |
| | | | |
| | | | | | (d) | | Amendment to Sub-Advisory Agreement, to be filed by subsequent amendment. |
| |
| (7) | | Underwriting Agreement, filed previously with PEA 89. |
| | |
| | (a) | | Updated Schedule I to be filed by subsequent amendment. |
| |
| (8) | | Amended and Restated Board Members Deferred Compensation Plan, filed previously with PEA 108 on February 26, 2010. |
| |
| (9) | | Custodian Agreement between Registrant and State Street Bank and Trust Company, filed previously with PEA 126. |
| | |
| | (a) | | Amendment to Custody Agreement, filed previously with PEA 170 on February 12, 2013. |
| | |
| | (b) | | Amendment to Appendix A-1 of Custody Agreement to be filed by subsequent amendment. |
| |
| (10) | | Plan of Distribution under Rule 12b-1 |
| | |
| | (a) | | Amended and Restated Plan of Distribution under Rule 12b-1, filed previously with PEA 197. |
| | | |
| | | | (i) | | Amended Schedule A to be filed by subsequent amendment. |
| | |
| | (b) | | Amended and Restated Plan for Multiple Classes of Shares, filed previously with PEA 230 on September 30, 2016. |
| | | |
| | | | (i) | | Amended Schedule A to be filed by subsequent amendment. |
| |
| (11) | | Form of Opinion of counsel as to the legality of the securities being registered, filed herein. |
| |
| (12) | | Form of Opinion of counsel as to tax matters, filed herein. |
| | |
| (13) | | (a) | | Transfer Agency Agreement between Registrant and Transamerica Fund Services, Inc. (“TFS”), filed previously with PEA 199 on March 30, 2015. |
| | |
| | (b) | | Amended and Restated Expense Limitation Agreement between Registrant and TAM, filed previously with PEA 199. |
| | | |
| | | | (i) | | Amended Schedules A and B to be filed by subsequent amendment. |
| | |
| | (c) | | Master Sub-Administration Agreement between Registrant and State Street Bank and Trust Company, filed previously with PEA 170. |
| | | |
| | | | (i) | | Novation Agreement on behalf of Master Sub-Administration Agreement, filed previously with PEA 230. |
| |
| (14) | | Consent of Independent Registered Certified Public Accounting firm, filed herein. |
| |
| (15) | | Not applicable. |
| |
| (16) | | Power of Attorney, filed herein. |
| |
| (17) | | Form of Proxy Card to be filed by subsequent amendment. |
All exhibits filed previously are herein incorporated by reference.
Item 17.
(1) The undersigned Registrant agrees that prior to any public reoffering of the securities registered through the use of a prospectus which is a part of this Registration Statement by any person or party who is deemed to be an underwriter within the meaning of Rule 145(c) of the 1933 Act, the reoffering prospectus will contain the information called for by the applicable registration form for the reofferings by persons who may be deemed underwriters, in addition to the information called for by the other items of the applicable form.
(2) The undersigned Registrant agrees that every prospectus that is filed under paragraph (1) above will be filed as a part of an amendment to the Registration Statement and will not be used until the amendment is effective, and that, in determining any liability under the 1933 Act, each post-effective amendment shall be deemed to be a new registration statement for the securities offered therein, and the offering of the securities at that time shall be deemed to be the initial bona fide offering of them.
(3) The undersigned Registrant undertakes to file, by post-effective amendment, the final opinion of Morgan Lewis & Bockius LLP supporting the tax consequences of the proposed reorganizations as soon as practicable after the closing of the reorganizations.
2
SIGNATURES
Pursuant to the requirements of the Securities Act of 1933, as amended, the Registrant has duly caused this Registration Statement on Form N-14 to be signed on its behalf by the undersigned, thereunder duly authorized, in the City of Denver, State of Colorado, on the 13th day of October, 2016.
| | |
| TRANSAMERICA FUNDS |
| |
| By: | | /s/ Marijn P. Smit |
| | Marijn P. Smit |
| | Trustee, President and Chief Executive Officer |
Pursuant to the requirements of the Securities Act of 1933, as amended this Registration Statement has been signed below by the following persons in the capacities and on the dates indicated:
| | | | |
/s/ Marijn P. Smit | | Trustee, President and Chief Executive Officer | | October 13, 2016 |
| Marijn P. Smit | | | |
| | |
/s/ Sandra N. Bane | | Trustee | | October 13, 2016 |
| Sandra N. Bane* | | | | |
| | |
/s/ Leo J. Hill | | Trustee | | October 13, 2016 |
| Leo J. Hill* | | | | |
| | |
/s/ David W. Jennings | | Trustee | | October 13, 2016 |
| David W. Jennings* | | | | |
| | |
/s/ Russell A. Kimball, Jr. | | Trustee | | October 13, 2016 |
| Russell A. Kimball, Jr.* | | | | |
| | |
/s/ Patricia L. Sawyer | | Trustee | | October 13, 2016 |
| Patricia L. Sawyer* | | | | |
| | |
/s/ John W. Waechter | | Trustee | | October 13, 2016 |
| John W. Waechter* | | | | |
| | |
/s/ Alan F. Warrick | | Trustee | | October 13, 2016 |
| Alan F. Warrick* | | | | |
| | |
/s/ Vincent J. Toner | | Vice President and Treasurer | | October 13, 2016 |
| Vincent J. Toner | | | | |
| | | | | | |
| * By: | | /s/ Tané T. Tyler | | Vice President, Associate General Counsel, Chief Legal Officer and Secretary | | October 13, 2016 |
| | Tané T. Tyler** | | | |
| ** | Attorney-in-fact pursuant to powers of attorney filed herein. |
WASHINGTON, DC 20549
SECURITIES AND EXCHANGE COMMISSION
Exhibits Filed With
Registration Statement on
Form N-14
Transamerica Funds
EXHIBIT INDEX
| | |
Exhibit Number | | Description of Exhibit |
| |
| (11) | | Opinion of counsel as to the legality of the securities being registered |
| |
| (12) | | Form of Opinion of counsel as to tax matters |
| |
| (14) | | Consent of Independent Registered Certified Public Accounting Firm |
| |
| (16) | | Power of Attorney |