| | |
| UNITED STATES
SECURITIES AND EXCHANGE COMMISSION |
| | |
| CERTIFIED SHAREHOLDER REPORT OF REGISTERED
MANAGEMENT INVESTMENT COMPANIES
|
| | |
| Investment Company Act file number: | (811-04616) |
| | |
| Exact name of registrant as specified in charter: | Putnam High Yield Fund |
| | |
| Address of principal executive offices: | 100 Federal Street, Boston, Massachusetts 02110 |
| | |
| Name and address of agent for service: | Robert T. Burns, Vice President
100 Federal Street
Boston, Massachusetts 02110 |
| | |
| Copy to: | Bryan Chegwidden, Esq.
Ropes & Gray LLP
1211 Avenue of the Americas
New York, New York 10036 |
| | |
| Registrant's telephone number, including area code: | (617) 292-1000 |
| | |
| Date of fiscal year end: | November 30, 2020 |
| | |
| Date of reporting period: | December 1, 2019 — November 30, 2020 |
| | |
|
Item 1. Report to Stockholders: | |
| | |
| The following is a copy of the report transmitted to stockholders pursuant to Rule 30e-1 under the Investment Company Act of 1940: | |
Putnam
High Yield
Fund
Annual report
11 | 30 | 20
Message from the Trustees
January 13, 2021
Dear Fellow Shareholder:
The world is welcoming 2021 with high hopes for the global economy and public health. Although COVID-19 infections have reached new levels, distribution of vaccines is underway, boosting optimism about a return to normal in the not-too-distant future. In the United States, President-elect Biden will take office with new proposals to rebuild the economy. The stock and bond markets start the year in good shape, indicating that investors are willing to look beyond current challenges and see the potential for renewed economic growth.
Putnam continues to employ active strategies that seek superior investment performance for you and your fellow shareholders. Putnam’s portfolio managers and analysts take a research-intensive approach that includes risk management strategies designed to serve you through changing conditions.
As always, thank you for investing with Putnam.

High-yield bonds have a number of features that can make them a compelling addition to a variety of portfolios. For one, high-yield bonds can be an attractive supplement — or even alternative — to equities. Since the start of the “lost decade” in 2000, high-yield bonds have outpaced stocks by a significant margin, and they have done so with a fraction of the volatility. For investors concerned about the risk entailed in today’s equity markets, high-yield bonds may be worth considering.
High-yield bonds can help diversify a Treasury-oriented portfolio
High-yield bonds can also complement a portfolio geared toward Treasuries, the prices of which tend to move in the opposite direction of interest rates. High-yield bonds generally trade based on investors’ perceptions of the health of the underlying corporate issuer, rather than on rates alone. In a strengthening economy, corporate fundamentals are often improving, and that can make high-yield bonds more attractive.
Diversification does not assure a profit or protect against loss. It is possible to lose money in a diversifiedp ortfolio.
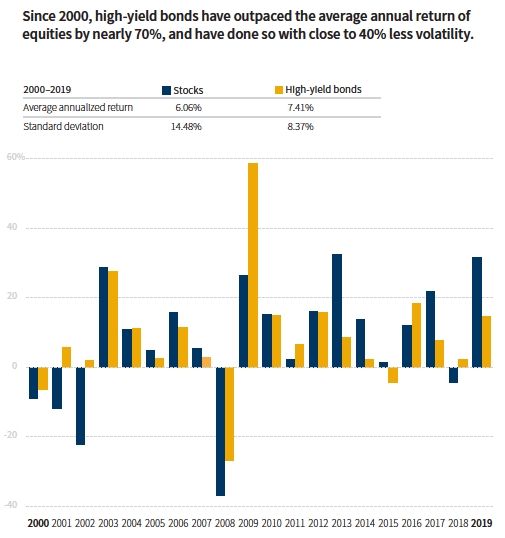
Sources: S&P, JPMorgan, as of 12/31/19. Stocks are represented by the S&P 500 Index. High-yield bonds are represented by the JPMorgan Developed High Yield Index. Standard deviation measures how widely a set of values varies from the mean. It is a historical measure of the variability of return earned by an investment portfolio. Past performance does not indicate future results. You cannot invest directly in an index.
Unlike stocks, bonds are subject to interest-rate risk, which means the prices of the fund’s bond investments are likely to fall if interest rates rise. Bond investments also are subject to credit risk, which is the risk that the issuer of the bond may default on payment of interest or principal. Interest-rate risk is generally greater for longer-term bonds, and credit risk is generally greater for below-investment-grade bonds, which may be considered speculative.
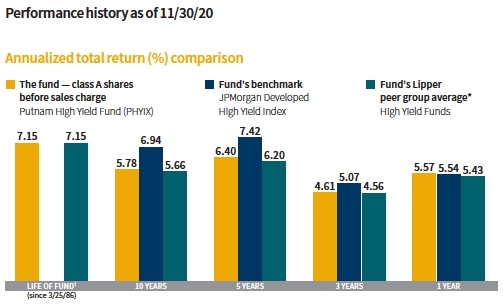
Current performance may be lower or higher than the quoted past performance, which cannot guarantee future results. Share price, principal value, and return will fluctuate, and you may have a gain or a loss when you sell your shares. Performance of class A shares assumes reinvestment of distributions and does not account for taxes. Fund returns in the bar chart do not reflect a sales charge of 4.00%; had they, returns would have been lower. See below and pages 10–13 for additional performance information. For a portion of the periods, the fund had expense limitations, without which returns would have been lower. To obtain the most recent month-end performance, visit putnam.com.
* Source: Lipper, a Refinitiv company.
† The fund’s benchmark, the JPMorgan Developed High Yield Index, was introduced on 12/31/94, which post-dates the inception of the fund’s class A shares.
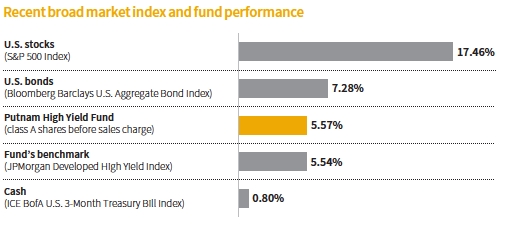
This comparison shows your fund’s performance in the context of broad market indexes for the 12 months ended 11/30/20. See above and pages 10–13 for additional fund performance information. Index descriptions can be found on pages 16–17.


Paul, how would you describe the high-yield bond market during the period?
Early on, it was a favorable environment for high yield and other risk assets, aided by U.S. Federal Reserve [Fed] interest-rate cuts and a phase-one trade agreement between the United States and China. Cracks began to appear in the benign backdrop early in 2020, however, leading to an eventual collapse in March. Intensifying investor anxiety about the COVID-19 outbreak sparked a global sell-off in risk assets. The pandemic quickly developed into an economic crisis that led to unprecedented measures from government policy makers. Also, a poorly timed dispute between Russia and Saudi Arabia over oil production levels pushed crude prices steadily lower until the end of April, further unnerving market participants.
Early in the crisis, the Fed quickly slashed its policy rate to near zero. High yield began to rebound in late March and continued through April on hopes that massive government stimulus would be enough to offset the near-term economic fallout from the pandemic.
The market recovery extended through May, as an easing of mobility restrictions and additional
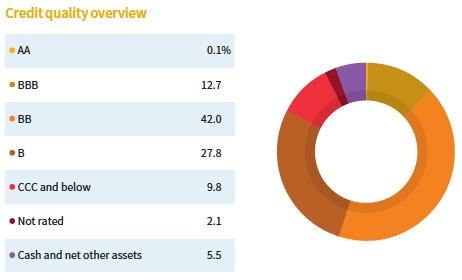
Credit qualities are shown as a percentage of the fund’s net assets as of 11/30/20. A bond rated BBB or higher (A-3 or higher, for short-term debt) is considered investment grade. This chart reflects the highest security rating provided by one or more of Standard & Poor’s, Moody’s, and Fitch. Ratings and portfolio credit quality will vary over time.
Cash and net other assets, if any, represent the market value weights of cash, derivatives, and short-term securities in the portfolio. The fund itself has not been rated by an independent rating agency.

policy support reinforced investors’ view that global economic activity had bottomed and would recover, albeit gradually.
After slowing a bit in June, the pace of the high-yield rally accelerated in July. A confluence of factors lifted market sentiment, including positive developments on a potential vaccine, progress on a new economic relief package, corporate earnings that came in above consensus expectations, and a steadily rising stock market. These dynamics boosted the market despite heightening U.S.–China tensions and rising COVID-19 cases.
After registering a solid gain in August, the high-yield market posted negative performance in September. Increased global economic concerns stemming from an upsurge in virus cases, fading hope for another U.S. stimulus package, and uncertainty surrounding U.S. elections weighed on the asset class.
High yield ended the period on a very strong note, gaining about 4% in November. Positive news on a COVID-19 vaccine bolstered investor optimism about the strength of the economic recovery in 2021.
Within the JPMorgan index, nearly all cohorts posted gains, led by automotive (+11%), health care (+10%), housing (+10%), and technology (+10%). The only negative groups were energy (–8%) and broadcasting (–1%). Transportation (+1%), a relatively small index component, also lagged.
From a credit-rating perspective, lower-quality bonds generated the strongest returns. In our view, this reflected increased appetite for risk following March’s turmoil amid a generally supportive fundamental backdrop. Higher-quality debt rated BB also outperformed the index.
The fund performed in line with its benchmark and modestly outpaced the average return of its Lipper peer group. What factors had the greatest impact on relative performance?
The fund’s lower-than-benchmark allocation to energy, as well as security selection in
the sector, added the most value versus the benchmark. Picks among telecommunications companies and overweight exposure to the utilities sector also helped. Conversely, an underweight allocation to automotive, along with overall positioning in gaming, lodging & leisure and food & beverages, dampened relative performance.
Which individual holdings had the biggest influence versus the benchmark?
This period, avoiding many poor-performing index members considerably aided the fund’s relative performance. For example, 11 of the fund’s top-20 relative contributors were bonds in the index that we did not own. These included several underperforming energy companies, as well as rental car company The Hertz Corporation, which filed for bankruptcy in May 2020.

On the downside, overweight positions in two oil & gas exploration and production companies worked against the fund’s relative performance. Both Transocean and Denbury Resources were hurt by the sharp decline in oil prices during the period. We sold the fund’s position in Denbury.
CEC Entertainment, the parent company of the Chuck E. Cheese restaurant chain, was another notable relative detractor. Reflecting the operating pressures presented by COVID-19, the company filed for bankruptcy protection in June 2020.

This table shows the fund’s top 10 individual holdings and the percentage of the fund’s net assets that each represented as of 11/30/20. Short-term investments, TBA commitments, and derivatives, if any, are excluded. Holdings may vary over time.
What is your outlook for the coming months?
As we look toward 2021, we have a moderately constructive view overall. Although we expect the ongoing global health crisis to affect the high-yield market, we have a fairly positive intermediate-term outlook for corporate fundamentals and the market’s supply-and-demand backdrop. Also, even though high-yield spreads retightened following their sizable widening in March, we think valuations remain relatively attractive. [Spreads are the yield advantage high-yield bonds offer over comparable-maturity U.S. Treasuries.]
From a fundamental perspective, we are closely watching sectors that we think are vulnerable to the disruption caused by the pandemic. In addition to energy, we are monitoring the impact on gaming, lodging & leisure; retail; and several other cohorts. Within these groups, we are focusing on the health of issuers’ balance sheets and liquidity metrics, as well as the risk of defaults or credit-rating downgrades.
The U.S. high-yield default rate ended the period at 6.74%, fueled by defaults among energy issuers. Excluding the energy sector, the default rate was a more modest 4.5%, although this was still above the long-term average of 3% to 3.5%. Given expectations for a widely distributed COVID-19 vaccine in 2021, we believe the default rate will decline next year.
As for supply/demand dynamics, new issuance of high-yield debt totaled $419.8 billion on a year-to-date basis through November 2020, topping the full-year record of $398.5 billion that occurred in 2013. On the demand side, high-yield funds [mutual funds and exchange-traded funds] experienced inflows in seven of the prior eight months through November, bringing the
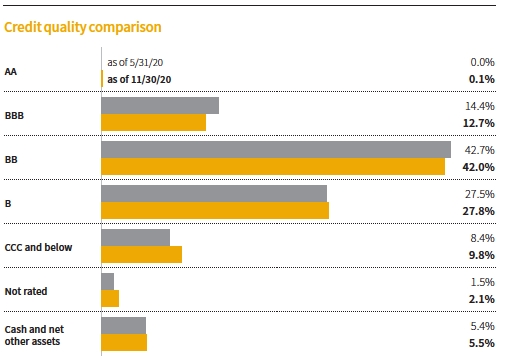
This chart shows how the fund’s credit quality has changed over the past six months. Credit qualities are shown as a percentage of the fund’s net assets. A bond rated BBB or higher (A-3 or higher, for short-term debt) is considered investment grade. This chart reflects the highest security rating provided by one or more of Standard & Poor’s, Moody’s, and Fitch. Ratings and portfolio credit quality will vary over time.
Cash and net other assets, if any, represent the market value weights of cash, derivatives, and short-term securities in the portfolio. The fund itself has not been rated by an independent rating agency.
year-to-date total to $44.7 billion. We believe the asset class will continue to attract inflows in 2021, although perhaps not to the degree we’ve seen in 2020.
From a valuation standpoint, the average spread of the fund’s benchmark tightened to about five percentage points over U.S. Treasuries as of period-end, below the long-term average of six percentage points. The benchmark’s yield was at 5.29% as of November 30. After tightening from March’s extremely wide level, high-yield spreads compressed a bit more on recent vaccine news. Despite the retracement in spreads, we think the market’s yield and overall total return potential remain attractive in the face of much lower global yields.
Thanks for your time and for bringing us up to date, Paul.
The views expressed in this report are exclusively those of Putnam Management and are subject to change. They are not meant as investment advice.
Please note that the holdings discussed in this report may not have been held by the fund for the entire period. Portfolio composition is subject to review in accordance with the fund’s investment strategy and may vary in the future. Current and future portfolio holdings are subject to risk. Statements in the Q&A concerning the fund’s performance or portfolio composition relative to those of the fund’s Lipper peer group may reference information produced by Lipper Inc. or through a third party.
Of special interest
The fund seeks high current income consistent with what Putnam Management believes to be prudent risk and had maintained a stable dividend since July 2017. In July 2020, however, the fund reduced its monthly distribution rate per class A share from $0.024 to $0.021. This reduction was deemed necessary due lower yields on the bonds held by the Fund which translated into less income earned by the portfolio. Similar decreases were made to other share classes.
Your fund’s performance
This section shows your fund’s performance, price, and distribution information for periods ended November 30, 2020, the end of its most recent fiscal year. In accordance with regulatory requirements for mutual funds, we also include performance information as of the most recent calendar quarter-end and expense information taken from the fund’s current prospectus. Performance should always be considered in light of a fund’s investment strategy. Data represent past performance. Past performance does not guarantee future results. More recent returns may be less or more than those shown. Investment return and principal value will fluctuate, and you may have a gain or a loss when you sell your shares. Performance information does not reflect any deduction for taxes a shareholder may owe on fund distributions or on the redemption of fund shares. For the most recent month-end performance, please visit the Individual Investors section at putnam.com or call Putnam at 1-800-225-1581. Class M shares (excluding those purchased from Japanese distributors) converted automatically to class A shares on November 25, 2019, and, beginning November 25, 2019, Class M shares are available for purchase only by individuals purchasing from Japanese distributors. Class R, R6, and Y shares are not available to all investors. See the Terms and definitions section in this report for definitions of the share classes offered by your fund.
Fund performance Total return for periods ended 11/30/20
| | | | | | | | |
| | Annual | | | | | | | |
| | average | | Annual | | Annual | | Annual | |
| | (life of fund) | 10 years | average | 5 years | average | 3 years | average | 1 year |
| Class A (3/25/86) | | | | | | | | |
| Before sales charge | 7.15% | 75.35% | 5.78% | 36.35% | 6.40% | 14.47% | 4.61% | 5.57% |
| After sales charge | 7.02 | 68.34 | 5.35 | 30.90 | 5.53 | 9.89 | 3.19 | 1.34 |
| Class B (5/16/94) | | | | | | | | |
| Before CDSC | 6.93 | 64.82 | 5.12 | 31.44 | 5.62 | 12.13 | 3.89 | 4.95 |
| After CDSC | 6.93 | 64.82 | 5.12 | 29.44 | 5.30 | 9.18 | 2.97 | –0.05 |
| Class C (3/30/07) | | | | | | | | |
| Before CDSC | 6.92 | 62.96 | 5.00 | 31.50 | 5.63 | 12.23 | 3.92 | 4.99 |
| After CDSC | 6.92 | 62.96 | 5.00 | 31.50 | 5.63 | 12.23 | 3.92 | 3.99 |
| Class M (12/1/94) | | | | | | | | |
| Before sales charge | 6.86 | 71.12 | 5.52 | 34.83 | 6.16 | 13.62 | 4.35 | 5.37 |
| After sales charge | 6.76 | 65.56 | 5.17 | 30.45 | 5.46 | 9.93 | 3.21 | 1.94 |
| Class R (3/30/07) | | | | | | | | |
| Net asset value | 6.89 | 71.13 | 5.52 | 34.84 | 6.16 | 13.80 | 4.40 | 5.35 |
| Class R6 (5/22/18) | | | | | | | | |
| Net asset value | 7.35 | 79.51 | 6.03 | 38.07 | 6.66 | 15.39 | 4.89 | 6.04 |
| Class Y (12/31/98) | | | | | | | | |
| Net asset value | 7.35 | 79.90 | 6.05 | 38.37 | 6.71 | 15.64 | 4.96 | 5.98 |
Current performance may be lower or higher than the quoted past performance, which cannot guarantee future results. After-sales-charge returns for class A and M shares reflect the deduction of the maximum 4.00% and 3.25% sales charge, respectively, levied at the time of purchase. Class B share returns after contingent deferred sales charge (CDSC) reflect the applicable CDSC, which is 5% in the first year, declining over time to 1% in the sixth year, and is eliminated thereafter. Class C share returns after CDSC reflect a 1% CDSC for the first year that is eliminated thereafter. Class R, R6, and Y shares have no initial sales charge or CDSC. Performance for class B, C, M, R, and Y shares before their inception is derived from the historical performance of class A shares, adjusted for the applicable sales charge (or CDSC) and the higher operating expenses for such shares, except for class Y shares, for which 12b-1 fees are not applicable. Performance for class R6 shares prior to their inception is derived from the historical performance of
class Y shares and has not been adjusted for the lower investor servicing fees applicable to class R6 shares; had it, returns would have been higher.
For a portion of the periods, the fund had expense limitations, without which returns would have been lower.
Class B share performance reflects conversion to class A shares after eight years.
Class C share performance reflects conversion to class A shares after 10 years.
Comparative index returns For periods ended 11/30/20
| | | | | | | | |
| | Annual | | | | | | | |
| | average | | Annual | | Annual | | Annual | |
| | (life of fund) | 10 years | average | 5 years | average | 3 years | average | 1 year |
| JPMorgan Developed High | | | | | | | | |
| Yield Index | —* | 95.57% | 6.94% | 43.03% | 7.42% | 16.01% | 5.07% | 5.54% |
| Lipper High Yield Funds | | | | | | | | |
| category average† | 7.15% | 73.74 | 5.66 | 35.21 | 6.20 | 14.34 | 4.56 | 5.43 |
Index and Lipper results should be compared with fund performance before sales charge, before CDSC, or at net asset value.
* The fund’s benchmark, the JPMorgan Developed High Yield Index, was introduced on 12/31/94, which post-dates the inception of the fund’s class A shares.
† Over the 1-year, 3-year, 5-year, 10-year, and life-of-fund periods ended 11/30/20, there were 509, 461, 393, 280, and 14 funds, respectively, in this Lipper category.
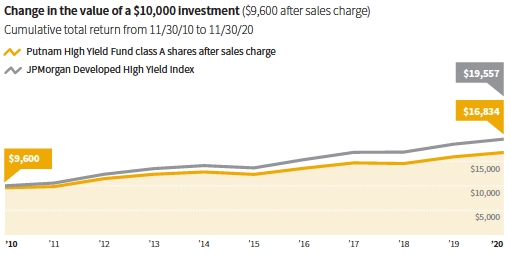
Past performance does not indicate future results. At the end of the same time period, a $10,000 investment in the fund’s class B and C shares would have been valued at $16,482 and $16,296, respectively, and no contingent deferred sales charges would apply. A $10,000 investment in the fund’s class M shares ($9,675 after sales charge) would have been valued at $16,556. A $10,000 investment in the fund’s class R, R6, and Y shares would have been valued at $17,113, $17,951, and $17,990, respectively.
Fund price and distribution information For the 12-month period ended 11/30/20
| | | | | | | | | |
| Distributions | Class A | Class B | Class C | Class M | Class R | Class R6 | Class Y |
| Number | 12 | 12 | 12 | 12 | 12 | 12 | 12 |
| Income | $0.273 | $0.232 | $0.233 | $0.261 | $0.260 | $0.297 | $0.285 |
| Capital gains | — | — | — | — | — | — | — |
| Total | $0.273 | $0.232 | $0.233 | $0.261 | $0.260 | $0.297 | $0.285 |
| | Before | After | Net | Net | Before | After | Net | Net | Net |
| | sales | sales | asset | asset | sales | sales | asset | asset | asset |
| Share value | charge | charge | value | value | charge | charge | value | value | value |
| 11/30/19 | $5.82 | $6.06 | $5.65 | $5.62 | $5.79 | $5.98 | $5.79 | $6.14 | $6.15 |
| 11/30/20 | 5.85 | 6.09 | 5.68 | 5.65 | 5.82 | 6.02 | 5.82 | 6.19 | 6.21 |
| | Before | After | Net | Net | Before | After | Net | Net | Net |
| Current rate | sales | sales | asset | asset | sales | sales | asset | asset | asset |
| (end of period) | charge | charge | value | value | charge | charge | value | value | value |
| Current dividend | | | | | | | | | |
| rate1 | 4.31% | 4.14% | 3.59% | 3.82% | 4.12% | 3.99% | 4.12% | 4.46% | 4.25% |
| Current 30-day | | | | | | | | | |
| SEC yield2 | N/A | 3.12 | 2.51 | 2.51 | N/A | 2.90 | 3.00 | 3.59 | 3.48 |
The classification of distributions, if any, is an estimate. Before-sales-charge share value and current dividend rate for class A and M shares, if applicable, do not take into account any sales charge levied at the time of purchase. After-sales-charge share value, current dividend rate, and current 30-day SEC yield, if applicable, are calculated assuming that the maximum sales charge (4.00% for class A shares and 3.25% for class M shares) was levied at the time of purchase. Final distribution information will appear on your year-end tax forms.
1 Most recent distribution, including any return of capital and excluding capital gains, annualized and divided by share price before or after sales charge at period-end.
2 Based only on investment income and calculated using the maximum offering price for each share class, in accordance with SEC guidelines.
Fund performance as of most recent calendar quarter Total return for periods ended 12/31/20
| | | | | | | | |
| | Annual | | | | | | | |
| | average | | Annual | | Annual | | Annual | |
| | (life of fund) | 10 years | average | 5 years | average | 3 years | average | 1 year |
| Class A (3/25/86) | | | | | | | | |
| Before sales charge | 7.18% | 74.41% | 5.72% | 42.65% | 7.36% | 15.78% | 5.01% | 5.50% |
| After sales charge | 7.05 | 67.43 | 5.29 | 36.94 | 6.49 | 11.15 | 3.59 | 1.28 |
| Class B (5/16/94) | | | | | | | | |
| Before CDSC | 6.96 | 64.32 | 5.09 | 37.42 | 6.56 | 13.26 | 4.24 | 4.70 |
| After CDSC | 6.96 | 64.32 | 5.09 | 35.42 | 6.25 | 10.27 | 3.31 | –0.30 |
| Class C (3/30/07) | | | | | | | | |
| Before CDSC | 6.95 | 61.82 | 4.93 | 37.25 | 6.54 | 13.17 | 4.21 | 4.72 |
| After CDSC | 6.95 | 61.82 | 4.93 | 37.25 | 6.54 | 13.17 | 4.21 | 3.72 |
| Class M (12/1/94) | | | | | | | | |
| Before sales charge | 6.89 | 70.21 | 5.46 | 40.82 | 7.09 | 14.93 | 4.75 | 5.31 |
| After sales charge | 6.79 | 64.68 | 5.11 | 36.25 | 6.38 | 11.20 | 3.60 | 1.88 |
| Class R (3/30/07) | | | | | | | | |
| Net asset value | 6.92 | 70.22 | 5.46 | 40.83 | 7.09 | 15.12 | 4.80 | 5.31 |
| Class R6 (5/22/18) | | | | | | | | |
| Net asset value | 7.37 | 78.53 | 5.97 | 44.17 | 7.59 | 16.47 | 5.21 | 5.97 |
| Class Y (12/31/98) | | | | | | | | |
| Net asset value | 7.38 | 78.88 | 5.99 | 44.45 | 7.63 | 16.70 | 5.28 | 5.91 |
See the discussion following the fund performance table on page 10 for information about the calculation of fund performance.
Your fund’s expenses
As a mutual fund investor, you pay ongoing expenses, such as management fees, distribution fees (12b-1 fees), and other expenses. Using the following information, you can estimate how these expenses affect your investment and compare them with the expenses of other funds. You may also pay one-time transaction expenses, including sales charges (loads) and redemption fees, which are not shown in this section and would have resulted in higher total expenses. For more information, see your fund’s prospectus or talk to your financial representative.
Expense ratios
| | | | | | | |
| | Class A | Class B | Class C | Class M | Class R | Class R6 | Class Y |
| Total annual operating expenses for the | | | | | | | |
| fiscal year ended 11/30/19 | 1.02% | 1.77% | 1.77% | 1.27% | 1.27% | 0.66% | 0.77% |
| Annualized expense ratio for the | | | | | | | |
| six-month period ended 11/30/20 * | 1.03% | 1.78% | 1.78% | 1.28% | 1.28% | 0.67% | 0.78% |
Fiscal year expense information in this table is taken from the most recent prospectus, is subject to change, and may differ from that shown for the annualized expense ratio and in the financial highlights of this report.
Expenses are shown as a percentage of average net assets.
* Expense ratios for each class are for the fund’s most recent fiscal half year. As a result of this, ratios may differ from expense ratios based on one-year data in the financial highlights.
Expenses per $1,000
The following table shows the expenses you would have paid on a $1,000 investment in each class of the fund from 6/1/20 to 11/30/20. It also shows how much a $1,000 investment would be worth at the close of the period, assuming actual returns and expenses.
| | | | | | | |
| | Class A | Class B | Class C | Class M | Class R | Class R6 | Class Y |
| Expenses paid per $1,000*† | $5.39 | $9.30 | $9.31 | $6.70 | $6.70 | $3.51 | $4.09 |
| Ending value (after expenses) | $1,094.00 | $1,090.80 | $1,091.50 | $1,093.30 | $1,093.40 | $1,096.30 | $1,096.80 |
* Expenses for each share class are calculated using the fund’s annualized expense ratio for each class, which represents the ongoing expenses as a percentage of average net assets for the six months ended 11/30/20. The expense ratio may differ for each share class.
† Expenses are calculated by multiplying the expense ratio by the average account value for the period; then multiplying the result by the number of days in the period; and then dividing that result by the number of days in the year.
Estimate the expenses you paid
To estimate the ongoing expenses you paid for the six months ended 11/30/20, use the following calculation method. To find the value of your investment on 6/1/20, call Putnam at 1-800-225-1581.

Compare expenses using the SEC’s method
The Securities and Exchange Commission (SEC) has established guidelines to help investors assess fund expenses. Per these guidelines, the following table shows your fund’s expenses based on a $1,000 investment, assuming a hypothetical 5% annualized return. You can use this information to compare the ongoing expenses (but not transaction expenses or total costs) of investing in the fund with those of other funds. All mutual fund shareholder reports will provide this information to help you make this comparison. Please note that you cannot use this information to estimate your actual ending account balance and expenses paid during the period.
| | | | | | | |
| | Class A | Class B | Class C | Class M | Class R | Class R6 | Class Y |
| Expenses paid per $1,000*† | $5.20 | $8.97 | $8.97 | $6.46 | $6.46 | $3.39 | $3.94 |
| Ending value (after expenses) | $1,019.85 | $1,016.10 | $1,016.10 | $1,018.60 | $1,018.60 | $1,021.65 | $1,021.10 |
* Expenses for each share class are calculated using the fund’s annualized expense ratio for each class, which represents the ongoing expenses as a percentage of average net assets for the six months ended 11/30/20. The expense ratio may differ for each share class.
† Expenses are calculated by multiplying the expense ratio by the average account value for the six-month period; then multiplying the result by the number of days in the six-month period; and then dividing that result by the number of days in the year.
Consider these risks before investing
The value of investments in the fund’s portfolio may fall or fail to rise over extended periods of time for a variety of reasons, including general economic, political, or financial market conditions; investor sentiment and market perceptions; government actions; geopolitical events or changes; and factors related to a specific issuer, geography, industry, or sector. These and other factors may lead to increased volatility and reduced liquidity in the fund’s portfolio holdings. Lower-rated bonds may offer higher yields in return for more risk. Bond investments are subject to interest-rate risk (the risk of bond prices falling if interest rates rise) and credit risk (the risk of an issuer defaulting on interest or principal payments). Interest-rate risk is generally greater for longer-term bonds, and credit risk is generally greater for below-investment-grade bonds (a significant part of the fund’s investments). Risks associated with derivatives include increased investment exposure (which may be considered leverage) and, in the case of over-the-counter instruments, the potential inability to terminate or sell derivatives positions and the potential failure of the other party to the instrument to meet its obligations. Unlike bonds, funds that invest in bonds have fees and expenses. Our investment techniques, analyses, and judgments may not produce the outcome we intend. The investments we select for the fund may not perform as well as other securities that we do not select for the fund. We, or the fund’s other service providers, may experience disruptions or operating errors that could have a negative effect on the fund. You can lose money by investing in the fund.
Terms and definitions
Important terms
Total return shows how the value of the fund’s shares changed over time, assuming you held the shares through the entire period and reinvested all distributions in the fund.
Before sales charge, or net asset value, is the price, or value, of one share of a mutual fund, without a sales charge. Before-sales-charge figures fluctuate with market conditions, and are calculated by dividing the net assets of each class of shares by the number of outstanding shares in the class.
After sales charge is the price of a mutual fund share plus the maximum sales charge levied at the time of purchase. After-sales-charge performance figures shown here assume the 4.00% maximum sales charge for class A shares and 3.25% for class M shares.
Contingent deferred sales charge (CDSC) is generally a charge applied at the time of the redemption of class B or C shares and assumes redemption at the end of the period. Your fund’s class B CDSC declines over time from a 5% maximum during the first year to 1% during the sixth year. After the sixth year, the CDSC no longer applies. The CDSC for class C shares is 1% for one year after purchase.
Share classes
Class A shares are generally subject to an initial sales charge and no CDSC (except on certain redemptions of shares bought without an initial sales charge).
Class B shares are closed to new investments and are only available by exchange from another Putnam fund or through dividend and/or capital gains reinvestment. They are not subject to an initial sales charge and may be subject to a CDSC.
Class C shares are not subject to an initial sales charge and are subject to a CDSC only if the shares are redeemed during the first year.
Class M shares have a lower initial sales charge and a higher 12b-1 fee than class A shares and no CDSC. Class M shares (excluding those purchased from Japanese distributors) converted automatically to class A shares on November 25, 2019, and, beginning on November 25, 2019, Class M shares are available for purchase only by individuals purchasing from Japanese distributors.
Class R shares are not subject to an initial sales charge or CDSC and are only available to employer-sponsored retirement plans.
Class R6 shares are not subject to an initial sales charge or CDSC and carry no 12b-1 fee. They are generally only available to employer-sponsored retirement plans, corporate and institutional clients, and clients in other approved programs.
Class Y shares are not subject to an initial sales charge or CDSC and carry no 12b-1 fee. They are generally only available to corporate and institutional clients and clients in other approved programs.
Fixed-income terms
Current rate is the annual rate of return earned from dividends or interest of an investment. Current rate is expressed as a percentage of the price of a security, fund share, or principal investment.
Yield curve is a graph that plots the yields of bonds with equal credit quality against their differing maturity dates, ranging from shortest to longest. It is used as a benchmark for other debt, such as mortgage or bank lending rates.
Comparative indexes
Bloomberg Barclays U.S. Aggregate Bond Index is an unmanaged index of U.S. investment-grade fixed-income securities.
ICE BofA (Intercontinental Exchange Bank of America) U.S. 3-Month Treasury Bill Index is
an unmanaged index that seeks to measure the performance of U.S. Treasury bills available in the marketplace.
JPMorgan Developed High Yield Index is an unmanaged index of high-yield fixed-income securities issued in developed countries.
S&P 500 Index is an unmanaged index of common stock performance.
Indexes assume reinvestment of all distributions and do not account for fees. Securities and performance of a fund and an index will differ. You cannot invest directly in an index.
ICE Data Indices, LLC (“ICE BofA”), used with permission. ICE BofA permits use of the ICE BofA indices and related data on an “as is” basis; makes no warranties regarding same; does not guarantee the suitability, quality, accuracy, timeliness, and/or completeness of the ICE BofA indices or any data included in, related to, or derived therefrom; assumes no liability in connection with the use of the foregoing; and does not sponsor, endorse, or recommend Putnam Investments, or any of its products or services.
Lipper, a Refinitiv company, is a third-party industry-ranking entity that ranks mutual funds. Its rankings do not reflect sales charges. Lipper rankings are based on total return at net asset value relative to other funds that have similar current investment styles or objectives as determined by Lipper. Lipper may change a fund’s category assignment at its discretion. Lipper category averages reflect performance trends for funds within a category.
Other information for shareholders
Proxy voting
Putnam is committed to managing our mutual funds in the best interests of our shareholders. The Putnam funds’ proxy voting guidelines and procedures, as well as information regarding how your fund voted proxies relating to portfolio securities during the 12-month period ended June 30, 2020, are available in the Individual Investors section of putnam.com and on the Securities and Exchange Commission (SEC) website, www.sec.gov. If you have questions about finding forms on the SEC’s website, you may call the SEC at 1-800-SEC-0330. You may also obtain the Putnam funds’ proxy voting guidelines and procedures at no charge by calling Putnam’s Shareholder Services at 1-800-225-1581.
Fund portfolio holdings
The fund will file a complete schedule of its portfolio holdings with the SEC for the first and third quarters of each fiscal year on Form N-PORT within 60 days of the end of such fiscal quarter. Shareholders may obtain the fund’s Form N-PORT on the SEC’s website at www.sec.gov.
Prior to its use of Form N-PORT, the fund filed its complete schedule of its portfolio holdings with the SEC on Form N-Q, which is available online at www.sec.gov.
Trustee and employee fund ownership
Putnam employees and members of the Board of Trustees place their faith, confidence, and, most importantly, investment dollars in Putnam mutual funds. As of November 30, 2020, Putnam employees had approximately $525,000,000 and the Trustees had approximately $81,000,000 invested in Putnam mutual funds. These amounts include investments by the Trustees’ and employees’ immediate family members as well as investments through retirement and deferred compensation plans.
Important notice regarding Putnam’s privacy policy
In order to conduct business with our shareholders, we must obtain certain personal information such as account holders’ names, addresses, Social Security numbers, and dates of birth. Using this information, we are able to maintain accurate records of accounts and transactions.
It is our policy to protect the confidentiality of our shareholder information, whether or not a shareholder currently owns shares of our funds. In particular, it is our policy not to sell information about you or your accounts to outside marketing firms. We have safeguards in place designed to prevent unauthorized access to our computer systems and procedures to protect personal information from unauthorized use.
Under certain circumstances, we must share account information with outside vendors who provide services to us, such as mailings and proxy solicitations. In these cases, the service providers enter into confidentiality agreements with us, and we provide only the information necessary to process transactions and perform other services related to your account. Finally, it is our policy to share account information with your financial representative, if you’ve listed one on your Putnam account.
Trustee approval of management contract
General conclusions
The Board of Trustees of The Putnam Funds oversees the management of each fund and, as required by law, determines annually whether to approve the continuance of your fund’s management contract with Putnam Investment Management, LLC (“Putnam Management”) and the sub-management contract with respect to your fund between Putnam Management and its affiliate, Putnam Investments Limited (“PIL”). The Board, with the assistance of its Contract Committee, requests and evaluates all information it deems reasonably necessary under the circumstances in connection with its annual contract review. The Contract Committee consists solely of Trustees who are not “interested persons” (as this term is defined in the Investment Company Act of 1940, as amended (the “1940 Act”)) of The Putnam Funds (“Independent Trustees”).
At the outset of the review process, members of the Board’s independent staff and independent legal counsel considered any possible changes to the annual contract review materials furnished to the Contract Committee during the course of the previous year’s review and, as applicable, identified those changes to Putnam Management. Following these discussions and in consultation with the Contract Committee, the Independent Trustees’ independent legal counsel requested that Putnam Management and its affiliates furnish specified information, together with any additional information that Putnam Management considered relevant, to the Contract Committee. Over the course of several months ending in June 2020, the Contract Committee met on a number of occasions with representatives of Putnam Management, and separately in executive session, to consider the information that Putnam Management provided. Throughout this process, the Contract Committee was assisted by the members of the Board’s independent staff and by independent legal counsel for The Putnam Funds and the Independent Trustees.
In May 2020, the Contract Committee met in executive session to discuss and consider its recommendations with respect to the continuance of the contracts. At the Trustees’ June 2020 meeting, the Contract Committee met in executive session with the other Independent Trustees to review a summary of the key financial, performance and other data that the Contract Committee considered in the course of its review. The Contract Committee then presented its written report, which summarized the key factors that the Committee had considered and set forth its recommendations. The Contract Committee recommended, and the Independent Trustees approved, the continuance of your fund’s management and sub-management contracts, effective July 1, 2020. (Because PIL is an affiliate of Putnam Management and Putnam Management remains fully responsible for all services provided by PIL, the Trustees have not attempted to evaluate PIL as a separate entity, and all subsequent references to Putnam Management below should be deemed to include reference to PIL as necessary or appropriate in the context.)
The Independent Trustees’ approval was based on the following conclusions:
• That the fee schedule in effect for your fund represented reasonable compensation in light of the nature and quality of the services being provided to the fund, the fees paid by competitive funds, the costs incurred by Putnam Management in providing services to the fund, and the application of certain reductions and waivers noted below; and
• That the fee schedule in effect for your fund represented an appropriate sharing between fund shareholders and Putnam Management of such economies of scale as may exist in the management of the fund at current asset levels.
These conclusions were based on a comprehensive consideration of all information provided to the Trustees and were not the result of any single factor. Some of the factors that figured particularly in the Trustees’ deliberations and how the Trustees considered these factors are described below, although individual Trustees may have evaluated the information presented differently, giving different weights to various factors. It is also important to recognize that the management arrangements for your fund and the other Putnam funds are the result of many years of review and discussion between the Independent Trustees and Putnam Management, that some aspects of the arrangements may receive greater scrutiny in some years than others, and that the Trustees’ conclusions may be based, in part, on their consideration of fee arrangements in previous years. For example, with certain exceptions primarily involving newly
launched or repositioned funds, the current fee arrangements under the vast majority of the funds’ management contracts were first implemented at the beginning of 2010 following extensive review by the Contract Committee and discussions with representatives of Putnam Management, as well as approval by shareholders.
Management fee schedules and total expenses
The Trustees reviewed the management fee schedules in effect for all Putnam funds, including fee levels and breakpoints. The Trustees also reviewed the total expenses of each Putnam fund, recognizing that in most cases management fees represented the major, but not the sole, determinant of total costs to fund shareholders. (Two funds have implemented so-called “all-in” management fees covering substantially all routine fund operating costs.)
In reviewing fees and expenses, the Trustees generally focus their attention on material changes in circumstances — for example, changes in assets under management, changes in a fund’s investment strategy, changes in Putnam Management’s operating costs or profitability, or changes in competitive practices in the mutual fund industry — that suggest that consideration of fee changes might be warranted. The Trustees concluded that the circumstances did not indicate that changes to the management fee schedule for your fund would be appropriate at this time.
Under its management contract, your fund has the benefit of breakpoints in its management fee schedule that provide shareholders with economies of scale in the form of reduced fee levels as assets under management in the Putnam family of funds increase. The Trustees concluded that the fee schedule in effect for your fund represented an appropriate sharing of economies of scale between fund shareholders and Putnam Management.
As in the past, the Trustees also focused on the competitiveness of each fund’s total expense ratio. In order to support the effort to have fund expenses meet competitive standards, the Trustees and Putnam Management and the funds’ investor servicing agent, Putnam Investor Services, Inc. (“PSERV”), have implemented expense limitations that were in effect during your fund’s fiscal year ending in 2019. These expense limitations were: (i) a contractual expense limitation applicable to specified open-end funds, including your fund, of 25 basis points on investor servicing fees and expenses and (ii) a contractual expense limitation applicable to specified open-end funds, including your fund, of 20 basis points on so-called “other expenses” (i.e., all expenses exclusive of management fees, distribution fees, investor servicing fees, investment-related expenses, interest, taxes, brokerage commissions, acquired fund fees and expenses and extraordinary expenses). These expense limitations attempt to maintain competitive expense levels for the funds. Most funds, including your fund, had sufficiently low expenses that these expense limitations were not operative during their fiscal years ending in 2019. Putnam Management and PSERV have agreed to maintain these expense limitations until at least March 30, 2022. The support of Putnam Management and PSERV for these expense limitation arrangements was an important factor in the Trustees’ decision to approve the continuance of your fund’s management and sub-management contracts.
The Trustees reviewed comparative fee and expense information for a custom group of competitive funds selected by Broadridge Financial Solutions, Inc. (“Broadridge”). This comparative information included your fund’s percentile ranking for effective management fees and total expenses (excluding any applicable 12b-1 fees), which provides a general indication of your fund’s relative standing. In the custom peer group, your fund ranked in the third quintile in effective management fees (determined for your fund and the other funds in the custom peer group based on fund asset size and the applicable contractual management fee schedule) and in the third quintile in total expenses (excluding any applicable 12b-1 fees) as of December 31, 2019. The first quintile represents the least expensive funds and the fifth quintile the most expensive funds. The fee and expense data reported by Broadridge as of December 31, 2019 reflected the most recent fiscal year-end data available in Broadridge’s database at that time.
In connection with their review of fund management fees and total expenses, the Trustees also reviewed the costs of the services provided and the profits realized by Putnam Management and its affiliates from their contractual relationships with the funds. This information included trends in revenues, expenses and profitability of Putnam Management and its affiliates relating to the investment management, investor servicing and distribution services provided to the funds. In
this regard, the Trustees also reviewed an analysis of the revenues, expenses and profitability of Putnam Management and its affiliates, allocated on a fund-by-fund basis, with respect to the funds’ management, distribution, and investor servicing contracts. For each fund, the analysis presented information about revenues, expenses and profitability for each of the agreements separately and for the agreements taken together on a combined basis. The Trustees concluded that, at current asset levels, the fee schedules in place represented reasonable compensation for the services being provided and represented an appropriate sharing between fund shareholders and Putnam Management of such economies of scale as may exist in the management of the Putnam funds at that time.
The information examined by the Trustees in connection with their annual contract review for the Putnam funds included information regarding services provided and fees charged by Putnam Management and its affiliates to other clients, including defined benefit pension and profit-sharing plans, sub-advised mutual funds, private funds sponsored by affiliates of Putnam Management, and model-only separately managed accounts. This information included, in cases where a product’s investment strategy corresponds with a fund’s strategy, comparisons of those fees with fees charged to the Putnam funds, as well as an assessment of the differences in the services provided to these clients as compared to the services provided to the Putnam funds. The Trustees observed that the differences in fee rates between these clients and the Putnam funds are by no means uniform when examined by individual asset sectors, suggesting that differences in the pricing of investment management services to these types of clients may reflect, among other things, historical competitive forces operating in separate marketplaces. The Trustees considered the fact that in many cases fee rates across different asset classes are higher on average for mutual funds than for other clients, and the Trustees also considered the differences between the services that Putnam Management provides to the Putnam funds and those that it provides to its other clients. The Trustees did not rely on these comparisons to any significant extent in concluding that the management fees paid by your fund are reasonable.
Investment performance
The quality of the investment process provided by Putnam Management represented a major factor in the Trustees’ evaluation of the quality of services provided by Putnam Management under your fund’s management contract. The Trustees were assisted in their review of Putnam Management’s investment process and performance by the work of the investment oversight committees of the Trustees and the full Board of Trustees, which meet on a regular basis with individual portfolio managers and with senior management of Putnam Management’s Investment Division throughout the year. The Trustees concluded that Putnam Management generally provides a high-quality investment process — based on the experience and skills of the individuals assigned to the management of fund portfolios, the resources made available to them, and in general Putnam Management’s ability to attract and retain high-quality personnel — but also recognized that this does not guarantee favorable investment results for every fund in every time period.
The Trustees considered that, in the aggregate, 2019 was a strong year of performance for The Putnam Funds, with the Putnam funds, on an asset-weighted basis, ranking in the top quartile of their Lipper Inc. (“Lipper”) peers for the year ended December 31, 2019. For those funds that are evaluated based on their total returns versus selected investment benchmarks, the Trustees observed that the funds, on an asset-weighted-basis, delivered a gross return that was 2.3% ahead of their benchmarks in 2019. In addition to the performance of the individual Putnam funds, the Trustees considered, as they had in prior years, the performance of The Putnam Fund complex versus competitor fund complexes. In this regard, the Trustees observed that The Putnam Funds’ relative performance, as reported in the Barron’s/Lipper Fund Families survey, was exceptionally strong over both the short and long term, with The Putnam Funds ranking as the 8th best performing mutual fund complex out of 55 complexes for the one-year period ended December 31, 2019 and the 8th best performing mutual fund complex out of 45 complexes for the ten-year period, with 2019 marking the third consecutive year that The Putnam Funds have ranked in the top ten fund complexes for the ten-year period. The Trustees also noted that The Putnam Funds ranked 26th out of 52 complexes for the five-year period ended December 31, 2019. In addition to the Barron’s/Lipper Fund Families
Survey, the Trustees also considered the funds’ ratings assigned by Morningstar Inc., noting that 22 of the funds were four- or five-star rated at the end of 2019 and that this included five funds that had achieved a five-star rating. They also noted, however, the disappointing investment performance of some funds for periods ended December 31, 2019 and considered information provided by Putnam Management regarding the factors contributing to the underperformance and actions being taken to improve the performance of these particular funds. The Trustees indicated their intention to continue to monitor closely the performance of those funds, including the effectiveness of any efforts Putnam Management has undertaken to address underperformance and whether additional actions to address areas of underperformance are warranted.
For purposes of the Trustees’ evaluation of the Putnam funds’ investment performance, the Trustees generally focus on a competitive industry ranking of each fund’s total net return over a one-year, three-year and five-year period. For a number of Putnam funds with relatively unique investment mandates for which Putnam Management informed the Trustees that meaningful competitive performance rankings are not considered to be available, the Trustees evaluated performance based on their total gross and net returns and comparisons of those returns with the returns of selected investment benchmarks. In the case of your fund, the Trustees considered that its class A share cumulative total return performance at net asset value was in the following quartiles of its Lipper peer group (Lipper High Yield Funds) for the one-year, three-year and five-year periods ended December 31, 2019 (the first quartile representing the best-performing funds and the fourth quartile the worst-performing funds):
| |
| One-year period | 2nd |
| Three-year period | 3rd |
| Five-year period | 3rd |
Over the one-year, three-year and five-year periods ended December 31, 2019, there were 500, 418 and 376 funds, respectively, in your fund’s Lipper peer group. (When considering performance information, shareholders should be mindful that past performance is not a guarantee of future results.) The Trustees considered Putnam Management’s continued efforts to support fund performance through initiatives including structuring compensation for portfolio managers and research analysts to enhance accountability for fund performance, emphasizing accountability in the portfolio management process, and affirming its commitment to a fundamental-driven approach to investing. The Trustees noted further that Putnam Management had made selective hires and internal promotions in 2019 to strengthen its investment team.
Brokerage and soft-dollar allocations; investor servicing
The Trustees considered various potential benefits that Putnam Management may receive in connection with the services it provides under the management contract with your fund. These include benefits related to brokerage allocation and the use of soft dollars, whereby a portion of the commissions paid by a fund for brokerage may be used to acquire research services that are expected to be useful to Putnam Management in managing the assets of the fund and of other clients. Subject to policies established by the Trustees, soft dollars generated by these means are used predominantly to acquire brokerage and research services (including third-party research and market data) that enhance Putnam Management’s investment capabilities and supplement Putnam Management’s internal research efforts. The Trustees noted that, in 2019, they had approved the elimination of a fund expense recapture program, whereby a portion of available soft dollars were used to pay fund expenses, and that the amount of commissions allocated to that program were instead used to increase, by a corresponding amount, the budget allocated for execution services. The Trustees indicated their continued intent to monitor regulatory and industry developments in this area with the assistance of their Brokerage Committee. In addition, with the assistance of their Brokerage Committee, the Trustees indicated their continued intent to monitor the allocation of the Putnam funds’ brokerage in order to ensure that the principle of seeking best price and execution remains paramount in the portfolio trading process.
Putnam Management may also receive benefits from payments that the funds make to Putnam Management’s affiliates for investor or distribution services. In conjunction with the annual review of your fund’s management and sub-management contracts, the Trustees reviewed your fund’s investor servicing agreement with PSERV and its distributor’s contracts and distribution plans with Putnam Retail Management Limited Partnership
(“PRM”), both of which are affiliates of Putnam Management. The Trustees concluded that the fees payable by the funds to PSERV and PRM, as applicable, for such services are fair and reasonable in relation to the nature and quality of such services, the fees paid by competitive funds, and the costs incurred by PSERV and PRM, as applicable, in providing such services. Furthermore, the Trustees were of the view that the services provided were required for the operation of the funds, and that they were of a quality at least equal to those provided by other providers.
Audited financial statements
These sections of the report, as well as the accompanying Notes, preceded by the Report of Independent Registered Public Accounting Firm, constitute the fund’s audited financial statements.
The fund’s portfolio lists all the fund’s investments and their values as of the last day of the reporting period. Holdings are organized by asset type and industry sector, country, or state to show areas of concentration and diversification.
Statement of assets and liabilities shows how the fund’s net assets and share price are determined. All investment and non-investment assets are added together. Any unpaid expenses and other liabilities are subtracted from this total. The result is divided by the number of shares to determine the net asset value per share, which is calculated separately for each class of shares. (For funds with preferred shares, the amount subtracted from total assets includes the liquidation preference of preferred shares.)
Statement of operations shows the fund’s net investment gain or loss. This is done by first adding up all the fund’s earnings — from dividends and interest income — and subtracting its operating expenses to determine net investment income (or loss). Then, any net gain or loss the fund realized on the sales of its holdings — as well as any unrealized gains or losses over the period — is added to or subtracted from the net investment result to determine the fund’s net gain or loss for the fiscal year.
Statement of changes in net assets shows how the fund’s net assets were affected by the fund’s net investment gain or loss, by distributions to shareholders, and by changes in the number of the fund’s shares. It lists distributions and their sources (net investment income or realized capital gains) over the current reporting period and the most recent fiscal year-end. The distributions listed here may not match the sources listed in the Statement of operations because the distributions are determined on a tax basis and may be paid in a different period from the one in which they were earned.
Financial highlights provide an overview of the fund’s investment results, per-share distributions, expense ratios, net investment income ratios, and portfolio turnover in one summary table, reflecting the five most recent reporting periods. In a semian-nual report, the highlights table also includes the current reporting period.
Report of Independent Registered Public Accounting Firm
To the Board of Trustees and Shareholders of
Putnam High Yield Fund:
Opinion on the Financial Statements
We have audited the accompanying statement of assets and liabilities, including the fund’s portfolio, of Putnam High Yield Fund (the “Fund”) as of November 30, 2020, the related statement of operations and changes in net assets for the year ended November 30, 2020, including the related notes, and the financial highlights for the year ended November 30, 2020 (collectively referred to as the “financial statements”). In our opinion, the financial statements present fairly, in all material respects, the financial position of the Fund as of November 30, 2020, the results of its operations, changes in its net assets and the financial highlights for the year ended November 30, 2020 in conformity with accounting principles generally accepted in the United States of America.
The financial statements of the Fund as of and for the year ended November 30, 2019 and the financial highlights for each of the periods ended on or prior to November 30, 2019 (not presented herein, other than the statement of changes in net assets and the financial highlights) were audited by other auditors whose report dated January 10, 2020 expressed an unqualified opinion on those financial statements and financial highlights.
Basis for Opinion
These financial statements are the responsibility of the Fund’s management. Our responsibility is to express an opinion on the Fund’s financial statements based on our audit. We are a public accounting firm registered with the Public Company Accounting Oversight Board (United States) (“PCAOB”) and are required to be independent with respect to the Fund in accordance with the U.S. federal securities laws and the applicable rules and regulations of the Securities and Exchange Commission and the PCAOB.
We conducted our audit of these financial statements in accordance with the standards of the PCAOB. Those standards require that we plan and perform the audit to obtain reasonable assurance about whether the financial statements are free of material misstatement, whether due to error or fraud.
Our audit included performing procedures to assess the risks of material misstatement of the financial statements, whether due to error or fraud, and performing procedures that respond to those risks. Such procedures included examining, on a test basis, evidence regarding the amounts and disclosures in the financial statements. Our audit also included evaluating the accounting principles used and significant estimates made by management, as well as evaluating the overall presentation of the financial statements. Our procedures included confirmation of securities owned as of November 30, 2020 by correspondence with the custodian, transfer agent, agent banks and brokers; when replies were not received from brokers, we performed other auditing procedures. We believe that our audit provides a reasonable basis for our opinion.
PricewaterhouseCoopers LLP
Boston, Massachusetts
January 13, 2021
We have served as the auditor of one or more investment companies in the Putnam Investments family of mutual funds since at least 1957. We have not been able to determine the specific year we began serving as auditor.
The fund’s portfolio 11/30/20 (Unaudited)
| | |
| | Principal | |
| CORPORATE BONDS AND NOTES (84.6%)* | amount | Value |
| Advertising and marketing services (0.7%) | | |
| Clear Channel Outdoor Holdings, Inc. 144A company guaranty sr. | | |
| notes 5.125%, 8/15/27 | $1,500,000 | $1,515,000 |
| Clear Channel Worldwide Holdings, Inc. company guaranty sr. | | |
| unsec. notes 9.25%, 2/15/24 | 1,374,000 | 1,372,283 |
| Outfront Media Capital, LLC/Outfront Media Capital Corp. 144A sr. | | |
| unsec. bonds 4.625%, 3/15/30 | 671,000 | 664,290 |
| Terrier Media Buyer, Inc. 144A company guaranty sr. unsec. notes | | |
| 8.875%, 12/15/27 | 4,540,000 | 4,903,200 |
| | | 8,454,773 |
| Automotive (1.2%) | | |
| Ford Motor Co. sr. unsec. unsub. notes 9.00%, 4/22/25 | 3,094,000 | 3,759,922 |
| Ford Motor Credit Co., LLC sr. unsec. unsub. notes 5.125%, 6/16/25 | 1,500,000 | 1,619,550 |
| Ford Motor Credit Co., LLC sr. unsec. unsub. notes 4.271%, 1/9/27 | 1,678,000 | 1,736,923 |
| Ford Motor Credit Co., LLC sr. unsec. unsub. notes 4.00%, 11/13/30 | 1,920,000 | 1,935,360 |
| General Motors Co. sr. unsec. notes 6.125%, 10/1/25 | 1,710,000 | 2,061,516 |
| Navistar International Corp. 144A sr. unsec. notes 6.625%, 11/1/25 | 772,000 | 808,052 |
| PM General Purchaser, LLC 144A sr. notes 9.50%, 10/1/28 | 3,175,000 | 3,460,750 |
| | | 15,382,073 |
| Basic materials (8.8%) | | |
| Allegheny Technologies, Inc. sr. unsec. sub. notes 5.875%, 12/1/27 | 220,000 | 228,800 |
| Allegheny Technologies, Inc. sr. unsec. unsub. notes | | |
| 7.875%, 8/15/23 | 2,482,000 | 2,674,355 |
| ArcelorMittal SA sr. unsec. unsub. notes 7.25%, 10/15/39 (France) | 2,810,000 | 3,702,175 |
| Atotech Alpha 2 BV 144A sr. unsec. notes 8.75%, 6/1/23 | | |
| (Netherlands) ‡‡ | 2,475,000 | 2,152,777 |
| Atotech Alpha 3 BV/Alpha US Bidco, Inc. 144A company guaranty | | |
| sr. unsec. notes 6.25%, 2/1/25 (Netherlands) | 2,265,000 | 2,307,469 |
| Axalta Coating Systems, LLC 144A company guaranty sr. unsec. | | |
| notes 3.375%, 2/15/29 | 2,335,000 | 2,355,315 |
| Axalta Coating Systems, LLC/Axalta Coating Systems Dutch | | |
| Holding B BV 144A company guaranty sr. unsec. notes | | |
| 4.75%, 6/15/27 | 1,325,000 | 1,397,875 |
| Beacon Roofing Supply, Inc. 144A company guaranty sr. notes | | |
| 4.50%, 11/15/26 | 1,312,000 | 1,366,120 |
| Beacon Roofing Supply, Inc. 144A company guaranty sr. unsec. | | |
| notes 4.875%, 11/1/25 | 2,568,000 | 2,602,668 |
| Big River Steel, LLC/BRS Finance Corp. 144A sr. notes | | |
| 6.625%, 1/31/29 | 2,245,000 | 2,379,700 |
| BMC East, LLC 144A company guaranty sr. notes 5.50%, 10/1/24 | 3,525,000 | 3,627,225 |
| Boise Cascade Co. 144A company guaranty sr. unsec. notes | | |
| 4.875%, 7/1/30 | 1,700,000 | 1,844,500 |
| Builders FirstSource, Inc. 144A sr. notes 6.75%, 6/1/27 | 1,853,000 | 1,991,975 |
| BWAY Holding Co. 144A sr. unsec. notes 7.25%, 4/15/25 | 2,145,000 | 2,152,937 |
| Cemex SAB de CV 144A company guaranty sr. notes 7.375%, | | |
| 6/5/27 (Mexico) | 1,000,000 | 1,122,200 |
| Cemex SAB de CV 144A company guaranty sr. notes 5.45%, | | |
| 11/19/29 (Mexico) | 1,605,000 | 1,756,673 |
| Cemex SAB de CV 144A company guaranty sr. sub. notes 5.70%, | | |
| 1/11/25 (Mexico) | 1,215,000 | 1,242,581 |
| | |
| | Principal | |
| CORPORATE BONDS AND NOTES (84.6%)* cont. | amount | Value |
| Basic materials cont. | | |
| CF Industries, Inc. company guaranty sr. unsec. bonds | | |
| 5.15%, 3/15/34 | $450,000 | $543,728 |
| CF Industries, Inc. company guaranty sr. unsec. bonds | | |
| 4.95%, 6/1/43 | 3,010,000 | 3,732,400 |
| CF Industries, Inc. company guaranty sr. unsec. notes | | |
| 3.45%, 6/1/23 | 491,000 | 515,776 |
| Clearwater Paper Corp. 144A company guaranty sr. unsec. notes | | |
| 4.75%, 8/15/28 | 1,025,000 | 1,067,281 |
| Compass Minerals International, Inc. 144A company guaranty sr. | | |
| unsec. notes 6.75%, 12/1/27 | 2,270,000 | 2,501,313 |
| Compass Minerals International, Inc. 144A company guaranty sr. | | |
| unsec. notes 4.875%, 7/15/24 | 1,237,000 | 1,278,749 |
| Constellium NV 144A company guaranty sr. unsec. notes 5.875%, | | |
| 2/15/26 (France) | 925,000 | 952,750 |
| Constellium NV 144A company guaranty sr. unsec. notes 5.75%, | | |
| 5/15/24 (France) | 1,104,000 | 1,126,080 |
| Constellium NV 144A sr. unsec. notes 6.625%, 3/1/25 (France) | 1,685,000 | 1,727,125 |
| Constellium SE 144A sr. unsec. notes 5.625%, 6/15/28 (France) | 1,150,000 | 1,236,250 |
| Core & Main LP 144A sr. unsec. notes 6.125%, 8/15/25 | 452,000 | 463,300 |
| CP Atlas Buyer, Inc. 144A sr. unsec. notes 7.00%, 12/1/28 | 505,000 | 522,675 |
| First Quantum Minerals, Ltd. 144A company guaranty sr. unsec. | | |
| notes 7.50%, 4/1/25 (Canada) | 1,935,000 | 2,009,981 |
| First Quantum Minerals, Ltd. 144A company guaranty sr. unsec. | | |
| notes 6.875%, 3/1/26 (Canada) | 1,345,000 | 1,389,553 |
| Freeport-McMoRan, Inc. company guaranty sr. unsec. bonds | | |
| 4.625%, 8/1/30 (Indonesia) | 1,135,000 | 1,257,013 |
| Freeport-McMoRan, Inc. company guaranty sr. unsec. notes | | |
| 4.375%, 8/1/28 (Indonesia) | 1,135,000 | 1,212,804 |
| Freeport-McMoRan, Inc. company guaranty sr. unsec. unsub. | | |
| notes 5.45%, 3/15/43 (Indonesia) | 1,111,000 | 1,383,923 |
| GCP Applied Technologies, Inc. 144A sr. unsec. notes | | |
| 5.50%, 4/15/26 | 1,874,000 | 1,920,850 |
| Graphic Packaging International, LLC 144A company guaranty sr. | | |
| unsec. notes 3.50%, 3/1/29 | 1,430,000 | 1,464,392 |
| Graphic Packaging International, LLC 144A sr. unsec. notes | | |
| 3.50%, 3/15/28 | 1,075,000 | 1,120,376 |
| Greif, Inc. 144A company guaranty sr. unsec. notes 6.50%, 3/1/27 | 2,050,000 | 2,167,875 |
| HudBay Minerals, Inc. 144A company guaranty sr. unsec. notes | | |
| 7.625%, 1/15/25 (Canada) | 2,610,000 | 2,720,925 |
| HudBay Minerals, Inc. 144A company guaranty sr. unsec. notes | | |
| 6.125%, 4/1/29 (Canada) | 555,000 | 596,792 |
| Huntsman International, LLC company guaranty sr. unsec. notes | | |
| 5.125%, 11/15/22 | 700,000 | 748,630 |
| Ingevity Corp. 144A company guaranty sr. unsec. notes | | |
| 3.875%, 11/1/28 | 1,790,000 | 1,816,850 |
| Intelligent Packaging, Ltd., Finco, Inc./Intelligent Packaging Ltd | | |
| Co-Issuer, LL 144A sr. notes 6.00%, 9/15/28 (Canada) | 1,880,000 | 1,998,393 |
| James Hardie International Finance DAC 144A sr. unsec. bonds | | |
| 5.00%, 1/15/28 (Ireland) | 2,260,000 | 2,389,950 |
| Louisiana-Pacific Corp. company guaranty sr. unsec. unsub. notes | | |
| 4.875%, 9/15/24 | 1,251,000 | 1,286,341 |
| | |
| | Principal | |
| CORPORATE BONDS AND NOTES (84.6%)* cont. | amount | Value |
| Basic materials cont. | | |
| Mauser Packaging Solutions Holding Co. 144A sr. notes | | |
| 8.50%, 4/15/24 | $730,000 | $766,500 |
| Mauser Packaging Solutions Holding Co. 144A sr. notes | | |
| 5.50%, 4/15/24 | 1,092,000 | 1,105,650 |
| Mercer International, Inc. sr. unsec. notes 7.375%, | | |
| 1/15/25 (Canada) | 331,000 | 342,171 |
| Mercer International, Inc. sr. unsec. notes 6.50%, 2/1/24 (Canada) | 1,275,000 | 1,290,938 |
| Mercer International, Inc. sr. unsec. notes 5.50%, 1/15/26 (Canada) | 1,636,000 | 1,640,090 |
| Novelis Corp. 144A company guaranty sr. unsec. bonds | | |
| 5.875%, 9/30/26 | 3,688,000 | 3,867,790 |
| Novelis Corp. 144A company guaranty sr. unsec. notes | | |
| 4.75%, 1/30/30 | 1,575,000 | 1,671,831 |
| Smurfit Kappa Treasury Funding DAC company guaranty sr. unsec. | | |
| unsub. notes 7.50%, 11/20/25 (Ireland) | 2,838,000 | 3,480,098 |
| Starfruit Finco BV/Starfruit US Holdco, LLC 144A sr. unsec. notes | | |
| 8.00%, 10/1/26 (Netherlands) | 3,375,000 | 3,611,250 |
| Syngenta Finance NV 144A company guaranty sr. unsec. unsub. | | |
| notes 5.182%, 4/24/28 (Switzerland) | 2,745,000 | 2,943,320 |
| TMS International Holding Corp. 144A sr. unsec. notes | | |
| 7.25%, 8/15/25 | 1,770,000 | 1,747,875 |
| TopBuild Corp. 144A company guaranty sr. unsec. notes | | |
| 5.625%, 5/1/26 | 1,733,000 | 1,791,489 |
| Tronox Finance PLC 144A company guaranty sr. unsec. notes | | |
| 5.75%, 10/1/25 (United Kingdom) | 1,704,000 | 1,761,510 |
| Tronox, Inc. 144A company guaranty sr. notes 6.50%, 5/1/25 | 355,000 | 378,182 |
| U.S. Concrete, Inc. 144A company guaranty sr. unsec. notes | | |
| 5.125%, 3/1/29 | 895,000 | 920,888 |
| Univar Solutions USA, Inc. 144A company guaranty sr. unsec. notes | | |
| 5.125%, 12/1/27 | 3,675,000 | 3,877,860 |
| W.R. Grace & Co.-Conn. 144A company guaranty sr. unsec. notes | | |
| 5.625%, 10/1/24 | 2,247,000 | 2,421,143 |
| W.R. Grace & Co.-Conn. 144A company guaranty sr. unsec. notes | | |
| 4.875%, 6/15/27 | 1,650,000 | 1,728,375 |
| | | 111,404,380 |
| Broadcasting (3.2%) | | |
| Diamond Sports Group, LLC/Diamond Sports Finance Co. 144A sr. | | |
| notes 5.375%, 8/15/26 | 4,059,000 | 3,145,725 |
| Diamond Sports Group, LLC/Diamond Sports Finance Co. 144A sr. | | |
| unsec. notes 6.625%, 8/15/27 | 4,527,000 | 2,596,008 |
| Entercom Media Corp. 144A company guaranty notes | | |
| 6.50%, 5/1/27 | 1,864,000 | 1,794,808 |
| Entercom Media Corp. 144A company guaranty sr. unsec. notes | | |
| 7.25%, 11/1/24 | 2,684,000 | 2,576,640 |
| Gray Television, Inc. 144A company guaranty sr. unsec. notes | | |
| 4.75%, 10/15/30 | 1,095,000 | 1,108,688 |
| Gray Television, Inc. 144A sr. unsec. notes 7.00%, 5/15/27 | 2,392,000 | 2,634,190 |
| iHeartCommunications, Inc. company guaranty sr. notes | | |
| 6.375%, 5/1/26 | 1,215,000 | 1,286,381 |
| iHeartCommunications, Inc. company guaranty sr. unsec. notes | | |
| 8.375%, 5/1/27 | 4,345,667 | 4,606,407 |
| Nexstar Broadcasting, Inc. 144A sr. unsec. notes 4.75%, 11/1/28 | 1,105,000 | 1,137,100 |
| | |
| | Principal | |
| CORPORATE BONDS AND NOTES (84.6%)* cont. | amount | Value |
| Broadcasting cont. | | |
| Nexstar Escrow, Inc. 144A sr. unsec. notes 5.625%, 7/15/27 | $3,330,000 | $3,550,613 |
| Sinclair Television Group, Inc. 144A company guaranty sr. unsec. | | |
| bonds 5.50%, 3/1/30 | 1,205,000 | 1,206,506 |
| Sinclair Television Group, Inc. 144A sr. bonds 4.125%, 12/1/30 | 1,145,000 | 1,146,431 |
| Sirius XM Radio, Inc. 144A sr. unsec. bonds 5.50%, 7/1/29 | 1,340,000 | 1,470,650 |
| Sirius XM Radio, Inc. 144A sr. unsec. bonds 5.00%, 8/1/27 | 3,293,000 | 3,465,883 |
| Townsquare Media, Inc. 144A company guaranty sr. unsec. notes | | |
| 6.50%, 4/1/23 | 3,529,000 | 3,423,130 |
| Univision Communications, Inc. 144A company guaranty sr. notes | | |
| 9.50%, 5/1/25 | 1,286,000 | 1,424,245 |
| Univision Communications, Inc. 144A company guaranty sr. notes | | |
| 6.625%, 6/1/27 | 2,400,000 | 2,562,000 |
| Univision Communications, Inc. 144A company guaranty sr. sub. | | |
| notes 5.125%, 2/15/25 | 813,000 | 818,081 |
| | | 39,953,486 |
| Building materials (1.5%) | | |
| American Builders & Contractors Supply Co., Inc. 144A company | | |
| guaranty sr. unsec. notes 5.875%, 5/15/26 | 711,000 | 740,329 |
| American Builders & Contractors Supply Co., Inc. 144A sr. notes | | |
| 4.00%, 1/15/28 | 2,395,000 | 2,484,813 |
| Cornerstone Building Brands, Inc. 144A company guaranty sr. | | |
| unsec. sub. notes 8.00%, 4/15/26 | 618,000 | 647,355 |
| JELD-WEN, Inc. 144A company guaranty sr. unsec. notes | | |
| 4.875%, 12/15/27 | 1,391,000 | 1,464,028 |
| JELD-WEN, Inc. 144A company guaranty sr. unsec. notes | | |
| 4.625%, 12/15/25 | 804,000 | 820,080 |
| JELD-WEN, Inc. 144A sr. notes 6.25%, 5/15/25 | 620,000 | 668,050 |
| Masonite International Corp. 144A company guaranty sr. unsec. | | |
| notes 5.375%, 2/1/28 | 860,000 | 915,143 |
| Standard Industries, Inc. 144A sr. unsec. bonds 3.375%, 1/15/31 | 3,017,000 | 3,028,314 |
| Standard Industries, Inc. 144A sr. unsec. notes 5.00%, 2/15/27 | 2,185,000 | 2,291,519 |
| Standard Industries, Inc. 144A sr. unsec. notes 4.75%, 1/15/28 | 230,000 | 242,363 |
| Werner FinCo LP/Werner FinCo, Inc. 144A company guaranty sr. | | |
| unsec. notes 8.75%, 7/15/25 | 3,395,000 | 3,310,125 |
| White Cap Buyer, LLC 144A sr. unsec. notes 6.875%, 10/15/28 | 1,620,000 | 1,723,575 |
| | | 18,335,694 |
| Capital goods (7.4%) | | |
| Adient Global Holdings, Ltd. 144A company guaranty sr. unsec. | | |
| notes 4.875%, 8/15/26 | 855,000 | 862,225 |
| Allison Transmission, Inc. 144A company guaranty sr. unsec. | | |
| bonds 3.75%, 1/30/31 | 2,330,000 | 2,350,388 |
| Allison Transmission, Inc. 144A company guaranty sr. unsec. notes | | |
| 4.75%, 10/1/27 | 1,736,000 | 1,836,688 |
| American Axle & Manufacturing, Inc. company guaranty sr. unsec. | | |
| notes 6.875%, 7/1/28 | 1,770,000 | 1,876,200 |
| Amsted Industries, Inc. 144A company guaranty sr. unsec. sub. | | |
| notes 5.625%, 7/1/27 | 630,000 | 668,588 |
| Amsted Industries, Inc. 144A sr. unsec. bonds 4.625%, 5/15/30 | 1,610,000 | 1,708,419 |
| ARD Finance SA 144A sr. notes Ser. REGS, 6.50%, 6/30/27 | | |
| (Luxembourg) ‡‡ | 3,980,000 | 4,193,925 |
| | |
| | Principal | |
| CORPORATE BONDS AND NOTES (84.6%)* cont. | amount | Value |
| Capital goods cont. | | |
| Ardagh Packaging Finance PLC/Ardagh Holdings USA, Inc. 144A | | |
| company guaranty sr. sub. notes 4.125%, 8/15/26 (Ireland) | $2,295,000 | $2,381,063 |
| Ardagh Packaging Finance PLC/Ardagh Holdings USA, Inc. 144A | | |
| company guaranty sr. unsec. notes 6.00%, 2/15/25 (Ireland) | 855,000 | 883,856 |
| Ardagh Packaging Finance PLC/Ardagh Holdings USA, Inc. 144A | | |
| company guaranty sr. unsec. notes 5.25%, 8/15/27 (Ireland) | 1,750,000 | 1,824,988 |
| Ardagh Packaging Finance PLC/Ardagh Holdings USA, Inc. 144A sr. | | |
| unsec. notes 5.25%, 8/15/27 (Ireland) | 400,000 | 417,140 |
| Berry Global, Inc. 144A company guaranty notes 5.625%, 7/15/27 | 1,090,000 | 1,160,850 |
| Berry Global, Inc. 144A notes 4.50%, 2/15/26 | 805,000 | 825,125 |
| Bombardier, Inc. 144A sr. unsec. notes 8.75%, 12/1/21 (Canada) | 325,000 | 333,109 |
| Bombardier, Inc. 144A sr. unsec. notes 7.875%, 4/15/27 (Canada) | 2,846,000 | 2,426,215 |
| Bombardier, Inc. 144A sr. unsec. notes 7.50%, 12/1/24 (Canada) | 615,000 | 550,659 |
| CANPACK SA/Eastern PA Land Investment Holding, LLC 144A | | |
| company guaranty sr. unsec. notes 3.125%, 11/1/25 (Poland) | 845,000 | 859,788 |
| Clarios Global LP 144A company guaranty sr. notes 6.75%, 5/15/25 | 840,000 | 903,529 |
| Clean Harbors, Inc. 144A sr. unsec. bonds 5.125%, 7/15/29 | 860,000 | 942,775 |
| Clean Harbors, Inc. 144A sr. unsec. notes 4.875%, 7/15/27 | 1,515,000 | 1,604,264 |
| Crown Americas, LLC/Crown Americas Capital Corp. VI company | | |
| guaranty sr. unsec. notes 4.75%, 2/1/26 | 2,590,000 | 2,687,125 |
| Crown Cork & Seal Co., Inc. company guaranty sr. unsec. bonds | | |
| 7.375%, 12/15/26 | 3,092,000 | 3,787,700 |
| GFL Environmental, Inc. 144A company guaranty sr. unsec. notes | | |
| 4.00%, 8/1/28 (Canada) | 920,000 | 915,400 |
| GFL Environmental, Inc. 144A sr. notes 5.125%, 12/15/26 (Canada) | 2,215,000 | 2,336,825 |
| GFL Environmental, Inc. 144A sr. unsec. notes 8.50%, | | |
| 5/1/27 (Canada) | 1,401,000 | 1,548,105 |
| Great Lakes Dredge & Dock Corp. company guaranty sr. unsec. | | |
| notes 8.00%, 5/15/22 | 3,130,000 | 3,208,250 |
| Husky III Holding, Ltd. 144A sr. unsec. notes 13.00%, 2/15/25 | | |
| (Canada) ‡‡ | 2,940,000 | 3,160,500 |
| MasTec, Inc. 144A company guaranty sr. unsec. notes | | |
| 4.50%, 8/15/28 | 2,255,000 | 2,355,528 |
| Owens-Brockway Glass Container, Inc. 144A company guaranty sr. | | |
| unsec. notes 6.625%, 5/13/27 | 935,000 | 1,012,138 |
| Panther BF Aggregator 2 LP/Panther Finance Co., Inc. 144A | | |
| company guaranty sr. notes 6.25%, 5/15/26 | 1,105,000 | 1,174,063 |
| Panther BF Aggregator 2 LP/Panther Finance Co., Inc. 144A | | |
| company guaranty sr. unsec. notes 8.50%, 5/15/27 | 2,480,000 | 2,669,100 |
| Park-Ohio Industries, Inc. company guaranty sr. unsec. notes | | |
| 6.625%, 4/15/27 | 3,455,000 | 3,505,581 |
| RBS Global, Inc./Rexnord, LLC 144A sr. unsec. notes | | |
| 4.875%, 12/15/25 | 1,870,000 | 1,907,400 |
| Staples, Inc. 144A sr. notes 7.50%, 4/15/26 | 5,865,000 | 5,901,656 |
| Stevens Holding Co, Inc. 144A company guaranty sr. unsec. notes | | |
| 6.125%, 10/1/26 | 1,607,000 | 1,741,586 |
| Tennant Co. company guaranty sr. unsec. unsub. notes | | |
| 5.625%, 5/1/25 | 2,734,000 | 2,836,525 |
| Tenneco, Inc. 144A company guaranty sr. notes 7.875%, 1/15/29 | 230,000 | 253,575 |
| Titan Acquisition, Ltd./Titan Co-Borrower, LLC 144A sr. unsec. | | |
| notes 7.75%, 4/15/26 (Canada) | 1,786,000 | 1,852,975 |
| | |
| | Principal | |
| CORPORATE BONDS AND NOTES (84.6%)* cont. | amount | Value |
| Capital goods cont. | | |
| TransDigm, Inc. company guaranty sr. unsec. sub. notes | | |
| 6.50%, 5/15/25 | $808,000 | $824,160 |
| TransDigm, Inc. company guaranty sr. unsec. sub. notes | | |
| 6.375%, 6/15/26 | 1,427,000 | 1,482,225 |
| TransDigm, Inc. company guaranty sr. unsec. sub. notes | | |
| 5.50%, 11/15/27 | 1,939,000 | 2,001,048 |
| TransDigm, Inc. 144A company guaranty sr. notes 8.00%, 12/15/25 | 450,000 | 491,625 |
| TransDigm, Inc. 144A company guaranty sr. notes 6.25%, 3/15/26 | 4,938,000 | 5,234,280 |
| Vertical Holdco GmbH 144A company guaranty sr. unsec. notes | | |
| 7.625%, 7/15/28 (Germany) | 1,990,000 | 2,131,788 |
| Vertical US Newco, Inc. 144A company guaranty sr. notes | | |
| 5.25%, 7/15/27 | 1,975,000 | 2,073,750 |
| Waste Pro USA, Inc. 144A sr. unsec. notes 5.50%, 2/15/26 | 3,478,000 | 3,591,035 |
| WESCO Distribution, Inc. 144A company guaranty sr. unsec. unsub. | | |
| notes 7.25%, 6/15/28 | 2,415,000 | 2,713,108 |
| WESCO Distribution, Inc. 144A company guaranty sr. unsec. unsub. | | |
| notes 7.125%, 6/15/25 | 1,210,000 | 1,317,388 |
| | | 93,324,233 |
| Commercial and consumer services (2.1%) | | |
| Carriage Services, Inc. 144A sr. unsec. notes 6.625%, 6/1/26 | 3,360,000 | 3,561,600 |
| Gartner, Inc. 144A company guaranty sr. unsec. bonds | | |
| 3.75%, 10/1/30 | 885,000 | 918,188 |
| Gartner, Inc. 144A company guaranty sr. unsec. notes | | |
| 4.50%, 7/1/28 | 475,000 | 498,750 |
| GW B-CR Security Corp. 144A sr. unsec. notes 9.50%, | | |
| 11/1/27 (Canada) | 2,357,000 | 2,628,055 |
| IHS Markit, Ltd. sr. unsec. sub. bonds 4.75%, 8/1/28 | | |
| (United Kingdom) | 1,145,000 | 1,369,706 |
| IHS Markit, Ltd. 144A company guaranty notes 4.75%, 2/15/25 | | |
| (United Kingdom) | 2,518,000 | 2,886,257 |
| IHS Markit, Ltd. 144A company guaranty sr. unsec. notes 4.00%, | | |
| 3/1/26 (United Kingdom) | 675,000 | 774,563 |
| Iron Mountain, Inc. 144A company guaranty sr. unsec. bonds | | |
| 5.25%, 3/15/28 R | 2,153,000 | 2,252,576 |
| Iron Mountain, Inc. 144A company guaranty sr. unsec. notes | | |
| 4.875%, 9/15/27 R | 1,266,000 | 1,316,640 |
| MPH Acquisition Holdings, LLC 144A company guaranty sr. unsec. | | |
| notes 5.75%, 11/1/28 | 1,125,000 | 1,101,797 |
| Prime Security Services Borrower, LLC/Prime Finance, Inc. 144A | | |
| company guaranty sr. notes 3.375%, 8/31/27 | 1,130,000 | 1,115,875 |
| Prime Security Services Borrower, LLC/Prime Finance, Inc. 144A | | |
| notes 6.25%, 1/15/28 | 2,245,000 | 2,350,919 |
| Sabre GLBL, Inc. 144A company guaranty sr. notes 9.25%, 4/15/25 | 2,790,000 | 3,262,905 |
| Shift4 Payments, LLC/Shift4 Payments Finance Sub, Inc. 144A | | |
| company guaranty sr. unsec. notes 4.625%, 11/1/26 | 2,310,000 | 2,399,628 |
| | | 26,437,459 |
| Communication services (9.5%) | | |
| Altice Financing SA 144A company guaranty sr. notes 5.00%, | | |
| 1/15/28 (Luxembourg) | 1,515,000 | 1,552,875 |
| Altice France Holding SA 144A company guaranty sr. sub. notes | | |
| 10.50%, 5/15/27 (Luxembourg) | 3,090,000 | 3,483,048 |
| | |
| | Principal | |
| CORPORATE BONDS AND NOTES (84.6%)* cont. | amount | Value |
| Communication services cont. | | |
| Altice France Holding SA 144A company guaranty sr. unsec. notes | | |
| 6.00%, 2/15/28 (Luxembourg) | $3,720,000 | $3,775,614 |
| Altice France SA 144A company guaranty sr. notes 7.375%, | | |
| 5/1/26 (France) | 4,900,000 | 5,145,000 |
| Altice France SA 144A company guaranty sr. notes 5.50%, | | |
| 1/15/28 (France) | 1,625,000 | 1,694,063 |
| CCO Holdings, LLC/CCO Holdings Capital Corp. 144A sr. unsec. | | |
| bonds 5.375%, 6/1/29 | 13,656,000 | 14,919,180 |
| CCO Holdings, LLC/CCO Holdings Capital Corp. 144A sr. unsec. | | |
| bonds 4.75%, 3/1/30 | 1,890,000 | 2,005,196 |
| CCO Holdings, LLC/CCO Holdings Capital Corp. 144A sr. unsec. | | |
| bonds 4.50%, 5/1/32 | 1,560,000 | 1,648,764 |
| CCO Holdings, LLC/CCO Holdings Capital Corp. 144A sr. unsec. | | |
| bonds 4.50%, 8/15/30 | 1,090,000 | 1,148,588 |
| CCO Holdings, LLC/CCO Holdings Capital Corp. 144A sr. unsec. | | |
| notes 5.75%, 2/15/26 | 2,010,000 | 2,082,863 |
| CCO Holdings, LLC/CCO Holdings Capital Corp. 144A sr. unsec. | | |
| notes 5.00%, 2/1/28 | 2,680,000 | 2,824,050 |
| CommScope Technologies, LLC 144A company guaranty sr. unsec. | | |
| notes 6.00%, 6/15/25 | 814,000 | 834,106 |
| CSC Holdings, LLC sr. unsec. unsub. bonds 5.25%, 6/1/24 | 5,465,000 | 5,915,863 |
| CSC Holdings, LLC 144A company guaranty sr. unsec. notes | | |
| 5.375%, 2/1/28 | 1,200,000 | 1,273,500 |
| CSC Holdings, LLC 144A sr. unsec. bonds 5.75%, 1/15/30 | 1,870,000 | 2,024,275 |
| CSC Holdings, LLC 144A sr. unsec. bonds 4.625%, 12/1/30 | 1,250,000 | 1,279,625 |
| CSC Holdings, LLC 144A sr. unsec. unsub. notes 7.50%, 4/1/28 | 3,050,000 | 3,400,338 |
| DISH DBS Corp. company guaranty sr. unsec. unsub. notes | | |
| 5.875%, 11/15/24 | 5,805,000 | 6,173,821 |
| Equinix, Inc. sr. unsec. sub. notes 3.20%, 11/18/29 R | 1,126,000 | 1,243,301 |
| Frontier Communications Corp. sr. unsec. notes 10.50%, 9/15/22 | | |
| (In default) † | 5,840,000 | 2,876,200 |
| Frontier Communications Corp. 144A company guaranty sr. notes | | |
| 5.875%, 10/15/27 | 1,660,000 | 1,747,150 |
| Frontier Communications Corp. 144A notes 6.75%, 5/1/29 | 1,010,000 | 1,045,350 |
| Intelsat Jackson Holdings SA 144A company guaranty sr. unsec. | | |
| notes 8.50%, 10/15/24 (Luxembourg) (In default) † | 1,000,000 | 705,100 |
| Intelsat Jackson Holdings SA 144A sr. unsec. notes 9.75%, 7/15/25 | | |
| (Luxembourg) (In default) † | 5,526,000 | 3,875,108 |
| Level 3 Financing, Inc. company guaranty sr. unsec. unsub. notes | | |
| 5.25%, 3/15/26 | 1,884,000 | 1,947,698 |
| Level 3 Financing, Inc. 144A company guaranty sr. unsec. notes | | |
| 4.625%, 9/15/27 | 2,395,000 | 2,492,225 |
| Level 3 Financing, Inc. 144A company guaranty sr. unsec. notes | | |
| 4.25%, 7/1/28 | 740,000 | 764,050 |
| Level 3 Financing, Inc. 144A company guaranty sr. unsec. unsub. | | |
| notes 3.625%, 1/15/29 | 1,135,000 | 1,136,396 |
| Quebecor Media, Inc. sr. unsec. unsub. notes 5.75%, | | |
| 1/15/23 (Canada) | 715,000 | 772,200 |
| Sprint Capital Corp. company guaranty sr. unsec. unsub. notes | | |
| 6.875%, 11/15/28 | 5,173,000 | 6,713,002 |
| Sprint Corp. company guaranty sr. unsec. notes 7.625%, 3/1/26 | 2,475,000 | 3,077,625 |
| | |
| | Principal | |
| CORPORATE BONDS AND NOTES (84.6%)* cont. | amount | Value |
| Communication services cont. | | |
| Sprint Corp. company guaranty sr. unsec. sub. notes | | |
| 7.875%, 9/15/23 | $6,570,000 | $7,577,481 |
| Sprint Corp. company guaranty sr. unsec. sub. notes | | |
| 7.25%, 9/15/21 | 2,385,000 | 2,483,381 |
| T-Mobile USA, Inc. company guaranty sr. unsec. notes | | |
| 6.00%, 3/1/23 | 205,000 | 205,738 |
| T-Mobile USA, Inc. company guaranty sr. unsec. notes | | |
| 5.375%, 4/15/27 | 1,571,000 | 1,680,970 |
| T-Mobile USA, Inc. company guaranty sr. unsec. unsub. bonds | | |
| 4.75%, 2/1/28 | 4,720,000 | 5,062,200 |
| T-Mobile USA, Inc. company guaranty sr. unsec. unsub. notes | | |
| 4.50%, 2/1/26 | 1,145,000 | 1,175,915 |
| T-Mobile USA, Inc. 144A company guaranty sr. notes | | |
| 3.875%, 4/15/30 | 945,000 | 1,084,236 |
| Videotron, Ltd. company guaranty sr. unsec. unsub. notes 5.00%, | | |
| 7/15/22 (Canada) | 1,593,000 | 1,676,633 |
| Videotron, Ltd./Videotron Ltee. 144A sr. unsec. notes 5.125%, | | |
| 4/15/27 (Canada) | 2,400,000 | 2,541,000 |
| Virgin Media Finance PLC 144A sr. unsec. bonds 5.00%, 7/15/30 | | |
| (United Kingdom) | 2,080,000 | 2,184,000 |
| Zayo Group Holdings, Inc. 144A sr. notes 4.00%, 3/1/27 | 450,000 | 447,701 |
| Zayo Group Holdings, Inc. 144A sr. unsec. notes 6.125%, 3/1/28 | 1,060,000 | 1,116,068 |
| Ziggo Bond Co. BV 144A sr. unsec. notes 6.00%, | | |
| 1/15/27 (Netherlands) | 2,215,000 | 2,331,288 |
| Ziggo BV 144A company guaranty sr. notes 5.50%, | | |
| 1/15/27 (Netherlands) | 1,245,000 | 1,302,519 |
| | | 120,445,304 |
| Consumer (0.8%) | | |
| Scotts Miracle-Gro, Co. (The) company guaranty sr. unsec. notes | | |
| 4.50%, 10/15/29 | 3,787,000 | 4,042,623 |
| Spectrum Brands, Inc. company guaranty sr. unsec. unsub. notes | | |
| 6.125%, 12/15/24 | 2,020,000 | 2,060,400 |
| Spectrum Brands, Inc. 144A company guaranty sr. unsec. bonds | | |
| 5.00%, 10/1/29 | 1,075,000 | 1,161,000 |
| Valvoline, Inc. company guaranty sr. unsec. notes 4.375%, 8/15/25 | 700,000 | 723,667 |
| Valvoline, Inc. 144A company guaranty sr. unsec. unsub. notes | | |
| 4.25%, 2/15/30 | 1,460,000 | 1,536,650 |
| | | 9,524,340 |
| Consumer staples (7.0%) | | |
| 1011778 BC ULC/New Red Finance, Inc. 144A bonds 4.00%, | | |
| 10/15/30 (Canada) | 1,475,000 | 1,469,469 |
| 1011778 BC ULC/New Red Finance, Inc. 144A company guaranty | | |
| notes 4.375%, 1/15/28 (Canada) | 1,548,000 | 1,598,310 |
| 1011778 BC ULC/New Red Finance, Inc. 144A company guaranty sr. | | |
| notes 3.875%, 1/15/28 (Canada) | 3,205,000 | 3,297,144 |
| Albertsons Cos., Inc./Safeway, Inc./New Albertsons LP/Albertsons, | | |
| LLC 144A company guaranty sr. unsec. notes 4.875%, 2/15/30 | 675,000 | 738,248 |
| Albertsons Cos., Inc./Safeway, Inc./New Albertsons LP/Albertsons, | | |
| LLC 144A company guaranty sr. unsec. notes 4.625%, 1/15/27 | 2,745,000 | 2,893,614 |
| | |
| | Principal | |
| CORPORATE BONDS AND NOTES (84.6%)* cont. | amount | Value |
| Consumer staples cont. | | |
| Albertsons Cos., LLC/Safeway, Inc./New Albertsons LP/ | | |
| Albertsons, LLC 144A company guaranty sr. unsec. notes | | |
| 7.50%, 3/15/26 | $2,010,000 | $2,256,225 |
| Ascend Learning, LLC 144A sr. unsec. notes 6.875%, 8/1/25 | 3,352,000 | 3,460,940 |
| Ashtead Capital, Inc. 144A bonds 4.25%, 11/1/29 | 200,000 | 217,000 |
| Ashtead Capital, Inc. 144A notes 4.375%, 8/15/27 | 710,000 | 747,353 |
| Avient Corp. 144A sr. unsec. notes 5.75%, 5/15/25 | 705,000 | 753,469 |
| Brand Energy & Infrastructure Services, Inc. 144A sr. unsec. notes | | |
| 8.50%, 7/15/25 | 1,580,000 | 1,572,100 |
| CDW, LLC/CDW Finance Corp. company guaranty sr. unsec. notes | | |
| 3.25%, 2/15/29 | 2,210,000 | 2,215,746 |
| Energizer Holdings, Inc. 144A company guaranty sr. unsec. notes | | |
| 7.75%, 1/15/27 | 200,000 | 218,000 |
| Fresh Market, Inc. (The) 144A company guaranty sr. notes | | |
| 9.75%, 5/1/23 | 5,172,000 | 5,068,560 |
| Go Daddy Operating Co, LLC/GD Finance Co., Inc. 144A company | | |
| guaranty sr. unsec. notes 5.25%, 12/1/27�� | 1,075,000 | 1,131,438 |
| Golden Nugget, Inc. 144A company guaranty sr. unsec. sub. notes | | |
| 8.75%, 10/1/25 | 1,710,000 | 1,722,825 |
| Golden Nugget, Inc. 144A sr. unsec. notes 6.75%, 10/15/24 | 4,185,000 | 4,090,838 |
| IRB Holding Corp. 144A company guaranty sr. notes 7.00%, 6/15/25 | 1,185,000 | 1,288,688 |
| KFC Holding Co./Pizza Hut Holdings, LLC/Taco Bell of America, LLC | | |
| 144A company guaranty sr. unsec. notes 5.25%, 6/1/26 | 2,765,000 | 2,861,609 |
| KFC Holding Co./Pizza Hut Holdings, LLC/Taco Bell of America, LLC | | |
| 144A company guaranty sr. unsec. notes 4.75%, 6/1/27 | 875,000 | 916,563 |
| Kraft Heinz Co. (The) company guaranty sr. unsec. notes | | |
| 5.00%, 7/15/35 | 3,640,000 | 4,292,404 |
| Kraft Heinz Co. (The) company guaranty sr. unsec. notes | | |
| 3.00%, 6/1/26 | 3,410,000 | 3,559,016 |
| Kraft Heinz Co. (The) 144A company guaranty sr. unsec. notes | | |
| 3.875%, 5/15/27 | 335,000 | 362,629 |
| Kraft Heinz Co. (The) 144A company guaranty sr. unsec. sub. notes | | |
| 3.75%, 4/1/30 | 1,350,000 | 1,452,644 |
| Lamb Weston Holdings, Inc. 144A company guaranty sr. unsec. | | |
| notes 4.875%, 5/15/28 | 1,640,000 | 1,820,400 |
| Lamb Weston Holdings, Inc. 144A company guaranty sr. unsec. | | |
| unsub. notes 4.875%, 11/1/26 | 3,385,000 | 3,520,400 |
| Lamb Weston Holdings, Inc. 144A company guaranty sr. unsec. | | |
| unsub. notes 4.625%, 11/1/24 | 861,000 | 895,440 |
| Match Group Holdings II, LLC 144A sr. unsec. notes 4.125%, 8/1/30 | 476,000 | 495,659 |
| Match Group, Inc. 144A sr. unsec. bonds 5.00%, 12/15/27 | 3,317,000 | 3,507,728 |
| Match Group, Inc. 144A sr. unsec. unsub. notes 4.625%, 6/1/28 | 2,130,000 | 2,236,500 |
| Netflix, Inc. sr. unsec. notes 6.375%, 5/15/29 | 1,130,000 | 1,417,913 |
| Netflix, Inc. sr. unsec. notes 4.875%, 4/15/28 | 2,520,000 | 2,885,400 |
| Netflix, Inc. sr. unsec. unsub. notes 5.875%, 11/15/28 | 4,420,000 | 5,337,946 |
| Netflix, Inc. 144A sr. unsec. bonds 5.375%, 11/15/29 | 1,165,000 | 1,391,068 |
| Netflix, Inc. 144A sr. unsec. bonds 4.875%, 6/15/30 | 665,000 | 769,738 |
| Newell Brands, Inc. sr. unsec. notes 4.875%, 6/1/25 | 1,293,000 | 1,428,765 |
| Newell Brands, Inc. sr. unsec. unsub. notes 4.70%, 4/1/26 | 3,430,000 | 3,695,208 |
| Rite Aid Corp. 144A company guaranty sr. notes 8.00%, 11/15/26 | 2,084,000 | 2,115,260 |
| | |
| | Principal | |
| CORPORATE BONDS AND NOTES (84.6%)* cont. | amount | Value |
| Consumer staples cont. | | |
| Rite Aid Corp. 144A company guaranty sr. unsec. sub. notes | | |
| 7.50%, 7/1/25 | $2,788,000 | $2,836,651 |
| TripAdvisor, Inc. 144A company guaranty sr. unsec. notes | | |
| 7.00%, 7/15/25 | 2,113,000 | 2,271,475 |
| United Rentals North America, Inc. company guaranty notes | | |
| 3.875%, 11/15/27 | 825,000 | 864,542 |
| Yum! Brands, Inc. sr. unsec. sub. bonds 3.625%, 3/15/31 | 1,125,000 | 1,125,000 |
| Yum! Brands, Inc. 144A sr. unsec. bonds 4.75%, 1/15/30 | 1,080,000 | 1,167,534 |
| Yum! Brands, Inc. 144A sr. unsec. notes 7.75%, 4/1/25 | 445,000 | 492,838 |
| | | 88,460,297 |
| Energy (9.4%) | | |
| Aker BP ASA 144A sr. unsec. notes 5.875%, 3/31/25 (Norway) | 2,830,000 | 2,935,944 |
| Aker BP ASA 144A sr. unsec. notes 3.75%, 1/15/30 (Norway) | 1,790,000 | 1,805,663 |
| Antero Resources Corp. company guaranty sr. unsec. sub. notes | | |
| 5.125%, 12/1/22 | 2,069,000 | 1,955,205 |
| Apache Corp. sr. unsec. unsub. notes 5.10%, 9/1/40 | 1,236,000 | 1,276,825 |
| Apache Corp. sr. unsec. unsub. notes 4.875%, 11/15/27 | 680,000 | 710,260 |
| Apache Corp. sr. unsec. unsub. notes 4.625%, 11/15/25 | 455,000 | 473,064 |
| Apache Corp. sr. unsec. unsub. notes 4.375%, 10/15/28 | 3,198,000 | 3,261,960 |
| Ascent Resources Utica Holdings, LLC/ARU Finance Corp. 144A sr. | | |
| unsec. notes 10.00%, 4/1/22 | 2,833,000 | 2,854,248 |
| Baytex Energy Corp. 144A company guaranty sr. unsec. sub. notes | | |
| 5.625%, 6/1/24 (Canada) | 920,000 | 535,900 |
| ChampionX corp. company guaranty sr. unsec. notes | | |
| 6.375%, 5/1/26 | 2,517,000 | 2,514,483 |
| Cheniere Corpus Christi Holdings, LLC company guaranty sr. notes | | |
| 7.00%, 6/30/24 | 1,400,000 | 1,615,990 |
| Cheniere Corpus Christi Holdings, LLC company guaranty sr. notes | | |
| 5.125%, 6/30/27 | 2,325,000 | 2,697,812 |
| Comstock Escrow Corp. company guaranty sr. unsec. sub. notes | | |
| 9.75%, 8/15/26 | 948,000 | 1,002,605 |
| Comstock Resources, Inc. company guaranty sr. unsec. sub. notes | | |
| 9.75%, 8/15/26 | 1,305,000 | 1,380,038 |
| Comstock Resources, Inc. 144A company guaranty sr. unsec. notes | | |
| 7.50%, 5/15/25 | 2,016,000 | 2,010,960 |
| Continental Resources, Inc. company guaranty sr. unsec. notes | | |
| 4.375%, 1/15/28 | 2,010,000 | 2,004,975 |
| Continental Resources, Inc. company guaranty sr. unsec. unsub. | | |
| notes 4.50%, 4/15/23 | 3,095,000 | 3,172,375 |
| Continental Resources, Inc. 144A company guaranty sr. unsec. | | |
| bonds 5.75%, 1/15/31 | 1,130,000 | 1,211,925 |
| DCP Midstream Operating LP company guaranty sr. unsec. notes | | |
| 5.625%, 7/15/27 | 1,110,000 | 1,207,125 |
| DCP Midstream Operating LP company guaranty sr. unsec. sub. | | |
| notes 5.125%, 5/15/29 | 610,000 | 646,600 |
| DCP Midstream Operating LP company guaranty sr. unsec. unsub. | | |
| notes 5.375%, 7/15/25 | 70,000 | 75,513 |
| DCP Midstream Operating LP 144A company guaranty sr. unsec. | | |
| unsub. bonds 6.75%, 9/15/37 | 3,143,000 | 3,237,290 |
| Devon Energy Corp. sr. unsec. unsub. bonds 7.95%, 4/15/32 | 1,665,000 | 2,208,206 |
| Devon Energy Corp. sr. unsec. unsub. bonds 7.875%, 9/30/31 | 1,170,000 | 1,564,875 |
| | |
| | Principal | |
| CORPORATE BONDS AND NOTES (84.6%)* cont. | amount | Value |
| Energy cont. | | |
| Devon Energy Corp. sr. unsec. unsub. bonds 5.60%, 7/15/41 | $917,000 | $1,070,902 |
| Diamondback Energy, Inc. company guaranty sr. unsec. notes | | |
| 3.25%, 12/1/26 | 800,000 | 846,855 |
| Diamondback Energy, Inc. sr. unsec. notes 4.75%, 5/31/25 | 1,245,000 | 1,388,489 |
| Double Eagle III Midco 1 LLC/Double Eagle Finance Corp. 144A sr. | | |
| unsec. notes 7.75%, 12/15/25 | 2,290,000 | 2,352,975 |
| Endeavor Energy Resources LP/EER Finance, Inc. 144A sr. unsec. | | |
| bonds 5.75%, 1/30/28 | 4,340,000 | 4,623,055 |
| Endeavor Energy Resources LP/EER Finance, Inc. 144A sr. unsec. | | |
| notes 6.625%, 7/15/25 | 2,400,000 | 2,556,000 |
| Energy Transfer Operating LP jr. unsec. sub. FRB Ser. B, 6.625%, | | |
| perpetual maturity | 6,451,000 | 5,273,693 |
| EQT Corp. sr. unsec. notes 5.00%, 1/15/29 | 225,000 | 237,375 |
| Global Partners LP/GLP Finance Corp. 144A company guaranty sr. | | |
| unsec. notes 6.875%, 1/15/29 | 335,000 | 358,065 |
| Hess Midstream Operations LP 144A company guaranty sr. unsec. | | |
| notes 5.125%, 6/15/28 | 1,065,000 | 1,091,625 |
| Hess Midstream Operations LP 144A company guaranty sr. unsec. | | |
| sub. notes 5.625%, 2/15/26 | 5,025,000 | 5,188,313 |
| Holly Energy Partners LP/Holly Energy Finance Corp. 144A | | |
| company guaranty sr. unsec. notes 5.00%, 2/1/28 | 1,499,000 | 1,475,915 |
| Indigo Natural Resources, LLC 144A sr. unsec. notes | | |
| 6.875%, 2/15/26 | 1,803,000 | 1,821,030 |
| MEG Energy Corp. 144A notes 6.50%, 1/15/25 (Canada) | 2,867,000 | 2,924,340 |
| Nabors Industries, Inc. company guaranty sr. unsec. notes | | |
| 5.75%, 2/1/25 | 1,126,000 | 412,116 |
| Nabors Industries, Ltd. 144A company guaranty sr. unsec. notes | | |
| 7.50%, 1/15/28 | 900,000 | 484,875 |
| Nabors Industries, Ltd. 144A company guaranty sr. unsec. notes | | |
| 7.25%, 1/15/26 | 1,125,000 | 630,000 |
| Newfield Exploration Co. sr. unsec. unsub. notes 5.75%, 1/30/22 | 1,805,000 | 1,869,072 |
| Newfield Exploration Co. sr. unsec. unsub. notes 5.625%, 7/1/24 | 1,227,000 | 1,300,620 |
| Newfield Exploration Co. sr. unsec. unsub. notes 5.375%, 1/1/26 | 373,000 | 390,796 |
| Noble Energy, Inc. sr. unsec. bonds 6.00%, 3/1/41 | 1,132,000 | 1,658,788 |
| Northriver Midstream Finance LP 144A sr. notes 5.625%, | | |
| 2/15/26 (Canada) | 1,183,000 | 1,199,266 |
| Occidental Petroleum Corp. sr. unsec. bonds 6.625%, 9/1/30 | 1,465,000 | 1,530,105 |
| Occidental Petroleum Corp. sr. unsec. sub. notes 6.45%, 9/15/36 | 2,358,000 | 2,304,473 |
| Occidental Petroleum Corp. sr. unsec. sub. notes 5.875%, 9/1/25 | 510,000 | 514,998 |
| Occidental Petroleum Corp. sr. unsec. sub. notes 4.85%, 3/15/21 | 1,495,000 | 1,495,000 |
| Occidental Petroleum Corp. sr. unsec. unsub. notes 3.50%, 6/15/25 | 1,152,000 | 1,077,120 |
| Precision Drilling Corp. 144A company guaranty sr. unsec. notes | | |
| 7.125%, 1/15/26 (Canada) | 3,250,000 | 2,210,000 |
| Rattler Midstream LP 144A company guaranty sr. unsec. notes | | |
| 5.625%, 7/15/25 | 1,590,000 | 1,678,444 |
| SM Energy Co. sr. unsec. notes 6.625%, 1/15/27 | 990,000 | 556,474 |
| SM Energy Co. sr. unsec. sub. notes 5.00%, 1/15/24 | 2,228,000 | 1,470,480 |
| SM Energy Co. sr. unsec. unsub. notes 6.75%, 9/15/26 | 975,000 | 546,000 |
| SM Energy Co. sr. unsec. unsub. notes 6.125%, 11/15/22 | 248,000 | 223,200 |
| SM Energy Co. 144A company guaranty notes 10.00%, 1/15/25 | 595,000 | 606,900 |
| | |
| | Principal | |
| CORPORATE BONDS AND NOTES (84.6%)* cont. | amount | Value |
| Energy cont. | | |
| Tallgrass Energy Partners LP/Tallgrass Energy Finance Corp. 144A | | |
| company guaranty sr. unsec. notes 7.50%, 10/1/25 | $565,000 | $584,775 |
| Tallgrass Energy Partners LP/Tallgrass Energy Finance Corp. 144A | | |
| company guaranty sr. unsec. notes 5.50%, 1/15/28 | 2,529,000 | 2,427,840 |
| Targa Resources Partners LP/Targa Resources Partners Finance | | |
| Corp. company guaranty sr. unsec. notes 6.875%, 1/15/29 | 705,000 | 789,600 |
| Targa Resources Partners LP/Targa Resources Partners Finance | | |
| Corp. company guaranty sr. unsec. notes 6.50%, 7/15/27 | 1,290,000 | 1,396,425 |
| Targa Resources Partners LP/Targa Resources Partners Finance | | |
| Corp. company guaranty sr. unsec. notes 5.50%, 3/1/30 | 665,000 | 723,188 |
| Targa Resources Partners LP/Targa Resources Partners Finance | | |
| Corp. company guaranty sr. unsec. unsub. notes 5.00%, 1/15/28 | 1,000,000 | 1,042,500 |
| Transocean Pontus, Ltd. 144A company guaranty sr. notes 6.125%, | | |
| 8/1/25 (Cayman Islands) | 907,920 | 848,905 |
| Transocean Poseidon, Ltd. 144A company guaranty sr. notes | | |
| 6.875%, 2/1/27 | 1,692,000 | 1,421,280 |
| USA Compression Partners LP/USA Compression Finance Corp. | | |
| company guaranty sr. unsec. notes 6.875%, 4/1/26 | 2,249,000 | 2,327,040 |
| USA Compression Partners LP/USA Compression Finance Corp. | | |
| company guaranty sr. unsec. unsub. notes 6.875%, 9/1/27 | 1,105,000 | 1,157,156 |
| Viper Energy Partners LP 144A company guaranty sr. unsec. notes | | |
| 5.375%, 11/1/27 | 965,000 | 1,020,845 |
| WPX Energy, Inc. sr. unsec. notes 8.25%, 8/1/23 | 1,592,000 | 1,814,880 |
| WPX Energy, Inc. sr. unsec. notes 5.75%, 6/1/26 | 1,288,000 | 1,355,620 |
| WPX Energy, Inc. sr. unsec. notes 4.50%, 1/15/30 | 1,315,000 | 1,373,255 |
| WPX Energy, Inc. sr. unsec. sub. notes 5.875%, 6/15/28 | 1,800,000 | 1,939,500 |
| WPX Energy, Inc. sr. unsec. sub. notes 5.25%, 10/15/27 | 1,947,000 | 2,054,085 |
| | | 118,004,094 |
| Entertainment (1.1%) | | |
| Cinemark USA, Inc. company guaranty sr. unsec. sub. notes | | |
| 4.875%, 6/1/23 | 1,834,000 | 1,735,973 |
| Cinemark USA, Inc. 144A company guaranty sr. notes 8.75%, 5/1/25 | 445,000 | 478,842 |
| Constellation Merger Sub, Inc. 144A sr. unsec. notes 8.50%, 9/15/25 | 3,465,000 | 3,023,213 |
| Live Nation Entertainment, Inc. 144A company guaranty sr. unsec. | | |
| notes 4.875%, 11/1/24 | 910,000 | 903,175 |
| Live Nation Entertainment, Inc. 144A company guaranty sr. unsec. | | |
| sub. notes 5.625%, 3/15/26 | 1,550,000 | 1,565,500 |
| Live Nation Entertainment, Inc. 144A sr. notes 6.50%, 5/15/27 | 1,185,000 | 1,312,388 |
| Royal Caribbean Cruises, Ltd. 144A company guaranty sr. unsec. | | |
| notes 9.125%, 6/15/23 | 450,000 | 487,125 |
| Six Flags Entertainment Corp. 144A company guaranty sr. unsec. | | |
| bonds 5.50%, 4/15/27 | 1,940,000 | 1,949,700 |
| Six Flags Theme Parks, Inc. 144A company guaranty sr. notes | | |
| 7.00%, 7/1/25 | 2,265,000 | 2,455,430 |
| | | 13,911,346 |
| Financials (7.8%) | | |
| AG Issuer, LLC 144A sr. notes 6.25%, 3/1/28 | 2,080,000 | 2,090,400 |
| Alliant Holdings Intermediate, LLC/Alliant Holdings Co-Issuer 144A | | |
| sr. unsec. notes 6.75%, 10/15/27 | 2,690,000 | 2,878,300 |
| Ally Financial, Inc. company guaranty sr. unsec. notes | | |
| 8.00%, 11/1/31 | 5,728,000 | 8,211,534 |
| | | |
| | | Principal | |
| CORPORATE BONDS AND NOTES (84.6%)* cont. | | amount | Value |
| Financials cont. | | | |
| American International Group, Inc. jr. unsec. sub. FRB | | | |
| 8.175%, 5/15/58 | | $222,000 | $323,651 |
| Bank of America Corp. jr. unsec. sub. FRN Ser. AA, 6.10%, | | | |
| perpetual maturity | | 1,010,000 | 1,128,675 |
| Bank of America Corp. jr. unsec. sub. FRN Ser. Z, 6.50%, | | | |
| perpetual maturity | | 1,635,000 | 1,843,463 |
| CIT Group, Inc. sr. unsec. sub. notes 5.00%, 8/1/23 | | 2,020,000 | 2,194,225 |
| CIT Group, Inc. sr. unsec. unsub. notes 5.25%, 3/7/25 | | 3,007,000 | 3,386,634 |
| CNO Financial Group, Inc. sr. unsec. notes 5.25%, 5/30/29 | | 1,980,000 | 2,349,271 |
| Credit Suisse Group AG 144A jr. unsec. sub. FRB 6.375%, perpetual | | | |
| maturity (Switzerland) | | 915,000 | 1,019,081 |
| Credit Suisse Group AG 144A jr. unsec. sub. FRN 6.25%, perpetual | | | |
| maturity (Switzerland) | | 2,400,000 | 2,622,000 |
| Diversified Healthcare Trust company guaranty sr. unsec. notes | | | |
| 9.75%, 6/15/25 R | | 4,830,000 | 5,520,738 |
| Dresdner Funding Trust I 144A jr. unsec. sub. notes 8.151%, 6/30/31 | | 1,812,000 | 2,668,420 |
| ESH Hospitality, Inc. 144A company guaranty sr. unsec. notes | | | |
| 5.25%, 5/1/25 R | | 1,905,000 | 1,950,244 |
| Fairfax Financial Holdings, Ltd. sr. unsec. notes 4.85%, | | | |
| 4/17/28 (Canada) | | 1,407,000 | 1,555,705 |
| Freedom Mortgage Corp. 144A sr. unsec. notes 8.25%, 4/15/25 | | 2,043,000 | 2,099,183 |
| Freedom Mortgage Corp. 144A sr. unsec. notes 8.125%, 11/15/24 | | 1,631,000 | 1,679,930 |
| GLP Capital LP/GLP Financing II, Inc. company guaranty sr. unsec. | | | |
| notes 5.25%, 6/1/25 | | 820,000 | 908,150 |
| goeasy, Ltd. 144A company guaranty sr. unsec. notes 5.375%, | | | |
| 12/1/24 (Canada) | | 2,210,000 | 2,295,638 |
| HUB International, Ltd. 144A sr. unsec. notes 7.00%, 5/1/26 | | 2,387,000 | 2,491,431 |
| Icahn Enterprises LP/Icahn Enterprises Finance Corp. company | | | |
| guaranty sr. unsec. notes 6.75%, 2/1/24 | | 920,000 | 938,400 |
| Icahn Enterprises LP/Icahn Enterprises Finance Corp. company | | | |
| guaranty sr. unsec. notes 6.25%, 5/15/26 | | 1,044,000 | 1,090,917 |
| Icahn Enterprises LP/Icahn Enterprises Finance Corp. company | | | |
| guaranty sr. unsec. notes 5.25%, 5/15/27 | | 1,325,000 | 1,397,875 |
| iStar, Inc. sr. unsec. notes 5.50%, 2/15/26 R | | 1,810,000 | 1,814,525 |
| iStar, Inc. sr. unsec. notes 4.75%, 10/1/24 R | | 3,007,000 | 3,007,000 |
| iStar, Inc. sr. unsec. notes 4.25%, 8/1/25 R | | 2,388,000 | 2,322,330 |
| JPMorgan Chase & Co. jr. unsec. sub. FRN Ser. R, 6.00%, | | | |
| perpetual maturity | | 1,000,000 | 1,049,240 |
| Ladder Capital Finance Holdings, LLLP/Ladder Capital | | | |
| Finance Corp. 144A company guaranty sr. unsec. unsub. notes | | | |
| 5.25%, 10/1/25 R | | 1,515,000 | 1,458,188 |
| Ladder Capital Finance Holdings, LLLP/Ladder Capital Finance | | | |
| Corp. 144A sr. unsec. notes 4.25%, 2/1/27 R | | 2,245,000 | 2,076,625 |
| Lloyds Bank PLC jr. unsec. sub. FRN Ser. EMTN, 13.00%, perpetual | | | |
| maturity (United Kingdom) | GBP | 1,030,000 | 2,488,028 |
| Lloyds Banking Group PLC jr. unsec. sub. FRB 7.50%, perpetual | | | |
| maturity (United Kingdom) | | $793,000 | 874,283 |
| LPL Holdings, Inc. 144A company guaranty sr. unsec. notes | | | |
| 5.75%, 9/15/25 | | 4,395,000 | 4,548,913 |
| Nationstar Mortgage Holdings, Inc. 144A company guaranty sr. | | | |
| unsec. notes 9.125%, 7/15/26 | | 665,000 | 714,044 |
| | |
| | Principal | |
| CORPORATE BONDS AND NOTES (84.6%)* cont. | amount | Value |
| Financials cont. | | |
| Nationstar Mortgage Holdings, Inc. 144A company guaranty sr. | | |
| unsec. notes 6.00%, 1/15/27 | $1,120,000 | $1,161,283 |
| Nationstar Mortgage Holdings, Inc. 144A company guaranty sr. | | |
| unsec. notes 5.50%, 8/15/28 | 1,833,000 | 1,887,990 |
| PennyMac Financial Services, Inc. 144A company guaranty sr. | | |
| unsec. notes 5.375%, 10/15/25 | 2,065,000 | 2,157,925 |
| Provident Funding Associates LP/PFG Finance Corp. 144A sr. | | |
| unsec. notes 6.375%, 6/15/25 | 3,860,000 | 3,840,700 |
| Service Properties Trust company guaranty sr. unsec. unsub. | | |
| notes 7.50%, 9/15/25 R | 834,000 | 933,065 |
| Societe Generale SA 144A jr. unsec. sub. notes 5.375%, | | |
| 11/18/50 (France) | 1,700,000 | 1,765,389 |
| Springleaf Finance Corp. company guaranty sr. unsec. notes | | |
| 8.875%, 6/1/25 | 950,000 | 1,059,250 |
| Springleaf Finance Corp. company guaranty sr. unsec. sub. notes | | |
| 7.125%, 3/15/26 | 1,090,000 | 1,254,688 |
| Springleaf Finance Corp. company guaranty sr. unsec. sub. notes | | |
| 6.625%, 1/15/28 | 1,185,000 | 1,365,713 |
| Springleaf Finance Corp. company guaranty sr. unsec. unsub. | | |
| notes 6.875%, 3/15/25 | 1,719,000 | 1,963,958 |
| Springleaf Finance Corp. company guaranty sr. unsec. unsub. | | |
| notes 5.375%, 11/15/29 | 2,295,000 | 2,501,550 |
| Starwood Property Trust, Inc. sr. unsec. notes 4.75%, 3/15/25 R | 3,010,000 | 3,089,916 |
| USIS Merger Sub, Inc. 144A sr. unsec. notes 6.875%, 5/1/25 | 1,952,000 | 2,000,800 |
| | | 97,979,268 |
| Gaming and lottery (2.3%) | | |
| Boyd Gaming Corp. company guaranty sr. unsec. notes | | |
| 6.00%, 8/15/26 | 1,120,000 | 1,166,200 |
| Boyd Gaming Corp. company guaranty sr. unsec. notes | | |
| 4.75%, 12/1/27 | 1,105,000 | 1,122,901 |
| Boyd Gaming Corp. company guaranty sr. unsec. unsub. notes | | |
| 6.375%, 4/1/26 | 1,095,000 | 1,137,431 |
| Boyd Gaming Corp. 144A sr. unsec. notes 8.625%, 6/1/25 | 1,060,000 | 1,177,596 |
| Caesars Entertainment, Inc. 144A sr. notes 6.25%, 7/1/25 | 3,600,000 | 3,832,362 |
| CRC Escrow Issuer, LLC/CRC Finco, Inc. 144A company guaranty sr. | | |
| unsec. notes 5.25%, 10/15/25 | 4,480,000 | 4,496,800 |
| Penn National Gaming, Inc. 144A sr. unsec. notes 5.625%, 1/15/27 | 2,645,000 | 2,750,800 |
| Scientific Games International, Inc. 144A company guaranty sr. | | |
| unsec. notes 7.25%, 11/15/29 | 3,545,000 | 3,762,787 |
| Scientific Games International, Inc. 144A sr. unsec. notes | | |
| 7.00%, 5/15/28 | 1,030,000 | 1,072,869 |
| Station Casinos, LLC 144A sr. unsec. notes 4.50%, 2/15/28 | 2,250,000 | 2,216,250 |
| Wynn Las Vegas, LLC/Wynn Las Vegas Capital Corp. 144A company | | |
| guaranty sr. unsec. sub. notes 5.25%, 5/15/27 | 2,998,000 | 3,027,980 |
| Wynn Resorts Finance, LLC/Wynn Resorts Capital Corp. 144A sr. | | |
| unsec. bonds 5.125%, 10/1/29 | 2,760,000 | 2,808,300 |
| Wynn Resorts Finance, LLC/Wynn Resorts Capital Corp. 144A sr. | | |
| unsec. notes 7.75%, 4/15/25 | 665,000 | 717,302 |
| | | 29,289,578 |
| | |
| | Principal | |
| CORPORATE BONDS AND NOTES (84.6%)* cont. | amount | Value |
| Health care (7.2%) | | |
| Air Methods Corp. 144A sr. unsec. notes 8.00%, 5/15/25 | $3,120,000 | $2,605,200 |
| Bausch Health Americas, Inc. 144A sr. unsec. notes 8.50%, 1/31/27 | 2,780,000 | 3,061,475 |
| Bausch Health Cos., Inc. 144A company guaranty sr. notes | | |
| 5.50%, 11/1/25 | 1,720,000 | 1,770,310 |
| Bausch Health Cos., Inc. 144A company guaranty sr. unsec. notes | | |
| 7.25%, 5/30/29 | 2,090,000 | 2,309,346 |
| Bausch Health Cos., Inc. 144A company guaranty sr. unsec. notes | | |
| 7.00%, 1/15/28 | 1,045,000 | 1,128,600 |
| Bausch Health Cos., Inc. 144A company guaranty sr. unsec. notes | | |
| 6.25%, 2/15/29 | 1,645,000 | 1,743,700 |
| Bausch Health Cos., Inc. 144A company guaranty sr. unsec. notes | | |
| 6.125%, 4/15/25 | 4,525,000 | 4,657,130 |
| Bausch Health Cos., Inc. 144A company guaranty sr. unsec. notes | | |
| 5.00%, 2/15/29 | 910,000 | 917,963 |
| Bausch Health Cos., Inc. 144A company guaranty sr. unsub. notes | | |
| 7.00%, 3/15/24 | 1,200,000 | 1,236,600 |
| Centene Corp. sr. unsec. bonds 3.00%, 10/15/30 | 1,025,000 | 1,078,813 |
| Centene Corp. sr. unsec. notes 4.625%, 12/15/29 | 4,840,000 | 5,299,800 |
| Centene Corp. 144A sr. unsec. notes 5.375%, 8/15/26 | 1,689,000 | 1,784,006 |
| Centene Escrow I Corp. 144A sr. unsec. notes 5.375%, 6/1/26 | 662,000 | 695,928 |
| CHS/Community Health Systems, Inc. company guaranty sr. notes | | |
| 6.25%, 3/31/23 | 8,009,000 | 8,179,191 |
| CHS/Community Health Systems, Inc. 144A company guaranty sr. | | |
| notes 8.00%, 3/15/26 | 1,115,000 | 1,171,308 |
| CHS/Community Health Systems, Inc. 144A company guaranty | | |
| sub. notes 8.125%, 6/30/24 | 2,110,000 | 1,962,300 |
| CHS/Community Health Systems, Inc. 144A sr. notes | | |
| 6.625%, 2/15/25 | 2,265,000 | 2,304,411 |
| Elanco Animal Health, Inc. sr. unsec. notes Ser. WI, 5.90%, 8/28/28 | 3,850,000 | 4,519,130 |
| Emergent BioSolutions, Inc. 144A company guaranty sr. unsec. | | |
| notes 3.875%, 8/15/28 | 680,000 | 687,650 |
| Endo DAC/Endo Finance, LLC/Endo Finco, Inc. 144A company | | |
| guaranty notes 9.50%, 7/31/27 (Ireland) | 699,000 | 769,183 |
| Endo DAC/Endo Finance, LLC/Endo Finco, Inc. 144A company | | |
| guaranty sr. unsec. notes 6.00%, 6/30/28 (Ireland) | 963,000 | 760,770 |
| Global Medical Response, Inc. 144A sr. notes 6.50%, 10/1/25 | 1,065,000 | 1,096,950 |
| HCA, Inc. company guaranty sr. bonds 5.25%, 6/15/26 | 970,000 | 1,144,819 |
| HCA, Inc. company guaranty sr. unsec. notes 5.375%, 9/1/26 | 4,655,000 | 5,289,244 |
| HCA, Inc. company guaranty sr. unsec. notes 3.50%, 9/1/30 | 1,115,000 | 1,154,152 |
| HCA, Inc. company guaranty sr. unsec. unsub. notes | | |
| 5.875%, 5/1/23 | 1,840,000 | 2,012,500 |
| Jaguar Holding Co. II/PPD Development LP 144A company | | |
| guaranty sr. unsec. notes 5.00%, 6/15/28 | 720,000 | 769,075 |
| Jaguar Holding Co. II/PPD Development LP 144A company | | |
| guaranty sr. unsec. notes 4.625%, 6/15/25 | 480,000 | 501,600 |
| Mallinckrodt International Finance SA/Mallinckrodt CB, LLC 144A | | |
| company guaranty sub. notes 10.00%, 4/15/25 (Luxembourg) | 1,366,000 | 1,215,740 |
| Molina Healthcare, Inc. 144A company guaranty sr. unsec. notes | | |
| 4.875%, 6/15/25 | 475,000 | 486,581 |
| Ortho-Clinical Diagnostics, Inc./Ortho-Clinical Diagnostics | | |
| SA 144A sr. unsec. notes 7.375%, 6/1/25 | 885,000 | 946,950 |
| | |
| | Principal | |
| CORPORATE BONDS AND NOTES (84.6%)* cont. | amount | Value |
| Health care cont. | | |
| Par Pharmaceutical, Inc. 144A company guaranty sr. notes | | |
| 7.50%, 4/1/27 | $312,000 | $336,180 |
| Service Corp. International sr. unsec. bonds 5.125%, 6/1/29 | 3,210,000 | 3,567,113 |
| Service Corp. International sr. unsec. notes 4.625%, 12/15/27 | 65,000 | 68,900 |
| Service Corp. International sr. unsec. notes 3.375%, 8/15/30 | 1,850,000 | 1,896,250 |
| Tenet Healthcare Corp. company guaranty sr. notes | | |
| 4.625%, 7/15/24 | 1,395,000 | 1,419,413 |
| Tenet Healthcare Corp. 144A company guaranty sr. notes | | |
| 7.50%, 4/1/25 | 550,000 | 602,022 |
| Tenet Healthcare Corp. 144A company guaranty sr. notes | | |
| 5.125%, 11/1/27 | 4,410,000 | 4,597,425 |
| Tenet Healthcare Corp. 144A company guaranty sr. notes | | |
| 4.875%, 1/1/26 | 5,985,000 | 6,164,550 |
| Teva Pharmaceutical Finance Netherlands III BV company | | |
| guaranty sr. unsec. notes 7.125%, 1/31/25 (Israel) | 955,000 | 1,043,586 |
| Teva Pharmaceutical Finance Netherlands III BV company | | |
| guaranty sr. unsec. notes 6.75%, 3/1/28 (Israel) | 4,505,000 | 5,037,378 |
| Teva Pharmaceutical Finance Netherlands III BV company | | |
| guaranty sr. unsec. notes 6.00%, 4/15/24 (Israel) | 2,970,000 | 3,145,230 |
| | | 91,138,472 |
| Homebuilding (1.9%) | | |
| Brookfield Residential Properties, Inc./Brookfield Residential | | |
| US Corp. 144A company guaranty sr. unsec. notes 6.25%, | | |
| 9/15/27 (Canada) | 2,315,000 | 2,442,325 |
| Howard Hughes Corp. (The) 144A sr. unsec. notes 5.375%, 3/15/25 | 2,936,000 | 3,020,410 |
| Mattamy Group Corp. 144A sr. unsec. notes 5.25%, | | |
| 12/15/27 (Canada) | 3,070,000 | 3,246,525 |
| Mattamy Group Corp. 144A sr. unsec. notes 4.625%, | | |
| 3/1/30 (Canada) | 2,470,000 | 2,587,325 |
| PulteGroup, Inc. company guaranty sr. unsec. unsub. notes | | |
| 7.875%, 6/15/32 | 4,768,000 | 7,104,320 |
| Taylor Morrison Communities, Inc. 144A sr. unsec. bonds | | |
| 5.125%, 8/1/30 | 455,000 | 506,188 |
| Taylor Morrison Communities, Inc. 144A sr. unsec. notes | | |
| 5.75%, 1/15/28 | 1,070,000 | 1,214,450 |
| TRI Pointe Group, Inc. sr. unsec. notes 5.70%, 6/15/28 | 1,200,000 | 1,363,812 |
| TRI Pointe Group, Inc./TRI Pointe Homes, Inc. company guaranty | | |
| sr. unsec. unsub. notes 5.875%, 6/15/24 | 1,911,000 | 2,085,283 |
| Weekley Homes, LLC/Weekley Finance Corp. 144A sr. unsec. notes | | |
| 4.875%, 9/15/28 | 450,000 | 470,391 |
| | | 24,041,029 |
| Lodging/Tourism (0.7%) | | |
| Carnival Corp. 144A sr. notes 11.50%, 4/1/23 | 975,000 | 1,110,281 |
| Hilton Worldwide Finance, LLC/Hilton Worldwide Finance Corp. | | |
| company guaranty sr. unsec. notes 4.875%, 4/1/27 | 2,545,000 | 2,649,981 |
| Marriott International, Inc. sr. unsec. bonds 4.625%, 6/15/30 | 65,000 | 75,057 |
| Marriott International, Inc. sr. unsec. notes Ser. EE, 5.75%, 5/1/25 | 1,715,000 | 1,985,955 |
| SugarHouse HSP Gaming Prop. Mezz LP/SugarHouse HSP | | |
| Gaming Finance Corp. 144A company guaranty sr. unsub. notes | | |
| 5.875%, 5/15/25 | 2,680,000 | 2,613,000 |
| | | 8,434,274 |
| | |
| | Principal | |
| CORPORATE BONDS AND NOTES (84.6%)* cont. | amount | Value |
| Media (1.1%) | | |
| Lions Gate Capital Holdings, LLC 144A company guaranty sr. | | |
| unsec. notes 5.875%, 11/1/24 | $2,549,000 | $2,549,000 |
| Lions Gate Capital Holdings, LLC 144A sr. unsec. notes | | |
| 6.375%, 2/1/24 | 2,220,000 | 2,281,294 |
| Nielsen Co. Luxembourg SARL (The) 144A company guaranty sr. | | |
| unsec. notes 5.00%, 2/1/25 (Luxembourg) | 3,344,000 | 3,440,140 |
| Nielsen Finance, LLC/Nielsen Finance Co. 144A company guaranty | | |
| sr. unsec. notes 5.625%, 10/1/28 | 1,565,000 | 1,668,212 |
| Nielsen Finance, LLC/Nielsen Finance Co. 144A company guaranty | | |
| sr. unsec. sub. notes 5.00%, 4/15/22 | 1,516,000 | 1,516,000 |
| WMG Acquisition Corp. 144A company guaranty sr. bonds | | |
| 3.00%, 2/15/31 | 1,345,000 | 1,311,254 |
| WMG Acquisition Corp. 144A company guaranty sr. bonds | | |
| 3.00%, 2/15/31 | 455,000 | 443,584 |
| WMG Acquisition Corp. 144A company guaranty sr. unsec. notes | | |
| 5.50%, 4/15/26 | 775,000 | 804,063 |
| | | 14,013,547 |
| Publishing (0.4%) | | |
| Meredith Corp. company guaranty sr. unsec. notes 6.875%, 2/1/26 | 3,160,000 | 3,144,200 |
| Meredith Corp. 144A company guaranty sr. unsec. notes | | |
| 6.50%, 7/1/25 | 2,220,000 | 2,358,750 |
| | | 5,502,950 |
| Retail (1.6%) | | |
| eG Global Finance PLC 144A company guaranty sr. notes 6.75%, | | |
| 2/7/25 (United Kingdom) | 1,471,000 | 1,522,485 |
| Gap, Inc. (The) 144A sr. notes 8.625%, 5/15/25 | 885,000 | 983,456 |
| Gap, Inc. (The) 144A sr. notes 8.375%, 5/15/23 | 1,539,000 | 1,742,918 |
| L Brands, Inc. company guaranty sr. unsec. bonds 6.75%, | | |
| perpetual maturity | 1,186,000 | 1,283,845 |
| L Brands, Inc. company guaranty sr. unsec. notes 7.50%, | | |
| perpetual maturity | 2,557,000 | 2,812,663 |
| L Brands, Inc. 144A company guaranty sr. notes 6.875%, 7/1/25 | 600,000 | 648,000 |
| L Brands, Inc. 144A company guaranty sr. unsec. notes | | |
| 9.375%, 7/1/25 | 480,000 | 585,600 |
| L Brands, Inc. 144A company guaranty sr. unsec. unsub. bonds | | |
| 6.625%, 10/1/30 | 1,030,000 | 1,127,953 |
| Macy’s, Inc. 144A company guaranty sr. unsec. notes | | |
| 8.375%, 6/15/25 | 600,000 | 653,970 |
| Nordstrom, Inc. 144A sr. notes 8.75%, 5/15/25 | 1,890,000 | 2,113,349 |
| Penske Automotive Group, Inc. company guaranty sr. unsec. notes | | |
| 3.50%, 9/1/25 | 455,000 | 461,265 |
| Penske Automotive Group, Inc. company guaranty sr. unsec. sub. | | |
| notes 5.375%, 12/1/24 | 2,570,000 | 2,614,602 |
| Wolverine World Wide, Inc. 144A company guaranty sr. unsec. | | |
| bonds 5.00%, 9/1/26 | 2,474,000 | 2,480,185 |
| Wolverine World Wide, Inc. 144A company guaranty sr. unsec. | | |
| notes 6.375%, 5/15/25 | 1,400,000 | 1,484,000 |
| | | 20,514,291 |
| Technology (4.2%) | | |
| Arches Buyer, Inc. 144A sr. notes 4.25%, 6/1/28 | 865,000 | 867,163 |
| Arches Buyer, Inc. 144A sr. unsec. notes 6.125%, 12/1/28 | 335,000 | 343,794 |
| | |
| | Principal | |
| CORPORATE BONDS AND NOTES (84.6%)* cont. | amount | Value |
| Technology cont. | | |
| Banff Merger Sub, Inc. 144A sr. unsec. notes 9.75%, 9/1/26 | $2,632,000 | $2,816,240 |
| Black Knight InfoServ, LLC 144A company guaranty sr. unsec. | | |
| notes 3.625%, 9/1/28 | 1,755,000 | 1,781,325 |
| Boxer Parent Co., Inc. 144A company guaranty sr. notes | | |
| 7.125%, 10/2/25 | 1,225,000 | 1,323,732 |
| Boxer Parent Co., Inc. 144A notes 9.125%, 3/1/26 | 1,820,000 | 1,958,684 |
| BY Crown Parent LLC/BY Bond Finance, Inc. 144A company | | |
| guaranty sr. notes 4.25%, 1/31/26 | 840,000 | 863,100 |
| CommScope Finance, LLC 144A sr. notes 6.00%, 3/1/26 | 1,020,000 | 1,076,100 |
| CommScope Finance, LLC 144A sr. notes 5.50%, 3/1/24 | 675,000 | 693,563 |
| CommScope, Inc. 144A company guaranty sr. unsec. notes | | |
| 8.25%, 3/1/27 | 2,434,000 | 2,622,635 |
| Dell International, LLC/EMC Corp. 144A company guaranty sr. | | |
| notes 5.85%, 7/15/25 | 710,000 | 844,977 |
| Diamond 1 Finance Corp./Diamond 2 Finance Corp. 144A | | |
| company guaranty sr. notes 6.02%, 6/15/26 | 2,508,000 | 3,045,204 |
| Diamond 1 Finance Corp./Diamond 2 Finance Corp. 144A | | |
| company guaranty sr. unsec. notes 7.125%, 6/15/24 | 2,098,000 | 2,174,053 |
| Dun & Bradstreet Corp. (The) 144A sr. notes 6.875%, 8/15/26 | 662,000 | 709,168 |
| Microchip Technology, Inc. 144A company guaranty sr. unsec. | | |
| notes 4.25%, 9/1/25 | 2,347,000 | 2,460,908 |
| MSCI, Inc. 144A company guaranty sr. unsec. notes 3.625%, 9/1/30 | 1,375,000 | 1,430,000 |
| Plantronics, Inc. 144A company guaranty sr. unsec. notes | | |
| 5.50%, 5/31/23 | 5,441,000 | 5,454,603 |
| Qorvo, Inc. 144A company guaranty sr. unsec. bonds | | |
| 3.375%, 4/1/31 | 1,105,000 | 1,124,559 |
| Rackspace Technology Global, Inc. 144A company guaranty sr. | | |
| unsec. notes 5.375%, 12/1/28 | 170,000 | 177,686 |
| Solera, LLC/Solera Finance, Inc. 144A sr. unsec. notes | | |
| 10.50%, 3/1/24 | 2,698,000 | 2,805,920 |
| SS&C Technologies, Inc. 144A company guaranty sr. unsec. notes | | |
| 5.50%, 9/30/27 | 4,631,000 | 4,949,381 |
| Tempo Acquisition, LLC/Tempo Acquisition Finance Corp. 144A | | |
| company guaranty sr. notes 5.75%, 6/1/25 | 935,000 | 995,775 |
| Tempo Acquisition, LLC/Tempo Acquisition Finance Corp. 144A sr. | | |
| unsec. notes 6.75%, 6/1/25 | 6,853,000 | 7,024,325 |
| TTM Technologies, Inc. 144A company guaranty sr. unsec. notes | | |
| 5.625%, 10/1/25 | 4,349,000 | 4,487,429 |
| Western Digital Corp. company guaranty sr. unsec. notes | | |
| 4.75%, 2/15/26 | 1,265,000 | 1,381,617 |
| | | 53,411,941 |
| Textiles (0.4%) | | |
| Hanesbrands, Inc. 144A company guaranty sr. unsec. notes | | |
| 5.375%, 5/15/25 | 935,000 | 995,195 |
| Hanesbrands, Inc. 144A company guaranty sr. unsec. unsub. notes | | |
| 4.875%, 5/15/26 | 1,155,000 | 1,241,625 |
| Hanesbrands, Inc. 144A company guaranty sr. unsec. unsub. notes | | |
| 4.625%, 5/15/24 | 2,165,000 | 2,275,956 |
| Levi Strauss & Co. sr. unsec. unsub. notes 5.00%, 5/1/25 | 950,000 | 976,125 |
| | | 5,488,901 |
| | |
| | Principal | |
| CORPORATE BONDS AND NOTES (84.6%)* cont. | amount | Value |
| Toys (0.3%) | | |
| Mattel, Inc. 144A company guaranty sr. unsec. notes | | |
| 5.875%, 12/15/27 | $3,310,000 | $3,649,275 |
| | | 3,649,275 |
| Transportation (0.7%) | | |
| Delta Air Lines Inc/SkyMiles IP, Ltd. 144A company guaranty sr. | | |
| notes 4.75%, 10/20/28 | 3,295,000 | 3,545,324 |
| Watco Cos LLC/Watco Finance Corp. 144A sr. unsec. notes | | |
| 6.50%, 6/15/27 | 5,255,000 | 5,570,300 |
| | | 9,115,624 |
| Utilities and power (3.3%) | | |
| AES Corp. (The) sr. unsec. unsub. notes 5.50%, 4/15/25 | 4,111,000 | 4,239,469 |
| AES Corp. (The) sr. unsec. unsub. notes 5.125%, 9/1/27 | 1,510,000 | 1,663,869 |
| AES Corp. (The) 144A sr. unsec. bonds 2.45%, 1/15/31 | 75,000 | 76,311 |
| AES Corp. (The) 144A sr. unsec. notes 3.30%, 7/15/25 | 755,000 | 823,524 |
| Buckeye Partners LP sr. unsec. bonds 5.85%, 11/15/43 | 1,088,000 | 1,011,840 |
| Buckeye Partners LP sr. unsec. notes 3.95%, 12/1/26 | 922,000 | 904,713 |
| Buckeye Partners LP 144A sr. unsec. notes 4.50%, 3/1/28 | 890,000 | 890,000 |
| Calpine Corp. 144A company guaranty sr. notes 5.25%, 6/1/26 | 1,824,000 | 1,889,755 |
| Calpine Corp. 144A company guaranty sr. notes 4.50%, 2/15/28 | 3,345,000 | 3,453,713 |
| Calpine Corp. 144A sr. unsec. notes 5.00%, 2/1/31 | 455,000 | 480,025 |
| Calpine Corp. 144A sr. unsec. notes 4.625%, 2/1/29 | 225,000 | 232,313 |
| Colorado Interstate Gas Co., LLC company guaranty sr. unsec. | | |
| notes 6.85%, 6/15/37 | 4,677,000 | 5,456,731 |
| NRG Energy, Inc. company guaranty sr. unsec. notes | | |
| 7.25%, 5/15/26 | 1,840,000 | 1,945,800 |
| NRG Energy, Inc. company guaranty sr. unsec. notes | | |
| 6.625%, 1/15/27 | 585,000 | 615,713 |
| NRG Energy, Inc. company guaranty sr. unsec. notes | | |
| 5.75%, 1/15/28 | 2,392,000 | 2,610,509 |
| NRG Energy, Inc. 144A sr. unsec. bonds 5.25%, 6/15/29 | 983,000 | 1,073,357 |
| Pacific Gas and Electric Co. bonds 2.50%, 2/1/31 | 3,720,000 | 3,741,744 |
| Pacific Gas and Electric Co. company guaranty sr. unsec. unsub. | | |
| notes 2.95%, 3/1/26 | 2,215,000 | 2,321,478 |
| Pacific Gas and Electric Co. notes 2.10%, 8/1/27 | 330,000 | 331,852 |
| Pacific Gas and Electric Co. sr. notes 3.30%, 3/15/27 | 600,000 | 633,262 |
| Texas Competitive Electric Holdings Co., LLC/TCEH Finance, Inc. | | |
| escrow company guaranty sr. notes 11.50%, 10/1/21 F | 1,345,000 | 1,345 |
| Vistra Operations Co., LLC 144A company guaranty sr. unsec. notes | | |
| 5.625%, 2/15/27 | 1,330,000 | 1,404,879 |
| Vistra Operations Co., LLC 144A company guaranty sr. unsec. notes | | |
| 5.50%, 9/1/26 | 3,590,000 | 3,756,396 |
| Vistra Operations Co., LLC 144A company guaranty sr. unsec. sub. | | |
| notes 5.00%, 7/31/27 | 1,430,000 | 1,512,368 |
| | | 41,070,966 |
| Total corporate bonds and notes (cost $1,025,532,531) | | $1,067,287,595 |
| | |
| | Principal | |
| SENIOR LOANS (6.2%)*c | amount | Value |
| Basic materials (0.9%) | | |
| Alpha 3 BV bank term loan FRN Ser. B1, (BBA LIBOR USD 3 Month | | |
| + 3.00%), 4.00%, 1/31/24 | $639,605 | $634,541 |
| CP Atlas Buyer, Inc. bank term loan FRN (BBA LIBOR USD 3 Month | | |
| + 4.50%), 5.25%, 11/19/27 | 2,349,000 | 2,344,889 |
| CP Atlas Buyer, Inc. bank term loan FRN (BBA LIBOR USD 3 Month | | |
| + 4.50%), 5.25%, 11/19/27 U | 783,000 | 781,630 |
| Diamond BC BV bank term loan FRN (BBA LIBOR USD 3 Month | | |
| + 3.00%), 3.214%, 9/6/24 | 897,915 | 878,647 |
| Pisces Midco, Inc. bank term loan FRN Ser. B, (BBA LIBOR USD | | |
| 3 Month + 3.75%), 3.88%, 4/12/25 | 1,286,835 | 1,276,112 |
| Solenis International, LLC bank term loan FRN (BBA LIBOR USD | | |
| 3 Month + 8.50%), 10.831%, 6/26/26 | 1,537,364 | 1,491,243 |
| Solenis International, LLC bank term loan FRN (BBA LIBOR USD | | |
| 3 Month + 4.00%), 4.256%, 6/26/25 | 2,819,996 | 2,784,746 |
| Starfruit US Holdco, LLC bank term loan FRN Ser. B, (1 Month | | |
| US LIBOR + 3.00%), 3.141%, 10/1/25 | 1,334,592 | 1,307,483 |
| | | 11,499,291 |
| Capital goods (0.8%) | | |
| American Axle and Manufacturing, Inc. bank term loan FRN (BBA | | |
| LIBOR USD 3 Month + 2.25%), 3.00%, 4/6/24 | 605,000 | 592,252 |
| BWAY Corp. bank term loan FRN Ser. B, (BBA LIBOR USD 3 Month | | |
| + 3.25%), 3.48%, 4/3/24 | 2,155,156 | 2,048,167 |
| Filtration Group Corp. bank term loan FRN Ser. B, (BBA LIBOR USD | | |
| 3 Month + 3.75%), 3.968%, 3/29/25 | 1,305,000 | 1,297,931 |
| Panther BF Aggregator 2 LP bank term loan FRN Ser. B, (BBA LIBOR | | |
| USD 3 Month + 3.50%), 3.646%, 4/30/26 | 1,555,429 | 1,537,930 |
| Titan Acquisition, Ltd. (United Kingdom) bank term loan FRN | | |
| Ser. B, (BBA LIBOR USD 3 Month + 3.00%), 3.361%, 3/28/25 | 2,474,559 | 2,377,264 |
| Vertiv Group Corp. bank term loan FRN Ser. B, (1 Month US LIBOR | | |
| + 3.00%), 4.655%, 3/2/27 | 2,343,467 | 2,302,876 |
| | | 10,156,420 |
| Communication services (0.1%) | | |
| Zayo Group Holdings, Inc. bank term loan FRN (1 Month US LIBOR | | |
| + 3.00%), 4.668%, 3/9/27 | 1,263,650 | 1,239,957 |
| | | 1,239,957 |
| Consumer cyclicals (2.1%) | | |
| AppleCaramel Buyer, LLC bank term loan FRN (BBA LIBOR USD | | |
| 3 Month + 4.00%), 4.50%, 10/19/27 | 1,735,000 | 1,718,580 |
| Clear Channel Outdoor Holdings, Inc. bank term loan FRN Ser. B, | | |
| (BBA LIBOR USD 3 Month + 3.50%), 3.714%, 8/21/26 | 3,187,800 | 2,985,907 |
| CPG International, Inc. bank term loan FRN (BBA LIBOR USD | | |
| 3 Month + 3.75%), 4.75%, 5/5/24 | 2,063,729 | 2,059,860 |
| Golden Nugget, LLC bank term loan FRN (BBA LIBOR USD 3 Month | | |
| + 12.25%), 13.00%, 10/4/23 | 635,000 | 711,200 |
| iHeartCommunications, Inc. bank term loan FRN (BBA LIBOR USD | | |
| 3 Month + 4.00%), 4.75%, 5/1/26 | 1,566,075 | 1,543,563 |
| iHeartCommunications, Inc. bank term loan FRN Ser. B, (BBA | | |
| LIBOR USD 3 Month + 3.00%), 4.66%, 5/1/26 | 977,613 | 944,210 |
| Navistar, Inc. bank term loan FRN Ser. B, (BBA LIBOR USD 3 Month | | |
| + 3.50%), 3.65%, 11/6/24 | 4,884,179 | 4,852,432 |
| | |
| | Principal | |
| SENIOR LOANS (6.2%)*c cont. | amount | Value |
| Consumer cyclicals cont. | | |
| PetSmart, Inc. bank term loan FRN Ser. B, (BBA LIBOR USD 3 Month | | |
| + 4.00%), 4.50%, 3/11/22 | $1,750,000 | $1,740,324 |
| Refinitiv US Holdings, Inc. bank term loan FRN Ser. B, (BBA LIBOR | | |
| USD 3 Month + 3.25%), 3.396%, 10/1/25 | 3,720,956 | 3,692,468 |
| Robertshaw Holdings Corp. bank term loan FRN (BBA LIBOR USD | | |
| 3 Month + 8.00%), 9.00%, 2/28/26 | 1,915,000 | 1,436,250 |
| Robertshaw Holdings Corp. bank term loan FRN (BBA LIBOR USD | | |
| 3 Month + 3.50%), 4.50%, 2/28/25 | 1,318,708 | 1,226,810 |
| Terrier Media Buyer, Inc. bank term loan FRN Ser. B, (BBA LIBOR | | |
| USD 3 Month + 4.25%), 5.99%, 12/17/26 | 1,920,488 | 1,891,680 |
| Werner Finco LP bank term loan FRN Ser. B, (BBA LIBOR USD | | |
| 3 Month + 4.00%), 5.00%, 7/24/24 | 835,000 | 830,825 |
| | | 25,634,109 |
| Consumer staples (0.4%) | | |
| Brand Industrial Services, Inc. bank term loan FRN (BBA LIBOR | | |
| USD 3 Month + 4.25%), 5.25%, 6/21/24 | 4,278,289 | 4,107,158 |
| IRB Holding Corp. bank term loan FRN Ser. B, (BBA LIBOR USD | | |
| 3 Month + 3.25%), 4.25%, 11/19/27 | 815,000 | 805,831 |
| | | 4,912,989 |
| Energy (0.2%) | | |
| ChampionX Holding, Inc. bank term loan FRN Ser. B, (1 Month | | |
| US LIBOR + 5.00%), 6.00%, 6/3/27 | 2,834,125 | 2,855,381 |
| | | 2,855,381 |
| Financials (0.1%) | | |
| HUB International, Ltd. bank term loan FRN Ser. B, (BBA LIBOR USD | | |
| 3 Month + 4.00%), 5.927%, 4/25/25 | 1,290,250 | 1,290,498 |
| | | 1,290,498 |
| Health care (0.6%) | | |
| Global Medical Response, Inc. bank term loan FRN (BBA LIBOR | | |
| USD 3 Month + 4.75%), 5.50%, 10/2/25 | 4,420,000 | 4,347,070 |
| Ortho-Clinical Diagnostics, Inc. bank term loan FRN Ser. B, (BBA | | |
| LIBOR USD 3 Month + 3.25%), 3.39%, 6/30/25 | 3,333,958 | 3,262,515 |
| | | 7,609,585 |
| Technology (1.0%) | | |
| Arches Buyer, Inc. bank term loan FRN (1 Month US LIBOR + 4.00%), | | |
| 4.50%, 11/24/27 | 3,165,000 | 3,155,109 |
| Epicor Software Corp. bank term loan FRN (1 Month US LIBOR | | |
| + 7.75%), 8.75%, 7/30/28 | 1,145,000 | 1,177,919 |
| Epicor Software Corp. bank term loan FRN Ser. B, (BBA LIBOR USD | | |
| 3 Month + 4.25%), 5.25%, 7/30/27 | 1,855,000 | 1,855,258 |
| Greeneden US Holdings II, LLC bank term loan FRN (BBA LIBOR | | |
| USD 3 Month + 4.00%), 4.75%, 10/8/27 | 1,695,000 | 1,687,373 |
| Rackspace Hosting, Inc. bank term loan FRN (BBA LIBOR USD | | |
| 3 Month + 3.00%), 4.00%, 11/3/23 | 593,919 | 589,217 |
| Star Merger Sub, Inc. bank term loan FRN Ser. B, (1 Month US LIBOR | | |
| + 3.75%), 3.893%, 2/8/26 | 1,059,675 | 1,052,463 |
| Ultimate Software Group, Inc. (The) bank term loan FRN (BBA | | |
| LIBOR USD 3 Month + 6.75%), 7.50%, 5/3/27 | 785,000 | 799,719 |
| Ultimate Software Group, Inc. (The) bank term loan FRN (BBA | | |
| LIBOR USD 3 Month + 4.00%), 4.75%, 5/3/26 | 2,455,000 | 2,457,455 |
| | | 12,774,513 |
| Total senior loans (cost $78,394,215) | | $77,972,743 |
| | |
| COMMON STOCKS (0.9%)* | Shares | Value |
| Advanz Pharma Corp., Ltd. (Canada) † | 15,824 | $75,560 |
| Altice USA, Inc. Class A † | 63,920 | 2,168,166 |
| CHC Group, LLC † | 111,939 | 83,954 |
| Clear Channel Outdoor Holdings, Inc. † | 169,916 | 256,573 |
| Crown Castle International Corp. R | 15,434 | 2,586,275 |
| iHeartMedia, Inc. Class A † | 68,669 | 820,938 |
| MWO Holdings, LLC (Units) F | 918 | — |
| Oasis Petroleum, Inc. † | 40,643 | 1,390,001 |
| PPL Corp. | 65,655 | 1,865,915 |
| Sirius XM Holdings, Inc. | 301,180 | 1,954,658 |
| Tervita Corp. (Canada) † | 2,845 | 4,469 |
| Texas Competitive Electric Holdings Co., LLC/TCEH Finance, Inc. (Rights) | 104,590 | 104,590 |
| Tribune Media Co. Class 1C | 297,958 | 29,796 |
| Total common stocks (cost $18,031,239) | | $11,340,895 |
| |
| | Principal | |
| CONVERTIBLE BONDS AND NOTES (0.8%)* | amount | Value |
| DISH Network Corp. cv. sr. unsec. notes 3.375%, 8/15/26 | $2,718,000 | $2,709,574 |
| Microchip Technology, Inc. cv. sr. unsec. sub. notes | | |
| 1.625%, 2/15/27 | 1,320,000 | 2,587,200 |
| ON Semiconductor Corp. cv. company guaranty sr. unsec. unsub. | | |
| notes 1.625%, 10/15/23 | 1,310,000 | 2,027,892 |
| Splunk, Inc. cv. sr. unsec. notes 1.125%, 9/15/25 | 875,000 | 1,330,713 |
| Splunk, Inc. 144A cv. sr. unsec. notes 1.125%, 6/15/27 | 924,000 | 1,040,543 |
| Total convertible bonds and notes (cost $7,871,639) | | $9,695,922 |
| |
| CONVERTIBLE PREFERRED STOCKS (1.0%)* | Shares | Value |
| Broadcom, Inc. 8.00% cv. pfd. | 1,730 | $2,302,128 |
| Danaher Corp. 4.75% cv. pfd. | 1,715 | 2,644,736 |
| KKR & Co., Inc. $3.00 cv. pfd. † | 35,758 | 1,981,708 |
| PG&E Corp. $5.50 cv. pfd. | 19,455 | 2,416,506 |
| T-Mobile US, Inc. 144A 5.25% cv. pfd. † | 2,423 | 2,937,161 |
| Total convertible preferred stocks (cost $10,759,118) | | $12,282,239 |
| | | | |
| | Expiration | Strike | | |
| WARRANTS (0.0%)* † | date | price | Warrants | Value |
| iHeartMedia, Inc. Class A | 5/1/39 | $16.75 | 3,590 | $43,421 |
| Stearns Holdings, LLC Class B F | 11/5/39 | 0.01 | 182,885 | 182,885 |
| Total warrants (cost $262,861) | | | | $226,306 |
| | | |
| | Principal amount/ | |
| SHORT-TERM INVESTMENTS (6.5%)* | | shares | Value |
| Putnam Short Term Investment Fund Class P 0.17% L | Shares | 81,311,927 | $81,311,927 |
| U.S. Treasury Bills 0.104%, 12/15/20 | | $100,000 | 99,998 |
| Total short-term investments (cost $81,411,923) | | | $81,411,925 |
| |
| TOTAL INVESTMENTS | | | |
| Total investments (cost $1,222,263,526) | | | $1,260,217,625 |
Key to holding’s currency abbreviations
Key to holding’s abbreviations
| |
| DAC | Designated Activity Company |
| EMTN | Euro Medium Term Notes |
| FRB | Floating Rate Bonds: the rate shown is the current interest rate at the close of the reporting period. Rates may |
| | be subject to a cap or floor. For certain securities, the rate may represent a fixed rate currently in place at the |
| | close of the reporting period. |
| FRN | Floating Rate Notes: the rate shown is the current interest rate or yield at the close of the reporting period. |
| | Rates may be subject to a cap or floor. For certain securities, the rate may represent a fixed rate currently in |
| | place at the close of the reporting period. |
| REGS | Securities sold under Regulation S may not be offered, sold or delivered within the United States except |
| | pursuant to an exemption from, or in a transaction not subject to, the registration requirements of the |
| | Securities Act of 1933. |
Notes to the fund’s portfolio
Unless noted otherwise, the notes to the fund’s portfolio are for the close of the fund’s reporting period, which ran from December 1, 2019 through November 30, 2020 (the reporting period). Within the following notes to the portfolio, references to “Putnam Management” represent Putnam Investment Management, LLC, the fund’s manager, an indirect wholly-owned subsidiary of Putnam Investments, LLC and references to “ASC 820” represent Accounting Standards Codification 820 Fair Value Measurements and Disclosures.
* Percentages indicated are based on net assets of $1,261,460,101.
† This security is non-income-producing.
‡‡ Income may be received in cash or additional securities at the discretion of the issuer. The rate shown in parenthesis is the rate paid in kind, if applicable.
c Senior loans are exempt from registration under the Securities Act of 1933, as amended, but contain certain restrictions on resale and cannot be sold publicly. These loans pay interest at rates which adjust periodically. The interest rates shown for senior loans are the current interest rates at the close of the reporting period. Senior loans are also subject to mandatory and/or optional prepayment which cannot be predicted. As a result, the remaining maturity may be substantially less than the stated maturity shown (Notes 1 and 7).
F This security is valued by Putnam Management at fair value following procedures approved by the Trustees. Securities are classified as Level 3 for ASC 820 based on the securities’ valuation inputs (Note 1).
L Affiliated company (Note 5). The rate quoted in the security description is the annualized 7-day yield of the fund at the close of the reporting period.
R Real Estate Investment Trust.
U This security, in part or in entirety, represents an unfunded loan commitment (Note 8).
At the close of the reporting period, the fund maintained liquid assets totaling $2,067 to cover certain derivative contracts.
Unless otherwise noted, the rates quoted in Short-term investments security descriptions represent the weighted average yield to maturity.
Debt obligations are considered secured unless otherwise indicated.
144A after the name of an issuer represents securities exempt from registration under Rule 144A of the Securities Act of 1933, as amended. These securities may be resold in transactions exempt from registration, normally to qualified institutional buyers.
The dates shown on debt obligations are the original maturity dates.
| | | | | | |
| FORWARD CURRENCY CONTRACTS at 11/30/20 (aggregate face value $3,845,865) (Unaudited) |
| | | | | | | Unrealized |
| | | Contract | Delivery | | Aggregate | appreciation/ |
| Counterparty | Currency | type* | date | Value | face value | (depreciation) |
| Goldman Sachs International | | | | | |
| | British Pound | Sell | 12/16/20 | $2,601,492 | $2,603,120 | $1,628 |
| State Street Bank and Trust Co. | | | | | |
| | Canadian Dollar | Buy | 1/20/21 | 1,269,076 | 1,242,745 | 26,331 |
| Unrealized appreciation | | | | | 27,959 |
| Unrealized (depreciation) | | | | | — |
| Total | | | | | | $27,959 |
* The exchange currency for all contracts listed is the United States Dollar.
ASC 820 establishes a three-level hierarchy for disclosure of fair value measurements. The valuation hierarchy is based upon the transparency of inputs to the valuation of the fund’s investments. The three levels are defined as follows:
Level 1: Valuations based on quoted prices for identical securities in active markets.
Level 2: Valuations based on quoted prices in markets that are not active or for which all significant inputs are observable, either directly or indirectly.
Level 3: Valuations based on inputs that are unobservable and significant to the fair value measurement.
The following is a summary of the inputs used to value the fund’s net assets as of the close of the reporting period:
| | | |
| | | | Valuation inputs | |
| Investments in securities: | Level 1 | Level 2 | Level 3 |
| Common stocks*: | | | |
| Capital goods | $4,469 | $— | $— |
| Communication services | 4,754,441 | — | — |
| Consumer cyclicals | 3,032,169 | 29,796 | — |
| Energy | 1,390,001 | 83,954 | — |
| Health care | 75,560 | — | — |
| Utilities and power | 1,865,915 | 104,590 | — |
| Total common stocks | 11,122,555 | 218,340 | — |
| | | | |
| Convertible bonds and notes | — | 9,695,922 | — |
| Convertible preferred stocks | 4,718,634 | 7,563,605 | — |
| Corporate bonds and notes | — | 1,067,286,250 | 1,345 |
| Senior loans | — | 77,972,743 | — |
| Warrants | 43,421 | — | 182,885 |
| Short-term investments | 81,311,927 | 99,998 | — |
| Totals by level | $97,196,537 | $1,162,836,858 | $184,230 |
| | | |
| | | | Valuation inputs | |
| Other financial instruments: | Level 1 | Level 2 | Level 3 |
| Forward currency contracts | $— | $27,959 | $— |
| Totals by level | $— | $27,959 | $— |
* Common stock classifications are presented at the sector level, which may differ from the fund’s portfolio presentation.
At the start and close of the reporting period, Level 3 investments in securities represented less than 1% of the fund’s net assets and were not considered a significant portion of the fund’s portfolio.
The accompanying notes are an integral part of these financial statements.
Statement of assets and liabilities 11/30/20
| |
| ASSETS | |
| Investment in securities, at value (Notes 1 and 10): | |
| Unaffiliated issuers (identified cost $1,140,951,599) | $1,178,905,698 |
| Affiliated issuers (identified cost $81,311,927) (Notes 1 and 5) | 81,311,927 |
| Dividends, interest and other receivables | 16,873,739 |
| Receivable for shares of the fund sold | 7,714,632 |
| Receivable for investments sold | 1,872,248 |
| Unrealized appreciation on forward currency contracts (Note 1) | 27,959 |
| Prepaid assets | 41,141 |
| Total assets | 1,286,747,344 |
| |
| LIABILITIES | |
| Payable to custodian | 1,743,600 |
| Payable for investments purchased | 15,815,140 |
| Payable for shares of the fund repurchased | 5,254,086 |
| Payable for compensation of Manager (Note 2) | 563,392 |
| Payable for custodian fees (Note 2) | 26,605 |
| Payable for investor servicing fees (Note 2) | 319,601 |
| Payable for Trustee compensation and expenses (Note 2) | 794,512 |
| Payable for administrative services (Note 2) | 3,756 |
| Payable for distribution fees (Note 2) | 403,059 |
| Other accrued expenses | 363,492 |
| Total liabilities | 25,287,243 |
| | |
| Net assets | $1,261,460,101 |
| |
| REPRESENTED BY | |
| Paid-in capital (Unlimited shares authorized) (Notes 1 and 4) | $1,344,045,172 |
| Total distributable earnings (Note 1) | (82,585,071) |
| Total — Representing net assets applicable to capital shares outstanding | $1,261,460,101 |
(Continued on next page)
Statement of assets and liabilities cont.
| |
| COMPUTATION OF NET ASSET VALUE AND OFFERING PRICE | |
| Net asset value and redemption price per class A share | |
| ($839,550,426 divided by 143,405,239 shares) | $5.85 |
| Offering price per class A share (100/96.00 of $5.85)* | $6.09 |
| Net asset value and offering price per class B share ($5,637,436 divided by 992,833 shares)** | $5.68 |
| Net asset value and offering price per class C share ($20,415,416 divided by 3,614,260 shares)** | $5.65 |
| Net asset value and redemption price per class M share | |
| ($55,548,942 divided by 9,536,977 shares) | $5.82 |
| Offering price per class M share (100/96.75 of $5.82)† | $6.02 |
| Net asset value, offering price and redemption price per class R share | |
| ($17,058,744 divided by 2,930,240 shares) | $5.82 |
| Net asset value, offering price and redemption price per class R6 share | |
| ($16,039,258 divided by 2,591,251 shares) | $6.19 |
| Net asset value, offering price and redemption price per class Y share | |
| ($307,209,879 divided by 49,503,366 shares) | $6.21 |
* On single retail sales of less than $100,000. On sales of $100,000 or more the offering price is reduced.
** Redemption price per share is equal to net asset value less any applicable contingent deferred sales charge.
† On single retail sales of less than $50,000. On sales of $50,000 or more the offering price is reduced.
The accompanying notes are an integral part of these financial statements.
Statement of operations Year ended 11/30/20
| |
| INVESTMENT INCOME | |
| Interest (including interest income of $633,525 from investments in affiliated issuers) (Note 5) | $70,921,725 |
| Dividends | 685,615 |
| Total investment income | 71,607,340 |
| |
| EXPENSES | |
| Compensation of Manager (Note 2) | 7,020,309 |
| Investor servicing fees (Note 2) | 2,096,690 |
| Custodian fees (Note 2) | 29,428 |
| Trustee compensation and expenses (Note 2) | 53,736 |
| Distribution fees (Note 2) | 2,830,947 |
| Administrative services (Note 2) | 33,065 |
| Other | 617,373 |
| Total expenses | 12,681,548 |
| Expense reduction (Note 2) | (13,315) |
| Net expenses | 12,668,233 |
| | |
| Net investment income | 58,939,107 |
| |
| REALIZED AND UNREALIZED GAIN (LOSS) | |
| Net realized gain (loss) on: | |
| Securities from unaffiliated issuers (Notes 1 and 3) | (15,551,837) |
| Foreign currency transactions (Note 1) | 3,611 |
| Forward currency contracts (Note 1) | (182,674) |
| Swap contracts (Note 1) | (618,492) |
| Total net realized loss | (16,349,392) |
| Change in net unrealized appreciation (depreciation) on: | |
| Securities from unaffiliated issuers | 22,345,162 |
| Assets and liabilities in foreign currencies | (724) |
| Forward currency contracts | 165,594 |
| Total change in net unrealized appreciation | 22,510,032 |
| | |
| Net gain on investments | 6,160,640 |
| |
| Net increase in net assets resulting from operations | $65,099,747 |
The accompanying notes are an integral part of these financial statements.
Statement of changes in net assets
| | |
| INCREASE (DECREASE) IN NET ASSETS | Year ended 11/30/20 | Year ended 11/30/19 |
| Operations | | |
| Net investment income | $58,939,107 | $66,485,953 |
| Net realized loss on investments | | |
| and foreign currency transactions | (16,349,392) | (26,579,578) |
| Change in net unrealized appreciation of investments | | |
| and assets and liabilities in foreign currencies | 22,510,032 | 82,157,240 |
| Net increase in net assets resulting from operations | 65,099,747 | 122,063,615 |
| Distributions to shareholders (Note 1): | | |
| From ordinary income | | |
| Net investment income | | |
| Class A | (41,739,328) | (44,096,773) |
| Class B | (318,631) | (530,724) |
| Class C | (1,061,708) | (1,460,574) |
| Class M | (2,551,827) | (3,817,691) |
| Class R | (859,650) | (1,214,655) |
| Class R6 | (749,683) | (748,948) |
| Class Y | (13,517,208) | (14,821,500) |
| Decrease from capital share transactions (Note 4) | (100,511,526) | (15,174,955) |
| Total increase (decrease) in net assets | (96,209,814) | 40,197,795 |
| |
| NET ASSETS | | |
| Beginning of year | 1,357,669,915 | 1,317,472,120 |
| End of year | $1,261,460,101 | $1,357,669,915 |
The accompanying notes are an integral part of these financial statements.
Financial highlights (For a common share outstanding throughout the period)
| | | | | | | | | | | | |
| | INVESTMENT OPERATIONS | LESS DISTRIBUTIONS | RATIOS AND SUPPLEMENTAL DATA |
| | | | | | | | | | | | Ratio | |
| | | | Net realized | | | | | | | | of net investment | |
| | Net asset value, | | and unrealized | Total from | From | | | Total return | Net assets, | Ratio of expenses | income (loss) | |
| | beginning | Net investment | gain (loss) | investment | net investment | Total | Net asset value, | at net asset value | end of period | to average | to average | Portfolio |
| Period ended | of period | income (loss)a | on investments | operations | income | distributions | end of period | (%)b | (in thousands) | net assets (%)c | net assets (%) | turnover (%) |
| Class A | | | | | | | | | | | | |
| November 30, 2020 | $5.82 | .26 | .04 | .30 | (.27) | (.27) | $5.85 | 5.57 | $839,550 | 1.03 | 4.66 | 46 |
| November 30, 2019 | 5.59 | .28 | .24 | .52 | (.29) | (.29) | 5.82 | 9.46 | 896,789 | 1.02 | 4.94 | 37 |
| November 30, 2018 | 5.93 | .30 | (.35) | (.05) | (.29) | (.29) | 5.59 | (.94) | 898,320 | 1.03 | 5.20 | 33 |
| November 30, 2017 | 5.78 | .30 | .16 | .46 | (.31) | (.31) | 5.93 | 8.11 | 1,054,712 | 1.04d | 5.12 | 47 |
| November 30, 2016 | 5.56 | .31 | .23 | .54 | (.32) | (.32) | 5.78 | 10.18 | 309,295 | 1.07e | 5.48e | 42 |
| Class B | | | | | | | | | | | | |
| November 30, 2020 | $5.65 | .22 | .04 | .26 | (.23) | (.23) | $5.68 | 4.95 | $5,637 | 1.78 | 3.94 | 46 |
| November 30, 2019 | 5.43 | .24 | .23 | .47 | (.25) | (.25) | 5.65 | 8.73 | 10,087 | 1.77 | 4.22 | 37 |
| November 30, 2018 | 5.77 | .25 | (.35) | (.10) | (.24) | (.24) | 5.43 | (1.74) | 14,151 | 1.78 | 4.46 | 33 |
| November 30, 2017 | 5.63 | .25 | .15 | .40 | (.26) | (.26) | 5.77 | 7.30 | 21,868 | 1.79d | 4.41 | 47 |
| November 30, 2016 | 5.43 | .26 | .22 | .48 | (.28) | (.28) | 5.63 | 9.24 | 14,950 | 1.82e | 4.72e | 42 |
| Class C | | | | | | | | | | | | |
| November 30, 2020 | $5.62 | .21 | .05 | .26 | (.23) | (.23) | $5.65 | 4.99 | $20,415 | 1.78 | 3.92 | 46 |
| November 30, 2019 | 5.41 | .23 | .23 | .46 | (.25) | (.25) | 5.62 | 8.58 | 30,768 | 1.77 | 4.22 | 37 |
| November 30, 2018 | 5.74 | .25 | (.33) | (.08) | (.25) | (.25) | 5.41 | (1.55) | 37,341 | 1.78 | 4.46 | 33 |
| November 30, 2017 | 5.61 | .25 | .15 | .40 | (.27) | (.27) | 5.74 | 7.18 | 56,274 | 1.79d | 4.37 | 47 |
| November 30, 2016 | 5.41 | .25 | .24 | .49 | (.29) | (.29) | 5.61 | 9.32 | 21,879 | 1.82e | 4.67e | 42 |
| Class M | | | | | | | | | | | | |
| November 30, 2020 | $5.79 | .25 | .04 | .29 | (.26) | (.26) | $5.82 | 5.37 | $55,549 | 1.28 | 4.41 | 46 |
| November 30, 2019 | 5.56 | .27 | .24 | .51 | (.28) | (.28) | 5.79 | 9.28 | 59,320 | 1.27 | 4.67 | 37 |
| November 30, 2018 | 5.91 | .29 | (.36) | (.07) | (.28) | (.28) | 5.56 | (1.32) | 79,376 | 1.28 | 4.96 | 33 |
| November 30, 2017 | 5.76 | .29 | .16 | .45 | (.30) | (.30) | 5.91 | 7.90 | 89,239 | 1.29d | 4.94 | 47 |
| November 30, 2016 | 5.54 | .29 | .24 | .53 | (.31) | (.31) | 5.76 | 9.98 | 77,471 | 1.32e | 5.23e | 42 |
| Class R | | | | | | | | | | | | |
| November 30, 2020 | $5.79 | .25 | .04 | .29 | (.26) | (.26) | $5.82 | 5.35 | $17,059 | 1.28 | 4.42 | 46 |
| November 30, 2019 | 5.56 | .27 | .24 | .51 | (.28) | (.28) | 5.79 | 9.28 | 23,954 | 1.27 | 4.69 | 37 |
| November 30, 2018 | 5.90 | .29 | (.35) | (.06) | (.28) | (.28) | 5.56 | (1.15) | 27,080 | 1.28 | 4.95 | 33 |
| November 30, 2017 | 5.76 | .29 | .15 | .44 | (.30) | (.30) | 5.90 | 7.74 | 28,817 | 1.29d | 4.93 | 47 |
| November 30, 2016 | 5.54 | .29 | .24 | .53 | (.31) | (.31) | 5.76 | 9.98 | 24,378 | 1.32e | 5.23e | 42 |
| Class R6 | | | | | | | | | | | | |
| November 30, 2020 | $6.14 | .30 | .05 | .35 | (.30) | (.30) | $6.19 | 6.04 | $16,039 | .67 | 5.02 | 46 |
| November 30, 2019 | 5.88 | .32 | .25 | .57 | (.31) | (.31) | 6.14 | 9.94 | 15,255 | .66 | 5.27 | 37 |
| November 30, 2018 † | 6.07 | .18 | (.21) | (.03) | (.16) | (.16) | 5.88 | (.60)* | 13,611 | .35* | 2.95* | 33 |
See notes to financial highlights at the end of this section.
The accompanying notes are an integral part of these financial statements.
| |
| 54 High Yield Fund | High Yield Fund 55 |
Financial highlights cont.
| | | | | | | | | | | | |
| | INVESTMENT OPERATIONS | LESS DISTRIBUTIONS | RATIOS AND SUPPLEMENTAL DATA |
| | | | | | | | | | | | Ratio | |
| | | | Net realized | | | | | | | | of net investment | |
| | Net asset value, | | and unrealized | Total from | From | | | Total return | Net assets, | Ratio of expenses | income (loss) | |
| | beginning | Net investment | gain (loss) | investment | net investment | Total | Net asset value, | at net asset value | end of period | to average | to average | Portfolio |
| Period ended | of period | income (loss)a | on investments | operations | income | distributions | end of period | (%)b | (in thousands) | net assets (%)c | net assets (%) | turnover (%) |
| Class Y | | | | | | | | | | | | |
| November 30, 2020 | $6.15 | .29 | .06 | .35 | (.29) | (.29) | $6.21 | 5.98 | $307,210 | .78 | 4.91 | 46 |
| November 30, 2019 | 5.88 | .31 | .26 | .57 | (.30) | (.30) | 6.15 | 9.89 | 321,497 | .77 | 5.16 | 37 |
| November 30, 2018 | 6.22 | .33 | (.37) | (.04) | (.30) | (.30) | 5.88 | (.71) | 247,593 | .78 | 5.46 | 33 |
| November 30, 2017 | 6.05 | .33 | .16 | .49 | (.32) | (.32) | 6.22 | 8.28 | 355,378 | .79d | 5.37 | 47 |
| November 30, 2016 | 5.80 | .33 | .26 | .59 | (.34) | (.34) | 6.05 | 10.50 | 96,811 | .82e | 5.71e | 42 |
* Not annualized.
† For the period May 22, 2018 (commencement of operations) to November 30, 2018.
a Per share net investment income (loss) has been determined on the basis of the weighted average number of shares outstanding during the period.
b Total return assumes dividend reinvestment and does not reflect the effect of sales charges.
c Includes amounts paid through expense offset and/or brokerage service arrangements, if any (Note 2). Also excludes acquired fund fees and expenses, if any.
d Includes one-time merger costs of 0.01% as a percentage of average net assets.
e Reflects a voluntary waiver of certain fund expenses in effect during the period. As a result of such waivers, the expenses of each class reflect a reduction of less than 0.01% as a percentage of average net assets per share for each class (Note 2).
The accompanying notes are an integral part of these financial statements.
| |
| 56 High Yield Fund | High Yield Fund 57 |
Notes to financial statements 11/30/20
Within the following Notes to financial statements, references to “State Street” represent State Street Bank and Trust Company, references to “the SEC” represent the Securities and Exchange Commission, references to “Putnam Management” represent Putnam Investment Management, LLC, the fund’s manager, an indirect wholly-owned subsidiary of Putnam Investments, LLC and references to “OTC”, if any, represent over-the-counter. Unless otherwise noted, the “reporting period” represents the period from December 1, 2019 through November 30, 2020.
Putnam High Yield Fund (the fund) is a Massachusetts business trust, which is registered under the Investment Company Act of 1940, as amended, as a diversified open-end management investment company. The goal of the fund is to seek high current income. Capital growth is a secondary goal when consistent with achieving high current income. The fund invests mainly in bonds that are obligations of U.S. companies, are below investment-grade in quality (sometimes referred to as “junk bonds”), and have intermediate- to long-term maturities (three years or longer). Under normal circumstances, the fund invests at least 80% of the fund’s net assets in securities rated below investment-grade. This policy may be changed only after 60 days’ notice to shareholders. Putnam Management may also invest in other debt instruments, including loans. Putnam Management may consider, among other factors, credit, interest rate and prepayment risks, as well as general market conditions, when deciding whether to buy or sell investments. The fund may also use derivatives, such as futures, options, certain foreign currency transactions and swap contracts, for both hedging and non-hedging purposes.
The fund offers class A, class B, class C, class M, class R, class R6 and class Y shares. Purchases of class B shares are closed to new and existing investors except by exchange from class B shares of another Putnam fund or through dividend and/or capital gains reinvestment. Class A and class M shares are sold with a maximum front-end sales charge of 4.00% and 3.25%, respectively. Class A shares generally are not subject to a contingent deferred sales charge, and class M, class R, class R6 and class Y shares are not subject to a contingent deferred sales charge. Class B shares, which convert to class A shares after approximately eight years, are not subject to a front-end sales charge and are subject to a contingent deferred sales charge if those shares are redeemed within six years of purchase. Class C shares are subject to a one-year 1.00% contingent deferred sales charge and generally convert to class A shares after approximately ten years. Class R shares, which are not available to all investors, are sold at net asset value. The expenses for class A, class B, class C, class M and class R shares may differ based on the distribution fee of each class, which is identified in Note 2. Class R6 and class Y shares, which are sold at net asset value, are generally subject to the same expenses as class A, class B, class C, class M and class R shares, but do not bear a distribution fee, and in the case of class R6 shares, bear a lower investor servicing fee, which is identified in Note 2. Class R6 and class Y shares are not available to all investors.
In the normal course of business, the fund enters into contracts that may include agreements to indemnify another party under given circumstances. The fund’s maximum exposure under these arrangements is unknown as this would involve future claims that may be, but have not yet been, made against the fund. However, the fund’s management team expects the risk of material loss to be remote.
The fund has entered into contractual arrangements with an investment adviser, administrator, distributor, shareholder servicing agent and custodian, who each provide services to the fund. Unless expressly stated otherwise, shareholders are not parties to, or intended beneficiaries of these contractual arrangements, and these contractual arrangements are not intended to create any shareholder right to enforce them against the service providers or to seek any remedy under them against the service providers, either directly or on behalf of the fund.
Under the fund’s Amended and Restated Agreement and Declaration of Trust, any claims asserted against or on behalf of the Putnam Funds, including claims against Trustees and Officers, must be brought in state and federal courts located within the Commonwealth of Massachusetts.
Note 1: Significant accounting policies
The following is a summary of significant accounting policies consistently followed by the fund in the preparation of its financial statements. The preparation of financial statements is in conformity with accounting principles generally accepted in the United States of America and requires management to make estimates and assumptions that affect the reported amounts of assets and liabilities in the financial statements and the reported amounts of increases and decreases in net assets from operations. Actual results could differ from those estimates. Subsequent events after the Statement of assets and liabilities date through the date that the financial statements were issued have been evaluated in the preparation of the financial statements.
Investment income, realized and unrealized gains and losses and expenses of the fund are borne pro-rata based on the relative net assets of each class to the total net assets of the fund, except that each class bears expenses unique to that class (including the distribution fees applicable to such classes). Each class votes as a class only with respect to its own distribution plan or other matters on which a class vote is required by law or determined by the Trustees. If the fund were liquidated, shares of each class would receive their pro-rata share of the net assets of the fund. In addition, the Trustees declare separate dividends on each class of shares.
Security valuation Portfolio securities and other investments are valued using policies and procedures adopted by the Board of Trustees. The Trustees have formed a Pricing Committee to oversee the implementation of these procedures and have delegated responsibility for valuing the fund’s assets in accordance with these procedures to Putnam Management. Putnam Management has established an internal Valuation Committee that is responsible for making fair value determinations, evaluating the effectiveness of the pricing policies of the fund and reporting to the Pricing Committee.
Investments for which market quotations are readily available are valued at the last reported sales price on their principal exchange, or official closing price for certain markets, and are classified as Level 1 securities under Accounting Standards Codification 820 Fair Value Measurements and Disclosures (ASC 820). If no sales are reported, as in the case of some securities that are traded OTC, a security is valued at its last reported bid price and is generally categorized as a Level 2 security.
Investments in open-end investment companies (excluding exchange-traded funds), if any, which can be classified as Level 1 or Level 2 securities, are valued based on their net asset value. The net asset value of such investment companies equals the total value of their assets less their liabilities and divided by the number of their outstanding shares.
Market quotations are not considered to be readily available for certain debt obligations (including short-term investments with remaining maturities of 60 days or less) and other investments; such investments are valued on the basis of valuations furnished by an independent pricing service approved by the Trustees or dealers selected by Putnam Management. Such services or dealers determine valuations for normal institutional-size trading units of such securities using methods based on market transactions for comparable securities and various relationships, generally recognized by institutional traders, between securities (which consider such factors as security prices, yields, maturities and ratings). These securities will generally be categorized as Level 2.
Many securities markets and exchanges outside the U.S. close prior to the scheduled close of the New York Stock Exchange and therefore the closing prices for securities in such markets or on such exchanges may not fully reflect events that occur after such close but before the scheduled close of the New York Stock Exchange. Accordingly, on certain days, the fund will fair value certain foreign equity securities taking into account multiple factors including movements in the U.S. securities markets, currency valuations and comparisons to the valuation of American Depository Receipts, exchange-traded funds and futures contracts. The foreign equity securities, which would generally be classified as Level 1 securities, will be transferred to Level 2 of the fair value hierarchy when they are valued at fair value. The number of days on which fair value prices will be used will depend on market activity and it is possible that fair value prices will be used by the fund to a significant extent. Securities quoted in foreign currencies, if any, are translated into U.S. dollars at the current exchange rate.
To the extent a pricing service or dealer is unable to value a security or provides a valuation that Putnam Management does not believe accurately reflects the security’s fair value, the security will be valued at fair value by Putnam Management in accordance with policies and procedures approved by the Trustees. Certain investments, including certain restricted and illiquid securities and derivatives, are also valued at fair value following procedures approved by the Trustees. These valuations consider such factors as significant market or specific security events such as interest rate or credit quality changes, various relationships with other securities, discount rates, U.S. Treasury, U.S. swap and credit yields, index levels, convexity exposures, recovery rates, sales and other multiples and resale restrictions. These securities are classified as Level 2 or as Level 3 depending on the priority of the significant inputs.
To assess the continuing appropriateness of fair valuations, the Valuation Committee reviews and affirms the reasonableness of such valuations on a regular basis after considering all relevant information that is reasonably available. Such valuations and procedures are reviewed periodically by the Trustees. The fair value of securities is generally determined as the amount that the fund could reasonably expect to realize from an orderly disposition of such securities over a reasonable period of time. By its nature, a fair value price is a good faith estimate of the value of a security in a current sale and does not reflect an actual market price, which may be different by a material amount.
Security transactions and related investment income Security transactions are recorded on the trade date (the date the order to buy or sell is executed). Gains or losses on securities sold are determined on the identified cost basis.
Interest income, net of any applicable withholding taxes, if any, is recorded on the accrual basis. Dividend income, net of any applicable withholding taxes, is recognized on the ex-dividend date except that certain dividends from foreign securities, if any, are recognized as soon as the fund is informed of the ex-dividend date. Non-cash dividends, if any, are recorded at the fair value of the securities received. Dividends representing a return of capital or capital gains, if any, are reflected as a reduction of cost and/or as a realized gain.
The fund may have earned certain fees in connection with its senior loan purchasing activities. These fees, if any, are treated as market discount and are amortized into income in the Statement of operations.
Foreign currency translation The accounting records of the fund are maintained in U.S. dollars. The fair value of foreign securities, currency holdings, and other assets and liabilities is recorded in the books and records of the fund after translation to U.S. dollars based on the exchange rates on that day. The cost of each security is determined using historical exchange rates. Income and withholding taxes are translated at prevailing exchange rates when earned or incurred. The fund does not isolate that portion of realized or unrealized gains or losses resulting from changes in the foreign exchange rate on investments from fluctuations arising from changes in the market prices of the securities. Such gains and losses are included with the net realized and unrealized gain or loss on investments. Net realized gains and losses on foreign currency transactions represent net realized exchange gains or losses on disposition of foreign currencies, currency gains and losses realized between the trade and settlement dates on securities transactions and the difference between the amount of investment income and foreign withholding taxes recorded on the fund’s books and the U.S. dollar equivalent amounts actually received or paid. Net unrealized appreciation and depreciation of assets and liabilities in foreign currencies arise from changes in the value of assets and liabilities other than investments at the period end, resulting from changes in the exchange rate.
Forward currency contracts The fund buys and sells forward currency contracts, which are agreements between two parties to buy and sell currencies at a set price on a future date. These contracts are used for hedging currency exposures.
The U.S. dollar value of forward currency contracts is determined using current forward currency exchange rates supplied by a quotation service. The fair value of the contract will fluctuate with changes in currency exchange rates. The contract is marked to market daily and the change in fair value is recorded as an unrealized gain or loss. The fund records a realized gain or loss equal to the difference between the value of the contract at the time it was opened and the value at the time it was closed when the contract matures or by delivery of the currency. The fund could be exposed to risk if the value of the currency changes unfavorably, if the counterparties to the contracts are unable to meet the terms of their contracts or if the fund is unable to enter into a closing position. Risks may exceed amounts recognized on the Statement of assets and liabilities.
Forward currency contracts outstanding at period end, if any, are listed after the fund’s portfolio.
Credit default contracts The fund entered into OTC and/or centrally cleared credit default contracts for hedging credit risk, for gaining liquid exposure to individual names and for hedging market risk.
In OTC and centrally cleared credit default contracts, the protection buyer typically makes a periodic stream of payments to a counterparty, the protection seller, in exchange for the right to receive a contingent payment upon the occurrence of a credit event on the reference obligation or all other equally ranked obligations of the reference entity. Credit events are contract specific but may include bankruptcy, failure to pay, restructuring and obligation acceleration. For OTC credit default contracts, an upfront payment received by the fund is recorded as a liability on the fund’s books. An upfront payment made by the fund is recorded as an asset on the fund’s books. Centrally cleared credit default contracts provide the same rights to the protection buyer and seller except the payments between parties, including upfront premiums, are settled through a central clearing agent through variation margin payments. Upfront and periodic payments received or paid by the fund for OTC and centrally cleared credit default contracts are recorded as realized gains or losses at the reset date or close of the contract. The OTC and centrally cleared credit default contracts are marked to market daily based upon quotations from an independent pricing service or market makers. Any change in value of OTC credit default contracts is recorded as an unrealized gain or loss. Daily fluctuations in the value of centrally cleared credit default contracts are recorded in variation margin on the Statement of assets and liabilities and recorded as unrealized gain or loss. Upon the occurrence of a credit event, the difference between the par value and fair value of the reference obligation, net of any proportional amount of the upfront payment, is recorded as a realized gain or loss.
In addition to bearing the risk that the credit event will occur, the fund could be exposed to market risk due to unfavorable changes in interest rates or in the price of the underlying security or index or the possibility that the fund may be unable to close out its position at the same time or at the same price as if it had purchased the underlying reference obligations. In certain circumstances, the fund may enter into offsetting OTC and centrally cleared credit default contracts which would mitigate its risk of loss. Risks of loss may exceed amounts recognized on the Statement of assets and liabilities. The fund’s maximum risk of loss from counterparty risk, either as the protection seller or as the protection buyer, is the fair value of the contract. This risk may be mitigated for OTC credit default contracts by having a master netting arrangement between the fund and the counterparty and for centrally cleared credit default contracts through the daily exchange of variation margin. Counterparty risk is further mitigated with respect to centrally cleared credit default swap contracts due to the clearinghouse guarantee fund and other resources that are available in the event of a clearing member default. Where the fund is a seller of protection, the maximum potential amount of future payments the fund may be required to make is equal to the notional amount.
OTC and centrally cleared credit default contracts outstanding, including their respective notional amounts at period end, if any, are listed after the fund’s portfolio.
Master agreements The fund is a party to ISDA (International Swaps and Derivatives Association, Inc.) Master Agreements that govern OTC derivative and foreign exchange contracts and Master Securities Forward Transaction Agreements that govern transactions involving mortgage-backed and other asset-backed securities that may result in delayed delivery (Master Agreements) with certain counterparties entered into from time to time. The Master Agreements may contain provisions regarding, among other things, the parties’ general obligations, representations, agreements, collateral requirements, events of default and early termination. With respect to certain counterparties, in accordance with the terms of the Master Agreements, collateral pledged to the fund is held in a segregated account by the fund’s custodian and, with respect to those amounts which can be sold or repledged, are presented in the fund’s portfolio.
Collateral pledged by the fund is segregated by the fund’s custodian and identified in the fund’s portfolio. Collateral can be in the form of cash or debt securities issued by the U.S. Government or related agencies or other securities as agreed to by the fund and the applicable counterparty. Collateral requirements are determined based on the fund’s net position with each counterparty.
With respect to ISDA Master Agreements, termination events applicable to the fund may occur upon a decline in the fund’s net assets below a specified threshold over a certain period of time. Termination events applicable to counterparties may occur upon a decline in the counterparty’s long-term or short-term credit ratings below a specified level. In each case, upon occurrence, the other party may elect to terminate early and cause settlement of all derivative and foreign exchange contracts outstanding, including the payment of any losses and costs resulting from such early termination, as reasonably determined by the terminating party. Any decision by one or more of the fund’s counterparties to elect early termination could impact the fund’s future derivative activity.
At the close of the reporting period, the fund did not have a net liability position on open derivative contracts subject to the Master Agreements.
Interfund lending The fund, along with other Putnam funds, may participate in an interfund lending program pursuant to an exemptive order issued by the SEC. This program allows the fund to borrow from or lend to other Putnam funds that permit such transactions. Interfund lending transactions are subject to each fund’s investment policies and borrowing and lending limits. Interest earned or paid on the interfund lending transaction will be based on the average of certain current market rates. During the reporting period, the fund did not utilize the program.
Lines of credit The fund participates, along with other Putnam funds, in a $317.5 million unsecured committed line of credit and a $235.5 million unsecured uncommitted line of credit, both provided by State Street. Borrowings may be made for temporary or emergency purposes, including the funding of shareholder redemption requests and trade settlements. Interest is charged to the fund based on the fund’s borrowing at a rate equal to 1.25% plus the higher of (1) the Federal Funds rate and (2) the Overnight Bank Funding Rate (overnight LIBOR prior to October 16, 2020) for the committed line of credit and 1.30% plus the higher of (1) the Federal Funds rate and (2) the Overnight Bank Funding Rate (1.30% prior to October 16, 2020) for the uncommitted line of credit. A closing fee equal to 0.04% of the committed line of credit and 0.04% of the uncommitted line of credit has been paid by the participating funds. In addition, a commitment fee of 0.21% per annum on any unutilized portion of the committed line of credit is allocated to the participating funds based on their relative net assets and paid quarterly. During the reporting period, the fund had no borrowings against these arrangements.
Federal taxes It is the policy of the fund to distribute all of its taxable income within the prescribed time period and otherwise comply with the provisions of the Internal Revenue Code of 1986, as amended (the Code), applicable to regulated investment companies. It is also the intention of the fund to distribute an amount sufficient to avoid imposition of any excise tax under Section 4982 of the Code.
The fund is subject to the provisions of Accounting Standards Codification 740 Income Taxes (ASC 740). ASC 740 sets forth a minimum threshold for financial statement recognition of the benefit of a tax position taken or expected to be taken in a tax return. The fund did not have a liability to record for any unrecognized tax benefits in the accompanying financial statements. No provision has been made for federal taxes on income, capital gains or unrealized appreciation on securities held nor for excise tax on income and capital gains. Each of the fund’s federal tax returns for the prior three fiscal years remains subject to examination by the Internal Revenue Service.
The fund may also be subject to taxes imposed by governments of countries in which it invests. Such taxes are generally based on either income or gains earned or repatriated. The fund accrues and applies such taxes to net investment income, net realized gains and net unrealized gains as income and/or capital gains are earned. In some cases, the fund may be entitled to reclaim all or a portion of such taxes, and such reclaim amounts, if any, are reflected as an asset on the fund’s books. In many cases, however, the fund may not receive such amounts for an extended period of time, depending on the country of investment.
Under the Regulated Investment Company Modernization Act of 2010, the fund will be permitted to carry forward capital losses incurred for an unlimited period and the carry forwards will retain their character as either short-term or long-term capital losses. At November 30, 2020, the fund had the following capital loss carryovers available, to the extent allowed by the Code, to offset future net capital gain, if any:
| | |
| | Loss carryover | |
| Short-term | Long-term | Total |
| $9,002,354 | $119,228,157 | $128,230,511 |
Distributions to shareholders Distributions to shareholders from net investment income are recorded by the fund on the ex-dividend date. Distributions from capital gains, if any, are recorded on the ex-dividend date and paid at least annually. The amount and character of income and gains to be distributed are determined in accordance with income tax regulations, which may differ from generally accepted accounting principles. These differences include temporary and/or permanent differences from defaulted bond interest. Reclassifications are made to the fund’s capital accounts to reflect income and gains available for distribution (or available capital loss carryovers) under income tax regulations. At the close of the reporting period, the fund reclassified $228,647 to decrease undistributed net investment income and $228,647 to decrease accumulated net realized loss.
Tax cost of investments includes adjustments to net unrealized appreciation (depreciation) which may not necessarily be final tax cost basis adjustments, but closely approximate the tax basis unrealized gains and losses that may be realized and distributed to shareholders. The tax basis components of distributable earnings and the federal tax cost as of the close of the reporting period were as follows:
| |
| Unrealized appreciation | $64,478,648 |
| Unrealized depreciation | (26,182,979) |
| Net unrealized appreciation | 38,295,669 |
| Undistributed ordinary income | 9,040,673 |
| Capital loss carryforward | (128,230,511) |
| Cost for federal income tax purposes | $1,221,949,915 |
Note 2: Management fee, administrative services and other transactions
The fund pays Putnam Management a management fee (based on the fund’s average net assets and computed and paid monthly) at annual rates that may vary based on the average of the aggregate net assets of all open-end mutual funds sponsored by Putnam Management (excluding net assets of funds that are invested in, or that are invested in by, other Putnam funds to the extent necessary to avoid “double counting” of those assets). Such annual rates may vary as follows:
| | | | |
| 0.720% | of the first $5 billion, | | 0.520% | of the next $50 billion, |
| 0.670% | of the next $5 billion, | | 0.500% | of the next $50 billion, |
| 0.620% | of the next $10 billion, | | 0.490% | of the next $100 billion and |
| 0.570% | of the next $10 billion, | | 0.485% | of any excess thereafter. |
For the reporting period, the management fee represented an effective rate (excluding the impact from any expense waivers in effect) of 0.558% of the fund’s average net assets.
Putnam Management has contractually agreed, through March 30, 2022, to waive fees and/or reimburse the fund’s expenses to the extent necessary to limit the cumulative expenses of the fund, exclusive of brokerage, interest, taxes, investment-related expenses, extraordinary expenses, acquired fund fees and expenses and payments under the fund’s investor servicing contract, investment management contract and distribution plans, on a fiscal year-to-date basis to an annual rate of 0.20% of the fund’s average net assets over such fiscal year-to-date period. During the reporting period, the fund’s expenses were not reduced as a result of this limit.
Putnam Investments Limited (PIL), an affiliate of Putnam Management, is authorized by the Trustees to manage a separate portion of the assets of the fund as determined by Putnam Management from time to time. PIL did not manage any portion of the assets of the fund during the reporting period. If Putnam Management were to engage the services of PIL, Putnam Management would pay a quarterly sub-management fee to PIL for its services at an annual rate of 0.40% of the average net assets of the portion of the fund managed by PIL.
The fund reimburses Putnam Management an allocated amount for the compensation and related expenses of certain officers of the fund and their staff who provide administrative services to the fund. The aggregate amount of all such reimbursements is determined annually by the Trustees.
Custodial functions for the fund’s assets are provided by State Street. Custody fees are based on the fund’s asset level, the number of its security holdings and transaction volumes.
Putnam Investor Services, Inc., an affiliate of Putnam Management, provides investor servicing agent functions to the fund. Putnam Investor Services, Inc. received fees for investor servicing for class A, class B, class C, class M, class R and class Y shares that included (1) a per account fee for each direct and underlying non-defined contribution account (retail account) of the fund; (2) a specified rate of the fund’s assets attributable to defined contribution plan accounts; and (3) a specified rate based on the average net assets in retail accounts. Putnam Investor Services, Inc. has agreed that the aggregate investor servicing fees for each fund’s retail and defined contribution accounts for these share classes will not exceed an annual rate of 0.25% of the fund’s average assets attributable to such accounts.
Class R6 shares paid a monthly fee based on the average net assets of class R6 shares at an annual rate of 0.05%.
During the reporting period, the expenses for each class of shares related to investor servicing fees were as follows:
| | | | |
| Class A | $1,443,293 | | Class R | 31,376 |
| Class B | 12,663 | | Class R6 | 7,524 |
| Class C | 40,748 | | Class Y | 469,061 |
| Class M | 92,025 | | Total | $2,096,690 |
The fund has entered into expense offset arrangements with State Street whereby State Street’s fees are reduced by credits allowed on cash balances. For the reporting period, the fund’s expenses were reduced by $13,315 under the expense offset arrangements.
Each Independent Trustee of the fund receives an annual Trustee fee, of which $799, as a quarterly retainer, has been allocated to the fund, and an additional fee for each Trustees meeting attended. Trustees also are reimbursed for expenses they incur relating to their services as Trustees.
The fund has adopted a Trustee Fee Deferral Plan (the Deferral Plan) which allows the Trustees to defer the receipt of all or a portion of Trustees fees payable on or after July 1, 1995. The deferred fees remain invested in certain Putnam funds until distribution in accordance with the Deferral Plan.
The fund has adopted an unfunded noncontributory defined benefit pension plan (the Pension Plan) covering all Trustees of the fund who have served as a Trustee for at least five years and were first elected prior to 2004. Benefits under the Pension Plan are equal to 50% of the Trustee’s average annual attendance and retainer fees for the three years ended December 31, 2005. The retirement benefit is payable during a Trustee’s lifetime, beginning the year following retirement, for the number of years of service through December 31, 2006. Pension expense for the fund is included in Trustee compensation and expenses in the Statement of operations. Accrued pension liability is included in Payable for Trustee compensation and expenses in the Statement of assets and liabilities. The Trustees have terminated the Pension Plan with respect to any Trustee first elected after 2003.
The fund has adopted distribution plans (the Plans) with respect to the following share classes pursuant to Rule 12b–1 under the Investment Company Act of 1940. The purpose of the Plans is to compensate Putnam Retail Management Limited Partnership, an indirect wholly-owned subsidiary of Putnam Investments, LLC, for services provided and expenses incurred in distributing shares of the fund. The Plans provide payments by the fund to Putnam Retail Management Limited Partnership at an annual rate of up to the following amounts (Maximum %) of the average net assets attributable to each class. The Trustees have approved payment by the fund at the following annual rate (Approved %) of the average net assets attributable to each class. During the reporting period, the class-specific expenses related to distribution fees were as follows:
| | | |
| | Maximum % | Approved % | Amount |
| Class A | 0.35% | 0.25% | $2,145,729 |
| Class B | 1.00% | 1.00% | 75,159 |
| Class C | 1.00% | 1.00% | 242,552 |
| Class M | 1.00% | 0.50% | 274,179 |
| Class R | 1.00% | 0.50% | 93,328 |
| Total | | | $2,830,947 |
For the reporting period, Putnam Retail Management Limited Partnership, acting as underwriter, received net commissions of $47,547 and $0 from the sale of class A and class M shares, respectively, and received $647 and $264 in contingent deferred sales charges from redemptions of class B and class C shares, respectively.
A deferred sales charge of up to 1.00% is assessed on certain redemptions of class A shares. For the reporting period, Putnam Retail Management Limited Partnership, acting as underwriter, received $3,092 on class A redemptions.
Note 3: Purchases and sales of securities
During the reporting period, the cost of purchases and the proceeds from sales, excluding short-term investments, were as follows:
| | |
| | Cost of purchases | Proceeds from sales |
| Investments in securities (Long-term) | $553,273,053 | $603,843,165 |
| U.S. government securities (Long-term) | — | — |
| Total | $553,273,053 | $603,843,165 |
The fund may purchase or sell investments from or to other Putnam funds in the ordinary course of business, which can reduce the fund’s transaction costs, at prices determined in accordance with SEC requirements and policies approved by the Trustees. During the reporting period, purchases or sales of long-term securities from or to other Putnam funds, if any, did not represent more than 5% of the fund’s total cost of purchases and/or total proceeds from sales.
Note 4: Capital shares
At the close of the reporting period, there were an unlimited number of shares of beneficial interest authorized. Transactions, including, if applicable, direct exchanges pursuant to share conversions, in capital shares were as follows:
| | | | |
| | YEAR ENDED 11/30/20 | YEAR ENDED 11/30/19 |
| Class A | Shares | Amount | Shares | Amount |
| Shares sold | 35,431,385 | $199,500,217 | 36,869,287 | $211,824,007 |
| Shares issued in connection with | | | | |
| reinvestment of distributions | 6,739,814 | 37,434,061 | 6,851,756 | 39,299,346 |
| | 42,171,199 | 236,934,278 | 43,721,043 | 251,123,353 |
| Shares repurchased | (52,926,381) | (295,392,995) | (50,369,208) | (288,332,209) |
| Net decrease | (10,755,182) | $(58,458,717) | (6,648,165) | $(37,208,856) |
| |
| | YEAR ENDED 11/30/20 | YEAR ENDED 11/30/19 |
| Class B | Shares | Amount | Shares | Amount |
| Shares sold | 47,403 | $248,356 | 77,773 | $434,349 |
| Shares issued in connection with | | | | |
| reinvestment of distributions | 54,869 | 295,691 | 89,142 | 496,425 |
| | 102,272 | 544,047 | 166,915 | 930,774 |
| Shares repurchased | (894,616) | (4,836,499) | (986,131) | (5,501,954) |
| Net decrease | (792,344) | $(4,292,452) | (819,216) | $(4,571,180) |
| |
| | YEAR ENDED 11/30/20 | YEAR ENDED 11/30/19 |
| Class C | Shares | Amount | Shares | Amount |
| Shares sold | 3,256,270 | $17,505,687 | 3,133,023 | $17,419,213 |
| Shares issued in connection with | | | | |
| reinvestment of distributions | 183,482 | 986,956 | 240,369 | 1,332,651 |
| | 3,439,752 | 18,492,643 | 3,373,392 | 18,751,864 |
| Shares repurchased | (5,298,863) | (28,625,602) | (4,806,961) | (26,443,067) |
| Net decrease | (1,859,111) | $(10,132,959) | (1,433,569) | $(7,691,203) |
| |
| | YEAR ENDED 11/30/20 | YEAR ENDED 11/30/19 |
| Class M | Shares | Amount | Shares | Amount |
| Shares sold | 20,000 | $110,600 | 819,213 | $4,698,928 |
| Shares issued in connection with | | | | |
| reinvestment of distributions | — | — | 147,120 | 840,493 |
| | 20,000 | 110,600 | 966,333 | 5,539,421 |
| Shares repurchased | (727,383) | (4,175,042) | (4,990,174) | (28,607,473) |
| Net decrease | (707,383) | $(4,064,442) | (4,023,841) | $(23,068,052) |
| | | | |
| | YEAR ENDED 11/30/20 | YEAR ENDED 11/30/19 |
| Class R | Shares | Amount | Shares | Amount |
| Shares sold | 927,330 | $5,228,186 | 1,020,580 | $5,833,720 |
| Shares issued in connection with | | | | |
| reinvestment of distributions | 155,168 | 857,343 | 211,272 | 1,205,223 |
| | 1,082,498 | 6,085,529 | 1,231,852 | 7,038,943 |
| Shares repurchased | (2,291,378) | (12,816,981) | (1,962,230) | (11,159,571) |
| Net decrease | (1,208,880) | $(6,731,452) | (730,378) | $(4,120,628) |
| |
| | YEAR ENDED 11/30/20 | YEAR ENDED 11/30/19 |
| Class R6 | Shares | Amount | Shares | Amount |
| Shares sold | 677,403 | $4,022,188 | 426,269 | $2,589,557 |
| Shares issued in connection with | | | | |
| reinvestment of distributions | 127,736 | 749,683 | 123,841 | 748,948 |
| | 805,139 | 4,771,871 | 550,110 | 3,338,505 |
| Shares repurchased | (699,531) | (4,071,296) | (378,935) | (2,307,590) |
| Net increase | 105,608 | $700,575 | 171,175 | $1,030,915 |
| |
| | YEAR ENDED 11/30/20 | YEAR ENDED 11/30/19 |
| Class Y | Shares | Amount | Shares | Amount |
| Shares sold | 34,894,135 | $205,885,439 | 20,026,046 | $119,486,257 |
| Shares issued in connection with | | | | |
| reinvestment of distributions | 2,272,762 | 13,404,198 | 2,408,851 | 14,591,876 |
| | 37,166,897 | 219,289,637 | 22,434,897 | 134,078,133 |
| Shares repurchased | (39,963,797) | (236,821,716) | (12,211,099) | (73,624,084) |
| Net increase (decrease) | (2,796,900) | $(17,532,079) | 10,223,798 | $60,454,049 |
Note 5: Affiliated transactions
Transactions during the reporting period with any company which is under common ownership or control were as follows:
| | | | | |
| | | | | | Shares |
| | | | | | outstanding |
| | | | | | and fair |
| | Fair value as | Purchase | Sale | Investment | value as |
| Name of affiliate | of 11/30/19 | cost | proceeds | income | of 11/30/20 |
| Short-term investments | | | | | |
| Putnam Short Term | | | | | |
| Investment Fund* | $109,993,501 | $469,936,459 | $498,618,033 | $633,525 | $81,311,927 |
| Total Short-term | | | | | |
| investments | $109,993,501 | $469,936,459 | $498,618,033 | $633,525 | $81,311,927 |
* Management fees charged to Putnam Short Term Investment Fund have been waived by Putnam Management. There were no realized or unrealized gains or losses during the period.
Note 6: Market, credit and other risks
In the normal course of business, the fund trades financial instruments and enters into financial transactions where risk of potential loss exists due to changes in the market (market risk) or failure of the contracting party to the transaction to perform (credit risk). The fund may be exposed to additional credit risk that an institution or other entity with which the fund has unsettled or open transactions will default. Investments in foreign securities involve certain risks, including those related to economic instability, unfavorable political developments, and currency fluctuations. The fund may invest in higher-yielding, lower-rated bonds that may have a higher rate of default.
On July 27, 2017, the United Kingdom’s Financial Conduct Authority (“FCA”), which regulates LIBOR, announced a desire to phase out the use of LIBOR by the end of 2021. LIBOR has historically been a common benchmark interest rate index used to make adjustments to variable-rate loans. It is used throughout global banking and financial industries to determine interest rates for a variety of financial instruments and borrowing arrangements. The transition process might lead to increased volatility and illiquidity in markets that currently rely on LIBOR to determine interest rates. It could also lead to a reduction in the value of some LIBOR-based investments and reduce the effectiveness of new hedges placed against existing LIBOR-based investments. While some LIBOR-based instruments may contemplate a scenario where LIBOR is no longer available by providing for an alternative rate-setting methodology, not all may have such provisions and there may be significant uncertainty regarding the effectiveness of any such alternative methodologies. Since the usefulness of LIBOR as a benchmark could deteriorate during the transition period, these effects could occur prior to the end of 2021.
Beginning in January 2020, global financial markets have experienced, and may continue to experience, significant volatility resulting from the spread of a virus known as COVID–19. The outbreak of COVID–19 has resulted in travel and border restrictions, quarantines, supply chain disruptions, lower consumer demand, and general market uncertainty. The effects of COVID–19 have adversely affected, and may continue to adversely affect, the global economy, the economies of certain nations, and individual issuers, all of which may negatively impact the fund’s performance.
Note 7: Senior loan commitments
Senior loans are purchased or sold on a when-issued or delayed delivery basis and may be settled a month or more after the trade date, which from time to time can delay the actual investment of available cash balances; interest income is accrued based on the terms of the securities. Senior loans can be acquired through an agent, by assignment from another holder of the loan, or as a participation interest in another holder’s portion of the loan. When the fund invests in a loan or participation, the fund is subject to the risk that an intermediate participant between the fund and the borrower will fail to meet its obligations to the fund, in addition to the risk that the borrower under the loan may default on its obligations.
Note 8: Unfunded loan commitments
As of the close of the reporting period, the fund had unfunded loan commitments of $328,000, which could be extended at the option of the borrower, pursuant to the following loan agreements with the following borrower:
| |
| Borrower | Unfunded Commitments |
| CP Atlas Buyer, Inc. | $328,000 |
| Total | $328,000 |
Note 9: Summary of derivative activity
The volume of activity for the reporting period for any derivative type that was held during the period is listed below and was based on an average of the holdings at the end of each fiscal quarter:
| |
| Forward currency contracts (contract amount) | $4,700,000 |
| Centrally cleared credit default contracts (notional) | $30,300,000 |
| Warrants (number of warrants) | 170,000 |
The following is a summary of the fair value of derivative instruments as of the close of the reporting period:
| | | | |
| Fair value of derivative instruments as of the close of the reporting period | |
| | ASSET DERIVATIVES | LIABILITY DERIVATIVES |
| Derivatives not | | | | |
| accounted for as | Statement of | | Statement of | |
| hedging instruments | assets and | | assets and | |
| under ASC 815 | liabilities location | Fair value | liabilities location | Fair value |
| Foreign exchange | | | | |
| contracts | Receivables | $27,959 | Payables | $— |
| Equity contracts | Investments | 226,306 | Payables | — |
| Total | | $254,265 | | $— |
The following is a summary of realized and change in unrealized gains or losses of derivative instruments in the Statement of operations for the reporting period (Note 1):
| | | |
| Amount of realized gain or (loss) on derivatives recognized in net gain or (loss) on investments | |
| Derivatives not accounted for as hedging | Forward currency | | |
| instruments under ASC 815 | contracts | Swaps | Total |
| Credit contracts | $— | $(618,492) | $(618,492) |
| Foreign exchange contracts | (182,674) | — | (182,674) |
| Total | $(182,674) | $(618,492) | $(801,166) |
| |
| Change in unrealized appreciation or (depreciation) on derivatives recognized in net gain or (loss) | |
| on investments | | | |
| Derivatives not accounted for as hedging | | Forward currency | |
| instruments under ASC 815 | Warrants | contracts | Total |
| Foreign exchange contracts | $— | $165,594 | $165,594 |
| Equity contracts | (8,185) | — | (8,185) |
| Total | $(8,185) | $165,594 | $157,409 |
Note 10: Offsetting of financial and derivative assets and liabilities
The following table summarizes any derivatives, repurchase agreements and reverse repurchase agreements, at the end of the reporting period, that are subject to an enforceable master netting agreement or similar agreement. For securities lending transactions or borrowing transactions associated with securities sold short, if any, see Note 1. For financial reporting purposes, the fund does not offset financial assets and financial liabilities that are subject to the master netting agreements in the Statement of assets and liabilities.
| | | |
| | Goldman Sachs | State Street Bank | Total |
| | International | and Trust Co. | |
| Assets: | | | |
| Forward currency contracts# | $1,628 | $26,331 | $27,959 |
| Total Assets | $1,628 | $26,331 | $27,959 |
| Liabilities: | | | |
| Forward currency contracts# | — | — | — |
| Total Liabilities | $— | $— | $— |
| Total Financial and Derivative Net Assets | $1,628 | $26,331 | $27,959 |
| Total collateral received (pledged)†## | $— | $— | |
| Net amount | $1,628 | $26,331 | |
| Controlled collateral received (including TBA | | | |
| commitments)** | $— | $— | $— |
| Uncontrolled collateral received | $— | $— | $— |
| Collateral (pledged) (including TBA commitments)** | $— | $— | $— |
** Included with Investments in securities on the Statement of assets and liabilities.
† Additional collateral may be required from certain brokers based on individual agreements.
# Covered by master netting agreement (Note 1).
## Any over-collateralization of total financial and derivative net assets is not shown. Collateral may include amounts related to unsettled agreements.
Note 11: New accounting pronouncements
In March 2017, the Financial Accounting Standards Board (FASB) issued Accounting Standards Update (ASU) 2017-08, Receivables — Nonrefundable Fees and Other Costs (Subtopic 310-20): Premium Amortization on Purchased Callable Debt Securities. The amendments in ASU 2017-08 shorten the amortization period for certain callable debt securities held at a premium, to be amortized to the earliest call date. ASU 2017-08 is effective for fiscal years and interim periods within those fiscal years beginning after December 15, 2018. The adoption of these amendments is not material to the financial statements.
In March 2020, FASB issued ASU 2020-04, Reference Rate Reform (Topic 848) — Facilitation of the Effects of Reference Rate Reform on Financial Reporting. The amendments in ASU 2020-04 provide optional temporary financial reporting relief from the effect of certain types of contract modifications due to the planned discontinuation of LIBOR and other interbank-offered based reference rates as of the end of 2021. ASU 2020-04 is effective for certain reference rate-related contract modifications that occur during the period March 12, 2020 through December 31, 2022. Management is currently evaluating the impact, if any, of applying this provision.
Note 12: Change in independent accountants (Unaudited)
On March 20, 2020, the Audit, Compliance and Risk Committee of the Trustees of the Putnam Funds approved and recommended the decision to change the Fund’s independent accountant and to not retain KPMG LLP, and on April 3, 2020, upon request of the Putnam Funds, KPMG LLP provided a letter of resignation. During the two previous fiscal years, KPMG LLP audit reports contained no adverse opinion or disclaimer of opinion; nor were its reports qualified or modified as to uncertainty, audit scope, or accounting principle. Further, in connection with its audits for the two previous fiscal years and the subsequent interim period through April 3, 2020: (i) there were no disagreements with KPMG LLP on any matter of accounting principles or practices, financial statement disclosure, or auditing scope or procedure, which disagreements if not resolved to the satisfaction of KPMG LLP would have caused it to make reference to the subject matter of the disagreements in its report on the Fund’s financial statements for such years, and (ii) there were no “reportable events” of the kind described in Item 304(a)(1)(v) of Regulation S-K under the Securities Act of 1933, as amended, and the Securities Exchange Act of 1934, as amended.
On April 17, 2020, the Audit, Compliance and Risk Committee of the Trustees of the Putnam Funds approved and recommended the decision to appoint PricewaterhouseCoopers LLP as the Fund’s independent accountant.
Federal tax information (Unaudited)
The fund designated 1.05% of ordinary income distributions as qualifying for the dividends received deduction for corporations.
For the reporting period, the fund hereby designates 1.05%, or the maximum amount allowable, of its taxable ordinary income distributions as qualified dividends taxed at the individual net capital gain rates.
For the reporting period, pursuant to §871(k) of the Internal Revenue Code, the fund hereby designates $44,621,910 of distributions paid as qualifying to be taxed as interest-related dividends.
The Form 1099 that will be mailed to you in January 2021 will show the tax status of all distributions paid to your account in calendar 2020.


* Mr. Reynolds is an “interested person” (as defined in the Investment Company Act of 1940) of the fund and Putnam Investments. He is President and Chief Executive Officer of Putnam Investments, as well as the President of your fund and each of the other Putnam funds.
The address of each Trustee is 100 Federal Street, Boston, MA 02110.
As of November 30, 2020, there were 96 Putnam funds. All Trustees serve as Trustees of all Putnam funds.
Each Trustee serves for an indefinite term, until his or her resignation, retirement at age 75, removal, or death.
Officers
In addition to Robert L. Reynolds, the other officers of the fund are shown below:
| |
| Robert T. Burns (Born 1961) | Richard T. Kircher (Born 1962) |
| Vice President and Chief Legal Officer | Vice President and BSA Compliance Officer |
| Since 2011 | Since 2019 |
| General Counsel, Putnam Investments, | Assistant Director, Operational Compliance, Putnam |
| Putnam Management, and Putnam Retail Management | Investments and Putnam Retail Management |
| |
| James F. Clark (Born 1974) | Susan G. Malloy (Born 1957) |
| Vice President and Chief Compliance Officer | Vice President and Assistant Treasurer |
| Since 2016 | Since 2007 |
| Chief Compliance Officer and Chief Risk Officer, | Head of Accounting and Middle Office Services, |
| Putnam Investments and Chief Compliance Officer, | Putnam Investments and Putnam Management |
| Putnam Management |
| Denere P. Poulack (Born 1968) |
| Nancy E. Florek (Born 1957) | Assistant Vice President, Assistant Clerk, |
| Vice President, Director of Proxy Voting and Corporate | and Assistant Treasurer |
| Governance, Assistant Clerk, and Assistant Treasurer | Since 2004 |
| Since 2000 |
| Janet C. Smith (Born 1965) |
| Michael J. Higgins (Born 1976) | Vice President, Principal Financial Officer, Principal |
| Vice President, Treasurer, and Clerk | Accounting Officer, and Assistant Treasurer |
| Since 2010 | Since 2007 |
| | Head of Fund Administration Services, |
| Jonathan S. Horwitz (Born 1955) | Putnam Investments and Putnam Management |
| Executive Vice President, Principal Executive Officer, | |
| and Compliance Liaison | Mark C. Trenchard (Born 1962) |
| Since 2004 | Vice President |
| | Since 2002 |
| | Director of Operational Compliance, Putnam |
| | Investments and Putnam Retail Management |
The principal occupations of the officers for the past five years have been with the employers as shown above, although in some cases they have held different positions with such employers. The address of each officer is 100 Federal Street, Boston, MA 02110.
Putnam family of funds
The following is a list of Putnam’s open-end mutual funds offered to the public. Investors should carefully consider the investment objective, risks, charges, and expenses of a fund before investing. For a prospectus, or a summary prospectus if available, containing this and other information for any Putnam fund or product, contact your financial advisor or call Putnam Investor Services at 1-800-225-1581. Please read the prospectus carefully before investing.
| |
| Blend | Income |
| Emerging Markets Equity Fund | Convertible Securities Fund |
| Focused Equity Fund | Diversified Income Trust |
| Global Equity Fund | Floating Rate Income Fund |
| International Capital Opportunities Fund | Global Income Trust |
| International Equity Fund | Government Money Market Fund* |
| Multi-Cap Core Fund | High Yield Fund |
| Research Fund | Income Fund |
| Money Market Fund† |
| Global Sector | Mortgage Opportunities Fund |
| Global Health Care Fund | Mortgage Securities Fund |
| Global Technology Fund | Short Duration Bond Fund |
| | Ultra Short Duration Income Fund |
| Growth | |
| Growth Opportunities Fund | Tax-free Income |
| Small Cap Growth Fund | Intermediate-Term Municipal Income Fund |
| Sustainable Future Fund | Short-Term Municipal Income Fund |
| Sustainable Leaders Fund | Strategic Intermediate Municipal Fund |
| | Tax Exempt Income Fund |
| Value | Tax-Free High Yield Fund |
| Equity Income Fund | |
| International Value Fund | State tax-free income funds‡: |
| Small Cap Value Fund | California, Massachusetts, Minnesota, |
| | New Jersey, New York, Ohio, and Pennsylvania. |
| | |
| |
| Absolute Return | Asset Allocation (cont.) |
| Fixed Income Absolute Return Fund | Putnam Retirement Advantage Maturity Fund |
| Multi-Asset Absolute Return Fund | Putnam Retirement Advantage 2060 Fund |
| Putnam Retirement Advantage 2055 Fund |
| Putnam PanAgora** | Putnam Retirement Advantage 2050 Fund |
| Putnam PanAgora Managed Futures Strategy | Putnam Retirement Advantage 2045 Fund |
| Putnam PanAgora Market Neutral Fund | Putnam Retirement Advantage 2040 Fund |
| Putnam PanAgora Risk Parity Fund | Putnam Retirement Advantage 2035 Fund |
| | Putnam Retirement Advantage 2030 Fund |
| Asset Allocation | Putnam Retirement Advantage 2025 Fund |
| Dynamic Risk Allocation Fund | |
| George Putnam Balanced Fund | RetirementReady® Maturity Fund |
| RetirementReady® 2060 Fund |
| Dynamic Asset Allocation Balanced Fund | RetirementReady® 2055 Fund |
| Dynamic Asset Allocation Conservative Fund | RetirementReady® 2050 Fund |
| Dynamic Asset Allocation Growth Fund | RetirementReady® 2045 Fund |
| | RetirementReady® 2040 Fund |
| | RetirementReady® 2035 Fund |
| | RetirementReady® 2030 Fund |
| | RetirementReady® 2025 Fund |
* You could lose money by investing in the fund. Although the fund seeks to preserve the value of your investment at $1.00 per share, it cannot guarantee it will do so. An investment in the fund is not insured or guaranteed by the Federal Deposit Insurance Corporation or any other government agency. The fund’s sponsor has no legal obligation to provide financial support to the fund, and you should not expect that the sponsor will provide financial support to the fund at any time.
† You could lose money by investing in the fund. Although the fund seeks to preserve the value of your investment at $1.00 per share, it cannot guarantee it will do so. The fund may impose a fee upon sale of your shares or may temporarily suspend your ability to sell shares if the fund’s liquidity falls below required minimums because of market conditions or other factors. An investment in the fund is not insured or guaranteed by the Federal Deposit Insurance Corporation or any other government agency. The fund’s sponsor has no legal obligation to provide financial support to the fund, and you should not expect that the sponsor will provide financial support to the fund at any time.
‡ Not available in all states.
** Sub-advised by PanAgora Asset Management.
Check your account balances and the most recent month-end performance in the Individual Investors section at putnam.com.
Fund information
Founded over 80 years ago, Putnam Investments was built around the concept that a balance between risk and reward is the hallmark of a well-rounded financial program. We manage funds across income, value, blend, growth, sustainable, asset allocation, absolute return, and global sector categories.
| | |
| Investment Manager | Trustees | Michael J. Higgins |
| Putnam Investment | Kenneth R. Leibler, Chair | Vice President, Treasurer, |
| Management, LLC | Liaquat Ahamed | and Clerk |
| 100 Federal Street | Ravi Akhoury | |
| Boston, MA 02110 | Barbara M. Baumann | Jonathan S. Horwitz |
| | Katinka Domotorffy | Executive Vice President, |
| Investment Sub-Advisor | Catharine Bond Hill | Principal Executive Officer, |
| Putnam Investments Limited | Paul L. Joskow | and Compliance Liaison |
| 16 St James’s Street | George Putnam, III | |
| London, England SW1A 1ER | Robert L. Reynolds | Richard T. Kircher |
| | Manoj P. Singh | Vice President and BSA |
| Marketing Services | Mona K. Sutphen | Compliance Officer |
| Putnam Retail Management | | |
| 100 Federal Street | Officers | Susan G. Malloy |
| 100 Federal Street | Robert L. Reynolds | Vice President and |
| President | Assistant Treasurer |
| Custodian | | |
| State Street Bank | Robert T. Burns | Denere P. Poulack |
| and Trust Company | Vice President and | Assistant Vice President, Assistant |
| Chief Legal Officer | Clerk, and Assistant Treasurer |
| Legal Counsel | | |
| Ropes & Gray LLP | James F. Clark | Janet C. Smith |
| Vice President, Chief Compliance | Vice President, |
| Independent Registered | Officer, and Chief Risk Officer | Principal Financial Officer, |
| Public Accounting Firm | | Principal Accounting Officer, |
| PricewaterhouseCoopers LLP | Nancy E. Florek | and Assistant Treasurer |
| | Vice President, Director of | |
| | Proxy Voting and Corporate | Mark C. Trenchard |
| | Governance, Assistant Clerk, | Vice President |
| | and Assistant Treasurer | |
This report is for the information of shareholders of Putnam High Yield Fund. It may also be used as sales literature when preceded or accompanied by the current prospectus, the most recent copy of Putnam’s Quarterly Performance Summary, and Putnam’s Quarterly Ranking Summary. For more recent performance, please visit putnam.com. Investors should carefully consider the investment objectives, risks, charges, and expenses of a fund, which are described in its prospectus. For this and other information or to request a prospectus or summary prospectus, call 1-800-225-1581 toll free. Please read the prospectus carefully before investing. The fund’s Statement of Additional Information contains additional information about the fund’s Trustees and is available without charge upon request by calling 1-800-225-1581.

| |
| (a) The fund's principal executive, financial and accounting officers are employees of Putnam Investment Management, LLC, the Fund's investment manager. As such they are subject to a comprehensive Code of Ethics adopted and administered by Putnam Investments which is designed to protect the interests of the firm and its clients. The Fund has adopted a Code of Ethics which incorporates the Code of Ethics of Putnam Investments with respect to all of its officers and Trustees who are employees of Putnam Investment Management, LLC. For this reason, the Fund has not adopted a separate code of ethics governing its principal executive, financial and accounting officers. |
| |
| Item 3. Audit Committee Financial Expert: |
| |
| The Funds' Audit, Compliance and Risk Committee is comprised solely of Trustees who are “independent” (as such term has been defined by the Securities and Exchange Commission (“SEC”) in regulations implementing Section 407 of the Sarbanes-Oxley Act (the “Regulations”)). The Trustees believe that each member of the Audit, Compliance and Risk Committee also possesses a combination of knowledge and experience with respect to financial accounting matters, as well as other attributes, that qualifies him or her for service on the Committee. In addition, the Trustees have determined that each of Dr. Hill, Dr. Joskow, and Mr. Singh qualifies as an “audit committee financial expert” (as such term has been defined by the Regulations) based on their review of his or her pertinent experience and education; in the case of Dr. Joskow, including his experience serving on the audit committees of several public companies and institutions and his education and experience as an economist who studies companies and industries, routinely using public company financial statements in his research. The SEC has stated, and the funds' amended and restated agreement and Declaration of Trust provides, that the designation or identification of a person as an audit committee financial expert pursuant to this Item 3 of Form N-CSR does not impose on such person any duties, obligations or liability that are greater than the duties, obligations and liability imposed on such person as a member of the Audit, Compliance and Risk Committee and the Board of Trustees in the absence of such designation or identification. |
| |
| Item 4. Principal Accountant Fees and Services: |
| |
| The following table presents fees billed in each of the last two fiscal years for services rendered to the fund by the fund's independent auditor: |
| | | | | |
| Fiscal year ended | Audit Fees | Audit-Related Fees | Tax Fees | All Other Fees |
|
|
| | | | | |
| November 30, 2020 | $105,222 | $ — | $7,538 | $ — |
| November 30, 2019 | $102,023 | $ — | $5,295 | $ — |
| |
| For the fiscal years ended November 30, 2020 and November 30, 2019, the fund's independent auditor billed aggregate non-audit fees in the amounts of $353,380 and $5,295 respectively, to the fund, Putnam Management and any entity controlling, controlled by or under common control with Putnam Management that provides ongoing services to the fund. |
| |
| Audit Fees represent fees billed for the fund's last two fiscal years relating to the audit and review of the financial statements included in annual reports and registration statements, and other services that are normally provided in connection with statutory and regulatory filings or engagements. |
| |
| Audit-Related Fees represent fees billed in the fund's last two fiscal years for services traditionally performed by the fund's auditor, including accounting consultation for proposed transactions or concerning financial accounting and reporting standards and other audit or attest services not required by statute or regulation. |
| |
| Tax Fees represent fees billed in the fund's last two fiscal years for tax compliance, tax planning and tax advice services. Tax planning and tax advice services include assistance with tax audits, employee benefit plans and requests for rulings or technical advice from taxing authorities. |
| |
| Pre-Approval Policies of the Audit, Compliance and Risk Committee. The Audit, Compliance and Risk Committee of the Putnam funds has determined that, as a matter of policy, all work performed for the funds by the funds' independent auditors will be pre-approved by the Committee itself and thus will generally not be subject to pre-approval procedures. |
| |
| The Audit, Compliance and Risk Committee also has adopted a policy to pre-approve the engagement by Putnam Management and certain of its affiliates of the funds' independent auditors, even in circumstances where pre-approval is not required by applicable law. Any such requests by Putnam Management or certain of its affiliates are typically submitted in writing to the Committee and explain, among other things, the nature of the proposed engagement, the estimated fees, and why this work should be performed by that particular audit firm as opposed to another one. In reviewing such requests, the Committee considers, among other things, whether the provision of such services by the audit firm are compatible with the independence of the audit firm. |
| |
| The following table presents fees billed by the fund's independent auditor for services required to be approved pursuant to paragraph (c)(7)(ii) of Rule 2–01 of Regulation S-X. |
| | | | | |
| Fiscal year ended | Audit-Related Fees | Tax Fees | All Other Fees | Total Non-Audit Fees |
|
|
| November 30, 2020 | $ — | $345,842 | $ — | $ — |
| November 30, 2019 | $ — | $ — | $ — | $ — |
| |
| Item 5. Audit Committee of Listed Registrants |
| |
| Item 6. Schedule of Investments: |
| |
| The registrant's schedule of investments in unaffiliated issuers is included in the report to shareholders in Item 1 above. |
| |
| Item 7. Disclosure of Proxy Voting Policies and Procedures For Closed-End Management Investment Companies: |
| |
| Item 8. Portfolio Managers of Closed-End Investment Companies |
| |
| Item 9. Purchases of Equity Securities by Closed-End Management Investment Companies and Affiliated Purchasers: |
| |
| Item 10. Submission of Matters to a Vote of Security Holders: |
| |
| Item 11. Controls and Procedures: |
| |
| (a) The registrant's principal executive officer and principal financial officer have concluded, based on their evaluation of the effectiveness of the design and operation of the registrant's disclosure controls and procedures as of a date within 180 days of the filing date of this report, that the design and operation of such procedures are generally effective to provide reasonable assurance that information required to be disclosed by the registrant in this report is recorded, processed, summarized and reported within the time periods specified in the Commission's rules and forms. |
| |
| (b) Changes in internal control over financial reporting: Not applicable |
| |
| Item 12. Disclosures of Securities Lending Activities for Closed-End Management Investment Companies: |
| |
| (a)(1) The Code of Ethics of The Putnam Funds, which incorporates the Code of Ethics of Putnam Investments, is filed herewith. |
| |
| Pursuant to the requirements of the Securities Exchange Act of 1934 and the Investment Company Act of 1940, the registrant has duly caused this report to be signed on its behalf by the undersigned, thereunto duly authorized. |
| |
| By (Signature and Title): |
| |
| /s/ Janet C. Smith
Janet C. Smith
Principal Accounting Officer
|
| |
| Pursuant to the requirements of the Securities Exchange Act of 1934 and the Investment Company Act of 1940, this report has been signed below by the following persons on behalf of the registrant and in the capacities and on the dates indicated. |
| |
| By (Signature and Title): |
| |
| /s/ Jonathan S. Horwitz
Jonathan S. Horwitz
Principal Executive Officer
|
| |
| By (Signature and Title): |
| |
| /s/ Janet C. Smith
Janet C. Smith
Principal Financial Officer
|