| | |
| UNITED STATES
SECURITIES AND EXCHANGE COMMISSION |
| | |
| CERTIFIED SHAREHOLDER REPORT OF REGISTERED
MANAGEMENT INVESTMENT COMPANIES
|
| | |
| Investment Company Act file number: | (811-04616) |
| | |
| Exact name of registrant as specified in charter: | Putnam High Yield Fund |
| | |
| Address of principal executive offices: | 100 Federal Street, Boston, Massachusetts 02110 |
| | |
| Name and address of agent for service: | Stephen Tate, Vice President
100 Federal Street
Boston, Massachusetts 02110 |
| | |
| Copy to: | Bryan Chegwidden, Esq.
Ropes & Gray LLP
1211 Avenue of the Americas
New York, New York 10036 |
| | |
| Registrant’s telephone number, including area code: | (617) 292-1000 |
| | |
| Date of fiscal year end: | November 30, 2022 |
| | |
| Date of reporting period: | December 1, 2021 – May 31, 2022 |
| | |
|
Item 1. Report to Stockholders: | |
| | |
| The following is a copy of the report transmitted to stockholders pursuant to Rule 30e-1 under the Investment Company Act of 1940: | |
Putnam
High Yield
Fund
Semiannual report
5 | 31 | 22
Message from the Trustees
July 7, 2022
Dear Fellow Shareholder:
Financial markets in the first half of 2022 have tested the patience of investors. High inflation and rising interest rates have clouded the outlook for the U.S. economy. The Russia-Ukraine War has disrupted global energy markets, while pandemic-driven lockdowns in China have slowed global growth.
These issues, which are important to monitor and may persist for some time, are likely shorter term in nature than your long-term financial goals. History has shown that markets eventually recover from downturns. At Putnam, dedicated and experienced investors are working for you. They are evaluating risks while trying to achieve strong performance for your fund. Learn more in the interview with your fund manager(s) in the following pages.
Thank you for investing with Putnam.

Current performance may be lower or higher than the quoted past performance, which cannot guarantee future results. Share price, principal value, and return will fluctuate, and you may have a gain or a loss when you sell your shares. Performance of class A shares assumes reinvestment of distributions and does not account for taxes. Fund returns in the bar chart do not reflect a sales charge of 4.00%; had they, returns would have been lower. See below and pages 8–10 for additional performance information. For a portion of the periods, the fund had expense limitations, without which returns would have been lower. To obtain the most recent month-end performance, visit putnam.com.
Returns for periods of less than one year are not annualized.
Lipper peer group average is provided by Lipper, a Refinitiv company.
* The fund’s benchmark, the JPMorgan Developed High Yield Index, was introduced on 12/31/94, which post-dates the inception of the fund’s class A shares.

This comparison shows your fund’s performance in the context of broad market indexes for the six months ended 5/31/22. See above and pages 8–10 for additional fund performance information. Index descriptions can be found on pages 14–15.
All Bloomberg indices are provided by Bloomberg Index Services Limited.

Rob, what was the fund’s investment environment like during the six months ended May 31, 2022?
It was a volatile period for high-yield corporate credit. The period started on a high note, as the asset class registered its strongest monthly gain of 2021, returning 1.98% in December. This came as concerns about the severity of the Omicron coronavirus variant receded. As we moved into the new year, however, a hawkish policy pivot by the U.S. Federal Reserve in the face of rapidly rising inflation, combined with Russia’s invasion of Ukraine, fueled a flight from risk. A resurgence of Covid-19 in China and accompanying lockdowns added to investor nervousness.
Within this environment, credit spreads widened and interest rates rose. [Spreads are the yield advantage high-yield corporate bonds offer over comparable-maturity U.S. Treasuries. Bond prices rise as yield spreads tighten and decline as spreads widen.] The yield on the benchmark 10-year U.S. Treasury rose from 1.43% at the start of the period to 2.85% at the end. In anticipation of Fed policy changes, short-term yields rose even more, causing the yield curve to flatten materially.
Credit qualities are shown as a percentage of the fund’s net assets as of 5/31/22. A bond rated BBB or higher (A-3 or higher, for short-term debt) is considered investment grade. This chart reflects the highest security rating provided by one or more of Standard & Poor’s, Moody’s, and Fitch. Ratings and portfolio credit quality will vary over time.
Cash and net other assets, if any, represent the market value weights of cash, derivatives, and short-term securities in the portfolio. The fund itself has not been rated by an independent rating agency.
This table shows the fund’s top 10 individual holdings and the percentage of the fund’s net assets that each represented as of 5/31/22. Short-term investments, to-be-announced (TBA) commitments, and derivatives, if any, are excluded. Holdings may vary over time.
Within the high-yield market specifically, following December’s robust advance, the asset class slumped, posting a return of –2.64%, its worst January return on record. The market downturn persisted in February, with high yield returning –0.79%, as investors continued to forecast an aggressive pace of Fed interest-rate hikes.
In March, oil prices spiked early in the month and interest rates rose further. Despite this, high-yield spreads tightened as investors sought to capitalize on more attractive valuations, particularly among mid-tier and higher-quality bonds.
April brought another drubbing, with high-yield credit dropping sharply [–3.39%]. Concerns began to grow about whether the U.S. economy and corporate earnings could withstand aggressive Fed tightening and rising risks to global growth.
The asset class finished the period with a slight gain in May, as investors once again looked to take advantage of more appealing valuations following April’s tumble.
Within the fund’s benchmark, all cohorts registered losses. Retail [–10%], cable & satellite TV [–9%], and automotive [–9%] were the weakest performers. Energy [–1%] and metals & mining [–4%] held up better and outperformed the benchmark. This wasn’t surprising, given that Russia’s invasion of Ukraine fueled a broad rally in commodities from oil to wheat and metals. From a credit-rating perspective, mid-tier bonds rated B or split B, and higher-quality credits rated BB, did the best, reflecting increased demand from investors during March and again in May.
The fund trailed the benchmark and the average return for its Lipper peer group. What factors had the biggest influence on the fund’s relative performance during the period?
Adverse overall positioning in broadcasting, along with security selection in health care and services, worked against relative performance. Conversely, lower-than-benchmark exposure to retail and food & beverages added the most value versus the benchmark.

In terms of individual holdings, overweight positions in pharmaceutical company Bausch Health Americas, radio station operator Audacy, and financial services provider Ally Financial were the primary relative detractors. On the plus side, greater-than-benchmark investments in energy exploration and production companies Antero Resources and Oasis Petroleum aided relative performance, as did an overweight allocation in oil and gas drilling contractor Nabors Industries.
What is the team’s near-term outlook?
We have a moderately constructive outlook, with a positive view of high-yield market fundamentals and the overall supply/demand backdrop. Valuations have improved, with credit spreads approximately 85 basis points wider year to date through May 31, and the benchmark’s average yield exceeding 7%. That said, we have seen volatility in spreads as market participants react to statements by Fed governors, as well as geopolitical developments.
Our favorable stance is tempered by concerns about global economic growth and tightening monetary policy. We anticipate continued bouts of volatility given the ongoing conflict in Ukraine, the pace of Fed rate hikes, and potentially negative effects on energy supplies from sanctions on Russia. We’re also concerned about lingering supply-chain disruptions, especially in light of the recent Covid-19 upsurge in China. There is also considerable uncertainty surrounding the Fed’s efforts to contain inflation without pushing the U.S. economy into recession.
Within this context, we continue to closely monitor issuers’ balance sheets and their ability to generate free cash flow. We’re also assessing which issuers appear best positioned to weather a period of slower economic growth.
As of May 31, default risk in the U.S. high-yield market remained low. Including distressed exchanges, the default rate ended the period at 0.72%, well below the long-term average of 3.8%.
As for supply/demand dynamics, net new issuance of high-yield debt [net of issuance for refinancing purposes] totaled $33.6 billion for the year-to-date period through May. This was less than half the net new issuance during the first five months of last year. On the demand side, high-yield funds [mutual funds and exchange-traded funds] experienced outflows of $36.6 billion year to date, versus outflows of $11.8 billion during the same period in 2021. In short, supply was lower but so was demand.
How was the fund positioned as of May 31?
Relative to the benchmark, the portfolio had overweight exposure to the higher- and lower-quality areas of the market and an underweight allocation in mid-tier bonds. From an industry perspective, we favored energy, broadcasting, diversified media, technology, and housing. The fund had underweight exposure to retail; food & beverages; gaming, lodging & leisure; automotive; and transportation.
The views expressed in this report are exclusively those of Putnam Management and are subject to change. They are not meant as investment advice.
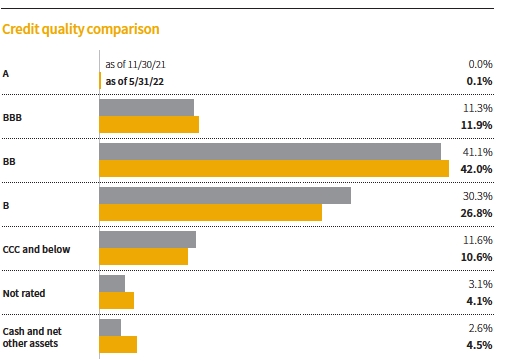
This chart shows how the fund’s credit quality has changed over the past six months. Credit qualities are shown as a percentage of the fund’s net assets. A bond rated BBB or higher (A-3 or higher, for short-term debt) is considered investment grade. This chart reflects the highest security rating provided by one or more of Standard & Poor’s, Moody’s, and Fitch. Ratings and portfolio credit quality will vary over time.
Cash and net other assets, if any, represent the market value weights of cash, derivatives, and short-term securities in the portfolio. The fund itself has not been rated by an independent rating agency.
Please note that the holdings discussed in this report may not have been held by the fund for the entire period. Portfolio composition is subject to review in accordance with the fund’s investment strategy and may vary in the future. Current and future portfolio holdings are subject to risk. Statements in the Q&A concerning the fund’s performance or portfolio composition relative to those of the fund’s Lipper peer group may reference information produced by Lipper Inc. or through a third party.
Of special interest
The fund had no direct exposure to Russian or Ukrainian securities or markets at the end of the period. We are closely monitoring governmental actions, including the issuance of sanctions, and related market developments.
Your fund’s performance
This section shows your fund’s performance, price, and distribution information for periods ended May 31, 2022, the end of the first half of its current fiscal year. In accordance with regulatory requirements for mutual funds, we also include performance information as of the most recent calendar quarter-end and expense information taken from the fund’s current prospectus. Performance should always be considered in light of a fund’s investment strategy. Data represent past performance. Past performance does not guarantee future results. More recent returns may be less or more than those shown. Investment return and principal value will fluctuate, and you may have a gain or a loss when you sell your shares. Performance information does not reflect any deduction for taxes a shareholder may owe on fund distributions or on the redemption of fund shares. For the most recent month-end performance, please visit the Individual Investors section at putnam.com or call Putnam at 1-800-225-1581. Class M, R, R6, and Y shares are not available to all investors. See the Terms and definitions section in this report for definitions of the share classes offered by your fund.
Annualized fund performance Total return for periods ended 5/31/22
| | | | | | |
| | Life of fund | 10 years | 5 years | 3 years | 1 year | 6 months |
| Class A (3/25/86) | | | | | | |
| Before sales charge | 6.79% | 4.52% | 2.82% | 2.67% | –5.56% | –6.11% |
| After sales charge | 6.67 | 4.09 | 1.99 | 1.28 | –9.34 | –9.87 |
| Class B (5/16/94) | | | | | | |
| Before CDSC | 6.58 | 3.88 | 2.09 | 1.92 | –6.11 | –6.49 |
| After CDSC | 6.58 | 3.88 | 1.75 | 1.00 | –10.64 | –11.07 |
| Class C (3/30/07) | | | | | | |
| Before CDSC | 6.61 | 3.88 | 2.08 | 1.89 | –6.11 | –6.49 |
| After CDSC | 6.61 | 3.88 | 2.08 | 1.89 | –7.02 | –7.41 |
| Class M (12/1/94) | | | | | | |
| Before sales charge | 6.51 | 4.26 | 2.59 | 2.41 | –5.62 | –6.24 |
| After sales charge | 6.41 | 3.91 | 1.91 | 1.29 | –8.69 | –9.29 |
| Class R (3/30/07) | | | | | | |
| Net asset value | 6.53 | 4.26 | 2.59 | 2.40 | –5.62 | –6.24 |
| Class R6 (5/22/18) | | | | | | |
| Net asset value | 6.99 | 4.78 | 3.10 | 3.05 | –5.05 | –5.90 |
| Class Y (12/31/98) | | | | | | |
| Net asset value | 6.99 | 4.78 | 3.08 | 2.89 | –5.22 | –6.13 |
Current performance may be lower or higher than the quoted past performance, which cannot guarantee future results. After-sales-charge returns for class A and M shares reflect the deduction of the maximum 4.00% and 3.25% sales charge, respectively, levied at the time of purchase. Class B share returns after contingent deferred sales charge (CDSC) reflect the applicable CDSC, which is 5% in the first year, declining over time to 1% in the sixth year, and is eliminated thereafter. Class C share returns after CDSC reflect a 1% CDSC for the first year that is eliminated thereafter. Class R, R6, and Y shares have no initial sales charge or CDSC. Performance for class B, C, M, R, and Y shares before their inception is derived from the historical performance of class A shares, adjusted for the applicable sales charge (or CDSC) and the higher operating expenses for such shares, except for class Y shares, for which 12b-1 fees are not applicable. Performance for class R6 shares prior to their inception is derived from the historical performance of class Y shares and has not been adjusted for the lower investor servicing fees applicable to class R6 shares; had it, returns would have been higher.
Returns for periods of less than one year are not annualized.
For a portion of the periods, the fund had expense limitations, without which returns would have been lower.
Class B and C share performance reflects conversion to class A shares after eight years.
Comparative annualized index returns For periods ended 5/31/22
| | | | | | |
| | Life of fund | 10 years | 5 years | 3 years | 1 year | 6 months |
| JPMorgan Developed High | | | | | | |
| Yield Index* | — | 5.54% | 3.59% | 3.31% | –4.50% | –5.43% |
| Lipper High Yield Funds | | | | | | |
| category average† | 6.91% | 4.54 | 2.95 | 2.85 | –5.04 | –5.80 |
Index and Lipper results should be compared with fund performance before sales charge, before CDSC, or at net asset value.
Returns for periods of less than one year are not annualized.
Lipper peer group average is provided by Lipper, a Refinitiv company.
* The fund’s benchmark, the JPMorgan Developed High Yield Index, was introduced on 12/31/94, which post-dates the inception of the fund’s class A shares.
† Over the 6-month, 1-year, 3-year, 5-year, 10-year, and life-of-fund periods ended 5/31/22, there were 527, 516, 485, 435, 296, and 13 funds, respectively, in this Lipper category.
Fund price and distribution information For the six-month period ended 5/31/22
| | | | | | | | | |
| Distributions | Class A | Class B | Class C | Class M | Class R | Class R6 | Class Y |
| Number | 6 | 6 | 6 | 6 | 6 | 6 | 6 |
| Income | $0.126 | $0.105 | $0.107 | $0.120 | $0.120 | $0.138 | $0.132 |
| Capital gains | — | — | — | — | — | — | — |
| Total | $0.126 | $0.105 | $0.107 | $0.120 | $0.120 | $0.138 | $0.132 |
| | Before | After | Net | Net | Before | After | Net | Net | Net |
| | sales | sales | asset | asset | sales | sales | asset | asset | asset |
| Share value | charge | charge | value | value | charge | charge | value | value | value |
| 11/30/21 | $5.86 | $6.10 | $5.68 | $5.65 | $5.83 | $6.03 | $5.83 | $6.21 | $6.24 |
| 5/31/22 | 5.38 | 5.60 | 5.21 | 5.18 | 5.35 | 5.53 | 5.35 | 5.71 | 5.73 |
| | Before | After | Net | Net | Before | After | Net | Net | Net |
| Current rate | sales | sales | asset | asset | sales | sales | asset | asset | asset |
| (end of period) | charge | charge | value | value | charge | charge | value | value | value |
| Current dividend | | | | | | | | | |
| rate1 | 4.68% | 4.50% | 4.15% | 4.17% | 4.49% | 4.34% | 4.49% | 4.83% | 4.61% |
| Current 30-day | | | | | | | | | |
| SEC yield2 | N/A | 5.54 | 5.02 | 5.01 | N/A | 5.33 | 5.51 | 6.12 | 6.01 |
The classification of distributions, if any, is an estimate. Before-sales-charge share value and current dividend rate for class A and M shares, if applicable, do not take into account any sales charge levied at the time of purchase. After-sales-charge share value, current dividend rate, and current 30-day SEC yield, if applicable, are calculated assuming that the maximum sales charge (4.00% for class A shares and 3.25% for class M shares) was levied at the time of purchase. Final distribution information will appear on your year-end tax forms.
1 Most recent distribution, including any return of capital and excluding capital gains, annualized and divided by share price before or after sales charge at period-end.
2 Based only on investment income and calculated using the maximum offering price for each share class, in accordance with SEC guidelines.
Annualized fund performance as of most recent calendar quarter
Total return for periods ended 6/30/22
| | | | | | |
| | Life of fund | 10 years | 5 years | 3 years | 1 year | 6 months |
| Class A (3/25/86) | | | | | | |
| Before sales charge | 6.57% | 3.58% | 1.46% | –0.39% | –12.91% | –14.01% |
| After sales charge | 6.45 | 3.16 | 0.63 | –1.73 | –16.39 | –17.45 |
| Class B (5/16/94) | | | | | | |
| Before CDSC | 6.36 | 2.95 | 0.69 | –1.15 | –13.63 | –14.29 |
| After CDSC | 6.36 | 2.95 | 0.36 | –2.04 | –17.79 | –18.49 |
| Class C (3/30/07) | | | | | | |
| Before CDSC | 6.39 | 2.95 | 0.71 | –1.14 | –13.51 | –14.34 |
| After CDSC | 6.39 | 2.95 | 0.71 | –1.14 | –14.34 | –15.18 |
| Class M (12/1/94) | | | | | | |
| Before sales charge | 6.29 | 3.32 | 1.22 | –0.66 | –13.16 | –14.18 |
| After sales charge | 6.19 | 2.98 | 0.55 | –1.74 | –15.98 | –16.97 |
| Class R (3/30/07) | | | | | | |
| Net asset value | 6.31 | 3.32 | 1.21 | –0.66 | –13.15 | –14.03 |
| Class R6 (5/22/18) | | | | | | |
| Net asset value | 6.77 | 3.82 | 1.70 | –0.08 | –12.64 | –13.99 |
| Class Y (12/31/98) | | | | | | |
| Net asset value | 6.77 | 3.84 | 1.72 | –0.16 | –12.61 | –13.87 |
See the discussion following the fund performance table on page 8 for information about the calculation of fund performance.
Returns for periods of less than one year are not annualized.
Your fund’s expenses
As a mutual fund investor, you pay ongoing expenses, such as management fees, distribution fees (12b-1 fees), and other expenses. In the most recent six-month period, your fund’s expenses were limited; had expenses not been limited, they would have been higher. Using the following information, you can estimate how these expenses affect your investment and compare them with the expenses of other funds. You may also pay one-time transaction expenses, including sales charges (loads) and redemption fees, which are not shown in this section and would have resulted in higher total expenses. For more information, see your fund’s prospectus or talk to your financial representative.
Expense ratios
| | | | | | | |
| | Class A | Class B | Class C | Class M | Class R | Class R6 | Class Y |
| Total annual operating expenses for the | | | | | | | |
| fiscal year ended 11/30/21* | 1.01% | 1.76% | 1.76% | 1.26% | 1.26% | 0.66% | 0.76% |
| Annualized expense ratio for the | | | | | | | |
| six-month period ended 5/31/22†‡ | 1.03% | 1.78% | 1.78% | 1.28% | 1.28% | 0.67% | 0.78% |
Fiscal year expense information in this table is taken from the most recent prospectus, is subject to change, and may differ from that shown for the annualized expense ratio and in the financial highlights of this report.
Expenses are shown as a percentage of average net assets.
† Expense ratios for each class are for the fund’s most recent fiscal half year. As a result of this, ratios may differ from expense ratios based on one-year data in the financial highlights.
‡ Includes one-time annualized proxy cost of 0.01%.
Expenses per $1,000
The following table shows the expenses you would have paid on a $1,000 investment in each class of the fund from 12/1/21 to 5/31/22. It also shows how much a $1,000 investment would be worth at the close of the period, assuming actual returns and expenses.
| | | | | | | |
| | Class A | Class B | Class C | Class M | Class R | Class R6 | Class Y |
| Expenses paid per $1,000*† | $4.98 | $8.59 | $8.59 | $6.18 | $6.18 | $3.24 | $3.77 |
| Ending value (after expenses) | $938.90 | $935.10 | $935.10 | $937.60 | $937.60 | $941.00 | $938.70 |
* Expenses for each share class are calculated using the fund’s annualized expense ratio for each class, which represents the ongoing expenses as a percentage of average net assets for the six months ended 5/31/22. The expense ratio may differ for each share class.
† Expenses are calculated by multiplying the expense ratio by the average account value for the period; then multiplying the result by the number of days in the period (182); and then dividing that result by the number of days in the year (365).
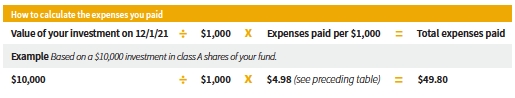
Estimate the expenses you paid
To estimate the ongoing expenses you paid for the six months ended 5/31/22, use the following calculation method. To find the value of your investment on 12/1/21, call Putnam at 1-800-225-1581.
Compare expenses using the SEC’s method
The Securities and Exchange Commission (SEC) has established guidelines to help investors assess fund expenses. Per these guidelines, the following table shows your fund’s expenses based on a $1,000 investment, assuming a hypothetical 5% annualized return. You can use this information to compare the ongoing expenses (but not transaction expenses or total costs) of investing in the fund with those of other funds. All mutual fund shareholder reports will provide this information to help you make this comparison. Please note that you cannot use this information to estimate your actual ending account balance and expenses paid during the period.
| | | | | | | |
| | Class A | Class B | Class C | Class M | Class R | Class R6 | Class Y |
| Expenses paid per $1,000*† | $5.19 | $8.95 | $8.95 | $6.44 | $6.44 | $3.38 | $3.93 |
| Ending value (after expenses) | $1,019.80 | $1,016.06 | $1,016.06 | $1,018.55 | $1,018.55 | $1,021.59 | $1,021.04 |
* Expenses for each share class are calculated using the fund’s annualized expense ratio for each class, which represents the ongoing expenses as a percentage of average net assets for the six months ended 5/31/22. The expense ratio may differ for each share class.
† Expenses are calculated by multiplying the expense ratio by the average account value for the six-month period; then multiplying the result by the number of days in the six-month period (182); and then dividing that result by the number of days in the year (365).
Consider these risks before investing
The value of investments in the fund’s portfolio may fall or fail to rise over extended periods of time for a variety of reasons, including general economic, political, or financial market conditions; investor sentiment and market perceptions; government actions; geopolitical events or changes; and factors related to a specific issuer, geography, industry, or sector. These and other factors may lead to increased volatility and reduced liquidity in the fund’s portfolio holdings.
Lower-rated bonds may offer higher yields in return for more risk. Bond investments are subject to interest-rate risk (the risk of bond prices falling if interest rates rise) and credit risk (the risk of an issuer defaulting on interest or principal payments). Interest-rate risk is generally greater for longer-term bonds, and credit risk is generally greater for below-investment-grade bonds (a significant part of the fund’s investments). Risks associated with derivatives include increased investment exposure (which may be considered leverage) and, in the case of over-the-counter instruments, the potential inability to terminate or sell derivatives positions and the potential failure of the other party to the instrument to meet its obligations. Unlike bonds, funds that invest in bonds have fees and expenses.
Our investment techniques, analyses, and judgments may not produce the outcome we intend. The investments we select for the fund may not perform as well as other securities that we do not select for the fund. We, or the fund’s other service providers, may experience disruptions or operating errors that could have a negative effect on the fund. You can lose money by investing in the fund.
Terms and definitions
Important terms
Total return shows how the value of the fund’s shares changed over time, assuming you held the shares through the entire period and reinvested all distributions in the fund.
Before sales charge, or net asset value, is the price, or value, of one share of a mutual fund, without a sales charge. Before-sales-charge figures fluctuate with market conditions. They are calculated by dividing the net assets of each class of shares by the number of outstanding shares in the class.
After sales charge is the price of a mutual fund share plus the maximum sales charge levied at the time of purchase. After-sales-charge performance figures shown here assume the 4.00% maximum sales charge for class A shares and 3.25% for class M shares.
Contingent deferred sales charge (CDSC) is generally a charge applied at the time of the redemption of class B or C shares and assumes redemption at the end of the period. Your fund’s class B CDSC declines over time from a 5% maximum during the first year to 1% during the sixth year. After the sixth year, the CDSC no longer applies. The CDSC for class C shares is 1% for one year after purchase.
Share classes
Class A shares are generally subject to an initial sales charge and no CDSC (except on certain redemptions of shares bought without an initial sales charge).
Class B shares are closed to new investments and are only available by exchange from class B shares of another Putnam fund or through dividend and/or capital gains reinvestment. They are not subject to an initial sales charge and may be subject to a CDSC.
Class C shares are not subject to an initial sales charge and are subject to a CDSC only if the shares are redeemed during the first year.
Class M shares have a lower initial sales charge and a higher 12b-1 fee than class A shares and no CDSC. They are only available to individuals purchasing shares of the fund from Japanese distributors that have selling agreements with Putnam Retail Management.
Class R shares are not subject to an initial sales charge or CDSC and are only available to employer-sponsored retirement plans.
Class R6 shares are not subject to an initial sales charge or CDSC and carry no 12b-1 fee. They are generally only available to employer-sponsored retirement plans, corporate and institutional clients, and clients in other approved programs.
Class Y shares are not subject to an initial sales charge or CDSC and carry no 12b-1 fee. They are generally only available to corporate and institutional clients and clients in other approved programs.
Fixed income terms
Current rate is the annual rate of return earned from dividends or interest of an investment. Current rate is expressed as a percentage of the price of a security, fund share, or principal investment.
Yield curve is a graph that plots the yields of bonds with equal credit quality against their differing maturity dates, ranging from shortest to longest. It is used as a benchmark for other debt, such as mortgage or bank lending rates.
Comparative indexes
Bloomberg U.S. Aggregate Bond Index is an unmanaged index of U.S. investment-grade fixed income securities.
ICE BofA (Intercontinental Exchange Bank of America) U.S. 3-Month Treasury Bill Index is an unmanaged index that seeks to measure the performance of U.S. Treasury bills available in the marketplace.
JPMorgan Developed High Yield Index is an unmanaged index of high-yield fixed income securities issued in developed countries.
S&P 500® Index is an unmanaged index of common stock performance.
Indexes assume reinvestment of all distributions and do not account for fees. Securities and performance of a fund and an index will differ. You cannot invest directly in an index.
BLOOMBERG® is a trademark and service mark of Bloomberg Finance L.P. and its affiliates (collectively “Bloomberg”). Bloomberg or Bloomberg’s licensors own all proprietary rights in the Bloomberg Indices. Neither Bloomberg nor Bloomberg’s licensors approve or endorse this material, or guarantee the accuracy or completeness of any information herein, or make any warranty, express or implied, as to the results to be obtained therefrom, and to the maximum extent allowed by law, neither shall have any liability or responsibility for injury or damages arising in connection therewith.
ICE Data Indices, LLC (“ICE BofA”), used with permission. ICE BofA permits use of the ICE BofA indices and related data on an “as is” basis; makes no warranties regarding same; does not guarantee the suitability, quality, accuracy, timeliness, and/or completeness of the ICE BofA indices or any data included in, related to, or derived therefrom; assumes no liability in connection with the use of the foregoing; and does not sponsor, endorse, or recommend Putnam Investments, or any of its products or services.
Lipper, a Refinitiv company, is a third-party industry-ranking entity that ranks mutual funds. Its rankings do not reflect sales charges. Lipper rankings are based on total return at net asset value relative to other funds that have similar current investment styles or objectives as determined by Lipper. Lipper may change a fund’s category assignment at its discretion. Lipper category averages reflect performance trends for funds within a category.
Other information for shareholders
Important notice regarding delivery of shareholder documents
In accordance with Securities and Exchange Commission (SEC) regulations, Putnam sends a single notice of internet availability, or a single printed copy, of annual and semiannual shareholder reports, prospectuses, and proxy statements to Putnam shareholders who share the same address, unless a shareholder requests otherwise. If you prefer to receive your own copy of these documents, please call Putnam at 1-800-225-1581, and Putnam will begin sending individual copies within 30 days.
Proxy voting
Putnam is committed to managing our mutual funds in the best interests of our shareholders. The Putnam funds’ proxy voting guidelines and procedures, as well as information regarding how your fund voted proxies relating to portfolio securities during the 12-month period ended June 30, 2021, are available in the Individual Investors section of putnam.com and on the SEC’s website, www.sec.gov. If you have questions about finding forms on the SEC’s website, you may call the SEC at 1-800-SEC-0330. You may also obtain the Putnam funds’ proxy voting guidelines and procedures at no charge by calling Putnam’s Shareholder Services at 1-800-225-1581.
Fund portfolio holdings
The fund will file a complete schedule of its portfolio holdings with the SEC for the first and third quarters of each fiscal year on Form N-PORT within 60 days of the end of such fiscal quarter. Shareholders may obtain the fund’s Form N-PORT on the SEC’s website at www.sec.gov.
Prior to its use of Form N-PORT, the fund filed its complete schedule of its portfolio holdings with the SEC on Form N-Q, which is available online at www.sec.gov.
Trustee and employee fund ownership
Putnam employees and members of the Board of Trustees place their faith, confidence, and, most importantly, investment dollars in Putnam mutual funds. As of May 31, 2022, Putnam employees had approximately $488,000,000 and the Trustees had approximately $71,000,000 invested in Putnam mutual funds. These amounts include investments by the Trustees’ and employees’ immediate family members as well as investments through retirement and deferred compensation plans.
Liquidity risk management program
Putnam, as the administrator of the fund’s liquidity risk management program (appointed by the Board of Trustees), presented the most recent annual report on the program to the Trustees in April 2022. The report covered the structure of the program, including the program documents and related policies and procedures adopted to comply with Rule 22e-4 under the Investment Company Act of 1940, and reviewed the operation of the program from January 2021 through December 2021. The report included a description of the annual liquidity assessment of the fund that Putnam performed in November 2021. The report noted that there were no material compliance exceptions identified under Rule 22e-4 during the period. The report included a review of the governance of the program and the methodology for classification of the fund’s investments. The report also included a discussion of liquidity monitoring during the period, including during the market liquidity challenges caused by the Covid-19 pandemic, and the impact those challenges had on the liquidity of the fund’s investments. Putnam concluded that the program has been operating effectively and adequately to ensure compliance with Rule 22e-4.
Financial statements
These sections of the report, as well as the accompanying Notes, constitute the fund’s financial statements.
The fund’s portfolio lists all the fund’s investments and their values as of the last day of the reporting period. Holdings are organized by asset type and industry sector, country, or state to show areas of concentration and diversification.
Statement of assets and liabilities shows how the fund’s net assets and share price are determined. All investment and non-investment assets are added together. Any unpaid expenses and other liabilities are subtracted from this total. The result is divided by the number of shares to determine the net asset value per share, which is calculated separately for each class of shares. (For funds with preferred shares, the amount subtracted from total assets includes the liquidation preference of preferred shares.)
Statement of operations shows the fund’s net investment gain or loss. This is done by first adding up all the fund’s earnings — from dividends and interest income — and subtracting its operating expenses to determine net investment income (or loss). Then, any net gain or loss the fund realized on the sales of its holdings — as well as any unrealized gains or losses over the period — is added to or subtracted from the net investment result to determine the fund’s net gain or loss for the fiscal period.
Statement of changes in net assets shows how the fund’s net assets were affected by the fund’s net investment gain or loss, by distributions to shareholders, and by changes in the number of the fund’s shares. It lists distributions and their sources (net investment income or realized capital gains) over the current reporting period and the most recent fiscal year-end. The distributions listed here may not match the sources listed in the Statement of operations because the distributions are determined on a tax basis and may be paid in a different period from the one in which they were earned. Dividend sources are estimated at the time of declaration. Actual results may vary. Any non-taxable return of capital cannot be determined until final tax calculations are completed after the end of the fund’s fiscal period.
Financial highlights provide an overview of the fund’s investment results, per-share distributions, expense ratios, net investment income ratios, and portfolio turnover in one summary table, reflecting the five most recent reporting periods. In a semiannual report, the highlights table also includes the current reporting period.
| | |
| The fund’s portfolio 5/31/22 (Unaudited) | | |
|
| | | |
| CORPORATE BONDS AND NOTES (84.2%)* | Principal
amount | Value |
| Advertising and marketing services (0.8%) |
| Clear Channel Outdoor Holdings, Inc. 144A company guaranty sr. notes 5.125%, 8/15/27 | | $1,500,000 | $1,378,350 |
| Clear Channel Outdoor Holdings, Inc. 144A company guaranty sr. unsec. sub. notes 7.75%, 4/15/28 | | 1,720,000 | 1,443,235 |
| Clear Channel Outdoor Holdings, Inc. 144A sr. unsec. notes 7.50%, 6/1/29 | | 1,685,000 | 1,362,002 |
| Terrier Media Buyer, Inc. 144A company guaranty sr. unsec. notes 8.875%, 12/15/27 | | 4,540,000 | 4,120,050 |
| | | 8,303,637 |
| Automotive (1.4%) |
| Ford Motor Co. sr. unsec. unsub. notes 3.625%, 6/17/31 | | 1,380,000 | 1,193,148 |
| Ford Motor Co., LLC sr. unsec. unsub. notes 2.90%, 2/10/29 | | 700,000 | 598,661 |
| Ford Motor Credit Co., LLC sr. unsec. unsub. notes 5.113%, 5/3/29 | | 2,210,000 | 2,153,910 |
| Ford Motor Credit Co., LLC sr. unsec. unsub. notes 2.90%, 2/16/28 | | 1,510,000 | 1,330,106 |
| Ford Motor Credit Co., LLC sr. unsec. unsub. notes 4.00%, 11/13/30 | | 6,509,000 | 5,858,100 |
| General Motors Financial Co., Inc. jr. unsec. sub. FRN 5.75%, perpetual maturity | | 570,000 | 497,821 |
| NESCO Holdings II, Inc. 144A company guaranty notes 5.50%, 4/15/29 | | 2,260,000 | 2,039,650 |
| Volkswagen International Finance NV company guaranty jr. unsec. sub. FRN 4.625%, perpetual maturity (Germany) | EUR | 300,000 | 311,195 |
| | | 13,982,591 |
| Basic materials (7.8%) |
| ArcelorMittal SA sr. unsec. unsub. notes 7.00%, 10/15/39 (France) | | $3,165,000 | 3,422,156 |
| Axalta Coating Systems, LLC 144A company guaranty sr. unsec. notes 3.375%, 2/15/29 | | 2,515,000 | 2,211,427 |
| Axalta Coating Systems, LLC/Axalta Coating Systems Dutch Holding B BV 144A company guaranty sr. unsec. notes 4.75%, 6/15/27 | | 275,000 | 261,938 |
| Beacon Roofing Supply, Inc. 144A company guaranty sr. notes 4.50%, 11/15/26 | | 1,312,000 | 1,272,640 |
| Beacon Roofing Supply, Inc. 144A sr. unsec. unsub. notes 4.125%, 5/15/29 | | 880,000 | 775,406 |
| Big River Steel, LLC/BRS Finance Corp. 144A sr. notes 6.625%, 1/31/29 | | 1,796,000 | 1,803,966 |
| Boise Cascade Co. 144A company guaranty sr. unsec. notes 4.875%, 7/1/30 | | 1,700,000 | 1,576,718 |
| Builders FirstSource, Inc. 144A company guaranty sr. unsec. bonds 4.25%, 2/1/32 | | 2,130,000 | 1,899,364 |
| BWAY Holding Co. 144A sr. unsec. notes 7.25%, 4/15/25 | | 1,475,000 | 1,425,588 |
| CF Industries, Inc. company guaranty sr. unsec. bonds 5.15%, 3/15/34 | | 450,000 | 461,964 |
| CF Industries, Inc. company guaranty sr. unsec. bonds 4.95%, 6/1/43 | | 3,010,000 | 2,889,600 |
| Commercial Metals Co. sr. unsec. notes 4.375%, 3/15/32 | | 680,000 | 597,729 |
| Commercial Metals Co. sr. unsec. notes 4.125%, 1/15/30 | | 985,000 | 894,618 |
| Compass Minerals International, Inc. 144A company guaranty sr. unsec. notes 6.75%, 12/1/27 | | 3,295,000 | 3,113,936 |
| | | |
| CORPORATE BONDS AND NOTES (84.2%)* cont. | Principal
amount | Value |
| Basic materials cont. |
| Constellium NV 144A company guaranty sr. unsec. notes 5.875%, 2/15/26 (France) | | $542,000 | $541,323 |
| Constellium SE 144A sr. unsec. notes 5.625%, 6/15/28 (France) | | 1,150,000 | 1,102,620 |
| CP Atlas Buyer, Inc. 144A sr. unsec. notes 7.00%, 12/1/28 | | 945,000 | 774,900 |
| First Quantum Minerals, Ltd. 144A company guaranty sr. unsec. notes 7.50%, 4/1/25 (Canada) | | 1,935,000 | 1,950,127 |
| First Quantum Minerals, Ltd. 144A company guaranty sr. unsec. notes 6.875%, 3/1/26 (Canada) | | 2,845,000 | 2,854,246 |
| Freeport-McMoRan, Inc. company guaranty sr. unsec. bonds 4.625%, 8/1/30 (Indonesia) | | 1,135,000 | 1,097,908 |
| Freeport-McMoRan, Inc. company guaranty sr. unsec. unsub. notes 5.45%, 3/15/43 (Indonesia) | | 1,431,000 | 1,407,575 |
| Graphic Packaging International, LLC 144A company guaranty sr. unsec. notes 3.75%, 2/1/30 | | 1,420,000 | 1,271,771 |
| Graphic Packaging International, LLC 144A sr. unsec. notes 3.50%, 3/15/28 | | 1,075,000 | 998,557 |
| Herens Holdco SARL 144A company guaranty sr. notes 4.75%, 5/15/28 (Luxembourg) | | 3,915,000 | 3,384,439 |
| Ingevity Corp. 144A company guaranty sr. unsec. notes 3.875%, 11/1/28 | | 1,790,000 | 1,622,188 |
| Intelligent Packaging Holdco Issuer LP 144A sr. unsec. notes 9.00%, 1/15/26 (Canada) ‡‡ | | 1,385,000 | 1,312,288 |
| Intelligent Packaging, Ltd., Finco, Inc./Intelligent Packaging, Ltd. Co-Issuer, LLC 144A sr. notes 6.00%, 9/15/28 (Canada) | | 1,800,000 | 1,665,000 |
| Kleopatra Holdings 2 SCA company guaranty sr. unsec. notes Ser. REGS, 6.50%, 9/1/26 (Luxembourg) | EUR | 1,600,000 | 1,141,416 |
| LSF11 A5 HoldCo, LLC 144A sr. unsec. notes 6.625%, 10/15/29 | | $2,565,000 | 2,193,075 |
| Mauser Packaging Solutions Holding Co. 144A sr. notes 8.50%, 4/15/24 | | 1,115,000 | 1,112,213 |
| Mauser Packaging Solutions Holding Co. 144A sr. notes 5.50%, 4/15/24 | | 1,500,000 | 1,481,550 |
| Mercer International, Inc. sr. unsec. notes 5.125%, 2/1/29 (Canada) | | 1,890,000 | 1,738,800 |
| Novelis Corp. 144A company guaranty sr. unsec. bonds 3.875%, 8/15/31 | | 465,000 | 405,713 |
| Novelis Corp. 144A company guaranty sr. unsec. notes 4.75%, 1/30/30 | | 1,575,000 | 1,494,281 |
| Novelis Corp. 144A company guaranty sr. unsec. notes 3.25%, 11/15/26 | | 465,000 | 426,558 |
| Nufarm Australia, Ltd./Nufarm Americas, Inc. 144A sr. unsec. notes 5.00%, 1/27/30 (Australia) | | 510,000 | 464,100 |
| Olympus Water US Holding Corp. 144A sr. notes 4.25%, 10/1/28 | | 1,715,000 | 1,562,159 |
| Olympus Water US Holding Corp. 144A sr. unsec. notes 6.25%, 10/1/29 | | 3,200,000 | 2,522,931 |
| PMHC II, Inc. 144A sr. unsec. notes 9.00%, 2/15/30 | | 2,505,000 | 1,878,750 |
| SCIH Salt Holdings, Inc. 144A sr. notes 4.875%, 5/1/28 | | 2,851,000 | 2,648,522 |
| SCIH Salt Holdings, Inc. 144A sr. unsec. notes 6.625%, 5/1/29 | | 1,055,000 | 944,225 |
| SCIL IV, LLC/SCIL USA Holdings, LLC 144A sr. notes 5.375%, 11/1/26 | | 1,695,000 | 1,576,350 |
| Sylvamo Corp. 144A company guaranty sr. unsec. notes 7.00%, 9/1/29 | | 3,030,000 | 2,969,400 |
| Taseko Mines, Ltd. 144A company guaranty sr. notes 7.00%, 2/15/26 (Canada) | | 1,535,000 | 1,474,275 |
| | | |
| CORPORATE BONDS AND NOTES (84.2%)* cont. | Principal
amount | Value |
| Basic materials cont. |
| TMS International Holding Corp. 144A sr. unsec. notes 6.25%, 4/15/29 | | $2,695,000 | $2,154,642 |
| Trinseo Materials Operating SCA/Trinseo Materials Finance, Inc. 144A company guaranty sr. unsec. notes 5.125%, 4/1/29 (Luxembourg) | | 2,940,000 | 2,454,900 |
| Tronox, Inc. 144A company guaranty sr. unsec. notes 4.625%, 3/15/29 | | 3,010,000 | 2,761,675 |
| WR Grace Holdings, LLC 144A company guaranty sr. notes 5.625%, 10/1/24 | | 955,000 | 950,225 |
| WR Grace Holdings, LLC 144A company guaranty sr. notes 4.875%, 6/15/27 | | 1,650,000 | 1,542,371 |
| WR Grace Holdings, LLC 144A sr. unsec. notes 5.625%, 8/15/29 | | 2,125,000 | 1,742,500 |
| | | 80,230,623 |
| Broadcasting (3.6%) |
| Beasley Mezzanine Holdings, LLC 144A company guaranty sr. notes 8.625%, 2/1/26 | | 3,465,000 | 2,997,225 |
| Diamond Sports Group, LLC/Diamond Sports Finance Co. 144A company guaranty notes 5.375%, 8/15/26 | | 4,059,000 | 1,339,470 |
| Entercom Media Corp. 144A company guaranty notes 6.75%, 3/31/29 | | 2,250,000 | 1,403,438 |
| Entercom Media Corp. 144A company guaranty notes 6.50%, 5/1/27 | | 1,864,000 | 1,215,701 |
| Gray Escrow II, Inc. 144A sr. unsec. bonds 5.375%, 11/15/31 | | 5,450,000 | 4,963,397 |
| iHeartCommunications, Inc. company guaranty sr. unsec. notes 8.375%, 5/1/27 | | 3,390,667 | 3,178,750 |
| Paramount Global jr. unsec. sub. FRB 6.375%, 3/30/62 | | 100,000 | 95,051 |
| Scripps Escrow II, Inc. 144A sr. notes 3.875%, 1/15/29 | | 1,275,000 | 1,153,748 |
| Scripps Escrow II, Inc. 144A sr. unsec. bonds 5.375%, 1/15/31 | | 1,459,000 | 1,278,288 |
| Scripps Escrow, Inc. 144A company guaranty sr. unsec. notes 5.875%, 7/15/27 | | 1,090,000 | 1,031,816 |
| Sinclair Television Group, Inc. 144A sr. bonds 4.125%, 12/1/30 | | 1,145,000 | 973,250 |
| Sirius XM Radio, Inc. 144A company guaranty sr. unsec. bonds 3.875%, 9/1/31 | | 3,442,000 | 3,026,275 |
| Sirius XM Radio, Inc. 144A company guaranty sr. unsec. notes 4.00%, 7/15/28 | | 1,450,000 | 1,344,658 |
| Sirius XM Radio, Inc. 144A sr. unsec. bonds 5.50%, 7/1/29 | | 1,340,000 | 1,331,015 |
| Spanish Broadcasting System, Inc. 144A sr. notes 9.75%, 3/1/26 | | 1,740,000 | 1,616,634 |
| Townsquare Media, Inc. 144A sr. notes 6.875%, 2/1/26 | | 2,135,000 | 2,063,712 |
| Univision Communications, Inc. 144A company guaranty sr. notes 9.50%, 5/1/25 | | 1,286,000 | 1,338,105 |
| Univision Communications, Inc. 144A company guaranty sr. notes 6.625%, 6/1/27 | | 2,400,000 | 2,425,680 |
| Univision Communications, Inc. 144A company guaranty sr. notes 4.50%, 5/1/29 | | 1,150,000 | 1,053,688 |
| Urban One, Inc. 144A company guaranty sr. notes 7.375%, 2/1/28 | | 2,640,000 | 2,492,398 |
| | | 36,322,299 |
| Building materials (1.9%) |
| American Builders & Contractors Supply Co., Inc. 144A sr. notes 4.00%, 1/15/28 | | 2,395,000 | 2,252,713 |
| American Builders & Contractors Supply Co., Inc. 144A sr. unsec. notes 3.875%, 11/15/29 | | 1,100,000 | 979,000 |
| | | |
| CORPORATE BONDS AND NOTES (84.2%)* cont. | Principal
amount | Value |
| Building materials cont. |
| BCPE Ulysses Intermediate, Inc. 144A sr. unsec. notes 7.75%, 4/1/27 ‡‡ | | $695,000 | $559,469 |
| JELD-WEN, Inc. 144A company guaranty sr. unsec. notes 4.875%, 12/15/27 | | 1,391,000 | 1,267,549 |
| LBM Acquisition, LLC 144A company guaranty sr. unsec. notes 6.25%, 1/15/29 | | 1,685,000 | 1,306,678 |
| Masonite International Corp. 144A company guaranty sr. unsec. notes 5.375%, 2/1/28 | | 860,000 | 859,742 |
| Masonite International Corp. 144A company guaranty sr. unsec. notes 3.50%, 2/15/30 | | 2,050,000 | 1,772,799 |
| MIWD Holdco II, LLC/MIWD Finance Corp. 144A company guaranty sr. unsec. notes 5.50%, 2/1/30 | | 1,105,000 | 939,374 |
| Standard Industries, Inc. 144A sr. unsec. bonds 3.375%, 1/15/31 | | 855,000 | 717,610 |
| Standard Industries, Inc. 144A sr. unsec. notes 5.00%, 2/15/27 | | 3,160,000 | 3,061,250 |
| Standard Industries, Inc. 144A sr. unsec. notes 4.75%, 1/15/28 | | 230,000 | 218,162 |
| Standard Industries, Inc. 144A sr. unsec. notes 4.375%, 7/15/30 | | 1,465,000 | 1,318,500 |
| Werner FinCo LP/Werner FinCo, Inc. 144A company guaranty sr. unsec. notes 8.75%, 7/15/25 | | 2,925,000 | 2,976,188 |
| White Cap Buyer, LLC 144A sr. unsec. notes 6.875%, 10/15/28 | | 1,530,000 | 1,361,700 |
| | | 19,590,734 |
| Capital goods (7.9%) |
| Allison Transmission, Inc. 144A company guaranty sr. unsec. bonds 3.75%, 1/30/31 | | 3,430,000 | 2,936,938 |
| Amsted Industries, Inc. 144A sr. unsec. bonds 4.625%, 5/15/30 | | 1,610,000 | 1,449,000 |
| ARD Finance SA 144A sr. notes Ser. REGS, 6.50%, 6/30/27 (Luxembourg) ‡‡ | | 1,670,223 | 1,311,125 |
| Ardagh Metal Packaging Finance USA, LLC/Ardagh Metal Packaging Finance PLC 144A sr. unsec. notes 4.00%, 9/1/29 | | 2,435,000 | 2,109,940 |
| Berry Global, Inc. 144A company guaranty notes 5.625%, 7/15/27 | | 1,400,000 | 1,390,452 |
| Bombardier, Inc. 144A sr. unsec. notes 7.875%, 4/15/27 (Canada) | | 2,981,000 | 2,719,232 |
| Bombardier, Inc. 144A sr. unsec. notes 7.50%, 12/1/24 (Canada) | | 236,000 | 228,920 |
| Bombardier, Inc. 144A sr. unsec. notes 7.125%, 6/15/26 (Canada) | | 1,315,000 | 1,201,338 |
| Bombardier, Inc. 144A sr. unsec. notes 6.00%, 2/15/28 (Canada) | | 840,000 | 699,476 |
| Canpack SA/Canpack US, LLC 144A company guaranty sr. unsec. notes 3.875%, 11/15/29 (Poland) | | 1,355,000 | 1,185,625 |
| Clarios Global LP 144A company guaranty sr. notes 6.75%, 5/15/25 | | 1,566,000 | 1,575,744 |
| Covanta Holding Corp. 144A company guaranty sr. unsec. notes 4.875%, 12/1/29 | | 3,020,000 | 2,656,709 |
| GFL Environmental, Inc. 144A company guaranty sr. notes 3.50%, 9/1/28 (Canada) | | 1,555,000 | 1,418,938 |
| GFL Environmental, Inc. 144A company guaranty sr. unsec. notes 4.00%, 8/1/28 (Canada) | | 452,000 | 406,597 |
| GFL Environmental, Inc. 144A sr. notes 5.125%, 12/15/26 (Canada) | | 1,215,000 | 1,213,585 |
| Granite US Holdings Corp. 144A company guaranty sr. unsec. notes 11.00%, 10/1/27 | | 2,185,000 | 2,122,138 |
| Great Lakes Dredge & Dock Corp. 144A company guaranty sr. unsec. notes 5.25%, 6/1/29 | | 3,214,000 | 3,021,160 |
| Howmet Aerospace, Inc. sr. unsec. unsub. notes 3.00%, 1/15/29 | | 3,091,000 | 2,819,424 |
| Husky III Holding, Ltd. 144A sr. unsec. notes 13.00%, 2/15/25 (Canada) ‡‡ | | 2,940,000 | 2,969,400 |
| Madison IAQ, LLC 144A sr. notes 4.125%, 6/30/28 | | 570,000 | 522,975 |
| | | |
| CORPORATE BONDS AND NOTES (84.2%)* cont. | Principal
amount | Value |
| Capital goods cont. |
| Madison IAQ, LLC 144A sr. unsec. notes 5.875%, 6/30/29 | | $3,650,000 | $2,856,125 |
| MajorDrive Holdings IV, LLC 144A sr. unsec. notes 6.375%, 6/1/29 | | 3,675,000 | 2,813,287 |
| OT Merger Corp. 144A sr. unsec. notes 7.875%, 10/15/29 | | 3,360,000 | 2,452,800 |
| Panther BF Aggregator 2 LP/Panther Finance Co., Inc. 144A company guaranty sr. unsec. notes 8.50%, 5/15/27 | | 2,480,000 | 2,471,692 |
| PM General Purchaser, LLC 144A sr. notes 9.50%, 10/1/28 | | 1,836,000 | 1,541,771 |
| Roller Bearing Co. of America, Inc. 144A sr. notes 4.375%, 10/15/29 | | 2,650,000 | 2,355,214 |
| Sensata Technologies BV 144A company guaranty sr. unsec. notes 4.00%, 4/15/29 | | 5,290,000 | 5,038,725 |
| Staples, Inc. 144A sr. notes 7.50%, 4/15/26 | | 5,865,000 | 5,416,913 |
| Stevens Holding Co., Inc. 144A company guaranty sr. unsec. notes 6.125%, 10/1/26 | | 1,741,000 | 1,727,943 |
| Terex Corp. 144A company guaranty sr. unsec. notes 5.00%, 5/15/29 | | 1,120,000 | 1,042,496 |
| Titan Acquisition, Ltd./Titan Co-Borrower, LLC 144A sr. unsec. notes 7.75%, 4/15/26 (Canada) | | 1,176,000 | 1,111,320 |
| TK Elevator Holdco GmbH 144A company guaranty sr. unsec. notes 7.625%, 7/15/28 (Germany) | | 1,785,000 | 1,675,604 |
| TransDigm, Inc. company guaranty sr. unsec. sub. notes 6.375%, 6/15/26 | | 1,380,000 | 1,369,650 |
| TransDigm, Inc. company guaranty sr. unsec. sub. notes 5.50%, 11/15/27 | | 164,000 | 157,010 |
| TransDigm, Inc. company guaranty sr. unsec. sub. notes 4.875%, 5/1/29 | | 2,335,000 | 2,095,663 |
| TransDigm, Inc. company guaranty sr. unsec. sub. notes 4.625%, 1/15/29 | | 1,595,000 | 1,430,029 |
| TransDigm, Inc. 144A company guaranty sr. notes 6.25%, 3/15/26 | | 3,688,000 | 3,751,655 |
| Vertical US Newco, Inc. 144A company guaranty sr. notes 5.25%, 7/15/27 | | 200,000 | 195,000 |
| Vertiv Group Corp. 144A company guaranty sr. notes 4.125%, 11/15/28 | | 2,955,000 | 2,627,010 |
| Waste Pro USA, Inc. 144A sr. unsec. notes 5.50%, 2/15/26 | | 3,478,000 | 3,130,200 |
| WESCO Distribution, Inc. 144A company guaranty sr. unsec. unsub. notes 7.25%, 6/15/28 | | 1,400,000 | 1,470,084 |
| | | 80,688,907 |
| Commercial and consumer services (2.0%) |
| ADT Security Corp. 144A sr. notes 4.125%, 8/1/29 | | 1,975,000 | 1,757,553 |
| Allied Universal Holdco LLC/Allied Universal Finance Corp. 144A sr. unsec. notes 6.00%, 6/1/29 | | 1,240,000 | 1,003,284 |
| Allied Universal Holdco LLC/Allied Universal Finance Corp./Atlas Luxco 4 SARL 144A sr. notes 4.625%, 6/1/28 (Luxembourg) | | 1,050,000 | 938,763 |
| Block, Inc. 144A sr. unsec. bonds 3.50%, 6/1/31 | | 3,055,000 | 2,619,663 |
| Carriage Services, Inc. 144A company guaranty sr. unsec. notes 4.25%, 5/15/29 | | 1,577,000 | 1,332,565 |
| Gartner, Inc. 144A company guaranty sr. unsec. bonds 3.75%, 10/1/30 | | 2,375,000 | 2,173,125 |
| Gartner, Inc. 144A company guaranty sr. unsec. notes 3.625%, 6/15/29 | | 575,000 | 524,688 |
| GW B-CR Security Corp. 144A sr. unsec. notes 9.50%, 11/1/27 (Canada) | | 2,847,000 | 2,676,848 |
| | | |
| CORPORATE BONDS AND NOTES (84.2%)* cont. | Principal
amount | Value |
| Commercial and consumer services cont. |
| Prime Security Services Borrower, LLC/Prime Finance, Inc. 144A company guaranty sr. notes 3.375%, 8/31/27 | | $1,130,000 | $1,011,350 |
| Prime Security Services Borrower, LLC/Prime Finance, Inc. 144A notes 6.25%, 1/15/28 | | 2,245,000 | 2,067,196 |
| Sabre GLBL, Inc. 144A company guaranty sr. notes 9.25%, 4/15/25 | | 2,790,000 | 2,887,427 |
| Shift4 Payments, LLC/Shift4 Payments Finance Sub, Inc. 144A company guaranty sr. unsec. notes 4.625%, 11/1/26 | | 1,916,000 | 1,792,840 |
| | | 20,785,302 |
| Communication services (6.9%) |
| Altice Financing SA 144A company guaranty sr. notes 5.00%, 1/15/28 (Luxembourg) | | 1,515,000 | 1,372,582 |
| Altice France Holding SA 144A company guaranty sr. sub. notes 10.50%, 5/15/27 (Luxembourg) | | 2,340,000 | 2,299,588 |
| Altice France Holding SA 144A company guaranty sr. unsec. notes 6.00%, 2/15/28 (Luxembourg) | | 2,575,000 | 2,151,413 |
| Altice France SA 144A company guaranty sr. notes 5.50%, 10/15/29 (France) | | 1,505,000 | 1,305,588 |
| Altice France SA 144A company guaranty sr. notes 5.50%, 1/15/28 (France) | | 1,625,000 | 1,458,438 |
| Altice France SA 144A company guaranty sr. notes 5.125%, 7/15/29 (France) | | 1,870,000 | 1,632,276 |
| CCO Holdings, LLC/CCO Holdings Capital Corp. sr. unsec. bonds 4.50%, 5/1/32 | | 1,560,000 | 1,372,488 |
| CCO Holdings, LLC/CCO Holdings Capital Corp. 144A sr. unsec. bonds 5.375%, 6/1/29 | | 7,610,000 | 7,392,278 |
| CCO Holdings, LLC/CCO Holdings Capital Corp. 144A sr. unsec. bonds 4.75%, 3/1/30 | | 3,565,000 | 3,288,713 |
| CCO Holdings, LLC/CCO Holdings Capital Corp. 144A sr. unsec. bonds 4.50%, 8/15/30 | | 1,090,000 | 984,379 |
| CCO Holdings, LLC/CCO Holdings Capital Corp. 144A sr. unsec. notes 5.00%, 2/1/28 | | 2,680,000 | 2,596,478 |
| CCO Holdings, LLC/CCO Holdings Capital Corp. 144A sr. unsec. notes 4.25%, 2/1/31 | | 1,211,000 | 1,068,344 |
| CommScope Technologies, LLC 144A company guaranty sr. unsec. notes 6.00%, 6/15/25 | | 804,000 | 748,968 |
| CSC Holdings, LLC sr. unsec. unsub. bonds 5.25%, 6/1/24 | | 5,465,000 | 5,394,283 |
| CSC Holdings, LLC 144A company guaranty sr. unsec. notes 5.375%, 2/1/28 | | 1,200,000 | 1,140,000 |
| DIRECTV Holdings, LLC/DIRECTV Financing Co., Inc. 144A sr. notes 5.875%, 8/15/27 | | 965,000 | 909,995 |
| DISH DBS Corp. company guaranty sr. unsec. notes 7.75%, 7/1/26 | | 2,530,000 | 2,163,150 |
| DISH DBS Corp. company guaranty sr. unsec. unsub. notes 5.125%, 6/1/29 | | 2,228,000 | 1,572,433 |
| DISH DBS Corp. 144A company guaranty sr. notes 5.75%, 12/1/28 | | 2,049,000 | 1,672,455 |
| DISH DBS Corp. 144A company guaranty sr. notes 5.25%, 12/1/26 | | 1,085,000 | 917,964 |
| Embarq Corp. sr. unsec. unsub. bonds 7.995%, 6/1/36 | | 3,425,000 | 2,885,563 |
| Frontier Communications Corp. 144A company guaranty sr. notes 5.875%, 10/15/27 | | 1,145,000 | 1,122,100 |
| Frontier Communications Corp. 144A notes 6.75%, 5/1/29 | | 4,515,000 | 3,979,340 |
| Level 3 Financing, Inc. company guaranty sr. unsec. unsub. notes 5.25%, 3/15/26 | | 704,000 | 691,659 |
| | | |
| CORPORATE BONDS AND NOTES (84.2%)* cont. | Principal
amount | Value |
| Communication services cont. |
| Level 3 Financing, Inc. 144A company guaranty sr. unsec. notes 4.25%, 7/1/28 | | $369,000 | $323,798 |
| Sprint Capital Corp. company guaranty sr. unsec. unsub. notes 6.875%, 11/15/28 | | 4,203,000 | 4,754,770 |
| Sprint Corp. company guaranty sr. unsec. notes 7.625%, 3/1/26 | | 2,475,000 | 2,739,231 |
| T-Mobile USA, Inc. company guaranty sr. unsec. bonds 2.875%, 2/15/31 | | 2,755,000 | 2,417,568 |
| T-Mobile USA, Inc. company guaranty sr. unsec. notes 5.375%, 4/15/27 | | 786,000 | 801,146 |
| T-Mobile USA, Inc. company guaranty sr. unsec. notes 2.625%, 2/15/29 | | 1,135,000 | 1,005,224 |
| T-Mobile USA, Inc. company guaranty sr. unsec. unsub. bonds 4.75%, 2/1/28 | | 2,855,000 | 2,863,708 |
| Virgin Media Finance PLC 144A sr. unsec. bonds 5.00%, 7/15/30 (United Kingdom) | | 2,080,000 | 1,856,816 |
| Vodafone Group PLC jr. unsec. sub. FRB 7.00%, 4/4/79 (United Kingdom) | | 440,000 | 461,239 |
| VZ Secured Financing BV 144A sr. notes 5.00%, 1/15/32 (Netherlands) | | 1,560,000 | 1,411,800 |
| Ziggo Bond Co. BV 144A sr. unsec. notes 6.00%, 1/15/27 (Netherlands) | | 2,215,000 | 2,155,906 |
| | | 70,911,681 |
| Conglomerates (—%) |
| General Electric Co. jr. unsec. sub. FRN (BBA LIBOR USD 3 Month + 3.33%), 4.156%, perpetual maturity | | 270,000 | 244,890 |
| | | 244,890 |
| Consumer (0.7%) |
| Scotts Miracle-Gro Co. (The) company guaranty sr. unsec. notes 4.50%, 10/15/29 | | 3,787,000 | 3,398,908 |
| Scotts Miracle-Gro Co. (The) company guaranty sr. unsec. unsub. bonds 4.375%, 2/1/32 | | 1,150,000 | 948,750 |
| Spectrum Brands, Inc. 144A company guaranty sr. unsec. bonds 5.00%, 10/1/29 | | 1,075,000 | 1,007,813 |
| Spectrum Brands, Inc. 144A company guaranty sr. unsec. bonds 3.875%, 3/15/31 | | 2,175,000 | 1,859,625 |
| | | 7,215,096 |
| Consumer staples (5.5%) |
| 1011778 BC ULC/New Red Finance, Inc. 144A bonds 4.00%, 10/15/30 (Canada) | | 1,475,000 | 1,300,072 |
| 1011778 BC ULC/New Red Finance, Inc. 144A company guaranty notes 4.375%, 1/15/28 (Canada) | | 1,548,000 | 1,454,656 |
| 1011778 BC ULC/New Red Finance, Inc. 144A company guaranty sr. notes 3.875%, 1/15/28 (Canada) | | 3,205,000 | 3,032,731 |
| Albertsons Cos., Inc./Safeway, Inc./New Albertsons LP/Albertsons, LLC 144A company guaranty sr. unsec. notes 4.875%, 2/15/30 | | 675,000 | 629,380 |
| Albertsons Cos., Inc./Safeway, Inc./New Albertsons LP/Albertsons, LLC 144A company guaranty sr. unsec. notes 4.625%, 1/15/27 | | 2,745,000 | 2,666,589 |
| Albertsons Cos., LLC/Safeway, Inc./New Albertsons LP/Albertsons, LLC 144A company guaranty sr. unsec. notes 7.50%, 3/15/26 | | 2,010,000 | 2,105,475 |
| | | |
| CORPORATE BONDS AND NOTES (84.2%)* cont. | Principal
amount | Value |
| Consumer staples cont. |
| Brand Energy & Infrastructure Services, Inc. 144A sr. unsec. notes 8.50%, 7/15/25 | | $1,375,000 | $1,131,653 |
| CDW, LLC/CDW Finance Corp. company guaranty sr. unsec. notes 3.25%, 2/15/29 | | 2,210,000 | 1,950,325 |
| Fertitta Entertainment, LLC/Fertitta Entertainment Finance Co., Inc. 144A company guaranty sr. unsec. notes 6.75%, 1/15/30 | | 1,010,000 | 868,600 |
| Herc Holdings, Inc. 144A company guaranty sr. unsec. notes 5.50%, 7/15/27 | | 2,891,000 | 2,898,228 |
| IRB Holding Corp. 144A company guaranty sr. notes 7.00%, 6/15/25 | | 1,605,000 | 1,621,098 |
| KFC Holding Co./Pizza Hut Holdings, LLC/Taco Bell of America, LLC 144A company guaranty sr. unsec. notes 4.75%, 6/1/27 | | 875,000 | 871,071 |
| Kraft Heinz Foods Co. company guaranty sr. unsec. notes 5.00%, 7/15/35 | | 1,766,000 | 1,781,167 |
| Kraft Heinz Foods Co. company guaranty sr. unsec. notes 3.00%, 6/1/26 | | 2,039,000 | 1,970,919 |
| Kraft Heinz Foods Co. company guaranty sr. unsec. sub. notes 3.75%, 4/1/30 | | 1,350,000 | 1,286,880 |
| Lamb Weston Holdings, Inc. 144A company guaranty sr. unsec. notes 4.875%, 5/15/28 | | 1,640,000 | 1,618,647 |
| Lamb Weston Holdings, Inc. 144A company guaranty sr. unsec. notes 4.125%, 1/31/30 | | 2,710,000 | 2,506,750 |
| Match Group Holdings II, LLC 144A sr. unsec. bonds 5.00%, 12/15/27 | | 1,972,000 | 1,918,826 |
| Match Group Holdings II, LLC 144A sr. unsec. bonds 3.625%, 10/1/31 | | 935,000 | 794,470 |
| Match Group Holdings II, LLC 144A sr. unsec. notes 4.125%, 8/1/30 | | 476,000 | 423,531 |
| Match Group Holdings II, LLC 144A sr. unsec. unsub. notes 4.625%, 6/1/28 | | 2,130,000 | 1,984,031 |
| Millennium Escrow Corp. 144A sr. notes 6.625%, 8/1/26 | | 1,540,000 | 1,354,717 |
| Netflix, Inc. sr. unsec. notes 4.875%, 4/15/28 | | 975,000 | 966,682 |
| Netflix, Inc. sr. unsec. unsub. notes 5.875%, 11/15/28 | | 3,146,000 | 3,258,250 |
| Netflix, Inc. 144A sr. unsec. bonds 4.875%, 6/15/30 | | 514,000 | 505,262 |
| Newell Brands, Inc. sr. unsec. notes 4.875%, 6/1/25 | | 1,293,000 | 1,309,062 |
| Newell Brands, Inc. sr. unsec. unsub. notes 4.45%, 4/1/26 | | 3,430,000 | 3,415,423 |
| PECF USS Intermediate Holding III Corp. 144A sr. unsec. notes 8.00%, 11/15/29 | | 3,295,000 | 2,767,800 |
| Rite Aid Corp. 144A company guaranty sr. notes 8.00%, 11/15/26 | | 1,109,000 | 918,856 |
| Rite Aid Corp. 144A company guaranty sr. unsec. sub. notes 7.50%, 7/1/25 | | 1,583,000 | 1,334,271 |
| TripAdvisor, Inc. 144A company guaranty sr. unsec. notes 7.00%, 7/15/25 | | 2,113,000 | 2,186,004 |
| Yum! Brands, Inc. sr. unsec. bonds 5.375%, 4/1/32 | | 645,000 | 628,875 |
| Yum! Brands, Inc. sr. unsec. sub. bonds 3.625%, 3/15/31 | | 1,125,000 | 994,998 |
| Yum! Brands, Inc. 144A sr. unsec. bonds 4.75%, 1/15/30 | | 1,590,000 | 1,530,375 |
| | | 55,985,674 |
| Energy (oil field) (0.5%) |
| ChampionX Corp. company guaranty sr. unsec. notes 6.375%, 5/1/26 | | 836,000 | 844,589 |
| Nabors Industries, Inc. company guaranty sr. unsec. notes 5.75%, 2/1/25 | | 1,345,000 | 1,295,625 |
| | | |
| CORPORATE BONDS AND NOTES (84.2%)* cont. | Principal
amount | Value |
| Energy (oil field) cont. |
| Nabors Industries, Inc. 144A company guaranty sr. unsec. notes 9.00%, 2/1/25 | | $744,000 | $759,588 |
| USA Compression Partners LP/USA Compression Finance Corp. company guaranty sr. unsec. notes 6.875%, 4/1/26 | | 1,634,000 | 1,595,193 |
| USA Compression Partners LP/USA Compression Finance Corp. company guaranty sr. unsec. unsub. notes 6.875%, 9/1/27 | | 1,105,000 | 1,063,916 |
| | | 5,558,911 |
| Energy (other) (0.1%) |
| Renewable Energy Group, Inc. 144A company guaranty sr. notes 5.875%, 6/1/28 | | 740,000 | 786,154 |
| | | 786,154 |
| Entertainment (1.9%) |
| AMC Entertainment Holdings, Inc. 144A company guaranty notes 10.00%, 6/15/26 ‡‡ | | 2,270,000 | 1,739,388 |
| AMC Entertainment Holdings, Inc. 144A company guaranty sr. notes 7.50%, 2/15/29 | | 970,000 | 888,292 |
| CDI Escrow Issuer, Inc. 144A sr. unsec. notes 5.75%, 4/1/30 | | 2,459,000 | 2,403,673 |
| Cinemark USA, Inc. 144A company guaranty sr. unsec. notes 5.875%, 3/15/26 | | 1,070,000 | 1,016,104 |
| Cinemark USA, Inc. 144A company guaranty sr. unsec. notes 5.25%, 7/15/28 | | 2,445,000 | 2,197,028 |
| Constellation Merger Sub, Inc. 144A sr. unsec. notes 8.50%, 9/15/25 | | 2,305,000 | 2,074,500 |
| Live Nation Entertainment, Inc. 144A company guaranty sr. unsec. sub. notes 5.625%, 3/15/26 | | 1,550,000 | 1,534,500 |
| Live Nation Entertainment, Inc. 144A sr. notes 6.50%, 5/15/27 | | 1,185,000 | 1,226,546 |
| NCL Corp., Ltd. 144A company guaranty sr. notes 5.875%, 2/15/27 | | 895,000 | 832,350 |
| NCL Corp., Ltd. 144A sr. unsec. unsub. notes 7.75%, 2/15/29 | | 675,000 | 604,125 |
| Royal Caribbean Cruises, Ltd. 144A sr. unsec. notes 5.50%, 8/31/26 | | 784,000 | 687,960 |
| Six Flags Entertainment Corp. 144A company guaranty sr. unsec. bonds 5.50%, 4/15/27 | | 1,940,000 | 1,891,500 |
| Six Flags Theme Parks, Inc. 144A company guaranty sr. notes 7.00%, 7/1/25 | | 2,265,000 | 2,344,275 |
| | | 19,440,241 |
| Financials (8.6%) |
| Alliant Holdings Intermediate, LLC/Alliant Holdings Co-Issuer 144A sr. unsec. notes 6.75%, 10/15/27 | | 2,690,000 | 2,596,388 |
| Allstate Corp. (The) unsec. sub. FRB 5.75%, 8/15/53 | | 85,000 | 79,475 |
| Ally Financial, Inc. company guaranty sr. unsec. notes 8.00%, 11/1/31 | | 4,963,000 | 5,828,777 |
| Ally Financial, Inc. jr. unsec. sub. FRN 4.70%, perpetual maturity | | 600,000 | 506,025 |
| Ally Financial, Inc. jr. unsec. sub. FRN 4.70%, perpetual maturity | | 200,000 | 159,734 |
| American Express Co. jr. unsec. sub. FRN 3.55%, 9/15/26 | | 250,000 | 212,609 |
| Apollo Management Holdings LP 144A company guaranty unsec. sub. FRB 4.95%, 1/14/50 | | 1,000,000 | 917,066 |
| Ares Finance Co. III, LLC 144A company guaranty unsec. sub. FRB 4.125%, 6/30/51 | | 500,000 | 429,947 |
| Aretec Escrow Issuer, Inc. 144A sr. unsec. notes 7.50%, 4/1/29 | | 2,710,000 | 2,416,541 |
| AXA SA 144A jr. unsec. sub. FRN 6.379%, perpetual maturity (France) | | 250,000 | 302,060 |
| Banca Monte dei Paschi di Siena SpA sr. unsec. unsub. notes Ser. EMTN, 2.625%, 4/28/25 (Italy) | EUR | 280,000 | 275,146 |
| | | |
| CORPORATE BONDS AND NOTES (84.2%)* cont. | Principal
amount | Value |
| Financials cont. |
| Banco Bilbao Vizcaya Argentaria SA jr. unsec. sub. FRN 6.125%, perpetual maturity (Spain) | | $600,000 | $558,045 |
| Banco do Brasil SA/Cayman 144A jr. unsec. sub. FRN 9.00%, perpetual maturity (Brazil) | | 310,000 | 322,152 |
| Banco Santander SA jr. unsec. sub. FRN 7.50%, perpetual maturity (Spain) | | 600,000 | 614,346 |
| Bank of America Corp. jr. unsec. sub. FRN 4.375%, 1/27/27 | | 350,000 | 307,977 |
| Bank of America Corp. jr. unsec. sub. FRN Ser. AA, 6.10%, perpetual maturity | | 640,000 | 643,200 |
| Bank of America Corp. jr. unsec. sub. FRN Ser. Z, 6.50%, perpetual maturity | | 1,000,000 | 1,014,742 |
| Bank of Nova Scotia (The) jr. unsec. sub. FRB 3.625%, 10/27/81 (Canada) | | 300,000 | 229,500 |
| Bank of Nova Scotia (The) jr. unsec. sub. FRN 4.90%, perpetual maturity (Canada) | | 320,000 | 311,106 |
| Barclays PLC jr. unsec. sub. FRN 8.00%, perpetual maturity (United Kingdom) | | 460,000 | 477,435 |
| Barclays PLC jr. unsec. sub. FRN 6.125%, 8/12/50 (United Kingdom) | | 200,000 | 196,970 |
| BNP Paribas SA 144A jr. unsec. sub. FRN 7.375%, perpetual maturity (France) | | 300,000 | 311,575 |
| Capital One Financial Corp. jr. unsec. sub. FRN 3.95%, perpetual maturity | | 250,000 | 213,623 |
| Citigroup, Inc. jr. unsec. sub. FRN 4.00%, perpetual maturity | | 690,000 | 622,421 |
| Citizens Financial Group, Inc. jr. unsec. sub. FRN 6.375%, perpetual maturity | | 320,000 | 296,604 |
| Cobra AcquisitionCo, LLC 144A company guaranty sr. unsec. notes 6.375%, 11/1/29 | | 2,346,000 | 1,829,880 |
| Coinbase Global, Inc. 144A company guaranty sr. unsec. unsub. bonds 3.625%, 10/1/31 | | 640,000 | 432,000 |
| Coinbase Global, Inc. 144A company guaranty sr. unsec. unsub. notes 3.375%, 10/1/28 | | 1,150,000 | 845,250 |
| Commerzbank AG FRB Ser. REGS, 7.00%, perpetual maturity (Germany) | EUR | 600,000 | 594,115 |
| Credit Agricole SA 144A jr. unsec. sub. FRN 6.875%, perpetual maturity (France) | | $310,000 | 314,416 |
| Credit Agricole SA 144A jr. unsec. sub. FRN 4.75%, 9/23/29 (France) | | 250,000 | 213,712 |
| Credit Suisse Group AG 144A jr. unsec. sub. FRB 6.375%, perpetual maturity (Switzerland) | | 560,000 | 516,967 |
| Credit Suisse Group AG 144A jr. unsec. sub. FRN 6.25%, perpetual maturity (Switzerland) | | 250,000 | 242,188 |
| Deutsche Bank AG jr. unsec. sub. FRN 6.00%, perpetual maturity (Germany) | | 800,000 | 748,529 |
| Deutsche Bank AG/New York, NY unsec. sub. FRB 3.729%, 1/14/32 (Germany) | | 1,360,000 | 1,134,014 |
| Discover Financial Services jr. unsec. sub. FRN 6.125%, perpetual maturity | | 230,000 | 231,191 |
| Freedom Mortgage Corp. 144A sr. unsec. notes 8.25%, 4/15/25 | | 849,000 | 786,372 |
| Freedom Mortgage Corp. 144A sr. unsec. notes 8.125%, 11/15/24 | | 1,631,000 | 1,552,217 |
| Freedom Mortgage Corp. 144A sr. unsec. notes 6.625%, 1/15/27 | | 1,150,000 | 987,235 |
| GLP Capital LP/GLP Financing II, Inc. company guaranty sr. unsec. notes 5.25%, 6/1/25 | | 820,000 | 820,205 |
| | | |
| CORPORATE BONDS AND NOTES (84.2%)* cont. | Principal
amount | Value |
| Financials cont. |
| goeasy, Ltd. 144A company guaranty sr. unsec. notes 5.375%, 12/1/24 (Canada) | | $675,000 | $644,625 |
| goeasy, Ltd. 144A company guaranty sr. unsec. notes 4.375%, 5/1/26 (Canada) | | 1,320,000 | 1,181,400 |
| Hartford Financial Services Group, Inc. (The) 144A jr. unsec. sub. FRB (BBA LIBOR USD 3 Month + 2.13%), 3.536%, 2/12/47 | | 550,000 | 467,804 |
| Home Point Capital, Inc. 144A company guaranty sr. unsec. notes 5.00%, 2/1/26 | | 1,145,000 | 938,900 |
| HSBC Holdings PLC jr. unsec. sub. FRN 6.50%, perpetual maturity (United Kingdom) | | 540,000 | 519,634 |
| HUB International, Ltd. 144A sr. unsec. notes 7.00%, 5/1/26 | | 2,387,000 | 2,410,560 |
| HUB International, Ltd. 144A sr. unsec. notes 5.625%, 12/1/29 | | 680,000 | 634,100 |
| Huntington Bancshares, Inc. jr. unsec. sub. FRN 4.45%, perpetual maturity | | 250,000 | 229,854 |
| Icahn Enterprises LP/Icahn Enterprises Finance Corp. company guaranty sr. unsec. notes 6.25%, 5/15/26 | | 1,044,000 | 1,049,381 |
| Icahn Enterprises LP/Icahn Enterprises Finance Corp. company guaranty sr. unsec. notes 5.25%, 5/15/27 | | 1,815,000 | 1,752,891 |
| Icahn Enterprises LP/Icahn Enterprises Finance Corp. company guaranty sr. unsec. sub. notes 4.375%, 2/1/29 | | 2,640,000 | 2,393,846 |
| ING Groep NV jr. unsec. sub. FRN 5.75%, perpetual maturity (Netherlands) | | 540,000 | 520,222 |
| Intesa Sanpaolo SpA 144A company guaranty jr. unsec. sub. FRB 7.70%, perpetual maturity (Italy) | | 610,000 | 597,666 |
| Intesa Sanpaolo SpA 144A unsec. sub. bonds 4.198%, 6/1/32 (Italy) | | 425,000 | 347,247 |
| iStar, Inc. sr. unsec. notes 5.50%, 2/15/26 R | | 1,810,000 | 1,817,855 |
| iStar, Inc. sr. unsec. notes 4.75%, 10/1/24 R | | 3,007,000 | 2,996,092 |
| iStar, Inc. sr. unsec. notes 4.25%, 8/1/25 R | | 2,543,000 | 2,508,034 |
| JPMorgan Chase & Co. jr. unsec. bonds 6.10%, perpetual maturity | | 800,000 | 787,724 |
| JPMorgan Chase & Co. jr. unsec. sub. FRN 3.65%, perpetual maturity | | 400,000 | 353,500 |
| JPMorgan Chase & Co. jr. unsec. sub. FRN Ser. R, 6.00%, perpetual maturity | | 1,000,000 | 979,339 |
| Ladder Capital Finance Holdings, LLLP/Ladder Capital Finance Corp. 144A company guaranty sr. unsec. notes 4.75%, 6/15/29 R | | 2,757,000 | 2,481,300 |
| Ladder Capital Finance Holdings, LLLP/Ladder Capital Finance Corp. 144A company guaranty sr. unsec. unsub. notes 5.25%, 10/1/25 R | | 600,000 | 574,500 |
| Ladder Capital Finance Holdings, LLLP/Ladder Capital Finance Corp. 144A sr. unsec. notes 4.25%, 2/1/27 R | | 2,245,000 | 2,026,113 |
| Liberty Mutual Group, Inc. 144A company guaranty jr. unsec. sub. FRB 4.125%, 12/15/51 | | 300,000 | 261,026 |
| Lloyds Banking Group PLC jr. unsec. sub. FRN 7.50%, perpetual maturity (United Kingdom) | | 600,000 | 616,659 |
| LPL Holdings, Inc. 144A company guaranty sr. unsec. notes 4.00%, 3/15/29 | | 1,390,000 | 1,287,488 |
| M&T Bank Corp. jr. unsec. sub. FRN 3.50%, 9/1/26 | | 250,000 | 205,313 |
| MetLife, Inc. 144A jr. unsec. sub. bonds 9.25%, 4/8/38 | | 350,000 | 422,875 |
| Morgan Stanley jr. unsec. sub. FRN 5.875%, perpetual maturity | | 760,000 | 757,619 |
| Nationstar Mortgage Holdings, Inc. 144A company guaranty sr. unsec. notes 5.75%, 11/15/31 | | 2,415,000 | 2,215,763 |
| | | |
| CORPORATE BONDS AND NOTES (84.2%)* cont. | Principal
amount | Value |
| Financials cont. |
| Nationstar Mortgage Holdings, Inc. 144A company guaranty sr. unsec. notes 5.50%, 8/15/28 | | $1,833,000 | $1,729,930 |
| OneMain Finance Corp. company guaranty sr. unsec. sub. notes 7.125%, 3/15/26 | | 1,090,000 | 1,116,160 |
| OneMain Finance Corp. company guaranty sr. unsec. sub. notes 6.625%, 1/15/28 | | 1,185,000 | 1,186,481 |
| OneMain Finance Corp. company guaranty sr. unsec. unsub. notes 5.375%, 11/15/29 | | 2,129,000 | 1,967,312 |
| PennyMac Financial Services, Inc. 144A company guaranty sr. unsec. notes 5.75%, 9/15/31 | | 1,055,000 | 915,202 |
| PennyMac Financial Services, Inc. 144A company guaranty sr. unsec. notes 5.375%, 10/15/25 | | 2,065,000 | 2,005,631 |
| PHH Mortgage Corp. 144A company guaranty sr. notes 7.875%, 3/15/26 | | 3,520,000 | 3,340,326 |
| Provident Funding Associates LP/PFG Finance Corp. 144A sr. unsec. notes 6.375%, 6/15/25 | | 3,110,000 | 2,970,050 |
| Prudential Financial, Inc. jr. unsec. sub. FRB 5.125%, 3/1/52 | | 100,000 | 96,125 |
| Prudential Financial, Inc. jr. unsec. sub. FRB 3.70%, 10/1/50 | | 520,000 | 446,770 |
| Royal Bank of Scotland Group PLC jr. unsec. sub. FRB 8.00%, perpetual maturity (United Kingdom) | | 590,000 | 616,550 |
| Societe Generale SA 144A jr. unsec. sub. FRN 4.75%, perpetual maturity (France) | | 1,865,000 | 1,657,519 |
| Societe Generale SA 144A jr. unsec. sub. notes 5.375%, perpetual maturity (France) | | 570,000 | 497,251 |
| Stichting AK Rabobank Certificaten jr. unsec. sub. FRN 6.50%, perpetual maturity (Netherlands) | EUR | 220,000 | 246,809 |
| Swiss Re Finance Luxembourg SA 144A company guaranty unsec. sub. FRB 5.00%, 4/2/49 (Luxembourg) | | $400,000 | 392,000 |
| Truist Financial Corp. jr. unsec. sub. FRN 5.125%, perpetual maturity | | 570,000 | 507,324 |
| UBS Group Funding Switzerland AG company guaranty jr. unsec. sub. FRN Ser. REGS, 6.875%, perpetual maturity (Switzerland) | | 510,000 | 522,557 |
| UniCredit SpA jr. unsec. sub. FRN 8.00%, perpetual maturity (Italy) | | 460,000 | 464,747 |
| USI, Inc./NY 144A sr. unsec. notes 6.875%, 5/1/25 | | 1,952,000 | 1,919,922 |
| Wells Fargo & Co. jr. unsec. sub. FRB Ser. U, 5.875%, perpetual maturity | | 470,000 | 468,238 |
| | | 88,137,989 |
| Gaming and lottery (2.3%) |
| Boyd Gaming Corp. company guaranty sr. unsec. notes 4.75%, 12/1/27 | | 1,105,000 | 1,074,613 |
| Boyd Gaming Corp. 144A sr. unsec. bonds 4.75%, 6/15/31 | | 2,250,000 | 2,058,750 |
| Boyd Gaming Corp. 144A sr. unsec. notes 8.625%, 6/1/25 | | 530,000 | 552,859 |
| Caesars Entertainment, Inc. 144A sr. notes 6.25%, 7/1/25 | | 3,600,000 | 3,646,800 |
| Caesars Entertainment, Inc. 144A sr. unsec. notes 4.625%, 10/15/29 | | 815,000 | 695,358 |
| Penn National Gaming, Inc. 144A sr. unsec. notes 5.625%, 1/15/27 | | 1,890,000 | 1,743,534 |
| Scientific Games Holdings LP/Scientific Games US FinCo., Inc. 144A sr. unsec. notes 6.625%, 3/1/30 | | 1,350,000 | 1,252,314 |
| Scientific Games International, Inc. 144A company guaranty sr. unsec. notes 7.25%, 11/15/29 | | 3,545,000 | 3,521,993 |
| | | |
| CORPORATE BONDS AND NOTES (84.2%)* cont. | Principal
amount | Value |
| Gaming and lottery cont. |
| Scientific Games International, Inc. 144A sr. unsec. notes 7.00%, 5/15/28 | | $1,030,000 | $1,019,988 |
| Station Casinos, LLC 144A sr. unsec. bonds 4.625%, 12/1/31 | | 770,000 | 652,246 |
| Station Casinos, LLC 144A sr. unsec. notes 4.50%, 2/15/28 | | 2,995,000 | 2,710,243 |
| Wynn Las Vegas, LLC/Wynn Las Vegas Capital Corp. 144A company guaranty sr. unsec. sub. notes 5.25%, 5/15/27 | | 2,298,000 | 2,114,344 |
| Wynn Resorts Finance, LLC/Wynn Resorts Capital Corp. 144A sr. unsec. bonds 5.125%, 10/1/29 | | 2,320,000 | 2,057,840 |
| Wynn Resorts Finance, LLC/Wynn Resorts Capital Corp. 144A sr. unsec. notes 7.75%, 4/15/25 | | 665,000 | 677,136 |
| | | 23,778,018 |
| Health care (7.6%) |
| 180 Medical, Inc. 144A company guaranty sr. unsec. notes 3.875%, 10/15/29 | | 945,000 | 859,950 |
| Air Methods Corp. 144A sr. unsec. notes 8.00%, 5/15/25 | | 3,120,000 | 2,157,776 |
| Bausch Health Cos., Inc. 144A company guaranty sr. notes 6.125%, 2/1/27 | | 1,481,000 | 1,347,710 |
| Bausch Health Cos., Inc. 144A company guaranty sr. unsec. notes 7.25%, 5/30/29 | | 880,000 | 581,830 |
| Bausch Health Cos., Inc. 144A company guaranty sr. unsec. notes 6.25%, 2/15/29 | | 1,645,000 | 1,022,351 |
| Bausch Health Cos., Inc. 144A company guaranty sr. unsec. notes 5.00%, 2/15/29 | | 910,000 | 543,793 |
| Bausch Health Cos., Inc. 144A sr. notes 4.875%, 6/1/28 | | 1,835,000 | 1,576,403 |
| Centene Corp. sr. unsec. bonds 3.00%, 10/15/30 | | 1,025,000 | 911,779 |
| Centene Corp. sr. unsec. notes 4.625%, 12/15/29 | | 4,840,000 | 4,767,400 |
| Charles River Laboratories International, Inc. 144A company guaranty sr. unsec. notes 4.00%, 3/15/31 | | 2,230,000 | 2,048,813 |
| Charles River Laboratories International, Inc. 144A company guaranty sr. unsec. notes 3.75%, 3/15/29 | | 1,015,000 | 947,756 |
| CHS/Community Health Systems, Inc. 144A company guaranty sr. notes 8.00%, 3/15/26 | | 1,115,000 | 1,117,252 |
| CHS/Community Health Systems, Inc. 144A company guaranty sr. notes 6.00%, 1/15/29 | | 225,000 | 204,750 |
| CHS/Community Health Systems, Inc. 144A company guaranty sr. notes 5.625%, 3/15/27 | | 905,000 | 839,388 |
| CHS/Community Health Systems, Inc. 144A company guaranty sr. unsec. sub. notes 6.875%, 4/1/28 | | 1,675,000 | 1,147,188 |
| CHS/Community Health Systems, Inc. 144A jr. notes 6.875%, 4/15/29 | | 3,060,000 | 2,390,778 |
| CHS/Community Health Systems, Inc. 144A sr. notes 5.25%, 5/15/30 | | 1,010,000 | 870,034 |
| Elanco Animal Health, Inc. sr. unsec. notes Ser. WI, 6.40%, 8/28/28 | | 3,850,000 | 3,957,030 |
| HCA, Inc. company guaranty sr. unsec. notes 5.375%, 9/1/26 | | 2,325,000 | 2,420,906 |
| HCA, Inc. company guaranty sr. unsec. notes 3.50%, 9/1/30 | | 2,005,000 | 1,828,306 |
| Jazz Securities DAC 144A company guaranty sr. unsub. notes 4.375%, 1/15/29 (Ireland) | | 3,987,000 | 3,847,455 |
| Mallinckrodt International Finance SA/Mallinckrodt CB, LLC 144A company guaranty sub. notes 10.00%, 4/15/25 (Luxembourg) | | 3,291,000 | 2,270,790 |
| Minerva Merger Sub, Inc. 144A sr. unsec. notes 6.50%, 2/15/30 | | 2,880,000 | 2,642,400 |
| Mozart Debt Merger Sub, Inc. 144A sr. notes 3.875%, 4/1/29 | | 785,000 | 708,463 |
| | | |
| CORPORATE BONDS AND NOTES (84.2%)* cont. | Principal
amount | Value |
| Health care cont. |
| Mozart Debt Merger Sub, Inc. 144A sr. unsec. notes 5.25%, 10/1/29 | | $1,815,000 | $1,606,656 |
| Option Care Health, Inc. 144A company guaranty sr. unsec. notes 4.375%, 10/31/29 | | 675,000 | 615,256 |
| Organon Finance 1, LLC 144A sr. notes 4.125%, 4/30/28 | | 3,480,000 | 3,336,555 |
| Organon Finance 1, LLC 144A sr. unsec. notes 5.125%, 4/30/31 | | 985,000 | 946,954 |
| Ortho-Clinical Diagnostics, Inc./Ortho-Clinical Diagnostics SA 144A sr. unsec. notes 7.375%, 6/1/25 | | 531,000 | 550,583 |
| Owens & Minor, Inc. 144A company guaranty sr. unsec. notes 6.625%, 4/1/30 | | 720,000 | 709,200 |
| Owens & Minor, Inc. 144A sr. unsec. notes 4.50%, 3/31/29 | | 2,610,000 | 2,358,788 |
| Service Corp. International sr. unsec. bonds 5.125%, 6/1/29 | | 3,210,000 | 3,212,514 |
| Service Corp. International sr. unsec. notes 3.375%, 8/15/30 | | 1,850,000 | 1,618,750 |
| Service Corp. International sr. unsec. sub. notes 4.00%, 5/15/31 | | 1,150,000 | 1,069,144 |
| Tenet Healthcare Corp. 144A company guaranty sr. notes 5.125%, 11/1/27 | | 4,410,000 | 4,376,396 |
| Tenet Healthcare Corp. 144A company guaranty sr. notes 4.875%, 1/1/26 | | 4,390,000 | 4,380,166 |
| Tenet Healthcare Corp. 144A company guaranty sr. notes 4.25%, 6/1/29 | | 1,705,000 | 1,601,762 |
| Teva Pharmaceutical Finance Netherlands III BV company guaranty sr. unsec. notes 7.125%, 1/31/25 (Israel) | | 955,000 | 980,928 |
| Teva Pharmaceutical Finance Netherlands III BV company guaranty sr. unsec. notes 6.75%, 3/1/28 (Israel) | | 3,200,000 | 3,258,224 |
| Teva Pharmaceutical Finance Netherlands III BV company guaranty sr. unsec. notes 6.00%, 4/15/24 (Israel) | | 1,240,000 | 1,252,400 |
| Teva Pharmaceutical Finance Netherlands III BV company guaranty sr. unsec. unsub. notes 5.125%, 5/9/29 (Israel) | | 5,015,000 | 4,596,548 |
| | | 77,481,125 |
| Homebuilding (0.5%) |
| Brookfield Residential Properties, Inc./Brookfield Residential US Corp. 144A sr. unsec. notes 5.00%, 6/15/29 (Canada) | | 1,605,000 | 1,356,787 |
| Mattamy Group Corp. 144A sr. unsec. notes 5.25%, 12/15/27 (Canada) | | 1,965,000 | 1,813,371 |
| Realogy Group, LLC/Realogy Co-Issuer Corp. 144A company guaranty sr. unsec. notes 5.75%, 1/15/29 | | 2,045,000 | 1,822,504 |
| | | 4,992,662 |
| Lodging/Tourism (1.2%) |
| Carnival Corp. 144A sr. unsec. notes 7.625%, 3/1/26 | | 1,917,000 | 1,797,571 |
| Carnival Corp. 144A sr. unsec. notes 5.75%, 3/1/27 | | 2,695,000 | 2,390,937 |
| Full House Resorts, Inc. 144A company guaranty sr. notes 8.25%, 2/15/28 | | 2,903,000 | 2,627,215 |
| Hilton Worldwide Finance, LLC/Hilton Worldwide Finance Corp. company guaranty sr. unsec. notes 4.875%, 4/1/27 | | 2,545,000 | 2,558,234 |
| MGM Resorts International company guaranty sr. unsec. notes 6.00%, 3/15/23 | | 425,000 | 429,250 |
| SugarHouse HSP Gaming Prop. Mezz LP/SugarHouse HSP Gaming Finance Corp. 144A company guaranty sr. unsub. notes 5.875%, 5/15/25 | | 2,680,000 | 2,566,100 |
| | | 12,369,307 |
| | | |
| CORPORATE BONDS AND NOTES (84.2%)* cont. | Principal
amount | Value |
| Media (0.4%) |
| Nielsen Co. Luxembourg SARL (The) 144A company guaranty sr. unsec. notes 5.00%, 2/1/25 (Luxembourg) | | $1,664,000 | $1,647,275 |
| Nielsen Finance, LLC/Nielsen Finance Co. 144A company guaranty sr. unsec. notes 5.625%, 10/1/28 | | 1,730,000 | 1,714,620 |
| Nielsen Finance, LLC/Nielsen Finance Co. 144A company guaranty sr. unsec. notes 4.50%, 7/15/29 | | 1,220,000 | 1,152,841 |
| | | 4,514,736 |
| Oil and gas (11.9%) |
| Antero Midstream Partners LP/Antero Midstream Finance Corp. 144A company guaranty sr. unsec. notes 7.875%, 5/15/26 | | 1,275,000 | 1,348,772 |
| Antero Resources Corp. 144A company guaranty sr. unsec. notes 8.375%, 7/15/26 | | 650,000 | 706,875 |
| Antero Resources Corp. 144A company guaranty sr. unsec. notes 7.625%, 2/1/29 | | 626,000 | 678,553 |
| Apache Corp. sr. unsec. unsub. notes 5.10%, 9/1/40 | | 1,236,000 | 1,153,151 |
| Apache Corp. sr. unsec. unsub. notes 4.375%, 10/15/28 | | 3,198,000 | 3,054,090 |
| BP Capital Markets PLC company guaranty unsec. sub. FRN 4.875%, perpetual maturity (United Kingdom) | | 490,000 | 458,194 |
| Callon Petroleum Co. company guaranty sr. unsec. notes 6.125%, 10/1/24 | | 3,700,000 | 3,684,886 |
| Callon Petroleum Co. 144A company guaranty notes 9.00%, 4/1/25 | | 1,160,000 | 1,229,600 |
| Callon Petroleum Co. 144A company guaranty sr. unsec. notes 8.00%, 8/1/28 | | 1,655,000 | 1,704,650 |
| Centennial Resource Production, LLC 144A company guaranty sr. unsec. notes 6.875%, 4/1/27 | | 3,560,000 | 3,560,000 |
| Centennial Resource Production, LLC 144A company guaranty sr. unsec. notes 5.375%, 1/15/26 | | 2,495,000 | 2,410,669 |
| Cheniere Energy Partners LP company guaranty sr. unsec. unsub. notes 4.00%, 3/1/31 | | 3,345,000 | 3,089,944 |
| Cheniere Energy Partners LP 144A company guaranty sr. unsec. unsub. bonds 3.25%, 1/31/32 | | 230,000 | 201,066 |
| Comstock Resources, Inc. 144A company guaranty sr. unsec. notes 5.875%, 1/15/30 | | 2,305,000 | 2,199,569 |
| Comstock Resources, Inc. 144A sr. unsec. notes 6.75%, 3/1/29 | | 852,000 | 850,803 |
| Continental Resources, Inc. company guaranty sr. unsec. bonds 4.90%, 6/1/44 | | 1,680,000 | 1,495,200 |
| Continental Resources, Inc. 144A company guaranty sr. unsec. bonds 5.75%, 1/15/31 | | 2,083,000 | 2,141,282 |
| Continental Resources, Inc. 144A company guaranty sr. unsec. bonds 2.875%, 4/1/32 | | 3,800,000 | 3,185,616 |
| DCP Midstream LP jr. unsec. sub. FRN 7.375%, perpetual maturity | | 226,000 | 208,555 |
| DCP Midstream Operating LP company guaranty sr. unsec. sub. notes 5.125%, 5/15/29 | | 610,000 | 610,061 |
| DCP Midstream Operating LP company guaranty sr. unsec. unsub. notes 5.375%, 7/15/25 | | 70,000 | 71,749 |
| DCP Midstream Operating LP 144A company guaranty sr. unsec. unsub. bonds 6.75%, 9/15/37 | | 3,143,000 | 3,410,155 |
| Devon Energy Corp. sr. unsec. unsub. bonds 7.95%, 4/15/32 | | 1,665,000 | 2,052,287 |
| Devon Energy Corp. sr. unsec. unsub. bonds 7.875%, 9/30/31 | | 1,170,000 | 1,437,638 |
| Encino Acquisition Partners Holdings, LLC 144A company guaranty sr. unsec. notes 8.50%, 5/1/28 | | 3,099,000 | 3,099,000 |
| | | |
| CORPORATE BONDS AND NOTES (84.2%)* cont. | Principal
amount | Value |
| Oil and gas cont. |
| Endeavor Energy Resources LP/EER Finance, Inc. 144A sr. unsec. bonds 5.75%, 1/30/28 | | $6,100,000 | $6,220,963 |
| EnLink Midstream Partners LP jr. unsec. sub. FRN 6.00%, perpetual maturity | | 500,000 | 352,330 |
| EnLink Midstream, LLC 144A company guaranty sr. unsec. notes 5.625%, 1/15/28 | | 2,970,000 | 2,951,438 |
| EQT Corp. sr. unsec. notes 7.50%, 2/1/30 | | 1,280,000 | 1,421,030 |
| EQT Corp. sr. unsec. notes 5.00%, 1/15/29 | | 225,000 | 223,252 |
| Hess Midstream Operations LP 144A company guaranty sr. unsec. notes 5.50%, 10/15/30 | | 990,000 | 976,536 |
| Hess Midstream Operations LP 144A company guaranty sr. unsec. notes 5.125%, 6/15/28 | | 1,065,000 | 1,051,565 |
| Hess Midstream Operations LP 144A company guaranty sr. unsec. notes 4.25%, 2/15/30 | | 905,000 | 829,387 |
| Hess Midstream Operations LP 144A company guaranty sr. unsec. sub. notes 5.625%, 2/15/26 | | 2,456,000 | 2,507,576 |
| Hilcorp Energy I LP/Hilcorp Finance Co. 144A sr. unsec. notes 6.25%, 4/15/32 | | 1,245,000 | 1,204,538 |
| Hilcorp Energy I LP/Hilcorp Finance Co. 144A sr. unsec. notes 6.00%, 4/15/30 | | 1,120,000 | 1,083,600 |
| Holly Energy Partners LP/Holly Energy Finance Corp. 144A company guaranty sr. unsec. notes 5.00%, 2/1/28 | | 3,104,000 | 2,917,372 |
| MPLX LP jr. unsec. sub. FRN 6.875%, perpetual maturity | | 260,000 | 252,291 |
| Nabors Industries, Ltd. 144A company guaranty sr. unsec. notes 7.25%, 1/15/26 | | 985,000 | 954,081 |
| Oasis Petroleum, Inc. 144A company guaranty sr. unsec. notes 6.375%, 6/1/26 | | 1,145,000 | 1,150,725 |
| Occidental Petroleum Corp. sr. unsec. bonds 6.625%, 9/1/30 | | 1,465,000 | 1,642,272 |
| Occidental Petroleum Corp. sr. unsec. bonds 6.125%, 1/1/31 | | 580,000 | 629,300 |
| Occidental Petroleum Corp. sr. unsec. sub. bonds 6.20%, 3/15/40 | | 6,399,000 | 6,750,922 |
| Occidental Petroleum Corp. sr. unsec. sub. notes 6.45%, 9/15/36 | | 5,843,000 | 6,536,389 |
| Ovintiv, Inc. company guaranty sr. unsec. bonds 6.50%, 8/15/34 | | 475,000 | 519,144 |
| Ovintiv, Inc. company guaranty sr. unsec. unsub. bonds 7.375%, 11/1/31 | | 1,701,000 | 1,948,910 |
| Ovintiv, Inc. company guaranty sr. unsec. unsub. bonds 6.625%, 8/15/37 | | 490,000 | 538,037 |
| Ovintiv, Inc. company guaranty sr. unsec. unsub. notes 8.125%, 9/15/30 | | 855,000 | 1,003,911 |
| PBF Holding Co., LLC/PBF Finance Corp. 144A company guaranty sr. notes 9.25%, 5/15/25 | | 2,790,000 | 2,901,600 |
| Precision Drilling Corp. 144A company guaranty sr. unsec. notes 7.125%, 1/15/26 (Canada) | | 3,250,000 | 3,233,750 |
| Precision Drilling Corp. 144A company guaranty sr. unsec. notes 6.875%, 1/15/29 (Canada) | | 520,000 | 501,800 |
| Rattler Midstream LP 144A company guaranty sr. unsec. notes 5.625%, 7/15/25 | | 1,590,000 | 1,625,918 |
| Rockcliff Energy II, LLC 144A sr. unsec. notes 5.50%, 10/15/29 | | 2,628,000 | 2,483,460 |
| SM Energy Co. sr. unsec. notes 6.625%, 1/15/27 | | 990,000 | 994,979 |
| SM Energy Co. sr. unsec. unsub. notes 6.75%, 9/15/26 | | 975,000 | 986,242 |
| SM Energy Co. sr. unsec. unsub. notes 6.50%, 7/15/28 | | 1,980,000 | 1,966,467 |
| | | |
| CORPORATE BONDS AND NOTES (84.2%)* cont. | Principal
amount | Value |
| Oil and gas cont. |
| Southwestern Energy Co. company guaranty sr. unsec. notes 5.375%, 3/15/30 | | $2,755,000 | $2,789,438 |
| Southwestern Energy Co. company guaranty sr. unsec. notes 5.375%, 2/1/29 | | 4,030,000 | 4,054,281 |
| Tallgrass Energy Partners LP/Tallgrass Energy Finance Corp. 144A company guaranty sr. unsec. notes 6.00%, 12/31/30 | | 1,615,000 | 1,454,388 |
| Tallgrass Energy Partners LP/Tallgrass Energy Finance Corp. 144A company guaranty sr. unsec. notes 5.50%, 1/15/28 | | 2,529,000 | 2,339,325 |
| Transcanada Trust company guaranty jr. unsec. sub. FRB 5.50%, 9/15/79 (Canada) | | 320,000 | 300,719 |
| Transocean Pontus, Ltd. 144A company guaranty sr. notes 6.125%, 8/1/25 (Cayman Islands) | | 924,960 | 908,773 |
| Transocean Poseidon, Ltd. 144A company guaranty sr. notes 6.875%, 2/1/27 | | 1,586,250 | 1,506,938 |
| Transocean, Inc. 144A company guaranty sr. unsec. notes 11.50%, 1/30/27 | | 1,500,000 | 1,503,233 |
| Venture Global Calcasieu Pass, LLC 144A company guaranty sr. bonds 3.875%, 11/1/33 | | 2,370,000 | 2,150,775 |
| Viper Energy Partners LP 144A company guaranty sr. unsec. notes 5.375%, 11/1/27 | | 965,000 | 960,159 |
| | | 120,370,179 |
| Publishing (1.0%) |
| Cengage Learning, Inc. 144A sr. unsec. unsub. notes 9.50%, 6/15/24 | | 2,730,000 | 2,576,110 |
| McGraw-Hill Education, Inc. 144A sr. notes 5.75%, 8/1/28 | | 2,860,000 | 2,608,277 |
| McGraw-Hill Education, Inc. 144A sr. unsec. notes 8.00%, 8/1/29 | | 2,930,000 | 2,536,696 |
| News Corp. 144A company guaranty sr. unsec. unsub. bonds 5.125%, 2/15/32 | | 265,000 | 252,413 |
| News Corp. 144A sr. unsec. notes 3.875%, 5/15/29 | | 2,875,000 | 2,659,490 |
| | | 10,632,986 |
| Retail (1.1%) |
| Asbury Automotive Group, Inc. 144A company guaranty sr. unsec. bonds 5.00%, 2/15/32 | | 230,000 | 208,286 |
| Asbury Automotive Group, Inc. 144A company guaranty sr. unsec. notes 4.625%, 11/15/29 | | 455,000 | 419,458 |
| Bath & Body Works, Inc. company guaranty sr. unsec. bonds 6.75%, perpetual maturity | | 1,186,000 | 1,058,505 |
| Bath & Body Works, Inc. company guaranty sr. unsec. notes 7.50%, perpetual maturity | | 1,637,000 | 1,690,203 |
| Bath & Body Works, Inc. 144A company guaranty sr. unsec. notes 9.375%, 7/1/25 | | 277,000 | 298,799 |
| Bath & Body Works, Inc. 144A company guaranty sr. unsec. unsub. bonds 6.625%, 10/1/30 | | 1,030,000 | 1,028,161 |
| Macy’s Retail Holdings, LLC 144A company guaranty sr. unsec. unsub. bonds 6.125%, 3/15/32 | | 965,000 | 866,088 |
| Macy’s Retail Holdings, LLC 144A company guaranty sr. unsec. unsub. notes 5.875%, 3/15/30 | | 240,000 | 219,000 |
| PetSmart Inc/PetSmart Finance Corp. 144A company guaranty sr. notes 4.75%, 2/15/28 | | 1,180,000 | 1,085,600 |
| PetSmart Inc/PetSmart Finance Corp. 144A company guaranty sr. unsec. notes 7.75%, 2/15/29 | | 1,815,000 | 1,707,933 |
| Victoria’s Secret & Co. 144A sr. unsec. notes 4.625%, 7/15/29 | | 2,765,000 | 2,260,388 |
| | | 10,842,421 |
| | | |
| CORPORATE BONDS AND NOTES (84.2%)* cont. | Principal
amount | Value |
| Technology (3.5%) |
| Ahead DB Holdings, LLC 144A company guaranty sr. unsec. notes 6.625%, 5/1/28 | | $3,545,000 | $3,024,648 |
| Arches Buyer, Inc. 144A sr. notes 4.25%, 6/1/28 | | 2,775,000 | 2,533,242 |
| Arches Buyer, Inc. 144A sr. unsec. notes 6.125%, 12/1/28 | | 1,100,000 | 923,593 |
| Boxer Parent Co., Inc. 144A company guaranty sr. notes 7.125%, 10/2/25 | | 1,225,000 | 1,199,814 |
| Clarivate Science Holdings Corp. 144A sr. unsec. notes 4.875%, 7/1/29 | | 2,425,000 | 2,171,588 |
| CommScope Finance, LLC 144A sr. notes 6.00%, 3/1/26 | | 1,005,000 | 982,388 |
| CommScope, Inc. 144A company guaranty sr. unsec. notes 8.25%, 3/1/27 | | 1,654,000 | 1,455,107 |
| Crowdstrike Holdings, Inc. company guaranty sr. unsec. notes 3.00%, 2/15/29 | | 3,729,000 | 3,384,068 |
| Imola Merger Corp. 144A sr. notes 4.75%, 5/15/29 | | 3,927,000 | 3,686,471 |
| MSCI, Inc. 144A company guaranty sr. unsec. notes 3.625%, 9/1/30 | | 1,675,000 | 1,534,082 |
| ON Semiconductor Corp. 144A company guaranty sr. unsec. notes 3.875%, 9/1/28 | | 1,095,000 | 1,038,728 |
| Rocket Software, Inc. 144A sr. unsec. notes 6.50%, 2/15/29 | | 4,050,000 | 3,169,125 |
| Tempo Acquisition, LLC/Tempo Acquisition Finance Corp. 144A company guaranty sr. notes 5.75%, 6/1/25 | | 935,000 | 932,825 |
| TTM Technologies, Inc. 144A company guaranty sr. unsec. notes 4.00%, 3/1/29 | | 1,705,000 | 1,508,925 |
| Twilio, Inc. company guaranty sr. unsec. notes 3.875%, 3/15/31 | | 1,200,000 | 1,088,796 |
| Twilio, Inc. company guaranty sr. unsec. notes 3.625%, 3/15/29 | | 2,270,000 | 2,076,902 |
| ZoomInfo Technologies, LLC/ZoomInfo Finance Corp. 144A company guaranty sr. unsec. notes 3.875%, 2/1/29 | | 5,750,000 | 5,016,875 |
| | | 35,727,177 |
| Textiles (0.8%) |
| Hanesbrands, Inc. 144A company guaranty sr. unsec. unsub. notes 4.875%, 5/15/26 | | 1,155,000 | 1,143,138 |
| Hanesbrands, Inc. 144A company guaranty sr. unsec. unsub. notes 4.625%, 5/15/24 | | 2,165,000 | 2,154,175 |
| Kontoor Brands, Inc. 144A company guaranty sr. unsec. notes 4.125%, 11/15/29 | | 2,710,000 | 2,303,500 |
| Levi Strauss & Co. 144A sr. unsec. sub. bonds 3.50%, 3/1/31 | | 2,705,000 | 2,373,638 |
| | | 7,974,451 |
| Toys (0.2%) |
| Mattel, Inc. 144A company guaranty sr. unsec. notes 3.75%, 4/1/29 | | 1,695,000 | 1,628,217 |
| Mattel, Inc. 144A company guaranty sr. unsec. notes 3.375%, 4/1/26 | | 460,000 | 446,108 |
| | | 2,074,325 |
| Transportation (1.5%) |
| American Airlines, Inc./AAdvantage Loyalty IP, Ltd. 144A company guaranty sr. notes 5.75%, 4/20/29 | | 2,255,000 | 2,178,894 |
| American Airlines, Inc./AAdvantage Loyalty IP, Ltd. 144A company guaranty sr. notes 5.50%, 4/20/26 | | 2,255,000 | 2,230,443 |
| Delta Air Lines, Inc./SkyMiles IP, Ltd. 144A company guaranty sr. notes 4.75%, 10/20/28 | | 3,295,000 | 3,290,557 |
| United Airlines, Inc. 144A company guaranty sr. notes 4.625%, 4/15/29 | | 890,000 | 834,998 |
| | | |
| CORPORATE BONDS AND NOTES (84.2%)* cont. | Principal
amount | Value |
| Transportation cont. |
| United Airlines, Inc. 144A company guaranty sr. notes 4.375%, 4/15/26 | | $890,000 | $858,888 |
| Watco Cos., LLC/Watco Finance Corp. 144A sr. unsec. notes 6.50%, 6/15/27 | | 6,255,000 | 5,938,281 |
| | | 15,332,061 |
| Utilities and power (2.6%) |
| Buckeye Partners LP sr. unsec. bonds 5.85%, 11/15/43 | | 1,088,000 | 848,423 |
| Buckeye Partners LP sr. unsec. notes 3.95%, 12/1/26 | | 922,000 | 882,999 |
| Buckeye Partners LP 144A sr. unsec. notes 4.50%, 3/1/28 | | 890,000 | 828,571 |
| Calpine Corp. 144A company guaranty sr. notes 4.50%, 2/15/28 | | 3,345,000 | 3,197,653 |
| Calpine Corp. 144A sr. unsec. notes 5.00%, 2/1/31 | | 455,000 | 405,514 |
| Calpine Corp. 144A sr. unsec. notes 4.625%, 2/1/29 | | 225,000 | 195,750 |
| CenterPoint Energy, Inc. jr. unsec. sub. FRN 6.125%, perpetual maturity | | 330,000 | 292,920 |
| Dominion Energy, Inc. jr. unsec. sub. FRN 4.65%, perpetual maturity | | 320,000 | 297,504 |
| Duke Energy Corp. jr. unsec. sub. FRB 3.25%, 1/15/82 | | 350,000 | 282,961 |
| Electricite De France SA 144A jr. unsec. sub. FRN 5.625%, perpetual maturity (France) | | 240,000 | 234,552 |
| Emera, Inc. jr. unsec. sub. FRB 6.75%, 6/15/76 (Canada) | | 450,000 | 445,461 |
| Enbridge, Inc. unsec. sub. FRB 6.00%, 1/15/77 (Canada) | | 320,000 | 311,486 |
| Energy Transfer LP jr. unsec. sub. FRN 6.625%, perpetual maturity | | 6,451,000 | 5,217,247 |
| Energy Transfer LP jr. unsec. sub. FRN 6.50%, perpetual maturity | | 200,000 | 186,726 |
| Energy Transfer LP jr. unsec. sub. FRN 6.25%, perpetual maturity | | 330,000 | 267,713 |
| NextEra Energy Capital Holdings, Inc. company guaranty jr. unsec. sub. FRB 5.65%, 5/1/79 | | 450,000 | 420,358 |
| NextEra Energy Capital Holdings, Inc. company guaranty jr. unsec. sub. FRB 3.80%, 3/15/82 | | 250,000 | 210,817 |
| NiSource, Inc. jr. unsec. sub. FRN 5.65%, perpetual maturity | | 500,000 | 472,500 |
| NRG Energy, Inc. company guaranty sr. unsec. notes 6.625%, 1/15/27 | | 178,000 | 182,686 |
| NRG Energy, Inc. 144A company guaranty sr. unsec. bonds 3.875%, 2/15/32 | | 3,470,000 | 3,053,600 |
| NRG Energy, Inc. 144A sr. unsec. bonds 5.25%, 6/15/29 | | 983,000 | 958,661 |
| Pacific Gas and Electric Co. company guaranty sr. unsec. unsub. notes 2.95%, 3/1/26 | | 2,215,000 | 2,057,986 |
| Southern Co. (The) jr. unsec. sub. FRB 3.75%, 9/15/51 | | 500,000 | 446,033 |
| Vistra Corp. 144A jr. unsec. sub. FRN 8.00%, 10/15/51 | | 100,000 | 99,250 |
| Vistra Corp. 144A jr. unsec. sub. FRN 7.00%, perpetual maturity | | 925,000 | 887,047 |
| Vistra Operations Co., LLC 144A company guaranty sr. unsec. notes 5.50%, 9/1/26 | | 2,590,000 | 2,572,569 |
| Vistra Operations Co., LLC 144A company guaranty sr. unsec. sub. notes 5.00%, 7/31/27 | | 1,430,000 | 1,398,976 |
| | | 26,655,963 |
| Total corporate bonds and notes (cost $933,214,037) | $860,930,140 |
|
| | | |
| SENIOR LOANS (5.3%)*c | Principal
amount | Value |
| Basic materials (0.5%) |
| CP Atlas Buyer, Inc. bank term loan FRN Ser. B1, (BBA LIBOR USD 3 Month + 3.75%), 4.81%, 11/23/27 | | $2,940,070 | $2,665,673 |
| Herens US Holdco Corp. bank term loan FRN Ser. B, (BBA LIBOR USD 3 Month + 4.00%), 5.006%, 4/30/28 | | 158,802 | 147,240 |
Klockner-Pentaplast of America, Inc. bank term loan FRN
(BBA LIBOR USD 3 Month + 4.75%), 5.554%, 2/4/26 | | 1,470,150 | 1,302,303 |
| Starfruit US Holdco, LLC bank term loan FRN Ser. B, (BBA LIBOR USD 3 Month + 3.00%), 4.006%, 10/1/25 | | 1,398,501 | 1,350,714 |
| | | 5,465,930 |
| Capital goods (0.2%) |
| Filtration Group Corp. bank term loan FRN (1 Month US LIBOR + 3.50%), 4.56%, 10/19/28 | | 373,125 | 356,334 |
| MajorDrive Holdings IV, LLC bank term loan FRN (BBA LIBOR USD 3 Month + 4.00%), 5.598%, 6/1/28 | | 1,696,777 | 1,533,462 |
| | | 1,889,796 |
| Communication services (0.4%) |
| Asurion, LLC bank term loan FRN (BBA LIBOR USD 3 Month + 5.25%), 6.31%, 1/30/29 | | 1,390,000 | 1,244,050 |
| Asurion, LLC bank term loan FRN Ser. B9, (BBA LIBOR USD 3 Month + 3.25%), 4.31%, 7/31/27 | | 918,045 | 867,094 |
| DIRECTV Financing, LLC bank term loan FRN (BBA LIBOR USD 3 Month + 5.00%), 6.06%, 7/22/27 | | 2,225,150 | 2,149,117 |
| | | 4,260,261 |
| Consumer cyclicals (1.1%) |
AMC Entertainment Holdings, Inc. bank term loan FRN Ser. B,
(BBA LIBOR USD 3 Month + 3.00%), 3.844%, 4/22/26 | | 2,135,000 | 1,876,793 |
| AppleCaramel Buyer, LLC bank term loan FRN (CME TERM SOFR 3 Month PLUS CSA + 0.00%), 4.784%, 10/19/27 | | 1,709,029 | 1,629,064 |
| Clear Channel Outdoor Holdings, Inc. bank term loan FRN Ser. B, (BBA LIBOR USD 3 Month + 3.50%), 4.738%, 8/21/26 | | 2,087,198 | 1,905,007 |
| Cornerstone Building Brands, Inc. bank term loan FRN (BBA LIBOR USD 3 Month + 3.25%), 4.125%, 4/12/28 | | 1,267,451 | 1,123,278 |
| Robertshaw Holdings Corp. bank term loan FRN (BBA LIBOR USD 3 Month + 8.00%), 9.063%, 2/28/26 | | 1,915,000 | 1,340,500 |
| Terrier Media Buyer, Inc. bank term loan FRN (BBA LIBOR USD 3 Month + 3.50%), 4.56%, 12/17/26 | | 1,891,704 | 1,811,307 |
| Werner Finco LP bank term loan FRN Ser. B, (BBA LIBOR USD 3 Month + 4.00%), 5.006%, 7/24/24 | | 1,210,979 | 1,150,430 |
| | | 10,836,379 |
| Consumer staples (0.8%) |
| Ascend Learning, LLC bank term loan FRN (1 Month US LIBOR + 5.75%), 6.81%, 11/18/29 | | 1,570,000 | 1,488,878 |
| Brand Industrial Services, Inc. bank term loan FRN (BBA LIBOR USD 3 Month + 4.25%), 5.396%, 6/21/24 | | 3,643,813 | 3,236,908 |
| PECF USS Intermediate Holding III Corp. bank term loan FRN Ser. B, (1 Month US LIBOR + 4.25%), 5.31%, 12/17/28 | | 3,759,988 | 3,536,155 |
| | | 8,261,941 |
| | | |
| SENIOR LOANS (5.3%)*c cont. | Principal
amount | Value |
| Energy (0.4%) |
| ChampionX Holding, Inc. bank term loan FRN Ser. B, (BBA LIBOR USD 3 Month + 4.00%), 8.00%, 6/3/27 | | $1,592,929 | $1,590,938 |
| CQP Holdco LP bank term loan FRN (BBA LIBOR USD 3 Month + 3.75%), 4.756%, 6/4/28 | | 2,719,450 | 2,640,287 |
| | | 4,231,225 |
| Health care (0.6%) |
| Global Medical Response, Inc. bank term loan FRN (1 Month US LIBOR + 4.25%), 5.25%, 10/2/25 | | 2,035,646 | 1,936,409 |
| One Call Corp. bank term loan FRN Ser. B, (1 Month US LIBOR + 5.50%), 6.25%, 4/22/27 | | 1,310,088 | 1,126,675 |
| Quorum Health Corp. bank term loan FRN (BBA LIBOR USD 3 Month + 7.75%), 8.75%, 4/29/25 | | 3,402,847 | 2,756,306 |
| | | 5,819,390 |
| Technology (1.0%) |
| Arches Buyer, Inc. bank term loan FRN (BBA LIBOR USD 3 Month + 3.25%), 4.31%, 12/6/27 | | 1,408,973 | 1,322,673 |
| Epicor Software Corp. bank term loan FRN (BBA LIBOR USD 3 Month + 7.75%), 8.81%, 7/30/28 | | 1,145,000 | 1,133,550 |
| Greeneden US Holdings II, LLC bank term loan FRN (BBA LIBOR USD 3 Month + 4.00%), 5.06%, 12/1/27 | | 1,673,813 | 1,623,297 |
| Polaris Newco, LLC bank term loan FRN Ser. B, (BBA LIBOR USD 3 Month + 4.00%), 5.06%, 6/3/28 | | 1,436,800 | 1,368,380 |
| Proofpoint, Inc. bank term loan FRN Ser. B, (BBA LIBOR USD 3 Month + 6.25%), 6.75%, 8/31/29 | | 835,000 | 815,169 |
| Rocket Software, Inc. bank term loan FRN (BBA LIBOR USD 3 Month + 4.25%), 5.31%, 11/28/25 | | 1,146,338 | 1,103,705 |
| UKG, Inc. bank term loan FRN (1 Month US LIBOR + 5.25%), 6.212%, 5/3/27 | | 1,450,000 | 1,387,476 |
| UKG, Inc. bank term loan FRN (1 Month US LIBOR + 3.25%), 4.212%, 5/3/26 | | 1,741,132 | 1,675,213 |
| | | 10,429,463 |
| Transportation (0.3%) |
| American Airlines, Inc. bank term loan FRN (BBA LIBOR USD 3 Month + 4.75%), 5.813%, 4/20/28 | | 1,055,000 | 1,050,516 |
| United Airlines, Inc. bank term loan FRN Ser. B, (BBA LIBOR USD 3 Month + 3.75%), 4.711%, 4/21/28 | | 2,207,700 | 2,144,229 |
| | | 3,194,745 |
| Total senior loans (cost $58,308,462) | $54,389,130 |
|
| | | |
| CONVERTIBLE BONDS AND NOTES (2.2%)* | Principal
amount | Value |
| Akamai Technologies, Inc. cv. sr. unsec. notes 0.375%, 9/1/27 | | $90,000 | $94,000 |
| Avalara, Inc. 144A cv. sr. unsec. notes 0.25%, 8/1/26 | | 1,796,000 | 1,480,478 |
| Block, Inc. cv. sr. unsec. sub. notes 0.25%, 11/1/27 | | 90,000 | 71,721 |
| Burlington Stores, Inc. cv. sr. unsec. notes 2.25%, 4/15/25 | | 58,000 | 63,003 |
| Cable One, Inc. company guaranty cv. sr. unsec. notes 1.125%, 3/15/28 | | 70,000 | 59,290 |
| Chegg, Inc. cv. sr. unsec. notes zero %, 9/1/26 | | 1,952,000 | 1,483,520 |
| Cloudflare, Inc. 144A cv. sr. unsec. notes zero %, 8/15/26 | | 78,000 | 62,975 |
| Coupa Software, Inc. cv. sr. unsec. notes 0.375%, 6/15/26 | | 120,000 | 94,445 |
| DexCom, Inc. cv. sr. unsec. unsub. notes 0.25%, 11/15/25 | | 83,000 | 78,007 |
| | | |
| CONVERTIBLE BONDS AND NOTES (2.2%)* cont. | Principal
amount | Value |
| DISH Network Corp. cv. sr. unsec. notes 3.375%, 8/15/26 | | $1,768,000 | $1,332,780 |
| Exact Sciences Corp. cv. sr. unsec. sub. notes 0.375%, 3/1/28 | | 50,000 | 37,469 |
| Expedia Group, Inc. company guaranty cv. sr. unsec. unsub. notes zero %, 2/15/26 | | 100,000 | 101,158 |
| Fiverr International, Ltd. cv. sr. unsec. notes zero %, 11/1/25 (Israel) | | 1,460,000 | 1,120,550 |
| Ford Motor Co. cv. sr. unsec. notes zero %, 3/15/26 | | 88,000 | 91,696 |
| Jazz Investments I, Ltd. company guaranty cv. sr. unsec. sub. notes 1.50%, 8/15/24 (Ireland) | | 60,000 | 58,831 |
| Liberty TripAdvisor Holdings, Inc. 144A cv. sr. unsec. bonds 0.50%, 6/30/51 | | 2,083,000 | 1,529,862 |
| Middleby Corp. (The) cv. sr. unsec. notes 1.00%, 9/1/25 | | 870,000 | 1,112,159 |
| Nabors Industries, Inc. company guaranty cv. sr. unsec. notes 0.75%, 1/15/24 | | 2,830,000 | 2,646,050 |
| Okta, Inc. cv. sr. unsec. notes 0.375%, 6/15/26 | | 110,000 | 89,976 |
| ON Semiconductor Corp. cv. sr. unsec. notes zero %, 5/1/27 | | 999,000 | 1,312,445 |
| Palo Alto Networks, Inc. cv. sr. unsec. notes 0.375%, 6/1/25 | | 76,000 | 132,164 |
| RingCentral, Inc. cv. sr. unsec. notes zero %, 3/15/26 | | 100,000 | 77,300 |
| Royal Caribbean Cruises, Ltd. cv. sr. unsec. notes 4.25%, 6/15/23 | | 70,000 | 74,566 |
| Shake Shack, Inc. cv. sr. unsec. notes zero %, 3/1/28 | | 1,917,000 | 1,320,813 |
| Shift4 Payments, Inc. cv. sr. unsec. sub. notes zero %, 12/15/25 | | 80,000 | 72,450 |
| Shopify, Inc. cv. sr. unsec. notes 0.125%, 11/1/25 (Canada) | | 60,000 | 51,240 |
| SoFi Technologies, Inc. 144A cv. sr. unsec. notes zero %, 10/15/26 | | 49,000 | 34,251 |
| Southwest Airlines Co. cv. sr. unsec. notes 1.25%, 5/1/25 | | 74,000 | 101,084 |
| Splunk, Inc. cv. sr. unsec. notes 1.125%, 6/15/27 | | 1,015,000 | 865,795 |
| Spotify USA, Inc. company guaranty cv. sr. unsec. notes zero %, 3/15/26 | | 1,849,000 | 1,497,690 |
| Teladoc Health, Inc. cv. sr. unsec. sub. notes 1.25%, 6/1/27 | | 1,872,000 | 1,441,440 |
| Transocean, Inc. company guaranty cv. sr. unsec. sub. notes 0.50%, 1/30/23 | | 1,009,000 | 970,532 |
| Twitter, Inc. cv. sr. unsec. sub. notes zero %, 3/15/26 | | 31,000 | 27,978 |
| Unity Software, Inc. 144A cv. sr. unsec. notes zero %, 11/15/26 | | 1,916,000 | 1,447,539 |
| Upwork, Inc. 144A cv. sr. unsec. notes 0.25%, 8/15/26 | | 1,926,000 | 1,459,444 |
| Zendesk, Inc. cv. sr. unsec. notes 0.625%, 6/15/25 | | 70,000 | 75,215 |
| Total convertible bonds and notes (cost $25,390,110) | $22,569,916 |
|
| | |
| COMMON STOCKS (1.3%)* | Shares | Value |
| Altice USA, Inc. Class A † | 54,455 | $619,698 |
| Antero Resources Corp. † | 95,700 | 4,103,616 |
| Frontier Communications Parent, Inc. † | 56,890 | 1,475,158 |
| General Motors Co. † | 23,615 | 913,428 |
| iHeartMedia, Inc. Class A † | 72,259 | 852,656 |
| Oasis Petroleum, Inc. | 23,337 | 3,704,282 |
| OneMain Holdings, Inc. | 31,610 | 1,392,737 |
| Texas Competitive Electric Holdings Co., LLC/TCEH Finance, Inc. (Rights) | 104,590 | 130,738 |
| Tribune Media Co. Class 1C | 297,958 | 2,980 |
| Total common stocks (cost $10,437,141) | $13,195,293 |
|
| | |
| CONVERTIBLE PREFERRED STOCKS (0.9%)* | Shares | Value |
| Aptiv PLC $5.50 cv. pfd. | 6,945 | $851,608 |
| Becton Dickinson and Co. $3.00 cv. pfd. | 2,500 | 128,375 |
| Broadcom, Inc. 8.00% cv. pfd. | 1,080 | 1,958,501 |
| Clarivate PLC $5.25 cv. pfd. (United Kingdom) | 18,245 | 1,104,976 |
| Danaher Corp. 5.00% cv. pfd. | 99 | 140,570 |
| DTE Energy Co. $3.13 cv. pfd. | 2,100 | 110,186 |
| KKR & Co., Inc. $3.00 cv. pfd. | 17,508 | 1,197,022 |
| PG&E Corp. $5.50 cv. pfd. | 14,350 | 1,622,667 |
| Southern Co. (The) $3.38 cv. pfd. | 2,000 | 112,627 |
| T-Mobile US, Inc. 144A 5.25% cv. pfd. † | 1,659 | 1,893,678 |
| Total convertible preferred stocks (cost $9,125,682) | $9,120,210 |
|
| | |
| U.S. TREASURY OBLIGATIONS (0.0%)* | Principal
amount | Value |
| U.S. Treasury Notes 1.625%, 8/15/29 i | $124,000 | $115,542 |
| Total U.S. treasury obligations (cost $115,542) | $115,542 |
|
| | |
| PREFERRED STOCKS (0.0%)* | Shares | Value |
| PennyMac Mortgage Investment Trust Ser. A, $2.031 pfd. ARP R | 4,000 | $101,600 |
| Total preferred stocks (cost $106,000) | $101,600 |
|
| | | | |
| WARRANTS (0.0%)* † | Expiration
date | Strike
price | Warrants | Value |
| Guaranteed Rate, Inc. F | 3/1/23 | $0.01 | 868 | $43 |
| Total warrants (cost $43) | $43 |
|
| | | |
| SHORT-TERM INVESTMENTS (3.7%)* | Shares | Value |
| Putnam Short Term Investment Fund Class P 0.83% L | | 38,248,089 | $38,248,089 |
| Total short-term investments (cost $38,248,089) | $38,248,089 |
|
| |
| TOTAL INVESTMENTS |
| Total investments (cost $1,074,945,106) | $998,669,963 |
|
| |
| Key to holding’s currency abbreviations |
| EUR | Euro |
|
| |
| Key to holding’s abbreviations |
| ARP | Adjustable Rate Preferred Stock: The rate shown is the current interest rate at the close of the reporting period. |
| DAC | Designated Activity Company |
| EMTN | Euro Medium Term Notes |
| FRB | Floating Rate Bonds: The rate shown is the current interest rate at the close of the reporting period. Rates may be subject to a cap or floor. For certain securities, the rate may represent a fixed rate currently in place at the close of the reporting period. |
| FRN | Floating Rate Notes: The rate shown is the current interest rate or yield at the close of the reporting period. Rates may be subject to a cap or floor. For certain securities, the rate may represent a fixed rate currently in place at the close of the reporting period. |
| LIBOR | London Interbank Offered Rate |
| REGS | Securities sold under Regulation S may not be offered, sold or delivered within the United States except pursuant to an exemption from, or in a transaction not subject to, the registration requirements of the Securities Act of 1933. |
| SOFR | Secured Overnight Financing Rate |
|
| | | |
| Notes to the fund’s portfolio |
| Unless noted otherwise, the notes to the fund’s portfolio are for the close of the fund’s reporting period, which ran from December 1, 2021 through May 31, 2022 (the reporting period). Within the following notes to the portfolio, references to “Putnam Management” represent Putnam Investment Management, LLC, the fund’s manager, an indirect wholly-owned subsidiary of Putnam Investments, LLC and references to “ASC 820” represent Accounting Standards Codification 820 Fair Value Measurements and Disclosures. |
| * | Percentages indicated are based on net assets of $1,022,107,284. |
| † | This security is non-income-producing. |
| ‡‡ | Income may be received in cash or additional securities at the discretion of the issuer. The rate shown in parenthesis is the rate paid in kind, if applicable. |
| c | Senior loans are exempt from registration under the Securities Act of 1933, as amended, but contain certain restrictions on resale and cannot be sold publicly. These loans pay interest at rates which adjust periodically. The interest rates shown for senior loans are the current interest rates at the close of the reporting period. Senior loans are also subject to mandatory and/or optional prepayment which cannot be predicted. As a result, the remaining maturity may be substantially less than the stated maturity shown (Notes 1 and 7). |
| F | This security is valued by Putnam Management at fair value following procedures approved by the Trustees. Securities are classified as Level 3 for ASC 820 based on the securities’ valuation inputs (Note 1). |
| i | This security was pledged, or purchased with cash that was pledged, to the fund for collateral on certain derivative contracts (Note 1). |
| L | Affiliated company (Note 5). The rate quoted in the security description is the annualized 7-day yield of the fund at the close of the reporting period. |
| R | Real Estate Investment Trust. |
| Unless otherwise noted, the rates quoted in Short-term investments security descriptions represent the weighted average yield to maturity. |
| Debt obligations are considered secured unless otherwise indicated. |
| 144A after the name of an issuer represents securities exempt from registration under Rule 144A of the Securities Act of 1933, as amended. These securities may be resold in transactions exempt from registration, normally to qualified institutional buyers. |
| The dates shown on debt obligations are the original maturity dates. |
|
| | | | | | |
| FORWARD CURRENCY CONTRACTS at 5/31/22 (aggregate face value $2,720,566) (Unaudited) |
| Counterparty | Currency | Contract
type* | Delivery
date | Value | Aggregate
face value | Unrealized
appreciation/
(depreciation) |
| Morgan Stanley & Co. International PLC |
| Euro | Buy | 6/15/22 | $79,383 | $78,000 | $1,383 |
| State Street Bank and Trust Co. |
| Euro | Sell | 6/15/22 | 2,550,039 | 2,642,566 | 92,527 |
| Unrealized appreciation | 93,910 |
| Unrealized (depreciation) | — |
| Total | $93,910 |
| * The exchange currency for all contracts listed is the United States Dollar. |
|
| ASC 820 establishes a three-level hierarchy for disclosure of fair value measurements. The valuation hierarchy is based upon the transparency of inputs to the valuation of the fund’s investments. The three levels are defined as follows: |
Level 1: Valuations based on quoted prices for identical securities in active markets.
Level 2: Valuations based on quoted prices in markets that are not active or for which all significant inputs are observable, either directly or indirectly.
Level 3: Valuations based on inputs that are unobservable and significant to the fair value measurement.
| The following is a summary of the inputs used to value the fund’s net assets as of the close of the reporting period: |
|
| | | |
| | Valuation inputs |
| Investments in securities: | Level 1 | Level 2 | Level 3 |
| Common stocks*: | | | |
| Communication services | $2,094,856 | $— | $— |
| Consumer cyclicals | 1,766,084 | 2,980 | — |
| Energy | 7,807,898 | — | — |
| Financials | 1,392,737 | — | — |
| Utilities and power | — | 130,738 | — |
| Total common stocks | 13,061,575 | 133,718 | — |
| Convertible bonds and notes | — | 22,569,916 | — |
| Convertible preferred stocks | — | 9,120,210 | — |
| Corporate bonds and notes | — | 860,930,140 | — |
| Preferred stocks | 101,600 | — | — |
| Senior loans | — | 54,389,130 | — |
| U.S. treasury obligations | — | 115,542 | — |
| Warrants | — | — | 43 |
| Short-term investments | — | 38,248,089 | — |
| Totals by level | $13,163,175 | $985,506,745 | $43 |
|
| | | |
| | Valuation inputs |
| Other financial instruments: | Level 1 | Level 2 | Level 3 |
| Forward currency contracts | $— | $93,910 | $— |
| Totals by level | $— | $93,910 | $— |
| * Common stock classifications are presented at the sector level, which may differ from the fund’s portfolio presentation. |
| At the start and close of the reporting period, Level 3 investments in securities represented less than 1% of the fund’s net assets and were not considered a significant portion of the fund’s portfolio. |
The accompanying notes are an integral part of these financial statements.
Statement of assets and liabilities 5/31/22 (Unaudited)
| |
| ASSETS | |
| Investment in securities, at value (Notes 1 and 9): | |
| Unaffiliated issuers (identified cost $1,036,697,017) | $960,421,874 |
| Affiliated issuers (identified cost $38,248,089) (Note 5) | 38,248,089 |
| Cash | 836,844 |
| Dividends, interest and other receivables | 14,724,230 |
| Receivable for shares of the fund sold | 7,796,377 |
| Receivable for investments sold | 10,827,973 |
| Unrealized appreciation on forward currency contracts (Note 1) | 93,910 |
| Prepaid assets | 67,271 |
| Total assets | 1,033,016,568 |
| |
| LIABILITIES | |
| Payable for investments purchased | 3,313,946 |
| Payable for shares of the fund repurchased | 5,444,602 |
| Payable for compensation of Manager (Note 2) | 476,682 |
| Payable for custodian fees (Note 2) | 10,750 |
| Payable for investor servicing fees (Note 2) | 274,853 |
| Payable for Trustee compensation and expenses (Note 2) | 642,943 |
| Payable for administrative services (Note 2) | 3,505 |
| Payable for distribution fees (Note 2) | 343,579 |
| Collateral on certain derivative contracts, at value (Notes 1 and 9) | 115,542 |
| Other accrued expenses | 282,882 |
| Total liabilities | 10,909,284 |
| | |
| Net assets | $1,022,107,284 |
| |
| REPRESENTED BY | |
| Paid-in capital (Unlimited shares authorized) (Notes 1 and 4) | $1,193,750,868 |
| Total distributable earnings (Note 1) | (171,643,584) |
| Total — Representing net assets applicable to capital shares outstanding | $1,022,107,284 |
| |
| COMPUTATION OF NET ASSET VALUE AND OFFERING PRICE | |
| Net asset value and redemption price per class A share | |
| ($705,648,447 divided by 131,097,162 shares) | $5.38 |
| Offering price per class A share (100/96.00 of $5.38)* | $5.60 |
| Net asset value and offering price per class B share ($2,085,017 divided by 400,157 shares)** | $5.21 |
| Net asset value and offering price per class C share ($10,283,447 divided by 1,985,264 shares)** | $5.18 |
| Net asset value and redemption price per class M share | |
| ($46,848,511 divided by 8,756,874 shares) | $5.35 |
| Offering price per class M share (100/96.75 of $5.35)† | $5.53 |
| Net asset value, offering price and redemption price per class R share | |
| ($16,758,809 divided by 3,134,223 shares) | $5.35 |
| Net asset value, offering price and redemption price per class R6 share | |
| ($18,350,980 divided by 3,214,470 shares) | $5.71 |
| Net asset value, offering price and redemption price per class Y share | |
| ($222,132,073 divided by 38,751,829 shares) | $5.73 |
* On single retail sales of less than $100,000. On sales of $100,000 or more the offering price is reduced.
** Redemption price per share is equal to net asset value less any applicable contingent deferred sales charge.
† On single retail sales of less than $50,000. On sales of $50,000 or more the offering price is reduced.
The accompanying notes are an integral part of these financial statements.
Statement of operations Six months ended 5/31/22 (Unaudited)
| |
| INVESTMENT INCOME | |
| Interest (including interest income of $48,489 from investments in affiliated issuers) (Note 5) | $29,506,204 |
| Dividends (net of foreign tax of $15,126) | 556,191 |
| Total investment income | 30,062,395 |
| |
| EXPENSES | |
| Compensation of Manager (Note 2) | 3,039,823 |
| Investor servicing fees (Note 2) | 850,773 |
| Custodian fees (Note 2) | 12,958 |
| Trustee compensation and expenses (Note 2) | 21,997 |
| Distribution fees (Note 2) | 1,190,115 |
| Administrative services (Note 2) | 19,761 |
| Other | 317,601 |
| Total expenses | 5,453,028 |
| Expense reduction (Note 2) | (807) |
| Net expenses | 5,452,221 |
| | |
| Net investment income | 24,610,174 |
| |
| REALIZED AND UNREALIZED GAIN (LOSS) | |
| Net realized gain (loss) on: | |
| Securities from unaffiliated issuers (Notes 1 and 3) | (2,998,642) |
| Foreign currency transactions (Note 1) | (3,068) |
| Forward currency contracts (Note 1) | 110,706 |
| Total net realized loss | (2,891,004) |
| Change in net unrealized appreciation (depreciation) on: | |
| Securities from unaffiliated issuers | (90,708,364) |
| Assets and liabilities in foreign currencies | (78) |
| Forward currency contracts | 43,754 |
| Total change in net unrealized depreciation | (90,664,688) |
| | |
| Net loss on investments | (93,555,692) |
| |
| Net decrease in net assets resulting from operations | $(68,945,518) |
The accompanying notes are an integral part of these financial statements.
Statement of changes in net assets
| | |
| DECREASE IN NET ASSETS | Six months ended 5/31/22* | Year ended 11/30/21 |
| Operations | | |
| Net investment income | $24,610,174 | $52,659,433 |
| Net realized gain (loss) on investments | | |
| and foreign currency transactions | (2,891,004) | 26,972,222 |
| Change in net unrealized depreciation of investments | | |
| and assets and liabilities in foreign currencies | (90,664,688) | (23,500,493) |
| Net increase (decrease) in net assets resulting | | |
| from operations | (68,945,518) | 56,131,162 |
| Distributions to shareholders (Note 1): | | |
| From ordinary income | | |
| Net investment income | | |
| Class A | (16,907,244) | (35,365,502) |
| Class B | (48,836) | (155,204) |
| Class C | (231,592) | (551,575) |
| Class M | (1,067,593) | (2,230,613) |
| Class R | (366,980) | (704,435) |
| Class R6 | (433,495) | (782,726) |
| Class Y | (5,186,202) | (12,191,080) |
| Decrease from capital share transactions (Note 4) | (48,453,505) | (101,861,879) |
| Total decrease in net assets | (141,640,965) | (97,711,852) |
| |
| NET ASSETS | | |
| Beginning of period | 1,163,748,249 | 1,261,460,101 |
| End of period | $1,022,107,284 | $1,163,748,249 |
* Unaudited.
The accompanying notes are an integral part of these financial statements.
Financial highlights
(For a common share outstanding throughout the period)
| | | | | | | | | | | | |
| | INVESTMENT OPERATIONS | | | LESS DISTRIBUTIONS | | | RATIOS AND SUPPLEMENTAL DATA | | |
| | | | | | | | | | | | Ratio | |
| | | | Net realized | | | | | | | | of net investment | |
| | Net asset value, | | and unrealized | Total from | From net | | | Total return | Net assets, | Ratio of expenses | income (loss) | |
| | beginning | Net investment | gain (loss) | investment | investment | Total | Net asset value, | at net asset value | end of period | to average | to average | Portfolio |
| Period ended | of period | income (loss)a | on investments | operations | income | distributions | end of period | (%)b | (in thousands) | net assets (%)c | net assets (%) | turnover (%) |
| Class A | | | | | | | | | | | | |
| May 31, 2022** | $5.86 | .13 | (.48) | (.35) | (.13) | (.13) | $5.38 | (6.11)* | $705,648 | .51* | 2.22* | 13* |
| November 30, 2021 | 5.85 | .25 | .01 | .26 | (.25) | (.25) | 5.86 | 4.51 | 808,041 | 1.01 | 4.21 | 48 |
| November 30, 2020 | 5.82 | .26 | .04 | .30 | (.27) | (.27) | 5.85 | 5.57 | 839,550 | 1.03 | 4.66 | 46 |
| November 30, 2019 | 5.59 | .28 | .24 | .52 | (.29) | (.29) | 5.82 | 9.46 | 896,789 | 1.02 | 4.94 | 37 |
| November 30, 2018 | 5.93 | .30 | (.35) | (.05) | (.29) | (.29) | 5.59 | (.94) | 898,320 | 1.03 | 5.20 | 33 |
| November 30, 2017 | 5.78 | .30 | .16 | .46 | (.31) | (.31) | 5.93 | 8.11 | 1,054,712 | 1.04d | 5.12 | 47 |
| Class B | | | | | | | | | | | | |
| May 31, 2022** | $5.68 | .10 | (.46) | (.36) | (.11) | (.11) | $5.21 | (6.49)* | $2,085 | .89* | 1.84* | 13* |
| November 30, 2021 | 5.68 | .20 | .01 | .21 | (.21) | (.21) | 5.68 | 3.68 | 3,306 | 1.76 | 3.48 | 48 |
| November 30, 2020 | 5.65 | .22 | .04 | .26 | (.23) | (.23) | 5.68 | 4.95 | 5,637 | 1.78 | 3.94 | 46 |
| November 30, 2019 | 5.43 | .24 | .23 | .47 | (.25) | (.25) | 5.65 | 8.73 | 10,087 | 1.77 | 4.22 | 37 |
| November 30, 2018 | 5.77 | .25 | (.35) | (.10) | (.24) | (.24) | 5.43 | (1.74) | 14,151 | 1.78 | 4.46 | 33 |
| November 30, 2017 | 5.63 | .25 | .15 | .40 | (.26) | (.26) | 5.77 | 7.30 | 21,868 | 1.79d | 4.41 | 47 |
| Class C | | | | | | | | | | | | |
| May 31, 2022** | $5.65 | .10 | (.46) | (.36) | (.11) | (.11) | $5.18 | (6.49)* | $10,283 | .89* | 1.84* | 13* |
| November 30, 2021 | 5.65 | .20 | .01 | .21 | (.21) | (.21) | 5.65 | 3.72 | 12,762 | 1.76 | 3.48 | 48 |
| November 30, 2020 | 5.62 | .21 | .05 | .26 | (.23) | (.23) | 5.65 | 4.99 | 20,415 | 1.78 | 3.92 | 46 |
| November 30, 2019 | 5.41 | .23 | .23 | .46 | (.25) | (.25) | 5.62 | 8.58 | 30,768 | 1.77 | 4.22 | 37 |
| November 30, 2018 | 5.74 | .25 | (.33) | (.08) | (.25) | (.25) | 5.41 | (1.55) | 37,341 | 1.78 | 4.46 | 33 |
| November 30, 2017 | 5.61 | .25 | .15 | .40 | (.27) | (.27) | 5.74 | 7.18 | 56,274 | 1.79d | 4.37 | 47 |
| Class M | | | | | | | | | | | | |
| May 31, 2022** | $5.83 | .12 | (.48) | (.36) | (.12) | (.12) | $5.35 | (6.24)* | $46,849 | .64* | 2.10* | 13* |
| November 30, 2021 | 5.82 | .23 | .02 | .25 | (.24) | (.24) | 5.83 | 4.32 | 52,676 | 1.26 | 3.96 | 48 |
| November 30, 2020 | 5.79 | .25 | .04 | .29 | (.26) | (.26) | 5.82 | 5.37 | 55,549 | 1.28 | 4.41 | 46 |
| November 30, 2019 | 5.56 | .27 | .24 | .51 | (.28) | (.28) | 5.79 | 9.28 | 59,320 | 1.27 | 4.67 | 37 |
| November 30, 2018 | 5.91 | .29 | (.36) | (.07) | (.28) | (.28) | 5.56 | (1.32) | 79,376 | 1.28 | 4.96 | 33 |
| November 30, 2017 | 5.76 | .29 | .16 | .45 | (.30) | (.30) | 5.91 | 7.90 | 89,239 | 1.29d | 4.94 | 47 |
| Class R | | | | | | | | | | | | |
| May 31, 2022** | $5.83 | .12 | (.48) | (.36) | (.12) | (.12) | $5.35 | (6.24)* | $16,759 | .64* | 2.10* | 13* |
| November 30, 2021 | 5.82 | .23 | .02 | .25 | (.24) | (.24) | 5.83 | 4.32 | 16,485 | 1.26 | 3.96 | 48 |
| November 30, 2020 | 5.79 | .25 | .04 | .29 | (.26) | (.26) | 5.82 | 5.35 | 17,059 | 1.28 | 4.42 | 46 |
| November 30, 2019 | 5.56 | .27 | .24 | .51 | (.28) | (.28) | 5.79 | 9.28 | 23,954 | 1.27 | 4.69 | 37 |
| November 30, 2018 | 5.90 | .29 | (.35) | (.06) | (.28) | (.28) | 5.56 | (1.15) | 27,080 | 1.28 | 4.95 | 33 |
| November 30, 2017 | 5.76 | .29 | .15 | .44 | (.30) | (.30) | 5.90 | 7.74 | 28,817 | 1.29d | 4.93 | 47 |
See notes to financial highlights at the end of this section.
The accompanying notes are an integral part of these financial statements.
| |
| 46 High Yield Fund | High Yield Fund 47 |
Financial highlights cont.
| | | | | | | | | | | | |
| | INVESTMENT OPERATIONS | | | LESS DISTRIBUTIONS | | | RATIOS AND SUPPLEMENTAL DATA | | |
| | | | | | | | | | | | Ratio | |
| | | | Net realized | | | | | | | | of net investment | |
| | Net asset value, | | and unrealized | Total from | From net | | | Total return | Net assets, | Ratio of expenses | income (loss) | |
| | beginning | Net investment | gain (loss) | investment | investment | Total | Net asset value, | at net asset value | end of period | to average | to average | Portfolio |
| Period ended | of period | income (loss)a | on investments | operations | income | distributions | end of period | (%)b | (in thousands) | net assets (%)c | net assets (%) | turnover (%) |
| Class R6 | | | | | | | | | | | | |
| May 31, 2022** | $6.21 | .14 | (.50) | (.36) | (.14) | (.14) | $5.71 | (5.90)* | $18,351 | .34* | 2.40* | 13* |
| November 30, 2021 | 6.19 | .29 | .01 | .30 | (.28) | (.28) | 6.21 | 4.82 | 18,888 | .66 | 4.55 | 48 |
| November 30, 2020 | 6.14 | .30 | .05 | .35 | (.30) | (.30) | 6.19 | 6.04 | 16,039 | .67 | 5.02 | 46 |
| November 30, 2019 | 5.88 | .32 | .25 | .57 | (.31) | (.31) | 6.14 | 9.94 | 15,255 | .66 | 5.27 | 37 |
| November 30, 2018† | 6.07 | .18 | (.21) | (.03) | (.16) | (.16) | 5.88 | (.60)* | 13,611 | .35* | 2.95* | 33 |
| Class Y | | | | | | | | | | | | |
| May 31, 2022** | $6.24 | .14 | (.52) | (.38) | (.13) | (.13) | $5.73 | (6.13)* | $222,132 | .39* | 2.34* | 13* |
| November 30, 2021 | 6.21 | .28 | .01 | .29 | (.26) | (.26) | 6.24 | 4.77 | 251,589 | .76 | 4.46 | 48 |
| November 30, 2020 | 6.15 | .29 | .06 | .35 | (.29) | (.29) | 6.21 | 5.98 | 307,210 | .78 | 4.91 | 46 |
| November 30, 2019 | 5.88 | .31 | .26 | .57 | (.30) | (.30) | 6.15 | 9.89 | 321,497 | .77 | 5.16 | 37 |
| November 30, 2018 | 6.22 | .33 | (.37) | (.04) | (.30) | (.30) | 5.88 | (.71) | 247,593 | .78 | 5.46 | 33 |
| November 30, 2017 | 6.05 | .33 | .16 | .49 | (.32) | (.32) | 6.22 | 8.28 | 355,378 | .79d | 5.37 | 47 |
* Not annualized.
** Unaudited.
† For the period May 22, 2018 (commencement of operations) to November 30, 2018.
a Per share net investment income (loss) has been determined on the basis of the weighted average number of shares outstanding during the period.
b Total return assumes dividend reinvestment and does not reflect the effect of sales charges.
c Includes amounts paid through expense offset and/or brokerage service arrangements, if any (Note 2). Also excludes acquired fund fees and expenses, if any.
d Includes one-time merger costs of 0.01% as a percentage of average net assets.
The accompanying notes are an integral part of these financial statements.
| |
| 48 High Yield Fund | High Yield Fund 49 |
Notes to financial statements 5/31/22 (Unaudited)
Within the following Notes to financial statements, references to “State Street” represent State Street Bank and Trust Company, references to “the SEC” represent the Securities and Exchange Commission, references to “Putnam Management” represent Putnam Investment Management, LLC, the fund’s manager, an indirect wholly-owned subsidiary of Putnam Investments, LLC and references to “OTC”, if any, represent over-the-counter. Unless otherwise noted, the “reporting period” represents the period from December 1, 2021 through May 31, 2022.
Putnam High Yield Fund (the fund) is a Massachusetts business trust, which is registered under the Investment Company Act of 1940, as amended, as a diversified open-end management investment company. The goal of the fund is to seek high current income. Capital growth is a secondary goal when consistent with achieving high current income. The fund invests mainly in bonds that are obligations of U.S. companies, are below-investment-grade in quality (sometimes referred to as “junk bonds”), and have intermediate- to long-term maturities (three years or longer). Under normal circumstances, the fund invests at least 80% of the fund’s net assets in securities rated below-investment-grade. This policy may be changed only after 60 days’ notice to shareholders. Putnam Management may also invest in other debt instruments, including loans. Putnam Management may consider, among other factors, credit, interest rate and prepayment risks, as well as general market conditions, when deciding whether to buy or sell investments. The fund may also use derivatives, such as futures, options, certain foreign currency transactions and swap contracts, for both hedging and non-hedging purposes.
The fund offers class A, class B, class C, class M, class R, class R6 and class Y shares. Purchases of class B shares are closed to new and existing investors except by exchange from class B shares of another Putnam fund or through dividend and/or capital gains reinvestment. Class A and class M shares are sold with a maximum front-end sales charge of 4.00% and 3.25%, respectively. Class A shares generally are not subject to a contingent deferred sales charge, and class M, class R, class R6 and class Y shares are not subject to a contingent deferred sales charge. Class B shares, which convert to class A shares after approximately eight years, are not subject to a front-end sales charge and are subject to a contingent deferred sales charge if those shares are redeemed within six years of purchase. Class C shares are subject to a one-year 1.00% contingent deferred sales charge and generally convert to class A shares after approximately eight years. Class R shares, which are not available to all investors, are sold at net asset value. The expenses for class A, class B, class C, class M and class R shares may differ based on the distribution fee of each class, which is identified in Note 2. Class R6 and class Y shares, which are sold at net asset value, are generally subject to the same expenses as class A, class B, class C, class M and class R shares, but do not bear a distribution fee, and in the case of class R6 shares, bear a lower investor servicing fee, which is identified in Note 2. Class M, class R6 and class Y shares are not available to all investors.
In the normal course of business, the fund enters into contracts that may include agreements to indemnify another party under given circumstances. The fund’s maximum exposure under these arrangements is unknown as this would involve future claims that may be, but have not yet been, made against the fund. However, the fund’s management team expects the risk of material loss to be remote.
The fund has entered into contractual arrangements with an investment adviser, administrator, distributor, shareholder servicing agent and custodian, who each provide services to the fund. Unless expressly stated otherwise, shareholders are not parties to, or intended beneficiaries of these contractual arrangements, and these contractual arrangements are not intended to create any shareholder right to enforce them against the service providers or to seek any remedy under them against the service providers, either directly or on behalf of the fund.
Under the fund’s Amended and Restated Agreement and Declaration of Trust, any claims asserted against or on behalf of the Putnam Funds, including claims against Trustees and Officers, must be brought in state and federal courts located within the Commonwealth of Massachusetts.
Note 1: Significant accounting policies
The following is a summary of significant accounting policies consistently followed by the fund in the preparation of its financial statements. The preparation of financial statements is in conformity with accounting principles generally accepted in the United States of America and requires management to make estimates and assumptions that affect the reported amounts of assets and liabilities in the financial statements and the reported amounts of increases and decreases in net assets from operations. Actual results could differ from those estimates. Subsequent events after the Statement of assets and liabilities date through the date that the financial statements were issued have been evaluated in the preparation of the financial statements.
Investment income, realized and unrealized gains and losses and expenses of the fund are borne pro-rata based on the relative net assets of each class to the total net assets of the fund, except that each class bears expenses unique to that class (including the distribution fees applicable to such classes). Each class votes as a class only with respect to its own distribution plan or other matters on which a class vote is required by law or determined by the Trustees. If the fund were liquidated, shares of each class would receive their pro-rata share of the net assets of the fund. In addition, the Trustees declare separate dividends on each class of shares.
Security valuation Portfolio securities and other investments are valued using policies and procedures adopted by the Board of Trustees. The Trustees have formed a Pricing Committee to oversee the implementation of these procedures and have delegated responsibility for valuing the fund’s assets in accordance with these procedures to Putnam Management. Putnam Management has established an internal Valuation Committee that is responsible for making fair value determinations, evaluating the effectiveness of the pricing policies of the fund and reporting to the Pricing Committee.
Investments for which market quotations are readily available are valued at the last reported sales price on their principal exchange, or official closing price for certain markets, and are classified as Level 1 securities under Accounting Standards Codification 820 Fair Value Measurements and Disclosures (ASC 820). If no sales are reported, as in the case of some securities that are traded OTC, a security is valued at its last reported bid price and is generally categorized as a Level 2 security.
Investments in open-end investment companies (excluding exchange-traded funds), if any, which can be classified as Level 1 or Level 2 securities, are valued based on their net asset value. The net asset value of such investment companies equals the total value of their assets less their liabilities and divided by the number of their outstanding shares.
Market quotations are not considered to be readily available for certain debt obligations (including short-term investments with remaining maturities of 60 days or less) and other investments; such investments are valued on the basis of valuations furnished by an independent pricing service approved by the Trustees or dealers selected by Putnam Management. Such services or dealers determine valuations for normal institutional-size trading units of such securities using methods based on market transactions for comparable securities and various relationships, generally recognized by institutional traders, between securities (which consider such factors as security prices, yields, maturities and ratings). These securities will generally be categorized as Level 2.
Many securities markets and exchanges outside the U.S. close prior to the scheduled close of the New York Stock Exchange and therefore the closing prices for securities in such markets or on such exchanges may not fully reflect events that occur after such close but before the scheduled close of the New York Stock Exchange. Accordingly, on certain days, the fund will fair value certain foreign equity securities taking into account multiple factors including movements in the U.S. securities markets, currency valuations and comparisons to the valuation of American Depository Receipts, exchange-traded funds and futures contracts. The foreign equity securities, which would generally be classified as Level 1 securities, will be transferred to Level 2 of the fair value hierarchy when they are valued at fair value. The number of days on which fair value prices will be used will depend on market activity and it is possible that fair value prices will be used by the fund to a significant extent. Securities quoted in foreign currencies, if any, are translated into U.S. dollars at the current exchange rate.
To the extent a pricing service or dealer is unable to value a security or provides a valuation that Putnam Management does not believe accurately reflects the security’s fair value, the security will be valued at fair value by Putnam Management in accordance with policies and procedures approved by the Trustees. Certain investments, including certain restricted and illiquid securities and derivatives, are also valued at fair value following procedures approved by the Trustees. These valuations consider such factors as significant market or specific security events such as interest rate or credit quality changes, various relationships with other securities, discount rates, U.S. Treasury, U.S. swap and credit yields, index levels, convexity exposures, recovery rates, sales and other multiples and resale restrictions. These securities are classified as Level 2 or as Level 3 depending on the priority of the significant inputs.
To assess the continuing appropriateness of fair valuations, the Valuation Committee reviews and affirms the reasonableness of such valuations on a regular basis after considering all relevant information that is reasonably available. Such valuations and procedures are reviewed periodically by the Trustees. The fair value of securities is generally determined as the amount that the fund could reasonably expect to realize from an orderly disposition of such securities over a reasonable period of time. By its nature, a fair value price is a good faith estimate of the value of a security in a current sale and does not reflect an actual market price, which may be different by a material amount.
Security transactions and related investment income Security transactions are recorded on the trade date (the date the order to buy or sell is executed). Gains or losses on securities sold are determined on the identified cost basis.
Interest income, net of any applicable withholding taxes, if any, and including amortization and accretion of premiums and discounts on debt securities, is recorded on the accrual basis. Dividend income, net of any applicable withholding taxes, is recognized on the ex-dividend date except that certain dividends from foreign securities, if any, are recognized as soon as the fund is informed of the ex-dividend date. Non-cash dividends, if any, are recorded at the fair value of the securities received. Dividends representing a return of capital or capital gains, if any, are reflected as a reduction of cost and/or as a realized gain.
The fund may have earned certain fees in connection with its senior loan purchasing activities. These fees, if any, are treated as market discount and are amortized into income in the Statement of operations.
Foreign currency translation The accounting records of the fund are maintained in U.S. dollars. The fair value of foreign securities, currency holdings, and other assets and liabilities is recorded in the books and records of the fund after translation to U.S. dollars based on the exchange rates on that day. The cost of each security is determined using historical exchange rates. Income and withholding taxes are translated at prevailing exchange rates when earned or incurred. The fund does not isolate that portion of realized or unrealized gains or losses resulting from changes in the foreign exchange rate on investments from fluctuations arising from changes in the market prices of the securities. Such gains and losses are included with the net realized and unrealized gain or loss on investments. Net realized gains and losses on foreign currency transactions represent net realized exchange gains or losses on disposition of foreign currencies, currency gains and losses realized between the trade and settlement dates on securities transactions and the difference between the amount of investment income and foreign withholding taxes recorded on the fund’s books and the U.S. dollar equivalent amounts actually received or paid. Net unrealized appreciation and depreciation of assets and liabilities in foreign currencies arise from changes in the value of assets and liabilities other than investments at the period end, resulting from changes in the exchange rate.
Forward currency contracts The fund buys and sells forward currency contracts, which are agreements between two parties to buy and sell currencies at a set price on a future date. These contracts are used for hedging currency exposures.
The U.S. dollar value of forward currency contracts is determined using current forward currency exchange rates supplied by a quotation service. The fair value of the contract will fluctuate with changes in currency exchange rates. The contract is marked to market daily and the change in fair value is recorded as an unrealized gain or loss. The fund records a realized gain or loss equal to the difference between the value of the contract at the time it was opened and the value at the time it was closed when the contract matures or by delivery of the currency. The fund could be exposed to risk if the value of the currency changes unfavorably, if the counterparties to the contracts are unable to meet the terms of their contracts or if the fund is unable to enter into a closing position. Risks may exceed amounts recognized on the Statement of assets and liabilities.
Forward currency contracts outstanding at period end, if any, are listed after the fund’s portfolio.
Master agreements The fund is a party to ISDA (International Swaps and Derivatives Association, Inc.) Master Agreements that govern OTC derivative and foreign exchange contracts and Master Securities Forward Transaction Agreements that govern transactions involving mortgage-backed and other asset-backed securities that may result in delayed delivery (Master Agreements) with certain counterparties entered into from time to time. The Master Agreements may contain provisions regarding, among other things, the parties’ general obligations, representations, agreements, collateral requirements, events of default and early termination. With respect to certain counterparties, in accordance with the terms of the Master Agreements, collateral pledged to the fund is held in a segregated account by the fund’s custodian and, with respect to those amounts which can be sold or repledged, are presented in the fund’s portfolio.
Collateral pledged by the fund is segregated by the fund’s custodian and identified in the fund’s portfolio. Collateral can be in the form of cash or debt securities issued by the U.S. Government or related agencies or other securities as agreed to by the fund and the applicable counterparty. Collateral requirements are determined based on the fund’s net position with each counterparty.
With respect to ISDA Master Agreements, termination events applicable to the fund may occur upon a decline in the fund’s net assets below a specified threshold over a certain period of time. Termination events applicable to counterparties may occur upon a decline in the counterparty’s long-term or short-term credit ratings below a specified level. In each case, upon occurrence, the other party may elect to terminate early and cause settlement
of all derivative and foreign exchange contracts outstanding, including the payment of any losses and costs resulting from such early termination, as reasonably determined by the terminating party. Any decision by one or more of the fund’s counterparties to elect early termination could impact the fund’s future derivative activity.
At the close of the reporting period, the fund did not have a net liability position on open derivative contracts subject to the Master Agreements.
Interfund lending The fund, along with other Putnam funds, may participate in an interfund lending program pursuant to an exemptive order issued by the SEC. This program allows the fund to borrow from or lend to other Putnam funds that permit such transactions. Interfund lending transactions are subject to each fund’s investment policies and borrowing and lending limits. Interest earned or paid on the interfund lending transaction will be based on the average of certain current market rates. During the reporting period, the fund did not utilize the program.
Lines of credit The fund participates, along with other Putnam funds, in a $317.5 million unsecured committed line of credit and a $235.5 million unsecured uncommitted line of credit, both provided by State Street. Borrowings may be made for temporary or emergency purposes, including the funding of shareholder redemption requests and trade settlements. Interest is charged to the fund based on the fund’s borrowing at a rate equal to 1.25% plus the higher of (1) the Federal Funds rate and (2) the Overnight Bank Funding Rate for the committed line of credit and 1.30% plus the higher of (1) the Federal Funds rate and (2) the Overnight Bank Funding Rate for the uncommitted line of credit. A closing fee equal to 0.04% of the committed line of credit and 0.04% of the uncommitted line of credit has been paid by the participating funds. In addition, a commitment fee of 0.21% per annum on any unutilized portion of the committed line of credit is allocated to the participating funds based on their relative net assets and paid quarterly. During the reporting period, the fund had no borrowings against these arrangements.
Federal taxes It is the policy of the fund to distribute all of its taxable income within the prescribed time period and otherwise comply with the provisions of the Internal Revenue Code of 1986, as amended (the Code), applicable to regulated investment companies. It is also the intention of the fund to distribute an amount sufficient to avoid imposition of any excise tax under Section 4982 of the Code.
The fund is subject to the provisions of Accounting Standards Codification 740 Income Taxes (ASC 740). ASC 740 sets forth a minimum threshold for financial statement recognition of the benefit of a tax position taken or expected to be taken in a tax return. The fund did not have a liability to record for any unrecognized tax benefits in the accompanying financial statements. No provision has been made for federal taxes on income, capital gains or unrealized appreciation on securities held nor for excise tax on income and capital gains. Each of the fund’s federal tax returns for the prior three fiscal years remains subject to examination by the Internal Revenue Service.
The fund may also be subject to taxes imposed by governments of countries in which it invests. Such taxes are generally based on either income or gains earned or repatriated. The fund accrues and applies such taxes to net investment income, net realized gains and net unrealized gains as income and/or capital gains are earned. In some cases, the fund may be entitled to reclaim all or a portion of such taxes, and such reclaim amounts, if any, are reflected as an asset on the fund’s books. In many cases, however, the fund may not receive such amounts for an extended period of time, depending on the country of investment.
Under the Regulated Investment Company Modernization Act of 2010, the fund will be permitted to carry forward capital losses incurred for an unlimited period and the carry forwards will retain their character as either short-term or long-term capital losses. At November 30, 2021, the fund had the following capital loss carryovers available, to the extent allowed by the Code, to offset future net capital gain, if any:
| | |
| | Loss carryover | |
| Short-term | Long-term | Total |
| $422,638 | $103,103,809 | $103,526,447 |
Tax cost of investments includes adjustments to net unrealized appreciation (depreciation) which may not necessarily be final tax cost basis adjustments, but closely approximate the tax basis unrealized gains and losses that may be realized and distributed to shareholders. The aggregate identified cost on a tax basis is $1,074,797,436, resulting in gross unrealized appreciation and depreciation of $12,958,043 and $88,991,606, respectively, or net unrealized depreciation of $76,033,563.
Distributions to shareholders Distributions to shareholders from net investment income are recorded by the fund on the ex-dividend date. Distributions from capital gains, if any, are recorded on the ex-dividend date and
paid at least annually. The amount and character of income and gains to be distributed are determined in accordance with income tax regulations, which may differ from generally accepted accounting principles. Dividend sources are estimated at the time of declaration. Actual results may vary. Any non-taxable return of capital cannot be determined until final tax calculations are completed after the end of the fund’s fiscal year. Reclassifications are made to the fund’s capital accounts to reflect income and gains available for distribution (or available capital loss carryovers) under income tax regulations.
Note 2: Management fee, administrative services and other transactions
The fund pays Putnam Management a management fee (based on the fund’s average net assets and computed and paid monthly) at annual rates that may vary based on the average of the aggregate net assets of all open-end mutual funds sponsored by Putnam Management (excluding net assets of funds that are invested in, or that are invested in by, other Putnam funds to the extent necessary to avoid “double counting” of those assets). Such annual rates may vary as follows:
| | | | |
| 0.720% | of the first $5 billion, | | 0.520% | of the next $50 billion, |
| 0.670% | of the next $5 billion, | | 0.500% | of the next $50 billion, |
| 0.620% | of the next $10 billion, | | 0.490% | of the next $100 billion and |
| 0.570% | of the next $10 billion, | | 0.485% | of any excess thereafter. |
For the reporting period, the management fee represented an effective rate (excluding the impact from any expense waivers in effect) of 0.276% of the fund’s average net assets.
Putnam Management has contractually agreed, through March 30, 2024, to waive fees and/or reimburse the fund’s expenses to the extent necessary to limit the cumulative expenses of the fund, exclusive of brokerage, interest, taxes, investment-related expenses, extraordinary expenses, acquired fund fees and expenses and payments under the fund’s investor servicing contract, investment management contract and distribution plans, on a fiscal year-to-date basis to an annual rate of 0.20% of the fund’s average net assets over such fiscal year-to-date period. During the reporting period, the fund’s expenses were not reduced as a result of this limit.
Putnam Investments Limited (PIL), an affiliate of Putnam Management, is authorized by the Trustees to manage a separate portion of the assets of the fund as determined by Putnam Management from time to time. PIL did not manage any portion of the assets of the fund during the reporting period. If Putnam Management were to engage the services of PIL, Putnam Management would pay a quarterly sub-management fee to PIL for its services at an annual rate of 0.40% of the average net assets of the portion of the fund managed by PIL.
The fund reimburses Putnam Management an allocated amount for the compensation and related expenses of certain officers of the fund and their staff who provide administrative services to the fund. The aggregate amount of all such reimbursements is determined annually by the Trustees.
Custodial functions for the fund’s assets are provided by State Street. Custody fees are based on the fund’s asset level, the number of its security holdings and transaction volumes.
Putnam Investor Services, Inc., an affiliate of Putnam Management, provides investor servicing agent functions to the fund. Putnam Investor Services, Inc. received fees for investor servicing for class A, class B, class C, class M, class R and class Y shares that included (1) a per account fee for each direct and underlying non-defined contribution account (retail account) of the fund; (2) a specified rate of the fund’s assets attributable to defined contribution plan accounts; and (3) a specified rate based on the average net assets in retail accounts. Putnam Investor Services, Inc. has agreed that the aggregate investor servicing fees for each fund’s retail and defined contribution accounts for these share classes will not exceed an annual rate of 0.25% of the fund’s average assets attributable to such accounts.
Class R6 shares paid a monthly fee based on the average net assets of class R6 shares at an annual rate of 0.05%.
During the reporting period, the expenses for each class of shares related to investor servicing fees were as follows:
| | | | |
| Class A | $596,686 | | Class R | 13,440 |
| Class B | 2,033 | | Class R6 | 4,715 |
| Class C | 9,300 | | Class Y | 185,330 |
| Class M | 39,269 | | Total | $850,773 |
The fund has entered into expense offset arrangements with Putnam Investor Services, Inc. and State Street whereby Putnam Investor Services, Inc.’s and State Street’s fees are reduced by credits allowed on cash balances. For the reporting period, the fund’s expenses were reduced by $807 under the expense offset arrangements.
Each Independent Trustee of the fund receives an annual Trustee fee, of which $792, as a quarterly retainer, has been allocated to the fund, and an additional fee for each Trustees meeting attended. Trustees also are reimbursed for expenses they incur relating to their services as Trustees.
The fund has adopted a Trustee Fee Deferral Plan (the Deferral Plan) which allows the Trustees to defer the receipt of all or a portion of Trustees fees payable on or after July 1, 1995. The deferred fees remain invested in certain Putnam funds until distribution in accordance with the Deferral Plan.
The fund has adopted an unfunded noncontributory defined benefit pension plan (the Pension Plan) covering all Trustees of the fund who have served as a Trustee for at least five years and were first elected prior to 2004. Benefits under the Pension Plan are equal to 50% of the Trustee’s average annual attendance and retainer fees for the three years ended December 31, 2005. The retirement benefit is payable during a Trustee’s lifetime, beginning the year following retirement, for the number of years of service through December 31, 2006. Pension expense for the fund is included in Trustee compensation and expenses in the Statement of operations. Accrued pension liability is included in Payable for Trustee compensation and expenses in the Statement of assets and liabilities. The Trustees have terminated the Pension Plan with respect to any Trustee first elected after 2003.
The fund has adopted distribution plans (the Plans) with respect to the following share classes pursuant to Rule 12b–1 under the Investment Company Act of 1940. The purpose of the Plans is to compensate Putnam Retail Management Limited Partnership, an indirect wholly-owned subsidiary of Putnam Investments, LLC, for services provided and expenses incurred in distributing shares of the fund. The Plans provide payments by the fund to Putnam Retail Management Limited Partnership at an annual rate of up to the following amounts (Maximum %) of the average net assets attributable to each class. The Trustees have approved payment by the fund at the following annual rate (Approved %) of the average net assets attributable to each class. During the reporting period, the class-specific expenses related to distribution fees were as follows:
| | | |
| | Maximum % | Approved % | Amount |
| Class A | 0.35% | 0.25% | $949,949 |
| Class B | 1.00% | 1.00% | 12,991 |
| Class C | 1.00% | 1.00% | 59,305 |
| Class M | 1.00% | 0.50% | 125,121 |
| Class R | 1.00% | 0.50% | 42,749 |
| Total | | | $1,190,115 |
For the reporting period, Putnam Retail Management Limited Partnership, acting as underwriter, received net commissions of $19,857 and $0 from the sale of class A and class M shares, respectively, and received $42 and $101 in contingent deferred sales charges from redemptions of class B and class C shares, respectively.
A deferred sales charge of up to 1.00% is assessed on certain redemptions of class A shares. For the reporting period, Putnam Retail Management Limited Partnership, acting as underwriter, received $770 on class A redemptions.
Note 3: Purchases and sales of securities
During the reporting period, the cost of purchases and the proceeds from sales, excluding short-term investments, were as follows:
| | |
| | Cost of purchases | Proceeds from sales |
| Investments in securities (Long-term) | $136,022,981 | $168,728,529 |
| U.S. government securities (Long-term) | — | — |
| Total | $136,022,981 | $168,728,529 |
The fund may purchase or sell investments from or to other Putnam funds in the ordinary course of business, which can reduce the fund’s transaction costs, at prices determined in accordance with SEC requirements and policies approved by the Trustees. During the reporting period, purchases or sales of long-term securities from or to other Putnam funds, if any, did not represent more than 5% of the fund’s total cost of purchases and/or total proceeds from sales.
Note 4: Capital shares
At the close of the reporting period, there were an unlimited number of shares of beneficial interest authorized. Transactions, including, if applicable, direct exchanges pursuant to share conversions, in capital shares were as follows:
| | | | |
| | SIX MONTHS ENDED 5/31/22 | YEAR ENDED 11/30/21 |
| Class A | Shares | Amount | Shares | Amount |
| Shares sold | 10,777,874 | $61,325,427 | 31,193,899 | $185,523,487 |
| Shares issued in connection with | | | | |
| reinvestment of distributions | 2,723,100 | 15,310,296 | 5,351,631 | 31,764,167 |
| | 13,500,974 | 76,635,723 | 36,545,530 | 217,287,654 |
| Shares repurchased | (20,184,156) | (114,649,171) | (42,170,425) | (250,865,736) |
| Net decrease | (6,683,182) | $(38,013,448) | (5,624,895) | $(33,578,082) |
| |
| | SIX MONTHS ENDED 5/31/22 | YEAR ENDED 11/30/21 |
| Class B | Shares | Amount | Shares | Amount |
| Shares sold | 1,695 | $9,166 | 15,373 | $87,848 |
| Shares issued in connection with | | | | |
| reinvestment of distributions | 8,193 | 44,685 | 24,695 | 141,967 |
| | 9,888 | 53,851 | 40,068 | 229,815 |
| Shares repurchased | (191,739) | (1,072,741) | (450,893) | (2,598,260) |
| Net decrease | (181,851) | $(1,018,890) | (410,825) | $(2,368,445) |
| |
| | SIX MONTHS ENDED 5/31/22 | YEAR ENDED 11/30/21 |
| Class C | Shares | Amount | Shares | Amount |
| Shares sold | 272,475 | $1,512,240 | 632,710 | $3,631,852 |
| Shares issued in connection with | | | | |
| reinvestment of distributions | 40,620 | 220,023 | 92,103 | 526,762 |
| | 313,095 | 1,732,263 | 724,813 | 4,158,614 |
| Shares repurchased | (586,876) | (3,173,058) | (2,080,028) | (11,881,513) |
| Net decrease | (273,781) | $(1,440,795) | (1,355,215) | $(7,722,899) |
| |
| | SIX MONTHS ENDED 5/31/22 | YEAR ENDED 11/30/21 |
| Class M | Shares | Amount | Shares | Amount |
| Shares sold | 3,630 | $21,381 | 17,600 | $104,418 |
| Shares issued in connection with | | | | |
| reinvestment of distributions | — | — | — | — |
| | 3,630 | 21,381 | 17,600 | 104,418 |
| Shares repurchased | (281,083) | (1,579,622) | (520,250) | (3,079,977) |
| Net decrease | (277,453) | $(1,558,241) | (502,650) | $(2,975,559) |
| | | | |
| | SIX MONTHS ENDED 5/31/22 | YEAR ENDED 11/30/21 |
| Class R | Shares | Amount | Shares | Amount |
| Shares sold | 702,932 | $4,022,027 | 820,608 | $4,852,466 |
| Shares issued in connection with | | | | |
| reinvestment of distributions | 65,685 | 366,068 | 119,137 | 702,843 |
| | 768,617 | 4,388,095 | 939,745 | 5,555,309 |
| Shares repurchased | (463,242) | (2,610,881) | (1,041,137) | (6,167,483) |
| Net increase (decrease) | 305,375 | $1,777,214 | (101,392) | $(612,174) |
| |
| | SIX MONTHS ENDED 5/31/22 | YEAR ENDED 11/30/21 |
| Class R6 | Shares | Amount | Shares | Amount |
| Shares sold | 287,892 | $1,736,060 | 711,987 | $4,483,224 |
| Shares issued in connection with | | | | |
| reinvestment of distributions | 72,858 | 433,493 | 124,552 | 782,726 |
| | 360,750 | 2,169,553 | 836,539 | 5,265,950 |
| Shares repurchased | (186,176) | (1,112,047) | (387,894) | (2,441,115) |
| Net increase | 174,574 | $1,057,506 | 448,645 | $2,824,835 |
| |
| | SIX MONTHS ENDED 5/31/22 | YEAR ENDED 11/30/21 |
| Class Y | Shares | Amount | Shares | Amount |
| Shares sold | 12,817,598 | $78,237,795 | 18,009,190 | $113,486,084 |
| Shares issued in connection with | | | | |
| reinvestment of distributions | 863,803 | 5,171,452 | 1,923,223 | 12,117,687 |
| | 13,681,401 | 83,409,247 | 19,932,413 | 125,603,771 |
| Shares repurchased | (15,276,229) | (92,666,098) | (29,089,122) | (183,033,326) |
| Net decrease | (1,594,828) | $(9,256,851) | (9,156,709) | $(57,429,555) |
Note 5: Affiliated transactions
Transactions during the reporting period with any company which is under common ownership or control were as follows:
| | | | | |
| | | | | | Shares |
| | | | | | outstanding |
| | | | | | and fair |
| | Fair value as | Purchase | Sale | Investment | value as |
| Name of affiliate | of 11/30/21 | cost | proceeds | income | of 5/31/22 |
| Short-term investments | | | | | |
| Putnam Short Term | | | | | |
| Investment Fund* | $16,734,744 | $199,728,308 | $178,214,963 | $48,489 | $38,248,089 |
| Total Short-term | | | | | |
| investments | $16,734,744 | $199,728,308 | $178,214,963 | $48,489 | $38,248,089 |
* Management fees charged to Putnam Short Term Investment Fund have been waived by Putnam Management. There were no realized or unrealized gains or losses during the period.
Note 6: Market, credit and other risks
In the normal course of business, the fund trades financial instruments and enters into financial transactions where risk of potential loss exists due to changes in the market (market risk) or failure of the contracting party to the transaction to perform (credit risk). The fund may be exposed to additional credit risk that an institution or other entity with which the fund has unsettled or open transactions will default. Investments in foreign securities involve certain risks, including those related to economic instability, unfavorable political developments, and currency fluctuations. The fund may invest in higher-yielding, lower-rated bonds that may have a higher rate of default.
On July 27, 2017, the United Kingdom’s Financial Conduct Authority (“FCA”), which regulates LIBOR, announced its intention to cease compelling banks to provide the quotations needed to sustain LIBOR after 2021. ICE Benchmark Administration, the administrator of LIBOR, ceased publication of most LIBOR settings on a representative basis at the end of 2021 and is expected to cease publication of a majority of U.S. dollar LIBOR settings on a representative basis after June 30, 2023. In addition, global regulators have announced that, with limited exceptions, no new LIBOR-based contracts should be entered into after 2021. LIBOR has historically been a common benchmark interest rate index used to make adjustments to variable-rate loans. It is used throughout global banking and financial industries to determine interest rates for a variety of financial instruments and borrowing arrangements. Actions by regulators have resulted in the establishment of alternative reference rates to LIBOR in most major currencies. Various financial industry groups have been planning for the transition away from LIBOR, but there are obstacles to converting certain longer-term securities and transactions to new reference rates. Markets are developing slowly and questions around liquidity in these rates and how to appropriately adjust these rates to mitigate any economic value transfer at the time of transition remain a significant concern. Neither the effect of the transition process nor its ultimate success can yet be known. The transition process might lead to increased volatility and illiquidity in markets that rely on LIBOR to determine interest rates. It could also lead to a reduction in the value of some LIBOR-based investments and reduce the effectiveness of related transactions, such as hedges. While some LIBOR-based instruments may contemplate a scenario where LIBOR is no longer available by providing for an alternative rate-setting methodology, not all may have such provisions and there may be significant uncertainty regarding the effectiveness of any such alternative methodologies. Since the usefulness of LIBOR as a benchmark could deteriorate during the transition period, these effects could occur at any time.
Beginning in January 2020, global financial markets have experienced, and may continue to experience, significant volatility resulting from the spread of a virus known as Covid–19. The outbreak of Covid–19 has resulted in travel and border restrictions, quarantines, supply chain disruptions, lower consumer demand, and general market uncertainty. The effects of Covid–19 have adversely affected, and may continue to adversely affect, the global economy, the economies of certain nations, and individual issuers, all of which may negatively impact the fund’s performance.
Note 7: Senior loan commitments
Senior loans are purchased or sold on a when-issued or delayed delivery basis and may be settled a month or more after the trade date, which from time to time can delay the actual investment of available cash balances; interest income is accrued based on the terms of the securities. Senior loans can be acquired through an agent, by assignment from another holder of the loan, or as a participation interest in another holder’s portion of the loan. When the fund invests in a loan or participation, the fund is subject to the risk that an intermediate participant between the fund and the borrower will fail to meet its obligations to the fund, in addition to the risk that the borrower under the loan may default on its obligations.
Note 8: Summary of derivative activity
The volume of activity for the reporting period for any derivative type that was held during the period is listed below and was based on an average of the holdings at the end of each fiscal quarter:
| |
| Forward currency contracts (contract amount) | $2,500,000 |
| Warrants (number of warrants) | 900 |
The following is a summary of the fair value of derivative instruments as of the close of the reporting period:
| | | | |
| Fair value of derivative instruments as of the close of the reporting period | |
| | ASSET DERIVATIVES | LIABILITY DERIVATIVES |
| Derivatives not | | | | |
| accounted for as | Statement of | | Statement of | |
| hedging instruments | assets and | | assets and | |
| under ASC 815 | liabilities location | Fair value | liabilities location | Fair value |
| Foreign exchange | | | | |
| contracts | Receivables | $93,910 | Payables | $— |
| Equity contracts | Receivables | 43 | Payables | — |
| Total | | $93,953 | | $— |
The following is a summary of realized and change in unrealized gains or losses of derivative instruments in the Statement of operations for the reporting period (Note 1):
| | |
| Amount of realized gain or (loss) on derivatives recognized in net gain or (loss) on investments | |
| Derivatives not accounted for as | Forward currency | |
| hedging instruments under ASC 815 | contracts | Total |
| Foreign exchange contracts | $110,706 | $110,706 |
| Total | $110,706 | $110,706 |
| | |
| Change in unrealized appreciation or (depreciation) on derivatives recognized in net gain or (loss) | |
| on investments | | |
| Derivatives not accounted for as | Forward currency | |
| hedging instruments under ASC 815 | contracts | Total |
| Foreign exchange contracts | $43,754 | $43,754 |
| Total | $43,754 | $43,754 |
Note 9: Offsetting of financial and derivative assets and liabilities
The following table summarizes any derivatives, repurchase agreements and reverse repurchase agreements, at the end of the reporting period, that are subject to an enforceable master netting agreement or similar agreement. For securities lending transactions or borrowing transactions associated with securities sold short, if any, see Note 1. For financial reporting purposes, the fund does not offset financial assets and financial liabilities that are subject to the master netting agreements in the Statement of assets and liabilities.
| | | |
| | Morgan Stanley & | | |
| | Co. International | State Street Bank | |
| | PLC | and Trust Co. | Total |
| Assets: | | | |
| Forward currency contracts # | $1,383 | $92,527 | $93,910 |
| Total Assets | $1,383 | $92,527 | $93,910 |
| Liabilities: | | | |
| Forward currency contracts # | — | — | — |
| Total Liabilities | $— | $— | $— |
| Total Financial and Derivative Net Assets | $1,383 | $92,527 | $93,910 |
| Total collateral received (pledged)†## | $— | $92,527 | |
| Net amount | $1,383 | $— | |
| Controlled collateral received (including | | | |
| TBA commitments)** | $— | $115,542 | $115,542 |
| Uncontrolled collateral received | $— | $— | $— |
| Collateral (pledged) (including TBA commitments)** | $— | $— | $— |
** Included with Investments in securities on the Statement of assets and liabilities.
† Additional collateral may be required from certain brokers based on individual agreements.
# Covered by master netting agreement (Note 1).
## Any over-collateralization of total financial and derivative net assets is not shown. Collateral may include amounts related to unsettled agreements.
Note 10: New accounting pronouncements
In March 2020, the Financial Accounting Standards Board (FASB) issued Accounting Standards Update (ASU) 2020–04, Reference Rate Reform (Topic 848) — Facilitation of the Effects of Reference Rate Reform on Financial Reporting. The amendments in ASU 2020–04 provide optional temporary financial reporting relief from the effect of certain types of contract modifications due to the planned discontinuation of LIBOR and other interbank-offered based reference rates as of the end of 2021. The discontinuation of LIBOR was subsequently extended to June 30, 2023. ASU 2020–04 is effective for certain reference rate-related contract modifications that occur during the period March 12, 2020 through December 31, 2022. Management expects that the adoption of the guidance will not have a material impact on the fund’s financial statements.
Fund information
Founded over 80 years ago, Putnam Investments was built around the concept that a balance between risk and reward is the hallmark of a well-rounded financial program. We manage funds across income, value, blend, growth, sustainable, asset allocation, absolute return, and global sector categories.
| | |
| Investment Manager | Trustees | Richard T. Kircher |
| Putnam Investment | Kenneth R. Leibler, Chair | Vice President and |
| Management, LLC | Barbara M. Baumann, Vice Chair | BSA Compliance Officer |
| 100 Federal Street | Liaquat Ahamed | |
| Boston, MA 02110 | Katinka Domotorffy | Martin Lemaire |
| | Catharine Bond Hill | Vice President and |
| Investment Sub-Advisor | Jennifer Williams Murphy | Derivatives Risk Manager |
| Putnam Investments Limited | Marie Pillai | |
| 16 St James’s Street | George Putnam, III | Susan G. Malloy |
| London, England SW1A 1ER | Robert L. Reynolds | Vice President and |
| | Manoj P. Singh | Assistant Treasurer |
| Marketing Services | Mona K. Sutphen | |
| Putnam Retail Management | | Alan G. McCormack |
| Limited Partnership | Officers | Vice President and |
| 100 Federal Street | Robert L. Reynolds | Derivatives Risk Manager |
| Boston, MA 02110 | President | |
| | | Denere P. Poulack |
| Custodian | James F. Clark | Assistant Vice President, |
| State Street Bank | Vice President, Chief Compliance | Assistant Clerk, and |
| and Trust Company | Officer, and Chief Risk Officer | Assistant Treasurer |
| | | |
| Legal Counsel | Nancy E. Florek | Janet C. Smith |
| Ropes & Gray LLP | Vice President, Director of | Vice President, |
| | Proxy Voting and Corporate | Principal Financial Officer, |
| | Governance, Assistant Clerk, | Principal Accounting Officer, |
| | and Assistant Treasurer | and Assistant Treasurer |
| | | |
| | Michael J. Higgins | Stephen J. Tate |
| | Vice President, Treasurer, | Vice President and |
| | and Clerk | Chief Legal Officer |
| | | |
| | Jonathan S. Horwitz | Mark C. Trenchard |
| | Executive Vice President, | Vice President |
| Principal Executive Officer, | |
| | and Compliance Liaison | |
This report is for the information of shareholders of Putnam High Yield Fund. It may also be used as sales literature when preceded or accompanied by the current prospectus, the most recent copy of Putnam’s Quarterly Performance Summary, and Putnam’s Quarterly Ranking Summary. For more recent performance, please visit putnam.com. Investors should carefully consider the investment objectives, risks, charges, and expenses of a fund, which are described in its prospectus. For this and other information or to request a prospectus or summary prospectus, call 1-800-225-1581 toll free. Please read the prospectus carefully before investing. The fund’s Statement of Additional Information contains additional information about the fund’s Trustees and is available without charge upon request by calling 1-800-225-1581.

| |
| Item 3. Audit Committee Financial Expert: |
| |
| Item 4. Principal Accountant Fees and Services: |
| |
| Item 5. Audit Committee of Listed Registrants |
| |
| Item 6. Schedule of Investments: |
| |
| The registrant’s schedule of investments in unaffiliated issuers is included in the report to shareholders in Item 1 above. |
| |
| Item 7. Disclosure of Proxy Voting Policies and Procedures For Closed-End Management Investment Companies: |
| |
| Item 8. Portfolio Managers of Closed-End Investment Companies |
| |
| Item 9. Purchases of Equity Securities by Closed-End Management Investment Companies and Affiliated Purchasers: |
| |
| Item 10. Submission of Matters to a Vote of Security Holders: |
| |
| Item 11. Controls and Procedures: |
| |
| (a) The registrant’s principal executive officer and principal financial officer have concluded, based on their evaluation of the effectiveness of the design and operation of the registrant’s disclosure controls and procedures as of a date within 90 days of the filing date of this report, that the design and operation of such procedures are generally effective to provide reasonable assurance that information required to be disclosed by the registrant in this report is recorded, processed, summarized and reported within the time periods specified in the Commission’s rules and forms. |
| |
| (b) Changes in internal control over financial reporting: Not applicable |
| |
| Item 12. Disclosures of Securities Lending Activities for Closed-End Investment Companies: |
| |
| Pursuant to the requirements of the Securities Exchange Act of 1934 and the Investment Company Act of 1940, the registrant has duly caused this report to be signed on its behalf by the undersigned, thereunto duly authorized. |
| |
| By (Signature and Title): |
| |
| /s/ Janet C. Smith
Janet C. Smith
Principal Accounting Officer
|
| |
| Pursuant to the requirements of the Securities Exchange Act of 1934 and the Investment Company Act of 1940, this report has been signed below by the following persons on behalf of the registrant and in the capacities and on the dates indicated. |
| |
| By (Signature and Title): |
| |
| /s/ Jonathan S. Horwitz
Jonathan S. Horwitz
Principal Executive Officer
|
| |
| By (Signature and Title): |
| |
| /s/ Janet C. Smith
Janet C. Smith
Principal Financial Officer
|