
CONFIDENTIAL DRAFT
Special Committee Discussion Materials
March 24, 2004
William Blair & Company
Important Information DRAFT
Confidential Material Presented to the Special Committee of the Board of Directors of Johnson Outdoors, Inc.
The following pages contain material that was provided to the Special Committee of the Board of Directors (the “Special Committee”) of Johnson Outdoors Inc. (the “Company”) and is for discussion purposes only. The accompanying material was compiled or prepared on a confidential basis for use by the Special Committee and not with a view toward public disclosure. This material is preliminary in nature and contains assumptions and methodologies which may be subject to change.
Table of Contents DRAFT
I. Executive Summary
II. Situation Overview
III. Valuation Methodologies
A. Comparable Public Companies Analysis
B. Comparable M&A Transactions Analysis
C. M&A Premiums Paid Analysis
D. Discounted Cash Flow Analysis
E. Leveraged Buyout Analysis
Appendix
A. Valuation Matrix
B. Comparable Public Companies Model

DRAFT
Executive Summary
Executive Summary
Implied Transaction Multiples DRAFT
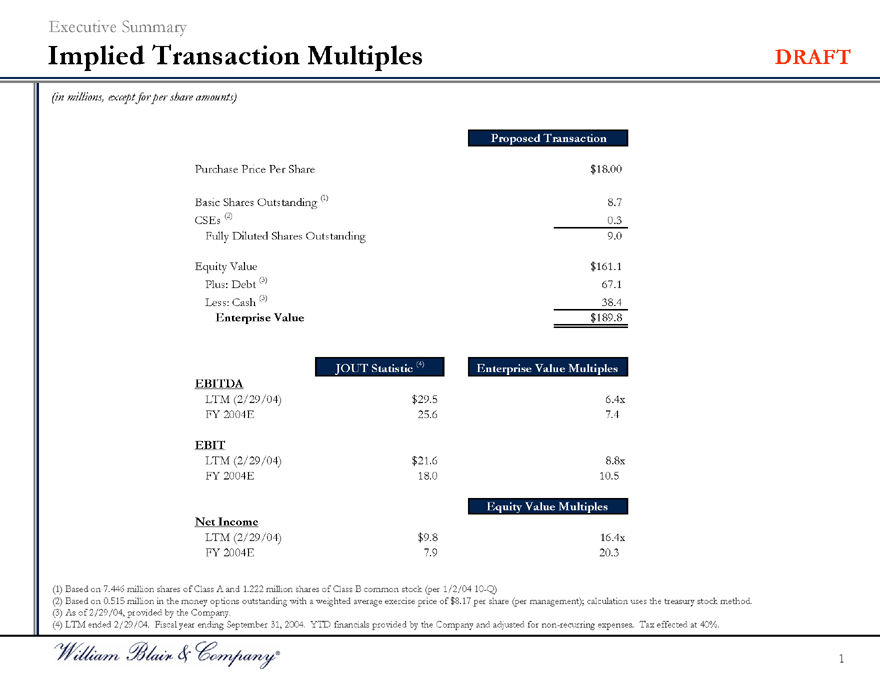
(in millions, except for per share amounts)
Proposed Transaction
Purchase Price Per Share $18.00
Basic Shares Outstanding (1) 8.7
CSEs (2) 0.3
Fully Diluted Shares Outstanding 9.0
Equity Value $161.1
Plus: Debt (3) 67.1
Less: Cash (3) 38.4
Enterprise Value $189.8
JOUT Statistic (4) Enterprise Value Multiples
EBITDA
LTM (2/29/04) $29.5 6.4x
FY 2004E 25.6 7.4
EBIT
LTM (2/29/04) $21.6 8.8x
FY 2004E 18.0 10.5
Equity Value Multiples
Net Income
LTM (2/29/04) $9.8 16.4x
FY 2004E 7.9 20.3
(1) Based on 7.446 million shares of Class A and 1.222 million shares of Class B common stock (per 1/2/04 10-Q)
(2) Based on 0.515 million in the money options outstanding with a weighted average exercise price of $8.17 per share (per management); calculation uses the treasury stock method.
(3) As of 2/29/04, provided by the Company.
(4) LTM ended 2/29/04. Fiscal year ending September 31, 2004. YTD financials provided by the Company and adjusted for non-recurring expenses. Tax effected at 40%.
1
DRAFT
Situation Overview
Situation Overview
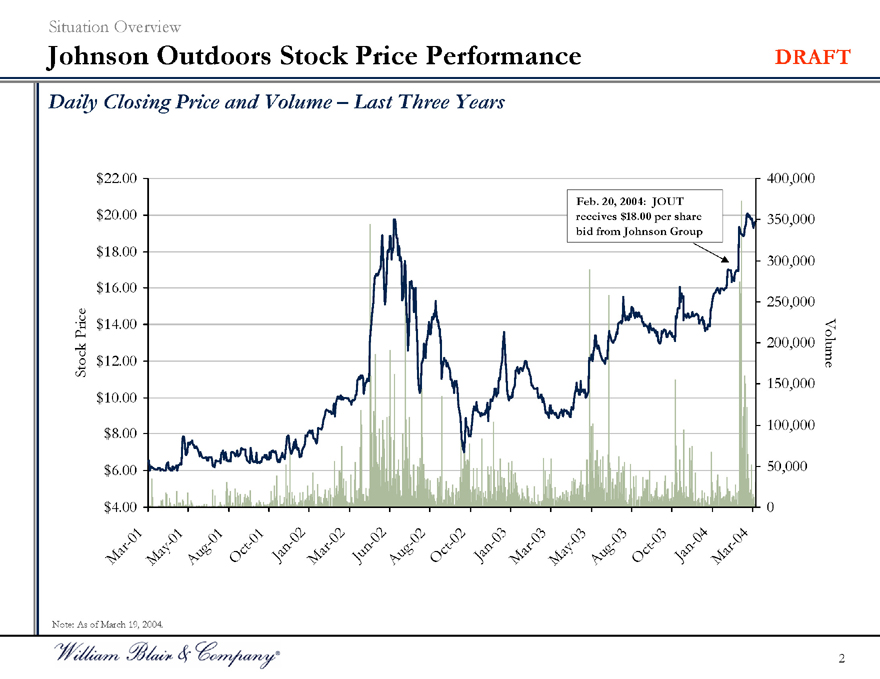
Johnson Outdoors Stock Price Performance DRAFT
Daily Closing Price and Volume – Last Three Years
Stock Price $22.00 $20.00 $18.00 $16.00 $14.00 $12.00 $10.00 $8.00 $6.00 $4.00
Mar-01 Ma y-01 Aug-01 Oct-01 Jan-02 Mar-02 Jun-02 Aug-02 Oct-02 Jan-03 Ma r-03 Ma y-03 Aug-03 Oct-03 Jan-04 Mar-04
400,000
350,000
300,000
250,000
200,000
150,000
100,000
50,0000
Volume
Feb. 20, 2004: JOUT receives $18.00 per share bid from Johnson Group
Note: As of March 19, 2004.
2
Situation Overview
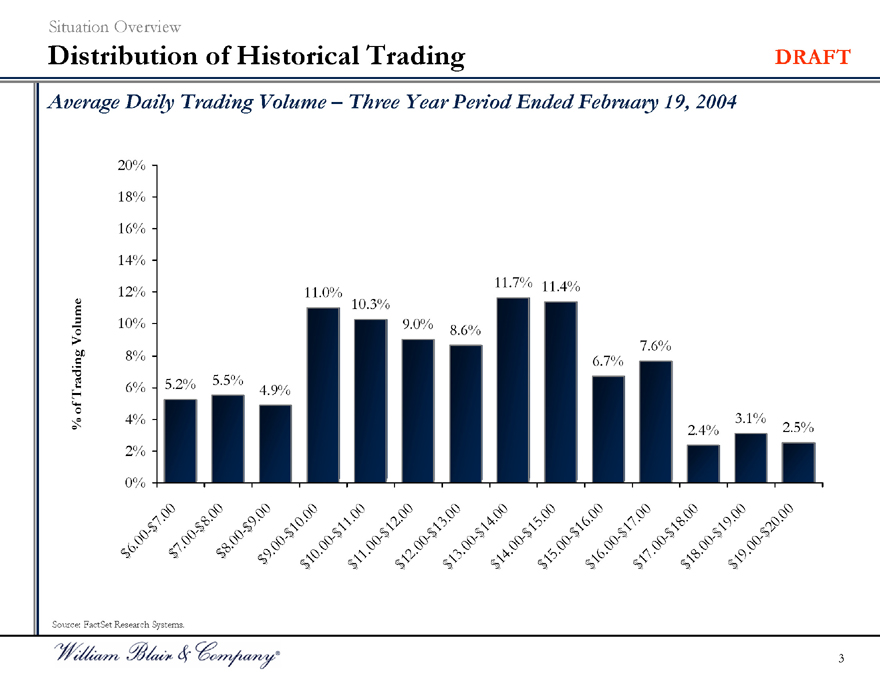
Distribution of Historical Trading DRAFT
Average Daily Trading Volume – Three Year Period Ended February 19, 2004
% of Trading Volume
20% 18% 16% 14% 12% 10% 8% 6% 4% 2% 0%
11.7% 11.4% 11.0% 10.3% 9.0% 8.6%
7.6% 6.7% 5.2% 5.5% 4.9%
3.1% 2.4% 2.5%
$6.00—$7.00
$7.00—$8.00
$8.00—$9.00
$9.00—$10.00
$10.00—$11.00
$11.00—$12.00
$12.00—$13.00
$13.00—$14.00
$14.00—$15.00
$15.00—$16.00
$16.00—$17.00
$17.00—$18.00
$18.00—$19.00
$19.00—$20.00
Source: FactSet Research Systems.
3
Situation Overview
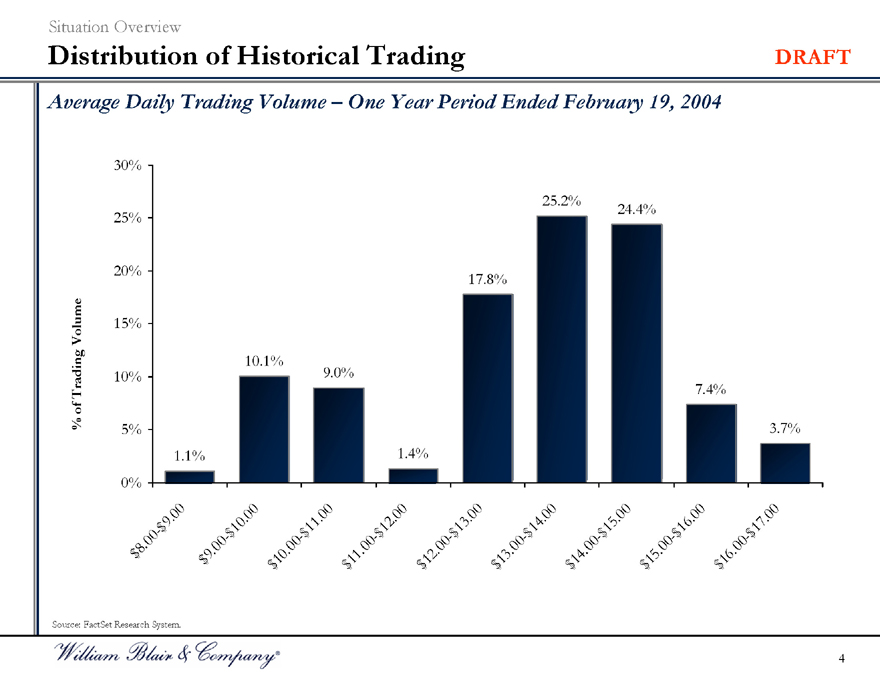
Distribution of Historical Trading DRAFT
Average Daily Trading Volume – One Year Period Ended February 19, 2004
% of Trading Volume
30% 25% 20% 15% 10% 5% 0%
25.2%
24.4%
17.8%
10.1%
9.0%
7.4%
3.7% 1.1% 1.4%
$8.00—$9.00
$9.00—$10.00
$10.00—$11.00
$11.00—$12.00
$12.00—$13.00
$13.00—$14.00
$14.00—$15.00
$15.00—$16.00
$16.00—$17.00
Source: FactSet Research System.
4
Situation Overview
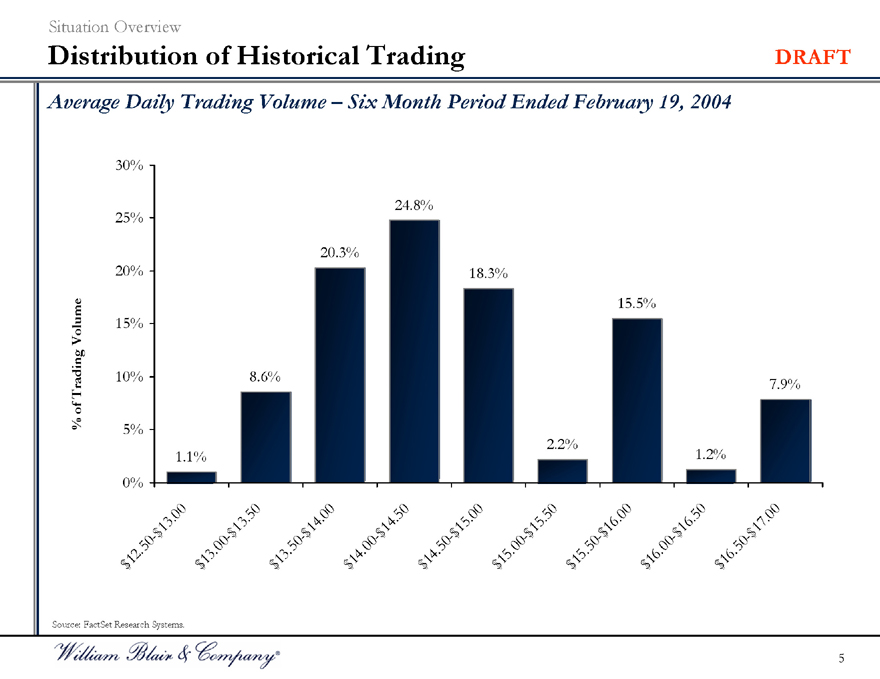
Distribution of Historical Trading DRAFT
Average Daily Trading Volume – Six Month Period Ended February 19, 2004
% of Trading Volume
30% 25% 20% 15% 10% 5% 0%
$12.50—$13.00
$13.00—$13.50
$13.50- $14.00
$14.00- $14.50
$14.50- $15.00
$15.00- $15.50
$15.50- $16.00
$16.00- $16.50
$16.50—$17.00
24.8%
20.3%
18.3%
15.5%
8.6%
7.9%
2.2%
1.1% 1.2%
Source: FactSet Research Systems.
5
Situation Overview
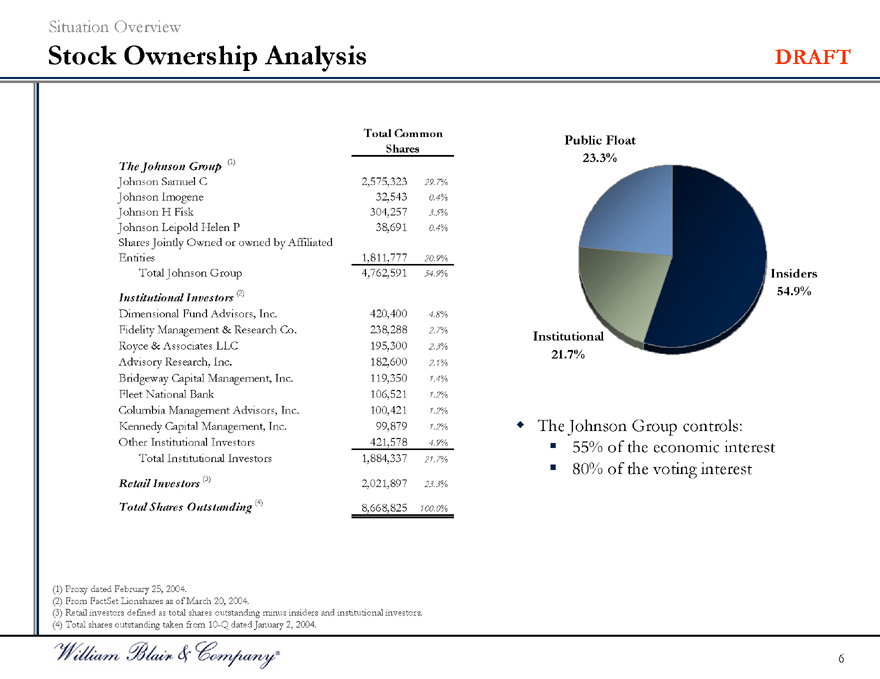
Stock Ownership Analysis DRAFT
Total Common Shares
The Johnson Group (1)
Johnson Samuel C 2,575,323 29.7%
Johnson Imogene 32,543 0.4%
Johnson H Fisk 304,257 3.5%
Johnson Leipold Helen P 38,691 0.4%
Shares Jointly Owned or owned by Affiliated
Entities 1,811,777 20.9%
Total Johnson Group 4,762,591 54.9%
Institutional Investors(2)
Dimensional Fund Advisors, Inc. 420,400 4.8%
Fidelity Management & Research Co. 238,288 2.7%
Royce & Associates LLC 195,300 2.3%
Advisory Research, Inc. 182,600 2.1%
Bridgeway Capital Management, Inc. 119,350 1.4%
Fleet National Bank 106,521 1.2%
Columbia Management Advisors, Inc. 100,421 1.2%
Kennedy Capital Management, Inc. 99,879 1.2%
Other Institutional Investors 421,578 4.9%
Total Institutional Investors 1,884,337 21.7%
Retail Investors(3) 2,021,897 23.3%
Total Shares Outstanding (4) 8,668,825 100.0%
Public Float 23.3%
Institutional 21.7%
Insiders 54.9%
The Johnson Group controls:
55% of the economic interest
80% of the voting interest
(1) Proxy dated February 25, 2004.
(2) From FactSet Lionshares as of March 20, 2004.
(3) Retail investors defined as total shares outstanding minus insiders and institutional investors. (4) Total shares outstanding taken from 10-Q dated January 2, 2004.
6
Valuation Methodologies
DRAFT
Valuation Methodologies
Valuation Methodologies DRAFT
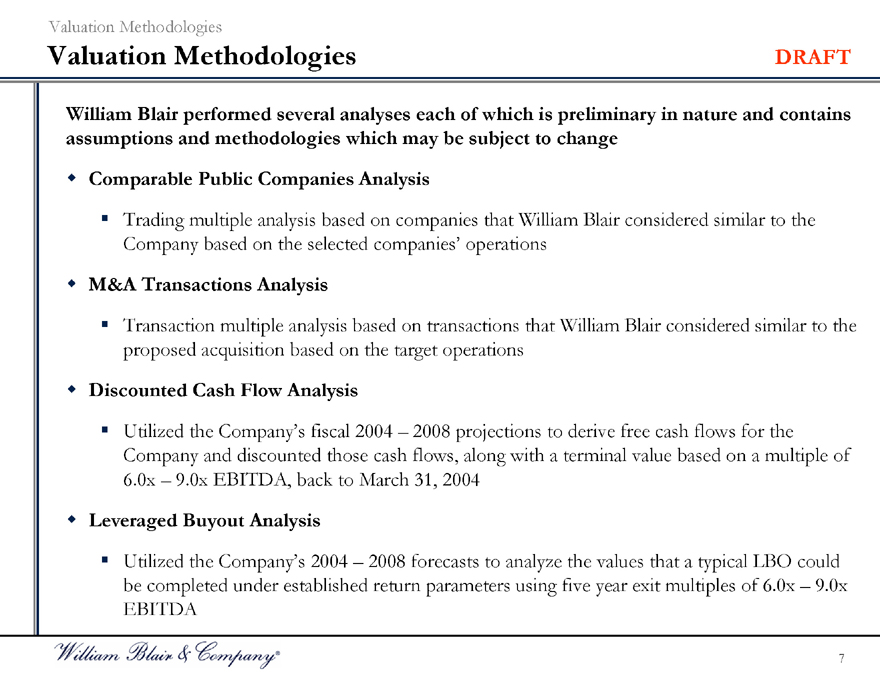
William Blair performed several analyses each of which is preliminary in nature and contains assumptions and methodologies which may be subject to change
Comparable Public Companies Analysis
Trading multiple analysis based on companies that William Blair considered similar to the Company based on the selected companies’ operations
M&A Transactions Analysis
Transaction multiple analysis based on transactions that William Blair considered similar to the proposed acquisition based on the target operations
Discounted Cash Flow Analysis
Utilized the Company’s fiscal 2004 – 2008 projections to derive free cash flows for the Company and discounted those cash flows, along with a terminal value based on a multiple of 6.0x – 9.0x EBITDA, back to March 31, 2004
Leveraged Buyout Analysis
Utilized the Company’s 2004 – 2008 forecasts to analyze the values that a typical LBO could be completed under established return parameters using five year exit multiples of 6.0x – 9.0x EBITDA
7
Valuation Methodologies
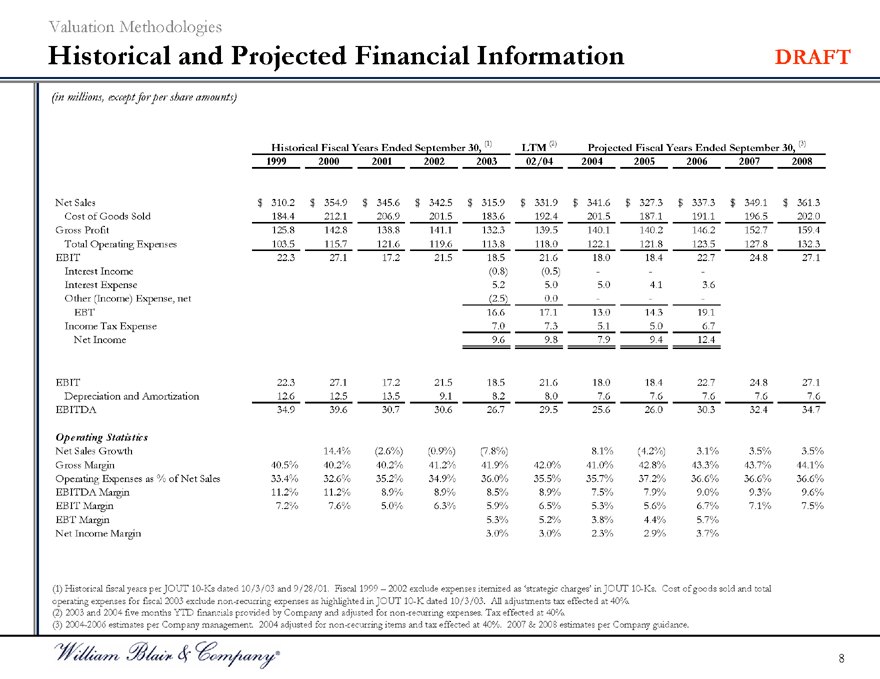
Historical and Projected Financial Information DRAFT
(in millions, except for per share amounts)
Historical Fiscal Years Ended September 30, (1) LTM (2) Projected Fiscal Years Ended September 30, (3)
1999 2000 2001 2002 2003 02/04 2004 2005 2006 2007 2008
Net Sales $310.2 $354.9 $345.6 $342.5 $315.9 $331.9 $341.6 $327.3 $337.3 $349.1 $361.3
Cost of Goods Sold 184.4 212.1 206.9 201.5 183.6 192.4 201.5 187.1 191.1 196.5 202.0
Gross Profit 125.8 142.8 138.8 141.1 132.3 139.5 140.1 140.2 146.2 152.7 159.4
Total Operating Expenses 103.5 115.7 121.6 119.6 113.8 118.0 122.1 121.8 123.5 127.8 132.3
EBIT 22.3 27.1 17.2 21.5 18.5 21.6 18.0 18.4 22.7 24.8 27.1
Interest Income (0.8) (0.5) - - -
Interest Expense 5.2 5.0 5.0 4.1 3.6
Other (Income) Expense, net (2.5) 0.0 - - -
EBT 16.6 17.1 13.0 14.3 19.1
Income Tax Expense 7.0 7.3 5.1 5.0 6.7
Net Income 9.6 9.8 7.9 9.4 12.4
EBIT 22.3 27.1 17.2 21.5 18.5 21.6 18.0 18.4 22.7 24.8 27.1
Depreciation and Amortization 12.6 12.5 13.5 9.1 8.2 8.0 7.6 7.6 7.6 7.6 7.6
EBITDA 34.9 39.6 30.7 30.6 26.7 29.5 25.6 26.0 30.3 32.4 34.7
Operating Statistics
Net Sales Growth 14.4% (2.6%) (0.9%) (7.8%) 8.1% (4.2%) 3.1% 3.5% 3.5%
Gross Margin 40.5% 40.2% 40.2% 41.2% 41.9% 42.0% 41.0% 42.8% 43.3% 43.7% 44.1%
Operating Expenses as% of Net Sales 33.4% 32.6% 35.2% 34.9% 36.0% 35.5% 35.7% 37.2% 36.6% 36.6% 36.6%
EBITDA Margin 11.2% 11.2% 8.9% 8.9% 8.5% 8.9% 7.5% 7.9% 9.0% 9.3% 9.6%
EBIT Margin 7.2% 7.6% 5.0% 6.3% 5.9% 6.5% 5.3% 5.6% 6.7% 7.1% 7.5%
EBT Margin 5.3% 5.2% 3.8% 4.4% 5.7%
Net Income Margin 3.0% 3.0% 2.3% 2.9% 3.7%
(1) Historical fiscal years per JOUT 10-Ks dated 10/3/03 and 9/28/01. Fiscal 1999 – 2002 exclude expenses itemized as ‘strategic charges’ in JOUT 10-Ks. Cost of goods sold and total operating expenses for fiscal 2003 exclude non-recurring expenses as highlighted in JOUT 10-K dated 10/3/03. All adjustments tax effected at 40%.
(2) 2003 and 2004 five months YTD financials provided by Company and adjusted for non-recurring expenses. Tax effected at 40%.
(3) 2004-2006 estimates per Company management. 2004 adjusted for non-recurring items and tax effected at 40%. 2007 & 2008 estimates per Company guidance.
8
Valuation Methodologies
Projected Financial Information DRAFT
(in millions, except for per share amounts)
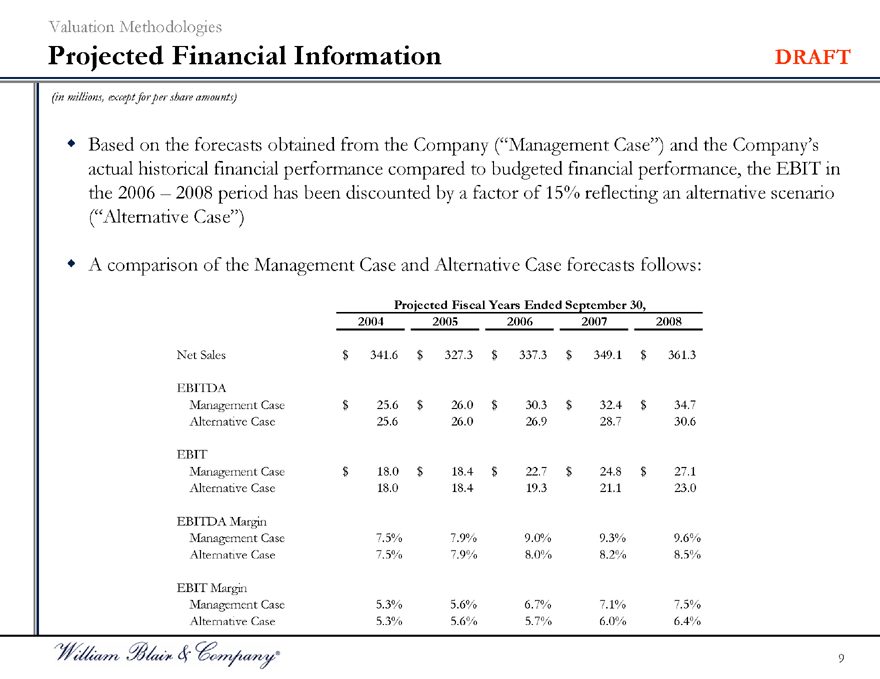
Based on the forecasts obtained from the Company (“Management Case”) and the Company’s actual historical financial performance compared to budgeted financial performance, the EBIT in the 2006 – 2008 period has been discounted by a factor of 15% reflecting an alternative scenario (“Alternative Case”)
A comparison of the Management Case and Alternative Case forecasts follows:
Projected Fiscal Years Ended September 30,
2004 2005 2006 2007 2008
Net Sales $341.6 $327.3 $337.3 $349.1 $361.3
EBITDA
Management Case $25.6 $26.0 $30.3 $32.4 $34.7
Alternative Case 25.6 26.0 26.9 28.7 30.6
EBIT
Management Case $18.0 $18.4 $22.7 $24.8 $27.1
Alternative Case 18.0 18.4 19.3 21.1 23.0
EBITDA Margin
Management Case 7.5% 7.9% 9.0% 9.3% 9.6%
Alternative Case 7.5% 7.9% 8.0% 8.2% 8.5%
EBIT Margin
Management Case 5.3% 5.6% 6.7% 7.1% 7.5%
Alternative Case 5.3% 5.6% 5.7% 6.0% 6.4%
9

Comparable Public Companies Analysis
DRAFT
Comparable Public Companies Analysis
Comparable Companies Analysis DRAFT
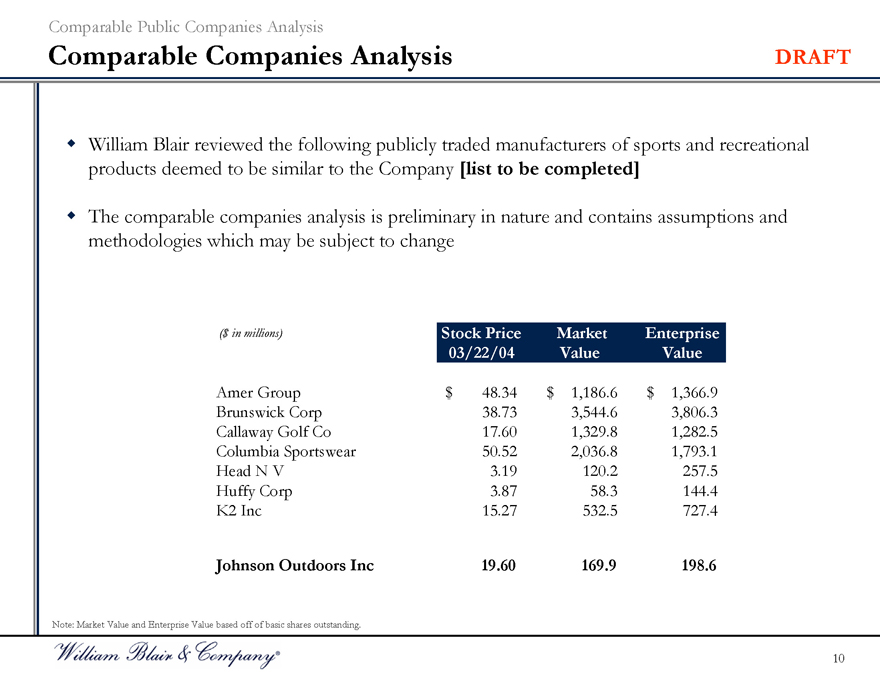
William Blair reviewed the following publicly traded manufacturers of sports and recreational products deemed to be similar to the Company [list to be completed]
The comparable companies analysis is preliminary in nature and contains assumptions and methodologies which may be subject to change
($in millions) Stock Price Market Enterprise
03/22/04 Value Value
Amer Group $48.34 $1,186.6 $1,366.9
Brunswick Corp 38.73 3,544.6 3,806.3
Callaway Golf Co 17.60 1,329.8 1,282.5
Columbia Sportswear 50.52 2,036.8 1,793.1
Head N V 3.19 120.2 257.5
Huffy Corp 3.87 58.3 144.4
K2 Inc 15.27 532.5 727.4
Johnson Outdoors Inc 19.60 169.9 198.6
Note: Market Value and Enterprise Value based off of basic shares outstanding.
10
Comparable Public Companies Analysis
Indexed Stock Price Performance DRAFT
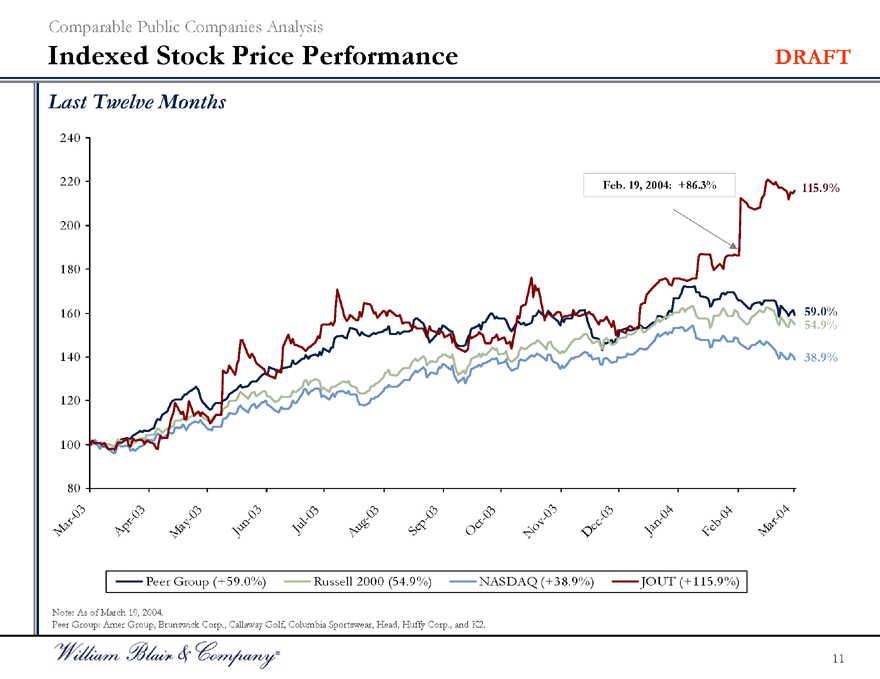
Last Twelve Months
240 220 200 180 160 140 120 100 80
Feb. 19, 2004: +86.3%
115.9%
59% 54.9
38.9%
Mar-03
Apr-03
May-03
Jun–03
Jul-03
Aug-03
Sep-03
Oct–03
Nov-03
Dec-03
Jan-04
Feb-04
Mar-04
Peer Group (+59.0%)
Russell 2000 (54.9%)
NASDAQ (+38.9%)
JOUT (+115.9%)
Note: As of March 19, 2004.
Peer Group: Amer Group, Brunswick Corp., Callaway Golf, Columbia Sportswear, Head, Huffy Corp., and K2.
11
Comparable Public Companies Analysis
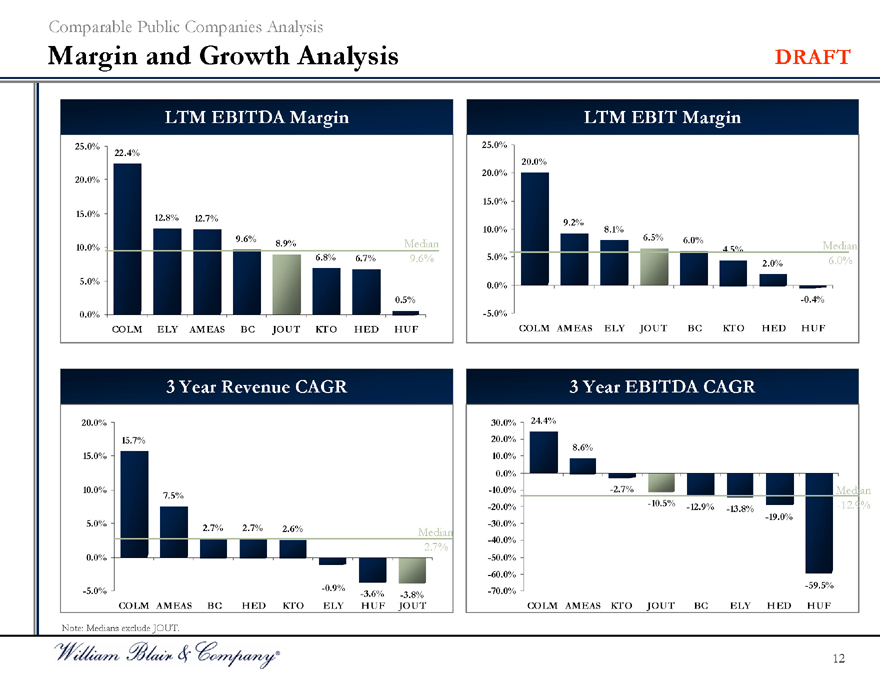
Margin and Growth Analysis DRAFT
LTM EBITDA Margin
25.0% 20.0% 15.0% 10.0% 5.0% 0.0%
22.4% 12.8% 12.7%
9.6%
8.9%
6.8% 6.7% Median 9.6%
0.5%
COLM ELY AMEAS BC JOUT KTO HED HUF
LTM EBIT Margin
25.0% 20.0% 15.0% 10.0% 5.0% 0.0% -5.0%
20.0% 9.2% 8.1% 6.5% 6.0% 4.5% 2.0% Median 6.0%
-0.4%
COLM AMEAS ELY JOUT BC KTO HED HUF
3 Year Revenue CAGR 20.0% 15.0% 10.0% 5.0% 0.0% -5.0% 15.7% 7.5% 2.7% 2.7% 2.6% Median 2.7% - -0.9% -3.6% -3.8% COLM AMEAS BC HED KTO ELY HUF JOUT
3 Year EBITDA CAGR
30.0%
20.0%
10.0%
0.0%
-10.0%
-20.0%
-30.0%
-40.0%
-50.0%
-60.0%
-70.0%
24.4% 8.6% -2.7% -10.5% -12.9% Median -12.9% -13.8% -19.0% -59.5%
COLM AMEAS KTO JOUT BC ELY HED HUF
Note: Medians exclude JOUT.
12
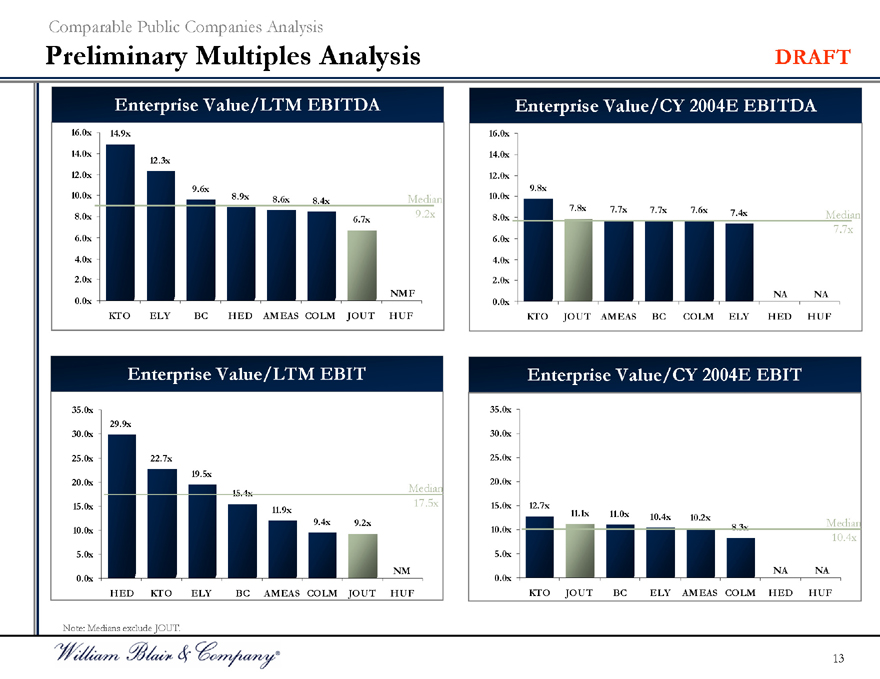
Comparable Public Companies Analysis
Preliminary Multiples Analysis DRAFT
Enterprise Value/LTM EBITDA
16.0x
14.0x
12.0x
10.0x
8.0x
6.0x
4.0x
2.0x
0.0x
14.9x
12.3x
9.6x
8.9x 8.6x Median 8.4x
9.2x
6.7x
NMF
KTO ELY BC HED AMEAS COLM JOUT HUF
Enterprise Value/CY 2004E EBITDA
16.0x
14.0x
12.0x
10.0x
8.0x
6.0x
4.0x
2.0x
0.0x
9.8x
7.8x 7.7x 7.7x 7.6x
7.4x
Median 7.7x
NA NA
KTO JOUT AMEAS BC COLM ELY HED HUF
Enterprise Value/LTM EBIT
35.0x 30.0x 25.0x 20.0x 15.0x 10.0x 5.0x 0.0x
29.9x
22.7x
19.5x
15.4x
Median 17.5x
11.9x
9.4x 9.2x
NM
HED KTO ELY BC AMEAS COLM JOUT HUF
Enterprise Value/CY 2004E EBIT
35.0x 30.0x 25.0x 20.0x 15.0x 10.0x 5.0x 0.0x
12.7x
11.1x 11.0x 10.4x
10.2x
8.3x
Median 10.4x
NA NA
KTO JOUT BC ELY AMEAS COLM HED HUF
Note: Medians exclude JOUT.
13
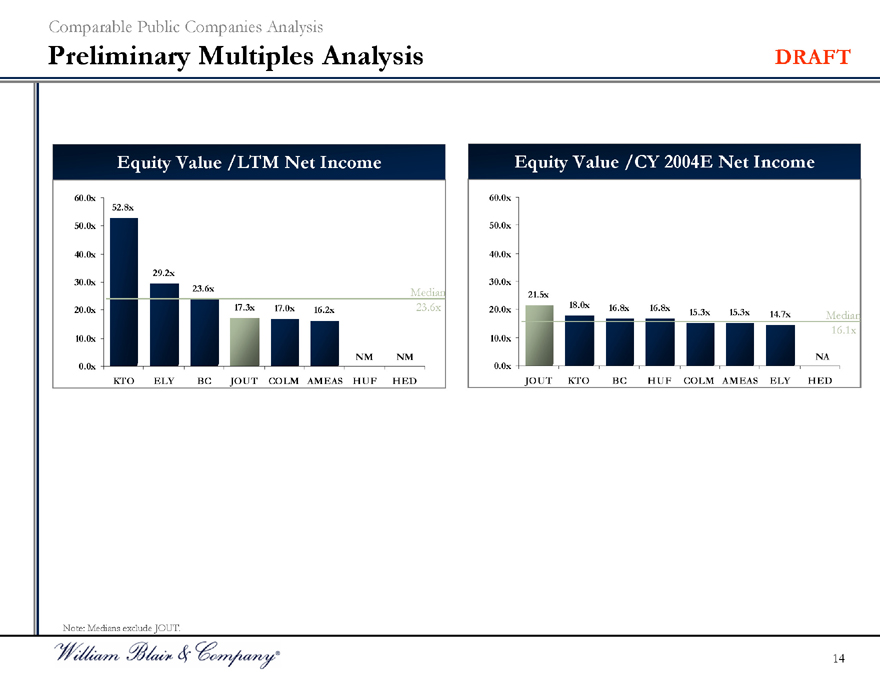
Comparable Public Companies Analysis
Preliminary Multiples Analysis DRAFT
Equity Value /LTM Net Income
60.0x 50.0x 40.0x 30.0x 20.0x 10.0x 0.0x
52.8x
29.2x
23.6x
17.3x 17.0x 16.2x Median 23.6x
NM NM
KTO ELY BC JOUT COLM AMEAS HUF HED
Equity Value /CY 2004E Net Income
60.0x 50.0x 40.0x 30.0x 20.0x 10.0x 0.0x
21.5x
18.0x 16.8x 16.8x
15.3x 15.3x 14.7x Median 16.1x
NA
JOUT KTO BC HUF COLM AMEAS ELY HED
Note: Medians exclude JOUT.
14
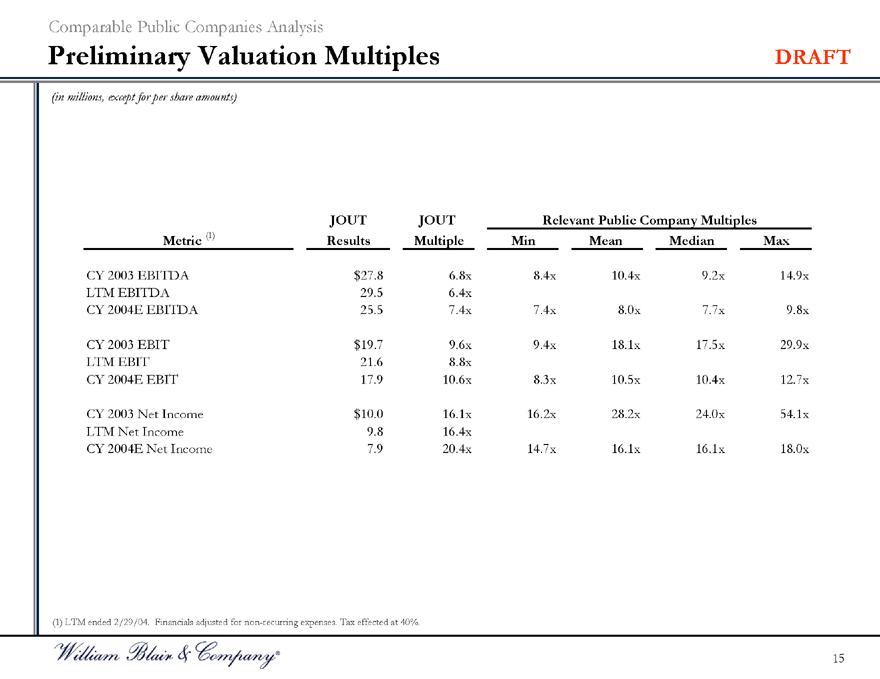
Comparable Public Companies Analysis
Preliminary Valuation Multiples DRAFT
(in millions, except for per share amounts)
JOUT JOUT Relevant Public Company Multiples
Metric (1) Results Multiple Min Mean Median Max
CY 2003 EBITDA $27.8 6.8x 8.4x 10.4x 9.2x 14.9x
LTM EBITDA 29.5 6.4x
CY 2004E EBITDA 25.5 7.4x 7.4x 8.0x 7.7x 9.8x
CY 2003 EBIT $19.7 9.6x 9.4x 18.1x 17.5x 29.9x
LTM EBIT 21.6 8.8x
CY 2004E EBIT 17.9 10.6x 8.3x 10.5x 10.4x 12.7x
CY 2003 Net Income $10.0 16.1x 16.2x 28.2x 24.0x 54.1x
LTM Net Income 9.8 16.4x
CY 2004E Net Income 7.9 20.4x 14.7x 16.1x 16.1x 18.0x
(1) LTM ended 2/29/04. Financials adjusted for non-recurring expenses. Tax effected at 40%.
15

DRAFT
Comparable M&A Transactions Analysis
\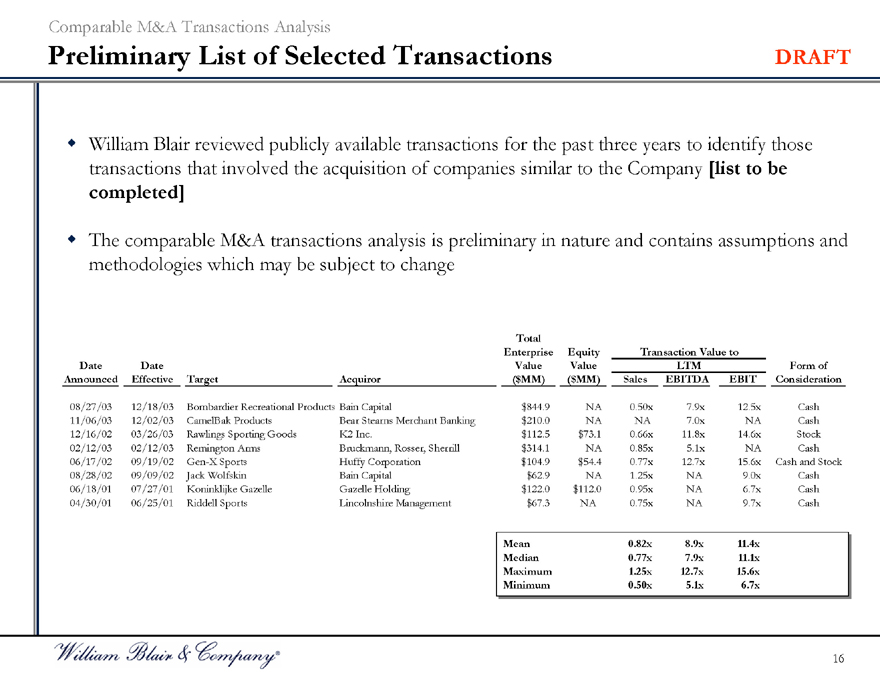
Comparable M&A Transactions Analysis
Preliminary List of Selected Transactions DRAFT
William Blair reviewed publicly available transactions for the past three years to identify those transactions that involved the acquisition of companies similar to the Company [list to be completed]
The comparable M&A transactions analysis is preliminary in nature and contains assumptions and methodologies which may be subject to change
Total
Enterprise Equity Transaction Value to
Date Date Value Value LTM Form of
Announced Effective Target Acquiror ($MM) ($MM) Sales EBITDA EBIT Consideration
08/27/03 12/18/03 Bombardier Recreational Products Bain Capital $844.9 NA 0.50x 7.9x 12.5x Cash
11/06/03 12/02/03 CamelBak Products Bear Stearns Merchant Banking $210.0 NA NA 7.0x NA Cash
12/16/02 03/26/03 Rawlings Sporting Goods K2 Inc. $112.5 $73.1 0.66x 11.8x 14.6x Stock
02/12/03 02/12/03 Remington Arms Bruckmann, Rosser, Sherrill $314.1 NA 0.85x 5.1x NA Cash
06/17/02 09/19/02 Gen-X Sports Huffy Corporation $104.9 $54.4 0.77x 12.7x 15.6x Cash and Stock
08/28/02 09/09/02 Jack Wolfskin Bain Capital $62.9 NA 1.25x NA 9.0x Cash
06/18/01 07/27/01 Koninklijke Gazelle Gazelle Holding $122.0 $112.0 0.95x NA 6.7x Cash
04/30/01 06/25/01 Riddell Sports Lincolnshire Management $67.3 NA 0.75x NA 9.7x Cash
Mean 0.82x 8.9x 11.4x
Median 0.77x 7.9x 11.1x
Maximum 1.25x 12.7x 15.6x
Minimum 0.50x 5.1x 6.7x
16
Comparable M&A Transactions Analysis
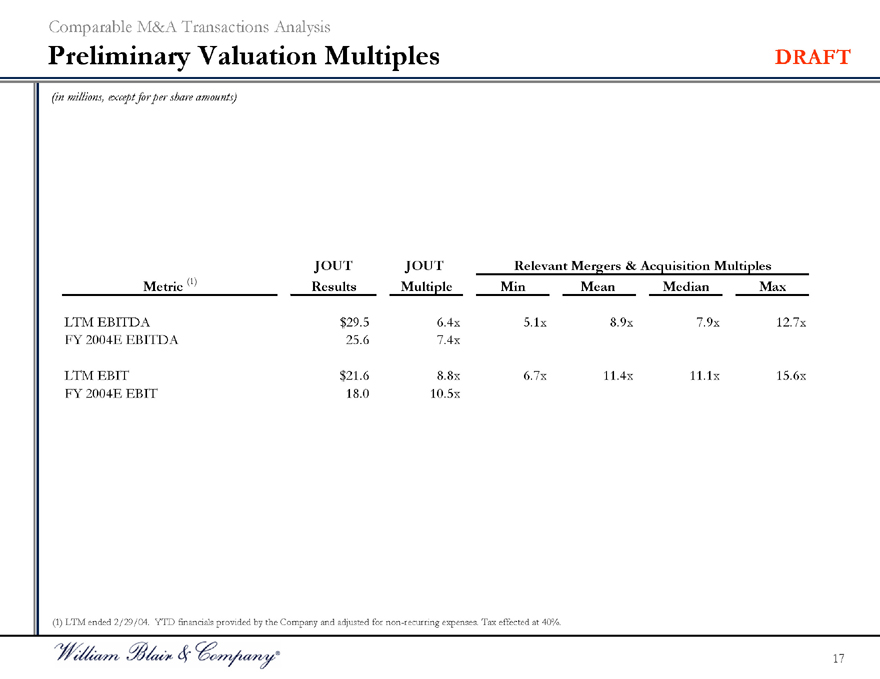
Preliminary Valuation Multiples DRAFT
(in millions, except for per share amounts)
JOUT JOUT Relevant Mergers & Acquisition Multiples Metric (1) Results Multiple Min Mean Median Max
LTM EBITDA $29.5 6.4x 5.1x 8.9x 7.9x 12.7x FY 2004E EBITDA 25.6 7.4x
LTM EBIT $21.6 8.8x 6.7x 11.4x 11.1x 15.6x FY 2004E EBIT 18.0 10.5x
(1) LTM ended 2/29/04. YTD financials provided by the Company and adjusted for non-recurring expenses. Tax effected at 40%.
17

DRAFT
M&A Premiums Paid Analysis
M&a Premiums Paid Analysis
Methodology and Assumptions DRAFT
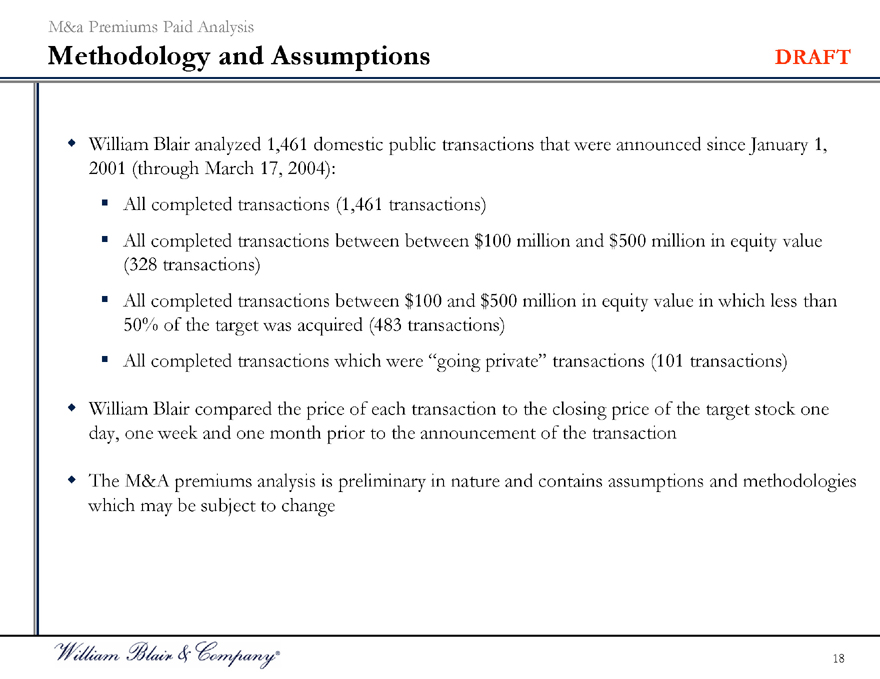
William Blair analyzed 1,461 domestic public transactions that were announced since January 1, 2001 (through March 17, 2004):
All completed transactions (1,461 transactions)
All completed transactions between between $100 million and $500 million in equity value (328 transactions) All completed transactions between $100 and $500 million in equity value in which less than 50% of the target was acquired (483 transactions) All completed transactions which were “going private” transactions (101 transactions)
William Blair compared the price of each transaction to the closing price of the target stock one day, one week and one month prior to the announcement of the transaction
The M&A premiums analysis is preliminary in nature and contains assumptions and methodologies which may be subject to change
18
M&a Premiums Paid Analysis
Premiums Paid Summary DRAFT
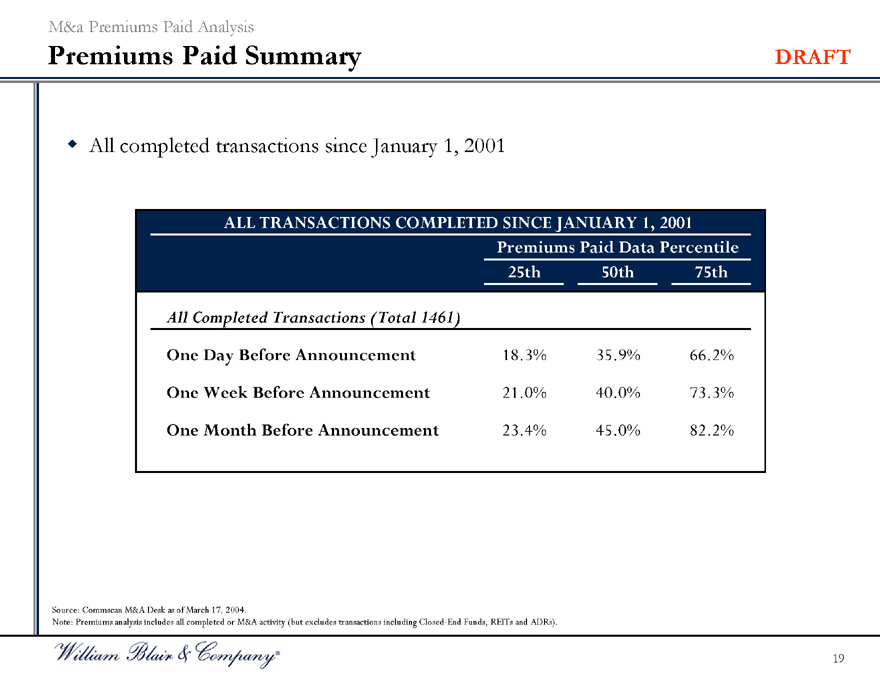
All completed transactions since January 1, 2001
ALL TRANSACTIONS COMPLETED SINCE JANUARY 1, 2001
Premiums Paid Data Percentile
25th 50th 75th
All Completed Transactions (Total 1461)
One Day Before Announcement 18.3% 35.9% 66.2%
One Week Before Announcement 21.0% 40.0% 73.3%
One Month Before Announcement 23.4% 45.0% 82.2%
Source: Commscan M&A Desk as of March 17, 2004.
Note: Premiums analysis includes all completed or M&A activity (but excludes transactions including Closed-End Funds, REITs and ADRs).
19
M&a Premiums Paid Analysis
Premiums Paid Summary DRAFT
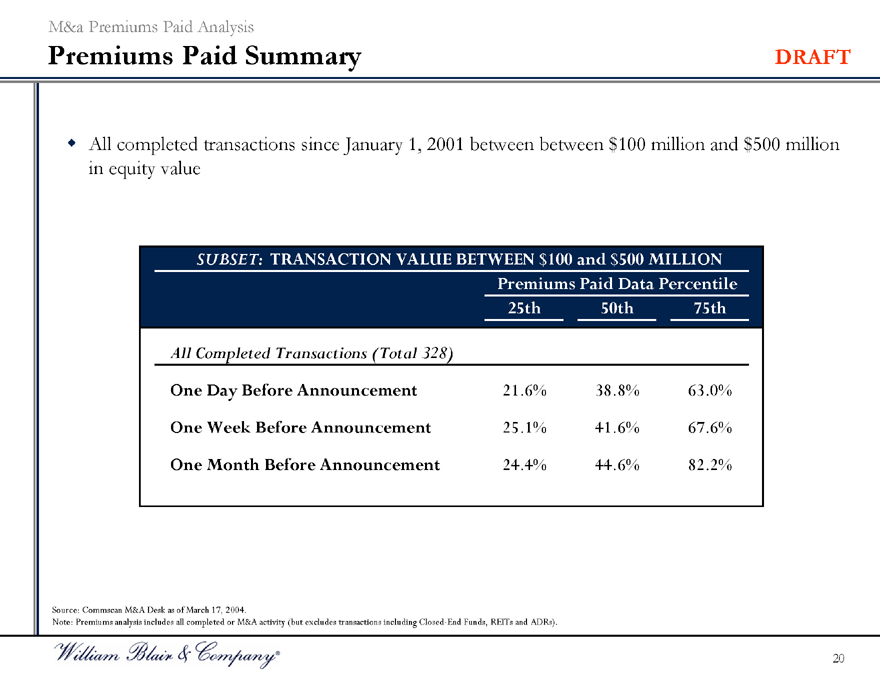
All completed transactions since January 1, 2001 between between $100 million and $500 million in equity value
SUBSET: TRANSACTION VALUE BETWEEN $100 and $500 MILLION
Premiums Paid Data Percentile
25th 50th 75th
All Completed Transactions (Total 328)
One Day Before Announcement 21.6% 38.8% 63.0%
One Week Before Announcement 25.1% 41.6% 67.6%
One Month Before Announcement 24.4% 44.6% 82.2%
Source: Commscan M&A Desk as of March 17, 2004.
Note: Premiums analysis includes all completed or M&A activity (but excludes transactions including Closed-End Funds, REITs and ADRs).
20
M&a Premiums Paid Analysis
Premiums Paid Summary DRAFT
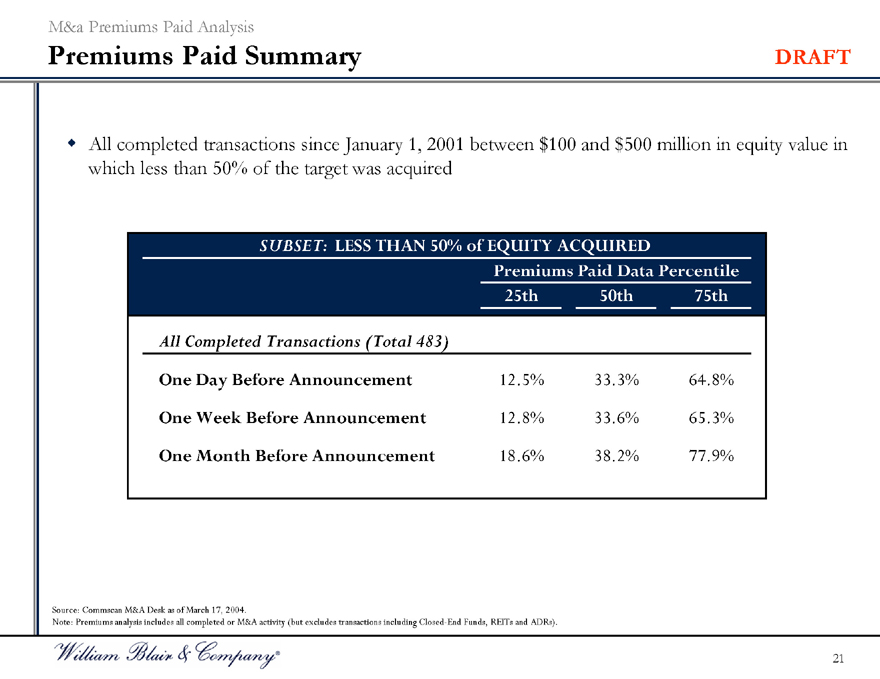
All completed transactions since January 1, 2001 between $100 and $500 million in equity value in which less than 50% of the target was acquired
SUBSET: LESS THAN 50% of EQUITY ACQUIRED
Premiums Paid Data Percentile
25th 50th 75th
All Completed Transactions (Total 483)
One Day Before Announcement 12.5% 33.3% 64.8%
One Week Before Announcement 12.8% 33.6% 65.3%
One Month Before Announcement 18.6% 38.2% 77.9%
Source: Commscan M&A Desk as of March 17, 2004.
Note: Premiums analysis includes all completed or M&A activity (but excludes transactions including Closed-End Funds, REITs and ADRs).
21
M&a Premiums Paid Analysis
Premiums Paid Summary DRAFT
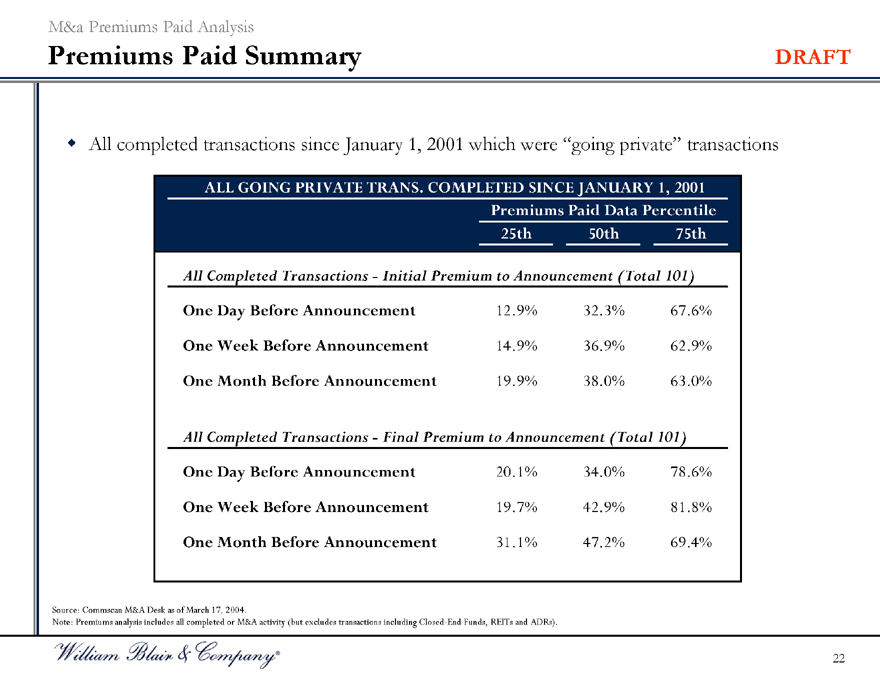
All completed transactions since January 1, 2001 which were “going private” transactions
ALL GOING PRIVATE TRANS. COMPLETED SINCE JANUARY 1, 2001
Premiums Paid Data Percentile
25th 50th 75th
All Completed Transactions - Initial Premium to Announcement (Total 101)
One Day Before Announcement 12.9% 32.3% 67.6%
One Week Before Announcement 14.9% 36.9% 62.9%
One Month Before Announcement 19.9% 38.0% 63.0%
All Completed Transactions - Final Premium to Announcement (Total 101)
One Day Before Announcement 20.1% 34.0% 78.6%
One Week Before Announcement 19.7% 42.9% 81.8%
One Month Before Announcement 31.1% 47.2% 69.4%
Source: Commscan M&A Desk as of March 17, 2004.
Note: Premiums analysis includes all completed or M&A activity (but excludes transactions including Closed-End Funds, REITs and ADRs).
22
DRAFT
Discounted Cash Flow Analysis
Discounted Cash Flow Analysis
Methodology and Assumptions DRAFT
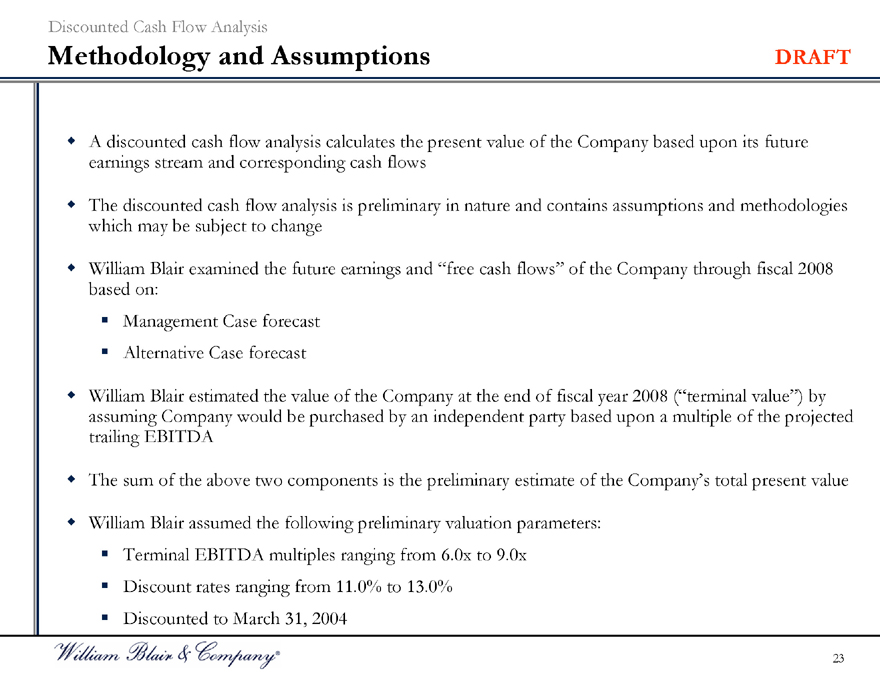
A discounted cash flow analysis calculates the present value of the Company based upon its future earnings stream and corresponding cash flows
The discounted cash flow analysis is preliminary in nature and contains assumptions and methodologies which may be subject to change
William Blair examined the future earnings and “free cash flows” of the Company through fiscal 2008 based on:
Management Case forecast Alternative Case forecast
William Blair estimated the value of the Company at the end of fiscal year 2008 (“terminal value”) by assuming Company would be purchased by an independent party based upon a multiple of the projected trailing EBITDA
The sum of the above two components is the preliminary estimate of the Company’s total present value
William Blair assumed the following preliminary valuation parameters:
Terminal EBITDA multiples ranging from 6.0x to 9.0x Discount rates ranging from 11.0% to 13.0% Discounted to March 31, 2004
23

Discounted Cash Flow Analysis
Discounted Cash Flow Analysis – Management Case DRAFT
(in millions, except for per share amounts)
Present Value of Enterprise Value
Discount Rate Terminal EBITDA Multiple
6.0x 7.5x 9.0x
11.0% $168.8 $201.3 $233.8
11.5% 165.8 197.6 229.5
12.0% 162.7 194.0 225.2
12.5% 159.8 190.4 221.0
13.0% 156.9 186.9 216.9
Present Value of Per Share Equity Value
Discount Rate Terminal EBITDA Multiple
6.0x 7.5x 9.0x
11.0% $15.66 $19.29 $22.92
11.5% 15.31 18.87 22.43
12.0% 14.98 18.47 21.95
12.5% 14.65 18.07 21.49
13.0% 14.33 17.68 21.03
24
Discounted Cash Flow Analysis
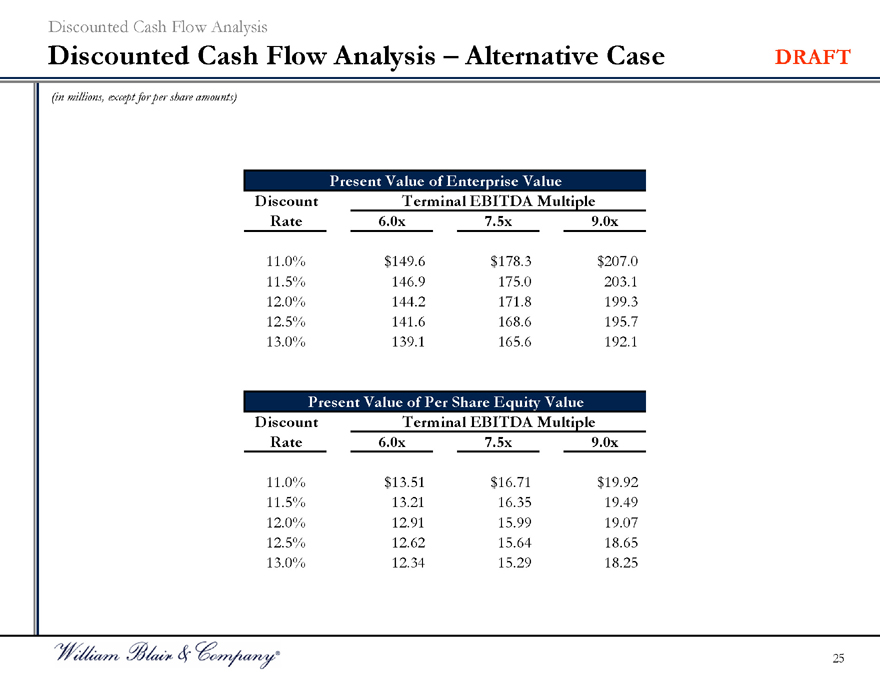
Discounted Cash Flow Analysis – Alternative Case DRAFT
(in millions, except for per share amounts)
Present Value of Enterprise Value
Discount Rate Terminal EBITDA Multiple
6.0x 7.5x 9.0x
11.0% $149.6 $178.3 $207.0
11.5% 146.9 175.0 203.1
12.0% 144.2 171.8 199.3
12.5% 141.6 168.6 195.7
13.0% 139.1 165.6 192.1
Present Value of Per Share Equity Value
Discount Rate Terminal EBITDA Multiple
6.0x 7.5x 9.0x
11.0% $13.51 $16.71 $19.92
11.5% 13.21 16.35 19.49
12.0% 12.91 15.99 19.07
12.5% 12.62 15.64 18.65
13.0% 12.34 15.29 18.25
25
DRAFT
Leveraged Buyout Analysis
Leveraged Buyout Analysis
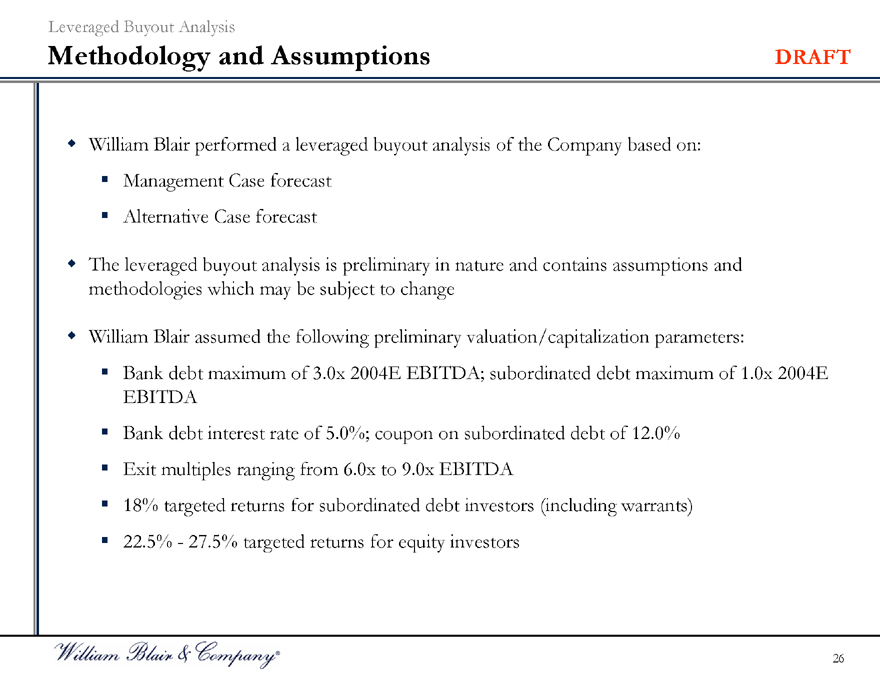
Methodology and Assumptions DRAFT
William Blair performed a leveraged buyout analysis of the Company based on:
Management Case forecast
Alternative Case forecast
The leveraged buyout analysis is preliminary in nature and contains assumptions and methodologies which may be subject to change
William Blair assumed the following preliminary valuation/capitalization parameters:
Bank debt maximum of 3.0x 2004E EBITDA; subordinated debt maximum of 1.0x 2004E EBITDA
Bank debt interest rate of 5.0%; coupon on subordinated debt of 12.0%
Exit multiples ranging from 6.0x to 9.0x EBITDA
18% targeted returns for subordinated debt investors (including warrants)
22.5%—27.5% targeted returns for equity investors
26
Leveraged Buyout Analysis
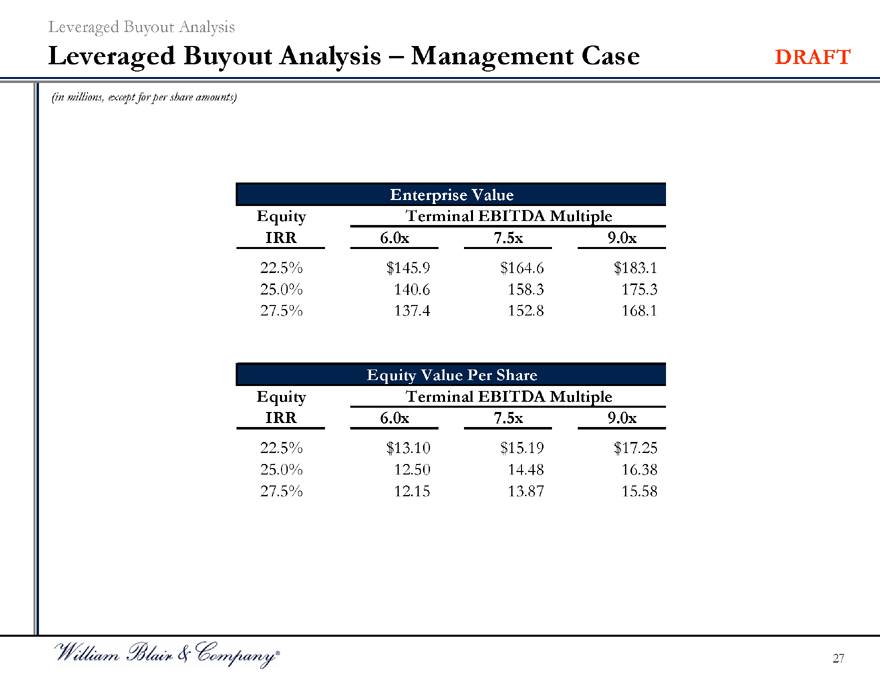
Leveraged Buyout Analysis – Management Case DRAFT
(in millions, except for per share amounts)
Enterprise Value
Equity IRR Terminal EBITDA Multiple
6.0x 7.5x 9.0x
22.5% $145.9 $164.6 $183.1
25.0% 140.6 158.3 175.3
27.5% 137.4 152.8 168.1
Equity Value Per Share
Equity IRR Terminal EBITDA Multiple
6.0x 7.5x 9.0x
22.5% $13.10 $15.19 $17.25
25.0% 12.50 14.48 16.38
27.5% 12.15 13.87 15.58
27
Leveraged Buyout Analysis
Leveraged Buyout Analysis – Alternative Case DRAFT
(in millions, except for per share amounts)
[Alternative Case Forthcoming]
28

DRAFT
Valuation Matrix
Valuation Matrix
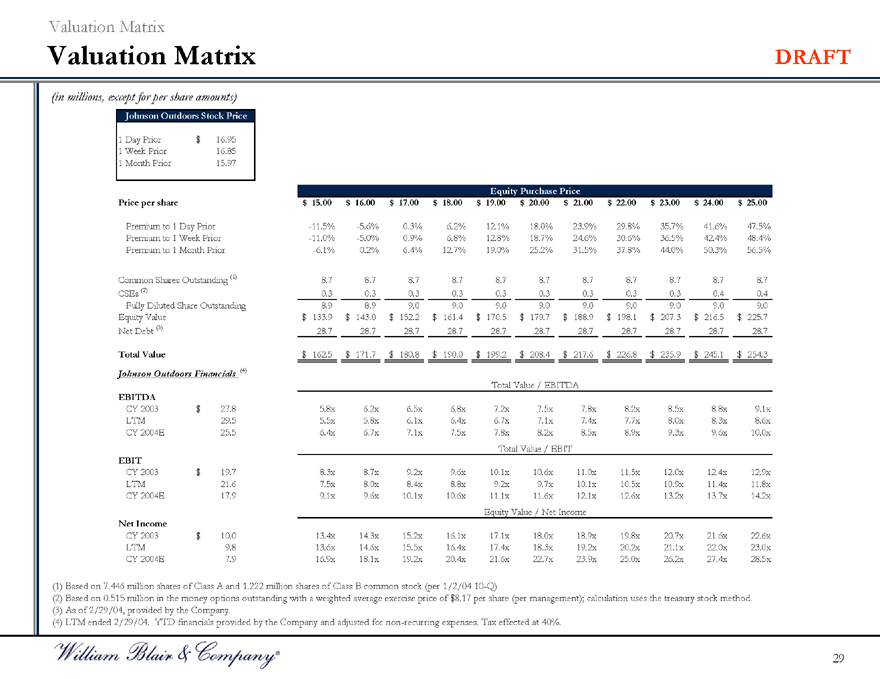
Valuation Matrix DRAFT
(in millions, except for per share amounts)
Johnson Outdoors Stock Price
1 Day Prior $16.95
1 Week Prior 16.85
1 Month Prior 15.97
Equity Purchase Price
Price per share $15.00 $16.00 $17.00 $18.00 $19.00 $20.00 $21.00 $22.00 $23.00 $24.00 $25.00
Premium to 1 Day Prior -11.5% -5.6% 0.3% 6.2% 12.1% 18.0% 23.9% 29.8% 35.7% 41.6% 47.5%
Premium to 1 Week Prior -11.0% -5.0% 0.9% 6.8% 12.8% 18.7% 24.6% 30.6% 36.5% 42.4% 48.4%
Premium to 1 Month Prior -6.1% 0.2% 6.4% 12.7% 19.0% 25.2% 31.5% 37.8% 44.0% 50.3% 56.5%
Common Shares Outstanding (1) 8.7 8.7 8.7 8.7 8.7 8.7 8.7 8.7 8.7 8.7 8.7
CSEs (2) 0.3 0.3 0.3 0.3 0.3 0.3 0.3 0.3 0.3 0.4 0.4
Fully Diluted Share Outstanding 8.9 8.9 9.0 9.0 9.0 9.0 9.0 9.0 9.0 9.0 9.0
Equity Value $133.9 $143.0 $152.2 $161.4 $170.5 $179.7 $188.9 $198.1 $207.3 $216.5 $225.7
Net Debt (3) 28.7 28.7 28.7 28.7 28.7 28.7 28.7 28.7 28.7 28.7 28.7
Total Value $162.5 $171.7 $180.8 $190.0 $199.2 $208.4 $217.6 $226.8 $235.9 $245.1 $254.3
Johnson Outdoors Financials (4)
Total Value / EBITDA
EBITDA
CY 2003 $27.8 5.8x 6.2x 6.5x 6.8x 7.2x 7.5x 7.8x 8.2x 8.5x 8.8x 9.1x
LTM 29.5 5.5x 5.8x 6.1x 6.4x 6.7x 7.1x 7.4x 7.7x 8.0x 8.3x 8.6x
CY 2004E 25.5 6.4x 6.7x 7.1x 7.5x 7.8x 8.2x 8.5x 8.9x 9.3x 9.6x 10.0x
Total Value / EBIT
EBIT
CY 2003 $19.7 8.3x 8.7x 9.2x 9.6x 10.1x 10.6x 11.0x 11.5x 12.0x 12.4x 12.9x
LTM 21.6 7.5x 8.0x 8.4x 8.8x 9.2x 9.7x 10.1x 10.5x 10.9x 11.4x 11.8x
CY 2004E 17.9 9.1x 9.6x 10.1x 10.6x 11.1x 11.6x 12.1x 12.6x 13.2x 13.7x 14.2x
Equity Value / Net Income
Net Income
CY 2003 $10.0 13.4x 14.3x 15.2x 16.1x 17.1x 18.0x 18.9x 19.8x 20.7x 21.6x 22.6x
LTM 9.8 13.6x 14.6x 15.5x 16.4x 17.4x 18.3x 19.2x 20.2x 21.1x 22.0x 23.0x
CY 2004E 7.9 16.9x 18.1x 19.2x 20.4x 21.6x 22.7x 23.9x 25.0x 26.2x 27.4x 28.5x
(1) Based on 7.446 million shares of Class A and 1.222 million shares of Class B common stock (per 1/2/04 10-Q)
(2) Based on 0.515 million in the money options outstanding with a weighted average exercise price of $8.17 per share (per management); calculation uses the treasury stock method. (3) As of 2/29/04, provided by the Company.
(4) LTM ended 2/29/04. YTD financials provided by the Company and adjusted for non-recurring expenses. Tax effected at 40%.
29

DRAFT
Comparable Public Companies Model
Comparable Public Companies Model
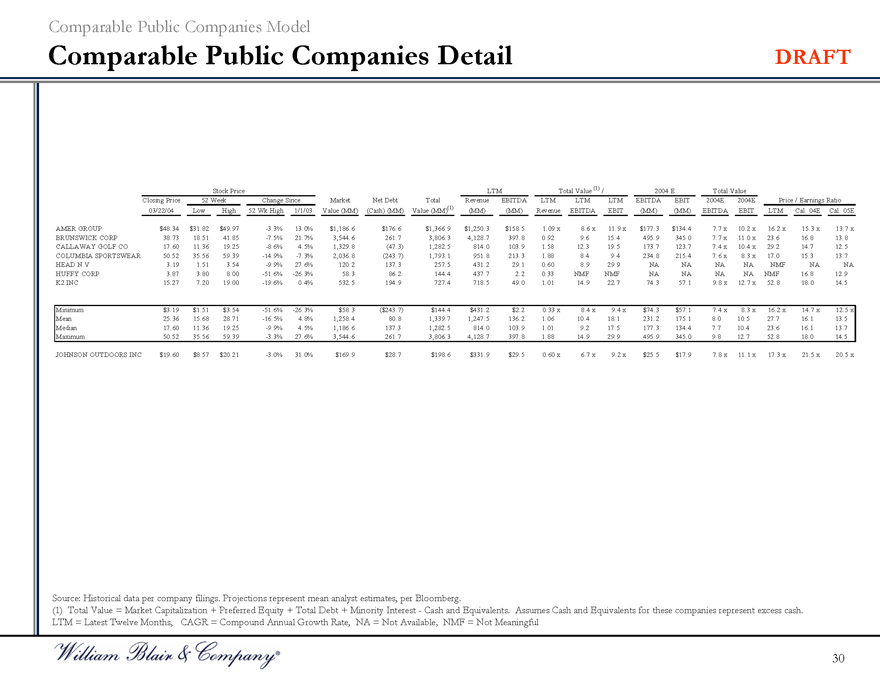
Comparable Public Companies Detail DRAFT
Stock Price LTM Total Value (1) / 2004 E Total Value
Closing Price 52 Week Change Since Market Net Debt Total Revenue EBITDA LTM LTM LTM EBITDA EBIT 2004E 2004E Price / Earnings Ratio
03/22/04 Low High 52 Wk High 1/1/03 Value (MM) (Cash) (MM) Value (MM)(1) (MM) (MM) Revenue EBITDA EBIT (MM) (MM) EBITDA EBIT LTM Cal. 04E Cal. 05E
AMER GROUP $48.34 $31.82 $49.97 -3.3% 13.0% $1,186.6 $176.6 $1,366.9 $1,250.3 $158.5 1.09 x 8.6 x 11.9 x $177.3 $134.4 7.7 x 10.2 x 16.2 x 15.3 x 13.7 x
BRUNSWICK CORP 38.73 18.51 41.85 -7.5% 21.7% 3,544.6 261.7 3,806.3 4,128.7 397.8 0.92 9.6 15.4 495.9 345.0 7.7 x 11.0 x 23.6 16.8 13.8
CALLAWAY GOLF CO 17.60 11.36 19.25 -8.6% 4.5% 1,329.8 (47.3) 1,282.5 814.0 103.9 1.58 12.3 19.5 173.7 123.7 7.4 x 10.4 x 29.2 14.7 12.5
COLUMBIA SPORTSWEAR 50.52 35.56 59.39 -14.9% -7.3% 2,036.8 (243.7) 1,793.1 951.8 213.3 1.88 8.4 9.4 234.8 215.4 7.6 x 8.3 x 17.0 15.3 13.7
HEAD N V 3.19 1.51 3.54 -9.9% 27.6% 120.2 137.3 257.5 431.2 29.1 0.60 8.9 29.9 NA NA NA NA NMF NA NA
HUFFY CORP 3.87 3.80 8.00 -51.6% -26.3% 58.3 86.2 144.4 437.7 2.2 0.33 NMF NMF NA NA NA NA NMF 16.8 12.9
K2 INC 15.27 7.20 19.00 -19.6% 0.4% 532.5 194.9 727.4 718.5 49.0 1.01 14.9 22.7 74.3 57.1 9.8 x 12.7 x 52.8 18.0 14.5
Minimum $3.19 $1.51 $3.54 -51.6% -26.3% $58.3 ($243.7) $144.4 $431.2 $2.2 0.33 x 8.4 x 9.4 x $74.3 $57.1 7.4 x 8.3 x 16.2 x 14.7 x 12.5 x
Mean 25.36 15.68 28.71 -16.5% 4.8% 1,258.4 80.8 1,339.7 1,247.5 136.2 1.06 10.4 18.1 231.2 175.1 8.0 10.5 27.7 16.1 13.5
Median 17.60 11.36 19.25 -9.9% 4.5% 1,186.6 137.3 1,282.5 814.0 103.9 1.01 9.2 17.5 177.3 134.4 7.7 10.4 23.6 16.1 13.7
Maximum 50.52 35.56 59.39 -3.3% 27.6% 3,544.6 261.7 3,806.3 4,128.7 397.8 1.88 14.9 29.9 495.9 345.0 9.8 12.7 52.8 18.0 14.5
JOHNSON OUTDOORS INC $19.60 $8.57 $20.21 -3.0% 31.0% $169.9 $28.7 $198.6 $331.9 $29.5 0.60 x 6.7 x 9.2 x $25.5 $17.9 7.8 x 11.1 x 17.3 x 21.5 x 20.5 x
Source: Historical data per company filings. Projections represent mean analyst estimates, per Bloomberg.
(1) Total Value = Market Capitalization + Preferred Equity + Total Debt + Minority Interest—Cash and Equivalents. Assumes Cash and Equivalents for these companies represent excess cash. LTM = Latest Twelve Months, CAGR = Compound Annual Growth Rate, NA = Not Available, NMF = Not Meaningful
30
Comparable Public Companies Model
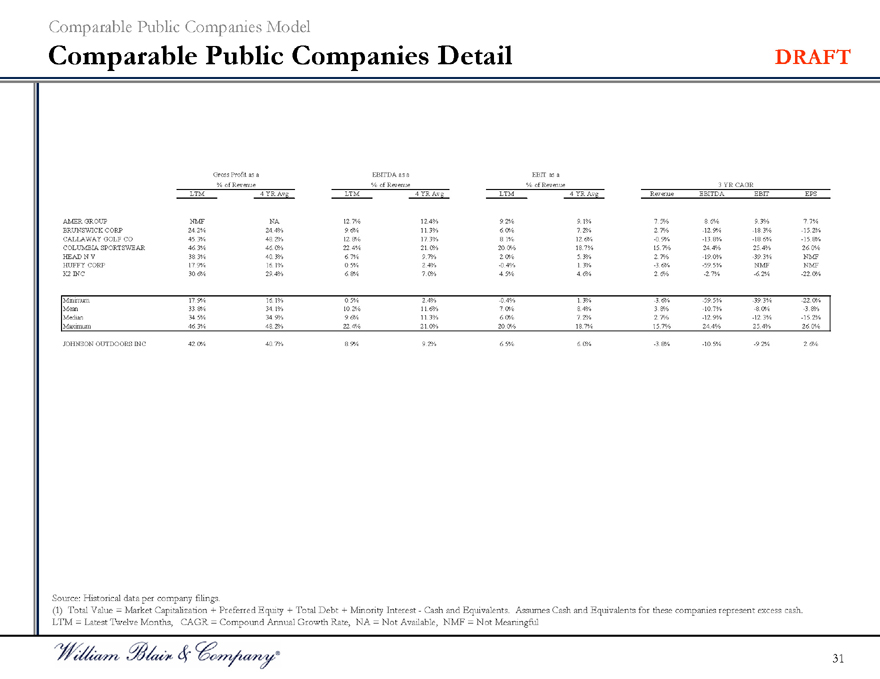
Comparable Public Companies Detail DRAFT
Gross Profit as a EBITDA as a EBIT as a
% of Revenue % of Revenue % of Revenue 3 YR CAGR
LTM 4 YR Avg LTM 4 YR Avg LTM 4 YR Avg Revenue EBITDA EBIT EPS
AMER GROUP NMF NA 12.7% 12.4% 9.2% 9.1% 7.5% 8.6% 9.3% 7.7%
BRUNSWICK CORP 24.2% 24.4% 9.6% 11.3% 6.0% 7.2% 2.7% -12.9% -18.3% -15.2%
CALLAWAY GOLF CO 45.3% 48.2% 12.8% 17.3% 8.1% 12.6% -0.9% -13.8% -18.6% -15.8%
COLUMBIA SPORTSWEAR 46.3% 46.0% 22.4% 21.0% 20.0% 18.7% 15.7% 24.4% 25.4% 26.0%
HEAD N V 38.3% 40.3% 6.7% 9.7% 2.0% 5.3% 2.7% -19.0% -39.3% NMF
HUFFY CORP 17.9% 16.1% 0.5% 2.4% -0.4% 1.3% -3.6% -59.5% NMF NMF
K2 INC 30.6% 29.4% 6.8% 7.0% 4.5% 4.6% 2.6% -2.7% -6.2% -22.0%
Minimum 17.9% 16.1% 0.5% 2.4% -0.4% 1.3% -3.6% -59.5% -39.3% -22.0%
Mean 33.8% 34.1% 10.2% 11.6% 7.0% 8.4% 3.8% -10.7% -8.0% -3.8%
Median 34.5% 34.9% 9.6% 11.3% 6.0% 7.2% 2.7% -12.9% -12.3% -15.2%
Maximum 46.3% 48.2% 22.4% 21.0% 20.0% 18.7% 15.7% 24.4% 25.4% 26.0%
JOHNSON OUTDOORS INC 42.0% 40.7% 8.9% 9.2% 6.5% 6.0% -3.8% -10.5% -9.2% 2.6%
Source: Historical data per company filings.
(1) Total Value = Market Capitalization + Preferred Equity + Total Debt + Minority Interest—Cash and Equivalents. Assumes Cash and Equivalents for these companies represent excess cash. LTM = Latest Twelve Months, CAGR = Compound Annual Growth Rate, NA = Not Available, NMF = Not Meaningful
31