UNITED STATES
SECURITIES AND EXCHANGE COMMISSION
Washington, D.C. 20549
FORM N-CSR
CERTIFIED SHAREHOLDER REPORT
OF
REGISTERED MANAGEMENT INVESTMENT COMPANIES
Investment Company Act file number: 811-04570
| Name of Registrant: | Vanguard New York Tax-Free Funds |
| Address of Registrant: | P.O. Box 2600 |
| Valley Forge, PA 19482 |
| Name and address of agent for service: | Anne E. Robinson, Esquire |
| P.O. Box 876 | |
| Valley Forge, PA 19482 |
Registrant’s telephone number, including area code: (610) 669-1000
Date of fiscal year end: November 30
Date of reporting period: December 1, 2022—November 30, 2023
Item 1: Reports to Shareholders

| Vanguard New York Municipal Money Market Fund |
| Vanguard New York Long-Term Tax-Exempt Fund |
Your Fund’s Performance at a Glance | 1 |
Advisor's Report | 2 |
About Your Fund’s Expenses | 5 |
New York Municipal Money Market Fund | 7 |
New York Long-Term Tax-Exempt Fund | 26 |
| • | For the 12 months ended November 30, 2023, the Vanguard New York Long-Term Tax-Exempt Fund returned 5.01% for Investor Shares and 5.10% for Admiral Shares. These results outpaced the 4.97% return of the fund's benchmark index, which includes state- and municipal-issued bonds across the maturity spectrum. Vanguard New York Municipal Money Market Fund returned 3.13%. |
| • | For much of the period, inflation continued to ease amid interest rate hikes by the Federal Reserve. Unexpected resilience in the labor market and consumer spending dialed back expectations of an imminent recession. Although the prospect of higher interest rates for longer and heightened geopolitical tensions weighed on market sentiment at times toward the close of the period, global stocks and bonds rallied in November. |
| • | On the whole, issuer fundamentals remained solid and muni yields fluctuated but ended the period not far from where they started it. Munis outperformed the broad taxable investment-grade bond market, where yields ended higher and prices lower. |
| • | The long-term fund’s outperformance was driven by an overweight allocation to credit, which benefited from attractive relative valuations and solid issuer fundamentals. Skilled management of the fund’s convexity profile also added value. |
| • | The fund’s allocation and selection in the transportation segment detracted modestly from performance. |
| Average Annual Total Returns Periods Ended November 30, 2023 | |||
| One Year | Three Years | Five Years | |
| Stocks | |||
| Russell 1000 Index (Large-caps) | 13.57% | 8.72% | 12.25% |
| Russell 2000 Index (Small-caps) | -2.56 | 1.13 | 4.78 |
| Russell 3000 Index (Broad U.S. market) | 12.61 | 8.26 | 11.77 |
| FTSE All-World ex US Index (International) | 9.64 | 2.12 | 5.49 |
| Bonds | |||
| Bloomberg U.S. Aggregate Float Adjusted Index (Broad taxable market) | 1.32% | -4.46% | 0.79% |
| Bloomberg Municipal Bond Index (Broad tax-exempt market) | 4.28 | -0.96 | 2.03 |
| FTSE Three-Month U.S. Treasury Bill Index | 5.12 | 2.08 | 1.85 |
| CPI | |||
| Consumer Price Index | 3.14% | 5.67% | 4.03% |
| Yields of Tax-Exempt Municipal Securities (National Averages, AAA-Rated General Obligation Issues) | ||
| Maturity | November 30, 2022 | November 30, 2023 |
| 2 years | 2.59% | 2.85% |
| 5 years | 2.65 | 2.60 |
| 10 years | 2.75 | 2.68 |
| 30 years | 3.57 | 3.77 |
| Source: Vanguard. | ||
| • | Based on actual fund return. This section helps you to estimate the actual expenses that you paid over the period. The ”Ending Account Value“ shown is derived from the fund‘s actual return, and the third column shows the dollar amount that would have been paid by an investor who started with $1,000 in the fund. You may use the information here, together with the amount you invested, to estimate the expenses that you paid over the period. |
| • | Based on hypothetical 5% yearly return. This section is intended to help you compare your fund‘s costs with those of other mutual funds. It assumes that the fund had a yearly return of 5% before expenses, but that the expense ratio is unchanged. In this case—because the return used is not the fund’s actual return—the results do not apply to your investment. The example is useful in making comparisons because the Securities and Exchange Commission requires all mutual funds to calculate expenses based on a 5% return. You can assess your fund’s costs by comparing this hypothetical example with the hypothetical examples that appear in shareholder reports of other funds. |
| Six Months Ended November 30, 2023 | |||
| Beginning Account Value 5/31/2023 | Ending Account Value 11/30/2023 | Expenses Paid During Period | |
| Based on Actual Fund Return | |||
| New York Municipal Money Market Fund | $1,000.00 | $1,016.90 | $0.81 |
| New York Long-Term Tax-Exempt Fund | |||
| Investor Shares | $1,000.00 | $1,022.40 | $0.86 |
| Admiral™ Shares | 1,000.00 | 1,022.80 | 0.46 |
| Based on Hypothetical 5% Yearly Return | |||
| New York Municipal Money Market Fund | $1,000.00 | $1,024.27 | $0.81 |
| New York Long-Term Tax-Exempt Fund | |||
| Investor Shares | $1,000.00 | $1,024.22 | $0.86 |
| Admiral Shares | 1,000.00 | 1,024.62 | 0.46 |
| 1 - 7 Days | 97.0% |
| 8 - 30 Days | 0.0 |
| 31 - 60 Days | 0.0 |
| 61 - 90 Days | 0.2 |
| 91 - 180 Days | 0.7 |
| Over 180 Days | 2.1 |
| Coupon | Maturity Date | Face Amount ($000) | Market Value• ($000) | ||
| Tax-Exempt Municipal Bonds (98.7%) | |||||
| New York (98.7%) | |||||
| Amherst NY BAN GO | 5.000% | 11/1/24 | 5,000 | 5,047 | |
| Battery Park City Authority Miscellaneous Revenue VRDO | 3.280% | 12/7/23 | 3,650 | 3,650 | |
| 1 | Build NYC Resource Corp. Miscellaneous Revenue (Asia Social Project) VRDO | 3.300% | 12/7/23 | 4,265 | 4,265 |
| Fairport Central School District BAN GO | 4.500% | 7/18/24 | 8,185 | 8,224 | |
| 1 | Geneva Industrial Development Agency College & University Revenue VRDO | 3.300% | 12/7/23 | 14,300 | 14,300 |
| Hauppauge Union Free School District GO | 5.000% | 6/25/24 | 15,000 | 15,114 | |
| 2,3 | Hudson Yards Infrastructure Corp. Miscellaneous Revenue TOB VRDO | 3.620% | 12/1/23 | 15,000 | 15,000 |
| 2 | Hudson Yards Infrastructure Corp. Miscellaneous Revenue TOB VRDO | 3.330% | 12/7/23 | 2,255 | 2,255 |
| 2 | Hudson Yards Infrastructure Corp. Miscellaneous Revenue TOB VRDO | 3.330% | 12/7/23 | 2,915 | 2,915 |
| 2 | Hudson Yards Infrastructure Corp. Miscellaneous Revenue TOB VRDO | 3.330% | 12/7/23 | 1,670 | 1,670 |
| 2 | Hudson Yards Infrastructure Corp. Miscellaneous Revenue TOB VRDO | 3.330% | 12/7/23 | 4,180 | 4,180 |
| 2,3 | Hudson Yards Infrastructure Corp. Miscellaneous Revenue VRDO | 3.330% | 12/7/23 | 6,250 | 6,250 |
| Ithaca City School District GO BAN | 4.500% | 7/12/24 | 10,000 | 10,051 | |
| 1,2,3 | Long Island Power Authority Electric Power & Light Revenue TOB VRDO | 3.330% | 12/7/23 | 2,635 | 2,635 |
| 1 | Metropolitan Transportation Authority Miscellaneous Taxes Revenue VRDO | 3.250% | 12/7/23 | 19,740 | 19,740 |
| 1 | Metropolitan Transportation Authority Transit Fuel Sales Tax Revenue VRDO | 3.250% | 12/7/23 | 30,250 | 30,250 |
| 1,2 | Metropolitan Transportation Authority Transit Revenue TOB VRDO | 3.330% | 12/7/23 | 1,245 | 1,245 |
| 1,2,3 | Metropolitan Transportation Authority Transit Revenue TOB VRDO | 3.350% | ��12/7/23 | 3,585 | 3,585 |
| 1,2 | Metropolitan Transportation Authority Transit Revenue TOB VRDO | 3.350% | 12/7/23 | 18,465 | 18,465 |
| 1 | Metropolitan Transportation Authority Transit Revenue VRDO | 3.300% | 12/1/23 | 8,540 | 8,540 |
| 1 | Metropolitan Transportation Authority Transit Revenue VRDO | 3.300% | 12/1/23 | 26,270 | 26,270 |
| 1 | Metropolitan Transportation Authority Transit Revenue VRDO | 3.250% | 12/7/23 | 8,485 | 8,485 |
| 1 | Metropolitan Transportation Authority Transit Revenue VRDO | 3.250% | 12/7/23 | 33,510 | 33,510 |
| 1 | Metropolitan Transportation Authority Transit Revenue VRDO | 3.290% | 12/7/23 | 860 | 860 |
| 1 | Metropolitan Transportation Authority Transit Revenue VRDO | 3.350% | 12/7/23 | 24,400 | 24,400 |
| 1 | Monroe County NY Industrial Development Corp. College & University Revenue VRDO | 3.410% | 12/7/23 | 5,590 | 5,590 |
| 1 | New York City Capital Resources Corp. Health, Hospital, Nursing Home Revenue VRDO | 3.220% | 12/7/23 | 23,955 | 23,955 |
| Coupon | Maturity Date | Face Amount ($000) | Market Value• ($000) | ||
| 1 | New York City Capital Resources Corp. Health, Hospital, Nursing Home Revenue VRDO | 3.260% | 12/7/23 | 560 | 560 |
| 1 | New York City Health and Hospitals Corp. Health, Hospital, Nursing Home Revenue VRDO | 3.300% | 12/7/23 | 23,975 | 23,975 |
| 1 | New York City Health and Hospitals Corp. Health, Hospital, Nursing Home Revenue VRDO | 3.340% | 12/7/23 | 1,100 | 1,100 |
| 2 | New York City Housing Development Corp. Local or Guaranteed Housing Revenue TOB VRDO | 3.330% | 12/7/23 | 6,315 | 6,315 |
| 2 | New York City Housing Development Corp. Local or Guaranteed Housing Revenue TOB VRDO | 3.330% | 12/7/23 | 5,000 | 5,000 |
| New York City Housing Development Corp. Local or Guaranteed Housing Revenue VRDO | 3.200% | 12/7/23 | 5,520 | 5,520 | |
| 1 | New York City Housing Development Corp. Local or Guaranteed Housing Revenue VRDO | 3.200% | 12/7/23 | 2,000 | 2,000 |
| New York City Housing Development Corp. Local or Guaranteed Housing Revenue VRDO | 3.200% | 12/7/23 | 10,900 | 10,900 | |
| New York City Housing Development Corp. Local or Guaranteed Housing Revenue VRDO | 3.210% | 12/7/23 | 35,800 | 35,800 | |
| 1 | New York City Housing Development Corp. Local or Guaranteed Housing Revenue VRDO | 3.210% | 12/7/23 | 26,000 | 26,000 |
| 1 | New York City Housing Development Corp. Local or Guaranteed Housing Revenue VRDO | 3.230% | 12/7/23 | 3,400 | 3,400 |
| 1 | New York City Housing Development Corp. Local or Guaranteed Housing Revenue VRDO | 3.240% | 12/7/23 | 3,450 | 3,450 |
| 1 | New York City Housing Development Corp. Local or Guaranteed Housing Revenue VRDO | 3.240% | 12/7/23 | 2,675 | 2,675 |
| 1 | New York City Housing Development Corp. Local or Guaranteed Housing Revenue VRDO | 3.300% | 12/7/23 | 14,065 | 14,065 |
| 1 | New York City Housing Development Corp. Local or Guaranteed Housing Revenue VRDO | 3.300% | 12/7/23 | 43,450 | 43,450 |
| New York City Housing Development Corp. Local or Guaranteed Housing Revenue VRDO | 3.300% | 12/7/23 | 25,365 | 25,365 | |
| New York City Housing Development Corp. Local or Guaranteed Housing Revenue VRDO | 3.300% | 12/7/23 | 26,100 | 26,100 | |
| 1 | New York City Housing Development Corp. Local or Guaranteed Housing Revenue VRDO | 3.300% | 12/7/23 | 8,075 | 8,075 |
| New York City Housing Development Corp. Local or Guaranteed Housing Revenue VRDO | 3.300% | 12/7/23 | 6,070 | 6,070 | |
| New York City Housing Development Corp. Local or Guaranteed Housing Revenue VRDO | 3.300% | 12/7/23 | 7,365 | 7,365 | |
| New York City Housing Development Corp. Local or Guaranteed Housing Revenue VRDO | 3.330% | 12/7/23 | 7,500 | 7,500 | |
| 1 | New York City Housing Development Corp. Local or Guaranteed Housing Revenue VRDO | 3.370% | 12/7/23 | 11,580 | 11,580 |
| 2 | New York City Housing Development Corp. Local or Guaranteed Housing Revenue VRDO | 3.370% | 12/7/23 | 13,500 | 13,500 |
| 1 | New York City Housing Development Corp. Local or Guaranteed Housing Revenue VRDO | 3.390% | 12/7/23 | 16,000 | 16,000 |
| 1 | New York City Housing Development Corp. Local or Guaranteed Housing Revenue VRDO | 3.390% | 12/7/23 | 24,000 | 24,000 |
| 1 | New York City Industrial Development Agency Industrial Revenue VRDO | 3.350% | 12/7/23 | 14,000 | 14,000 |
| 1 | New York City Industrial Development Agency Lease (Appropriation) Revenue VRDO | 3.400% | 12/1/23 | 12,835 | 12,835 |
| 1 | New York City Industrial Development Agency Miscellaneous Revenue VRDO | 3.230% | 12/7/23 | 15,035 | 15,035 |
| 2 | New York City Municipal Water Finance Authority Water & Sewer System Revenue TOB VRDO | 3.330% | 12/7/23 | 9,570 | 9,570 |
| Coupon | Maturity Date | Face Amount ($000) | Market Value• ($000) | ||
| 2 | New York City Municipal Water Finance Authority Water & Sewer System Water Revenue TOB VRDO | 3.330% | 12/7/23 | 5,300 | 5,300 |
| 2 | New York City Municipal Water Finance Authority Water Revenue TOB VRDO | 3.350% | 12/1/23 | 8,750 | 8,750 |
| 2 | New York City Municipal Water Finance Authority Water Revenue TOB VRDO | 3.350% | 12/1/23 | 3,350 | 3,350 |
| 2 | New York City Municipal Water Finance Authority Water Revenue TOB VRDO | 3.320% | 12/7/23 | 2,740 | 2,740 |
| 2 | New York City Municipal Water Finance Authority Water Revenue TOB VRDO | 3.320% | 12/7/23 | 3,750 | 3,750 |
| 1,2 | New York City Municipal Water Finance Authority Water Revenue TOB VRDO | 3.330% | 12/7/23 | 32,700 | 32,700 |
| 2 | New York City Municipal Water Finance Authority Water Revenue TOB VRDO | 3.330% | 12/7/23 | 1,875 | 1,875 |
| 2 | New York City Municipal Water Finance Authority Water Revenue TOB VRDO | 3.330% | 12/7/23 | 2,100 | 2,100 |
| 2 | New York City Municipal Water Finance Authority Water Revenue TOB VRDO | 3.330% | 12/7/23 | 1,875 | 1,875 |
| New York City Municipal Water Finance Authority Water Revenue VRDO | 3.220% | 12/1/23 | 9,960 | 9,960 | |
| New York City Municipal Water Finance Authority Water Revenue VRDO | 3.250% | 12/1/23 | 19,470 | 19,470 | |
| New York City Municipal Water Finance Authority Water Revenue VRDO | 3.350% | 12/1/23 | 495 | 495 | |
| New York City Municipal Water Finance Authority Water Revenue VRDO | 3.400% | 12/1/23 | 9,170 | 9,170 | |
| New York City Municipal Water Finance Authority Water Revenue VRDO | 3.400% | 12/1/23 | 19,215 | 19,215 | |
| New York City Municipal Water Finance Authority Water Revenue VRDO | 3.400% | 12/1/23 | 14,160 | 14,160 | |
| New York City Municipal Water Finance Authority Water Revenue VRDO | 3.400% | 12/1/23 | 2,000 | 2,000 | |
| New York City Municipal Water Finance Authority Water Revenue VRDO | 3.200% | 12/7/23 | 3,230 | 3,230 | |
| New York City Municipal Water Finance Authority Water Revenue VRDO | 3.200% | 12/7/23 | 18,455 | 18,455 | |
| New York City Municipal Water Finance Authority Water Revenue VRDO | 3.260% | 12/7/23 | 1,800 | 1,800 | |
| New York City Municipal Water Finance Authority Water Revenue VRDO | 3.260% | 12/7/23 | 23,750 | 23,750 | |
| New York City Municipal Water Finance Authority Water Revenue VRDO | 3.290% | 12/7/23 | 9,995 | 9,995 | |
| New York City Municipal Water Finance Authority Water Revenue VRDO | 3.290% | 12/7/23 | 1,000 | 1,000 | |
| New York City Municipal Water Finance Authority Water Revenue VRDO | 3.300% | 12/7/23 | 8,580 | 8,580 | |
| New York City Municipal Water Finance Authority Water Revenue VRDO | 3.300% | 12/7/23 | 10,000 | 10,000 | |
| 2 | New York City Transitional Finance Authority Building Aid Appropriations Revenue VRDO | 3.330% | 12/7/23 | 51,570 | 51,570 |
| 2 | New York City Transitional Finance Authority Future Tax Secured Income Tax Revenue TOB VRDO | 3.350% | 12/1/23 | 2,615 | 2,615 |
| 2 | New York City Transitional Finance Authority Future Tax Secured Income Tax Revenue TOB VRDO | 3.350% | 12/1/23 | 16,245 | 16,245 |
| 2 | New York City Transitional Finance Authority Future Tax Secured Income Tax Revenue TOB VRDO | 3.320% | 12/7/23 | 3,750 | 3,750 |
| 2 | New York City Transitional Finance Authority Future Tax Secured Income Tax Revenue TOB VRDO | 3.320% | 12/7/23 | 3,285 | 3,285 |
| Coupon | Maturity Date | Face Amount ($000) | Market Value• ($000) | ||
| 2 | New York City Transitional Finance Authority Future Tax Secured Income Tax Revenue TOB VRDO | 3.330% | 12/7/23 | 3,915 | 3,915 |
| 2 | New York City Transitional Finance Authority Future Tax Secured Income Tax Revenue TOB VRDO | 3.330% | 12/7/23 | 3,595 | 3,595 |
| 2 | New York City Transitional Finance Authority Future Tax Secured Income Tax Revenue TOB VRDO | 3.330% | 12/7/23 | 4,800 | 4,800 |
| 2 | New York City Transitional Finance Authority Future Tax Secured Income Tax Revenue TOB VRDO | 3.330% | 12/7/23 | 3,000 | 3,000 |
| 2 | New York City Transitional Finance Authority Future Tax Secured Income Tax Revenue TOB VRDO | 3.330% | 12/7/23 | 2,445 | 2,445 |
| 2 | New York City Transitional Finance Authority Future Tax Secured Income Tax Revenue TOB VRDO | 3.330% | 12/7/23 | 2,000 | 2,000 |
| 2 | New York City Transitional Finance Authority Future Tax Secured Income Tax Revenue TOB VRDO | 3.330% | 12/7/23 | 2,905 | 2,905 |
| 2 | New York City Transitional Finance Authority Future Tax Secured Income Tax Revenue TOB VRDO | 3.330% | 12/7/23 | 6,470 | 6,470 |
| New York City Transitional Finance Authority Future Tax Secured Income Tax Revenue VRDO | 3.250% | 12/1/23 | 6,675 | 6,675 | |
| New York City Transitional Finance Authority Future Tax Secured Income Tax Revenue VRDO | 3.200% | 12/7/23 | 16,455 | 16,455 | |
| New York City Transitional Finance Authority Future Tax Secured Income Tax Revenue VRDO | 3.280% | 12/7/23 | 13,785 | 13,785 | |
| New York City Transitional Finance Authority Future Tax Secured Sales Tax Revenue VRDO | 3.400% | 12/1/23 | 1,110 | 1,110 | |
| 2 | New York City Transitional Finance Authority Income Tax Revenue TOB VRDO | 3.350% | 12/1/23 | 3,750 | 3,750 |
| 2 | New York City Transitional Finance Authority Income Tax Revenue TOB VRDO | 3.320% | 12/7/23 | 3,475 | 3,475 |
| 2 | New York City Transitional Finance Authority Income Tax Revenue TOB VRDO | 3.330% | 12/7/23 | 7,610 | 7,610 |
| 1 | New York City Trust for Cultural Resources Miscellaneous Revenue VRDO | 3.300% | 12/7/23 | 2,665 | 2,665 |
| New York City Trust for Cultural Resources Recreational Revenue VRDO | 3.050% | 12/7/23 | 23,650 | 23,650 | |
| New York City Trust for Cultural Resources Recreational Revenue VRDO | 3.050% | 12/7/23 | 52,130 | 52,130 | |
| 1 | New York City Trust for Cultural Resources Recreational Revenue VRDO | 3.200% | 12/7/23 | 2,200 | 2,200 |
| New York City Water & Sewer System Sewer Revenue VRDO | 3.250% | 12/1/23 | 2,145 | 2,145 | |
| 1 | New York Liberty Development Corp. Industrial Revenue VRDO | 3.250% | 12/7/23 | 37,150 | 37,150 |
| New York Mortgage Agency Homeowner Mortgage Local or Guaranteed Housing Revenue VRDO | 3.250% | 12/7/23 | 37,175 | 37,175 | |
| New York Mortgage Agency Homeowner Mortgage Local or Guaranteed Housing Revenue VRDO | 3.280% | 12/7/23 | 23,175 | 23,175 | |
| New York Mortgage Agency Homeowner Mortgage Local or Guaranteed Housing Revenue VRDO | 3.300% | 12/7/23 | 15,000 | 15,000 | |
| 2 | New York Mortgage Agency Local or Guaranteed Housing Revenue TOB VRDO | 3.330% | 12/7/23 | 1,660 | 1,660 |
| 1,2 | New York NY GO TOB VRDO | 3.300% | 12/1/23 | 14,555 | 14,555 |
| 1,2 | New York NY GO TOB VRDO | 3.330% | 12/7/23 | 13,550 | 13,550 |
| 1,2 | New York NY GO TOB VRDO | 3.330% | 12/7/23 | 2,000 | 2,000 |
| 2 | New York NY GO TOB VRDO | 3.330% | 12/7/23 | 1,875 | 1,875 |
| 2 | New York NY GO TOB VRDO | 3.330% | 12/7/23 | 2,860 | 2,860 |
| 2 | New York NY GO TOB VRDO | 3.330% | 12/7/23 | 5,800 | 5,800 |
| 2 | New York NY GO TOB VRDO | 3.330% | 12/7/23 | 1,000 | 1,000 |
| 2 | New York NY GO TOB VRDO | 3.330% | 12/7/23 | 2,000 | 2,000 |
| 1 | New York NY GO VRDO | 3.260% | 12/1/23 | 5,040 | 5,040 |
| 1 | New York NY GO VRDO | 3.400% | 12/1/23 | 7,800 | 7,800 |
| Coupon | Maturity Date | Face Amount ($000) | Market Value• ($000) | ||
| 1 | New York NY GO VRDO | 3.400% | 12/1/23 | 2,165 | 2,165 |
| New York NY GO VRDO | 3.500% | 12/1/23 | 1,100 | 1,100 | |
| 1 | New York NY GO VRDO | 3.200% | 12/7/23 | 4,600 | 4,600 |
| 1 | New York NY GO VRDO | 3.250% | 12/7/23 | 9,940 | 9,940 |
| 1 | New York NY GO VRDO | 3.250% | 12/7/23 | 5,430 | 5,430 |
| 1 | New York NY GO VRDO | 3.280% | 12/7/23 | 14,450 | 14,450 |
| 1 | New York NY GO VRDO | 3.310% | 12/7/23 | 5,470 | 5,470 |
| New York Power Authority CP | 3.840% | 12/7/23 | 20,000 | 20,000 | |
| 2 | New York Power Authority Electric Power & Light Revenue TOB VRDO | 3.330% | 12/7/23 | 3,665 | 3,665 |
| 2 | New York Power Authority Electric Power & Light Revenue TOB VRDO | 3.330% | 12/7/23 | 3,940 | 3,940 |
| 2 | New York State Dormitory Authority College & University Revenue TOB VRDO | 3.330% | 12/7/23 | 16,875 | 16,875 |
| 2 | New York State Dormitory Authority College & University Revenue TOB VRDO | 3.330% | 12/7/23 | 2,240 | 2,240 |
| 2 | New York State Dormitory Authority College & University Revenue TOB VRDO | 3.330% | 12/7/23 | 3,750 | 3,750 |
| New York State Dormitory Authority College & University Revenue VRDO | 3.150% | 12/1/23 | 65,320 | 65,320 | |
| New York State Dormitory Authority College & University Revenue VRDO | 3.000% | 12/7/23 | 60,895 | 60,895 | |
| New York State Dormitory Authority College & University Revenue VRDO | 3.050% | 12/7/23 | 12,550 | 12,550 | |
| New York State Dormitory Authority College & University Revenue VRDO | 3.200% | 12/7/23 | 56,775 | 56,775 | |
| New York State Dormitory Authority College & University Revenue VRDO | 3.200% | 12/7/23 | 3,665 | 3,665 | |
| New York State Dormitory Authority College & University Revenue VRDO | 3.270% | 12/7/23 | 10,875 | 10,875 | |
| New York State Dormitory Authority College & University Revenue VRDO | 3.270% | 12/7/23 | 12,055 | 12,055 | |
| 1 | New York State Dormitory Authority College & University Revenue VRDO | 3.280% | 12/7/23 | 2,375 | 2,375 |
| 1 | New York State Dormitory Authority College & University Revenue VRDO | 3.280% | 12/7/23 | 14,130 | 14,130 |
| 1,2 | New York State Dormitory Authority Health, Hospital, Nursing Home Revenue TOB VRDO | 3.330% | 12/7/23 | 4,495 | 4,495 |
| 1,2 | New York State Dormitory Authority Health, Hospital, Nursing Home Revenue TOB VRDO | 3.350% | 12/7/23 | 2,665 | 2,665 |
| 1 | New York State Dormitory Authority Health, Hospital, Nursing Home Revenue VRDO | 3.320% | 12/7/23 | 7,250 | 7,250 |
| 1 | New York State Dormitory Authority Health, Hospital, Nursing Home Revenue VRDO | 3.340% | 12/7/23 | 50,885 | 50,885 |
| 2 | New York State Dormitory Authority Income Tax Revenue TOB VRDO | 3.320% | 12/7/23 | 7,000 | 7,000 |
| 2 | New York State Dormitory Authority Income Tax Revenue TOB VRDO | 3.330% | 12/7/23 | 4,000 | 4,000 |
| 2 | New York State Dormitory Authority Income Tax Revenue TOB VRDO | 3.330% | 12/7/23 | 2,460 | 2,460 |
| 2 | New York State Dormitory Authority Income Tax Revenue TOB VRDO | 3.330% | 12/7/23 | 5,625 | 5,625 |
| 2 | New York State Dormitory Authority Income Tax Revenue TOB VRDO | 3.330% | 12/7/23 | 11,325 | 11,325 |
| 2 | New York State Dormitory Authority Income Tax Revenue TOB VRDO | 3.330% | 12/7/23 | 3,420 | 3,420 |
| 2 | New York State Dormitory Authority Income Tax Revenue TOB VRDO | 3.330% | 12/7/23 | 4,525 | 4,525 |
| Coupon | Maturity Date | Face Amount ($000) | Market Value• ($000) | ||
| 2 | New York State Dormitory Authority Income Tax Revenue TOB VRDO | 3.430% | 12/7/23 | 16,480 | 16,480 |
| 2,4 | New York State Dormitory Authority Intergovernmental Agreement Revenue TOB VRDO | 3.330% | 12/7/23 | 5,700 | 5,700 |
| 2 | New York State Dormitory Authority Lease (Appropriation) Revenue TOB VRDO | 3.320% | 12/7/23 | 2,000 | 2,000 |
| 2 | New York State Dormitory Authority Lease (Appropriation) Revenue TOB VRDO | 3.330% | 12/7/23 | 2,500 | 2,500 |
| 2 | New York State Dormitory Authority Sales Tax Revenue TOB VRDO | 3.310% | 12/7/23 | 4,450 | 4,450 |
| 2 | New York State Dormitory Authority Sales Tax Revenue TOB VRDO | 3.320% | 12/7/23 | 3,685 | 3,685 |
| 2 | New York State Dormitory Authority Sales Tax Revenue TOB VRDO | 3.320% | 12/7/23 | 17,600 | 17,600 |
| 2 | New York State Dormitory Authority Sales Tax Revenue TOB VRDO | 3.330% | 12/7/23 | 5,900 | 5,900 |
| 2 | New York State Dormitory Authority Sales Tax Revenue TOB VRDO | 3.330% | 12/7/23 | 2,355 | 2,355 |
| 2 | New York State Dormitory Authority Sales Tax Revenue TOB VRDO | 3.330% | 12/7/23 | 1,630 | 1,630 |
| 2 | New York State Dormitory Authority Sales Tax Revenue TOB VRDO | 3.330% | 12/7/23 | 5,000 | 5,000 |
| 1 | New York State Energy Research & Development Authority Industrial Revenue (Consolidated Edison Co. New York Inc. Project) VRDO | 3.150% | 12/7/23 | 3,200 | 3,200 |
| 1 | New York State Energy Research & Development Authority Industrial Revenue (Consolidated Edison Co. New York Inc. Project) VRDO | 3.310% | 12/7/23 | 7,400 | 7,400 |
| 1 | New York State Energy Research & Development Authority Industrial Revenue (Consolidated Edison Co. New York Inc. Project) VRDO | 3.340% | 12/7/23 | 26,300 | 26,300 |
| 1 | New York State Energy Research & Development Authority Industrial Revenue VRDO | 3.350% | 12/7/23 | 45,300 | 45,300 |
| 2 | New York State Environmental Facilities Corp. Water Revenue TOB VRDO | 3.330% | 12/7/23 | 3,565 | 3,565 |
| 1 | New York State Housing Finance Agency Local or Guaranteed Housing Revenue VRDO | 3.150% | 12/7/23 | 9,800 | 9,800 |
| New York State Housing Finance Agency Local or Guaranteed Housing Revenue VRDO | 3.200% | 12/7/23 | 49,000 | 49,000 | |
| 1 | New York State Housing Finance Agency Local or Guaranteed Housing Revenue VRDO | 3.200% | 12/7/23 | 7,500 | 7,500 |
| 1 | New York State Housing Finance Agency Local or Guaranteed Housing Revenue VRDO | 3.250% | 12/7/23 | 49,125 | 49,125 |
| 1 | New York State Housing Finance Agency Local or Guaranteed Housing Revenue VRDO | 3.250% | 12/7/23 | 12,450 | 12,450 |
| 1 | New York State Housing Finance Agency Local or Guaranteed Housing Revenue VRDO | 3.250% | 12/7/23 | 12,845 | 12,845 |
| New York State Housing Finance Agency Local or Guaranteed Housing Revenue VRDO | 3.260% | 12/7/23 | 1,500 | 1,500 | |
| New York State Housing Finance Agency Local or Guaranteed Housing Revenue VRDO | 3.270% | 12/7/23 | 29,590 | 29,590 | |
| 1 | New York State Housing Finance Agency Local or Guaranteed Housing Revenue VRDO | 3.300% | 12/7/23 | 10,000 | 10,000 |
| 1 | New York State Housing Finance Agency Local or Guaranteed Housing Revenue VRDO | 3.300% | 12/7/23 | 39,550 | 39,550 |
| 1 | New York State Housing Finance Agency Local or Guaranteed Housing Revenue VRDO | 3.330% | 12/7/23 | 4,900 | 4,900 |
| 1 | New York State Housing Finance Agency Local or Guaranteed Housing Revenue VRDO | 3.340% | 12/7/23 | 25,962 | 25,962 |
| Coupon | Maturity Date | Face Amount ($000) | Market Value• ($000) | ||
| 1 | New York State Housing Finance Agency Local or Guaranteed Housing Revenue VRDO | 3.390% | 12/7/23 | 14,100 | 14,100 |
| New York State Housing Finance Agency Local or Guaranteed Housing Revenue VRDO | 3.390% | 12/7/23 | 22,000 | 22,000 | |
| 1 | New York State Housing Finance Agency Local or Guaranteed Housing Revenue VRDO | 3.390% | 12/7/23 | 5,000 | 5,000 |
| New York State Power Authority CP | 3.600% | 12/4/23 | 11,791 | 11,791 | |
| New York State Power Authority CP | 4.000% | 2/6/24 | 6,300 | 6,300 | |
| 2 | New York State Thruway Authority Income Tax Revenue TOB VRDO | 3.310% | 12/7/23 | 4,065 | 4,065 |
| 2 | New York State Thruway Authority Income Tax Revenue TOB VRDO | 3.330% | 12/7/23 | 5,000 | 5,000 |
| 2 | New York State Thruway Authority Income Tax Revenue TOB VRDO | 3.330% | 12/7/23 | 14,800 | 14,800 |
| 2 | New York State Thruway Authority Income Tax Revenue TOB VRDO | 3.350% | 12/7/23 | 2,150 | 2,150 |
| 2 | New York State Thruway Authority Lease (Appropriation) Revenue TOB VRDO | 3.330% | 12/7/23 | 945 | 945 |
| 2 | New York State Thruway Authority Lease (Appropriation) Revenue TOB VRDO | 3.330% | 12/7/23 | 9,000 | 9,000 |
| 2 | New York State Urban Development Corp. Income Tax Revenue TOB VRDO | 3.330% | 12/7/23 | 5,150 | 5,150 |
| 2 | New York State Urban Development Corp. Income Tax Revenue TOB VRDO | 3.330% | 12/7/23 | 6,760 | 6,760 |
| 2 | New York State Urban Development Corp. Income Tax Revenue TOB VRDO | 3.330% | 12/7/23 | 3,125 | 3,125 |
| 2 | New York State Urban Development Corp. Income Tax Revenue TOB VRDO | 3.330% | 12/7/23 | 5,625 | 5,625 |
| 2 | New York State Urban Development Corp. Income Tax Revenue TOB VRDO | 3.330% | 12/7/23 | 3,880 | 3,880 |
| New York State Urban Development Corp. Income Tax Revenue, Prere. | 5.000% | 3/15/24 | 11,295 | 11,336 | |
| 2 | New York State Urban Development Corp. Intergovernmental Agreement Revenue TOB VRDO | 3.350% | 12/1/23 | 4,000 | 4,000 |
| 2 | New York State Urban Development Corp. Intergovernmental Agreement Revenue TOB VRDO | 3.330% | 12/7/23 | 16,875 | 16,875 |
| 2 | New York State Urban Development Corp. Intergovernmental Agreement Revenue TOB VRDO | 3.330% | 12/7/23 | 3,750 | 3,750 |
| 2 | New York State Urban Development Corp. Intergovernmental Agreement Revenue TOB VRDO | 3.330% | 12/7/23 | 6,000 | 6,000 |
| 2 | New York State Urban Development Corp. Lease (Appropriation) Revenue TOB VRDO | 3.330% | 12/7/23 | 1,825 | 1,825 |
| 2 | New York State Urban Development Corporation Highway Revenue TOB VRDO | 3.330% | 12/7/23 | 4,375 | 4,375 |
| 1,2 | New York Transportation Development Corp. Special Facilities Revenue TOB VRDO | 3.400% | 12/7/23 | 42,975 | 42,975 |
| 5 | New York Trust for Cultural Resources Miscellaneous Revenue, SIFMA Municipal Swap Index Yield + 0.040% | 3.340% | 4/29/24 | 9,900 | 9,900 |
| 5 | New York Trust for Cultural Resources Miscellaneous Revenue, SIFMA Municipal Swap Index Yield + 0.040% | 3.340% | 7/15/24 | 12,555 | 12,555 |
| 2 | Nuveen New York AMT-Free Quality Municipal Income Fund VRDO VRDP | 3.340% | 12/7/23 | 25,600 | 25,600 |
| 2 | Nuveen New York AMT-Free Quality Municipal Income Fund VRDO VRDP | 3.350% | 12/7/23 | 10,000 | 10,000 |
| 2 | Nuveen New York AMT-Free Quality Municipal Income Fund VRDO VRDP | 3.350% | 12/7/23 | 80,300 | 80,300 |
| 2 | Nuveen New York Quality Municipal Income Fund VRDO VRDP | 3.390% | 12/7/23 | 34,800 | 34,800 |
| Coupon | Maturity Date | Face Amount ($000) | Market Value• ($000) | ||
| Port Authority of New York & New Jersey Port, Airport & Marina Revenue | 5.000% | 9/15/24 | 3,000 | 3,016 | |
| 2 | Port Authority of New York & New Jersey Port, Airport & Marina Revenue TOB VRDO | 3.350% | 12/1/23 | 1,415 | 1,415 |
| 2 | Port Authority of New York & New Jersey Port, Airport & Marina Revenue TOB VRDO | 3.380% | 12/1/23 | 3,940 | 3,940 |
| 2 | Port Authority of New York & New Jersey Port, Airport & Marina Revenue TOB VRDO | 3.330% | 12/7/23 | 7,500 | 7,500 |
| 2 | Port Authority of New York & New Jersey Port, Airport & Marina Revenue TOB VRDO | 3.330% | 12/7/23 | 1,875 | 1,875 |
| 2 | Port Authority of New York & New Jersey Port, Airport & Marina Revenue TOB VRDO | 3.330% | 12/7/23 | 11,575 | 11,575 |
| 2 | Port Authority of New York & New Jersey Port, Airport & Marina Revenue TOB VRDO | 3.340% | 12/7/23 | 1,750 | 1,750 |
| 2 | Port Authority of New York & New Jersey Port, Airport & Marina Revenue TOB VRDO | 3.360% | 12/7/23 | 4,215 | 4,215 |
| 2 | Port Authority of New York & New Jersey Port, Airport & Marina Revenue TOB VRDO | 3.360% | 12/7/23 | 3,335 | 3,335 |
| 2 | Port Authority of New York & New Jersey Port, Airport & Marina Revenue TOB VRDO | 3.360% | 12/7/23 | 1,040 | 1,040 |
| 2 | Port Authority of New York & New Jersey Port, Airport & Marina Revenue TOB VRDO | 3.360% | 12/7/23 | 5,040 | 5,040 |
| 2 | Port Authority of New York & New Jersey Port, Airport & Marina Revenue TOB VRDO | 3.360% | 12/7/23 | 4,825 | 4,825 |
| 1,2 | Port Authority of New York & New Jersey Port, Airport & Marina Revenue TOB VRDO | 3.360% | 12/7/23 | 7,600 | 7,600 |
| 2 | Port Authority of New York & New Jersey Port, Airport & Marina Revenue TOB VRDO | 3.360% | 12/7/23 | 3,200 | 3,200 |
| 2 | Port Authority of New York & New Jersey Port, Airport & Marina Revenue TOB VRDO | 3.370% | 12/7/23 | 1,745 | 1,745 |
| 2 | Port Authority of New York & New Jersey Port, Airport & Marina Revenue TOB VRDO | 3.370% | 12/7/23 | 2,310 | 2,310 |
| 2 | Port Authority of New York & New Jersey Port, Airport & Marina Revenue VRDO | 3.330% | 12/7/23 | 4,780 | 4,780 |
| 2 | Triborough Bridge & Tunnel Authority Fuel Sales Tax Revenue TOB VRDO | 3.330% | 12/7/23 | 3,845 | 3,845 |
| 2 | Triborough Bridge & Tunnel Authority Highway Revenue TOB VRDO | 3.350% | 12/1/23 | 12,960 | 12,960 |
| 2 | Triborough Bridge & Tunnel Authority Highway Revenue TOB VRDO | 3.350% | 12/1/23 | 2,640 | 2,640 |
| 2 | Triborough Bridge & Tunnel Authority Highway Revenue TOB VRDO | 3.330% | 12/7/23 | 1,665 | 1,665 |
| 2 | Triborough Bridge & Tunnel Authority Highway Revenue TOB VRDO | 3.330% | 12/7/23 | 3,200 | 3,200 |
| 2 | Triborough Bridge & Tunnel Authority Highway Revenue TOB VRDO | 3.330% | 12/7/23 | 1,250 | 1,250 |
| 2 | Triborough Bridge & Tunnel Authority Highway Revenue TOB VRDO | 3.330% | 12/7/23 | 1,565 | 1,565 |
| 2 | Triborough Bridge & Tunnel Authority Highway Revenue TOB VRDO | 3.330% | 12/7/23 | 8,225 | 8,225 |
| 2 | Triborough Bridge & Tunnel Authority Highway Revenue TOB VRDO | 3.330% | 12/7/23 | 3,310 | 3,310 |
| 2 | Triborough Bridge & Tunnel Authority Highway Revenue Tolls TOB VRDO | 3.350% | 12/1/23 | 9,600 | 9,600 |
| 1 | Triborough Bridge & Tunnel Authority Highway Revenue VRDO | 3.250% | 12/1/23 | 19,900 | 19,900 |
| 1 | Triborough Bridge & Tunnel Authority Highway Revenue VRDO | 3.250% | 12/1/23 | 38,670 | 38,670 |
| 1 | Triborough Bridge & Tunnel Authority Highway Revenue VRDO | 3.400% | 12/1/23 | 5,800 | 5,800 |
| Coupon | Maturity Date | Face Amount ($000) | Market Value• ($000) | ||
| 2 | Triborough Bridge & Tunnel Authority Miscellaneous Taxes Revenue TOB VRDO | 3.320% | 12/7/23 | 4,000 | 4,000 |
| 2 | Triborough Bridge & Tunnel Authority Miscellaneous Taxes Revenue TOB VRDO | 3.330% | 12/7/23 | 13,825 | 13,825 |
| 2 | Triborough Bridge & Tunnel Authority Miscellaneous Taxes Revenue TOB VRDO | 3.330% | 12/7/23 | 4,025 | 4,025 |
| 2 | Triborough Bridge & Tunnel Authority Miscellaneous Taxes Revenue TOB VRDO | 3.330% | 12/7/23 | 2,665 | 2,665 |
| 2 | Triborough Bridge & Tunnel Authority Miscellaneous Taxes Revenue TOB VRDO | 3.330% | 12/7/23 | 4,050 | 4,050 |
| 2 | Triborough Bridge & Tunnel Authority New York Highway Revenue TOB VRDO | 3.330% | 12/7/23 | 6,000 | 6,000 |
| 2 | Triborough Bridge & Tunnel Authority New York Payroll Mobility Fuel Sales Tax Revenue TOB VRDO | 3.330% | 12/7/23 | 1,875 | 1,875 |
| 2 | Triborough Bridge & Tunnel Authority New York Payroll Mobility Fuel Sales Tax Revenue TOB VRDO | 3.330% | 12/7/23 | 2,100 | 2,100 |
| 2 | Triborough Bridge & Tunnel Authority New York Payroll Mobility Miscellaneous Taxes Revenue TOB VRDO | 3.350% | 12/1/23 | 10,195 | 10,195 |
| 2 | Triborough Bridge & Tunnel Authority New York Payroll Mobility Miscellaneous Taxes Revenue TOB VRDO | 3.320% | 12/7/23 | 5,745 | 5,745 |
| 2 | Triborough Bridge & Tunnel Authority New York Payroll Mobility Miscellaneous Taxes Revenue TOB VRDO | 3.330% | 12/7/23 | 2,945 | 2,945 |
| 2 | Triborough Bridge & Tunnel Authority New York Payroll Mobility Miscellaneous Taxes Revenue TOB VRDO | 3.330% | 12/7/23 | 4,000 | 4,000 |
| 2 | Triborough Bridge & Tunnel Authority New York Payroll Mobility Miscellaneous Taxes Revenue TOB VRDO | 3.330% | 12/7/23 | 2,665 | 2,665 |
| 2 | Triborough Bridge & Tunnel Authority New York Payroll Mobility Miscellaneous Taxes Revenue TOB VRDO | 3.330% | 12/7/23 | 3,010 | 3,010 |
| 2 | Triborough Bridge & Tunnel Authority Sales Tax Revenue TOB VRDO | 3.350% | 12/1/23 | 14,685 | 14,685 |
| 2 | Triborough Bridge & Tunnel Authority Sales Tax Revenue TOB VRDO | 3.330% | 12/7/23 | 9,375 | 9,375 |
| 2 | Triborough Bridge & Tunnel Authority Sales Tax Revenue TOB VRDO | 3.330% | 12/7/23 | 4,555 | 4,555 |
| 2 | Triborough Bridge & Tunnel Authority Sales Tax Revenue TOB VRDO | 3.330% | 12/7/23 | 3,620 | 3,620 |
| 2 | Triborough Bridge & Tunnel Authority Sales Tax Revenue TOB VRDO | 3.330% | 12/7/23 | 11,000 | 11,000 |
| 2 | Triborough Bridge & Tunnel Authority Sales Tax Revenue TOB VRDO | 3.330% | 12/7/23 | 16,765 | 16,765 |
| 2 | Triborough Bridge & Tunnel Authority Sales Tax Revenue TOB VRDO | 3.330% | 12/7/23 | 27,275 | 27,275 |
| 2 | Triborough Bridge & Tunnel Authority Sales Tax Revenue TOB VRDO | 3.330% | 12/7/23 | 3,750 | 3,750 |
| 2 | Triborough Bridge & Tunnel Authority Sales Tax Revenue TOB VRDO | 3.340% | 12/7/23 | 6,000 | 6,000 |
| 2 | Triborough Bridge & Tunnel Authority Sales Tax Revenue TOB VRDO | 3.340% | 12/7/23 | 6,000 | 6,000 |
| 1 | Triborough Bridge & Tunnel Authority Transit Revenue VRDO | 3.350% | 12/7/23 | 20,000 | 20,000 |
| Coupon | Maturity Date | Face Amount ($000) | Market Value• ($000) | ||
| Williamsville Central School District BAN GO | 4.500% | 6/6/24 | 6,730 | 6,754 | |
| Total Tax-Exempt Municipal Bonds (Cost $2,912,115) | 2,912,115 | ||||
| Total Investments (98.7%) (Cost $2,912,115) | 2,912,115 | ||||
| Other Assets and Liabilities—Net (1.3%) | 37,820 | ||||
| Net Assets (100%) | 2,949,935 | ||||
| Cost is in $000. | |||||
| • | See Note A in Notes to Financial Statements. |
| 1 | Scheduled principal and interest payments are guaranteed by bank letter of credit. |
| 2 | Security exempt from registration under Rule 144A of the Securities Act of 1933. Such securities may be sold in transactions exempt from registration, normally to qualified institutional buyers. At November 30, 2023, the aggregate value was $1,044,135,000, representing 35.4% of net assets. |
| 3 | Scheduled principal and interest payments are guaranteed by Assured Guaranty Municipal Corp. |
| 4 | Scheduled principal and interest payments are guaranteed by Build America Mutual Assurance Co. |
| 5 | Variable-rate security; rate shown is effective rate at period end. Certain variable-rate securities are not based on a published reference rate and spread but are determined by the issuer or agent based on current market conditions. |
| BAN—Bond Anticipation Note. | |
| CP—Commercial Paper. | |
| GO—General Obligation Bond. | |
| Prere.—Prerefunded. | |
| SIFMA—Securities Industry and Financial Markets Association. | |
| TOB—Tender Option Bond. | |
| VRDO—Variable Rate Demand Obligation. | |
| VRDP—Variable Rate Demand Preferred. |
| ($000s, except shares, footnotes, and per-share amounts) | Amount |
| Assets | |
| Investments in Securities, at Value—Unaffiliated Issuers (Cost $2,912,115) | 2,912,115 |
| Investment in Vanguard | 104 |
| Cash | 68 |
| Receivables for Investment Securities Sold | 51,471 |
| Receivables for Accrued Income | 11,118 |
| Receivables for Capital Shares Issued | 5,932 |
| Other Assets | 1,180 |
| Total Assets | 2,981,988 |
| Liabilities | |
| Payables for Investment Securities Purchased | 26,400 |
| Payables for Capital Shares Redeemed | 4,676 |
| Payables for Distributions | 784 |
| Payables to Vanguard | 193 |
| Total Liabilities | 32,053 |
| Net Assets | 2,949,935 |
| At November 30, 2023, net assets consisted of: | |
| Paid-in Capital | 2,949,857 |
| Total Distributable Earnings (Loss) | 78 |
| Net Assets | 2,949,935 |
| Net Assets | |
| Applicable to 2,949,550,499 outstanding $.001 par value shares of beneficial interest (unlimited authorization) | 2,949,935 |
| Net Asset Value Per Share | $1.00 |
| Year Ended November 30, 2023 | |
| ($000) | |
| Investment Income | |
| Income | |
| Interest | 84,453 |
| Total Income | 84,453 |
| Expenses | |
| The Vanguard Group—Note B | |
| Investment Advisory Services | 353 |
| Management and Administrative | 3,497 |
| Marketing and Distribution | 216 |
| Custodian Fees | 28 |
| Auditing Fees | 24 |
| Shareholders’ Reports | 35 |
| Trustees’ Fees and Expenses | 2 |
| Other Expenses | 15 |
| Total Expenses | 4,170 |
| Expenses Paid Indirectly | (28) |
| Net Expenses | 4,142 |
| Net Investment Income | 80,311 |
| Realized Net Gain (Loss) on Investment Securities Sold | 49 |
| Net Increase (Decrease) in Net Assets Resulting from Operations | 80,360 |
| Year Ended November 30, | ||
| 2023 ($000) | 2022 ($000) | |
| Increase (Decrease) in Net Assets | ||
| Operations | ||
| Net Investment Income | 80,311 | 16,420 |
| Realized Net Gain (Loss) | 49 | 9 |
| Net Increase (Decrease) in Net Assets Resulting from Operations | 80,360 | 16,429 |
| Distributions | ||
| Total Distributions | (80,318) | (16,431) |
| Capital Share Transactions (at $1.00 per share) | ||
| Issued | 2,963,524 | 1,630,527 |
| Issued in Lieu of Cash Distributions | 71,289 | 15,063 |
| Redeemed | (2,271,774) | (1,403,202) |
| Net Increase (Decrease) from Capital Share Transactions | 763,039 | 242,388 |
| Total Increase (Decrease) | 763,081 | 242,386 |
| Net Assets | ||
| Beginning of Period | 2,186,854 | 1,944,468 |
| End of Period | 2,949,935 | 2,186,854 |
| For a Share Outstanding Throughout Each Period | Year Ended November 30, | ||||
| 2023 | 2022 | 2021 | 2020 | 2019 | |
| Net Asset Value, Beginning of Period | $1.00 | $1.00 | $1.00 | $1.00 | $1.00 |
| Investment Operations | |||||
| Net Investment Income1 | .0310 | .0080 | .0001 | .006 | .014 |
| Net Realized and Unrealized Gain (Loss) on Investments | (.0002) | (.0002) | — | — | — |
| Total from Investment Operations | .0308 | .0078 | .0001 | .006 | .014 |
| Distributions | |||||
| Dividends from Net Investment Income | (.0308) | (.0078) | (.0001) | (.006) | (.014) |
| Distributions from Realized Capital Gains | (.0000)2 | (.0000)2 | — | — | — |
| Total Distributions | (.0308) | (.0078) | (.0001) | (.006) | (.014) |
| Net Asset Value, End of Period | $1.00 | $1.00 | $1.00 | $1.00 | $1.00 |
| Total Return3 | 3.13% | 0.78% | 0.01% | 0.55% | 1.39% |
| Ratios/Supplemental Data | |||||
| Net Assets, End of Period (Millions) | $2,950 | $2,187 | $1,944 | $2,450 | $3,454 |
| Ratio of Total Expenses to Average Net Assets4 | 0.16%5 | 0.15%5 | 0.07% | 0.16% | 0.16% |
| Ratio of Net Investment Income to Average Net Assets | 3.10% | 0.80% | 0.01% | 0.61% | 1.38% |
| 1 | Calculated based on average shares outstanding. |
| 2 | Distribution was less than $0.0001 per share. |
| 3 | Total returns do not include account service fees that may have applied in the periods shown. Fund prospectuses provide information about any applicable account service fees. |
| 4 | Vanguard and the board of trustees have agreed to temporarily limit certain net operating expenses in excess of the fund’s daily yield in order to maintain a zero or positive yield for the fund. Vanguard and the board of trustees may terminate the temporary expense limitation at any time. The fund is not obligated to repay this amount to Vanguard. The ratio of total expenses to average net assets before an expense reduction was 0.16% for the years ended November 30, 2022 and 2021. For the years ended November 30, 2023, 2020, and 2019, there were no expense reductions. |
| 5 | The ratio of expenses to average net assets for the period net of reduction from custody fee offset arrangements was 0.16 and 0.15%, respectively. |
| A. | The following significant accounting policies conform to generally accepted accounting principles for U.S. investment companies. The fund consistently follows such policies in preparing its financial statements. |
| B. | In accordance with the terms of a Funds' Service Agreement (the “FSA”) between Vanguard and the fund, Vanguard furnishes to the fund investment advisory, corporate management, administrative, marketing, and distribution services at Vanguard’s cost of operations (as defined by the FSA). These costs of operations are allocated to the fund based on methods and guidelines approved by the board of trustees and are generally settled twice a month. |
| C. | The fund’s custodian bank has agreed to reduce its fees when the fund maintains cash on deposit in the non-interest-bearing custody account. For the year ended November 30, 2023, custodian fee offset arrangements reduced the fund’s expenses by $28,000 (an annual rate of less than 0.01% of average net assets). |
| D. | Various inputs may be used to determine the value of the fund’s investments. These inputs are summarized in three broad levels for financial statement purposes. The inputs or methodologies used to value securities are not necessarily an indication of the risk associated with investing in those securities. |
| E. | Permanent differences between book-basis and tax-basis components of net assets, if any, are reclassified among capital accounts in the financial statements to reflect their tax character. These reclassifications have no effect on net assets or net asset value per share. |
| Amount ($000) | |
| Undistributed Ordinary Income | 19 |
| Undistributed Tax-Exempt Income | 814 |
| Undistributed Long-Term Gains | 29 |
| Net Unrealized Gains (Losses) | — |
| Capital Loss Carryforwards | — |
| Qualified Late-Year Losses | — |
| Other Temporary Differences | (784) |
| Total | 78 |
| Year Ended November 30, | ||
| 2023 Amount ($000) | 2022 Amount ($000) | |
| Tax-Exempt Income | 80,311 | 16,419 |
| Ordinary Income* | 7 | 7 |
| Long-Term Capital Gains | — | 5 |
| Total | 80,318 | 16,431 |
| * | Includes short-term capital gains, if any. |
| Amount ($000) | |
| Tax Cost | 2,912,115 |
| Gross Unrealized Appreciation | — |
| Gross Unrealized Depreciation | — |
| Net Unrealized Appreciation (Depreciation) | — |
| F. | The fund purchased securities from and sold securities to other Vanguard funds or accounts managed by Vanguard or its affiliates, in accordance with procedures adopted by the board of trustees in compliance with Rule 17a-7 of the Investment Company Act of 1940. For the year ended November 30, 2023, such purchases were $702,260,000 and sales were $185,245,000, resulting in net realized gain (loss) of $0. |
| G. | Significant market disruptions, such as those caused by pandemics (e.g., COVID-19 pandemic), natural or environmental disasters, war (e.g., Russia’s invasion of Ukraine), acts of terrorism, or other events, can adversely affect local and global markets and normal market operations. Any such disruptions could have an adverse impact on the value of the fund’s investments and fund performance. |
| H. | Management has determined that no events or transactions occurred subsequent to November 30, 2023, that would require recognition or disclosure in these financial statements. |
| Average Annual Total Returns Periods Ended November 30, 2023 | |||||
| One Year | Five Years | Ten Years | Final Value of a $10,000 Investment | ||
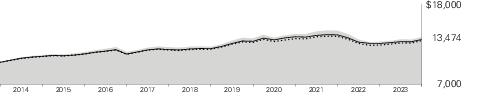
 | New York Long-Term Tax-Exempt Fund Investor Shares | 5.01% | 2.09% | 3.03% | $13,474 |
 | Bloomberg NY Municipal Bond Index | 4.97 | 1.94 | 2.65 | 12,994 |
 | Bloomberg Municipal Bond Index | 4.28 | 2.03 | 2.77 | 13,143 |
| One Year | Five Years | Ten Years | Final Value of a $50,000 Investment | ||
| New York Long-Term Tax-Exempt Fund Admiral Shares | 5.10% | 2.17% | 3.11% | $67,936 | |
| Bloomberg NY Municipal Bond Index | 4.97 | 1.94 | 2.65 | 64,969 | |
| Bloomberg Municipal Bond Index | 4.28 | 2.03 | 2.77 | 65,716 | |
| Under 1 Year | 6.2% |
| 1 - 3 Years | 3.0 |
| 3 - 5 Years | 4.4 |
| 5 - 10 Years | 12.3 |
| 10 - 20 Years | 39.6 |
| 20 - 30 Years | 28.6 |
| Over 30 Years | 5.9 |
| Coupon | Maturity Date | Face Amount ($000) | Market Value• ($000) | ||
| Tax-Exempt Municipal Bonds (99.2%) | |||||
| New York (97.8%) | |||||
| Battery Park City Authority Miscellaneous Revenue | 5.000% | 11/1/27 | 3,000 | 3,272 | |
| Battery Park City Authority Miscellaneous Revenue | 5.000% | 11/1/28 | 1,900 | 2,113 | |
| Battery Park City Authority Miscellaneous Revenue | 5.000% | 11/1/53 | 7,500 | 8,154 | |
| Brookhaven Local Development Corp. Health, Hospital, Nursing Home Revenue | 5.000% | 10/1/31 | 650 | 713 | |
| Brookhaven Local Development Corp. Health, Hospital, Nursing Home Revenue | 3.375% | 10/1/40 | 500 | 411 | |
| Brookhaven Local Development Corp. Health, Hospital, Nursing Home Revenue | 4.000% | 10/1/45 | 7,000 | 6,426 | |
| Brookhaven Local Development Corp. Health, Hospital, Nursing Home Revenue | 5.000% | 10/1/50 | 3,000 | 3,097 | |
| Brooklyn Arena Local Development Corp. Miscellaneous Revenue (Barclays Center Project) | 5.000% | 7/15/25 | 1,655 | 1,678 | |
| Brooklyn Arena Local Development Corp. Miscellaneous Revenue (Barclays Center Project) | 5.000% | 7/15/26 | 3,000 | 3,064 | |
| 1 | Brooklyn Arena Local Development Corp. Miscellaneous Revenue (Barclays Center Project) | 4.000% | 7/15/29 | 375 | 377 |
| Brooklyn Arena Local Development Corp. Miscellaneous Revenue (Barclays Center Project) | 5.000% | 7/15/30 | 5,990 | 6,105 | |
| Brooklyn Arena Local Development Corp. Miscellaneous Revenue (Barclays Center Project) | 5.000% | 7/15/42 | 3,500 | 3,446 | |
| 1 | Brooklyn Arena Local Development Corp. Miscellaneous Revenue (Barclays Center Project) | 3.000% | 7/15/43 | 1,225 | 913 |
| Brooklyn Arena Local Development Corp. Recreational Revenue (Barclays Center Project) | 0.000% | 7/15/31 | 10,890 | 7,726 | |
| Brooklyn Arena Local Development Corp. Recreational Revenue (Barclays Center Project) | 0.000% | 7/15/32 | 2,100 | 1,418 | |
| Brooklyn Arena Local Development Corp. Recreational Revenue (Barclays Center Project) | 0.000% | 7/15/33 | 5,475 | 3,516 | |
| Brooklyn Arena Local Development Corp. Recreational Revenue (Barclays Center Project) | 0.000% | 7/15/35 | 2,490 | 1,440 | |
| Brooklyn Arena Local Development Corp. Recreational Revenue (Barclays Center Project) | 0.000% | 7/15/45 | 5,735 | 1,805 | |
| Brooklyn Arena Local Development Corp. Recreational Revenue (Barclays Center Project) | 0.000% | 7/15/46 | 2,000 | 593 | |
| Broome County Local Development Corp. Health, Hospital, Nursing Home Revenue | 4.000% | 7/1/31 | 685 | 611 | |
| 1 | Broome County Local Development Corp. Health, Hospital, Nursing Home Revenue | 4.000% | 4/1/34 | 1,300 | 1,313 |
| Coupon | Maturity Date | Face Amount ($000) | Market Value• ($000) | ||
| 1 | Broome County Local Development Corp. Health, Hospital, Nursing Home Revenue | 3.000% | 4/1/35 | 3,200 | 2,765 |
| Broome County Local Development Corp. Health, Hospital, Nursing Home Revenue | 4.000% | 7/1/36 | 1,600 | 1,315 | |
| 1 | Broome County Local Development Corp. Health, Hospital, Nursing Home Revenue | 3.000% | 4/1/37 | 865 | 713 |
| Broome County Local Development Corp. Health, Hospital, Nursing Home Revenue | 4.000% | 7/1/41 | 1,900 | 1,426 | |
| 1 | Broome County Local Development Corp. Health, Hospital, Nursing Home Revenue | 3.000% | 4/1/45 | 5,865 | 4,382 |
| Broome County Local Development Corp. Health, Hospital, Nursing Home Revenue | 4.000% | 7/1/47 | 2,320 | 1,614 | |
| 1 | Broome County Local Development Corp. Health, Hospital, Nursing Home Revenue | 3.000% | 4/1/50 | 3,000 | 2,134 |
| Buffalo & Erie County Industrial Land Development Corp. Health, Hospital, Nursing Home Revenue | 5.000% | 11/15/37 | 5,515 | 5,487 | |
| Buffalo & Erie County Industrial Land Development Corp. Health, Hospital, Nursing Home Revenue | 4.000% | 7/1/45 | 1,890 | 1,325 | |
| Buffalo Municipal Water Finance Authority Water Revenue | 5.000% | 7/1/25 | 630 | 650 | |
| 1 | Buffalo Municipal Water Finance Authority Water Revenue | 3.000% | 7/1/35 | 15 | 14 |
| 2 | Buffalo Sewer Authority Sewer Revenue | 4.000% | 6/15/34 | 175 | 181 |
| 2 | Buffalo Sewer Authority Sewer Revenue | 4.000% | 6/15/36 | 265 | 269 |
| Build NYC Resource Corp. Charter School Aid Revenue | 4.000% | 6/15/31 | 100 | 94 | |
| Build NYC Resource Corp. Charter School Aid Revenue | 4.000% | 6/15/36 | 400 | 365 | |
| 3 | Build NYC Resource Corp. Charter School Aid Revenue | 5.750% | 6/1/42 | 1,350 | 1,371 |
| Build NYC Resource Corp. Charter School Aid Revenue | 5.250% | 7/1/52 | 1,000 | 1,027 | |
| Build NYC Resource Corp. Charter School Aid Revenue | 5.250% | 7/1/57 | 5,250 | 5,374 | |
| 3 | Build NYC Resource Corp. Charter School Aid Revenue | 5.750% | 6/1/62 | 1,750 | 1,750 |
| 3 | Build NYC Resource Corp. Charter School Aid Revenue (New York Preparatory Charter School Project) | 4.000% | 6/15/31 | 1,600 | 1,492 |
| 3 | Build NYC Resource Corp. Charter School Aid Revenue (New York Preparatory Charter School Project) | 4.000% | 6/15/41 | 3,750 | 2,999 |
| 3 | Build NYC Resource Corp. Charter School Aid Revenue (New York Preparatory Charter School Project) | 4.000% | 6/15/51 | 4,980 | 3,583 |
| 3 | Build NYC Resource Corp. Charter School Aid Revenue (New York Preparatory Charter School Project) | 4.000% | 6/15/56 | 3,020 | 2,111 |
| 3 | Build NYC Resource Corp. Charter School Aid Revenue (Richmond Preparatory Charter School Project) | 4.000% | 6/1/31 | 1,950 | 1,846 |
| 3 | Build NYC Resource Corp. Charter School Aid Revenue (Richmond Preparatory Charter School Project) | 5.000% | 6/1/36 | 565 | 557 |
| 3 | Build NYC Resource Corp. Charter School Aid Revenue (Richmond Preparatory Charter School Project) | 5.000% | 6/1/41 | 600 | 565 |
| 3 | Build NYC Resource Corp. Charter School Aid Revenue (Richmond Preparatory Charter School Project) | 5.000% | 6/1/51 | 1,200 | 1,070 |
| Build NYC Resource Corp. College & University Revenue (New York Law School Project) | 5.000% | 7/1/29 | 1,890 | 1,917 | |
| Build NYC Resource Corp. College & University Revenue (New York Law School Project) | 4.000% | 7/1/45 | 185 | 152 | |
| 3 | Build NYC Resource Corp. Economic Development Revenue | 5.000% | 12/1/39 | 2,220 | 1,855 |
| 3 | Build NYC Resource Corp. Economic Development Revenue | 5.000% | 12/1/49 | 3,410 | 2,619 |
| Build NYC Resource Corp. Health, Hospital, Nursing Home Revenue (NY Methodist Hospital Project), Prere. | 5.000% | 7/1/24 | 1,325 | 1,338 | |
| Build NYC Resource Corp. Health, Hospital, Nursing Home Revenue (NY Methodist Hospital Project), Prere. | 5.000% | 7/1/24 | 1,000 | 1,010 | |
| Build NYC Resource Corp. Miscellaneous Revenue | 5.000% | 6/1/24 | 750 | 756 | |
| Build NYC Resource Corp. Miscellaneous Revenue | 5.000% | 7/1/25 | 100 | 103 | |
| Build NYC Resource Corp. Miscellaneous Revenue | 5.000% | 7/1/26 | 85 | 89 | |
| Build NYC Resource Corp. Miscellaneous Revenue | 5.000% | 7/1/27 | 75 | 80 |
| Coupon | Maturity Date | Face Amount ($000) | Market Value• ($000) | ||
| Build NYC Resource Corp. Miscellaneous Revenue | 4.000% | 7/1/36 | 130 | 131 | |
| Build NYC Resource Corp. Miscellaneous Revenue | 4.000% | 7/1/37 | 165 | 165 | |
| Build NYC Resource Corp. Miscellaneous Revenue | 3.000% | 7/1/39 | 550 | 460 | |
| Build NYC Resource Corp. Miscellaneous Revenue | 4.000% | 7/1/44 | 975 | 907 | |
| Build NYC Resource Corp. Miscellaneous Revenue | 4.000% | 7/1/49 | 1,400 | 1,265 | |
| Build NYC Resource Corp. Miscellaneous Revenue (YMCA of Greater NY Project), Prere. | 5.000% | 8/1/25 | 500 | 516 | |
| Build NYC Resource Corp. Miscellaneous Revenue (YMCA of Greater NY Project), Prere. | 5.000% | 8/1/25 | 1,000 | 1,033 | |
| 3 | Build NYC Resource Corp. Private Schools Revenue (Shefa School Project) | 2.500% | 6/15/31 | 1,455 | 1,182 |
| 3 | Build NYC Resource Corp. Private Schools Revenue (Shefa School Project) | 5.000% | 6/15/51 | 5,765 | 4,701 |
| 3 | Build NYC Resource Corp. Private Schools Revenue TOB VRDO | 3.400% | 12/7/23 | 6,110 | 6,110 |
| Chemung County NY GO BAN | 4.250% | 8/29/24 | 3,000 | 3,002 | |
| 3 | Deutsche Bank Spears/Lifers Trust Revenue TOB VRDO | 3.580% | 12/1/23 | 15,200 | 15,200 |
| Dutchess County Local Development Corp. College & University Revenue | 5.000% | 7/1/29 | 250 | 261 | |
| Dutchess County Local Development Corp. College & University Revenue | 5.000% | 7/1/30 | 220 | 230 | |
| Dutchess County Local Development Corp. College & University Revenue | 5.000% | 7/1/31 | 1,170 | 1,220 | |
| Dutchess County Local Development Corp. College & University Revenue | 5.000% | 7/1/32 | 450 | 467 | |
| Dutchess County Local Development Corp. College & University Revenue | 5.000% | 7/1/33 | 250 | 259 | |
| Dutchess County Local Development Corp. College & University Revenue | 5.000% | 7/1/34 | 1,390 | 1,441 | |
| Dutchess County Local Development Corp. College & University Revenue (Bard College Project) | 5.000% | 7/1/40 | 3,220 | 3,290 | |
| Dutchess County Local Development Corp. College & University Revenue (Bard College Project) | 5.000% | 7/1/45 | 2,000 | 2,022 | |
| Dutchess County Local Development Corp. College & University Revenue (Bard College Project) | 5.000% | 7/1/51 | 2,000 | 2,005 | |
| Dutchess County Local Development Corp. College & University Revenue (Culinary Institute of America Project) | 5.000% | 7/1/25 | 500 | 506 | |
| Dutchess County Local Development Corp. College & University Revenue (Culinary Institute of America Project) | 5.000% | 7/1/26 | 300 | 308 | |
| Dutchess County Local Development Corp. College & University Revenue (Culinary Institute of America Project) | 5.000% | 7/1/27 | 805 | 828 | |
| Dutchess County Local Development Corp. College & University Revenue (Culinary Institute of America Project) | 5.000% | 7/1/28 | 950 | 977 | |
| Dutchess County Local Development Corp. College & University Revenue (Culinary Institute of America Project) | 5.000% | 7/1/29 | 500 | 514 | |
| Dutchess County Local Development Corp. College & University Revenue (Culinary Institute of America Project) | 5.000% | 7/1/30 | 380 | 390 | |
| Dutchess County Local Development Corp. College & University Revenue (Culinary Institute of America Project) | 5.000% | 7/1/31 | 575 | 590 | |
| Dutchess County Local Development Corp. College & University Revenue (Culinary Institute of America Project) | 5.000% | 7/1/32 | 240 | 246 | |
| Dutchess County Local Development Corp. College & University Revenue (Culinary Institute of America Project) | 5.000% | 7/1/33 | 200 | 204 | |
| Dutchess County Local Development Corp. College & University Revenue (Culinary Institute of America Project) | 5.000% | 7/1/36 | 145 | 148 | |
| Dutchess County Local Development Corp. College & University Revenue (Marist College Project) | 5.000% | 7/1/24 | 500 | 505 | |
| Dutchess County Local Development Corp. College & University Revenue (Marist College Project) | 5.000% | 7/1/25 | 500 | 515 |
| Coupon | Maturity Date | Face Amount ($000) | Market Value• ($000) | ||
| Dutchess County Local Development Corp. College & University Revenue (Marist College Project) | 5.000% | 7/1/26 | 755 | 793 | |
| Dutchess County Local Development Corp. College & University Revenue (Marist College Project) | 5.000% | 7/1/27 | 750 | 803 | |
| Dutchess County Local Development Corp. College & University Revenue (Marist College Project) | 5.000% | 7/1/28 | 600 | 653 | |
| Dutchess County Local Development Corp. College & University Revenue (Marist College Project) | 5.000% | 7/1/29 | 500 | 551 | |
| Dutchess County Local Development Corp. College & University Revenue (Marist College Project) | 5.000% | 7/1/31 | 400 | 451 | |
| Dutchess County Local Development Corp. College & University Revenue (Vassar College Project) | 5.000% | 7/1/33 | 565 | 598 | |
| Dutchess County Local Development Corp. College & University Revenue (Vassar College Project) | 5.000% | 7/1/34 | 275 | 291 | |
| Dutchess County Local Development Corp. College & University Revenue (Vassar College Project) | 5.000% | 7/1/35 | 1,200 | 1,265 | |
| Dutchess County Local Development Corp. College & University Revenue (Vassar College Project) | 5.000% | 7/1/42 | 7,250 | 7,471 | |
| Dutchess County Local Development Corp. College & University Revenue (Vassar College Project) | 4.000% | 7/1/49 | 5,000 | 4,803 | |
| Dutchess County Local Development Corp. Health, Hospital, Nursing Home Revenue | 3.000% | 7/1/36 | 1,355 | 1,124 | |
| Dutchess County Local Development Corp. Health, Hospital, Nursing Home Revenue | 4.000% | 7/1/41 | 6,220 | 5,484 | |
| Dutchess County Local Development Corp. Health, Hospital, Nursing Home Revenue | 4.000% | 7/1/44 | 3,805 | 3,277 | |
| Dutchess County Local Development Corp. Health, Hospital, Nursing Home Revenue | 4.000% | 7/1/49 | 7,600 | 6,268 | |
| Dutchess County Local Development Corp. Health, Hospital, Nursing Home Revenue, Prere. | 5.000% | 7/1/24 | 655 | 662 | |
| Dutchess County Local Development Corp. Health, Hospital, Nursing Home Revenue, Prere. | 5.000% | 7/1/24 | 2,000 | 2,021 | |
| Erie County Fiscal Stability Authority Sales Tax Revenue | 4.000% | 9/1/33 | 600 | 610 | |
| Genesee County Funding Corp. Health, Hospital, Nursing Home Revenue | 5.250% | 12/1/52 | 4,000 | 4,123 | |
| Hempstead Town Local Development Corp. College & University Revenue (Adelphi University Project) | 5.000% | 6/1/29 | 400 | 432 | |
| Hempstead Town Local Development Corp. College & University Revenue (Adelphi University Project) | 5.000% | 6/1/30 | 200 | 218 | |
| Hempstead Town Local Development Corp. College & University Revenue (Adelphi University Project) | 5.000% | 6/1/32 | 250 | 276 | |
| Hempstead Town Local Development Corp. College & University Revenue (Hofstra University Project) | 4.000% | 7/1/40 | 715 | 712 | |
| Hempstead Town Local Development Corp. College & University Revenue (Hofstra University Project) | 4.000% | 7/1/41 | 555 | 550 | |
| Hempstead Town Local Development Corp. College & University Revenue (Molloy College Project) | 5.000% | 7/1/26 | 700 | 715 | |
| Hempstead Town Local Development Corp. College & University Revenue (Molloy College Project) | 5.000% | 7/1/27 | 1,740 | 1,796 | |
| Hempstead Town Local Development Corp. College & University Revenue (Molloy College Project) | 5.000% | 7/1/29 | 2,170 | 2,184 | |
| Hempstead Town Local Development Corp. College & University Revenue (Molloy College Project) | 5.000% | 7/1/30 | 670 | 690 | |
| Hempstead Town Local Development Corp. College & University Revenue (Molloy College Project) | 5.000% | 7/1/32 | 370 | 378 | |
| Hempstead Town Local Development Corp. College & University Revenue (Molloy College Project) | 5.000% | 7/1/34 | 810 | 824 | |
| Hempstead Town Local Development Corp. College & University Revenue (Molloy College Project) | 5.000% | 7/1/37 | 1,890 | 1,892 |
| Coupon | Maturity Date | Face Amount ($000) | Market Value• ($000) | ||
| Hempstead Town Local Development Corp. College & University Revenue (Molloy College Project) | 5.000% | 7/1/38 | 435 | 433 | |
| Hempstead Town Local Development Corp. College & University Revenue (Molloy College Project) | 5.000% | 7/1/38 | 870 | 878 | |
| Hudson Yards Infrastructure Corp. Miscellaneous Revenue | 5.000% | 2/15/34 | 14,000 | 14,715 | |
| Hudson Yards Infrastructure Corp. Miscellaneous Revenue | 5.000% | 2/15/37 | 3,600 | 3,743 | |
| Hudson Yards Infrastructure Corp. Miscellaneous Revenue | 5.000% | 2/15/39 | 8,500 | 8,813 | |
| Hudson Yards Infrastructure Corp. Miscellaneous Revenue | 5.000% | 2/15/42 | 5,000 | 5,168 | |
| Hudson Yards Infrastructure Corp. Miscellaneous Revenue | 4.000% | 2/15/43 | 17,405 | 17,081 | |
| Hudson Yards Infrastructure Corp. Miscellaneous Revenue | 4.000% | 2/15/44 | 250 | 243 | |
| Hudson Yards Infrastructure Corp. Miscellaneous Revenue | 2.750% | 2/15/47 | 4,000 | 2,771 | |
| 1 | Hudson Yards Infrastructure Corp. Miscellaneous Revenue | 4.000% | 2/15/47 | 700 | 678 |
| Ithaca City School District GO BAN | 4.500% | 7/12/24 | 3,000 | 3,016 | |
| Jefferson County Civic Facility Development Corp. Health, Hospital, Nursing Home Revenue (Samaritan Medical Center Project) | 4.000% | 11/1/42 | 1,000 | 738 | |
| Jefferson County Civic Facility Development Corp. Health, Hospital, Nursing Home Revenue (Samaritan Medical Center Project) | 4.000% | 11/1/47 | 1,875 | 1,297 | |
| 1 | Long Island Power Authority Electric Power & Light Revenue | 0.000% | 6/1/24 | 19,830 | 19,501 |
| Long Island Power Authority Electric Power & Light Revenue | 5.000% | 9/1/26 | 1,000 | 1,023 | |
| 1 | Long Island Power Authority Electric Power & Light Revenue | 0.000% | 6/1/27 | 15,905 | 14,202 |
| Long Island Power Authority Electric Power & Light Revenue | 5.000% | 9/1/27 | 5,000 | 5,410 | |
| Long Island Power Authority Electric Power & Light Revenue | 5.000% | 9/1/28 | 5,000 | 5,517 | |
| Long Island Power Authority Electric Power & Light Revenue | 5.000% | 9/1/29 | 1,000 | 1,082 | |
| Long Island Power Authority Electric Power & Light Revenue | 5.000% | 9/1/33 | 750 | 811 | |
| Long Island Power Authority Electric Power & Light Revenue | 5.000% | 9/1/34 | 1,050 | 1,130 | |
| Long Island Power Authority Electric Power & Light Revenue | 5.000% | 9/1/35 | 1,500 | 1,606 | |
| Long Island Power Authority Electric Power & Light Revenue | 5.000% | 9/1/36 | 2,000 | 2,065 | |
| Long Island Power Authority Electric Power & Light Revenue | 5.000% | 9/1/36 | 2,285 | 2,452 | |
| Long Island Power Authority Electric Power & Light Revenue | 5.000% | 9/1/37 | 2,150 | 2,293 | |
| Long Island Power Authority Electric Power & Light Revenue | 4.000% | 9/1/38 | 2,315 | 2,340 | |
| Long Island Power Authority Electric Power & Light Revenue | 5.000% | 9/1/38 | 2,150 | 2,282 | |
| Long Island Power Authority Electric Power & Light Revenue | 4.000% | 9/1/39 | 750 | 754 | |
| Long Island Power Authority Electric Power & Light Revenue | 3.000% | 9/1/40 | 3,740 | 3,097 | |
| Long Island Power Authority Electric Power & Light Revenue | 4.000% | 9/1/41 | 1,350 | 1,349 | |
| Long Island Power Authority Electric Power & Light Revenue | 5.000% | 9/1/42 | 7,500 | 7,757 | |
| Long Island Power Authority Electric Power & Light Revenue | 5.000% | 9/1/43 | 3,225 | 3,534 | |
| Long Island Power Authority Electric Power & Light Revenue | 5.000% | 9/1/48 | 5,000 | 5,403 | |
| Long Island Power Authority Electric Power & Light Revenue | 5.000% | 9/1/53 | 5,000 | 5,377 | |
| Long Island Power Authority Electric Power & Light Revenue PUT | 1.650% | 9/1/24 | 5,350 | 5,265 | |
| Long Island Power Authority Electric Power & Light Revenue PUT | 0.850% | 9/1/25 | 4,200 | 3,987 | |
| Long Island Power Authority Electric Power & Light Revenue PUT | 1.500% | 9/1/26 | 13,100 | 12,251 | |
| Long Island Power Authority Electric Power & Light Revenue PUT | 5.000% | 9/1/27 | 3,720 | 3,921 | |
| Metropolitan Transportation Authority Fuel Sales Tax Revenue | 4.000% | 11/15/26 | 410 | 422 | |
| Metropolitan Transportation Authority Fuel Sales Tax Revenue | 5.000% | 11/15/26 | 870 | 920 | |
| Metropolitan Transportation Authority Fuel Sales Tax Revenue | 5.000% | 11/15/27 | 25 | 26 | |
| Metropolitan Transportation Authority Fuel Sales Tax Revenue | 5.250% | 11/15/27 | 40 | 42 | |
| Metropolitan Transportation Authority Fuel Sales Tax Revenue | 5.250% | 11/15/31 | 2,730 | 2,871 | |
| Metropolitan Transportation Authority Fuel Sales Tax Revenue | 5.000% | 11/15/32 | 75 | 80 | |
| Metropolitan Transportation Authority Fuel Sales Tax Revenue | 5.250% | 11/15/32 | 2,600 | 2,733 | |
| Metropolitan Transportation Authority Fuel Sales Tax Revenue | 3.125% | 11/15/33 | 1,045 | 980 | |
| Metropolitan Transportation Authority Fuel Sales Tax Revenue | 4.000% | 11/15/33 | 10,100 | 10,391 | |
| Metropolitan Transportation Authority Fuel Sales Tax Revenue | 3.500% | 11/15/34 | 1,000 | 960 | |
| Metropolitan Transportation Authority Fuel Sales Tax Revenue | 4.000% | 11/15/34 | 500 | 508 | |
| Metropolitan Transportation Authority Fuel Sales Tax Revenue | 5.000% | 11/15/34 | 1,770 | 1,847 |
| Coupon | Maturity Date | Face Amount ($000) | Market Value• ($000) | ||
| Metropolitan Transportation Authority Fuel Sales Tax Revenue | 5.250% | 11/15/34 | 1,055 | 1,109 | |
| Metropolitan Transportation Authority Fuel Sales Tax Revenue | 5.000% | 11/15/36 | 610 | 633 | |
| Metropolitan Transportation Authority Fuel Sales Tax Revenue | 5.250% | 11/15/36 | 5,000 | 5,223 | |
| Metropolitan Transportation Authority Fuel Sales Tax Revenue | 4.000% | 11/15/40 | 400 | 393 | |
| Metropolitan Transportation Authority Fuel Sales Tax Revenue | 5.000% | 11/15/42 | 14,440 | 14,905 | |
| Metropolitan Transportation Authority Fuel Sales Tax Revenue | 4.000% | 11/15/43 | 9,615 | 9,294 | |
| Metropolitan Transportation Authority Fuel Sales Tax Revenue | 5.250% | 11/15/57 | 5,865 | 6,085 | |
| Metropolitan Transportation Authority Miscellaneous Taxes Revenue | 0.000% | 11/15/30 | 11,095 | 8,521 | |
| Metropolitan Transportation Authority Miscellaneous Taxes Revenue | 0.000% | 11/15/32 | 1,210 | 852 | |
| Metropolitan Transportation Authority Transit Revenue | 5.000% | 11/15/25 | 1,000 | 1,017 | |
| Metropolitan Transportation Authority Transit Revenue | 0.000% | 11/15/27 | 2,240 | 1,918 | |
| Metropolitan Transportation Authority Transit Revenue | 5.000% | 11/15/27 | 590 | 631 | |
| Metropolitan Transportation Authority Transit Revenue | 5.000% | 11/15/27 | 920 | 955 | |
| Metropolitan Transportation Authority Transit Revenue | 5.000% | 11/15/28 | 7,225 | 7,392 | |
| Metropolitan Transportation Authority Transit Revenue | 5.000% | 11/15/28 | 4,755 | 4,935 | |
| Metropolitan Transportation Authority Transit Revenue | 5.000% | 11/15/28 | 1,650 | 1,773 | |
| Metropolitan Transportation Authority Transit Revenue | 0.000% | 11/15/29 | 6,695 | 5,262 | |
| Metropolitan Transportation Authority Transit Revenue | 5.000% | 11/15/29 | 1,000 | 1,037 | |
| Metropolitan Transportation Authority Transit Revenue | 5.000% | 11/15/29 | 1,890 | 1,959 | |
| Metropolitan Transportation Authority Transit Revenue | 5.000% | 11/15/29 | 1,085 | 1,110 | |
| Metropolitan Transportation Authority Transit Revenue | 0.000% | 11/15/32 | 500 | 343 | |
| Metropolitan Transportation Authority Transit Revenue | 3.500% | 11/15/32 | 155 | 155 | |
| Metropolitan Transportation Authority Transit Revenue | 3.500% | 11/15/32 | 145 | 137 | |
| Metropolitan Transportation Authority Transit Revenue | 4.000% | 11/15/32 | 5,500 | 5,562 | |
| Metropolitan Transportation Authority Transit Revenue | 0.000% | 11/15/33 | 500 | 327 | |
| Metropolitan Transportation Authority Transit Revenue | 5.000% | 11/15/33 | 2,500 | 2,726 | |
| Metropolitan Transportation Authority Transit Revenue | 4.000% | 11/15/35 | 5,000 | 5,021 | |
| Metropolitan Transportation Authority Transit Revenue | 3.250% | 11/15/36 | 2,745 | 2,367 | |
| Metropolitan Transportation Authority Transit Revenue | 3.375% | 11/15/37 | 2,110 | 1,820 | |
| Metropolitan Transportation Authority Transit Revenue | 3.500% | 11/15/41 | 1,020 | 830 | |
| Metropolitan Transportation Authority Transit Revenue | 4.000% | 11/15/42 | 3,700 | 3,472 | |
| 1 | Metropolitan Transportation Authority Transit Revenue | 4.000% | 11/15/42 | 2,000 | 1,926 |
| Metropolitan Transportation Authority Transit Revenue | 4.250% | 11/15/42 | 210 | 205 | |
| 1 | Metropolitan Transportation Authority Transit Revenue | 4.000% | 11/15/43 | 2,530 | 2,427 |
| Metropolitan Transportation Authority Transit Revenue | 4.000% | 11/15/44 | 1,000 | 927 | |
| Metropolitan Transportation Authority Transit Revenue | 4.000% | 11/15/45 | 3,845 | 3,545 | |
| Metropolitan Transportation Authority Transit Revenue | 4.000% | 11/15/45 | 2,500 | 2,304 | |
| Metropolitan Transportation Authority Transit Revenue | 4.000% | 11/15/46 | 2,000 | 1,831 | |
| Metropolitan Transportation Authority Transit Revenue | 4.000% | 11/15/48 | 2,000 | 1,834 | |
| Metropolitan Transportation Authority Transit Revenue | 5.000% | 11/15/48 | 3,000 | 3,087 | |
| Metropolitan Transportation Authority Transit Revenue | 4.000% | 11/15/49 | 3,300 | 3,014 | |
| Metropolitan Transportation Authority Transit Revenue | 4.000% | 11/15/49 | 2,000 | 1,806 | |
| 2 | Metropolitan Transportation Authority Transit Revenue | 4.000% | 11/15/50 | 5,855 | 5,398 |
| Metropolitan Transportation Authority Transit Revenue | 5.000% | 11/15/50 | 2,000 | 2,053 | |
| Metropolitan Transportation Authority Transit Revenue | 4.000% | 11/15/51 | 4,790 | 4,299 | |
| Metropolitan Transportation Authority Transit Revenue | 4.000% | 11/15/52 | 1,000 | 894 | |
| Metropolitan Transportation Authority Transit Revenue | 5.250% | 11/15/55 | 2,000 | 2,066 | |
| Metropolitan Transportation Authority Transit Revenue PUT | 5.000% | 11/15/24 | 12,500 | 12,564 | |
| 1,3 | Metropolitan Transportation Authority Transit Revenue TOB VRDO | 3.420% | 12/7/23 | 2,975 | 2,975 |
| 1,3 | Metropolitan Transportation Authority Transit Revenue TOB VRDO | 3.420% | 12/7/23 | 2,945 | 2,945 |
| 2,3 | Metropolitan Transportation Authority Transit Revenue TOB VRDO | 3.420% | 12/7/23 | 6,000 | 6,000 |
| 4 | Metropolitan Transportation Authority Transit Revenue VRDO | 3.250% | 12/1/23 | 2,100 | 2,100 |
| 4 | Metropolitan Transportation Authority Transit Revenue VRDO | 3.250% | 12/1/23 | 8,700 | 8,700 |
| Coupon | Maturity Date | Face Amount ($000) | Market Value• ($000) | ||
| Monroe County NY Industrial Development Corp. College & University Revenue | 4.000% | 7/1/32 | 1,780 | 1,806 | |
| Monroe County NY Industrial Development Corp. College & University Revenue | 4.000% | 7/1/32 | 1,295 | 1,306 | |
| Monroe County NY Industrial Development Corp. College & University Revenue | 5.000% | 10/1/32 | 600 | 621 | |
| Monroe County NY Industrial Development Corp. College & University Revenue | 5.000% | 7/1/33 | 1,400 | 1,425 | |
| Monroe County NY Industrial Development Corp. College & University Revenue | 5.000% | 7/1/37 | 1,000 | 1,013 | |
| Monroe County NY Industrial Development Corp. College & University Revenue | 4.000% | 10/1/47 | 1,205 | 1,024 | |
| Monroe County NY Industrial Development Corp. College & University Revenue (University of Rochester Project) | 5.000% | 7/1/36 | 1,000 | 1,054 | |
| Monroe County NY Industrial Development Corp. College & University Revenue (University of Rochester Project) | 4.000% | 7/1/50 | 10,740 | 10,278 | |
| Monroe County NY Industrial Development Corp. Health, Hospital, Nursing Home Revenue | 3.750% | 12/1/33 | 300 | 283 | |
| Monroe County NY Industrial Development Corp. Health, Hospital, Nursing Home Revenue | 3.750% | 12/1/35 | 100 | 92 | |
| Monroe County NY Industrial Development Corp. Health, Hospital, Nursing Home Revenue | 3.000% | 12/1/37 | 3,880 | 2,984 | |
| Monroe County NY Industrial Development Corp. Health, Hospital, Nursing Home Revenue | 3.000% | 12/1/40 | 6,380 | 4,634 | |
| Monroe County NY Industrial Development Corp. Health, Hospital, Nursing Home Revenue | 4.000% | 12/1/46 | 7,885 | 6,686 | |
| Mount Vernon NY City School District GO | 4.000% | 12/1/32 | 2,480 | 2,534 | |
| Mount Vernon NY City School District GO | 4.000% | 12/1/33 | 2,370 | 2,421 | |
| 3,4 | MTA Hudson Rail Yards Trust Obligations Lease Revenue TOB VRDO | 3.360% | 12/7/23 | 6,800 | 6,800 |
| Nassau County IDA College & University Revenue VRDO | 3.150% | 12/1/23 | 1,700 | 1,700 | |
| Nassau County Local Economic Assistance Corp. Health, Hospital, Nursing Home Revenue | 5.000% | 7/1/24 | 925 | 931 | |
| Nassau County Local Economic Assistance Corp. Health, Hospital, Nursing Home Revenue | 5.000% | 7/1/24 | 125 | 126 | |
| Nassau County Local Economic Assistance Corp. Health, Hospital, Nursing Home Revenue | 5.000% | 7/1/25 | 1,900 | 1,915 | |
| Nassau County Local Economic Assistance Corp. Health, Hospital, Nursing Home Revenue | 5.000% | 7/1/28 | 1,500 | 1,510 | |
| Nassau County Local Economic Assistance Corp. Health, Hospital, Nursing Home Revenue | 5.000% | 7/1/28 | 1,690 | 1,701 | |
| Nassau County Local Economic Assistance Corp. Health, Hospital, Nursing Home Revenue | 5.000% | 7/1/29 | 1,565 | 1,574 | |
| Nassau County Local Economic Assistance Corp. Health, Hospital, Nursing Home Revenue | 5.000% | 7/1/30 | 1,750 | 1,759 | |
| Nassau County Local Economic Assistance Corp. Health, Hospital, Nursing Home Revenue | 5.000% | 7/1/31 | 1,000 | 1,005 | |
| 1,3 | Nassau County NY Ad Valorem Property Tax Revenue TOB VRDO | 3.500% | 12/7/23 | 9,330 | 9,330 |
| Nassau County NY GO | 5.000% | 10/1/36 | 5,685 | 5,964 | |
| Nassau County NY GO | 4.000% | 4/1/40 | 1,525 | 1,536 | |
| Nassau County NY GO | 5.000% | 4/1/41 | 1,500 | 1,657 | |
| Nassau County NY GO | 5.000% | 4/1/42 | 1,500 | 1,647 | |
| Nassau County NY GO | 5.000% | 4/1/43 | 1,220 | 1,335 | |
| 1 | Nassau County NY GO | 4.000% | 4/1/44 | 6,720 | 6,729 |
| Nassau County NY GO | 4.000% | 4/1/53 | 7,000 | 6,719 | |
| 1,3 | Nassau County NY GO TOB VRDO | 3.500% | 12/7/23 | 5,685 | 5,685 |
| Nassau County NY GO, Prere. | 5.000% | 4/1/24 | 1,740 | 1,750 | |
| 3 | Nassau County NY Revenue TOB VRDO | 3.400% | 12/1/23 | 11,200 | 11,200 |
| Coupon | Maturity Date | Face Amount ($000) | Market Value• ($000) | ||
| New Rochelle NY College & University Revenue (IONA College Project) | 5.000% | 7/1/25 | 325 | 331 | |
| New Rochelle NY College & University Revenue (IONA College Project) | 5.000% | 7/1/26 | 335 | 339 | |
| New Rochelle NY College & University Revenue (IONA College Project) | 5.000% | 7/1/27 | 425 | 431 | |
| New Rochelle NY College & University Revenue (IONA College Project) | 5.000% | 7/1/28 | 375 | 380 | |
| New Rochelle NY College & University Revenue (IONA College Project) | 5.000% | 7/1/33 | 1,135 | 1,146 | |
| New Rochelle NY College & University Revenue (IONA College Project) | 5.000% | 7/1/35 | 1,000 | 1,008 | |
| New York City Educational Construction Fund Lease (Non-Terminable) Revenue | 5.000% | 4/1/41 | 2,245 | 2,405 | |
| New York City Educational Construction Fund Lease Revenue | 5.000% | 4/1/36 | 3,100 | 3,361 | |
| New York City Educational Construction Fund Lease Revenue | 5.000% | 4/1/37 | 2,850 | 3,065 | |
| New York City Health and Hospitals Corp. Health, Hospital, Nursing Home Revenue | 5.000% | 2/15/32 | 650 | 737 | |
| New York City Health and Hospitals Corp. Health, Hospital, Nursing Home Revenue | 5.000% | 2/15/33 | 675 | 762 | |
| New York City Health and Hospitals Corp. Health, Hospital, Nursing Home Revenue | 5.000% | 2/15/34 | 500 | 563 | |
| New York City Health and Hospitals Corp. Health, Hospital, Nursing Home Revenue | 5.000% | 2/15/35 | 500 | 559 | |
| New York City Health and Hospitals Corp. Health, Hospital, Nursing Home Revenue | 5.000% | 2/15/36 | 525 | 582 | |
| New York City Health and Hospitals Corp. Health, Hospital, Nursing Home Revenue | 5.000% | 2/15/37 | 335 | 366 | |
| New York City Health and Hospitals Corp. Health, Hospital, Nursing Home Revenue | 3.000% | 2/15/45 | 1,500 | 1,127 | |
| New York City Health and Hospitals Corp. Health, Hospital, Nursing Home Revenue | 4.000% | 2/15/45 | 640 | 617 | |
| New York City Housing Development Corp. Local or Guaranteed Housing Revenue | 2.800% | 5/1/28 | 1,880 | 1,817 | |
| New York City Housing Development Corp. Local or Guaranteed Housing Revenue | 2.850% | 11/1/28 | 2,965 | 2,863 | |
| New York City Housing Development Corp. Local or Guaranteed Housing Revenue | 2.900% | 5/1/29 | 3,230 | 3,111 | |
| New York City Housing Development Corp. Local or Guaranteed Housing Revenue | 2.950% | 11/1/29 | 1,550 | 1,490 | |
| New York City Housing Development Corp. Local or Guaranteed Housing Revenue | 3.100% | 5/1/30 | 1,210 | 1,162 | |
| New York City Housing Development Corp. Local or Guaranteed Housing Revenue | 3.125% | 11/1/30 | 1,855 | 1,776 | |
| New York City Housing Development Corp. Local or Guaranteed Housing Revenue | 3.700% | 11/1/30 | 3,000 | 3,001 | |
| 5 | New York City Housing Development Corp. Local or Guaranteed Housing Revenue | 1.800% | 5/1/31 | 500 | 433 |
| New York City Housing Development Corp. Local or Guaranteed Housing Revenue | 3.150% | 5/1/31 | 1,230 | 1,166 | |
| New York City Housing Development Corp. Local or Guaranteed Housing Revenue | 2.750% | 11/1/31 | 940 | 888 | |
| New York City Housing Development Corp. Local or Guaranteed Housing Revenue | 2.850% | 11/1/31 | 1,285 | 1,186 | |
| New York City Housing Development Corp. Local or Guaranteed Housing Revenue | 3.400% | 11/1/33 | 545 | 512 | |
| New York City Housing Development Corp. Local or Guaranteed Housing Revenue | 3.600% | 11/1/33 | 2,930 | 2,798 |
| Coupon | Maturity Date | Face Amount ($000) | Market Value• ($000) | ||
| 5 | New York City Housing Development Corp. Local or Guaranteed Housing Revenue | 2.000% | 11/1/35 | 750 | 609 |
| 5 | New York City Housing Development Corp. Local or Guaranteed Housing Revenue | 2.100% | 11/1/36 | 2,000 | 1,596 |
| 5 | New York City Housing Development Corp. Local or Guaranteed Housing Revenue | 2.250% | 11/1/36 | 4,510 | 3,687 |
| New York City Housing Development Corp. Local or Guaranteed Housing Revenue | 2.900% | 11/1/37 | 2,100 | 1,784 | |
| New York City Housing Development Corp. Local or Guaranteed Housing Revenue | 3.000% | 11/1/39 | 3,920 | 3,304 | |
| New York City Housing Development Corp. Local or Guaranteed Housing Revenue | 2.400% | 8/1/40 | 1,200 | 893 | |
| New York City Housing Development Corp. Local or Guaranteed Housing Revenue | 2.350% | 11/1/40 | 3,640 | 2,669 | |
| New York City Housing Development Corp. Local or Guaranteed Housing Revenue | 2.250% | 11/1/41 | 500 | 362 | |
| 5 | New York City Housing Development Corp. Local or Guaranteed Housing Revenue | 2.250% | 11/1/41 | 7,000 | 5,062 |
| New York City Housing Development Corp. Local or Guaranteed Housing Revenue | 3.000% | 11/1/44 | 12,245 | 9,485 | |
| 5 | New York City Housing Development Corp. Local or Guaranteed Housing Revenue | 2.450% | 11/1/45 | 1,000 | 693 |
| New York City Housing Development Corp. Local or Guaranteed Housing Revenue | 2.550% | 11/1/45 | 9,000 | 6,254 | |
| 5 | New York City Housing Development Corp. Local or Guaranteed Housing Revenue | 2.400% | 11/1/46 | 2,000 | 1,343 |
| 5 | New York City Housing Development Corp. Local or Guaranteed Housing Revenue | 2.600% | 11/1/46 | 4,000 | 2,768 |
| New York City Housing Development Corp. Local or Guaranteed Housing Revenue | 3.100% | 8/1/47 | 2,500 | 1,865 | |
| 5 | New York City Housing Development Corp. Local or Guaranteed Housing Revenue | 4.750% | 11/1/47 | 2,000 | 2,038 |
| New York City Housing Development Corp. Local or Guaranteed Housing Revenue | 3.900% | 11/1/48 | 3,880 | 3,450 | |
| New York City Housing Development Corp. Local or Guaranteed Housing Revenue | 3.950% | 11/1/48 | 7,425 | 6,656 | |
| New York City Housing Development Corp. Local or Guaranteed Housing Revenue | 4.050% | 11/1/48 | 4,040 | 3,692 | |
| New York City Housing Development Corp. Local or Guaranteed Housing Revenue | 3.650% | 11/1/49 | 3,210 | 2,608 | |
| New York City Housing Development Corp. Local or Guaranteed Housing Revenue | 3.950% | 11/1/49 | 3,365 | 2,929 | |
| New York City Housing Development Corp. Local or Guaranteed Housing Revenue | 2.800% | 2/1/50 | 6,135 | 4,160 | |
| New York City Housing Development Corp. Local or Guaranteed Housing Revenue | 3.450% | 5/1/50 | 3,800 | 2,984 | |
| New York City Housing Development Corp. Local or Guaranteed Housing Revenue | 2.650% | 11/1/50 | 4,300 | 2,878 | |
| New York City Housing Development Corp. Local or Guaranteed Housing Revenue | 2.900% | 11/1/50 | 3,625 | 2,507 | |
| New York City Housing Development Corp. Local or Guaranteed Housing Revenue | 2.750% | 2/1/51 | 9,930 | 6,789 | |
| 5 | New York City Housing Development Corp. Local or Guaranteed Housing Revenue | 2.750% | 5/1/51 | 3,000 | 2,048 |
| New York City Housing Development Corp. Local or Guaranteed Housing Revenue | 3.250% | 8/1/51 | 11,400 | 8,585 | |
| New York City Housing Development Corp. Local or Guaranteed Housing Revenue | 2.500% | 11/1/51 | 1,000 | 637 |
| Coupon | Maturity Date | Face Amount ($000) | Market Value• ($000) | ||
| 5 | New York City Housing Development Corp. Local or Guaranteed Housing Revenue | 2.500% | 11/1/51 | 8,000 | 5,097 |
| New York City Housing Development Corp. Local or Guaranteed Housing Revenue | 3.450% | 11/1/52 | 1,000 | 764 | |
| 5 | New York City Housing Development Corp. Local or Guaranteed Housing Revenue | 4.850% | 11/1/52 | 3,000 | 3,070 |
| New York City Housing Development Corp. Local or Guaranteed Housing Revenue | 4.800% | 2/1/53 | 12,365 | 12,628 | |
| New York City Housing Development Corp. Local or Guaranteed Housing Revenue | 4.000% | 11/1/53 | 1,120 | 1,001 | |
| New York City Housing Development Corp. Local or Guaranteed Housing Revenue | 3.150% | 11/1/54 | 2,225 | 1,578 | |
| New York City Housing Development Corp. Local or Guaranteed Housing Revenue | 3.750% | 11/1/54 | 2,505 | 2,025 | |
| New York City Housing Development Corp. Local or Guaranteed Housing Revenue | 2.700% | 11/1/55 | 2,500 | 1,583 | |
| New York City Housing Development Corp. Local or Guaranteed Housing Revenue | 3.000% | 11/1/55 | 4,070 | 2,755 | |
| 5 | New York City Housing Development Corp. Local or Guaranteed Housing Revenue | 2.600% | 11/1/56 | 2,000 | 1,221 |
| New York City Housing Development Corp. Local or Guaranteed Housing Revenue | 2.800% | 11/1/60 | 2,500 | 1,590 | |
| 5 | New York City Housing Development Corp. Local or Guaranteed Housing Revenue | 2.700% | 5/1/61 | 2,000 | 1,231 |
| New York City Housing Development Corp. Local or Guaranteed Housing Revenue PUT | 0.700% | 5/1/25 | 4,680 | 4,433 | |
| 5 | New York City Housing Development Corp. Local or Guaranteed Housing Revenue PUT | 0.600% | 7/1/25 | 13,160 | 12,371 |
| New York City Housing Development Corp. Local or Guaranteed Housing Revenue PUT | 0.700% | 7/1/25 | 1,000 | 942 | |
| 5 | New York City Housing Development Corp. Local or Guaranteed Housing Revenue PUT | 0.900% | 1/1/26 | 8,360 | 7,762 |
| New York City Housing Development Corp. Local or Guaranteed Housing Revenue PUT | 2.950% | 2/1/26 | 5,050 | 4,977 | |
| New York City Housing Development Corp. Local or Guaranteed Housing Revenue PUT | 2.950% | 2/1/26 | 7,200 | 7,097 | |
| 5 | New York City Housing Development Corp. Local or Guaranteed Housing Revenue PUT | 3.400% | 12/22/26 | 2,825 | 2,823 |
| 5 | New York City Housing Development Corp. Local or Guaranteed Housing Revenue PUT | 3.400% | 12/22/26 | 7,390 | 7,272 |
| New York City Housing Development Corp. Local or Guaranteed Housing Revenue PUT | 3.700% | 12/30/27 | 6,000 | 6,009 | |
| New York City Housing Development Corp. Local or Guaranteed Housing Revenue PUT | 4.300% | 11/1/28 | 3,355 | 3,402 | |
| New York City Housing Development Corp. Local or Guaranteed Housing Revenue PUT | 3.730% | 12/29/28 | 8,235 | 8,152 | |
| 4 | New York City Housing Development Corp. Local or Guaranteed Housing Revenue PUT | 2.100% | 10/1/29 | 2,415 | 2,190 |
| 1 | New York City Industrial Development Agency Miscellaneous Revenue | 5.000% | 1/1/25 | 2,000 | 2,035 |
| 1 | New York City Industrial Development Agency Miscellaneous Revenue | 5.000% | 1/1/26 | 2,000 | 2,064 |
| 1 | New York City Industrial Development Agency Miscellaneous Revenue | 5.000% | 1/1/27 | 1,000 | 1,050 |
| 1 | New York City Industrial Development Agency Miscellaneous Revenue | 3.000% | 1/1/33 | 4,610 | 4,215 |
| 1 | New York City Industrial Development Agency Miscellaneous Revenue | 3.000% | 1/1/34 | 3,255 | 2,948 |
| Coupon | Maturity Date | Face Amount ($000) | Market Value• ($000) | ||
| 1 | New York City Industrial Development Agency Miscellaneous Revenue | 3.000% | 1/1/35 | 1,705 | 1,519 |
| 1 | New York City Industrial Development Agency Miscellaneous Revenue | 3.000% | 1/1/36 | 3,000 | 2,646 |
| 1 | New York City Industrial Development Agency Miscellaneous Revenue | 3.000% | 1/1/37 | 2,975 | 2,567 |
| 1 | New York City Industrial Development Agency Miscellaneous Revenue | 2.000% | 1/1/38 | 2,890 | 2,036 |
| 1 | New York City Industrial Development Agency Miscellaneous Revenue | 3.000% | 1/1/39 | 3,795 | 3,150 |
| 1 | New York City Industrial Development Agency Miscellaneous Revenue | 3.000% | 1/1/40 | 1,395 | 1,136 |
| 1 | New York City Industrial Development Agency Miscellaneous Revenue | 3.000% | 1/1/46 | 11,230 | 8,387 |
| 1 | New York City Industrial Development Agency Miscellaneous Revenue (Yankee Stadium Project) PILOT | 5.000% | 3/1/30 | 750 | 821 |
| 1 | New York City Industrial Development Agency Miscellaneous Revenue (Yankee Stadium Project) PILOT | 4.000% | 3/1/31 | 1,500 | 1,545 |
| 1 | New York City Industrial Development Agency Miscellaneous Revenue (Yankee Stadium Project) PILOT | 3.000% | 3/1/36 | 2,250 | 1,984 |
| 1 | New York City Industrial Development Agency Miscellaneous Revenue (Yankee Stadium Project) PILOT | 2.500% | 3/1/37 | 590 | 450 |
| 1 | New York City Industrial Development Agency Miscellaneous Revenue (Yankee Stadium Project) PILOT | 3.000% | 3/1/38 | 4,000 | 3,324 |
| 1 | New York City Industrial Development Agency Miscellaneous Revenue (Yankee Stadium Project) PILOT | 3.000% | 3/1/39 | 2,565 | 2,116 |
| 1 | New York City Industrial Development Agency Miscellaneous Revenue (Yankee Stadium Project) PILOT | 4.000% | 3/1/45 | 3,980 | 3,812 |
| New York City Industrial Development Agency Miscellaneous Revenue (Yankee Stadium Project) PILOT | 4.000% | 3/1/45 | 4,350 | 4,005 | |
| 1 | New York City Industrial Development Agency Miscellaneous Revenue (Yankee Stadium Project) PILOT | 3.000% | 3/1/49 | 7,050 | 5,028 |
| New York City Industrial Development Agency Miscellaneous Revenue (Yankee Stadium Project) PILOT | 3.000% | 3/1/49 | 15,000 | 10,698 | |
| 6 | New York City Industrial Development Agency Private Schools Revenue (Stars-Churchill School Center Project) | 2.250% | 10/1/29 | 930 | 864 |
| 6 | New York City Industrial Development Agency Recreational Revenue PILOT | 0.000% | 3/1/34 | 5,285 | 3,585 |
| 6 | New York City Industrial Development Agency Recreational Revenue PILOT | 0.000% | 3/1/35 | 4,450 | 2,879 |
| 6 | New York City Industrial Development Agency Recreational Revenue PILOT | 0.000% | 3/1/40 | 595 | 287 |
| 6 | New York City Industrial Development Agency Recreational Revenue PILOT | 0.000% | 3/1/41 | 660 | 301 |
| New York City Municipal Water Finance Authority Water Revenue | 5.000% | 6/15/34 | 10,500 | 12,617 | |
| New York City Municipal Water Finance Authority Water Revenue | 5.000% | 6/15/37 | 10,000 | 10,553 | |
| New York City Municipal Water Finance Authority Water Revenue | 5.000% | 6/15/38 | 12,500 | 13,158 | |
| New York City Municipal Water Finance Authority Water Revenue | 5.000% | 6/15/39 | 10,040 | 10,185 | |
| New York City Municipal Water Finance Authority Water Revenue | 5.000% | 6/15/39 | 7,500 | 7,608 | |
| New York City Municipal Water Finance Authority Water Revenue | 5.000% | 6/15/40 | 3,900 | 4,195 | |
| New York City Municipal Water Finance Authority Water Revenue | 5.000% | 6/15/40 | 2,175 | 2,298 | |
| New York City Municipal Water Finance Authority Water Revenue | 5.000% | 6/15/40 | 3,500 | 3,745 | |
| New York City Municipal Water Finance Authority Water Revenue | 4.000% | 6/15/41 | 1,175 | 1,179 | |
| New York City Municipal Water Finance Authority Water Revenue | 4.000% | 6/15/41 | 7,390 | 7,417 | |
| New York City Municipal Water Finance Authority Water Revenue | 4.000% | 6/15/41 | 4,740 | 4,759 | |
| New York City Municipal Water Finance Authority Water Revenue | 4.000% | 6/15/42 | 2,150 | 2,155 | |
| New York City Municipal Water Finance Authority Water Revenue | 4.000% | 6/15/42 | 930 | 932 | |
| New York City Municipal Water Finance Authority Water Revenue | 4.000% | 6/15/42 | 7,300 | 7,316 |
| Coupon | Maturity Date | Face Amount ($000) | Market Value• ($000) | ||
| New York City Municipal Water Finance Authority Water Revenue | 4.000% | 6/15/42 | 4,125 | 4,136 | |
| New York City Municipal Water Finance Authority Water Revenue | 4.000% | 6/15/42 | 2,850 | 2,857 | |
| New York City Municipal Water Finance Authority Water Revenue | 4.000% | 6/15/43 | 1,030 | 1,032 | |
| New York City Municipal Water Finance Authority Water Revenue | 5.000% | 6/15/43 | 1,375 | 1,519 | |
| New York City Municipal Water Finance Authority Water Revenue | 3.000% | 6/15/44 | 6,535 | 5,160 | |
| New York City Municipal Water Finance Authority Water Revenue | 4.000% | 6/15/45 | 10,000 | 9,891 | |
| New York City Municipal Water Finance Authority Water Revenue | 4.125% | 6/15/47 | 6,700 | 6,680 | |
| New York City Municipal Water Finance Authority Water Revenue | 5.000% | 6/15/47 | 2,245 | 2,426 | |
| New York City Municipal Water Finance Authority Water Revenue | 3.500% | 6/15/48 | 11,000 | 9,238 | |
| New York City Municipal Water Finance Authority Water Revenue | 3.625% | 6/15/48 | 2,120 | 1,830 | |
| New York City Municipal Water Finance Authority Water Revenue | 5.000% | 6/15/49 | 10,825 | 11,362 | |
| New York City Municipal Water Finance Authority Water Revenue | 3.000% | 6/15/50 | 1,200 | 888 | |
| New York City Municipal Water Finance Authority Water Revenue | 3.000% | 6/15/50 | 1,125 | 832 | |
| New York City Municipal Water Finance Authority Water Revenue | 4.000% | 6/15/50 | 10,500 | 10,246 | |
| New York City Municipal Water Finance Authority Water Revenue | 4.000% | 6/15/50 | 8,470 | 8,265 | |
| New York City Municipal Water Finance Authority Water Revenue | 5.000% | 6/15/50 | 1,000 | 1,057 | |
| New York City Municipal Water Finance Authority Water Revenue | 5.000% | 6/15/50 | 2,410 | 2,557 | |
| New York City Municipal Water Finance Authority Water Revenue | 3.000% | 6/15/51 | 2,000 | 1,468 | |
| New York City Municipal Water Finance Authority Water Revenue | 5.000% | 6/15/51 | 90 | 96 | |
| New York City Municipal Water Finance Authority Water Revenue | 4.000% | 6/15/52 | 21,760 | 21,113 | |
| New York City Municipal Water Finance Authority Water Revenue | 5.250% | 6/15/52 | 2,215 | 2,429 | |
| New York City Municipal Water Finance Authority Water Revenue | 5.250% | 6/15/53 | 4,515 | 4,986 | |
| New York City Municipal Water Finance Authority Water Revenue VRDO | 3.250% | 12/1/23 | 3,700 | 3,700 | |
| New York City Municipal Water Finance Authority Water Revenue VRDO | 3.250% | 12/1/23 | 800 | 800 | |
| New York City Municipal Water Finance Authority Water Revenue VRDO | 3.250% | 12/1/23 | 2,100 | 2,100 | |
| New York City Municipal Water Finance Authority Water Revenue VRDO | 3.350% | 12/1/23 | 7,000 | 7,000 | |
| New York City Municipal Water Finance Authority Water Revenue VRDO | 3.400% | 12/1/23 | 21,785 | 21,785 | |
| New York City Municipal Water Finance Authority Water Revenue VRDO | 3.500% | 12/1/23 | 4,200 | 4,200 | |
| New York City Transitional Finance Authority Building Aid Appropriations Revenue | 5.000% | 7/15/31 | 2,820 | 3,060 | |
| New York City Transitional Finance Authority Building Aid Appropriations Revenue | 4.000% | 7/15/34 | 4,000 | 4,207 | |
| New York City Transitional Finance Authority Building Aid Appropriations Revenue | 5.000% | 7/15/35 | 2,500 | 2,874 | |
| New York City Transitional Finance Authority Building Aid Appropriations Revenue | 5.000% | 7/15/36 | 5,000 | 5,350 | |
| New York City Transitional Finance Authority Building Aid Appropriations Revenue | 4.000% | 7/15/37 | 5,000 | 5,106 | |
| New York City Transitional Finance Authority Building Aid Appropriations Revenue | 5.000% | 7/15/37 | 5,000 | 5,317 | |
| New York City Transitional Finance Authority Building Aid Appropriations Revenue | 3.000% | 7/15/38 | 2,500 | 2,158 | |
| New York City Transitional Finance Authority Building Aid Appropriations Revenue | 4.000% | 7/15/40 | 4,470 | 4,494 | |
| New York City Transitional Finance Authority Building Aid Appropriations Revenue | 4.000% | 7/15/42 | 7,255 | 7,255 | |
| New York City Transitional Finance Authority Building Aid Appropriations Revenue | 3.000% | 7/15/49 | 1,505 | 1,118 | |
| New York City Transitional Finance Authority Building Aid Income Tax Revenue | 5.000% | 7/15/32 | 1,910 | 2,071 |
| Coupon | Maturity Date | Face Amount ($000) | Market Value• ($000) | ||
| New York City Transitional Finance Authority Building Aid Income Tax Revenue | 5.000% | 7/15/33 | 2,500 | 2,708 | |
| New York City Transitional Finance Authority Building Aid Income Tax Revenue | 5.000% | 7/15/34 | 3,000 | 3,243 | |
| New York City Transitional Finance Authority Building Aid Income Tax Revenue | 4.000% | 7/15/36 | 1,190 | 1,211 | |
| New York City Transitional Finance Authority Building Aid Income Tax Revenue | 5.000% | 7/15/36 | 5,000 | 5,069 | |
| New York City Transitional Finance Authority Building Aid Income Tax Revenue | 5.000% | 7/15/37 | 8,000 | 8,507 | |
| New York City Transitional Finance Authority Building Aid Income Tax Revenue | 5.000% | 7/15/37 | 575 | 611 | |
| New York City Transitional Finance Authority Building Aid Income Tax Revenue | 5.000% | 7/15/38 | 3,000 | 3,173 | |
| New York City Transitional Finance Authority Building Aid Income Tax Revenue | 5.000% | 7/15/43 | 14,130 | 14,765 | |
| New York City Transitional Finance Authority Building Aid Income Tax Revenue | 5.000% | 7/15/43 | 2,930 | 3,062 | |
| New York City Transitional Finance Authority Building Aid Income Tax Revenue | 3.500% | 7/15/47 | 7,510 | 6,387 | |
| New York City Transitional Finance Authority Future Tax Secured Income Tax Revenue | 5.000% | 11/1/26 | 1,925 | 2,046 | |
| New York City Transitional Finance Authority Future Tax Secured Income Tax Revenue | 5.000% | 11/1/27 | 1,470 | 1,597 | |
| New York City Transitional Finance Authority Future Tax Secured Income Tax Revenue | 5.000% | 8/1/32 | 300 | 319 | |
| New York City Transitional Finance Authority Future Tax Secured Income Tax Revenue | 5.000% | 8/1/33 | 3,400 | 3,615 | |
| New York City Transitional Finance Authority Future Tax Secured Income Tax Revenue | 5.000% | 8/1/33 | 10,275 | 10,581 | |
| New York City Transitional Finance Authority Future Tax Secured Income Tax Revenue | 5.000% | 11/1/33 | 1,000 | 1,150 | |
| New York City Transitional Finance Authority Future Tax Secured Income Tax Revenue | 5.000% | 11/1/33 | 5,000 | 5,839 | |
| New York City Transitional Finance Authority Future Tax Secured Income Tax Revenue | 5.000% | 8/1/34 | 2,000 | 2,124 | |
| New York City Transitional Finance Authority Future Tax Secured Income Tax Revenue | 4.000% | 11/1/34 | 1,880 | 1,912 | |
| New York City Transitional Finance Authority Future Tax Secured Income Tax Revenue | 5.000% | 11/1/34 | 5,000 | 5,813 | |
| New York City Transitional Finance Authority Future Tax Secured Income Tax Revenue | 5.000% | 2/1/35 | 5,500 | 5,779 | |
| New York City Transitional Finance Authority Future Tax Secured Income Tax Revenue | 4.000% | 8/1/35 | 1,600 | 1,613 | |
| New York City Transitional Finance Authority Future Tax Secured Income Tax Revenue | 5.000% | 8/1/35 | 2,750 | 2,982 | |
| New York City Transitional Finance Authority Future Tax Secured Income Tax Revenue | 4.000% | 11/1/35 | 2,010 | 2,087 | |
| New York City Transitional Finance Authority Future Tax Secured Income Tax Revenue | 5.000% | 2/1/36 | 2,300 | 2,413 | |
| New York City Transitional Finance Authority Future Tax Secured Income Tax Revenue | 4.000% | 5/1/36 | 2,500 | 2,576 | |
| New York City Transitional Finance Authority Future Tax Secured Income Tax Revenue | 5.000% | 5/1/36 | 2,000 | 2,069 | |
| New York City Transitional Finance Authority Future Tax Secured Income Tax Revenue | 5.000% | 11/1/36 | 4,000 | 4,618 | |
| New York City Transitional Finance Authority Future Tax Secured Income Tax Revenue | 4.000% | 5/1/37 | 1,400 | 1,425 |
| Coupon | Maturity Date | Face Amount ($000) | Market Value• ($000) | ||
| New York City Transitional Finance Authority Future Tax Secured Income Tax Revenue | 5.000% | 5/1/37 | 9,495 | 10,269 | |
| New York City Transitional Finance Authority Future Tax Secured Income Tax Revenue | 5.000% | 8/1/37 | 5,000 | 5,115 | |
| New York City Transitional Finance Authority Future Tax Secured Income Tax Revenue | 3.000% | 11/1/37 | 6,015 | 5,314 | |
| New York City Transitional Finance Authority Future Tax Secured Income Tax Revenue | 4.000% | 11/1/37 | 690 | 700 | |
| New York City Transitional Finance Authority Future Tax Secured Income Tax Revenue | 4.000% | 11/1/37 | 1,000 | 1,015 | |
| New York City Transitional Finance Authority Future Tax Secured Income Tax Revenue | 5.250% | 11/1/37 | 2,100 | 2,413 | |
| New York City Transitional Finance Authority Future Tax Secured Income Tax Revenue | 4.000% | 2/1/38 | 1,090 | 1,094 | |
| New York City Transitional Finance Authority Future Tax Secured Income Tax Revenue | 5.000% | 5/1/38 | 2,000 | 2,145 | |
| New York City Transitional Finance Authority Future Tax Secured Income Tax Revenue | 5.000% | 8/1/38 | 12,845 | 13,270 | |
| New York City Transitional Finance Authority Future Tax Secured Income Tax Revenue | 4.000% | 11/1/38 | 3,000 | 3,009 | |
| New York City Transitional Finance Authority Future Tax Secured Income Tax Revenue | 4.000% | 11/1/38 | 1,680 | 1,686 | |
| New York City Transitional Finance Authority Future Tax Secured Income Tax Revenue | 4.000% | 11/1/38 | 465 | 467 | |
| New York City Transitional Finance Authority Future Tax Secured Income Tax Revenue | 5.000% | 2/1/39 | 6,105 | 6,770 | |
| New York City Transitional Finance Authority Future Tax Secured Income Tax Revenue | 5.000% | 5/1/39 | 4,965 | 5,188 | |
| New York City Transitional Finance Authority Future Tax Secured Income Tax Revenue | 5.000% | 8/1/39 | 5,000 | 5,245 | |
| New York City Transitional Finance Authority Future Tax Secured Income Tax Revenue | 5.000% | 11/1/39 | 3,000 | 3,178 | |
| New York City Transitional Finance Authority Future Tax Secured Income Tax Revenue | 4.000% | 2/1/40 | 475 | 474 | |
| New York City Transitional Finance Authority Future Tax Secured Income Tax Revenue | 5.000% | 2/1/40 | 4,790 | 4,902 | |
| New York City Transitional Finance Authority Future Tax Secured Income Tax Revenue | 4.000% | 5/1/40 | 2,600 | 2,595 | |
| New York City Transitional Finance Authority Future Tax Secured Income Tax Revenue | 5.000% | 5/1/40 | 4,000 | 4,108 | |
| New York City Transitional Finance Authority Future Tax Secured Income Tax Revenue | 5.000% | 5/1/40 | 5,000 | 5,325 | |
| New York City Transitional Finance Authority Future Tax Secured Income Tax Revenue | 5.000% | 5/1/40 | 13,315 | 14,021 | |
| New York City Transitional Finance Authority Future Tax Secured Income Tax Revenue | 5.000% | 5/1/40 | 1,415 | 1,582 | |
| New York City Transitional Finance Authority Future Tax Secured Income Tax Revenue | 5.000% | 8/1/40 | 7,610 | 8,034 | |
| New York City Transitional Finance Authority Future Tax Secured Income Tax Revenue | 5.000% | 11/1/40 | 3,000 | 3,167 | |
| New York City Transitional Finance Authority Future Tax Secured Income Tax Revenue | 4.000% | 2/1/41 | 415 | 414 | |
| New York City Transitional Finance Authority Future Tax Secured Income Tax Revenue | 5.000% | 2/1/41 | 3,325 | 3,684 | |
| New York City Transitional Finance Authority Future Tax Secured Income Tax Revenue | 5.000% | 5/1/41 | 1,770 | 1,966 | |
| 2 | New York City Transitional Finance Authority Future Tax Secured Income Tax Revenue | 3.000% | 8/1/41 | 5,000 | 4,180 |
| Coupon | Maturity Date | Face Amount ($000) | Market Value• ($000) | ||
| New York City Transitional Finance Authority Future Tax Secured Income Tax Revenue | 5.000% | 11/1/41 | 3,000 | 3,167 | |
| New York City Transitional Finance Authority Future Tax Secured Income Tax Revenue | 4.000% | 5/1/42 | 895 | 885 | |
| New York City Transitional Finance Authority Future Tax Secured Income Tax Revenue | 5.000% | 5/1/42 | 1,760 | 1,943 | |
| New York City Transitional Finance Authority Future Tax Secured Income Tax Revenue | 4.000% | 8/1/42 | 10,470 | 10,354 | |
| New York City Transitional Finance Authority Future Tax Secured Income Tax Revenue | 5.250% | 8/1/42 | 3,500 | 3,898 | |
| New York City Transitional Finance Authority Future Tax Secured Income Tax Revenue | 4.000% | 11/1/42 | 6,170 | 6,101 | |
| New York City Transitional Finance Authority Future Tax Secured Income Tax Revenue | 5.250% | 11/1/42 | 5,000 | 5,583 | |
| New York City Transitional Finance Authority Future Tax Secured Income Tax Revenue | 4.000% | 2/1/43 | 1,600 | 1,579 | |
| New York City Transitional Finance Authority Future Tax Secured Income Tax Revenue | 4.000% | 2/1/43 | 1,195 | 1,180 | |
| New York City Transitional Finance Authority Future Tax Secured Income Tax Revenue | 5.000% | 5/1/43 | 1,695 | 1,867 | |
| New York City Transitional Finance Authority Future Tax Secured Income Tax Revenue | 4.000% | 5/1/44 | 1,475 | 1,455 | |
| New York City Transitional Finance Authority Future Tax Secured Income Tax Revenue | 5.000% | 5/1/44 | 1,270 | 1,392 | |
| New York City Transitional Finance Authority Future Tax Secured Income Tax Revenue | 4.000% | 8/1/45 | 1,850 | 1,816 | |
| New York City Transitional Finance Authority Future Tax Secured Income Tax Revenue | 4.000% | 11/1/45 | 2,400 | 2,359 | |
| New York City Transitional Finance Authority Future Tax Secured Income Tax Revenue | 5.500% | 11/1/45 | 5,000 | 5,632 | |
| New York City Transitional Finance Authority Future Tax Secured Income Tax Revenue | 3.000% | 5/1/46 | 5,855 | 4,558 | |
| New York City Transitional Finance Authority Future Tax Secured Income Tax Revenue | 5.000% | 2/1/47 | 4,470 | 4,803 | |
| New York City Transitional Finance Authority Future Tax Secured Income Tax Revenue | 5.250% | 11/1/48 | 5,000 | 5,484 | |
| New York City Transitional Finance Authority Future Tax Secured Income Tax Revenue | 3.000% | 2/1/51 | 3,860 | 2,868 | |
| New York City Transitional Finance Authority Future Tax Secured Income Tax Revenue | 4.000% | 2/1/51 | 1,735 | 1,674 | |
| New York City Transitional Finance Authority Future Tax Secured Income Tax Revenue | 4.000% | 2/1/51 | 1,190 | 1,148 | |
| New York City Transitional Finance Authority Future Tax Secured Income Tax Revenue | 4.000% | 2/1/51 | 8,000 | 7,716 | |
| New York City Transitional Finance Authority Future Tax Secured Income Tax Revenue | 4.000% | 5/1/53 | 5,730 | 5,490 | |
| New York City Transitional Finance Authority Future Tax Secured Income Tax Revenue | 5.000% | 5/1/53 | 3,000 | 3,226 | |
| New York City Transitional Finance Authority Future Tax Secured Income Tax Revenue VRDO | 3.250% | 12/1/23 | 4,700 | 4,700 | |
| New York City Transitional Finance Authority Future Tax Secured Income Tax Revenue VRDO | 3.400% | 12/1/23 | 400 | 400 | |
| New York City Transitional Finance Authority Income Tax Revenue | 5.000% | 5/1/29 | 1,000 | 1,116 | |
| New York City Transitional Finance Authority Income Tax Revenue | 5.000% | 5/1/39 | 4,350 | 4,909 | |
| New York City Transitional Finance Authority Income Tax Revenue | 5.000% | 5/1/43 | 5,000 | 5,528 | |
| New York City Transitional Finance Authority Income Tax Revenue | 5.250% | 5/1/43 | 4,000 | 4,494 | |
| New York City Transitional Finance Authority Income Tax Revenue | 5.250% | 5/1/50 | 7,365 | 8,119 | |
| New York City Transitional Finance Authority Income Tax Revenue | 5.250% | 5/1/50 | 2,740 | 3,021 |
| Coupon | Maturity Date | Face Amount ($000) | Market Value• ($000) | ||
| New York City Transitional Finance Authority Income Tax Revenue | 4.375% | 5/1/53 | 10,000 | 10,027 | |
| New York City Transitional Finance Authority Income Tax Revenue | 5.500% | 5/1/53 | 2,405 | 2,700 | |
| New York City Trust for Cultural Resources Miscellaneous Revenue | 5.000% | 12/1/25 | 610 | 631 | |
| New York City Trust for Cultural Resources Miscellaneous Revenue | 5.000% | 12/1/26 | 275 | 290 | |
| New York City Trust for Cultural Resources Miscellaneous Revenue | 5.000% | 12/1/27 | 525 | 565 | |
| New York City Trust for Cultural Resources Miscellaneous Revenue | 5.000% | 12/1/28 | 385 | 421 | |
| New York City Trust for Cultural Resources Miscellaneous Revenue | 5.000% | 12/1/29 | 350 | 388 | |
| New York City Trust for Cultural Resources Miscellaneous Revenue | 5.000% | 12/1/31 | 1,020 | 1,135 | |
| New York City Trust for Cultural Resources Miscellaneous Revenue | 5.000% | 12/1/32 | 350 | 389 | |
| New York City Trust for Cultural Resources Miscellaneous Revenue | 4.000% | 12/1/33 | 4,000 | 4,115 | |
| New York City Trust for Cultural Resources Miscellaneous Revenue | 4.000% | 12/1/35 | 3,100 | 3,158 | |
| New York City Trust for Cultural Resources Miscellaneous Revenue | 5.000% | 12/1/35 | 500 | 551 | |
| New York City Trust for Cultural Resources Miscellaneous Revenue | 5.000% | 12/1/36 | 900 | 984 | |
| New York City Trust for Cultural Resources Miscellaneous Revenue | 5.000% | 12/1/37 | 2,255 | 2,445 | |
| New York City Trust for Cultural Resources Miscellaneous Revenue | 5.000% | 12/1/38 | 2,070 | 2,234 | |
| New York City Trust for Cultural Resources Miscellaneous Revenue | 5.000% | 12/1/39 | 605 | 650 | |
| New York City Trust for Cultural Resources Recreational Revenue | 4.000% | 7/1/46 | 1,835 | 1,631 | |
| New York Convention Center Development Corp. Hotel Occupancy Tax Revenue | 5.000% | 11/15/27 | 1,400 | 1,427 | |
| New York Convention Center Development Corp. Hotel Occupancy Tax Revenue | 5.000% | 11/15/32 | 3,540 | 3,601 | |
| New York Convention Center Development Corp. Hotel Occupancy Tax Revenue | 5.000% | 11/15/33 | 4,655 | 4,734 | |
| 2 | New York Convention Center Development Corp. Hotel Occupancy Tax Revenue | 0.000% | 11/15/41 | 6,000 | 2,512 |
| 1 | New York Convention Center Development Corp. Hotel Occupancy Tax Revenue | 0.000% | 11/15/44 | 11,075 | 3,892 |
| New York Convention Center Development Corp. Hotel Occupancy Tax Revenue | 0.000% | 11/15/49 | 6,000 | 1,611 | |
| New York Convention Center Development Corp. Hotel Occupancy Tax Revenue | 0.000% | 11/15/51 | 11,365 | 2,736 | |
| New York Counties Tobacco Trust VI Tobacco Settlement Funded Revenue | 5.625% | 6/1/35 | 8,020 | 8,205 | |
| New York Counties Tobacco Trust VI Tobacco Settlement Funded Revenue | 2.450% | 6/1/42 | 520 | 518 | |
| New York Liberty Development Corp. Economic Development Revenue (World Trade Center Project) | 3.000% | 9/15/43 | 3,000 | 2,366 | |
| New York Liberty Development Corp. Economic Development Revenue (World Trade Center Project) | 3.125% | 9/15/50 | 8,000 | 6,002 | |
| New York Liberty Development Corp. Economic Development Revenue (World Trade Center Project) | 3.250% | 9/15/52 | 2,000 | 1,445 | |
| New York Liberty Development Corp. Economic Development Revenue (World Trade Center Project) | 3.500% | 9/15/52 | 3,655 | 2,789 | |
| 3 | New York Liberty Development Corp. Industrial Revenue | 5.150% | 11/15/34 | 6,110 | 6,105 |
| Coupon | Maturity Date | Face Amount ($000) | Market Value• ($000) | ||
| New York Liberty Development Corp. Industrial Revenue | 5.500% | 10/1/37 | 8,306 | 9,383 | |
| 7 | New York Liberty Development Corp. Industrial Revenue | 2.450% | 9/15/69 | 17,325 | 15,519 |
| New York Liberty Development Corp. Industrial Revenue | 2.625% | 9/15/69 | 12,885 | 11,473 | |
| New York Liberty Development Corp. Industrial Revenue | 2.800% | 9/15/69 | 11,080 | 9,813 | |
| New York Liberty Development Corp. Intergovernmental Agreement Revenue | 2.250% | 2/15/41 | 6,175 | 4,515 | |
| New York Liberty Development Corp. Intergovernmental Agreement Revenue | 3.000% | 2/15/42 | 1,170 | 947 | |
| 2 | New York Liberty Development Corp. Intergovernmental Agreement Revenue | 3.000% | 2/15/42 | 1,205 | 991 |
| New York Liberty Development Corp. Intergovernmental Agreement Revenue | 4.000% | 2/15/43 | 5,355 | 5,255 | |
| New York Liberty Development Corp. Intergovernmental Agreement Revenue | 2.750% | 2/15/44 | 14,000 | 10,648 | |
| New York Liberty Development Corp. Lease (Appropriation) Revenue | 1.900% | 11/15/31 | 1,000 | 861 | |
| New York Liberty Development Corp. Lease (Appropriation) Revenue | 2.300% | 11/15/34 | 4,000 | 3,428 | |
| New York Liberty Development Corp. Lease (Appropriation) Revenue | 2.400% | 11/15/35 | 3,750 | 3,188 | |
| New York Liberty Development Corp. Lease (Appropriation) Revenue | 2.500% | 11/15/36 | 3,000 | 2,510 | |
| New York Liberty Development Corp. Lease (Appropriation) Revenue | 2.750% | 11/15/41 | 10,900 | 8,488 | |
| New York Liberty Development Corp. Lease (Appropriation) Revenue | 2.875% | 11/15/46 | 12,500 | 9,255 | |
| 2 | New York Liberty Development Corp. Lease (Appropriation) Revenue | 2.875% | 11/15/46 | 3,180 | 2,388 |
| 1 | New York Liberty Development Corp. Lease (Appropriation) Revenue | 2.875% | 11/15/46 | 3,155 | 2,369 |
| New York Liberty Development Corp. Lease (Appropriation) Revenue | 3.000% | 11/15/51 | 12,150 | 8,697 | |
| 2 | New York Liberty Development Corp. Lease (Appropriation) Revenue | 3.000% | 11/15/51 | 5,460 | 3,982 |
| 1,2,3 | New York Liberty Development Corp. Lease (Appropriation) Revenue TOB VRDO | 3.420% | 12/7/23 | 2,500 | 2,500 |
| New York Liberty Development Corp. Miscellaneous Revenue | 5.250% | 10/1/35 | 48,500 | 54,847 | |
| New York Mortgage Agency Homeowner Mortgage Local or Guaranteed Housing Revenue | 2.200% | 10/1/36 | 275 | 211 | |
| New York Mortgage Agency Homeowner Mortgage Local or Guaranteed Housing Revenue | 2.200% | 10/1/36 | 1,500 | 1,150 | |
| New York Mortgage Agency Homeowner Mortgage Local or Guaranteed Housing Revenue | 3.400% | 10/1/38 | 1,295 | 1,166 | |
| New York Mortgage Agency Homeowner Mortgage Local or Guaranteed Housing Revenue | 3.750% | 10/1/43 | 3,150 | 2,836 | |
| New York Mortgage Agency Homeowner Mortgage Local or Guaranteed Housing Revenue | 4.450% | 10/1/43 | 1,500 | 1,531 | |
| New York Mortgage Agency Homeowner Mortgage Local or Guaranteed Housing Revenue | 4.650% | 10/1/43 | 3,000 | 3,035 | |
| New York Mortgage Agency Homeowner Mortgage Local or Guaranteed Housing Revenue | 2.850% | 10/1/44 | 1,350 | 1,011 | |
| New York Mortgage Agency Homeowner Mortgage Local or Guaranteed Housing Revenue | 2.450% | 10/1/45 | 5,000 | 3,457 | |
| New York Mortgage Agency Homeowner Mortgage Local or Guaranteed Housing Revenue | 3.000% | 10/1/45 | 3,855 | 3,711 | |
| New York Mortgage Agency Homeowner Mortgage Local or Guaranteed Housing Revenue | 2.700% | 10/1/47 | 3,490 | 2,479 |
| Coupon | Maturity Date | Face Amount ($000) | Market Value• ($000) | ||
| New York Mortgage Agency Homeowner Mortgage Local or Guaranteed Housing Revenue | 3.500% | 10/1/47 | 1,420 | 1,403 | |
| New York Mortgage Agency Homeowner Mortgage Local or Guaranteed Housing Revenue | 3.800% | 10/1/48 | 6,535 | 5,555 | |
| New York Mortgage Agency Homeowner Mortgage Local or Guaranteed Housing Revenue | 5.000% | 10/1/48 | 1,285 | 1,322 | |
| New York Mortgage Agency Homeowner Mortgage Local or Guaranteed Housing Revenue | 3.000% | 4/1/50 | 6,530 | 6,242 | |
| New York Mortgage Agency Homeowner Mortgage Local or Guaranteed Housing Revenue | 3.250% | 10/1/51 | 3,760 | 3,625 | |
| New York Mortgage Agency Homeowner Mortgage Local or Guaranteed Housing Revenue | 4.650% | 10/1/53 | 1,500 | 1,504 | |
| New York NY GO | 5.000% | 8/1/26 | 3,140 | 3,275 | |
| New York NY GO | 5.000% | 8/1/26 | 3,875 | 4,095 | |
| New York NY GO | 5.000% | 8/1/26 | 1,630 | 1,722 | |
| New York NY GO | 5.000% | 1/1/27 | 3,500 | 3,728 | |
| New York NY GO | 5.000% | 8/1/27 | 600 | 647 | |
| New York NY GO | 5.000% | 9/1/27 | 3,805 | 4,111 | |
| New York NY GO | 5.000% | 8/1/28 | 2,320 | 2,510 | |
| New York NY GO | 5.000% | 8/1/28 | 2,260 | 2,491 | |
| New York NY GO | 5.000% | 8/1/29 | 5,070 | 5,315 | |
| New York NY GO | 5.000% | 8/1/29 | 5,195 | 5,605 | |
| New York NY GO | 5.000% | 8/1/29 | 3,000 | 3,360 | |
| New York NY GO | 5.000% | 8/1/29 | 3,400 | 3,808 | |
| New York NY GO | 5.000% | 8/1/29 | 1,000 | 1,120 | |
| New York NY GO | 5.000% | 12/1/29 | 1,360 | 1,486 | |
| New York NY GO | 5.000% | 8/1/30 | 5,050 | 5,281 | |
| New York NY GO | 5.000% | 8/1/30 | 4,720 | 4,936 | |
| New York NY GO | 5.000% | 8/1/30 | 4,000 | 4,308 | |
| New York NY GO | 5.000% | 8/1/30 | 2,000 | 2,270 | |
| New York NY GO | 4.000% | 8/1/31 | 2,775 | 2,838 | |
| New York NY GO | 5.000% | 8/1/31 | 7,810 | 8,373 | |
| New York NY GO | 5.000% | 8/1/31 | 1,440 | 1,550 | |
| New York NY GO | 5.000% | 8/1/31 | 3,000 | 3,397 | |
| New York NY GO | 5.000% | 8/1/31 | 1,815 | 2,089 | |
| New York NY GO | 5.000% | 12/1/31 | 4,770 | 5,021 | |
| New York NY GO | 5.000% | 1/1/32 | 2,000 | 2,195 | |
| New York NY GO | 4.000% | 8/1/32 | 1,935 | 1,975 | |
| New York NY GO | 5.000% | 8/1/32 | 1,250 | 1,373 | |
| New York NY GO | 5.000% | 8/1/32 | 3,735 | 4,016 | |
| New York NY GO | 5.000% | 8/1/32 | 1,000 | 1,131 | |
| New York NY GO | 5.000% | 12/1/32 | 1,240 | 1,350 | |
| New York NY GO | 3.250% | 3/1/33 | 3,000 | 2,990 | |
| New York NY GO | 5.000% | 8/1/33 | 1,000 | 1,095 | |
| New York NY GO | 5.000% | 8/1/33 | 500 | 582 | |
| New York NY GO | 5.000% | 4/1/34 | 3,680 | 4,195 | |
| New York NY GO | 5.000% | 8/1/34 | 2,000 | 2,182 | |
| New York NY GO | 5.000% | 8/1/34 | 2,260 | 2,466 | |
| New York NY GO | 5.000% | 8/1/34 | 1,125 | 1,268 | |
| New York NY GO | 3.000% | 3/1/35 | 3,145 | 2,832 | |
| New York NY GO | 4.000% | 8/1/35 | 1,830 | 1,879 | |
| New York NY GO | 5.000% | 8/1/35 | 2,000 | 2,244 | |
| New York NY GO | 5.000% | 8/1/35 | 1,000 | 1,170 | |
| New York NY GO | 4.000% | 10/1/35 | 2,085 | 2,133 | |
| New York NY GO | 5.000% | 12/1/35 | 2,500 | 2,623 | |
| New York NY GO | 4.000% | 3/1/36 | 1,500 | 1,533 |
| Coupon | Maturity Date | Face Amount ($000) | Market Value• ($000) | ||
| New York NY GO | 4.000% | 8/1/36 | 1,385 | 1,412 | |
| New York NY GO | 5.000% | 8/1/36 | 1,235 | 1,429 | |
| New York NY GO | 5.000% | 10/1/36 | 5,000 | 5,266 | |
| New York NY GO | 5.000% | 10/1/36 | 2,590 | 2,818 | |
| New York NY GO | 5.000% | 10/1/36 | 1,650 | 1,886 | |
| New York NY GO | 5.000% | 3/1/37 | 7,500 | 7,966 | |
| New York NY GO | 5.000% | 4/1/37 | 3,575 | 3,799 | |
| New York NY GO | 4.000% | 8/1/37 | 8,820 | 8,956 | |
| New York NY GO | 4.000% | 8/1/37 | 2,500 | 2,544 | |
| New York NY GO | 5.000% | 8/1/37 | 4,000 | 4,142 | |
| New York NY GO | 5.000% | 8/1/37 | 1,000 | 1,143 | |
| New York NY GO | 4.000% | 3/1/38 | 5,240 | 5,288 | |
| New York NY GO | 5.000% | 3/1/38 | 7,500 | 7,911 | |
| New York NY GO | 5.000% | 3/1/38 | 2,000 | 2,177 | |
| New York NY GO | 5.000% | 4/1/38 | 1,000 | 1,056 | |
| New York NY GO | 4.000% | 8/1/38 | 2,760 | 2,786 | |
| New York NY GO | 5.000% | 8/1/38 | 10,395 | 10,746 | |
| New York NY GO | 5.000% | 10/1/38 | 6,500 | 6,776 | |
| New York NY GO | 5.000% | 10/1/38 | 2,910 | 3,125 | |
| New York NY GO | 5.000% | 3/1/39 | 6,360 | 6,693 | |
| New York NY GO | 5.000% | 3/1/39 | 3,000 | 3,249 | |
| New York NY GO | 4.000% | 8/1/39 | 2,865 | 2,881 | |
| New York NY GO | 5.000% | 10/1/39 | 2,220 | 2,374 | |
| New York NY GO | 5.000% | 10/1/39 | 8,910 | 9,259 | |
| New York NY GO | 5.250% | 10/1/39 | 1,000 | 1,135 | |
| New York NY GO | 4.000% | 8/1/40 | 5,000 | 5,014 | |
| New York NY GO | 4.000% | 8/1/40 | 1,155 | 1,159 | |
| New York NY GO | 4.000% | 8/1/40 | 9,400 | 9,434 | |
| New York NY GO | 5.000% | 8/1/40 | 1,500 | 1,671 | |
| New York NY GO | 4.000% | 10/1/40 | 3,000 | 3,008 | |
| New York NY GO | 3.000% | 3/1/41 | 5,010 | 4,121 | |
| New York NY GO | 4.000% | 8/1/41 | 2,035 | 2,041 | |
| New York NY GO | 4.000% | 8/1/41 | 2,500 | 2,508 | |
| New York NY GO | 5.000% | 8/1/41 | 1,000 | 1,109 | |
| New York NY GO | 3.000% | 10/1/41 | 2,250 | 1,843 | |
| New York NY GO | 5.250% | 10/1/41 | 1,070 | 1,203 | |
| New York NY GO | 5.000% | 12/1/41 | 10,000 | 10,349 | |
| New York NY GO | 5.000% | 12/1/41 | 4,850 | 5,119 | |
| New York NY GO | 4.000% | 3/1/42 | 1,500 | 1,501 | |
| New York NY GO | 5.000% | 3/1/42 | 2,000 | 2,160 | |
| New York NY GO | 4.000% | 4/1/42 | 8,000 | 8,011 | |
| New York NY GO | 5.000% | 8/1/42 | 1,000 | 1,102 | |
| New York NY GO | 5.250% | 9/1/42 | 6,240 | 6,965 | |
| New York NY GO | 5.000% | 10/1/42 | 8,000 | 8,475 | |
| New York NY GO | 5.250% | 10/1/42 | 2,250 | 2,514 | |
| New York NY GO | 5.000% | 3/1/43 | 1,000 | 1,068 | |
| New York NY GO | 5.000% | 3/1/43 | 10,180 | 10,970 | |
| New York NY GO | 5.000% | 4/1/43 | 6,500 | 6,788 | |
| New York NY GO | 5.250% | 4/1/43 | 11,815 | 13,213 | |
| New York NY GO | 5.000% | 8/1/43 | 9,020 | 9,531 | |
| New York NY GO | 5.000% | 8/1/43 | 2,340 | 2,509 | |
| New York NY GO | 5.000% | 8/1/43 | 1,000 | 1,099 | |
| New York NY GO | 5.000% | 10/1/43 | 8,000 | 8,465 | |
| New York NY GO | 5.250% | 10/1/43 | 1,000 | 1,113 | |
| New York NY GO | 4.000% | 3/1/44 | 7,000 | 6,946 |
| Coupon | Maturity Date | Face Amount ($000) | Market Value• ($000) | ||
| New York NY GO | 5.250% | 4/1/44 | 5,825 | 6,490 | |
| New York NY GO | 5.000% | 8/1/44 | 1,000 | 1,096 | |
| New York NY GO | 3.000% | 3/1/45 | 4,880 | 3,797 | |
| New York NY GO | 4.000% | 4/1/45 | 6,840 | 6,759 | |
| New York NY GO | 5.000% | 8/1/45 | 5,000 | 5,454 | |
| New York NY GO | 5.000% | 8/1/46 | 2,500 | 2,714 | |
| New York NY GO | 4.000% | 9/1/46 | 6,940 | 6,783 | |
| New York NY GO | 4.000% | 3/1/47 | 3,080 | 3,006 | |
| New York NY GO | 5.000% | 8/1/47 | 2,595 | 2,771 | |
| New York NY GO | 5.000% | 8/1/47 | 6,000 | 6,495 | |
| New York NY GO | 5.250% | 10/1/47 | 10,000 | 10,974 | |
| New York NY GO | 5.000% | 8/1/48 | 10,000 | 10,803 | |
| New York NY GO | 4.500% | 5/1/49 | 2,675 | 2,712 | |
| New York NY GO | 4.000% | 4/1/50 | 4,135 | 4,005 | |
| New York NY GO | 3.000% | 8/1/50 | 4,000 | 2,948 | |
| New York NY GO | 4.000% | 8/1/50 | 5,700 | 5,520 | |
| 2 | New York NY GO | 4.000% | 8/1/50 | 2,000 | 1,949 |
| New York NY GO | 3.000% | 3/1/51 | 2,235 | 1,638 | |
| New York NY GO | 5.000% | 8/1/51 | 14,735 | 15,842 | |
| New York NY GO | 4.125% | 8/1/53 | 6,125 | 5,988 | |
| 8 | New York NY GO PUT, 9.000% coupon rate effective 12/1/25 | 5.000% | 6/1/44 | 1,650 | 1,689 |
| 4 | New York NY GO VRDO | 3.170% | 12/1/23 | 7,400 | 7,400 |
| New York NY GO VRDO | 3.250% | 12/1/23 | 3,140 | 3,140 | |
| New York NY GO VRDO | 3.250% | 12/1/23 | 1,820 | 1,820 | |
| New York NY GO VRDO | 3.250% | 12/1/23 | 5,040 | 5,040 | |
| New York NY GO VRDO | 3.250% | 12/1/23 | 1,600 | 1,600 | |
| 4 | New York NY GO VRDO | 3.400% | 12/1/23 | 1,400 | 1,400 |
| 1 | New York Power Authority Electric Power & Light Revenue | 5.000% | 11/15/27 | 1,785 | 1,930 |
| 1 | New York Power Authority Electric Power & Light Revenue | 5.000% | 11/15/28 | 1,000 | 1,100 |
| 1 | New York Power Authority Electric Power & Light Revenue | 5.000% | 11/15/29 | 1,000 | 1,116 |
| 1 | New York Power Authority Electric Power & Light Revenue | 5.000% | 11/15/38 | 1,000 | 1,126 |
| 1 | New York Power Authority Electric Power & Light Revenue | 5.250% | 11/15/39 | 800 | 916 |
| 1 | New York Power Authority Electric Power & Light Revenue | 5.250% | 11/15/41 | 1,000 | 1,127 |
| 1 | New York Power Authority Electric Power & Light Revenue | 5.250% | 11/15/43 | 1,400 | 1,561 |
| New York Power Authority Electric Power & Light Revenue | 4.000% | 11/15/45 | 6,310 | 6,235 | |
| 1 | New York Power Authority Electric Power & Light Revenue | 5.000% | 11/15/48 | 5,000 | 5,378 |
| New York Power Authority Electric Power & Light Revenue | 4.000% | 11/15/50 | 10,065 | 9,809 | |
| 1 | New York Power Authority Electric Power & Light Revenue | 5.000% | 11/15/53 | 5,000 | 5,353 |
| New York Power Authority Electric Power & Light Revenue | 4.000% | 11/15/55 | 20,815 | 20,021 | |
| 1 | New York Power Authority Electric Power & Light Revenue | 5.125% | 11/15/58 | 10,500 | 11,276 |
| New York Power Authority Electric Power & Light Revenue | 3.250% | 11/15/60 | 8,100 | 5,982 | |
| New York Power Authority Electric Power & Light Revenue | 4.000% | 11/15/60 | 3,325 | 3,160 | |
| 1 | New York Power Authority Electric Power & Light Revenue | 5.125% | 11/15/63 | 5,000 | 5,348 |
| 1 | New York Power Authority Electric Power & Light Revenue (Green Transmission Project) | 4.000% | 11/15/36 | 2,440 | 2,491 |
| 1 | New York Power Authority Electric Power & Light Revenue (Green Transmission Project) | 4.000% | 11/15/52 | 7,500 | 7,280 |
| 1 | New York Power Authority Electric Power & Light Revenue (Green Transmission Project) | 4.000% | 11/15/61 | 5,000 | 4,651 |
| New York State Bridge Authority Highway Revenue | 4.000% | 1/1/33 | 1,285 | 1,346 | |
| New York State Bridge Authority Highway Revenue | 4.000% | 1/1/36 | 675 | 694 | |
| New York State Dormitory Authority College & University Revenue | 5.000% | 7/1/24 | 315 | 317 | |
| 9 | New York State Dormitory Authority College & University Revenue | 5.150% | 7/1/24 | 700 | 708 |
| New York State Dormitory Authority College & University Revenue | 5.000% | 5/1/25 | 1,270 | 1,271 | |
| New York State Dormitory Authority College & University Revenue | 5.000% | 7/1/25 | 315 | 321 | |
| New York State Dormitory Authority College & University Revenue | 5.000% | 7/1/26 | 2,595 | 2,659 |
| Coupon | Maturity Date | Face Amount ($000) | Market Value• ($000) | ||
| New York State Dormitory Authority College & University Revenue | 5.000% | 7/1/26 | 325 | 331 | |
| New York State Dormitory Authority College & University Revenue | 5.000% | 5/1/27 | 1,025 | 1,026 | |
| New York State Dormitory Authority College & University Revenue | 5.000% | 7/1/27 | 655 | 670 | |
| New York State Dormitory Authority College & University Revenue | 5.000% | 7/1/27 | 500 | 520 | |
| New York State Dormitory Authority College & University Revenue | 5.000% | 7/1/27 | 490 | 501 | |
| New York State Dormitory Authority College & University Revenue | 5.000% | 7/1/27 | 350 | 360 | |
| New York State Dormitory Authority College & University Revenue | 5.000% | 5/1/28 | 2,445 | 2,446 | |
| New York State Dormitory Authority College & University Revenue | 5.000% | 7/1/28 | 400 | 417 | |
| New York State Dormitory Authority College & University Revenue | 5.000% | 7/1/28 | 300 | 311 | |
| New York State Dormitory Authority College & University Revenue | 5.000% | 5/1/29 | 1,660 | 1,661 | |
| New York State Dormitory Authority College & University Revenue | 5.000% | 7/1/29 | 1,010 | 1,050 | |
| New York State Dormitory Authority College & University Revenue | 5.000% | 7/1/29 | 850 | 899 | |
| New York State Dormitory Authority College & University Revenue | 5.000% | 7/1/29 | 25 | 26 | |
| New York State Dormitory Authority College & University Revenue | 5.000% | 7/1/29 | 45 | 46 | |
| New York State Dormitory Authority College & University Revenue | 5.000% | 7/1/29 | 300 | 312 | |
| New York State Dormitory Authority College & University Revenue | 5.000% | 7/1/30 | 500 | 519 | |
| New York State Dormitory Authority College & University Revenue | 5.000% | 7/1/30 | 515 | 544 | |
| New York State Dormitory Authority College & University Revenue | 5.000% | 7/1/30 | 505 | 539 | |
| New York State Dormitory Authority College & University Revenue | 5.000% | 7/1/30 | 300 | 313 | |
| New York State Dormitory Authority College & University Revenue | 5.250% | 7/1/30 | 1,040 | 1,122 | |
| New York State Dormitory Authority College & University Revenue | 4.000% | 7/1/31 | 1,015 | 1,031 | |
| New York State Dormitory Authority College & University Revenue | 5.000% | 7/1/31 | 3,000 | 3,032 | |
| New York State Dormitory Authority College & University Revenue | 5.000% | 7/1/31 | 955 | 990 | |
| New York State Dormitory Authority College & University Revenue | 5.000% | 7/1/31 | 350 | 366 | |
| New York State Dormitory Authority College & University Revenue | 5.000% | 7/1/32 | 1,825 | 1,937 | |
| New York State Dormitory Authority College & University Revenue | 5.000% | 7/1/32 | 325 | 341 | |
| New York State Dormitory Authority College & University Revenue | 4.000% | 7/1/33 | 500 | 510 | |
| New York State Dormitory Authority College & University Revenue | 4.000% | 7/1/33 | 1,200 | 1,218 | |
| New York State Dormitory Authority College & University Revenue | 4.000% | 7/1/33 | 1,030 | 1,072 | |
| New York State Dormitory Authority College & University Revenue | 4.000% | 7/1/34 | 1,500 | 1,552 | |
| New York State Dormitory Authority College & University Revenue | 4.000% | 7/1/35 | 1,355 | 1,383 | |
| New York State Dormitory Authority College & University Revenue | 4.000% | 7/1/35 | 570 | 580 | |
| New York State Dormitory Authority College & University Revenue | 4.000% | 7/1/35 | 225 | 231 | |
| New York State Dormitory Authority College & University Revenue | 5.000% | 7/1/35 | 560 | 580 | |
| New York State Dormitory Authority College & University Revenue | 5.000% | 7/1/35 | 2,000 | 2,115 | |
| New York State Dormitory Authority College & University Revenue | 4.000% | 7/1/36 | 1,000 | 1,012 | |
| New York State Dormitory Authority College & University Revenue | 4.000% | 7/1/36 | 2,000 | 2,014 | |
| New York State Dormitory Authority College & University Revenue | 4.000% | 7/1/36 | 530 | 531 | |
| New York State Dormitory Authority College & University Revenue | 4.000% | 7/1/36 | 300 | 306 | |
| New York State Dormitory Authority College & University Revenue | 5.000% | 7/1/36 | 1,500 | 1,581 | |
| New York State Dormitory Authority College & University Revenue | 5.000% | 7/1/36 | 1,000 | 1,086 | |
| New York State Dormitory Authority College & University Revenue | 4.000% | 7/1/37 | 1,020 | 1,023 | |
| New York State Dormitory Authority College & University Revenue | 4.000% | 7/1/37 | 505 | 501 | |
| New York State Dormitory Authority College & University Revenue | 4.000% | 7/1/37 | 325 | 328 | |
| New York State Dormitory Authority College & University Revenue | 4.000% | 7/1/37 | 1,555 | 1,578 | |
| New York State Dormitory Authority College & University Revenue | 4.000% | 7/1/37 | 1,550 | 1,574 | |
| New York State Dormitory Authority College & University Revenue | 5.000% | 7/1/37 | 225 | 230 | |
| New York State Dormitory Authority College & University Revenue | 5.000% | 7/1/37 | 750 | 805 | |
| New York State Dormitory Authority College & University Revenue | 4.000% | 7/1/38 | 405 | 397 | |
| New York State Dormitory Authority College & University Revenue | 4.000% | 7/1/38 | 600 | 603 | |
| New York State Dormitory Authority College & University Revenue | 4.000% | 7/1/38 | 2,000 | 2,013 | |
| New York State Dormitory Authority College & University Revenue | 5.000% | 10/1/38 | 5,000 | 5,335 | |
| New York State Dormitory Authority College & University Revenue | 5.000% | 7/1/39 | 1,615 | 1,713 | |
| New York State Dormitory Authority College & University Revenue | 5.000% | 7/1/39 | 15 | 15 | |
| New York State Dormitory Authority College & University Revenue | 4.000% | 7/1/40 | 120 | 120 |
| Coupon | Maturity Date | Face Amount ($000) | Market Value• ($000) | ||
| New York State Dormitory Authority College & University Revenue | 5.000% | 7/1/40 | 2,135 | 2,259 | |
| 10 | New York State Dormitory Authority College & University Revenue | 5.500% | 7/1/40 | 2,660 | 3,123 |
| New York State Dormitory Authority College & University Revenue | 3.000% | 7/1/42 | 2,790 | 2,209 | |
| New York State Dormitory Authority College & University Revenue | 4.000% | 7/1/42 | 1,185 | 1,172 | |
| New York State Dormitory Authority College & University Revenue | 5.000% | 7/1/42 | 5,000 | 5,311 | |
| New York State Dormitory Authority College & University Revenue | 5.000% | 7/1/42 | 300 | 298 | |
| New York State Dormitory Authority College & University Revenue | 5.000% | 7/1/42 | 10 | 10 | |
| New York State Dormitory Authority College & University Revenue | 4.000% | 7/1/44 | 3,415 | 3,308 | |
| New York State Dormitory Authority College & University Revenue | 5.000% | 10/1/45 | 2,000 | 2,336 | |
| New York State Dormitory Authority College & University Revenue | 4.000% | 7/1/46 | 3,250 | 3,123 | |
| New York State Dormitory Authority College & University Revenue | 4.000% | 7/1/46 | 5,040 | 4,885 | |
| New York State Dormitory Authority College & University Revenue | 5.000% | 10/1/46 | 3,000 | 3,493 | |
| New York State Dormitory Authority College & University Revenue | 5.000% | 10/1/46 | 1,250 | 1,285 | |
| New York State Dormitory Authority College & University Revenue | 4.000% | 7/1/47 | 4,500 | 3,998 | |
| New York State Dormitory Authority College & University Revenue | 5.000% | 10/1/47 | 2,900 | 3,371 | |
| New York State Dormitory Authority College & University Revenue | 4.000% | 7/1/48 | 4,465 | 4,086 | |
| New York State Dormitory Authority College & University Revenue | 5.000% | 10/1/48 | 7,500 | 8,713 | |
| New York State Dormitory Authority College & University Revenue | 4.000% | 7/1/49 | 2,250 | 2,041 | |
| New York State Dormitory Authority College & University Revenue | 5.000% | 7/1/49 | 5,000 | 5,221 | |
| New York State Dormitory Authority College & University Revenue | 5.000% | 7/1/50 | 2,500 | 2,606 | |
| New York State Dormitory Authority College & University Revenue | 5.000% | 7/15/50 | 3,095 | 3,029 | |
| New York State Dormitory Authority College & University Revenue | 5.000% | 10/1/50 | 10,830 | 12,605 | |
| New York State Dormitory Authority College & University Revenue | 4.000% | 7/1/52 | 5,445 | 4,705 | |
| New York State Dormitory Authority College & University Revenue | 5.000% | 7/1/52 | 2,505 | 2,629 | |
| New York State Dormitory Authority College & University Revenue | 5.000% | 7/1/57 | 1,000 | 961 | |
| New York State Dormitory Authority College & University Revenue (New School Project) | 4.000% | 7/1/43 | 1,565 | 1,433 | |
| 3 | New York State Dormitory Authority College & University Revenue TOB VRDO | 3.550% | 12/1/23 | 11,400 | 11,400 |
| New York State Dormitory Authority College & University Revenue, Prere. | 5.000% | 7/1/24 | 500 | 505 | |
| New York State Dormitory Authority College & University Revenue, Prere. | 5.000% | 7/1/24 | 1,000 | 1,010 | |
| New York State Dormitory Authority College & University Revenue, Prere. | 5.000% | 7/1/24 | 500 | 505 | |
| New York State Dormitory Authority College & University Revenue, Prere. | 5.000% | 7/1/24 | 2,110 | 2,130 | |
| New York State Dormitory Authority College & University Revenue, Prere. | 5.000% | 7/1/24 | 1,805 | 1,822 | |
| New York State Dormitory Authority College & University Revenue, Prere. | 4.000% | 7/1/25 | 1,275 | 1,295 | |
| New York State Dormitory Authority College & University Revenue, Prere. | 4.000% | 7/1/25 | 1,450 | 1,473 | |
| New York State Dormitory Authority College & University Revenue, Prere. | 5.000% | 7/1/25 | 750 | 773 | |
| New York State Dormitory Authority College & University Revenue, Prere. | 5.000% | 7/1/25 | 15 | 15 | |
| New York State Dormitory Authority College & University Revenue, Prere. | 5.000% | 7/1/25 | 5 | 5 | |
| New York State Dormitory Authority College & University Revenue, Prere. | 5.000% | 7/1/25 | 210 | 216 | |
| New York State Dormitory Authority College & University Revenue, Prere. | 5.000% | 7/1/25 | 210 | 216 | |
| New York State Dormitory Authority Health, Hospital, Nursing Home Revenue | 5.000% | 8/1/24 | 800 | 802 | |
| New York State Dormitory Authority Health, Hospital, Nursing Home Revenue | 5.000% | 5/1/27 | 2,135 | 2,176 |
| Coupon | Maturity Date | Face Amount ($000) | Market Value• ($000) | ||
| New York State Dormitory Authority Health, Hospital, Nursing Home Revenue | 5.000% | 7/1/27 | 780 | 811 | |
| New York State Dormitory Authority Health, Hospital, Nursing Home Revenue | 5.000% | 5/1/28 | 2,480 | 2,525 | |
| New York State Dormitory Authority Health, Hospital, Nursing Home Revenue | 5.000% | 7/1/28 | 700 | 726 | |
| New York State Dormitory Authority Health, Hospital, Nursing Home Revenue | 5.000% | 7/1/29 | 1,550 | 1,607 | |
| New York State Dormitory Authority Health, Hospital, Nursing Home Revenue | 5.000% | 8/1/29 | 1,515 | 1,566 | |
| 5 | New York State Dormitory Authority Health, Hospital, Nursing Home Revenue | 4.000% | 2/1/30 | 500 | 517 |
| New York State Dormitory Authority Health, Hospital, Nursing Home Revenue | 5.000% | 5/1/30 | 2,225 | 2,261 | |
| 5 | New York State Dormitory Authority Health, Hospital, Nursing Home Revenue | 4.000% | 8/1/30 | 540 | 558 |
| 5 | New York State Dormitory Authority Health, Hospital, Nursing Home Revenue | 4.000% | 2/1/31 | 450 | 464 |
| New York State Dormitory Authority Health, Hospital, Nursing Home Revenue | 3.000% | 7/1/31 | 2,400 | 1,838 | |
| 5 | New York State Dormitory Authority Health, Hospital, Nursing Home Revenue | 4.000% | 8/1/31 | 450 | 464 |
| 5 | New York State Dormitory Authority Health, Hospital, Nursing Home Revenue | 4.000% | 2/1/32 | 1,145 | 1,179 |
| New York State Dormitory Authority Health, Hospital, Nursing Home Revenue | 5.000% | 5/1/32 | 2,650 | 2,691 | |
| New York State Dormitory Authority Health, Hospital, Nursing Home Revenue | 5.000% | 7/1/32 | 745 | 771 | |
| New York State Dormitory Authority Health, Hospital, Nursing Home Revenue | 5.000% | 7/1/32 | 1,875 | 1,995 | |
| 5 | New York State Dormitory Authority Health, Hospital, Nursing Home Revenue | 4.000% | 8/1/32 | 340 | 350 |
| 5 | New York State Dormitory Authority Health, Hospital, Nursing Home Revenue | 4.000% | 2/1/33 | 700 | 720 |
| New York State Dormitory Authority Health, Hospital, Nursing Home Revenue | 5.000% | 5/1/33 | 3,555 | 3,609 | |
| New York State Dormitory Authority Health, Hospital, Nursing Home Revenue | 3.000% | 7/1/33 | 2,650 | 1,904 | |
| New York State Dormitory Authority Health, Hospital, Nursing Home Revenue | 5.000% | 7/1/33 | 800 | 828 | |
| 5 | New York State Dormitory Authority Health, Hospital, Nursing Home Revenue | 4.000% | 2/1/34 | 825 | 848 |
| New York State Dormitory Authority Health, Hospital, Nursing Home Revenue | 4.000% | 5/1/34 | 775 | 777 | |
| New York State Dormitory Authority Health, Hospital, Nursing Home Revenue | 4.000% | 7/1/34 | 3,000 | 3,041 | |
| New York State Dormitory Authority Health, Hospital, Nursing Home Revenue | 5.000% | 8/1/34 | 1,000 | 1,028 | |
| 5 | New York State Dormitory Authority Health, Hospital, Nursing Home Revenue | 4.000% | 2/1/35 | 950 | 974 |
| New York State Dormitory Authority Health, Hospital, Nursing Home Revenue | 4.000% | 7/1/35 | 1,620 | 1,640 | |
| New York State Dormitory Authority Health, Hospital, Nursing Home Revenue | 5.000% | 5/1/36 | 3,020 | 3,057 | |
| New York State Dormitory Authority Health, Hospital, Nursing Home Revenue | 4.000% | 8/1/36 | 6,135 | 5,895 | |
| New York State Dormitory Authority Health, Hospital, Nursing Home Revenue | 4.000% | 9/1/36 | 405 | 392 |
| Coupon | Maturity Date | Face Amount ($000) | Market Value• ($000) | ||
| New York State Dormitory Authority Health, Hospital, Nursing Home Revenue | 4.000% | 7/1/37 | 1,015 | 1,026 | |
| New York State Dormitory Authority Health, Hospital, Nursing Home Revenue | 4.000% | 8/1/37 | 5,750 | 5,478 | |
| New York State Dormitory Authority Health, Hospital, Nursing Home Revenue | 4.000% | 9/1/37 | 300 | 285 | |
| New York State Dormitory Authority Health, Hospital, Nursing Home Revenue | 4.000% | 8/1/38 | 2,000 | 1,874 | |
| New York State Dormitory Authority Health, Hospital, Nursing Home Revenue | 4.000% | 9/1/38 | 600 | 562 | |
| New York State Dormitory Authority Health, Hospital, Nursing Home Revenue | 4.000% | 9/1/39 | 550 | 509 | |
| New York State Dormitory Authority Health, Hospital, Nursing Home Revenue | 4.000% | 7/1/40 | 650 | 470 | |
| 5 | New York State Dormitory Authority Health, Hospital, Nursing Home Revenue | 3.000% | 8/1/40 | 500 | 408 |
| New York State Dormitory Authority Health, Hospital, Nursing Home Revenue | 5.000% | 7/1/41 | 1,400 | 1,119 | |
| New York State Dormitory Authority Health, Hospital, Nursing Home Revenue | 5.000% | 7/1/42 | 5,000 | 5,193 | |
| New York State Dormitory Authority Health, Hospital, Nursing Home Revenue | 4.000% | 5/1/45 | 10,275 | 9,531 | |
| New York State Dormitory Authority Health, Hospital, Nursing Home Revenue | 4.000% | 7/1/45 | 4,500 | 3,148 | |
| New York State Dormitory Authority Health, Hospital, Nursing Home Revenue | 4.000% | 9/1/45 | 4,000 | 3,486 | |
| New York State Dormitory Authority Health, Hospital, Nursing Home Revenue | 4.000% | 7/1/47 | 3,000 | 2,903 | |
| New York State Dormitory Authority Health, Hospital, Nursing Home Revenue | 3.000% | 7/1/48 | 3,630 | 2,737 | |
| 1 | New York State Dormitory Authority Health, Hospital, Nursing Home Revenue | 3.000% | 7/1/48 | 5,000 | 3,740 |
| 5 | New York State Dormitory Authority Health, Hospital, Nursing Home Revenue | 3.000% | 2/1/50 | 5,000 | 3,552 |
| New York State Dormitory Authority Health, Hospital, Nursing Home Revenue | 4.000% | 7/1/50 | 9,525 | 8,733 | |
| 1 | New York State Dormitory Authority Health, Hospital, Nursing Home Revenue | 3.000% | 9/1/50 | 5,000 | 3,571 |
| New York State Dormitory Authority Health, Hospital, Nursing Home Revenue | 4.000% | 9/1/50 | 6,085 | 5,115 | |
| New York State Dormitory Authority Health, Hospital, Nursing Home Revenue | 4.000% | 7/1/51 | 7,500 | 7,074 | |
| New York State Dormitory Authority Health, Hospital, Nursing Home Revenue | 4.250% | 5/1/52 | 6,480 | 6,144 | |
| New York State Dormitory Authority Health, Hospital, Nursing Home Revenue | 5.000% | 5/1/52 | 7,000 | 7,254 | |
| New York State Dormitory Authority Health, Hospital, Nursing Home Revenue | 4.000% | 7/1/53 | 9,500 | 8,579 | |
| New York State Dormitory Authority Health, Hospital, Nursing Home Revenue PUT | 5.000% | 5/1/26 | 7,560 | 7,759 | |
| 3 | New York State Dormitory Authority Health, Hospital, Nursing Home Revenue TOB VRDO | 3.350% | 12/1/23 | 16,750 | 16,750 |
| New York State Dormitory Authority Income Tax Revenue | 5.000% | 2/15/29 | 5,095 | 5,326 | |
| New York State Dormitory Authority Income Tax Revenue | 5.000% | 3/15/29 | 5,000 | 5,577 | |
| New York State Dormitory Authority Income Tax Revenue | 5.000% | 2/15/32 | 1,500 | 1,600 | |
| New York State Dormitory Authority Income Tax Revenue | 5.000% | 3/15/32 | 5,000 | 5,826 | |
| New York State Dormitory Authority Income Tax Revenue | 5.000% | 3/15/33 | 5,000 | 5,225 | |
| New York State Dormitory Authority Income Tax Revenue | 5.000% | 3/15/33 | 1,000 | 1,165 |
| Coupon | Maturity Date | Face Amount ($000) | Market Value• ($000) | ||
| New York State Dormitory Authority Income Tax Revenue | 5.000% | 3/15/33 | 4,000 | 4,722 | |
| New York State Dormitory Authority Income Tax Revenue | 4.000% | 2/15/34 | 4,985 | 5,068 | |
| New York State Dormitory Authority Income Tax Revenue | 5.000% | 2/15/34 | 7,575 | 8,065 | |
| New York State Dormitory Authority Income Tax Revenue | 4.000% | 2/15/35 | 1,900 | 1,930 | |
| New York State Dormitory Authority Income Tax Revenue | 5.000% | 2/15/35 | 7,500 | 8,393 | |
| New York State Dormitory Authority Income Tax Revenue | 5.000% | 2/15/35 | 3,510 | 3,649 | |
| New York State Dormitory Authority Income Tax Revenue | 4.000% | 3/15/35 | 3,000 | 3,111 | |
| New York State Dormitory Authority Income Tax Revenue | 5.000% | 3/15/35 | 4,305 | 4,409 | |
| New York State Dormitory Authority Income Tax Revenue | 5.000% | 3/15/35 | 5,030 | 5,237 | |
| New York State Dormitory Authority Income Tax Revenue | 5.000% | 2/15/36 | 3,000 | 3,109 | |
| New York State Dormitory Authority Income Tax Revenue | 5.000% | 3/15/36 | 1,000 | 1,022 | |
| New York State Dormitory Authority Income Tax Revenue | 5.250% | 3/15/38 | 5,000 | 5,370 | |
| New York State Dormitory Authority Income Tax Revenue | 4.000% | 3/15/39 | 2,500 | 2,514 | |
| New York State Dormitory Authority Income Tax Revenue | 5.250% | 3/15/39 | 2,065 | 2,209 | |
| New York State Dormitory Authority Income Tax Revenue | 4.000% | 3/15/40 | 10,000 | 10,027 | |
| New York State Dormitory Authority Income Tax Revenue | 5.000% | 2/15/41 | 2,140 | 2,234 | |
| New York State Dormitory Authority Income Tax Revenue | 3.000% | 3/15/41 | 3,100 | 2,544 | |
| New York State Dormitory Authority Income Tax Revenue | 4.000% | 3/15/41 | 2,600 | 2,595 | |
| New York State Dormitory Authority Income Tax Revenue | 5.000% | 3/15/41 | 2,500 | 2,737 | |
| New York State Dormitory Authority Income Tax Revenue | 5.000% | 2/15/42 | 500 | 521 | |
| New York State Dormitory Authority Income Tax Revenue | 5.000% | 2/15/42 | 1,500 | 1,542 | |
| New York State Dormitory Authority Income Tax Revenue | 4.000% | 3/15/42 | 7,500 | 7,434 | |
| New York State Dormitory Authority Income Tax Revenue | 4.000% | 3/15/42 | 670 | 664 | |
| New York State Dormitory Authority Income Tax Revenue | 5.000% | 2/15/43 | 2,490 | 2,593 | |
| New York State Dormitory Authority Income Tax Revenue | 4.000% | 3/15/44 | 5,150 | 5,060 | |
| New York State Dormitory Authority Income Tax Revenue | 4.000% | 3/15/44 | 5,620 | 5,522 | |
| New York State Dormitory Authority Income Tax Revenue | 4.000% | 3/15/46 | 7,020 | 6,825 | |
| New York State Dormitory Authority Income Tax Revenue | 4.000% | 3/15/47 | 5,000 | 4,855 | |
| New York State Dormitory Authority Income Tax Revenue | 5.000% | 2/15/48 | 4,125 | 4,345 | |
| New York State Dormitory Authority Income Tax Revenue | 3.000% | 2/15/49 | 3,000 | 2,234 | |
| New York State Dormitory Authority Income Tax Revenue | 4.000% | 3/15/49 | 4,125 | 3,981 | |
| New York State Dormitory Authority Income Tax Revenue | 3.000% | 3/15/50 | 4,000 | 2,954 | |
| New York State Dormitory Authority Income Tax Revenue, Prere. | 5.000% | 2/15/24 | 15 | 15 | |
| New York State Dormitory Authority Income Tax Revenue, Prere. | 4.000% | 2/15/27 | 15 | 16 | |
| New York State Dormitory Authority Income Tax Revenue, Prere. | 5.000% | 9/15/28 | 10 | 11 | |
| New York State Dormitory Authority Intergovernmental Agreement Revenue | 5.000% | 10/1/27 | 2,700 | 2,827 | |
| New York State Dormitory Authority Intergovernmental Agreement Revenue | 5.000% | 3/15/29 | 4,870 | 5,412 | |
| New York State Dormitory Authority Intergovernmental Agreement Revenue | 5.000% | 9/15/30 | 5,000 | 5,656 | |
| New York State Dormitory Authority Intergovernmental Agreement Revenue | 5.000% | 9/15/33 | 10,000 | 11,805 | |
| 1 | New York State Dormitory Authority Intergovernmental Agreement Revenue | 5.000% | 10/1/33 | 1,285 | 1,398 |
| New York State Dormitory Authority Intergovernmental Agreement Revenue | 5.000% | 4/1/34 | 1,290 | 1,401 | |
| New York State Dormitory Authority Intergovernmental Agreement Revenue | 5.000% | 10/1/34 | 1,175 | 1,275 | |
| New York State Dormitory Authority Intergovernmental Agreement Revenue | 4.000% | 4/1/35 | 1,055 | 1,073 | |
| New York State Dormitory Authority Intergovernmental Agreement Revenue | 4.000% | 10/1/35 | 645 | 655 | |
| 2 | New York State Dormitory Authority Intergovernmental Agreement Revenue | 5.000% | 10/1/37 | 4,160 | 4,610 |
| New York State Dormitory Authority Intergovernmental Agreement Revenue | 5.000% | 3/15/40 | 5,000 | 5,415 |
| Coupon | Maturity Date | Face Amount ($000) | Market Value• ($000) | ||
| New York State Dormitory Authority Intergovernmental Agreement Revenue | 5.000% | 3/15/42 | 5,000 | 5,366 | |
| New York State Dormitory Authority Intergovernmental Agreement Revenue | 4.000% | 3/15/43 | 2,000 | 1,978 | |
| New York State Dormitory Authority Intergovernmental Agreement Revenue | 5.250% | 3/15/44 | 5,000 | 5,406 | |
| New York State Dormitory Authority Intergovernmental Agreement Revenue | 4.000% | 3/15/49 | 4,665 | 4,502 | |
| New York State Dormitory Authority Intergovernmental Agreement Revenue | 4.000% | 7/1/52 | 3,435 | 3,103 | |
| 1 | New York State Dormitory Authority Intergovernmental Agreement Revenue (School District Revenue Bond Financing Program) | 5.000% | 10/1/26 | 3,115 | 3,294 |
| 1 | New York State Dormitory Authority Intergovernmental Agreement Revenue (School District Revenue Bond Financing Program) | 5.000% | 10/1/40 | 1,000 | 1,103 |
| 1 | New York State Dormitory Authority Intergovernmental Agreement Revenue (School District Revenue Bond Financing Program) | 5.000% | 10/1/41 | 1,950 | 2,142 |
| 1 | New York State Dormitory Authority Intergovernmental Agreement Revenue (School District Revenue Bond Financing Program) | 5.000% | 10/1/42 | 835 | 912 |
| 1 | New York State Dormitory Authority Intergovernmental Agreement Revenue (School District Revenue Bond Financing Program) | 5.000% | 10/1/43 | 505 | 549 |
| New York State Dormitory Authority Intergovernmental Agreement Revenue (School Districts Bond Financing Program) | 5.000% | 10/1/31 | 2,015 | 2,116 | |
| New York State Dormitory Authority Intergovernmental Agreement Revenue (School Districts Bond Financing Program) | 5.000% | 10/1/33 | 600 | 626 | |
| 1 | New York State Dormitory Authority Intergovernmental Agreement Revenue (School Districts Bond Financing Program) | 4.000% | 10/1/34 | 1,125 | 1,155 |
| New York State Dormitory Authority Intergovernmental Agreement Revenue (School Districts Bond Financing Program) | 5.000% | 10/1/34 | 520 | 542 | |
| 1 | New York State Dormitory Authority Intergovernmental Agreement Revenue (School Districts Bond Financing Program) | 4.000% | 10/1/35 | 900 | 919 |
| New York State Dormitory Authority Intergovernmental Agreement Revenue (School Districts Bond Financing Program) | 5.000% | 10/1/26 | 1,425 | 1,507 | |
| New York State Dormitory Authority Lease (Appropriation) Revenue | 5.000% | 1/15/30 | 1,535 | 1,661 | |
| New York State Dormitory Authority Lease (Appropriation) Revenue | 5.000% | 1/15/31 | 5,000 | 5,405 | |
| New York State Dormitory Authority Lease (Appropriation) Revenue | 4.000% | 3/15/41 | 5,260 | 5,250 | |
| New York State Dormitory Authority Lease (Appropriation) Revenue | 4.000% | 3/15/43 | 10,415 | 10,270 | |
| New York State Dormitory Authority Lease (Appropriation) Revenue | 4.000% | 3/15/47 | 7,415 | 7,200 | |
| 1 | New York State Dormitory Authority Lease Revenue, Prere. | 5.000% | 10/1/28 | 5 | 6 |
| New York State Dormitory Authority Local or Guaranteed Housing Revenue | 5.000% | 7/1/28 | 1,500 | 1,646 | |
| New York State Dormitory Authority Local or Guaranteed Housing Revenue | 5.000% | 7/1/29 | 1,500 | 1,674 | |
| New York State Dormitory Authority Local or Guaranteed Housing Revenue | 5.000% | 7/1/29 | 1,225 | 1,367 | |
| New York State Dormitory Authority Local or Guaranteed Housing Revenue | 5.000% | 7/1/33 | 3,048 | 3,465 | |
| New York State Dormitory Authority Local or Guaranteed Housing Revenue | 4.000% | 7/1/37 | 800 | 805 |
| Coupon | Maturity Date | Face Amount ($000) | Market Value• ($000) | ||
| New York State Dormitory Authority Local or Guaranteed Housing Revenue | 5.000% | 7/1/48 | 2,200 | 2,327 | |
| New York State Dormitory Authority Sales Tax Revenue | 5.000% | 3/15/30 | 400 | 432 | |
| New York State Dormitory Authority Sales Tax Revenue | 5.000% | 3/15/31 | 4,865 | 5,160 | |
| New York State Dormitory Authority Sales Tax Revenue | 5.000% | 3/15/33 | 300 | 326 | |
| New York State Dormitory Authority Sales Tax Revenue | 5.000% | 3/15/35 | 5,000 | 5,365 | |
| New York State Dormitory Authority Sales Tax Revenue | 5.000% | 3/15/36 | 2,305 | 2,402 | |
| New York State Dormitory Authority Sales Tax Revenue | 5.000% | 3/15/36 | 1,000 | 1,044 | |
| New York State Dormitory Authority Sales Tax Revenue | 5.000% | 3/15/36 | 6,700 | 7,165 | |
| New York State Dormitory Authority Sales Tax Revenue | 5.000% | 3/15/37 | 3,600 | 3,741 | |
| New York State Dormitory Authority Sales Tax Revenue | 5.000% | 3/15/37 | 2,000 | 2,128 | |
| New York State Dormitory Authority Sales Tax Revenue | 5.000% | 3/15/38 | 5,000 | 5,285 | |
| New York State Dormitory Authority Sales Tax Revenue | 5.000% | 3/15/38 | 4,500 | 4,784 | |
| New York State Dormitory Authority Sales Tax Revenue | 5.000% | 3/15/39 | 6,000 | 6,205 | |
| New York State Dormitory Authority Sales Tax Revenue | 5.000% | 3/15/39 | 5,000 | 5,272 | |
| New York State Dormitory Authority Sales Tax Revenue | 5.000% | 3/15/39 | 1,250 | 1,325 | |
| New York State Dormitory Authority Sales Tax Revenue | 5.000% | 3/15/40 | 1,900 | 2,010 | |
| New York State Dormitory Authority Sales Tax Revenue | 5.000% | 3/15/42 | 6,500 | 6,691 | |
| New York State Dormitory Authority Sales Tax Revenue | 5.000% | 3/15/42 | 1,195 | 1,252 | |
| New York State Dormitory Authority Sales Tax Revenue | 5.000% | 3/15/43 | 4,085 | 4,202 | |
| New York State Dormitory Authority Sales Tax Revenue | 5.000% | 3/15/44 | 12,830 | 13,414 | |
| New York State Dormitory Authority Sales Tax Revenue | 4.000% | 3/15/47 | 1,475 | 1,432 | |
| New York State Energy Research & Development Authority Natural Gas Revenue | 4.000% | 4/1/34 | 10,715 | 10,724 | |
| New York State Environmental Facilities Corp. Miscellaneous Revenue | 4.000% | 8/15/51 | 1,500 | 1,447 | |
| New York State Environmental Facilities Corp. Water Revenue | 5.000% | 6/15/28 | 2,455 | 2,709 | |
| New York State Environmental Facilities Corp. Water Revenue | 5.000% | 8/15/34 | 1,000 | 1,073 | |
| New York State Environmental Facilities Corp. Water Revenue | 5.000% | 8/15/36 | 1,000 | 1,065 | |
| New York State Environmental Facilities Corp. Water Revenue | 4.000% | 6/15/37 | 5,610 | 5,684 | |
| New York State Environmental Facilities Corp. Water Revenue | 5.000% | 6/15/41 | 3,000 | 3,086 | |
| New York State Environmental Facilities Corp. Water Revenue | 5.000% | 6/15/42 | 11,310 | 11,834 | |
| New York State Environmental Facilities Corp. Water Revenue | 4.000% | 6/15/46 | 1,475 | 1,446 | |
| New York State Environmental Facilities Corp. Water Revenue | 4.000% | 6/15/47 | 5,000 | 4,881 | |
| New York State Environmental Facilities Corp. Water Revenue | 5.250% | 9/15/52 | 5,000 | 5,468 | |
| 11 | New York State Environmental Facilities Corp. Water Revenue | 5.000% | 9/15/53 | 5,000 | 5,365 |
| New York State Housing Finance Agency Local or Guaranteed Housing Revenue | 0.950% | 5/1/25 | 3,625 | 3,436 | |
| New York State Housing Finance Agency Local or Guaranteed Housing Revenue | 3.250% | 11/1/31 | 1,105 | 1,051 | |
| New York State Housing Finance Agency Local or Guaranteed Housing Revenue | 3.650% | 11/1/32 | 1,000 | 978 | |
| New York State Housing Finance Agency Local or Guaranteed Housing Revenue | 3.625% | 11/1/33 | 2,340 | 2,313 | |
| New York State Housing Finance Agency Local or Guaranteed Housing Revenue | 2.750% | 11/1/34 | 1,250 | 1,084 | |
| New York State Housing Finance Agency Local or Guaranteed Housing Revenue | 2.850% | 11/1/39 | 745 | 606 | |
| New York State Housing Finance Agency Local or Guaranteed Housing Revenue | 3.550% | 11/1/39 | 1,000 | 873 | |
| New York State Housing Finance Agency Local or Guaranteed Housing Revenue | 2.350% | 11/1/40 | 4,300 | 3,043 | |
| New York State Housing Finance Agency Local or Guaranteed Housing Revenue | 3.450% | 11/1/40 | 1,535 | 1,310 | |
| 5 | New York State Housing Finance Agency Local or Guaranteed Housing Revenue | 4.625% | 11/1/42 | 600 | 615 |
| Coupon | Maturity Date | Face Amount ($000) | Market Value• ($000) | ||
| New York State Housing Finance Agency Local or Guaranteed Housing Revenue | 3.850% | 11/1/43 | 1,140 | 1,018 | |
| New York State Housing Finance Agency Local or Guaranteed Housing Revenue | 3.850% | 11/1/43 | 2,270 | 1,995 | |
| New York State Housing Finance Agency Local or Guaranteed Housing Revenue | 4.700% | 11/1/43 | 1,945 | 2,001 | |
| New York State Housing Finance Agency Local or Guaranteed Housing Revenue | 3.000% | 11/1/44 | 1,485 | 1,113 | |
| 5 | New York State Housing Finance Agency Local or Guaranteed Housing Revenue | 2.500% | 11/1/45 | 4,990 | 3,513 |
| New York State Housing Finance Agency Local or Guaranteed Housing Revenue | 2.550% | 11/1/46 | 2,545 | 1,785 | |
| New York State Housing Finance Agency Local or Guaranteed Housing Revenue | 2.600% | 11/1/46 | 3,955 | 2,791 | |
| New York State Housing Finance Agency Local or Guaranteed Housing Revenue | 2.650% | 11/1/46 | 2,000 | 1,428 | |
| 5 | New York State Housing Finance Agency Local or Guaranteed Housing Revenue | 4.800% | 11/1/47 | 750 | 768 |
| New York State Housing Finance Agency Local or Guaranteed Housing Revenue | 3.875% | 11/1/48 | 2,435 | 2,039 | |
| New York State Housing Finance Agency Local or Guaranteed Housing Revenue | 3.875% | 11/1/48 | 1,480 | 1,239 | |
| New York State Housing Finance Agency Local or Guaranteed Housing Revenue | 3.900% | 11/1/48 | 1,345 | 1,155 | |
| New York State Housing Finance Agency Local or Guaranteed Housing Revenue | 4.050% | 11/1/48 | 2,300 | 2,106 | |
| New York State Housing Finance Agency Local or Guaranteed Housing Revenue | 4.650% | 11/1/48 | 1,000 | 997 | |
| New York State Housing Finance Agency Local or Guaranteed Housing Revenue | 3.050% | 11/1/49 | 13,655 | 9,817 | |
| New York State Housing Finance Agency Local or Guaranteed Housing Revenue | 3.375% | 11/1/49 | 5,000 | 3,820 | |
| New York State Housing Finance Agency Local or Guaranteed Housing Revenue | 2.600% | 11/1/50 | 1,000 | 661 | |
| New York State Housing Finance Agency Local or Guaranteed Housing Revenue | 2.650% | 11/1/51 | 1,230 | 816 | |
| New York State Housing Finance Agency Local or Guaranteed Housing Revenue | 2.730% | 11/1/51 | 3,790 | 2,566 | |
| New York State Housing Finance Agency Local or Guaranteed Housing Revenue | 3.050% | 11/1/52 | 3,395 | 2,341 | |
| New York State Housing Finance Agency Local or Guaranteed Housing Revenue | 2.650% | 11/1/54 | 2,895 | 1,853 | |
| 5 | New York State Housing Finance Agency Local or Guaranteed Housing Revenue | 2.650% | 11/1/54 | 1,500 | 960 |
| New York State Housing Finance Agency Local or Guaranteed Housing Revenue | 3.150% | 11/1/54 | 4,000 | 2,765 | |
| New York State Housing Finance Agency Local or Guaranteed Housing Revenue | 2.750% | 11/1/56 | 770 | 491 | |
| New York State Housing Finance Agency Local or Guaranteed Housing Revenue | 2.875% | 11/1/56 | 3,165 | 2,092 | |
| 5 | New York State Housing Finance Agency Local or Guaranteed Housing Revenue | 4.300% | 11/1/57 | 3,000 | 2,803 |
| New York State Housing Finance Agency Local or Guaranteed Housing Revenue | 3.000% | 11/1/61 | 1,500 | 967 | |
| New York State Housing Finance Agency Local or Guaranteed Housing Revenue PUT | 2.500% | 5/1/27 | 1,275 | 1,220 | |
| 5 | New York State Housing Finance Agency Local or Guaranteed Housing Revenue PUT | 3.450% | 5/1/27 | 1,195 | 1,196 |
| Coupon | Maturity Date | Face Amount ($000) | Market Value• ($000) | ||
| New York State Housing Finance Agency Local or Guaranteed Housing Revenue PUT | 3.600% | 5/1/27 | 8,505 | 8,506 | |
| 5 | New York State Housing Finance Agency Local or Guaranteed Housing Revenue PUT | 3.100% | 11/1/27 | 1,125 | 1,123 |
| New York State Housing Finance Agency Local or Guaranteed Housing Revenue PUT | 3.650% | 11/1/28 | 5,140 | 5,089 | |
| New York State Housing Finance Agency Local or Guaranteed Housing Revenue PUT | 4.500% | 11/1/28 | 3,000 | 3,044 | |
| New York State Housing Finance Agency Local or Guaranteed Housing Revenue PUT | 3.800% | 5/1/29 | 7,000 | 7,003 | |
| New York State Thruway Authority Highway Revenue | 5.000% | 1/1/29 | 1,220 | 1,251 | |
| New York State Thruway Authority Highway Revenue | 5.000% | 1/1/30 | 1,700 | 1,743 | |
| New York State Thruway Authority Highway Revenue | 5.000% | 1/1/31 | 2,900 | 2,972 | |
| New York State Thruway Authority Highway Revenue | 5.000% | 1/1/32 | 5,155 | 5,233 | |
| New York State Thruway Authority Highway Revenue | 5.000% | 1/1/32 | 7,920 | 8,116 | |
| New York State Thruway Authority Highway Revenue | 5.000% | 1/1/33 | 1,800 | 1,932 | |
| New York State Thruway Authority Highway Revenue | 5.000% | 1/1/33 | 2,560 | 2,622 | |
| New York State Thruway Authority Highway Revenue | 5.000% | 1/1/34 | 2,185 | 2,343 | |
| New York State Thruway Authority Highway Revenue | 5.000% | 1/1/35 | 3,100 | 3,319 | |
| New York State Thruway Authority Highway Revenue | 4.000% | 1/1/36 | 1,275 | 1,296 | |
| New York State Thruway Authority Highway Revenue | 4.000% | 1/1/38 | 150 | 150 | |
| 2 | New York State Thruway Authority Highway Revenue | 4.000% | 1/1/39 | 7,375 | 7,394 |
| 1 | New York State Thruway Authority Highway Revenue | 4.000% | 1/1/40 | 7,500 | 7,508 |
| New York State Thruway Authority Highway Revenue | 4.000% | 1/1/40 | 1,750 | 1,758 | |
| New York State Thruway Authority Highway Revenue | 4.000% | 1/1/41 | 4,435 | 4,344 | |
| New York State Thruway Authority Highway Revenue | 4.000% | 1/1/41 | 3,375 | 3,379 | |
| New York State Thruway Authority Highway Revenue | 4.000% | 1/1/42 | 5,000 | 4,982 | |
| New York State Thruway Authority Highway Revenue | 4.000% | 1/1/45 | 8,370 | 7,992 | |
| 1 | New York State Thruway Authority Highway Revenue | 4.000% | 1/1/45 | 3,575 | 3,520 |
| New York State Thruway Authority Highway Revenue | 4.000% | 1/1/45 | 4,000 | 3,917 | |
| 2 | New York State Thruway Authority Highway Revenue | 4.000% | 1/1/45 | 1,285 | 1,260 |
| New York State Thruway Authority Highway Revenue | 4.000% | 1/1/45 | 1,835 | 1,804 | |
| 1 | New York State Thruway Authority Highway Revenue | 3.000% | 1/1/46 | 425 | 328 |
| New York State Thruway Authority Highway Revenue | 3.000% | 1/1/46 | 1,000 | 750 | |
| New York State Thruway Authority Highway Revenue | 4.000% | 1/1/46 | 3,220 | 3,134 | |
| New York State Thruway Authority Highway Revenue | 4.000% | 1/1/48 | 5,000 | 4,838 | |
| New York State Thruway Authority Highway Revenue | 3.000% | 1/1/49 | 5,000 | 3,727 | |
| New York State Thruway Authority Highway Revenue | 4.000% | 1/1/50 | 15,000 | 13,802 | |
| 1 | New York State Thruway Authority Highway Revenue | 4.000% | 1/1/50 | 2,000 | 1,935 |
| New York State Thruway Authority Highway Revenue | 3.000% | 1/1/51 | 2,000 | 1,465 | |
| 1 | New York State Thruway Authority Highway Revenue | 3.000% | 1/1/53 | 3,480 | 2,527 |
| New York State Thruway Authority Highway Revenue | 3.000% | 1/1/53 | 2,585 | 1,807 | |
| New York State Thruway Authority Highway Revenue | 4.000% | 1/1/53 | 4,945 | 4,499 | |
| 1 | New York State Thruway Authority Highway Revenue | 4.000% | 1/1/53 | 2,000 | 1,918 |
| New York State Thruway Authority Income Tax Revenue | 5.000% | 3/15/42 | 2,000 | 2,190 | |
| New York State Thruway Authority Income Tax Revenue | 4.000% | 3/15/43 | 2,500 | 2,501 | |
| New York State Thruway Authority Income Tax Revenue | 5.000% | 3/15/48 | 4,000 | 4,294 | |
| New York State Thruway Authority Income Tax Revenue | 4.000% | 3/15/50 | 3,635 | 3,555 | |
| New York State Thruway Authority Income Tax Revenue | 5.000% | 3/15/55 | 10,000 | 10,666 | |
| New York State Thruway Authority Income Tax Revenue | 4.125% | 3/15/56 | 8,920 | 8,743 | |
| New York State Thruway Authority Lease (Appropriation) Revenue | 4.000% | 3/15/40 | 5,200 | 5,236 | |
| New York State Thruway Authority Lease (Appropriation) Revenue | 4.000% | 3/15/41 | 3,000 | 3,014 | |
| New York State Thruway Authority Lease (Appropriation) Revenue | 4.000% | 3/15/43 | 1,360 | 1,360 | |
| New York State Thruway Authority Lease (Appropriation) Revenue | 4.000% | 3/15/46 | 5,165 | 5,103 | |
| New York State Thruway Authority Lease (Appropriation) Revenue | 3.000% | 3/15/48 | 3,000 | 2,253 | |
| New York State Thruway Authority Lease (Appropriation) Revenue | 3.000% | 3/15/49 | 6,365 | 4,735 |
| Coupon | Maturity Date | Face Amount ($000) | Market Value• ($000) | ||
| New York State Thruway Authority Lease (Appropriation) Revenue | 3.000% | 3/15/50 | 9,040 | 6,676 | |
| New York State Thruway Authority Lease (Appropriation) Revenue | 4.000% | 3/15/55 | 6,000 | 5,783 | |
| New York State Thruway Authority Lease (Appropriation) Revenue | 4.000% | 3/15/56 | 6,000 | 5,770 | |
| New York State Urban Development Corp. Income Tax Revenue | 5.000% | 3/15/31 | 3,410 | 3,546 | |
| New York State Urban Development Corp. Income Tax Revenue | 5.000% | 3/15/33 | 3,000 | 3,401 | |
| New York State Urban Development Corp. Income Tax Revenue | 4.000% | 3/15/34 | 3,000 | 3,106 | |
| New York State Urban Development Corp. Income Tax Revenue | 5.000% | 3/15/36 | 1,000 | 1,056 | |
| New York State Urban Development Corp. Income Tax Revenue | 4.000% | 3/15/39 | 2,885 | 2,894 | |
| New York State Urban Development Corp. Income Tax Revenue | 3.000% | 3/15/40 | 2,050 | 1,709 | |
| New York State Urban Development Corp. Income Tax Revenue | 4.000% | 3/15/41 | 5,000 | 4,972 | |
| New York State Urban Development Corp. Income Tax Revenue | 5.000% | 3/15/41 | 11,195 | 12,094 | |
| New York State Urban Development Corp. Income Tax Revenue | 5.000% | 3/15/42 | 1,810 | 1,891 | |
| New York State Urban Development Corp. Income Tax Revenue | 5.000% | 3/15/42 | 1,000 | 1,038 | |
| New York State Urban Development Corp. Income Tax Revenue | 5.000% | 3/15/42 | 1,255 | 1,350 | |
| New York State Urban Development Corp. Income Tax Revenue | 5.000% | 3/15/43 | 5,900 | 6,158 | |
| New York State Urban Development Corp. Income Tax Revenue | 4.000% | 3/15/45 | 3,000 | 2,938 | |
| New York State Urban Development Corp. Income Tax Revenue | 3.000% | 3/15/48 | 4,750 | 3,583 | |
| New York State Urban Development Corp. Income Tax Revenue | 3.000% | 3/15/48 | 1,800 | 1,358 | |
| New York State Urban Development Corp. Intergovernmental Agreement Revenue | 5.000% | 3/15/41 | 10,200 | 11,358 | |
| New York State Urban Development Corp. Intergovernmental Agreement Revenue | 5.000% | 3/15/43 | 5,875 | 6,474 | |
| New York State Urban Development Corp. Intergovernmental Agreement Revenue | 5.000% | 3/15/50 | 5,050 | 5,452 | |
| New York State Urban Development Corp. Intergovernmental Agreement Revenue | 5.000% | 3/15/51 | 2,405 | 2,596 | |
| New York State Urban Development Corp. Intergovernmental Agreement Revenue | 5.000% | 3/15/53 | 6,710 | 7,232 | |
| New York State Urban Development Corp. Lease (Appropriation) Revenue | 5.000% | 3/15/35 | 1,490 | 1,639 | |
| New York State Urban Development Corp. Lease (Appropriation) Revenue | 4.000% | 3/15/38 | 505 | 508 | |
| New York State Urban Development Corp. Lease (Appropriation) Revenue | 5.000% | 3/15/39 | 1,340 | 1,432 | |
| New York State Urban Development Corp. Lease (Appropriation) Revenue | 5.000% | 3/15/40 | 925 | 984 | |
| New York State Urban Development Corp. Lease (Appropriation) Revenue | 3.000% | 3/15/42 | 5,000 | 4,026 | |
| New York State Urban Development Corp. Lease (Appropriation) Revenue | 4.000% | 3/15/43 | 11,295 | 11,094 | |
| New York State Urban Development Corp. Lease (Appropriation) Revenue | 4.000% | 3/15/45 | 10,320 | 10,035 | |
| New York State Urban Development Corp. Lease (Appropriation) Revenue | 4.000% | 3/15/46 | 2,745 | 2,665 | |
| New York State Urban Development Corp. Lease (Appropriation) Revenue | 4.000% | 3/15/46 | 2,500 | 2,427 | |
| New York State Urban Development Corp. Lease (Appropriation) Revenue | 4.000% | 3/15/47 | 7,500 | 7,261 | |
| New York State Urban Development Corp. Lease (Appropriation) Revenue | 3.000% | 3/15/49 | 1,725 | 1,281 | |
| New York State Urban Development Corp. Lease (Appropriation) Revenue | 3.000% | 3/15/50 | 5,150 | 3,803 | |
| New York State Urban Development Corp. Lease (Appropriation) Revenue | 2.625% | 3/15/51 | 2,000 | 1,331 | |
| New York Transportation Development Corp. Port, Airport & Marina Revenue | 5.000% | 12/1/26 | 750 | 784 | |
| New York Transportation Development Corp. Port, Airport & Marina Revenue | 5.000% | 12/1/29 | 1,210 | 1,300 |
| Coupon | Maturity Date | Face Amount ($000) | Market Value• ($000) | ||
| New York Transportation Development Corp. Port, Airport & Marina Revenue | 5.000% | 12/1/30 | 1,000 | 1,084 | |
| New York Transportation Development Corp. Port, Airport & Marina Revenue | 5.000% | 12/1/33 | 4,655 | 5,003 | |
| New York Transportation Development Corp. Port, Airport & Marina Revenue | 5.000% | 12/1/35 | 2,505 | 2,671 | |
| New York Transportation Development Corp. Port, Airport & Marina Revenue | 4.000% | 12/1/39 | 3,940 | 3,824 | |
| New York Transportation Development Corp. Port, Airport & Marina Revenue | 4.000% | 12/1/41 | 3,295 | 3,124 | |
| New York Transportation Development Corp. Port, Airport & Marina Revenue | 4.000% | 12/1/42 | 4,920 | 4,643 | |
| Niagara Area Development Corp. Health, Hospital, Nursing Home Revenue | 4.500% | 7/1/52 | 3,795 | 2,735 | |
| 3,4 | Niagara Country Industrial Development Agency Multi Family Housing Local or Guaranteed Housing Revenue TOB VRDO | 3.470% | 12/1/23 | 12,800 | 12,800 |
| 3,4 | Niagara Country Industrial Development Agency Multi Family Housing Local or Guaranteed Housing Revenue TOB VRDO | 3.470% | 12/1/23 | 18,880 | 18,880 |
| Oneida County Local Development Corp. College & University Revenue (Hamilton College Project) | 5.000% | 7/1/51 | 2,000 | 2,197 | |
| Oneida County Local Development Corp. College & University Revenue (Utica College Project) | 4.000% | 7/1/39 | 1,250 | 1,131 | |
| 1 | Oneida County Local Development Corp. Health, Hospital, Nursing Home Revenue | 4.000% | 12/1/34 | 1,000 | 1,002 |
| 1 | Oneida County Local Development Corp. Health, Hospital, Nursing Home Revenue | 4.000% | 12/1/35 | 1,000 | 999 |
| 1 | Oneida County Local Development Corp. Health, Hospital, Nursing Home Revenue | 3.000% | 12/1/51 | 5,000 | 3,443 |
| Onondaga Civic Development Corp. College & University Revenue (Le Moyne College Project) | 5.000% | 7/1/28 | 450 | 459 | |
| Onondaga Civic Development Corp. College & University Revenue (Le Moyne College Project) | 5.000% | 7/1/29 | 475 | 484 | |
| Onondaga Civic Development Corp. College & University Revenue (Le Moyne College Project) | 5.000% | 7/1/30 | 450 | 458 | |
| Onondaga Civic Development Corp. College & University Revenue (Le Moyne College Project) | 5.000% | 7/1/31 | 690 | 735 | |
| Onondaga Civic Development Corp. College & University Revenue (Le Moyne College Project) | 5.000% | 1/1/32 | 510 | 529 | |
| Onondaga Civic Development Corp. College & University Revenue (Le Moyne College Project) | 5.000% | 1/1/33 | 540 | 559 | |
| Onondaga Civic Development Corp. College & University Revenue (Le Moyne College Project) | 5.000% | 7/1/33 | 575 | 584 | |
| Onondaga Civic Development Corp. College & University Revenue (Le Moyne College Project) | 5.000% | 7/1/33 | 300 | 315 | |
| Onondaga Civic Development Corp. College & University Revenue (Le Moyne College Project) | 5.000% | 1/1/34 | 565 | 585 | |
| Onondaga Civic Development Corp. College & University Revenue (Le Moyne College Project) | 4.000% | 7/1/34 | 330 | 323 | |
| Onondaga Civic Development Corp. College & University Revenue (Le Moyne College Project) | 5.000% | 7/1/34 | 300 | 315 | |
| Onondaga Civic Development Corp. College & University Revenue (Le Moyne College Project) | 5.000% | 1/1/35 | 595 | 615 | |
| Onondaga Civic Development Corp. College & University Revenue (Le Moyne College Project) | 5.000% | 7/1/35 | 635 | 644 | |
| Onondaga Civic Development Corp. College & University Revenue (Le Moyne College Project) | 5.000% | 7/1/35 | 410 | 429 | |
| Onondaga Civic Development Corp. College & University Revenue (Le Moyne College Project) | 5.000% | 1/1/36 | 625 | 645 |
| Coupon | Maturity Date | Face Amount ($000) | Market Value• ($000) | ||
| Onondaga Civic Development Corp. College & University Revenue (Le Moyne College Project) | 4.000% | 7/1/36 | 435 | 417 | |
| Onondaga Civic Development Corp. College & University Revenue (Le Moyne College Project) | 4.000% | 7/1/36 | 350 | 336 | |
| Onondaga Civic Development Corp. College & University Revenue (Le Moyne College Project) | 5.000% | 1/1/37 | 355 | 364 | |
| Onondaga Civic Development Corp. College & University Revenue (Le Moyne College Project) | 4.000% | 7/1/37 | 300 | 283 | |
| Onondaga Civic Development Corp. College & University Revenue (Le Moyne College Project) | 5.000% | 1/1/38 | 285 | 290 | |
| Onondaga Civic Development Corp. College & University Revenue (Le Moyne College Project) | 4.000% | 7/1/38 | 275 | 254 | |
| Onondaga Civic Development Corp. College & University Revenue (Le Moyne College Project) | 4.000% | 7/1/38 | 200 | 185 | |
| Onondaga Civic Development Corp. College & University Revenue (Le Moyne College Project) | 4.000% | 7/1/39 | 350 | 320 | |
| Onondaga Civic Development Corp. College & University Revenue (Le Moyne College Project) | 4.000% | 7/1/39 | 500 | 457 | |
| Onondaga Civic Development Corp. College & University Revenue (Le Moyne College Project) | 4.000% | 7/1/40 | 300 | 271 | |
| Onondaga Civic Development Corp. College & University Revenue (Le Moyne College Project) | 4.000% | 7/1/41 | 250 | 224 | |
| Onondaga Civic Development Corp. College & University Revenue (Le Moyne College Project) | 4.000% | 7/1/42 | 530 | 468 | |
| Onondaga Civic Development Corp. College & University Revenue (Le Moyne College Project) | 5.000% | 7/1/46 | 500 | 500 | |
| Onondaga Civic Development Corp. College & University Revenue (Le Moyne College Project) | 5.000% | 7/1/51 | 725 | 714 | |
| Onondaga Civic Development Corp. Health, Hospital, Nursing Home Revenue | 5.500% | 3/1/24 | 670 | 668 | |
| Onondaga Civic Development Corp. Health, Hospital, Nursing Home Revenue | 5.250% | 3/1/31 | 4,940 | 4,401 | |
| Onondaga County NY GO | 4.000% | 6/15/43 | 550 | 554 | |
| Onondaga County Trust for Cultural Resources College & University Revenue (Syracuse University Project) | 4.000% | 12/1/41 | 700 | 705 | |
| Onondaga County Trust for Cultural Resources College & University Revenue (Syracuse University Project) | 5.000% | 12/1/43 | 4,405 | 4,692 | |
| Onondaga County Trust for Cultural Resources College & University Revenue (Syracuse University Project) | 5.000% | 12/1/45 | 2,000 | 2,122 | |
| Onondaga County Trust for Cultural Resources College & University Revenue (Syracuse University Project), Prere. | 5.000% | 12/1/23 | 1,000 | 1,000 | |
| Onondaga County Trust for Cultural Resources Local or Guaranteed Housing Revenue (Abby Lane Housing Corp. Project) | 5.000% | 5/1/35 | 1,140 | 1,155 | |
| Onondaga County Trust for Cultural Resources Local or Guaranteed Housing Revenue (Abby Lane Housing Corp. Project) | 5.000% | 5/1/36 | 1,475 | 1,492 | |
| Onondaga County Trust for Cultural Resources Local or Guaranteed Housing Revenue (Abby Lane Housing Corp. Project) | 5.000% | 5/1/40 | 2,200 | 2,214 | |
| Onondaga County Water Authority Water Revenue | 2.500% | 9/15/51 | 1,510 | 1,024 | |
| Port Authority of New York & New Jersey Port, Airport & Marina Revenue | 5.000% | 12/1/27 | 3,000 | 3,252 | |
| Port Authority of New York & New Jersey Port, Airport & Marina Revenue | 5.000% | 12/1/28 | 3,000 | 3,305 | |
| Port Authority of New York & New Jersey Port, Airport & Marina Revenue | 5.000% | 11/15/35 | 4,275 | 4,564 | |
| Port Authority of New York & New Jersey Port, Airport & Marina Revenue | 4.000% | 7/15/36 | 3,400 | 3,461 |
| Coupon | Maturity Date | Face Amount ($000) | Market Value• ($000) | ||
| Port Authority of New York & New Jersey Port, Airport & Marina Revenue | 5.000% | 12/1/37 | 1,335 | 1,502 | |
| Port Authority of New York & New Jersey Port, Airport & Marina Revenue | 5.000% | 12/1/38 | 1,470 | 1,644 | |
| Port Authority of New York & New Jersey Port, Airport & Marina Revenue | 5.000% | 12/1/39 | 1,640 | 1,822 | |
| Port Authority of New York & New Jersey Port, Airport & Marina Revenue | 5.000% | 5/1/40 | 3,000 | 3,047 | |
| Port Authority of New York & New Jersey Port, Airport & Marina Revenue | 4.000% | 7/15/40 | 485 | 488 | |
| Port Authority of New York & New Jersey Port, Airport & Marina Revenue | 5.000% | 12/1/40 | 1,000 | 1,105 | |
| Port Authority of New York & New Jersey Port, Airport & Marina Revenue | 4.000% | 7/15/41 | 2,250 | 2,259 | |
| Port Authority of New York & New Jersey Port, Airport & Marina Revenue | 5.000% | 10/15/41 | 10,180 | 10,389 | |
| Port Authority of New York & New Jersey Port, Airport & Marina Revenue | 5.000% | 7/15/42 | 3,325 | 3,621 | |
| Port Authority of New York & New Jersey Port, Airport & Marina Revenue | 5.000% | 12/1/42 | 800 | 874 | |
| Port Authority of New York & New Jersey Port, Airport & Marina Revenue | 5.000% | 7/15/43 | 6,270 | 6,805 | |
| Port Authority of New York & New Jersey Port, Airport & Marina Revenue | 4.000% | 9/1/43 | 4,225 | 4,205 | |
| Port Authority of New York & New Jersey Port, Airport & Marina Revenue | 4.500% | 8/1/45 | 1,000 | 1,032 | |
| Port Authority of New York & New Jersey Port, Airport & Marina Revenue | 4.000% | 7/15/51 | 2,785 | 2,705 | |
| Port Authority of New York & New Jersey Port, Airport & Marina Revenue | 5.000% | 1/15/52 | 5,000 | 5,329 | |
| Port Authority of New York & New Jersey Port, Airport & Marina Revenue | 5.250% | 8/1/52 | 5,000 | 5,440 | |
| Port Authority of New York & New Jersey Port, Airport & Marina Revenue | 5.000% | 7/15/53 | 5,710 | 6,097 | |
| Port Authority of New York & New Jersey Port, Airport & Marina Revenue | 5.000% | 7/15/56 | 5,000 | 5,269 | |
| Port Authority of New York & New Jersey Port, Airport & Marina Revenue | 5.250% | 11/15/57 | 4,000 | 4,151 | |
| Port Authority of New York & New Jersey Port, Airport & Marina Revenue | 4.000% | 7/15/61 | 5,000 | 4,732 | |
| Rockland County NY GO | 4.000% | 4/1/24 | 240 | 241 | |
| Rockland County NY GO | 4.000% | 4/1/25 | 255 | 258 | |
| Rockland County NY GO | 4.000% | 4/1/26 | 265 | 271 | |
| Rockland County NY GO | 4.000% | 4/1/27 | 270 | 280 | |
| Rockland County NY GO | 4.000% | 4/1/28 | 285 | 299 | |
| Rockland County NY GO | 4.000% | 4/1/29 | 300 | 317 | |
| Rockland County NY GO | 4.000% | 4/1/30 | 310 | 330 | |
| Rockland County NY GO | 4.000% | 4/1/32 | 335 | 353 | |
| 1 | Rockland County NY GO | 3.000% | 6/15/32 | 2,815 | 2,736 |
| Rockland County NY GO | 4.000% | 4/1/35 | 385 | 399 | |
| Rockland County NY GO | 4.000% | 4/1/36 | 410 | 422 | |
| Sales Tax Asset Receivable Corp. Sales Tax Revenue, Prere. | 5.000% | 10/15/24 | 10 | 10 | |
| Sales Tax Asset Receivable Corp. Sales Tax Revenue, Prere. | 5.000% | 10/15/24 | 65 | 66 | |
| Saratoga County Capital Resource Corp. College & University Revenue (Skidmore College Project) | 5.000% | 7/1/32 | 220 | 238 | |
| Saratoga County Capital Resource Corp. College & University Revenue (Skidmore College Project) | 5.000% | 7/1/33 | 175 | 189 |
| Coupon | Maturity Date | Face Amount ($000) | Market Value• ($000) | ||
| Saratoga County Capital Resource Corp. College & University Revenue (Skidmore College Project) | 5.000% | 7/1/34 | 225 | 243 | |
| Saratoga County Capital Resource Corp. College & University Revenue (Skidmore College Project) | 5.000% | 7/1/35 | 225 | 242 | |
| Saratoga County Capital Resource Corp. College & University Revenue (Skidmore College Project) | 3.000% | 7/1/38 | 610 | 521 | |
| Saratoga County Capital Resource Corp. College & University Revenue (Skidmore College Project) | 4.000% | 7/1/38 | 1,440 | 1,444 | |
| Saratoga County Capital Resource Corp. College & University Revenue (Skidmore College Project) | 3.000% | 7/1/39 | 2,635 | 2,199 | |
| Saratoga County Capital Resource Corp. College & University Revenue (Skidmore College Project) | 3.000% | 7/1/40 | 2,110 | 1,722 | |
| Schenectady County Capital Resource Corp. College & University Revenue (Union College Project) | 5.000% | 7/1/32 | 1,000 | 1,145 | |
| Schenectady County Capital Resource Corp. College & University Revenue (Union College Project) | 5.250% | 7/1/52 | 1,000 | 1,080 | |
| 1 | Schenectady NY GO | 3.000% | 5/1/31 | 635 | 618 |
| St. Lawrence County Industrial Development Agency College & University Revenue | 5.000% | 7/1/28 | 310 | 323 | |
| St. Lawrence County Industrial Development Agency College & University Revenue | 5.000% | 7/1/29 | 660 | 688 | |
| St. Lawrence County Industrial Development Agency College & University Revenue | 5.000% | 7/1/31 | 450 | 467 | |
| St. Lawrence County Industrial Development Agency College & University Revenue | 5.000% | 7/1/34 | 830 | 861 | |
| St. Lawrence County Industrial Development Agency College & University Revenue | 5.000% | 7/1/35 | 1,510 | 1,564 | |
| St. Lawrence County Industrial Development Agency College & University Revenue | 5.000% | 7/1/36 | 545 | 563 | |
| St. Lawrence County Industrial Development Agency College & University Revenue (Clarkson University Project) | 5.000% | 9/1/29 | 100 | 106 | |
| St. Lawrence County Industrial Development Agency College & University Revenue (Clarkson University Project) | 5.000% | 9/1/30 | 75 | 80 | |
| St. Lawrence County Industrial Development Agency College & University Revenue (Clarkson University Project) | 5.000% | 9/1/30 | 285 | 303 | |
| St. Lawrence County Industrial Development Agency College & University Revenue (Clarkson University Project) | 5.000% | 9/1/31 | 100 | 107 | |
| St. Lawrence County Industrial Development Agency College & University Revenue (Clarkson University Project) | 5.000% | 9/1/31 | 275 | 294 | |
| St. Lawrence County Industrial Development Agency College & University Revenue (Clarkson University Project) | 5.000% | 9/1/32 | 100 | 106 | |
| St. Lawrence County Industrial Development Agency College & University Revenue (Clarkson University Project) | 5.000% | 9/1/32 | 265 | 282 | |
| St. Lawrence County Industrial Development Agency College & University Revenue (Clarkson University Project) | 5.000% | 9/1/33 | 100 | 106 | |
| St. Lawrence County Industrial Development Agency College & University Revenue (Clarkson University Project) | 5.000% | 9/1/33 | 250 | 265 | |
| St. Lawrence County Industrial Development Agency College & University Revenue (Clarkson University Project) | 5.000% | 9/1/34 | 150 | 159 | |
| St. Lawrence County Industrial Development Agency College & University Revenue (Clarkson University Project) | 5.000% | 9/1/34 | 250 | 265 | |
| Suffolk County Economic Development Corp. Health, Hospital, Nursing Home Revenue | 4.000% | 12/1/23 | 230 | 230 | |
| Suffolk County Economic Development Corp. Health, Hospital, Nursing Home Revenue | 4.000% | 12/1/24 | 250 | 248 | |
| Suffolk County Economic Development Corp. Health, Hospital, Nursing Home Revenue | 4.000% | 12/1/25 | 250 | 246 | |
| Suffolk County Economic Development Corp. Health, Hospital, Nursing Home Revenue | 5.000% | 7/1/28 | 1,500 | 1,510 |
| Coupon | Maturity Date | Face Amount ($000) | Market Value• ($000) | ||
| Suffolk County Economic Development Corp. Health, Hospital, Nursing Home Revenue | 5.000% | 7/1/29 | 3,000 | 3,017 | |
| Suffolk County Economic Development Corp. Health, Hospital, Nursing Home Revenue | 5.000% | 12/1/29 | 720 | 721 | |
| Suffolk County Economic Development Corp. Health, Hospital, Nursing Home Revenue | 5.000% | 12/1/29 | 160 | 160 | |
| Suffolk County Economic Development Corp. Health, Hospital, Nursing Home Revenue | 5.000% | 12/1/34 | 1,000 | 982 | |
| Suffolk County Economic Development Corp. Health, Hospital, Nursing Home Revenue | 5.000% | 12/1/34 | 170 | 167 | |
| Suffolk County Economic Development Corp. Health, Hospital, Nursing Home Revenue | 5.000% | 12/1/40 | 1,500 | 1,404 | |
| 2 | Suffolk County NY GO | 4.000% | 4/1/30 | 4,420 | 4,569 |
| 2 | Suffolk County NY GO | 4.000% | 4/1/31 | 4,590 | 4,739 |
| 1 | Suffolk County NY GO | 3.000% | 6/15/31 | 250 | 247 |
| Suffolk Tobacco Asset Securitization Corp. Tobacco Settlement Funded Revenue | 4.000% | 6/1/37 | 1,250 | 1,209 | |
| Suffolk Tobacco Asset Securitization Corp. Tobacco Settlement Funded Revenue | 4.000% | 6/1/38 | 1,000 | 958 | |
| Suffolk Tobacco Asset Securitization Corp. Tobacco Settlement Funded Revenue | 4.000% | 6/1/39 | 1,250 | 1,187 | |
| Suffolk Tobacco Asset Securitization Corp. Tobacco Settlement Funded Revenue | 4.000% | 6/1/40 | 1,250 | 1,176 | |
| Suffolk Tobacco Asset Securitization Corp. Tobacco Settlement Funded Revenue | 4.000% | 6/1/41 | 1,300 | 1,210 | |
| Suffolk Tobacco Asset Securitization Corp. Tobacco Settlement Funded Revenue | 4.000% | 6/1/50 | 2,000 | 1,745 | |
| Suffolk Tobacco Asset Securitization Corp. Tobacco Settlement Funded Revenue | 4.000% | 6/1/50 | 4,455 | 4,306 | |
| Syracuse Industrial Development Agency Intergovernmental Agreement Revenue | 4.000% | 5/1/33 | 1,025 | 1,058 | |
| Syracuse Industrial Development Agency Intergovernmental Agreement Revenue | 4.000% | 5/1/34 | 1,200 | 1,233 | |
| Syracuse Industrial Development Agency Intergovernmental Agreement Revenue | 4.000% | 5/1/35 | 1,000 | 1,020 | |
| Syracuse Industrial Development Agency Intergovernmental Agreement Revenue (Syracuse City School District Project) | 4.000% | 5/1/35 | 500 | 513 | |
| Triborough Bridge & Tunnel Authority Fuel Sales Tax Revenue | 0.000% | 11/15/36 | 2,500 | 1,467 | |
| Triborough Bridge & Tunnel Authority Fuel Sales Tax Revenue | 0.000% | 11/15/39 | 1,500 | 735 | |
| Triborough Bridge & Tunnel Authority Fuel Sales Tax Revenue | 5.500% | 5/15/52 | 5,000 | 5,537 | |
| Triborough Bridge & Tunnel Authority Highway Revenue | 5.000% | 11/15/25 | 2,500 | 2,601 | |
| Triborough Bridge & Tunnel Authority Highway Revenue | 5.000% | 11/15/26 | 1,000 | 1,065 | |
| Triborough Bridge & Tunnel Authority Highway Revenue | 5.000% | 11/15/27 | 1,000 | 1,088 | |
| Triborough Bridge & Tunnel Authority Highway Revenue | 5.000% | 11/15/28 | 2,000 | 2,218 | |
| Triborough Bridge & Tunnel Authority Highway Revenue | 0.000% | 11/15/29 | 2,705 | 2,184 | |
| Triborough Bridge & Tunnel Authority Highway Revenue | 0.000% | 11/15/31 | 5,500 | 4,090 | |
| Triborough Bridge & Tunnel Authority Highway Revenue | 5.000% | 11/15/31 | 3,010 | 3,143 | |
| Triborough Bridge & Tunnel Authority Highway Revenue | 0.000% | 11/15/32 | 3,510 | 2,523 | |
| Triborough Bridge & Tunnel Authority Highway Revenue | 0.000% | 11/15/32 | 235 | 167 | |
| Triborough Bridge & Tunnel Authority Highway Revenue | 5.000% | 11/15/33 | 1,400 | 1,485 | |
| Triborough Bridge & Tunnel Authority Highway Revenue | 5.000% | 11/15/34 | 2,790 | 2,948 | |
| Triborough Bridge & Tunnel Authority Highway Revenue | 5.000% | 11/15/35 | 1,000 | 1,053 | |
| Triborough Bridge & Tunnel Authority Highway Revenue | 5.000% | 11/15/35 | 5,000 | 5,406 | |
| Triborough Bridge & Tunnel Authority Highway Revenue | 5.000% | 11/15/36 | 4,010 | 4,138 | |
| Triborough Bridge & Tunnel Authority Highway Revenue | 5.000% | 11/15/40 | 1,000 | 1,115 | |
| Triborough Bridge & Tunnel Authority Highway Revenue | 5.000% | 11/15/41 | 2,510 | 2,571 | |
| Triborough Bridge & Tunnel Authority Highway Revenue | 5.000% | 11/15/41 | 1,175 | 1,303 |
| Coupon | Maturity Date | Face Amount ($000) | Market Value• ($000) | ||
| Triborough Bridge & Tunnel Authority Highway Revenue | 5.000% | 11/15/42 | 4,600 | 4,770 | |
| Triborough Bridge & Tunnel Authority Highway Revenue | 5.000% | 11/15/42 | 1,000 | 1,102 | |
| Triborough Bridge & Tunnel Authority Highway Revenue | 5.000% | 11/15/43 | 5,000 | 5,242 | |
| Triborough Bridge & Tunnel Authority Highway Revenue | 5.000% | 11/15/43 | 5,985 | 6,289 | |
| Triborough Bridge & Tunnel Authority Highway Revenue | 5.000% | 11/15/43 | 1,000 | 1,098 | |
| Triborough Bridge & Tunnel Authority Highway Revenue | 5.000% | 11/15/44 | 3,500 | 3,828 | |
| Triborough Bridge & Tunnel Authority Highway Revenue | 5.250% | 11/15/45 | 4,000 | 4,054 | |
| Triborough Bridge & Tunnel Authority Highway Revenue | 3.000% | 11/15/48 | 3,560 | 2,648 | |
| Triborough Bridge & Tunnel Authority Highway Revenue | 5.000% | 11/15/48 | 3,950 | 4,265 | |
| Triborough Bridge & Tunnel Authority Highway Revenue | 5.000% | 11/15/49 | 4,000 | 4,230 | |
| Triborough Bridge & Tunnel Authority Highway Revenue | 5.000% | 11/15/51 | 9,430 | 9,994 | |
| Triborough Bridge & Tunnel Authority Highway Revenue | 4.000% | 11/15/52 | 1,500 | 1,454 | |
| Triborough Bridge & Tunnel Authority Highway Revenue | 4.000% | 11/15/54 | 23,365 | 22,566 | |
| Triborough Bridge & Tunnel Authority Highway Revenue | 5.000% | 11/15/54 | 9,500 | 10,019 | |
| Triborough Bridge & Tunnel Authority Highway Revenue | 4.000% | 11/15/56 | 3,500 | 3,365 | |
| Triborough Bridge & Tunnel Authority Highway Revenue | 5.000% | 11/15/56 | 10,000 | 10,567 | |
| Triborough Bridge & Tunnel Authority Highway Revenue | 5.500% | 11/15/57 | 17,260 | 19,097 | |
| 4 | Triborough Bridge & Tunnel Authority Highway Revenue VRDO | 3.250% | 12/1/23 | 4,400 | 4,400 |
| Triborough Bridge & Tunnel Authority Miscellaneous Taxes Revenue | 5.000% | 11/15/25 | 2,000 | 2,078 | |
| Triborough Bridge & Tunnel Authority Miscellaneous Taxes Revenue | 5.000% | 11/15/26 | 3,000 | 3,198 | |
| Triborough Bridge & Tunnel Authority Miscellaneous Taxes Revenue | 5.000% | 11/15/27 | 2,000 | 2,180 | |
| Triborough Bridge & Tunnel Authority Miscellaneous Taxes Revenue | 5.000% | 11/15/28 | 8,700 | 9,548 | |
| Triborough Bridge & Tunnel Authority Miscellaneous Taxes Revenue | 5.000% | 11/15/30 | 7,500 | 8,557 | |
| Triborough Bridge & Tunnel Authority Miscellaneous Taxes Revenue | 3.000% | 5/15/32 | 360 | 347 | |
| Triborough Bridge & Tunnel Authority Miscellaneous Taxes Revenue | 0.000% | 5/15/33 | 5,000 | 3,509 | |
| Triborough Bridge & Tunnel Authority Miscellaneous Taxes Revenue | 5.000% | 11/15/33 | 2,500 | 2,978 | |
| Triborough Bridge & Tunnel Authority Miscellaneous Taxes Revenue | 5.000% | 11/15/34 | 2,385 | 2,838 | |
| Triborough Bridge & Tunnel Authority Miscellaneous Taxes Revenue | 4.000% | 11/15/37 | 2,445 | 2,496 | |
| Triborough Bridge & Tunnel Authority Miscellaneous Taxes Revenue | 5.000% | 11/15/37 | 1,800 | 2,078 | |
| Triborough Bridge & Tunnel Authority Miscellaneous Taxes Revenue | 5.000% | 11/15/38 | 1,555 | 1,771 | |
| Triborough Bridge & Tunnel Authority Miscellaneous Taxes Revenue | 5.250% | 11/15/39 | 1,880 | 2,170 | |
| Triborough Bridge & Tunnel Authority Miscellaneous Taxes Revenue | 5.250% | 11/15/40 | 2,600 | 2,988 | |
| Triborough Bridge & Tunnel Authority Miscellaneous Taxes Revenue | 5.000% | 11/15/41 | 2,235 | 2,490 | |
| Triborough Bridge & Tunnel Authority Miscellaneous Taxes Revenue | 4.000% | 5/15/42 | 995 | 990 | |
| Triborough Bridge & Tunnel Authority Miscellaneous Taxes Revenue | 5.250% | 11/15/42 | 2,315 | 2,634 | |
| Triborough Bridge & Tunnel Authority Miscellaneous Taxes Revenue | 4.000% | 5/15/43 | 1,140 | 1,132 | |
| Triborough Bridge & Tunnel Authority Miscellaneous Taxes Revenue | 4.000% | 5/15/46 | 7,520 | 7,391 | |
| Triborough Bridge & Tunnel Authority Miscellaneous Taxes Revenue | 2.500% | 5/15/51 | 2,500 | 1,619 |
| Coupon | Maturity Date | Face Amount ($000) | Market Value• ($000) | ||
| Triborough Bridge & Tunnel Authority Miscellaneous Taxes Revenue | 4.000% | 5/15/51 | 5,640 | 5,480 | |
| Triborough Bridge & Tunnel Authority Miscellaneous Taxes Revenue | 4.125% | 5/15/52 | 5,000 | 4,923 | |
| Triborough Bridge & Tunnel Authority Miscellaneous Taxes Revenue | 5.250% | 5/15/52 | 1,150 | 1,259 | |
| Triborough Bridge & Tunnel Authority Miscellaneous Taxes Revenue PUT | 2.000% | 5/15/28 | 1,425 | 1,316 | |
| Triborough Bridge & Tunnel Authority Sales Tax Revenue | 4.000% | 5/15/48 | 11,640 | 11,192 | |
| Triborough Bridge & Tunnel Authority Sales Tax Revenue | 5.250% | 5/15/52 | 2,000 | 2,176 | |
| Triborough Bridge & Tunnel Authority Sales Tax Revenue | 4.125% | 5/15/53 | 5,000 | 4,829 | |
| Triborough Bridge & Tunnel Authority Sales Tax Revenue | 5.250% | 5/15/57 | 2,000 | 2,166 | |
| Triborough Bridge & Tunnel Authority Sales Tax Revenue | 4.250% | 5/15/58 | 5,000 | 4,869 | |
| Triborough Bridge & Tunnel Authority Sales Tax Revenue | 5.250% | 5/15/62 | 2,000 | 2,157 | |
| Troy Capital Resource Corp. College & University Revenue | 5.000% | 8/1/25 | 1,000 | 1,020 | |
| Troy Capital Resource Corp. College & University Revenue | 5.000% | 9/1/27 | 1,000 | 1,057 | |
| Troy Capital Resource Corp. College & University Revenue | 5.000% | 9/1/27 | 150 | 159 | |
| Troy Capital Resource Corp. College & University Revenue | 5.000% | 9/1/28 | 1,000 | 1,073 | |
| Troy Capital Resource Corp. College & University Revenue | 5.000% | 9/1/28 | 275 | 295 | |
| Troy Capital Resource Corp. College & University Revenue | 4.000% | 9/1/30 | 470 | 481 | |
| Troy Capital Resource Corp. College & University Revenue | 4.000% | 9/1/31 | 235 | 238 | |
| Troy Capital Resource Corp. College & University Revenue | 4.000% | 9/1/32 | 365 | 368 | |
| Troy Capital Resource Corp. College & University Revenue | 4.000% | 9/1/33 | 100 | 101 | |
| Troy Capital Resource Corp. College & University Revenue | 4.000% | 9/1/34 | 155 | 155 | |
| Troy Capital Resource Corp. College & University Revenue | 4.000% | 9/1/35 | 190 | 191 | |
| Troy Capital Resource Corp. College & University Revenue | 4.000% | 9/1/36 | 380 | 378 | |
| Troy Capital Resource Corp. College & University Revenue | 5.000% | 9/1/37 | 2,900 | 3,071 | |
| Troy Capital Resource Corp. College & University Revenue | 5.000% | 9/1/38 | 2,500 | 2,627 | |
| Troy Capital Resource Corp. College & University Revenue | 5.000% | 9/1/39 | 2,845 | 2,980 | |
| Troy Capital Resource Corp. College & University Revenue | 4.000% | 9/1/40 | 4,725 | 4,479 | |
| TSASC Inc. NY Tobacco Settlement Funded Revenue | 5.000% | 6/1/26 | 3,095 | 3,168 | |
| TSASC Inc. NY Tobacco Settlement Funded Revenue | 5.000% | 6/1/28 | 5,880 | 6,085 | |
| TSASC Inc. NY Tobacco Settlement Funded Revenue | 5.000% | 6/1/29 | 5,015 | 5,182 | |
| TSASC Inc. NY Tobacco Settlement Funded Revenue | 5.000% | 6/1/30 | 5,435 | 5,610 | |
| TSASC Inc. NY Tobacco Settlement Funded Revenue | 5.000% | 6/1/32 | 2,865 | 2,952 | |
| TSASC Inc. NY Tobacco Settlement Funded Revenue | 5.000% | 6/1/33 | 2,000 | 2,059 | |
| TSASC Inc. NY Tobacco Settlement Funded Revenue | 5.000% | 6/1/34 | 11,000 | 11,312 | |
| TSASC Inc. NY Tobacco Settlement Funded Revenue | 5.000% | 6/1/35 | 1,000 | 1,026 | |
| TSASC Inc. NY Tobacco Settlement Funded Revenue | 5.000% | 6/1/36 | 900 | 919 | |
| TSASC Inc. NY Tobacco Settlement Funded Revenue | 5.000% | 6/1/41 | 6,625 | 6,644 | |
| Utility Debt Securitization Authority Electric Power & Light Revenue | 5.000% | 12/15/33 | 2,755 | 2,844 | |
| Utility Debt Securitization Authority Electric Power & Light Revenue | 5.000% | 12/15/37 | 5,000 | 5,117 | |
| Utility Debt Securitization Authority Electric Power & Light Revenue | 5.000% | 12/15/38 | 1,000 | 1,132 | |
| 11 | Utility Debt Securitization Authority Electric Power & Light Revenue | 5.000% | 12/15/40 | 3,055 | 3,479 |
| 11 | Utility Debt Securitization Authority Electric Power & Light Revenue | 5.000% | 12/15/41 | 4,280 | 4,848 |
| 11 | Utility Debt Securitization Authority Electric Power & Light Revenue | 5.000% | 12/15/42 | 2,000 | 2,248 |
| 11 | Utility Debt Securitization Authority Electric Power & Light Revenue | 5.000% | 12/15/43 | 2,275 | 2,546 |
| 11 | Utility Debt Securitization Authority Electric Power & Light Revenue | 5.000% | 12/15/44 | 3,145 | 3,493 |
| Coupon | Maturity Date | Face Amount ($000) | Market Value• ($000) | ||
| 11 | Utility Debt Securitization Authority Electric Power & Light Revenue | 5.000% | 12/15/45 | 1,880 | 2,078 |
| 11 | Utility Debt Securitization Authority Electric Power & Light Revenue | 5.000% | 6/15/53 | 2,000 | 2,178 |
| Webster Central School District GO | 2.000% | 6/15/33 | 1,180 | 1,000 | |
| Webster Central School District GO | 2.000% | 6/15/34 | 1,265 | 1,057 | |
| Westbury Union Free School District GO | 2.000% | 12/15/31 | 3,600 | 3,203 | |
| Westbury Union Free School District GO | 2.000% | 12/15/32 | 3,670 | 3,204 | |
| Westchester County Local Development Corp. College & University Revenue | 5.000% | 5/1/34 | 1,000 | 1,002 | |
| Westchester County Local Development Corp. Health, Hospital, Nursing Home Revenue | 5.000% | 7/1/24 | 350 | 352 | |
| Westchester County Local Development Corp. Health, Hospital, Nursing Home Revenue | 5.000% | 7/1/25 | 770 | 782 | |
| Westchester County Local Development Corp. Health, Hospital, Nursing Home Revenue | 5.000% | 11/1/25 | 400 | 400 | |
| 3 | Westchester County Local Development Corp. Health, Hospital, Nursing Home Revenue | 2.875% | 7/1/26 | 1,480 | 1,414 |
| Westchester County Local Development Corp. Health, Hospital, Nursing Home Revenue | 5.000% | 7/1/26 | 590 | 606 | |
| Westchester County Local Development Corp. Health, Hospital, Nursing Home Revenue | 5.000% | 7/1/27 | 440 | 457 | |
| Westchester County Local Development Corp. Health, Hospital, Nursing Home Revenue | 5.000% | 11/1/27 | 1,410 | 1,415 | |
| 3 | Westchester County Local Development Corp. Health, Hospital, Nursing Home Revenue | 3.200% | 7/1/28 | 3,515 | 3,282 |
| Westchester County Local Development Corp. Health, Hospital, Nursing Home Revenue | 5.000% | 7/1/28 | 370 | 387 | |
| Westchester County Local Development Corp. Health, Hospital, Nursing Home Revenue | 5.000% | 11/1/28 | 1,000 | 1,004 | |
| Westchester County Local Development Corp. Health, Hospital, Nursing Home Revenue | 5.000% | 7/1/29 | 500 | 523 | |
| Westchester County Local Development Corp. Health, Hospital, Nursing Home Revenue | 5.000% | 11/1/29 | 1,000 | 1,002 | |
| Westchester County Local Development Corp. Health, Hospital, Nursing Home Revenue | 5.000% | 7/1/34 | 200 | 209 | |
| 3 | Westchester County Local Development Corp. Health, Hospital, Nursing Home Revenue | 5.000% | 7/1/36 | 2,065 | 1,891 |
| Westchester County Local Development Corp. Health, Hospital, Nursing Home Revenue | 3.750% | 11/1/37 | 2,375 | 1,926 | |
| 3 | Westchester County Local Development Corp. Health, Hospital, Nursing Home Revenue | 5.000% | 7/1/46 | 2,610 | 2,108 |
| 1 | Westchester County Local Development Corp. Health, Hospital, Nursing Home Revenue | 5.750% | 11/1/48 | 2,420 | 2,658 |
| 1 | Westchester County Local Development Corp. Health, Hospital, Nursing Home Revenue | 5.750% | 11/1/49 | 4,170 | 4,568 |
| 1 | Westchester County Local Development Corp. Health, Hospital, Nursing Home Revenue | 5.000% | 11/1/51 | 1,480 | 1,528 |
| Westchester County Local Development Corp. Health, Hospital, Nursing Home Revenue | 6.250% | 11/1/52 | 2,705 | 2,994 | |
| 1 | Westchester County Local Development Corp. Health, Hospital, Nursing Home Revenue | 5.750% | 11/1/53 | 1,900 | 2,090 |
| 3 | Westchester County Local Development Corp. Health, Hospital, Nursing Home Revenue | 4.500% | 7/1/56 | 2,000 | 1,398 |
| 3 | Westchester County Local Development Corp. Health, Hospital, Nursing Home Revenue | 5.000% | 7/1/56 | 6,385 | 4,879 |
| Coupon | Maturity Date | Face Amount ($000) | Market Value• ($000) | ||
| Westchester County Local Development Corp. Local or Guaranteed Housing Revenue (Purchase Housing Corp. II Project) | 5.000% | 6/1/28 | 550 | 564 | |
| Westchester County Local Development Corp. Local or Guaranteed Housing Revenue (Purchase Housing Corp. II Project) | 5.000% | 6/1/37 | 1,250 | 1,259 | |
| Westchester County NY GO | 2.000% | 10/15/34 | 2,685 | 2,291 | |
| Westchester County NY Healthcare Corp. Health, Hospital, Nursing Home Revenue | 6.000% | 11/1/30 | 15 | 15 | |
| Westchester Tobacco Asset Securitization Corp. Tobacco Settlement Funded Revenue | 5.000% | 6/1/32 | 2,500 | 2,578 | |
| Western Nassau County Water Authority Water Revenue | 3.000% | 4/1/39 | 845 | 707 | |
| Western Nassau County Water Authority Water Revenue | 4.000% | 4/1/46 | 2,500 | 2,427 | |
| Yonkers Economic Development Corp. Charter School Aid Revenue | 5.000% | 10/15/40 | 750 | 695 | |
| Yonkers Economic Development Corp. Charter School Aid Revenue | 5.000% | 10/15/50 | 1,325 | 1,146 | |
| Yonkers Economic Development Corp. Charter School Aid Revenue (Charter School Education Excellence Project) | 4.000% | 10/15/29 | 400 | 378 | |
| Yonkers Economic Development Corp. Charter School Aid Revenue (Charter School Education Excellence Project) | 5.000% | 10/15/39 | 1,000 | 930 | |
| Yonkers Economic Development Corp. Charter School Aid Revenue (Charter School Education Excellence Project) | 5.000% | 10/15/49 | 640 | 556 | |
| Yonkers Economic Development Corp. Charter School Aid Revenue (Charter School Education Excellence Project) | 5.000% | 10/15/54 | 765 | 652 | |
| 1 | Yonkers NY GO | 5.000% | 3/15/34 | 1,400 | 1,595 |
| 1 | Yonkers NY GO | 5.000% | 3/15/36 | 1,735 | 1,950 |
| 4,358,119 | |||||
| Guam (0.2%) | |||||
| Guam Government Waterworks Authority Water Revenue | 5.000% | 7/1/29 | 1,000 | 1,007 | |
| Guam Miscellaneous Taxes Revenue | 5.000% | 11/15/27 | 595 | 605 | |
| Guam Miscellaneous Taxes Revenue | 4.000% | 1/1/42 | 560 | 507 | |
| Guam Power Authority Electric Power & Light Revenue | 5.000% | 10/1/31 | 5,980 | 6,218 | |
| 8,337 | |||||
| Puerto Rico (1.2%) | |||||
| Commonwealth of Puerto Rico GO | 0.000% | 7/1/24 | 1,316 | 1,284 | |
| Commonwealth of Puerto Rico GO | 5.375% | 7/1/25 | 6,810 | 6,928 | |
| Commonwealth of Puerto Rico GO | 5.625% | 7/1/27 | 3,082 | 3,218 | |
| Commonwealth of Puerto Rico GO | 5.625% | 7/1/29 | 3,125 | 3,303 | |
| Commonwealth of Puerto Rico GO | 5.750% | 7/1/31 | 6,890 | 7,410 | |
| Commonwealth of Puerto Rico GO | 0.000% | 7/1/33 | 3,884 | 2,364 | |
| Commonwealth of Puerto Rico GO | 4.000% | 7/1/33 | 4,830 | 4,507 | |
| Commonwealth of Puerto Rico GO | 4.000% | 7/1/35 | 1,500 | 1,372 | |
| Commonwealth of Puerto Rico GO | 4.000% | 7/1/37 | 425 | 380 | |
| Commonwealth of Puerto Rico GO | 4.000% | 7/1/46 | 172 | 143 | |
| 3 | Puerto Rico Commonwealth Aqueduct & Sewer Authority Water Revenue | 5.000% | 7/1/30 | 1,790 | 1,810 |
| 3 | Puerto Rico Commonwealth Aqueduct & Sewer Authority Water Revenue | 5.000% | 7/1/33 | 570 | 575 |
| 3 | Puerto Rico Commonwealth Aqueduct & Sewer Authority Water Revenue | 5.000% | 7/1/33 | 1,415 | 1,429 |
| Puerto Rico Highway & Transportation Authority Highway Revenue | 0.000% | 7/1/32 | 505 | 327 | |
| Puerto Rico Sales Tax Financing Corp. Sales Tax Revenue | 0.000% | 7/1/24 | 66 | 64 | |
| Puerto Rico Sales Tax Financing Corp. Sales Tax Revenue | 0.000% | 7/1/27 | 5,543 | 4,781 | |
| Puerto Rico Sales Tax Financing Corp. Sales Tax Revenue | 0.000% | 7/1/29 | 1,212 | 957 | |
| Coupon | Maturity Date | Face Amount ($000) | Market Value• ($000) | ||
| Puerto Rico Sales Tax Financing Corp. Sales Tax Revenue | 0.000% | 7/1/31 | 2,096 | 1,510 | |
| Puerto Rico Sales Tax Financing Corp. Sales Tax Revenue | 0.000% | 7/1/33 | 650 | 425 | |
| Puerto Rico Sales Tax Financing Corp. Sales Tax Revenue | 4.329% | 7/1/40 | 8,422 | 7,972 | |
| Puerto Rico Sales Tax Financing Corp. Sales Tax Revenue | 0.000% | 7/1/46 | 7,719 | 2,268 | |
| Puerto Rico Sales Tax Financing Corp. Sales Tax Revenue | 4.784% | 7/1/58 | 4,000 | 3,758 | |
| 56,785 | |||||
| Total Tax-Exempt Municipal Bonds (Cost $4,564,612) | 4,423,241 | ||||
| Total Investments (99.2%) (Cost $4,564,612) | 4,423,241 | ||||
| Other Assets and Liabilities—Net (0.8%) | 33,574 | ||||
| Net Assets (100%) | 4,456,815 | ||||
| Cost is in $000. | |||||
| • | See Note A in Notes to Financial Statements. |
| 1 | Scheduled principal and interest payments are guaranteed by Assured Guaranty Municipal Corp. |
| 2 | Scheduled principal and interest payments are guaranteed by Build America Mutual Assurance Co. |
| 3 | Security exempt from registration under Rule 144A of the Securities Act of 1933. Such securities may be sold in transactions exempt from registration, normally to qualified institutional buyers. At November 30, 2023, the aggregate value was $181,167,000, representing 4.1% of net assets. |
| 4 | Scheduled principal and interest payments are guaranteed by bank letter of credit. |
| 5 | Scheduled principal and interest payments are guaranteed by Federal Housing Authority. |
| 6 | Scheduled principal and interest payments are guaranteed by Assured Guaranty Corp. |
| 7 | Securities with a value of $640,000 have been segregated as initial margin for open futures contracts. |
| 8 | Step bond. |
| 9 | Scheduled principal and interest payments are guaranteed by National Public Finance Guarantee Corp. |
| 10 | Scheduled principal and interest payments are guaranteed by Ambac Assurance Corp. |
| 11 | Includes securities purchased on a when-issued or delayed-delivery basis for which the fund has not taken delivery as of November 30, 2023. |
| BAN—Bond Anticipation Note. | |
| GO—General Obligation Bond. | |
| IDA—Industrial Development Authority Bond. | |
| PILOT—Payments in Lieu of Taxes. | |
| Prere.—Prerefunded. | |
| PUT—Put Option Obligation. | |
| TOB—Tender Option Bond. | |
| VRDO—Variable Rate Demand Obligation. |
| Futures Contracts | ||||
| ($000) | ||||
| Expiration | Number of Long (Short) Contracts | Notional Amount | Value and Unrealized Appreciation (Depreciation) | |
| Long Futures Contracts | ||||
| 5-Year U.S. Treasury Note | March 2024 | 460 | 49,152 | 221 |
| Futures Contracts (continued) | ||||
| ($000) | ||||
| Expiration | Number of Long (Short) Contracts | Notional Amount | Value and Unrealized Appreciation (Depreciation) | |
| Short Futures Contracts | ||||
| Ultra Long U.S. Treasury Bond | March 2024 | (141) | (17,343) | (329) |
| (108) | ||||
| ($000s, except shares, footnotes, and per-share amounts) | Amount |
| Assets | |
| Investments in Securities, at Value—Unaffiliated Issuers (Cost $4,564,612) | 4,423,241 |
| Investment in Vanguard | 146 |
| Cash | 75 |
| Receivables for Investment Securities Sold | 42,882 |
| Receivables for Accrued Income | 45,653 |
| Receivables for Capital Shares Issued | 2,970 |
| Variation Margin Receivable—Futures Contracts | 19 |
| Other Assets | 99 |
| Total Assets | 4,515,085 |
| Liabilities | |
| Payables for Investment Securities Purchased | 48,957 |
| Payables for Capital Shares Redeemed | 5,928 |
| Payables for Distributions | 3,208 |
| Payables to Vanguard | 177 |
| Total Liabilities | 58,270 |
| Net Assets | 4,456,815 |
| At November 30, 2023, net assets consisted of: | |
| Paid-in Capital | 4,785,363 |
| Total Distributable Earnings (Loss) | (328,548) |
| Net Assets | 4,456,815 |
| Investor Shares—Net Assets | |
| Applicable to 41,824,477 outstanding $.001 par value shares of beneficial interest (unlimited authorization) | 447,395 |
| Net Asset Value Per Share—Investor Shares | $10.70 |
| Admiral Shares—Net Assets | |
| Applicable to 374,818,918 outstanding $.001 par value shares of beneficial interest (unlimited authorization) | 4,009,420 |
| Net Asset Value Per Share—Admiral Shares | $10.70 |
| Year Ended November 30, 2023 | |
| ($000) | |
| Investment Income | |
| Income | |
| Interest | 145,957 |
| Total Income | 145,957 |
| Expenses | |
| The Vanguard Group—Note B | |
| Investment Advisory Services | 235 |
| Management and Administrative—Investor Shares | 642 |
| Management and Administrative—Admiral Shares | 2,933 |
| Marketing and Distribution—Investor Shares | 32 |
| Marketing and Distribution—Admiral Shares | 223 |
| Custodian Fees | 28 |
| Auditing Fees | 30 |
| Shareholders’ Reports—Investor Shares | 16 |
| Shareholders’ Reports—Admiral Shares | 27 |
| Trustees’ Fees and Expenses | 2 |
| Other Expenses | 39 |
| Total Expenses | 4,207 |
| Expenses Paid Indirectly | (28) |
| Net Expenses | 4,179 |
| Net Investment Income | 141,778 |
| Realized Net Gain (Loss) | |
| Investment Securities Sold | (64,690) |
| Futures Contracts | (189) |
| Realized Net Gain (Loss) | (64,879) |
| Change in Unrealized Appreciation (Depreciation) | |
| Investment Securities | 130,842 |
| Futures Contracts | (45) |
| Change in Unrealized Appreciation (Depreciation) | 130,797 |
| Net Increase (Decrease) in Net Assets Resulting from Operations | 207,696 |
| Year Ended November 30, | ||
| 2023 ($000) | 2022 ($000) | |
| Increase (Decrease) in Net Assets | ||
| Operations | ||
| Net Investment Income | 141,778 | 131,086 |
| Realized Net Gain (Loss) | (64,879) | (115,486) |
| Change in Unrealized Appreciation (Depreciation) | 130,797 | (605,608) |
| Net Increase (Decrease) in Net Assets Resulting from Operations | 207,696 | (590,008) |
| Distributions | ||
| Investor Shares | (13,558) | (16,235) |
| Admiral Shares | (125,724) | (156,149) |
| Total Distributions | (139,282) | (172,384) |
| Capital Share Transactions | ||
| Investor Shares | 34,546 | (67,985) |
| Admiral Shares | 195,907 | (655,060) |
| Net Increase (Decrease) from Capital Share Transactions | 230,453 | (723,045) |
| Total Increase (Decrease) | 298,867 | (1,485,437) |
| Net Assets | ||
| Beginning of Period | 4,157,948 | 5,643,385 |
| End of Period | 4,456,815 | 4,157,948 |
| Investor Shares | |||||
| For a Share Outstanding Throughout Each Period | Year Ended November 30, | ||||
| 2023 | 2022 | 2021 | 2020 | 2019 | |
| Net Asset Value, Beginning of Period | $10.52 | $12.21 | $12.20 | $12.01 | $11.34 |
| Investment Operations | |||||
| Net Investment Income1 | .344 | .297 | .295 | .327 | .354 |
| Net Realized and Unrealized Gain (Loss) on Investments | .174 | (1.600) | .108 | .231 | .696 |
| Total from Investment Operations | .518 | (1.303) | .403 | .558 | 1.050 |
| Distributions | |||||
| Dividends from Net Investment Income | (.338) | (.296) | (.295) | (.326) | (.355) |
| Distributions from Realized Capital Gains | — | (.091) | (.098) | (.042) | (.025) |
| Total Distributions | (.338) | (.387) | (.393) | (.368) | (.380) |
| Net Asset Value, End of Period | $10.70 | $10.52 | $12.21 | $12.20 | $12.01 |
| Total Return2 | 5.01% | -10.80% | 3.34% | 4.73% | 9.37% |
| Ratios/Supplemental Data | |||||
| Net Assets, End of Period (Millions) | $447 | $406 | $546 | $513 | $550 |
| Ratio of Total Expenses to Average Net Assets | 0.17%3 | 0.17%3 | 0.17% | 0.17% | 0.17% |
| Ratio of Net Investment Income to Average Net Assets | 3.25% | 2.70% | 2.41% | 2.73% | 3.00% |
| Portfolio Turnover Rate | 100% | 77% | 40% | 34% | 15% |
| 1 | Calculated based on average shares outstanding. |
| 2 | Total returns do not include account service fees that may have applied in the periods shown. Fund prospectuses provide information about any applicable account service fees. |
| 3 | The ratio of expenses to average net assets for the period net of reduction from custody fee offset arrangements was 0.17%. |
| Admiral Shares | |||||
| For a Share Outstanding Throughout Each Period | Year Ended November 30, | ||||
| 2023 | 2022 | 2021 | 2020 | 2019 | |
| Net Asset Value, Beginning of Period | $10.52 | $12.21 | $12.20 | $12.01 | $11.34 |
| Investment Operations | |||||
| Net Investment Income1 | .352 | .306 | .305 | .337 | .364 |
| Net Realized and Unrealized Gain (Loss) on Investments | .174 | (1.600) | .107 | .230 | .695 |
| Total from Investment Operations | .526 | (1.294) | .412 | .567 | 1.059 |
| Distributions | |||||
| Dividends from Net Investment Income | (.346) | (.305) | (.304) | (.335) | (.364) |
| Distributions from Realized Capital Gains | — | (.091) | (.098) | (.042) | (.025) |
| Total Distributions | (.346) | (.396) | (.402) | (.377) | (.389) |
| Net Asset Value, End of Period | $10.70 | $10.52 | $12.21 | $12.20 | $12.01 |
| Total Return2 | 5.10% | -10.73% | 3.43% | 4.82% | 9.46% |
| Ratios/Supplemental Data | |||||
| Net Assets, End of Period (Millions) | $4,009 | $3,752 | $5,097 | $4,725 | $4,648 |
| Ratio of Total Expenses to Average Net Assets | 0.09%3 | 0.09%3 | 0.09% | 0.09% | 0.09% |
| Ratio of Net Investment Income to Average Net Assets | 3.33% | 2.78% | 2.49% | 2.81% | 3.08% |
| Portfolio Turnover Rate | 100% | 77% | 40% | 34% | 15% |
| 1 | Calculated based on average shares outstanding. |
| 2 | Total returns do not include account service fees that may have applied in the periods shown. Fund prospectuses provide information about any applicable account service fees. |
| 3 | The ratio of expenses to average net assets for the period net of reduction from custody fee offset arrangements was 0.09%. |
| A. | The following significant accounting policies conform to generally accepted accounting principles for U.S. investment companies. The fund consistently follows such policies in preparing its financial statements. |
| B. | In accordance with the terms of a Funds' Service Agreement (the “FSA”) between Vanguard and the fund, Vanguard furnishes to the fund investment advisory, corporate management, administrative, marketing, and distribution services at Vanguard’s cost of operations (as defined by the FSA). These costs of operations are allocated to the fund based on methods and guidelines approved by the board of trustees and are generally settled twice a month. |
| C. | The fund’s custodian bank has agreed to reduce its fees when the fund maintains cash on deposit in the non-interest-bearing custody account. For the year ended November 30, 2023, custodian fee offset arrangements reduced the fund’s expenses by $28,000 (an annual rate of less than 0.01% of average net assets). |
| D. | Various inputs may be used to determine the value of the fund’s investments and derivatives. These inputs are summarized in three broad levels for financial statement purposes. The inputs or methodologies used to value securities are not necessarily an indication of the risk associated with investing in those securities. |
| Level 1 ($000) | Level 2 ($000) | Level 3 ($000) | Total ($000) | |
| Investments | ||||
| Assets | ||||
| Tax-Exempt Municipal Bonds | — | 4,423,241 | — | 4,423,241 |
| Derivative Financial Instruments | ||||
| Assets | ||||
| Futures Contracts1 | 221 | — | — | 221 |
| Liabilities | ||||
| Futures Contracts1 | 329 | — | — | 329 |
| 1 | Includes cumulative appreciation (depreciation) on futures contracts and centrally cleared swaps, if any, as reported in the Schedule of Investments. Only current day’s variation margin is reported within the Statement of Assets and Liabilities. |
| E. | Permanent differences between book-basis and tax-basis components of net assets, if any, are reclassified among capital accounts in the financial statements to reflect their tax character. These |
| Amount ($000) | |
| Undistributed Ordinary Income | — |
| Undistributed Tax-Exempt Income | 3,314 |
| Undistributed Long-Term Gains | — |
| Net Unrealized Gains (Losses) | (144,619) |
| Capital Loss Carryforwards | (184,062) |
| Qualified Late-Year Losses | — |
| Other Temporary Differences | (3,181) |
| Total | (328,548) |
| Year Ended November 30, | ||
| 2023 Amount ($000) | 2022 Amount ($000) | |
| Tax-Exempt Income | 139,282 | 130,452 |
| Ordinary Income* | — | 10,151 |
| Long-Term Capital Gains | — | 31,781 |
| Total | 139,282 | 172,384 |
| * | Includes short-term capital gains, if any. |
| Amount ($000) | |
| Tax Cost | 4,567,859 |
| Gross Unrealized Appreciation | 67,551 |
| Gross Unrealized Depreciation | (212,170) |
| Net Unrealized Appreciation (Depreciation) | (144,619) |
| F. | During the year ended November 30, 2023, the fund purchased $4,496,267,000 of investment securities and sold $4,226,025,000 of investment securities, other than temporary cash investments. |
| G. | Capital share transactions for each class of shares were: |
| Year Ended November 30, | |||||
| 2023 | 2022 | ||||
| Amount ($000) | Shares (000) | Amount ($000) | Shares (000) | ||
| Investor Shares | |||||
| Issued | 159,704 | 15,109 | 86,775 | 7,943 | |
| Issued in Lieu of Cash Distributions | 11,461 | 1,087 | 13,610 | 1,216 | |
| Redeemed | (136,619) | (12,947) | (168,370) | (15,323) | |
| Net Increase (Decrease)—Investor Shares | 34,546 | 3,249 | (67,985) | (6,164) | |
| Admiral Shares | |||||
| Issued | 983,165 | 93,680 | 1,155,283 | 107,293 | |
| Issued in Lieu of Cash Distributions | 90,034 | 8,532 | 114,170 | 10,197 | |
| Redeemed | (877,292) | (83,903) | (1,924,513) | (178,345) | |
| Net Increase (Decrease)—Admiral Shares | 195,907 | 18,309 | (655,060) | (60,855) | |
| H. | Significant market disruptions, such as those caused by pandemics (e.g., COVID-19 pandemic), natural or environmental disasters, war (e.g., Russia’s invasion of Ukraine), acts of terrorism, or other events, can adversely affect local and global markets and normal market operations. Any such disruptions could have an adverse impact on the value of the fund’s investments and fund performance. |
| I. | Management has determined that no events or transactions occurred subsequent to November 30, 2023, that would require recognition or disclosure in these financial statements. |
Philadelphia, Pennsylvania
January 19, 2024
| Fund | ($000) |
| New York Municipal Money Market Fund | 0 |
| New York Long-Term Tax-Exempt Fund | 0 |
| Matthew Benchener | Thomas M. Rampulla |
| Joseph Brennan | Karin A. Risi |
| Mortimer J. Buckley | Anne E. Robinson |
| Gregory Davis | Michael Rollings |
| John James | Nitin Tandon |
| Chris D. Mclsaac | Lauren Valente |
All rights reserved.
Vanguard Marketing Corporation, Distributor.
Item 2: Code of Ethics.
The Registrant has adopted a code of ethics that applies to the Registrant’s principal executive officer, principal financial officer, principal accounting officer or controller or persons performing similar functions. The Code of Ethics was amended during the reporting period covered by this report to make certain technical, non-material changes.
Item 3: Audit Committee Financial Expert.
All members of the Audit Committee have been determined by the Registrant’s Board of Trustees to be Audit Committee Financial Experts and to be independent: F. Joseph Loughrey, Mark Loughridge, Sarah Bloom Raskin, and Peter F. Volanakis.
Item 4: Principal Accountant Fees and Services.
(a) Audit Fees.
Audit Fees of the Registrant.
Fiscal Year Ended November 30, 2023: $54,000
Fiscal Year Ended November 30, 2022: $56,000
Aggregate Audit Fees of Registered Investment Companies in the Vanguard Group.
Fiscal Year Ended November 30, 2023: $9,326,156
Fiscal Year Ended November 30, 2022: $10,494,508
Includes fees billed in connection with audits of the Registrant, other registered investment companies in the Vanguard complex, The Vanguard Group, Inc., and Vanguard Marketing Corporation.
(b) Audit-Related Fees.
Fiscal Year Ended November 30, 2023: $3,295,934
Fiscal Year Ended November 30, 2022: $2,757,764
Includes fees billed in connection with assurance and related services provided to the Registrant, other registered investment companies in the Vanguard complex, The Vanguard Group, Inc., and Vanguard Marketing Corporation.
(c) Tax Fees.
Fiscal Year Ended November 30, 2023: $1,678,928
Fiscal Year Ended November 30, 2022: $5,202,689
Includes fees billed in connection with tax compliance, planning, and advice services provided to the Registrant, other registered investment companies in the Vanguard complex, The Vanguard Group, Inc., and Vanguard Marketing Corporation.
(d) All Other Fees.
Fiscal Year Ended November 30, 2023: $25,000
Fiscal Year Ended November 30, 2022: $298,000
Includes fees billed for services related to tax reported information provided to the Registrant, other registered investment companies in the Vanguard complex, The Vanguard Group, Inc., and Vanguard Marketing Corporation.
(e) (1) Pre-Approval Policies. The policy of the Registrant’s Audit Committee is to consider, and, if appropriate, approve before the principal accountant is engaged for such services, all specific audit and non-audit services provided to: the Registrant, other registered investment companies in the Vanguard complex, The Vanguard Group, Inc., and entities controlled by The Vanguard Group, Inc. that provide ongoing services to the Registrant. In making a determination, the Audit Committee considers whether the services are consistent with maintaining the principal accountant’s independence.
In the event of a contingency situation in which the principal accountant is needed to provide services in between scheduled Audit Committee meetings, the Chairman of the Audit Committee would be called on to consider and, if appropriate, pre-approve audit or permitted non-audit services in an amount sufficient to complete services through the next Audit Committee meeting, and to determine if such services would be consistent with maintaining the accountant’s independence. At the next scheduled Audit Committee meeting, services and fees would be presented to the Audit Committee for formal consideration, and, if appropriate, approval by the entire Audit Committee. The Audit Committee would again consider whether such services and fees are consistent with maintaining the principal accountant’s independence.
The Registrant’s Audit Committee is informed at least annually of all audit and non-audit services provided by the principal accountant to the Vanguard complex, whether such services are provided to: the Registrant, other registered investment companies in the Vanguard complex, The Vanguard Group, Inc., or other entities controlled by The Vanguard Group, Inc. that provide ongoing services to the Registrant.
(2) No percentage of the principal accountant’s fees or services were approved pursuant to the waiver provision of paragraph (c)(7)(i)(C) of Rule 2-01 of Regulation S-X.
(f) For the most recent fiscal year, over 50% of the hours worked under the principal accountant’s engagement were not performed by persons other than full-time, permanent employees of the principal accountant.
(g) Aggregate Non-Audit Fees.
Fiscal Year Ended November 30, 2023: $1,703,928
Fiscal Year Ended November 30, 2022: $5,500,689
Includes fees billed for non-audit services provided to the Registrant, other registered investment companies in the Vanguard complex, The Vanguard Group, Inc., and Vanguard Marketing Corporation.
(h) For the most recent fiscal year, the Audit Committee has determined that the provision of all non-audit services was consistent with maintaining the principal accountant’s independence.
Item 5: Audit Committee of Listed Registrants.
The Registrant is a listed issuer as defined in rule 10A-3 under the Securities Exchange Act of 1934 (“Exchange Act”). The Registrant has a separately-designated standing audit committee established in accordance with Section 3(a)(58)(A) of the Exchange Act. The Registrant’s audit committee members are: F. Joseph Loughrey, Mark Loughridge, Sarah Bloom Raskin, and Peter F. Volanakis.
Item 6: Investments.
Not applicable. The complete schedule of investments is included as part of the report to shareholders filed under Item 1 of this Form.
Item 7: Disclosure of Proxy Voting Policies and Procedures for Closed-End Management Investment Companies.
Not applicable.
Item 8: Portfolio Managers of Closed-End Management Investment Companies.
Not applicable.
Item 9: Purchase of Equity Securities by Closed-End Management Investment Company and Affiliated Purchasers.
Not applicable.
Item 10: Submission of Matters to a Vote of Security Holders.
Not applicable.
Item 11: Controls and Procedures.
(a) Disclosure Controls and Procedures. The Principal Executive and Financial Officers concluded that the Registrant’s Disclosure Controls and Procedures are effective based on their evaluation of the Disclosure Controls and Procedures as of a date within 90 days of the filing date of this report.
(b) Internal Control Over Financial Reporting. There were no significant changes in the Registrant’s Internal Control Over Financial Reporting or in other factors that could significantly affect this control during the period covered by this report, including any corrective actions with regard to significant deficiencies and material weaknesses.
Item 12: Disclosure of Securities Lending Activities for Closed-End Management Investment Companies.
Not applicable.
Item 13: Exhibits.
| (a)(1) | Code of Ethics filed herewith. |
| (a)(2) | Certifications filed herewith. |
| (a)(2) | Certifications filed herewith. |
Pursuant to the requirements of the Securities Exchange Act of 1934 and the Investment Company Act of 1940, the registrant has duly caused this report to be signed on its behalf by the undersigned, thereunto duly authorized.
| VANGUARD NEW YORK tax-free funds | |||
| BY: | /s/ MORTIMER J. BUCKLEY* | ||
| MORTIMER J. BUCKLEY | |||
| CHIEF EXECUTIVE OFFICER | |||
Date: January 22, 2024
Pursuant to the requirements of the Securities Exchange Act of 1934 and the Investment Company Act of 1940, this report has been signed below by the following persons on behalf of the registrant and in the capacities and on the dates indicated.
| VANGUARD NEW YORK tax-free funds | |||
| BY: | /s/ MORTIMER J. BUCKLEY* | ||
| MORTIMER J. BUCKLEY | |||
| CHIEF EXECUTIVE OFFICER | |||
Date: January 22, 2024
| VANGUARD NEW YORK tax-free funds | |||
| BY: | /s/ CHRISTINE BUCHANAN* | ||
| CHRISTINE BUCHANAN | |||
| CHIEF FINANCIAL OFFICER | |||
Date: January 22, 2024
| * By: | /s/ Anne E. Robinson |
Anne E. Robinson, pursuant to a Power of Attorney filed on March 29, 2023 (see File Number 2-11444), Incorporated by Reference.