Exhibit 99.1

Public Service Enterprise Group
PSEG Earnings Conference Call
3rd Quarter 2007
November 1, 2007

Disclaimer Statement
The statements contained in this communication about our and our
subsidiaries’ future performance, including, without limitation, future
revenues, earnings, strategies, prospects and all other statements that are
not purely historical, are forward-looking statements for purposes of the safe
harbor provisions under The Private Securities Litigation Reform Act of
1995. Although we believe that our expectations are based on information
currently available and on reasonable assumptions, we can give no
assurance they will be achieved. There are a number of risks and
uncertainties that could cause actual results to differ materially from the
forward-looking statements made herein. A discussion of some of these
risks and uncertainties is contained in our Annual Report on Form 10-K and
subsequent reports on Form 10-Q and Form 8-K filed with the Securities
and Exchange Commission (SEC), and available on our website:
http://www.pseg.com. These documents address in further detail our
business, industry issues and other factors that could cause actual results
to differ materially from those indicated in this communication. In addition,
any forward-looking statements included herein represent our estimates
only as of today and should not be relied upon as representing our
estimates as of any subsequent date. While we may elect to update
forward-looking statements from time to time, we specifically disclaim any
obligation to do so, even if our estimates change, unless otherwise required
by applicable securities laws.
1

GAAP Disclaimer
PSEG presents Operating Earnings in addition to its Net Income reported
in accordance with generally accepted accounting principles (GAAP).
Operating Earnings is a non-GAAP financial measure that differs from Net
Income because it excludes the impact of the sale of certain non-core
domestic and international assets and costs stemming from the
terminated merger agreement with Exelon Corporation. PSEG presents
Operating Earnings because management believes that it is appropriate
for investors to consider results excluding these items in addition to the
results reported in accordance with GAAP. PSEG believes that the non-
GAAP financial measure of Operating Earnings provides a consistent and
comparable measure of performance of its businesses to help
shareholders understand performance trends. This information is
not intended to be viewed as an alternative to GAAP information. The last
slide in this presentation includes a list of items excluded from Net Income
to reconcile to Operating Earnings, with a reference to that slide included
on each of the slides where the non-GAAP information appears. These
slides are only intended to be reviewed in conjunction with the oral
presentation to which they relate.
2

PSEG
2007 Q3 Review
Ralph Izzo
Chairman, President and Chief Executive Officer

Q3 2007 EPS Summary
$ 2
--
Merger Related Costs
--
($ 7)
Write Down of Assets
$ 2
$ 6
Discontinued Operations, net of tax
$ 1.47
$ 2.00
EPS from Operating Earnings
$ 374
$ 506
Net Income
$ 372
$ 500
Income from Continuing Operations
$ 370
$ 507
Operating Earnings
Q3 2006
Q3 2007
$ millions (except EPS)
* See page 35 for Items excluded from Net Income to reconcile to Operating Earnings
4

YTD Income Summary
($ 178)
($ 7)
Write Down of Assets
$ 217
($ 17)
Discontinued Operations, net of tax
$ 2.99
$ 4.47
EPS from Operating Earnings
$ 786
$ 1,110
Net Income
$ 569
$ 1,127
Income from Continuing Operations
($ 7)
-
Merger Costs
$ 754
$ 1,134
Operating Earnings
2006
2007
$ millions (except EPS)
Nine months ended September 30,
* See page 35 for Items excluded from Net Income to reconcile to Operating Earnings
5
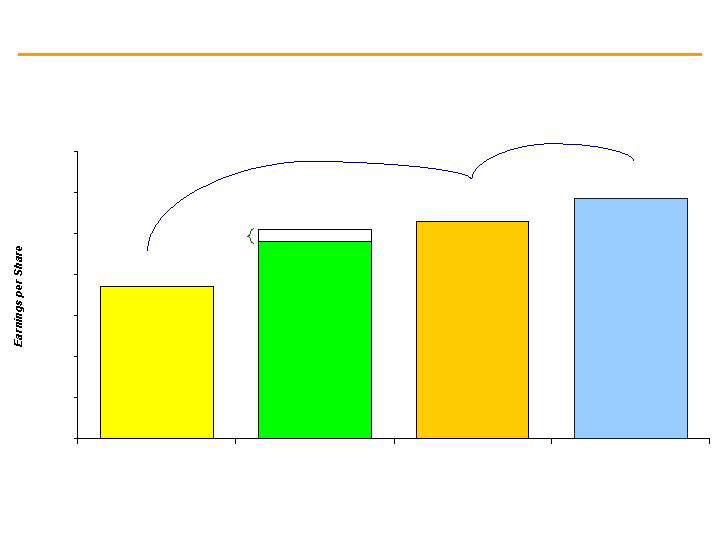
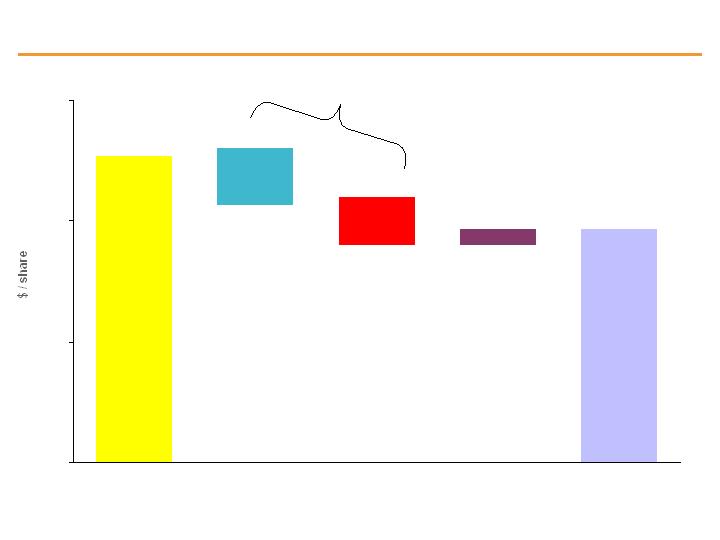
Earnings – Exceeding Expectations
$0.00
$1.00
$2.00
$3.00
$4.00
$5.00
$6.00
$7.00
2006 Operating
Earnings*
Prior 2007 Guidance
Current 2007
Guidance
2008 Guidance
$4.90 - $5.30
$5.60 - $6.10
$3.71
$5.15 - $5.45
+ 40 – 45%
+ 10%
2007 Guidance
raised by $0.30
in March 2007
Initial
Guidance:
$4.60 - $5.00
* As reported: Excludes Loss on Sale of RGE of $0.70 per share, Merger costs of $0.03 per share and Loss from Discontinued Operations of $0.05 per share
** Percentage change in growth based on mid-point of guidance
6

PSEG – Meeting Commitments
2007 earnings exceeding guidance
Focus on core businesses
Investments in Latin America received attractive values
Pursuing expansion of peaking capacity
Transmission investment
Meeting commitment to system reliability with major expansion to
transmission system / new peaking / customer information
Top quartile operating performance
PSE&G Mid-Atlantic ReliabilityOne Award for 6th consecutive year
Expects to be in a position to resume independent operation of nuclear
fleet at year-end
Addressing NJ’s clean energy commitments
Solar initiative
PSE&G to use more energy efficient equipment and vehicles
Meeting our balance sheet goals
S&P outlook revised to stable; commercial paper ratings upgraded
7

PSEG
2007 Q3 Operating Company Review
Tom O’Flynn
Executive Vice President and Chief Financial Officer
President – PSEG Energy Holdings

Q3 Operating Earnings by Subsidiary
$ 370
(18)
97
205
$ 86
2006
$ 507
(10)
73
338
$ 106
2007
Operating Earnings
Per Share
$ Millions (except EPS)
(0.07)
(0.04)
Enterprise
$ 1.47
$ 2.00
PSEG
0.38
0.29
PSEG Energy Holdings
0.82
1.33
PSEG Power
$ 0.34
$ 0.42
PSE&G
2006
2007
Quarter ended September 30,
* See page 35 for Items excluded from Net Income to reconcile to Operating Earnings
9

YTD Operating Earnings by Subsidiary
$ 754
(50)
193
413
$ 198
2006
$ 1,134
(43)
134
744
$ 299
2007
Operating Earnings
Per Share
$ Millions (except EPS)
(0.20)
(0.17)
Enterprise
$ 2.99
$ 4.47
PSEG
0.76
0.53
PSEG Energy Holdings
1.64
2.93
PSEG Power
$ 0.79
$ 1.18
PSE&G
2006
2007
Nine months ended September 30,
* See page 35 for Items excluded from Net Income to reconcile to Operating Earnings
10
0.00
1.00
2.00
3.00
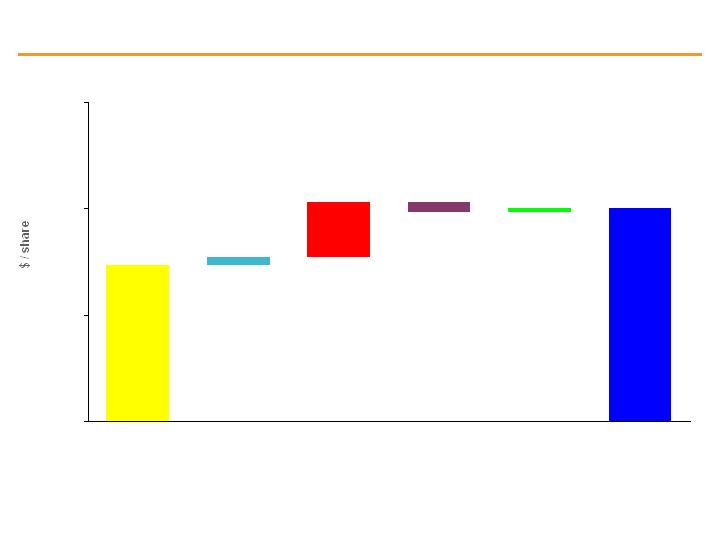
PSEG EPS Reconciliation – Q3 2006 versus Q3 2007
Q3 2007
operating
earnings
Q3 2006
operating
earnings
* See page 35 for Items excluded from Net Income to reconcile to Operating Earnings
Rate relief .06
Weather (.01)
Appliance Service
.01
Interest expense,
change in shares
& other .02
Recontracting/
Strong operations
.55
MTM (.03)
O&M (.03)
Other .02
Global
International .01
G&A .01
Interest & taxes (.06)
Texas – MTM &
Operations (.07)
Interest
.03
Resources
NWA settlement .02
Interest expense .02
Lease income (.02)
$1.47
$.08
$0.51
$(.09)
$.03
$2.00
PSE&G
Power
Holdings
Enterprise
11

0.00
1.00
2.00
3.00
4.00
5.00
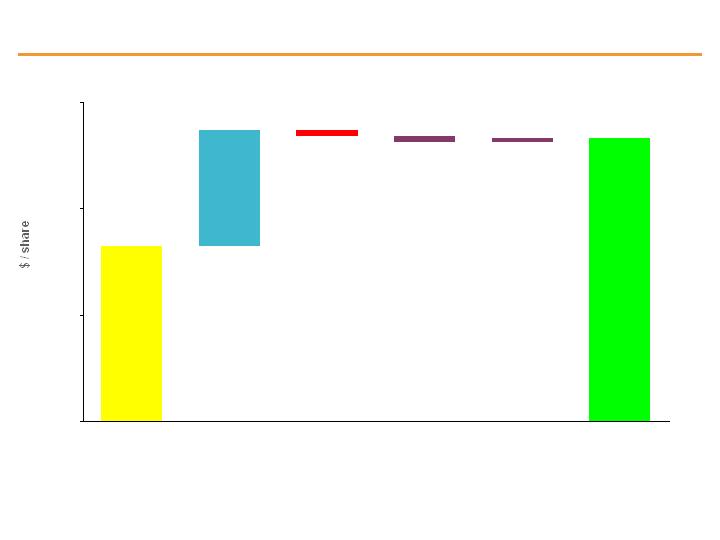
PSEG EPS Reconciliation – YTD 2006 versus YTD 2007
9 months 2007
operating
earnings
9 months 2006
operating
earnings
* See page 35 for Items excluded from Net Income to reconcile to Operating Earnings
Rate relief .23
Weather .08
Volume/
demand .05
Appliance Service
.02
Interest expense,
change in shares &
other .01
Recontracting /
strong operations
1.16
BGSS & other .18
Effective tax rate /
change in shares
.02
MTM (.04)
Depreciation,
interest &
other (.02)
O&M (.01)
Interest .03
$2.99
$0.39
$1.29
$(0.23)
$0.03
$4.47
PSE&G
Power
Holdings
Enterprise
Global
Settlement & gain .04
RGE (.04)
International
Operations - Italy (.08),
SAESA .04
Texas – MTM &
Operations (.19)
Resources
NWA settlement .02
Lease income (.04)
Interest, G&A & other
.02
12

PSEG Power
2007 Q3 Review

PSEG Power – Q3 2007 EPS Summary
$ 125
$ 1,455
$ 1,580
Operating Revenues
$ 0.51
$ 0.82
$ 1.33
EPS from Operating Earnings
$ 134
$ 205
$ 339
Net Income
$ 3
($ 2)
$ 1
Discontinued Operations, net of tax
$ 131
$ 207
$ 338
Income from Continuing Operations
$ 133
$ 205
$ 338
Operating Earnings
Variance
Q3 2006
Q3 2007
$ millions (except EPS)
* See page 35 for Items excluded from Net Income to reconcile to Operating Earnings
14
.82
.55
(.03)
(.03)
.02
1.33
0.00
0.50
1.00
1.50
Recontracting &
Strong operations
.55
PSEG Power EPS Reconciliation – Q3 2006 versus Q3 2007
Q3 2007
operating
earnings
Q3 2006
operating
earnings
O&M (.03)
Mark-to-
Market (.03)
Other:
Effective tax rate .03
Change in shares (.01)
* See page 35 for Items excluded from Net Income to reconcile to Operating Earnings
15

0%
25%
50%
75%
100%
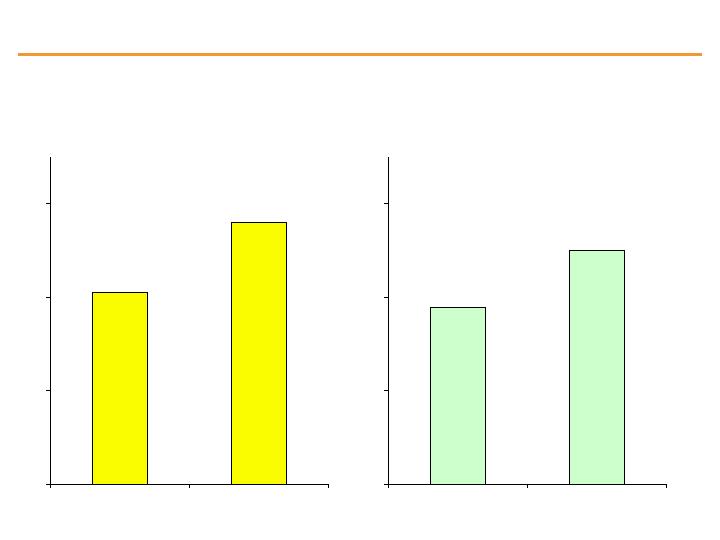
Summer capacity factor averaging above 98%
2006
2007
Nuclear Fleet Maintains Strong Operating Performance
Salem
Hope Creek
16

PSEG Power – Generation Measures
7.3
7.4
3.9
3.8
3.8
4.0
0
4
8
12
16
2006
2007
21.8
21.8
11.2
10.0
7.1
9.0
0
15
30
45
2006
2007
28.9
29.2
15.0
13.9
8.4
10.8
0
20
40
60
2006
2007
3rd Quarter
Nine months ended 9/30
Trailing Twelve Months
(ended 9/30/07)
Total Nuclear
Total Coal
Total Oil &
Natural Gas*
* Includes figures for Pumped Storage
PSEG Power – Generation (MWh)
15.0
15.2
40.1
40.8
52.3
53.9
17
Prices and Operations Yield Margin Increase of 37% Quarter over Quarter
$0
$20
$40
$60
Q3 2006
Q3 2007
PSEG Power Realized Gross Margin
($/MWh)
$41
$56
$0
$20
$40
$60
9 Months 2006
9 Months 2007
$38
$50
18

RPM Capacity Auction – Transparent Pricing Model
Delivery Year
($MW/Day)
$97.82
$111.92
$191.32
---
$191.32
$148.80
2009 / 2010
2008 / 2009
2007 / 2008
Zones
$40.80
Rest of Pool
---
MAAC & APS
$197.67
Eastern MAAC
Auctions scheduled in the next year provide transition through the
2011-2012 delivery year.
Results from PJM’s third capacity auction under the Reliability Pricing
Model for the 2009-2010 delivery year provided strong price signals.
May 2008
2011 – 2012
Annual base auction in May of each
subsequent year
January 2008
2010 – 2011
Auction Date
Planning Year
Future auction pricing to be influenced by increase in number of zones,
load growth, new transmission, avoided cost for units, and capacity
available.
19

RPM is Working
RPM has had an influence on the market – forced outage rates
declining, retirements slowing, more DSM bid into market.
PSEG Power is taking steps to add 300 - 400MW ($250 - $350
million) of new gas-fired peaking capacity that could be bid into
PJM’s Reliability Pricing Model (RPM) base residual auctions in
2008.
PSEG Power has requested that PJM perform a feasibility study
to determine the system impact of adding as much as 1,000MW
of new gas-fired capacity at some of its existing generating
stations located in the eastern MAAC reliability region.
The final decision to proceed with construction would take into
account capital and interconnection costs, available siting and
potential for environmental limitations.
20

PSEG Power – Q3 Highlights
Operations:
Generation output increased
Nuclear: 1.1%
Fossil: 2.4%
Expects to be in a position to resume independent operation of Salem
and Hope Creek by year-end
NRC approval of Hope Creek 125 MW uprate expected by spring
2008
Markets:
Benefiting from roll-off of below market contracts
RPM pricing effective June 1, 2007 for 2007-2008 delivery year
Improved pricing for energy in PJM, New York and New England
Financial:
$250 million dividend paid to Enterprise
21

PSE&G
2007 Q3 Review

PSE&G – Q3 2007 EPS Summary
$ 0.08
$ 0.34
$ 0.42
EPS from Operating Earnings
$ 19
$ 87
$ 106
Income from Continuing Operations/
Net Income
$ 20
$ 86
$ 106
Operating Earnings
$ 135
$ 1,971
$ 2,106
Operating Revenues
Variance
Q3 2006
Q3 2007
$ millions (except EPS)
* See page 35 for Items excluded from Net Income to reconcile to Operating Earnings
23

.34
.06
(.01)
.03
.42
0.00
0.10
0.20
0.30
0.40
0.50
Rate relief:
Gas .04
Electric .02
PSE&G EPS Reconciliation – Q3 2006 versus Q3 2007
Q3 2007
operating
earnings
Q3 2006
operating
earnings
Weather:
Electric (.01)
Other
Appliance
service .01
Interest expense,
change in shares &
other .02
* See page 35 for Items excluded from Net Income to reconcile to Operating Earnings
24

PSE&G – Q3 Highlights
Operations
Sales growth reflects:
Weather normalized growth in residential and commercial electric customer demand of
3.2% and 3.6%, respectively
Industrial electric demand reflects customer loss
Weather – cooler than normal
Mid-Atlantic ReliabilityOne Award – six years running
O&M growth less than inflation
Regulatory
PSE&G advocates a strong role for gas and electric utilities in meeting the state’s
energy efficiency goals.
Awaiting BPU response to $100 million solar initiative
NJ Energy Master Plan – draft proposal expected before year-end
Financial
Transmission projects represent potential $1 billion investment over 5-8 years
beginning 2008
PSE&G paid $100 million in dividends to PSEG in September
25

PSEG Energy Holdings
2007 Q3 Review

PSEG Energy Holdings – Q3 2007 EPS Summary
($ 7)
--
($ 7)
Write Down of Assets
($ 0.09)
$ 0.38
$ 0.29
EPS from Operating Earnings
($ 30)
$ 101
$ 71
Net Income
$ 1
$ 4
$ 5
Discontinued Operations, net of tax
($ 31)
$ 97
$ 66
Income from Continuing Operations
($ 24)
$ 97
$ 73
Operating Earnings
Variance
Q3 2006
Q3 2007
$ millions (except EPS)
* See page 35 for Items excluded from Net Income to reconcile to Operating Earnings
27
.29
.02
(.06)
(.05)
.38
0.00
0.15
0.30
0.45
PSEG Energy Holdings EPS Reconciliation – Q3 2006 versus Q3 2007
Q3 2007
operating
earnings
Q3 2006
operating
earnings
Global
* See page 35 for Items excluded from Net Income to reconcile to Operating Earnings
Texas
MTM (.06)
Operations (.01)
International
SAESA .01
G&A .01
Interest (.03)
Taxes (.03)
NWA settlement
.02
Interest
.02
Lease income
(.02)
Resources
28

PSEG Energy Holdings – Q3 Highlights
Operations:
Global
Italian biomass generation plant resumed operations in June after extended
outage; now at full capacity
Latin America distribution businesses performing well
Markets:
Global
Economic growth driving strong demand
Valuations remain strong for international assets
Texas near-term spark spreads lower with mild weather
Financial:
Global
Electroandes sale for $390 million closed on October 17
Reached agreement on sale of Chilquinta and Luz del Sur for $685 million
$7 million after-tax impairment on Turboven recognized in quarter
$158 million payment to Energy Holdings in September 2007 from proceeds
of SAESA debt issuance
29
$41
$175
$104
$129
$50
$13
$(40)
$(35)
$(24)
Improved risk profile by reducing capital invested in non-strategic
assets while increasing returns and sharpening focus on G&A
2004
2006
$2.6B
$2.0B
Chile
&
Peru
US
Other
$900M
$400M
$1.3B
$150M
$500M
$1.4B
35%
15%
50%
7%
68%
25%
$317M**
56%
49%
2004
2006
2007
Projected
$195M**
$205M-$225M**
Composition of Global’s Pre-tax
Contribution by Region*
G&A
Chile &
Peru
US
Other
26%
53%
21%
4%
41%
55%
Global’s Invested Capital
$500M
$1.2 B
12/31/07
Projected
$1.1B***
43%
47%
* Includes both consolidated and unconsolidated investments after project debt, before allocation of parent debt
** Excludes interest, taxes, G&A and other corporate items to arrive at Global’s Operating Earnings, includes Electroandes,Chilquinta and LDS (33%)
***Assumes the closing of Chilquinta and LDS prior to year end
09/30/07
$1.8B
$470M
$500M
64%
29%
$150M
7%
$100M
10%
-5%
30

PSEG
2007 Q3 Review

Summary of Q3 Fundamental Factors
Operations
Power’s generation output increased 1.7% over last year’s levels
Domestic distribution and transmission assets provide safe and secure
supply
Latin America assets benefit from economic growth
Markets
Weather normalized electric demand growth within expectations
Generating assets see strong, functioning energy and capacity markets
International asset values being recognized
Financials
Dividend payments from operating companies support parent level debt
reductions
PSEG stopped issuing new and treasury shares for shareholder dividend
reinvestment programs.
32

Cash Outlook – Forecast Intact
We remain comfortable with forecasted improvement in
cash
Operating income exceeding expectations
Successful asset sales
Planned rate mechanisms for transmission investments
would provide cash recovery during construction
Excess cash between $1.5 billion and $2.0 billion will be
available through 2011
Excess cash expected to be used to retire debt; once
debt targets are met, cash will be available for investment
and/or share repurchase
33

Increasing 2007 Operating Earnings Guidance
$5.15 - $5.45
$1,305 - $1,410
($55) – ($45)
$110 - $135
$360 - $380
$890 - $940
Current
($55) – ($45)
Parent
$4.90 - $5.30
Earnings per Share
$1,245 - $1,370
Operating Earnings
$120 - $135
PSEG Energy Holdings
$ 340 - $360
PSE&G
$ 840 - $920
PSEG Power
Prior
$ millions (except EPS)
34
Items Excluded from Net Income to Reconcile to Operating Earnings
Please see Slide 2 for an explanation of PSEG’s use of Operating Earnings as a non-GAAP financial measure and how
it differs from Net Income.
$ Millions (except EPS)
2007
2006
2007
2006
2007
2006
2007
2006
Merger related Costs:
PSE&G
-
$
1
$
-
$
(1)
$
Power
-
2
-
-
Enterprise
-
(1)
-
(6)
Total Merger Related Costs
-
$
2
$
-
$
(7)
$
-
$
-
$
-
$
(0.03)
$
Write Down of Assets (Holdings)
(7)
$
-
$
(7)
$
(178)
$
(0.03)
$
-
$
(0.03)
$
(0.70)
$
Discontinued Operations:
Power - Lawrenceburg
1
$
(2)
$
(8)
$
(19)
$
-
$
(0.01)
$
(0.03)
$
(0.08)
$
Holdings:
Elcho and Skawina
-
$
-
$
-
$
227
$
Electroandes
5
4
(9)
9
Total Holdings
5
$
4
$
(9)
$
236
$
0.02
$
0.02
$
(0.04)
$
0.94
$
Total Discontinued Operations
6
$
2
$
(17)
$
217
$
0.02
$
0.01
$
(0.07)
$
0.86
$
Quarter Ended Sept. 30,
Nine Months Ended Sept. 30,
Impact to PSEG EPS
Quarter Ended Sept. 30,
Nine Months Ended Sept. 30,
35