Exhibit 99

Public Service Enterprise Group
Deutsche Bank
May 29, 2008
2008 Energy and Utilities Conference
Miami Beach, FL

Forward-Looking Statement
Readers are cautioned that statements contained in this presentation about our and our subsidiaries' future performance, including
future revenues, earnings, strategies, prospects and all other statements that are not purely historical, are forward-looking statements
for purposes of the safe harbor provisions under The Private Securities Litigation Reform Act of 1995. Although we believe that our
expectations are based on reasonable assumptions, we can give no assurance they will be achieved. The results or events predicted in
these statements may differ materially from actual results or events. Factors which could cause results or events to differ from current
expectations include, but are not limited to:
•
Adverse changes in energy industry, policies and regulation, including market rules that may adversely affect our operating results.
•
Any inability of our energy transmission and distribution businesses to obtain adequate and timely rate relief and/or regulatory approvals
from federal and/or state regulators.
•
Changes in federal and/or state environmental regulations that could increase our costs or limit operations of our generating units.
•
Changes in nuclear regulation and/or developments in the nuclear power industry generally, that could limit operations of our nuclear
generating units.
•
Actions or activities at one of our nuclear units that might adversely affect our ability to continue to operate that unit or other units at
the same site.
•
Any inability to balance our energy obligations, available supply and trading risks.
•
Any deterioration in our credit quality.
•
Any inability to realize anticipated tax benefits or retain tax credits.
•
Increases in the cost of or interruption in the supply of fuel and other commodities necessary to the operation of our generating units.
•
Delays or cost escalations in our construction and development activities.
•
Adverse capital market performance of our decommissioning and defined benefit plan trust funds.
•
Changes in technology and/or increased customer conservation.
For further information, please refer to our Annual Report on Form 10-K, including Item 1A. Risk Factors, and subsequent reports on
Form 10-Q and Form 8-K filed with the Securities and Exchange Commission. These documents address in further detail our
business, industry issues and other factors that could cause actual results to differ materially from those indicated in this presentation.
In addition, any forward-looking statements included herein represent our estimates only as of today and should not be relied upon as
representing our estimates as of any subsequent date. While we may elect to update forward-looking statements from time to time,
we specifically disclaim any obligation to do so, even if our estimates change, unless otherwise required by applicable securities laws.
2

GAAP Disclaimer
PSEG presents Operating Earnings in addition to its Net Income reported
in accordance with accounting principles generally accepted in the United
States (GAAP). Operating Earnings is a non-GAAP financial measure that
differs from Net Income because it excludes the impact of the sale of
certain non-core domestic and international assets and costs stemming
from the terminated merger agreement with Exelon Corporation. PSEG
presents Operating Earnings because management believes that it is
appropriate for investors to consider results excluding these items in
addition to the results reported in accordance with GAAP. PSEG believes
that the non-GAAP financial measure of Operating Earnings provides a
consistent and comparable measure of performance of its businesses to
help shareholders understand performance trends. This information is not
intended to be viewed as an alternative to GAAP information. The last
slide in this presentation includes a list of items excluded from Net Income
to reconcile to Operating Earnings, with a reference to that slide included
on each of the slides where the non-GAAP information appears. These
slides are intended to be reviewed in conjunction with the oral
presentation to which they relate.
3

PSEG Power
Dan Cregg
Vice President – Finance, PSEG Power

PSEG Power represents the largest subsidiary within a diverse
platform…
Major electric generation
Stable electric and gas
Redeployment of capital
company with 13,300
distribution and
through the sale of
MW of base-load,
transmission company
international assets.
intermediate and load
rated top quartile for
Focused on managing
following capability
reliability providing
lease portfolio and
operating in attractive
service in mature
potential investment in
markets in the Northeast
service territory in New
renewables.
with operating control of
Jersey.
additional 2,000 MW of
capacity in Texas.
2007 Operating
Earnings:
$949M*
$376M*
$115M*
2008 Guidance:
$1,040M - $1,140M
$350M – $370M
5
* See page 30 for Items excluded from Net Income to reconcile to Operating Earnings
$45M – $60M
… providing earnings stability, multiple growth opportunities and
substantial cash flow.

Major influences on our business environment remain …
Infrastructure
Climate Change
Capacity Needs
Requirements
• Capital investment in
• PSEG Power’s base-
• Significant new
coal fleet to meet
load nuclear assets
well situated in carbon
constrained
environment
transmission capital
environmental
program to improve
requirements
reliability
maintains critical
infrastructure and
expands capability
• PSE&G pursuing
investments in energy
• Potential to leverage
efficiency and
existing brownfield
renewables
sites; potential for
new nuclear
… and PSEG’s assets are well positioned to meet the needs of
6
customers and shareholders in a challenging environment.
Right set of assets, right markets at the right time …
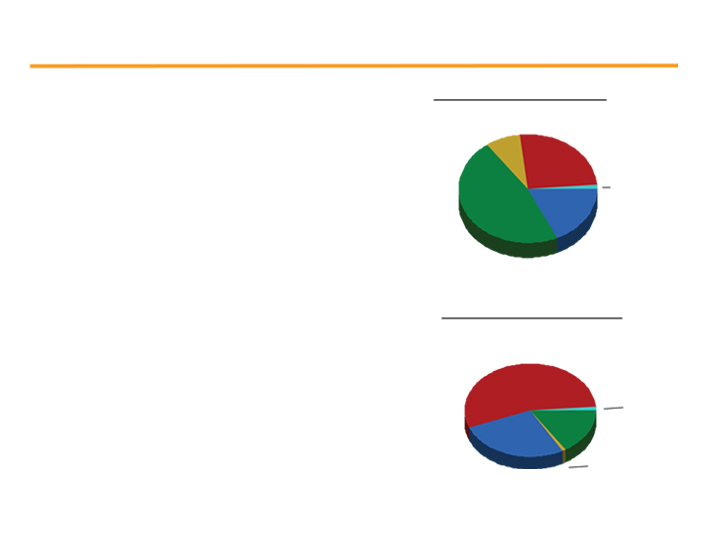
Fuel Diversity – 2007
• Low-cost portfolio
Total MW: 13,300*
• Strong cash generator
Oil
Nuclear
8%
• Regional focus in competitive,
26%
Pumped
liquid markets
Storage
18%
1%
47%
• Assets favorably located
Coal
Gas
– Many units east of PJM constraints
Energy Produced - 2007
– Near customers/load centers
Total GWh: 53,200*
• 80% of Fossil capacity has dual
Nuclear
fuel capabilities
54%
Pumped
•
Integrated generation and portfolio
Storage
1%
19%
management optimizes asset-
25%
Gas
based revenues
Oil 1%
Coal
… we continue to like the assets we have and their location.
7
* Excludes 2,000MW of combined cycle generation in Texas under PSEG Power’s operating control.
– Southern NEPOOL/ Connecticut
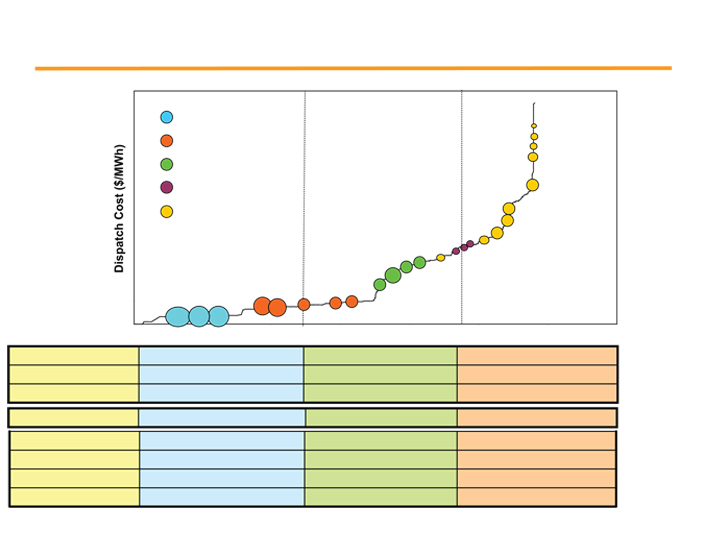
Power’s assets along the dispatch curve …
Nuclear
National Park
Coal
Sewaren 6
Mercer 3
Kearny 10-11
Combined Cycle
Burlington 8-9-11
Steam
GT Peaking
Edison 1-2-3
Essex 10-11-12
New
Haven
Linden 5-8 / Essex 9
Bergen 1
Burlington 12 / Kearny 12
Linden 1,2
Keystone
Yards
Sewaren 1-4
Conemaugh
Creek
Hudson 1
Peach
BEC
Bottom
Bridgeport
Hudson 2
Hope
Bergen 2
Creek
Salem
Mercer1, 2
Illustrative
Baseload units
Load following units
Peaking units
Energy Revenue
X
X
X
Capacity Revenue
X
X
X
Ancillary Revenue
X
X
Dual Fuel
X
X
Nuclear CF
90% to 92%
Coal CF
85% to 90%
50% to 70%
Combined Cycle CF
30% to 50%
Peaking CF
2% to 10%
8
… position the company to serve full requirement load contracts.

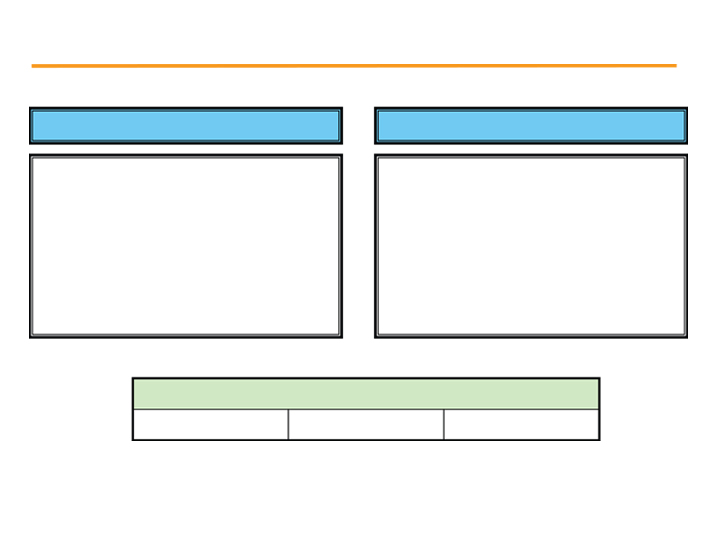
Our five unit nuclear fleet …
Hope Creek
• Operated by PSEG Nuclear
Salem Units 1 and 2
• PSEG Ownership: 100%
• Operated by PSEG Nuclear
• Technology:
Boiling Water Reactor
• Ownership: PSEG - 57%,
Exelon – 43%
Peach Bottom Units 2 and 3
• Total Capacity: 1,061MW
• Technology:
Pressurized Water Reactor
• Operated by Exelon
• Owned Capacity: 1,061MW*
• License Expiration: 2026
• Total Capacity: 2,304MW
• PSEG Ownership: 50%
*125MW uprate expected for 2008 summer run
• Owned Capacity: 1,323MW*
• Technology:
Boiling Water Reactor
• License Expiration: 2016 and
2020
• Total Capacity: 2,224MW
• Owned Capacity: 1,112MW
*15MW uprate expected for 2008 summer run
• License Expiration: 2033
and 2034
… is a critical element of Power’s success.
9

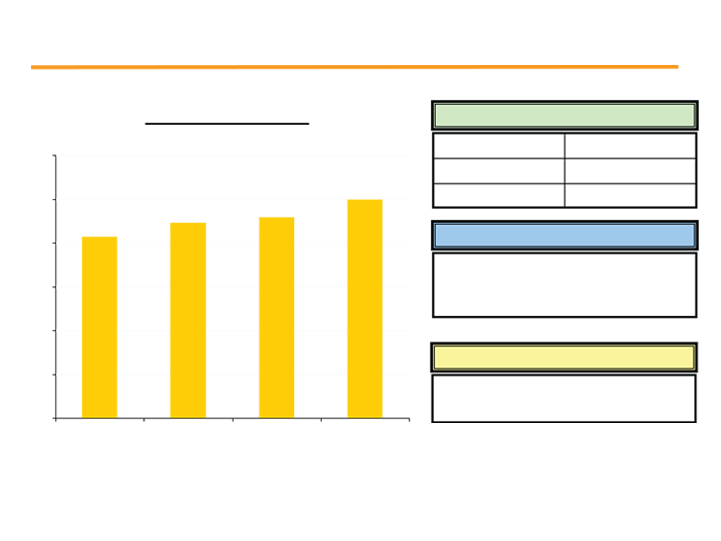
We have delivered strong nuclear performance …
Total Nuclear Output
O&M Total Incurred Cost
(000 GWh)
($ millions)
$589
$567
$564
$554
$542
29.2
28.5
28.8
27.4
24.8
2004
2005
2006
2007
2008 Target
2004
2005
2006
2007
10
Note: Values represent Salem/Hope Creek/Peach Bottom, PSEG Share
2008 Target
… while reducing cost of operations.
We have some major 2008 initiatives …
Hope Creek Uprate
Salem Steam Generator Outage
• NRC approved Hope Creek’s
• Unit 2 outage concluded
extended power uprate
within 58 days – on time
license amendment in May
• 15 MW uprate (PS share)
2008
expected for 2008 summer
• 125 MW uprate expected for
run
2008 summer run
INPO Assessments
Hope Creek
Salem
Corporate
… that will drive value for years to come.
11
Fossil operations contribute to earnings …
Total Fossil Output
A Diverse 9,800 MW Fleet (MW)
(GWh)
Coal
2,350
30,000
Combined Cycle
3,150
25,000
Steam / Peaking
4,300
Right Assets – Right Location
20,000
• Fuel diversity
15,000
• Technical diversity
`
• Near load centers
10,000
Operation of 2,000 MW Texas Portfolio
5,000
• Shared best practices
• Leverage scale
0
2004
2005
2006
2007
… through a low-cost portfolio in which the majority of the output is
from coal facilities.
12
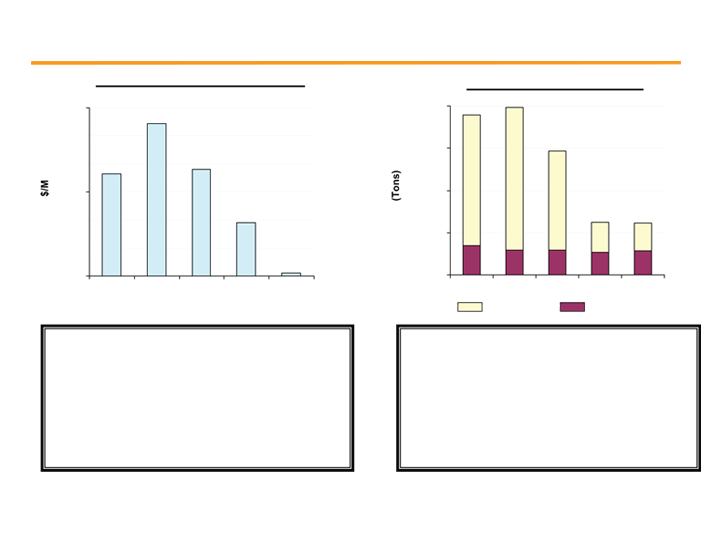
Fossil’s capital spending on pollution control equipment
declines over time …
Coal Environmental Capital
Coal Emissions Output
$600
80,000
60,000
$300
40,000
20,000
$0
0
2007
2008
2009
2010
2011
2007
2008
2009
2010
2011
Coal – SO2
Coal – NOx
• Fossil spending on BET reaches a peak of over
• Aggregate emissions will decline nearly 70%
$500 million in 2008
after installation of the pollution control
equipment
• Fossil’s coal fleet will be well positioned in
2010, with a dramatic reduction in capital
• The installation will allow for fuel flexibility in
spending on pollution control equipment
future years
… and the coal fleet’s profile results in lower emissions and
13
higher output.
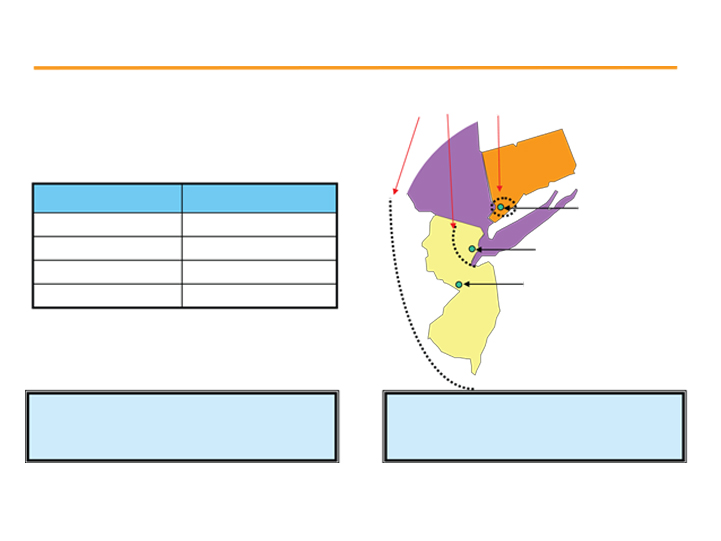
Power’s eastern coal plants are in the right areas …
System Interface
Coal Units
Capacity (MW)
Bridgeport Harbor 3
Hudson 2
558
Mercer 1&2
648
Hudson 2
Bridgeport
372
Mercer 1&2
Total
1,578
Power’s New Jersey coal units are
Power is also making considerable
mid-merit, with capacity factors
investments beyond the pollution
averaging 50% to 60%.
control facilities for its coal assets.
… and after capital investments, anticipate increased capacity factors.
14

Markets remain attractive …
Energy markets have seen rising prices
Fuel costs have risen
Reserve margins have tightened
Capacity pricing mechanisms have been implemented in Power’s
key markets
Five RPM auctions implemented in PJM
Power’s hedging strategy enables strong and stable cash flows
Increasingly visible and stable margin
BGS results in line with markets, including load serving value
Gas asset optimization and other products round out a strong
portfolio
2007 delivered strong results
… in response to rising fuel costs and the need for new capacity.
15
First FCM auction implemented in NE
Other recontracting to drive value
Through the new capacity constructs, and repricing at
market prices …
Power’s capacity is located in three Northeast markets.
NE
NY
Total Capacity 13,300MW*
(~ 1,000 - 1,500 MW under RMR)
PJM
* Excludes 2,000MW of combined cycle generation in Texas under PSEG Power’s operating control.
The RPM Auction to date has provided strong price signals in PJM.
Delivery Year ($MW/Day)
2007 / 2008
2008 / 2009
2009 / 2010
2010 / 2011
2011 / 2012
Zones
Eastern MAAC*
$197.67
$148.80
$191.32
$174.29
$110.00
MAAC
---
---
$191.32 (a)
$174.29
$110.00
Rest of Pool
$40.80
$111.92
$102.04
$174.29
$110.00
* Majority of Power’s assets
(a) – includes APS
16
… Power expects to maintain strong margins.
Power’s fleet diversity and location ...
Market Perspective – BGS Auction Results
Increase in Full Requirements Component Due to:
Increased Congestion (East/West Basis)
Full Requirements
Increase in Capacity Markets/RPM
$111.50
$102.51
• Ancillary services
Volatility in Market Increases Risk Premium
$98.88
• Capacity
• Congestion
~ $43
• Load shape
~ $32
~ $41
$65.41
• RECs
• Transmission
$55.59
$55.05
• Risk premium
~ $21
~ $18
~ $21
$58-$60
$68 - $71
$44 - $46
$67 - $70
$33 - $34
Round the Clock
PJM West
Forward Energy
Price
2003
2004
2005
2006
2007
2008
… has enabled successful participation in each BGS auction and
17
cushioned customer impacts.
Note: BGS prices reflect PSE&G Zone
$36 - $37
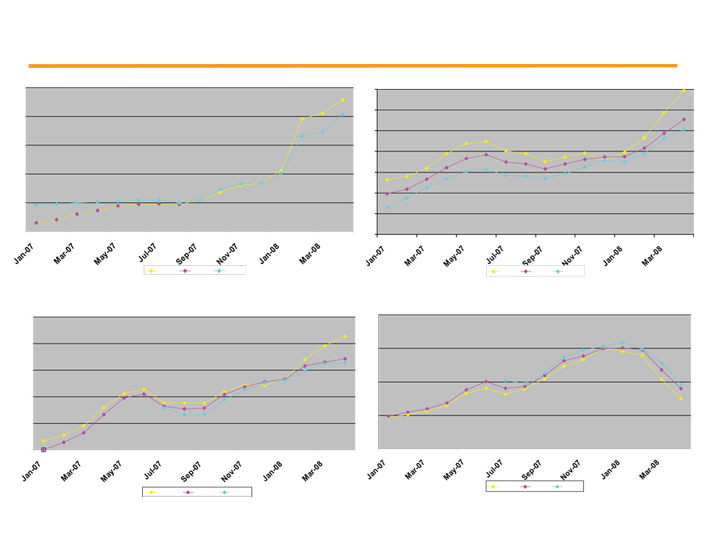
Rising coal and natural gas prices have driven LMPs ...
Central Appalachian Coal ($/Ton)
Natural Gas Henry Hub ($/MMbtu)
$90
$10.0
$9.5
$80
$9.0
$70
$8.5
$60
$8.0
$7.5
$50
$7.0
$40
$6.5
2009
2010
2011
2009
2010
2011
On Peak Heat Rate Expansion (MMbtu/MWh)
Electric PJM Western Hub RTC Price ($/MWh)
$80
10.5
$75
10.0
$70
9.5
$65
9.0
$60
$55
8.5
2009
2010
2011
2009
2010
2011
18
… and this trend may continue.
Note: Forward prices as of 4/28/08

The Regional Greenhouse Gas Initiative (RGGI) …
• Cooperative effort by Northeast states to
design a regional cap-and-trade program to
reduce carbon dioxide (CO2 ) emissions
– Full participants – CT, MA, MD, ME, NH, VT,
NY, NJ, RI, and DE
RGGI
States
ME
– Observers – PA, DC, and Eastern Canadian
Provinces and New Brunswick
VT
NH
•
Timeline
NY
– April 2003 process proposed by Governor Pataki
MA
– 2003 – 2006 – Stakeholder process
CT
PA
RI
– December 20, 2005 Final 7 state MOU
NJ
– March 23, 2006 – Draft Model Rule
– August 15, 2006 – Final Model Rule & amended
MOU
MD
Participating States
DE
– 2007-2008 – State level adoption
Observer States
– First RGGI allowance auction September 2008
– January 1, 2009 – Implementation
… is a potential influence on market prices.
19
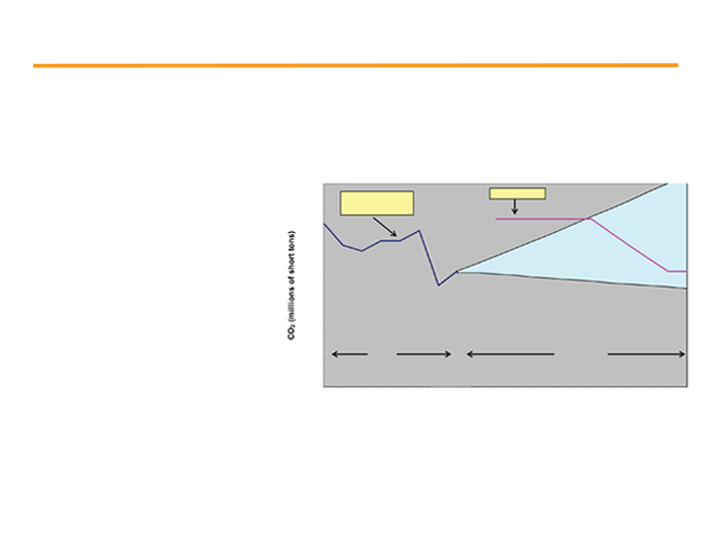
The RGGI cap shows headroom …
• Affected Sources
– Fossil fired electric generating units
CO2 Emissions vs. RGGI Cap
with a capacity of 25 megawatts
(Actuals through 2007)
(MW) and larger
200
RGGI Cap
Actual &
Forecast CO2
190
– Three-year compliance periods
180
with the first running from 2009-
2011
170
– Stabilization of CO2 emissions at
160
recent levels through 2015 (~188
million tons per year)
150
– Achieve a 10% reduction of CO2
Actual
Projected
140
emissions below recent levels by
2019
130
2000
2002
2004
2006
2008
2010
2012
2014
2016
2018
– This translates into ~13% reduction
below 1990 levels or ~35%
reduction from BAU levels by 2020
20
… when viewed in comparison to historical emissions.
• Targets and Timing

RGGI’s CO2 pricing projections …
$10
$8
$0
2009
2011
2013
2015
2017
2019
2021
2023
2025
RGGI - ICF Base
RGGI - ICF Base (Rev. Oct-06)
… reflect moderate prices, based on the headroom in the cap.
21
$2
$4
$6
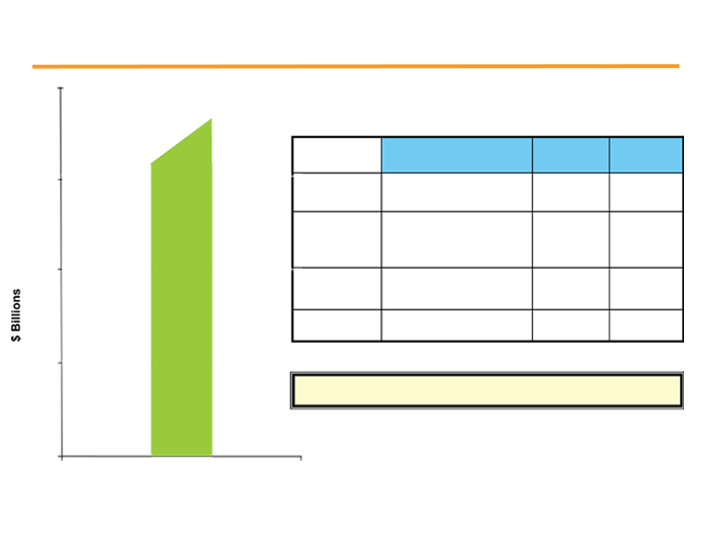
Power’s open EBITDA is approximately $2.6 - $2.8 billion …
$3.0
EBITDA
Assumption
Sensitivity
Impact
$2.5
Capacity
~ $60 - $65/KW-yr
(~ $165 - $178/MW-day)
$10/KW-yr
~ $120M
Energy
$1/MWh
~ $40M
~ $69 - 73/MWh
(PJM-West)
$2.0
Fuel
Gas ~$8.50 to $9.00/MB
Coal ~ $2.85 to $3.15/MB
O&M
~ $1.0 - 1.05B
$1.5
2008 Forecasted EBITDA $2.05B - $2.25B
$1.0
… which will vary depending upon market drivers.
22
* Open EBITDA reflects unhedged results of Power at market prices shown above
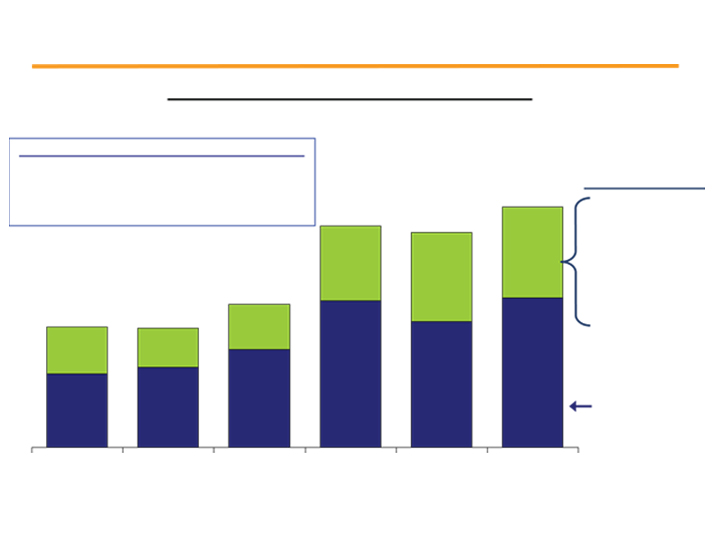
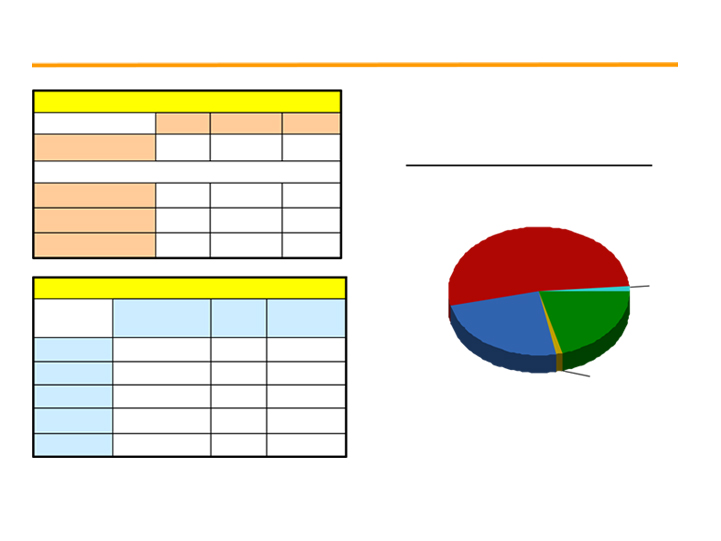
PSEG Power’s capital program
2007
2008
2009
2010
2011
2006 10-K
$584
$626
$516
$527
$198
($ millions)
2007 10-K
$562
$890
$675
$620
$430
($ millions)
Program focused on meeting environmental commitments,
capital associated with new capacity ($500M*) and exploring
the opportunity for new nuclear. All initiatives focused on
improving the fleet’s reliability and performance.
23
* Forecast capital spending associated with new peaking could be lower than amount indicated.
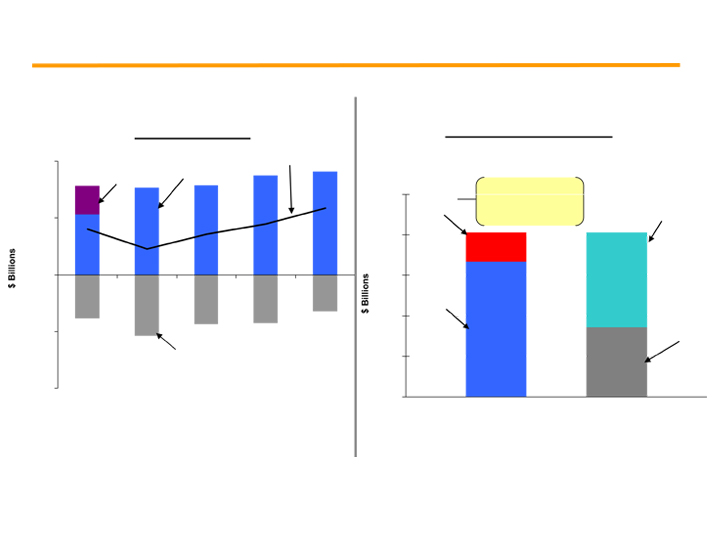
At Power, strong cash generation and declining
capital expenditures …
Power Cash Flow
Power Sources and Uses
(2008 – 2011 Forecast)
Net Cash
Flow
$2.0
Asset
Sales
Cash
from Ops
Incremental debt
$10.0
Net
capacity while
Dividends
Financing
maintaining target
to Parent
$1.0
credit measures
$8.0
$0.0
$6.0
Cash from
Ops
$4.0
($1.0)
Investments
Declining Investments
$2.0
($2.0)
$0.0
2007
2008
2009
2010
2011
Sources
Uses
… should result in substantial discretionary cash available to
24
PSEG for additional growth and/or share repurchases.

Public Service Enterprise Group

APPENDIX
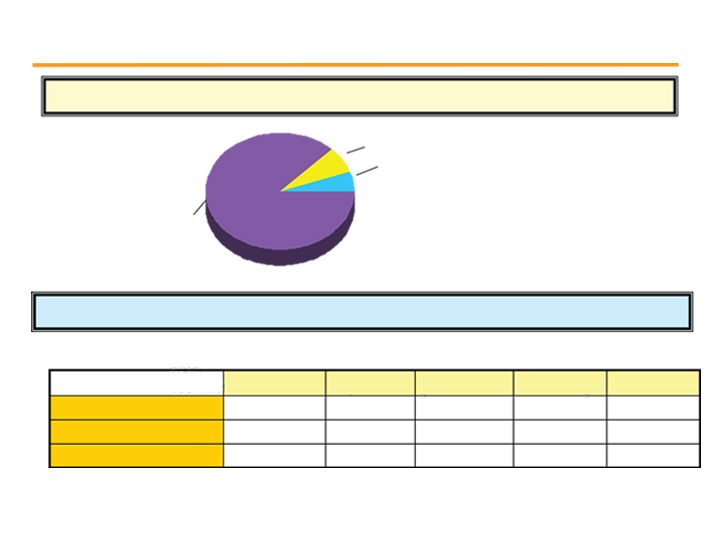
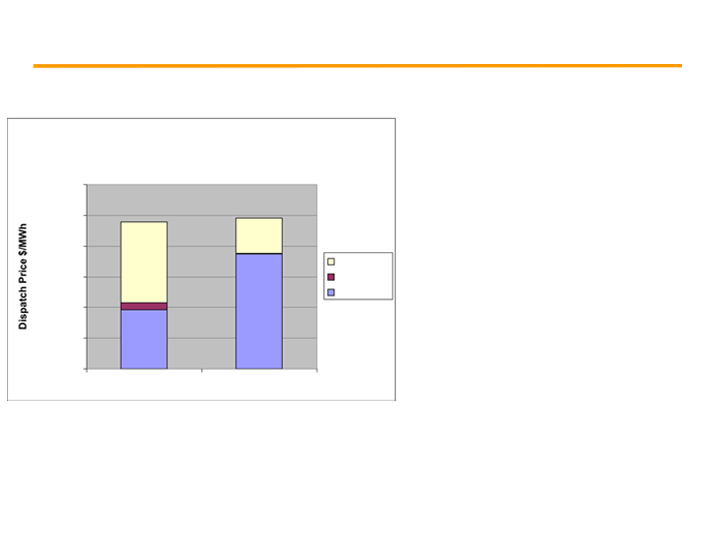
The implementation of carbon legislation will address
the critical issue of global warming …
By Fuel Type
Coal
CTs
CC
Carbon tons/MWh
1.0
0.6
0.4
PSEG Power Generation by Fuel
Price ($/MWh)
2007 Total GWh: 53,200*
@$10/ton
$10.0
$6.0
$4.0
Nuclear
@$20/ton
$20.0
$12.0
$8.0
@$30/ton
$30.0
$18.0
$12.0
54%
Dispatch curve implication @ $20/ton**
Pumped
Storage
On margin
$/MWh
Impact
19%
1%
(Illustrative)
25%
($/MWh)
Gas
Coal
50%
$20.0
$10.0
Coal
CTs
10%
$12.0
$1.2
Oil 1%
Gas CC
40%
$8.0
$3.2
Nuclear
0%
$0.0
$0.0
Total
100%
$14.4
… and will put additional upward pressure on energy prices.
27
* Excludes 2,000MW of combined cycle generation in Texas under PSEG Power’s operating control.
** For illustration purposes – potential impact of CO2 on power prices with current dispatch – not an indication of net effect on income.
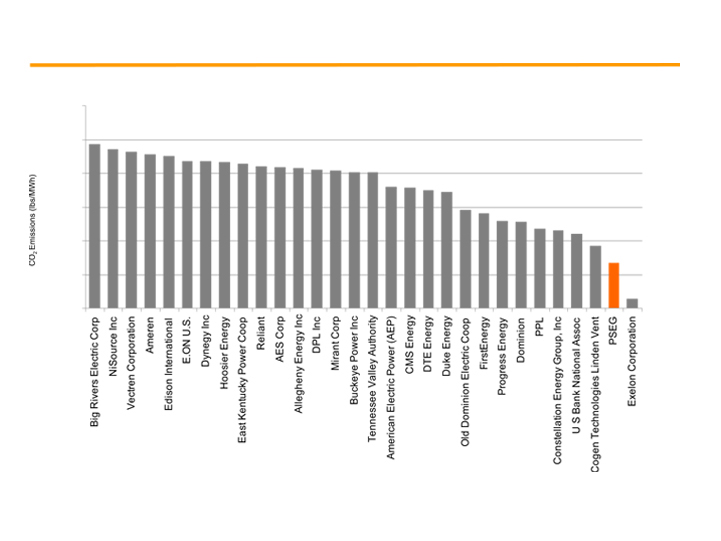
Power’s fleet has a low carbon profile …
2006 CO2 Emissions Rate Ranking
3,000
(Companies in PJM States)
2,500
2,000
1,500
1,000
500
0
* Source: Energy Information Administration (2006)
… which is well positioned for virtually any form of carbon restrictions.
28
The separation between coal and gas pricing …
Allowance Price Needed to
Dispatch Gas over Coal
• Fuel switching is an expensive
option
$120.00
$100.00
• At current fuel and allowance
$23.25
$80.00
prices, switching from coal to
CO2 Adder
$52.62
combined-cycle natural gas
$60.00
NOx & SO2
Fuel Cost
may require an allowance price
$40.00
of about $50/ton
$20.00
– Politically infeasible in the near
term
$-
Coal
CC NG
… may require significant carbon prices to alter dispatch.
29

Items Excluded from Net Income to Reconcile to Operating Earnings
($ millions )
(EPS)
Years Ended Dec. 31,
Years Ended Dec. 31,
2007
2006
2007
2006
Merger related Costs:
PSE&G
$
-
$
(1)
$
-
Enterprise
-
(7)
(0.02)
Total Merger related Costs
$
-
$
(8)
$
-
$
(0.02)
Impact of Asset Sales:
Loss on Sale of RGE
-
(178)
$
-
$
(0.35)
Chilquinta & Luz Del Sur
(23)
-
(0.05)
-
Write down of Turboven
(7)
-
(0.01)
-
Premium on bond redemption
(28)
(7)
(0.06)
(0.02)
Total Impact of Asset Sales
$
(58)
$
(185)
$
(0.12)
$
(0.37)
Discontinued Operations:
Power - Lawrenceburg
$
(8)
$
(239)
$
(0.02)
$
(0.47)
Holdings:
SAESA
(33)
57
(0.06)
0.11
Electroandes
57
16
0.11
0.03
Elcho and Skawina
-
226
-
0.45
Total Holdings
$
24
$
299
$
0.05
$
0.59
Total Discontinued Operations
$
16
$
60
$
0.03
$
0.12
Please see Slide 3 for an explanation of PSEG’s use of Operating Earnings as a non-GAAP financial measure and how it differs from Net Income.
30