Exhibit 99.1

Public Service Enterprise Group
PSEG Earnings Conference Call
3rd Quarter 2008
October 31, 2008

Forward-Looking Statement
Readers are cautioned that statements contained in this presentation about our and our subsidiaries' future performance, including future
revenues, earnings, strategies, prospects and all other statements that are not purely historical, are forward-looking statements for purposes of the safe harbor provisions under The Private Securities Litigation Reform Act of 1995. Although we believe that our expectations are based on reasonable assumptions, we can give no assurance they will be achieved. The results or events predicted in these statements may differ materially from actual results or events. Factors which could cause results or events to differ from current expectations include, but are not limited to:
• Adverse Changes in energy industry, policies and regulation, including market rules that may adversely affect our operating results.
• Any inability of our energy transmission and distribution businesses to obtain adequate and timely rate relief and/or regulatory approvals from
federal and/or state regulators.
• Changes in federal and/or state environmental regulations that could increase our costs or limit operations of our generating units.
• Changes in nuclear regulation and/or developments in the nuclear power industry generally, that could limit operations of our nuclear generating
units.
• Actions or activities at one of our nuclear units that might adversely affect our ability to continue to operate that unit or other units at the same
site.
• Any inability to balance successfully our energy obligations, available supply and trading risks.
• Any deterioration in our credit quality.
• Availability of capital and credit markets at reasonable pricing terms and ability to meet cash needs.
• Any inability to realize anticipated tax benefits or retain tax credits.
• Increases in the cost of or interruption in the supply of fuel and other commodities necessary to the operation of our generating units.
• Delays or cost escalations in our construction and development activities.
• Adverse capital market performance of our decommissioning and defined benefit plan trust funds.
• Changes in technology and/or increased customer conservation.
For further information, please refer to our Annual Report on Form 10-K, including Item 1A. Risk Factors, and subsequent reports on Form 10-Q and Form 8-K filed with the Securities and Exchange Commission. These documents address in further detail our business, industry issues and other factors that could cause actual results to differ materially from those indicated in this presentation. In addition, any forward-looking statements included herein represent our estimates only as of today and should not be relied upon as representing our estimates as of any subsequent date. While we may elect to update forward-looking statements from time to time, we specifically disclaim any obligation to do so, even if our estimates change, unless otherwise required by applicable securities laws.
1

GAAP Disclaimer
PSEG presents Operating Earnings in addition to its Net Income reported
in accordance with accounting principles generally accepted in the United
States (GAAP). Operating Earnings is a non-GAAP financial measure that
differs from Net Income because it excludes the impact of the sale of
certain non-core domestic and international assets and material
impairments and lease-transaction-related charges. PSEG presents
Operating Earnings because management believes that it is appropriate
for investors to consider results excluding these items in addition to the
results reported in accordance with GAAP. PSEG believes that the non-
GAAP financial measure of Operating Earnings provides a consistent and
comparable measure of performance of its businesses to help
shareholders understand performance trends. This information is
not intended to be viewed as an alternative to GAAP information. The last
slide in this presentation includes a list of items excluded from Net Income
to reconcile to Operating Earnings, with a reference to that slide included
on each of the slides where the non-GAAP information appears.
2

PSEG
2008 Q3 Review
Ralph Izzo
Chairman, President and Chief Executive Officer

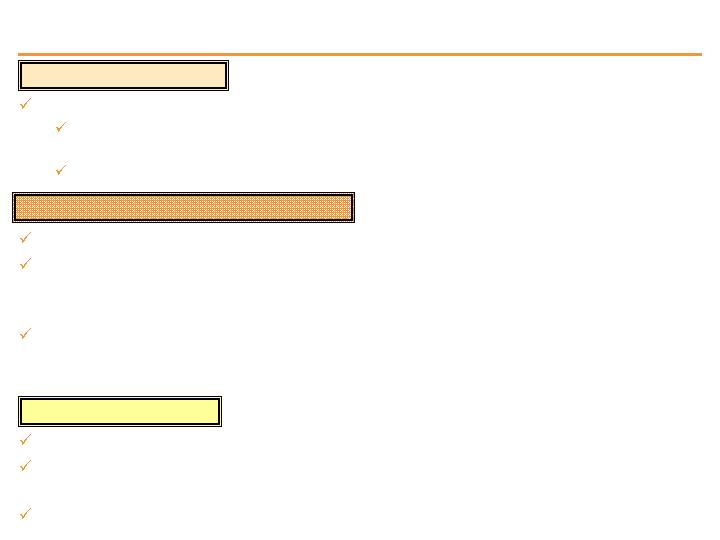
PSEG – Q3 2008 Highlights
Solid earnings performance:
Maintaining 2008 guidance of $2.80 - $3.05 per share
Supporting lower half of 2009 earnings of $3.05 - $3.35 per share
Strong operating performance maintained
PSE&G honored as America’s Most Reliable Electric Utility
PSEG Power — Nuclear capacity factor at 93% YTD September 30
— Nuclear uprates yield 173MW of new capacity
Supportive regulatory environment
NJ releases Energy Master Plan
Transmission rate order effective October 1, 2008
FERC endorses Reliability Pricing Model
RGGI auction in September 2008 – price for carbon at $3.07/ton
Strong balance sheet
Received approximately $600 million on sale of SAESA
$ 3.35 billion of available liquidity; capital needs funded from internal cash
Responding to challenging credit markets
4

Q3 2008 Earnings Summary
16
180
Discontinued Operations
$ 0.97
$ 0.94
EPS from Operating Earnings
506
656
Net Income
490
476
Income from Continuing Operations
(7)
—
Reconciling Items
$ 497
$ 476
Operating Earnings
2007
2008
$ millions (except EPS)
Quarter ended September 30,
5

YTD Earnings Summary
(7)
(491)
Reconciling Items
4
208
Discontinued Operations, net of tax
$ 2.19
$ 2.43
EPS from Operating Earnings
1,110
954
Net Income
1,106
746
Income from Continuing Operations
$ 1,113
$ 1,237
Operating Earnings
2007
2008
$ millions (except EPS)
Nine months ended September 30,
6
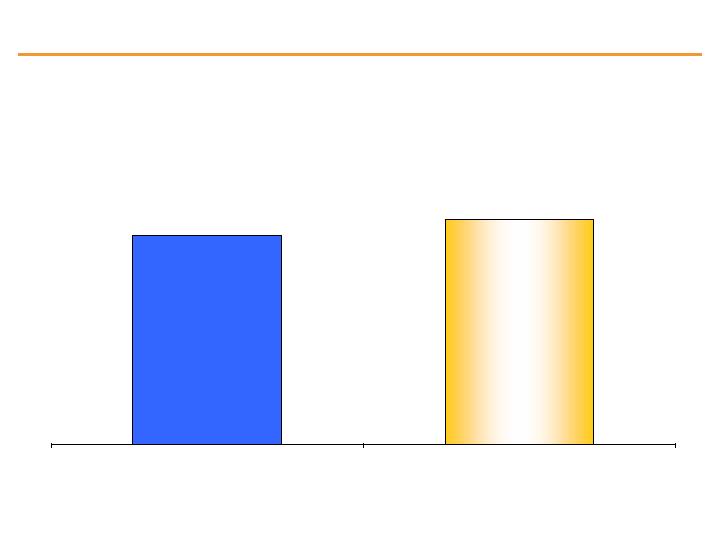
2007 Operating Earnings*
2008 Guidance
$2.71
$2.80 - $3.05
On Track to Meet 2008 Earnings Guidance
* As reported. Excludes Loss on Sale of Chilquinta and Luz Del Sur ($0.05), Write-down of Turboven ($0.01), Premium on Bond Redemption ($0.06), and Income from Discontinued Operations ($0.03)
$2.71
$2.80 - $3.05
On Track to Meet 2008 Earnings Guidance
* As reported. Excludes Loss on Sale of Chilquinta and Luz Del Sur ($0.05), Write-down of Turboven ($0.01), Premium on Bond Redemption ($0.06), and Income from Discontinued Operations ($0.03)
7
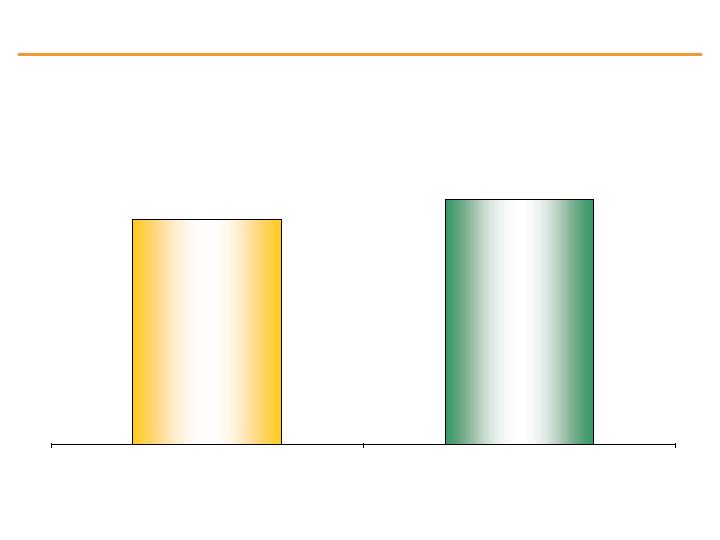
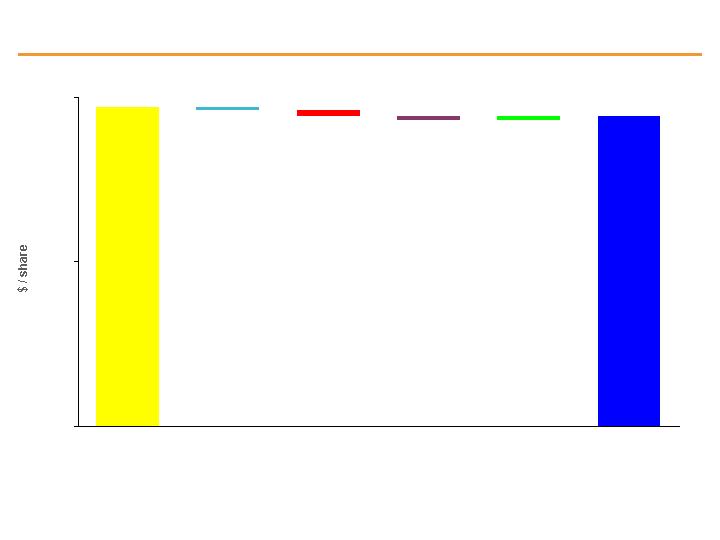
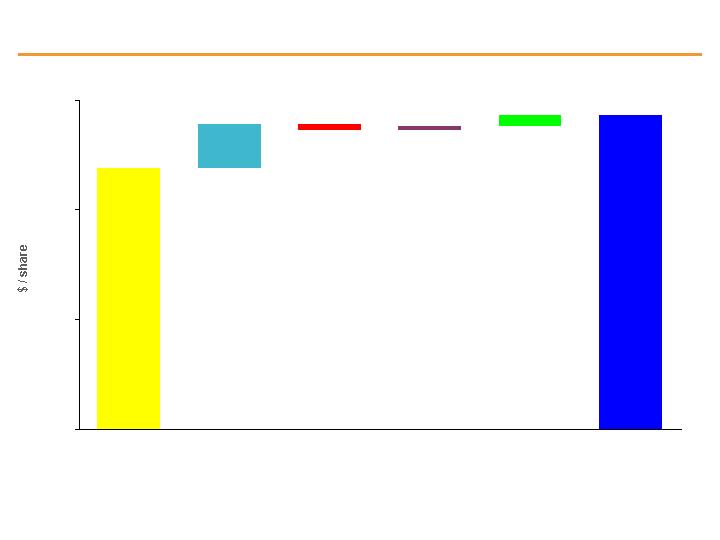
2008 Guidance
2009 Guidance
$2.80 - $3.05
$3.05 - $3.35
Fundamentals Continue to Support Growth in 2009 …
… But, Financial Market Stress May Limit Growth to Lower Half
of Forecast Range.

PSEG
2008 Q3 Operating Company Review
Tom O’Flynn
Executive Vice President and Chief Financial Officer

Q3 Operating Earnings by Subsidiary
$ 497
(10)
63
106
$ 338
2007
$ 476
(5)
56
97
$ 328
2008
Operating Earnings
Earnings per Share
(0.02)
(0.01)
Enterprise
$ 0.97
$ 0.94
Operating Earnings
0.12
0.11
PSEG Energy Holdings
0.21
0.19
PSE&G
$ 0.66
$ 0.65
PSEG Power
2007
2008
$ millions (except EPS)
Quarter ended September 30,
10

YTD Operating Earnings by Subsidiary
$ 1,113
(43)
113
299
$ 744
2007
$ 1,237
(14)
124
284
$ 843
2008
Operating Earnings
Earnings per Share
(0.08)
(0.03)
Enterprise
$ 2.19
$ 2.43
Operating Earnings
0.22
0.24
PSEG Energy Holdings
0.59
0.56
PSE&G
$ 1.46
$ 1.66
PSEG Power
2007
2008
$ millions (except EPS)
Nine months ended September 30,
11

PSEG Power
2008 Q3 Review

PSEG Power – Q3 2008 EPS Summary
$ 253
$ 1,580
$ 1,833
Operating Revenues
($ 0.01)
$ 0.66
$ 0.65
EPS from Operating Earnings
(11)
339
328
Net Income
(1)
1
—
Discontinued Operations
(10)
338
328
Income from Continuing Operations
(10)
338
328
Operating Earnings
Variance
Q3 2007
Q3 2008
$ millions (except EPS)
13
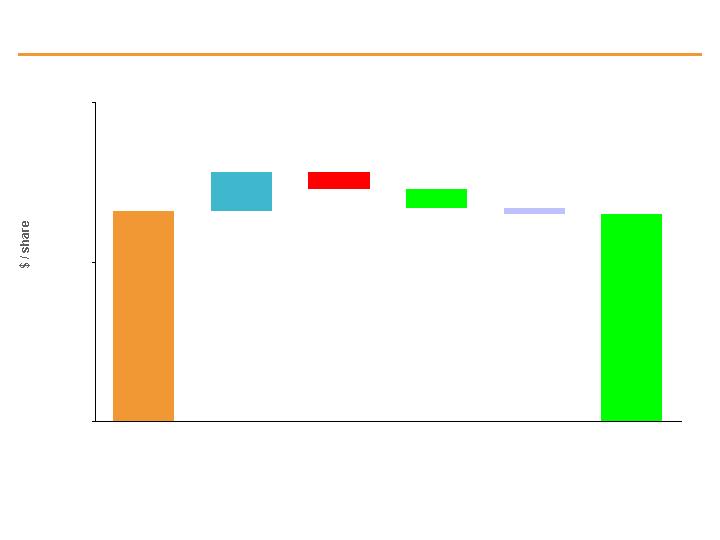
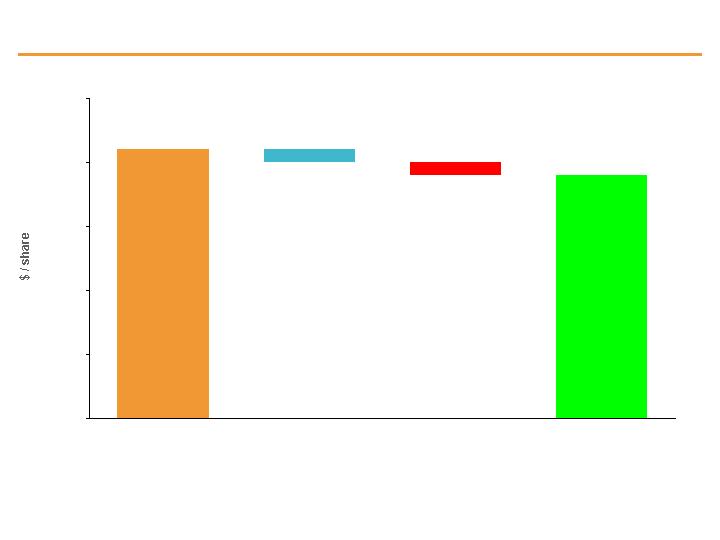
$.66
.12
(.05)
(.06)
(.02)
$.65
0.00
0.50
1.00
Recontracting
and strong
markets
PSEG Power EPS Reconciliation – Q3 2008 versus Q3 2007
Q3 2008
operating
earnings*
Q3 2007
operating
earnings*
MTM
Depreciation, NDT &
Other
O&M
* See page 32 for Items excluded from Net Income to reconcile to Operating Earnings
14
PSEG Power – Generation Measures
7,409
7,628
3,824
3,730
4,048
4,144
0
5,000
10,000
15,000
20,000
2007
2008
Quarter ended September 30,
Total Nuclear
Total Coal*
Total Oil &
Natural Gas
* Includes figures for Pumped Storage
PSEG Power – Generation (GWh)
15,281
15,502
21,823
21,924
9,947
10,276
9,037
10,571
0
15,000
30,000
45,000
2007
2008
Nine months ended September 30,
40,807
42,771
15
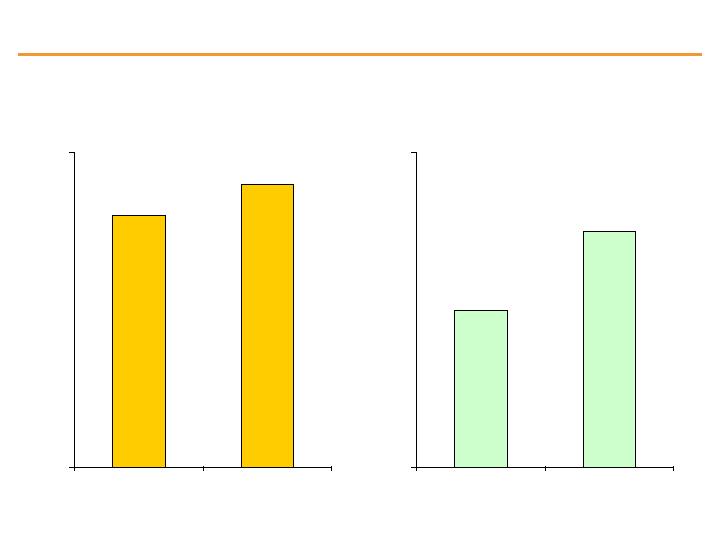
$40
$60
2007
2008
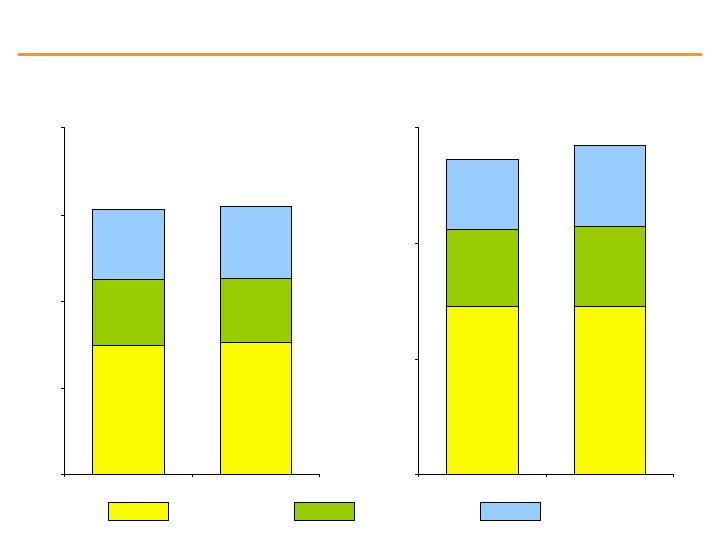
Strong Pricing Supports Margin Improvement
$40
$60
2007
2008
PSEG Power Gross Margin* ($/MWh)
$56
$58
Quarter ended September 30,
Nine months ended September 30,
$50
$55
* Includes MTM
16

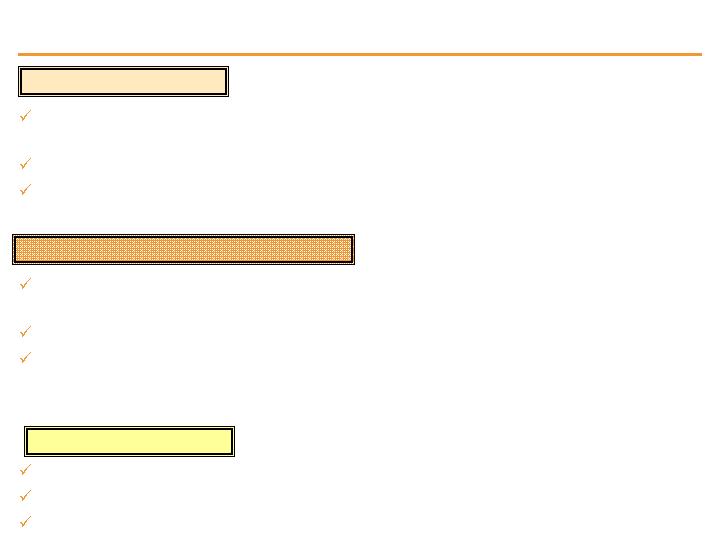
PSEG Power – Q3 Operating Highlights
Output increased 1.5%.
For the quarter, nuclear fleet capacity factor improved to 94.6%; YTD capacity factor of
93.1% ahead of expectations.
Combined cycle fleet operated at capacity factors in excess of 50%.
Maintenance programs at NJ coal fleet limited capacity factor to 72%.
Power uprates at Hope Creek of 150MW; Salem No. 2 of 23MW.
Operations
Regulatory and Market Environment
Financial
RPM auction upheld by FERC in September; PJM evaluating ways to improve auction.
Clean Air Interstate Rule (CAIR) – US Court of Appeals for District of Columbia Circuit
requesting briefing on whether any party is seeking repeal and/or whether the Court should stay its mandate to vacate.
RGGI auction in September; carbon prices set at $3.07/ton.
$1.7 billion of available liquidity on its lines of credit as of September 30; access to additional PSEG credit of $1.1 billion.
Power wins bid to build 130MW of peaking capacity for June 2012 in-service at cost of
$130-$140 million.
Value of NDT fund affected by market volatility.
17

PSE&G
2008 Q3 Review

PSE&G – Q3 2008 Earnings Summary
($ 0.02)
$ 0.21
$ 0.19
EPS from Operating Earnings
(9)
106
97
Income from Continuing Operations/
Net Income
(9)
106
97
Operating Earnings
$ 168
$ 2,106
$ 2,274
Operating Revenues
Variance
Q3 2007
Q3 2008
$ millions (except EPS)
19
$.21
(.01)
(.01)
$.19
0.00
0.05
0.10
0.15
0.20
0.25
PSE&G EPS Reconciliation – Q3 2008 versus Q3 2007
Q3 2008
operating
earnings*
Q3 2007
operating
earnings*
Electric Margin
Depreciation, Interest
& O&M
* See page 32 for Items excluded from Net Income to reconcile to Operating Earnings
20
PSE&G – Q3 Operating Highlights
FERC approved request for cost of service formula rates for existing and future
transmission investments effective October 1, 2008.
NJ BPU approved 14.2% increase in base prices for gas commodity supply.
NJ released its Energy Master Plan calling for a 20% reduction in peak demand
by 2020, a 20% reduction in energy consumption by 2020 and 30% supply from
renewable resources by 2020.
Turmoil in financial markets affecting outlook for electric sales growth.
Capital to be invested in areas with regulatory support.
$447 million of available liquidity on its lines of credit as of September 30.
Operations
Regulatory and Market Environment
Financial
PSE&G, for the third time in four years, has been named America’s most reliable
electric utility and the most reliable Mid-Atlantic utility for the seventh year.
O&M growth remains below inflation.
Accounts receivable balance and aging stable as a result of customer outreach
programs.
21

PSEG Energy Holdings
2008 Q3 Review

PSEG Energy Holdings – Q3 2008 Earnings Summary
7
(7)
-
Reconciling Items
-
56
56
Income from Continuing Operations
($0.01)
$ 0.12
$ 0.11
EPS from Operating Earnings
165
71
236
Net Income
165
15
180
Discontinued Operations
($ 7)
$ 63
$ 56
Operating Earnings
Variance
Q3 2007
Q3 2008
$ millions (except EPS)
23
(.01)
(.02)
$.11
(.01)
(.02)
.02
.05
$.12
(.01)
(.01)
0.00
0.05
0.10
0.15
0.20
PSEG Energy Holdings EPS Reconciliation – Q3 2008 versus
Q3 2007
Q3 2008
operating
earnings*
Q3 2007
operating
earnings*
Effective Tax
Rate
Earnings
on
Chilquinta/
LDS
Texas -
Operations .01
MTM .04
Interest
Expense
GLOBAL
RESOURCES
Interest
Expense
Effective Tax
Rate
Lease
Income
Other
* See page 32 for Items excluded from Net Income to reconcile to Operating Earnings
24
PSEG Energy Holdings – Q3 Operating Highlights
PSEG Global exploring options for its remaining international investments.
The Emergency Economic Stabilization Act of 2008 supports development of
renewables with extension of tax credits for solar and other renewable energy
sources.
Garden State Offshore Energy, a joint venture of PSEG Renewable Generation and Deepwater Wind, was chosen by NJ BPU to explore the development of a 350MW offshore wind farm.
SAESA sale – received approximately $600 million after Chilean and US taxes.
Additional $80 million tax deposit made with the IRS in September 2008 to defray
interest costs on disputed payments.
$115 million of available liquidity on its lines of credit as of September 30.
Operations
Regulatory and Market Environment
Financial
Texas – 2,000 MW gas-fired combined cycle capacity
1,000MW Guadalupe facility benefited from normal weather, increased dispatch and
spark spreads.
1,000MW Odessa facility Q3 dispatch flat to last year with increased spark spreads.
25

PSEG

Maintaining 2008 Operating Earnings Guidance
$2.80 - $3.05
$1,420 - $1,560
(15) - (10)
75 - 90
350 - 370
$1,010 - $1,110
Current
$2.80 - $3.05
$1,420 - $1,560
(15) - (10)
45 - 60
350 - 370
$1,040 - $1,140
Prior
Enterprise
Earnings per Share
Operating Earnings
PSEG Energy Holdings
PSE&G
PSEG Power
$ millions (except EPS)
27

Liquidity – Sufficient to Meet Capital Requirements
PSEG has $3.35 billion of available liquidity as of September 30
to meet capital needs. During 2008, PSEG, PSEG Power and
PSE&G added capacity of $147 million, $225 million and $28
million, respectively, to their lines of credit.
Capital expenditure forecast for 2009 reduced by $275 - $325
million from prior levels.
PSEG, as of September 30, 2008, had $658 million of remaining
authorization under its $750 million common stock repurchase
program. The program was authorized in July 2008 to be
executed over an 18-month period.
28

Expiration
Total
Primary
Usage at
Available
Company
Facility
Date
Facility
Purpose
9/30/2008
9/30/2008
PSEG
5-year Credit Facility
Dec-12
$1,000
1
CP Support/Funding/LCs
$0
$1,000
Bilateral Credit Facility
Jun-09
$100
CP Support/Funding
$0
$100
Uncommitted Bilateral
Agreement
N/A
N/A
Funding
0
N/A
Power
5-Year Credit Facility
Dec-12
1,600
2
Funding/LCs
225
1,375
Bilateral Credit Facility
Jun-09
100
Funding/LCs
0
100
Bilateral Credit Facility
Mar-09
150
Funding/LCs
59
91
Bilateral Credit Facility
Sep-09
50
Funding
0
50
Bilateral Credit Facility
Mar-10
100
Funding/LCs
25
75
PSE&G
5-year Credit Facility
Jun-12
600
3
CP Support/Funding/LCs
153
447
Uncommitted Bilateral
N/A
N/A
Funding
28
N/A
Energy
5-year Credit Facility
Jun-10
136
Funding/LCs
21
115
Holdings
Total
$3,836
$3,353
1
PSEG Facility reduces by $47 million in 2012
2
Power Facility reduces by $75 million in 2012
3
PSE&G Facility reduces by $28 million in 2012
($ millions)
PSEG Liquidity as of September 30, 2008
29
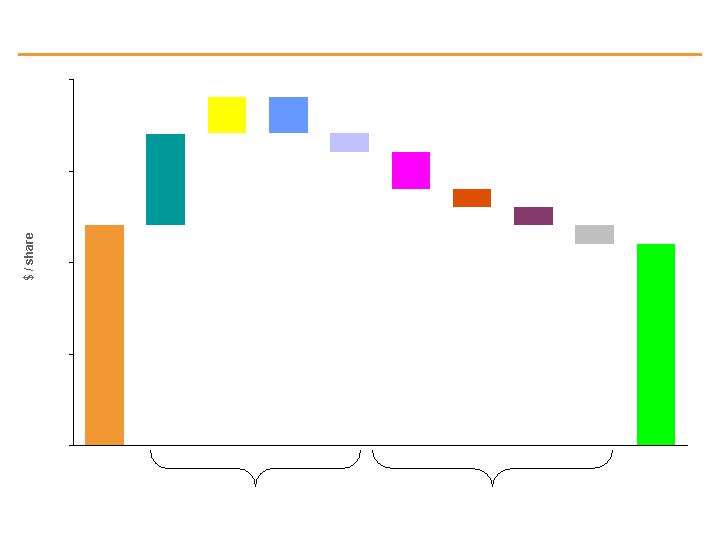
$.97
(.01)
(.02)
(.01)
.01
$.94
0.00
0.50
1.00
PSEG EPS Reconciliation – Q3 2007 versus Q3 2008
Q3 2008
operating
earnings*
Q3 2007
operating
earnings*
Interest
Recontracting
and strong
markets .12
MTM (.05)
O&M (.06)
Depreciation,
interest & NDT
(.02)
PSEG Power
Electric Margin
(.01)
Depreciation,
interest and
O&M (.01)
PSE&G
PSEG Energy
Holdings
Enterprise
Global:
Texas – MTM .04
Operations .01
Interest expense .02
Chilquinta/LDS (.02)
Effective tax rate
(.01)
Resources:
Effective tax rate
(.02)
Lease income (.01)
Interest Expense
(.01)
Other (.01)
* See page 32 for Items excluded from Net Income to reconcile to Operating Earnings
30
$2.19
.20
(.03)
.02
.05
$2.43
1.00
1.50
2.00
2.50
PSEG EPS Reconciliation – YTD 2007 versus YTD 2008
Nine months
ended 9/30/2008
operating
earnings*
Nine months
ended 9/30/2007
operating
earnings*
Interest
Recontracting and
strong markets .36
MTM .03
Depreciation,
interest & NDT (.09)
O&M (.10)
PSEG Power
Effective tax rate .06
Weather – Gas (.02)
O&M (.02)
Gas (.01)
Transmission (.01)
Electric (.01)
Depreciation &
Other (.02)
PSE&G
PSEG Energy
Holdings
Enterprise
Global:
Texas – MTM .02
Operations .07
Interest expense .07
Effective tax rate .02
Chilquinta/LDS (.08)
Other (.02)
Gain on 2007 sale of
Tracy (.01)
2007 settlement &
Other (.01)
Resources:
Effective tax rate .01
Lease income (.02)
Other (.02)
Interest Expense
(.01)
* See page 32 for Items excluded from Net Income to reconcile to Operating Earnings
31

Items Excluded from Net Income to Reconcile to Operating Earnings
Please see Slide 2 for an explanation of PSEG’s use of Operating Earnings as a non-GAAP financial measure and how
it differs from Net Income.
Pro-forma Adjustments
2008
2007
2008
2007
Earnings Impact (in Millions)
Lease Transaction Reserves, net of tax
-
$
-
$
(490)
$
-
$
Loss from write-down of Turboven, net of tax
-
(7)
-
(7)
Premium on Bond Redemption, net of tax
-
-
(1)
-
Total Pro-forma to Operating Earnings
-
$
(7)
$
(491)
$
(7)
$
Fully Diluted Average Shares Outstanding (in Millions)
508
509
509
508
Per Share Impact (Diluted)
Lease Transaction Reserves, net of tax
-
$
-
$
(0.96)
$
-
$
Loss from write-down of Turboven, net of tax
-
(0.01)
-
(0.01)
Premium on Bond Redemption, net of tax
-
-
-
-
Total Pro-forma to Operating Earnings
-
$
(0.01)
$
(0.96)
$
(0.01)
$
September 30,
September 30,
For the Quarters Ended
For the Nine Months Ended
32