
We make things work for you.
Public Service Enterprise Group
Presentation to the Financial Community
New York, New York
March 18, 2009

Forward-Looking Statement
Readers are cautioned that statements contained in this presentation about our and our subsidiaries’ future performance, including future revenues, earnings, strategies, prospects and all other statements that are not purely historical, are forward-looking statements for purposes of the safe harbor provisions under The Private Securities Litigation Reform Act of 1995. Although we believe that our expectations are based on reasonable assumptions, we can give no assurance they will be achieved. The results or events predicted in these statements may differ materially from actual results or events. Factors which could cause results or events to differ from current expectations include, but are not limited to:
Adverse changes in energy industry, policies and regulation, including market structures and rules.
Any inability of our energy transmission and distribution businesses to obtain adequate and timely rate relief and regulatory approvals from federal and state regulators.
Changes in federal and state environmental regulations that could increase our costs or limit operations of our generating units.
Changes in nuclear regulation and/or developments in the nuclear power industry generally, that could limit operations of our nuclear generating units.
Actions or activities at one of our nuclear units that might adversely affect our ability to continue to operate that unit or other units at the same site.
Any inability to balance our energy obligations, available supply and trading risks.
Any deterioration in our credit quality.
Availability of capital and credit at reasonable pricing terms and our ability to meet cash needs.
Any inability to realize anticipated tax benefits or retain tax credits.
Increases in the cost of or interruption in the supply of fuel and other commodities necessary to the operation of our generating units.
Delays or cost escalations in our construction and development activities.
Adverse investment performance of our decommissioning and defined benefit plan trust funds, and changes in discount rates and funding requirements.
Changes in technology and increased customer conservation.
For further information, please refer to our Annual Report on Form 10-K, including Item 1A. Risk Factors, and subsequent reports on Form 10-Q and Form 8-K filed with the Securities and Exchange Commission. These documents address in further detail our business, industry issues and other factors that could cause actual results to differ materially from those indicated in this presentation. In addition, any forward-looking statements included herein represent our estimates only as of today and should not be relied upon as representing our estimates as of any subsequent date. While we may elect to update forward-looking statements from time to time, we specifically disclaim any obligation to do so, even if our internal estimates change, unless otherwise required by applicable securities laws.
Delivering Value: Today and Tomorrow
2

GAAP Disclaimer
PSEG presents Operating Earnings in addition to its Net Income reported
in accordance with accounting principles generally accepted in the United
States (GAAP). Operating Earnings is a non-GAAP financial measure that
differs from Net Income because it excludes the impact of the sale of
certain non-core domestic and international assets and material
impairments and lease-transaction-related charges. PSEG presents
Operating Earnings because management believes that it is appropriate
for investors to consider results excluding these items in addition to the
results reported in accordance with GAAP. PSEG believes that the non-
GAAP financial measure of Operating Earnings provides a consistent and
comparable measure of performance of its businesses to help
shareholders understand performance trends. This information is
not intended to be viewed as an alternative to GAAP information. The last
slide in this presentation includes a list of items excluded from Net Income
to reconcile to Operating Earnings, with a reference to that slide included
on each of the slides where the non-GAAP information appears.
Delivering Value: Today and Tomorrow
3

Agenda
Stephen Byrd
PSEG Energy Holdings – Review and Outlook
9:00 – 9:30
PSE&G and PSEG Energy Holdings – Q&A
9:30 – 9:45
Presenter
Presentation
Time
Ralph Izzo
Summary and Q&A
Tom O’Flynn
PSEG Financial Review and Outlook
11:45 – 12:15
Dan Cregg
PSEG Power – Financial Outlook
11:15 – 11:45
Joe Hopf
PSEG Power – Market Overview
10:45 – 11:15
Bill Levis
PSEG Power – Review and Outlook
10:00 – 10:45
BREAK
Ralph LaRossa
PSE&G – Review and Outlook
8:30 – 9:00
Ralph Izzo
PSEG Strategic Overview
8:00 – 8:30
Kathleen Lally
Welcome / Introduction
8:00
Delivering Value: Today and Tomorrow
4

We make things work for you.
PSEG - Review and Outlook
Ralph Izzo
Chairman, President and Chief Executive Officer

Public Service Enterprise Group …
… an energy provider
meeting the needs of customers
and shareholders.
Meeting
Commitments
Delivering
Value Today
Positioned for
the Future
Delivering Value: Today and Tomorrow
6

PSEG: Establishing a foundation…
Meeting Commitments
Achieved earnings targets
Operational excellence drove results
Sharpened business focus; international assets sold
Balance sheet strengthened; credit outlook improved
Attractive dividend growth rate
… and building a record that sets us apart.
Delivering Value: Today and Tomorrow
7

2006 Operating
Earnings*
2007 Operating
Earnings*
2008 Operating
Earnings*
$2.72
$1.72
$2.92
$1.72
$1.87
$2.57
$2.72
$2.80
$3.05
We have achieved the targets we set for earnings...
… despite the turmoil of recent years.
Guidance
Range
Guidance
Range
Guidance
Range
*See page 139 for Items excluded from Income from Continuing Operations to reconcile to Operating Earnings
Initial
Guidance
$2.30
$2.50
**
**2008 Operating results include ($0.11) impact from NDT and MTM
Delivering Value: Today and Tomorrow
8

PSEG Power’s focus on operational excellence…
… resulted in a record year of power generation.
30,000
40,000
50,000
60,000
50
75
100
0
25
50
Total Generation (GWh)
Nuclear Capacity
Factor (%)
Combined Cycle
Capacity Factor (%)
2007
2008
2007
2008
2007
2008
Delivering Value: Today and Tomorrow
9

PSE&G’s focus on operational excellence…
0.5
1.0
2005
2006
2007
2008
50
60
70
80
2005
2006
2007
2008
90%
95%
100%
2005
2006
2007
2008
0%
50%
100%
2005
2006
2007
2008
SAIFI
CAIDI
Gas Leak Response Rate
General Inquiry Service Level
Top Quartile Benchmark
PSE&G Performance
… continued a tradition of industry-leading reliability.
Delivering Value: Today and Tomorrow
10

A focus on value …
… producing a strong financial base.
Sale of international
assets yielded
$ 1.5B over 2007-
2008.
Debt reduced $1.8B*.
Stable credit
outlook achieved.
Improved credit
metrics.
* $1.8B reduction at Enterprise and PSEG Energy Holdings over 2007-2008.
Delivering Value: Today and Tomorrow
11

Making decisions and achieving results…
… to strengthen operational and financial position.
Delivering Value Today
2009 earnings guidance represents continued
growth
Operational excellence improving results
Core business investments providing attractive
returns
Dividend increased – 6th consecutive year; 102nd
year of paying an annual dividend
Strong financial position – credit metrics, liquidity
Delivering Value: Today and Tomorrow
12

Strong operations and risk controls…
… position us to meet challenges of today’s market.
Asset optimization yielding
results
Forecasting record power generation
for 2009
Power’s BET (Back-end Technology)
construction on time, on budget
7th successful BGS auction insulates
Power from market volatility
On track to achieve
earnings growth in 2009.
Guidance maintained at
$3.00 - $3.25.
Investment focus on projects
with attractive risk-adjusted
returns
iPower installation on track
Infrastructure
Energy Efficiency
Solar
Delivering Value: Today and Tomorrow
13

… continues 102-year history of paying common dividends.
70%
44%
Payout
Ratio
41% - 44%
43%
66%
63%
$1.10
$1.12
$1.33
$1.17
$1.29
$1.14
2004
2005
2006
2007
2008
2009E
*Indicated annual dividend rate
*
Dividends per Share
Sixth consecutive annual increase in common dividend …
Delivering Value: Today and Tomorrow
14

Operational excellence, financial strength and disciplined investment …
Positioned for the Future
… support shareholder value.
Balanced business mix
BGS: A demonstrated mechanism for meeting
customer supply at market prices for multi-year period
Federal and State policies provide opportunities for
growth – Leadership position in energy policy
T&D investments providing growth with minimal rate
impact
Strong financial position and cash flow provide
flexibility in volatile markets – No need to issue equity
Delivering Value: Today and Tomorrow
15

Energy Policy has moved to the forefront of the national agenda.
PSEG is well-situated to respond.
“No single issue is as fundamental to our future
as energy.”
- President Obama, January 26, 2009
“By embracing new approaches to energy, we are providing the
pathway to both economic prosperity and environmental
protection.”
- Governor Jon Corzine, October 22, 2008
Delivering Value: Today and Tomorrow
16

Anticipate Congressional action in energy legislation…
Energy legislation emphasis
Renewable Portfolio Standard
Transmission expansion
Smart grid investments
Carbon legislation drivers for action
EPA – States – International negotiations
Congress looking for simplicity
Obama Administration’s 10-year budget proposal
includes $645 billion from emission allowances, or $12 –
$15/ton in 2012 and increasing to $15 - $20/ton in 2020
… which could be combined with federal carbon legislation.
Delivering Value: Today and Tomorrow
17
PSEG establishing a policy leadership position …
Power LLC
Energy Holdings
Electric and Gas
Delivery
Leveraged Leases and
Renewable Investments
Regional
Wholesale Energy
… in promoting a sustainable energy future.
PSE&G positioned to
meet NJ’s energy policy
and economic growth
objectives with $1.7
billion investment
program.
PSEG Power’s low-cost
baseload nuclear fleet
well-positioned in
carbon constrained
environment.
PSEG Energy Holdings
positioned to pursue
attractive renewable
generation opportunities.
Compressed Air Energy
Storage (CAES)
Solar
Offshore wind
Delivering Value: Today and Tomorrow
18

PSEG leadership recognized
Named one of the Most
Admired Companies,
2007 & 2008
Dow Jones
Sustainability Indexes
One of 125 companies
named to DJSI North
America and one of only
10 U.S. electric
companies included
ALL BUSINESS
ALL NEW JERSEY
Corporation of the year 2007
One of the 400 best
big companies, 2008
PSE&G named America’s Most
Reliable Utility
Mid-Atlantic Region
winner for the 7th straight year
PSEG Chairman
Ralph Izzo named
CEO of the year
Carbon Disclosure
Leadership Index 2008
2008 Balanced Scorecard
Achievement Award
Solar electric power association
Delivering Value: Today and Tomorrow
19

PSEG – Delivering Value: Today and Tomorrow
Delivering
Value Today
Positioned for
the Future
Achieved earnings targets
Operational excellence
drove results
Sharpened business focus;
international assets sold
Balance sheet
strengthened; credit
outlook improved
Attractive dividend growth
rate
2009 earnings guidance
represents continued
growth
Operational excellence
improving results
Core business
investments providing
attractive returns
Dividend increased – 6th
consecutive year; 102nd
year of paying an annual
dividend
Strong financial position
– credit metrics, liquidity
Balanced business mix
BGS: A demonstrated
mechanism for meeting
customer supply at market
prices for multi-year period
Federal and State policies
provide opportunities for
growth – Leadership position
in energy policy
T&D investments providing
growth with minimal rate
impact
Strong financial position and
cash flow provide flexibility in
volatile markets – No need to
issue equity
Meeting
Commitments
Delivering Value: Today and Tomorrow
20

Operational excellence, financial strength and disciplined investment…
… position us well in today’s market.
Low payout ratio and strong balance sheet provide support
Is dividend secure?
Strong balance sheet, credit metrics and liquidity
What is the impact of
credit market stress?
Strong cash flow well in excess of PSE&G’s equity
requirements
Do you need equity?
Carbon friendly
Federal and State Policy initiatives support capital plans
How is PSEG affected
by policy changes?
Multi-year hedging profile supported by core assets
Asset balance dampens relative fuel price volatility
Capacity markets provide stability
What’s the impact of
commodity volatility?
PSE&G current/pending rate needs equal 2-4% impact
BGS supply generally priced at market
What is impact on
customer from capital
programs?
PSEG Position
Market’s Questions
Delivering Value: Today and Tomorrow
21

PSE&G - Review and Outlook
We make things work for you.
Ralph LaRossa
President and Chief Operating Officer, PSE&G

Earnings targets met
Transmission formula rate
treatment received from
FERC
Strong O&M control
Reduced Distribution capital
expenditures
National ReliabilityOne
Award winner
Earnings on track to meet
2009 guidance
Distribution base rate case
filing mid-2009 to address
capital and O&M recovery
Transmission investment
increasing
New customer information
system to go-live end of 1st
quarter
Active participant in shaping
State energy policy
Prepared to meet NJ’s
stimulus and energy goals
Resolve Distribution base
rate case by mid-2010
Investment program
responsive to NJ’s
economic and energy-
related goals
Transmission formula rates
provide current return on
invested capital
Earnings growth in line with
capital investment
Continue to lead the nation
in electric reliability
PSE&G – Delivering Value: Today and Tomorrow
Delivering
Value Today
Positioned for
the Future
Meeting
Commitments
Delivering Value: Today and Tomorrow
23

PSE&G met earnings targets…
… through fair rate treatment and diligent O&M management.
2007 Operating
Earnings*
Sales
Weather
O&M
Depreciation,
Interest and
Other
Taxes
2008 Operating
Earnings*
$350M
$370M
Guidance
Range
$330M
$350M
Guidance
Range
$376M
($21M)
($7M)
$10M
($9M)
$11M
$360M
*See page 139 for Items excluded from Income from Continuing Operations to reconcile to Operating Earnings
Delivering Value: Today and Tomorrow
24

Regulatory decisions…
PSE&G’s revenues fall under the regulatory jurisdiction of:
NJ Board of Public Utilities (BPU)
Commission has jurisdiction over Electric and Gas Distribution and
Energy Master Plan investments
Anticipate filing Electric and Gas base rate case in mid-2009
Last base rate case resulted in settlement effective November 2006
Federal Energy Regulatory Commission (FERC)
Commission has jurisdiction over Electric Transmission revenues
Formula rate treatment for Transmission effective on October 1,
2008 with true-up adjustments for operating and maintenance
expense and capital on annual basis
Allowed ROE of 11.68%
Additional incentive of 1.25% ROE for Susquehanna-to-Roseland
investment
… have provided PSE&G the opportunity to earn a fair return.
Delivering Value: Today and Tomorrow
25

PSE&G refocused its investments in late 2008 in response to the 4th quarter market stress.
PSE&G’s current investment plan…
34%
51%
15%
0%
30%
1%
20%
49%
32%
17%
1%
50%
… provides for growth in rate base of 9% which drives solid growth
in earnings from 2009 – 2011 of 13% - 14%.
PSE&G Rate Base
28%
25%
1%
46%
Electric Transmission
Electric Distribution
Gas Distribution
Energy Master Plan
2008
Rate Base $6.9B
Equity Ratio ~ 50%
2009
Rate Base $7.4B
Equity Ratio ~ 51%*
2010
Rate Base $8.0B
Equity Ratio ~ 51%*
2011
Rate Base $8.8B
Equity Ratio ~ 51%*
*Pending regulatory approval
Delivering Value: Today and Tomorrow
26

0
100
200
300
400
500
600
2007
2008
2009
2010
2011
Reliability Performance Metrics compared to
Peer Panel have been Top Quartile since:
National ReliabilityOne
Award winner three of
the last four years
… and focusing investment to achieve top quartile reliability performance.
PSE&G Base* O&M
2004
CAIDI
2006
Damages per Locate 1,000 Requests
2000
Leak Response Rate
2003
Gas Leak Reports per Mile
2004
MAIFI (Excluding Major Storms)
2000
SAIFI (Excluding Major Storms)
CAGR
2007 – 2011: 0.6%
2008 – 2011: 2.0%
PSE&G manages O&M growth by capturing productivity gains…
*Excludes pension, EMP and revenue generating expenses
Delivering Value: Today and Tomorrow
27

2008 Operating
Earnings*
Weather
Transmission
Pension
Depreciation,
Interest and Other
2009 Guidance
$360M
$5 - 10M
$320 –
$345M
$10 - 15M
… increasing pension, depreciation and interest costs.
($40 - 35M)
($15 - 5M)
In 2009, controlling O&M will mitigate the effects of…
*See page 139 for Items excluded from Income from Continuing Operations to reconcile to Operating Earnings
Delivering Value: Today and Tomorrow
28

PSE&G – Business Drivers
Operational excellence and effective cost
management
Distribution rate case should improve
2009 ROE’s of 8.0% - 8.8% to 9.0% - 9.5%
Addresses capital investment, O&M and
sales losses
1% change in Distribution rate case ROE for
2010 = ~$21M change in earnings
Transmission Investment under formula
rates. ROE ~ 11.7%
Capital Stimulus could provide an
additional 25 – 50 basis points to ROE
Energy Master Plan investments for
Energy Efficiency and Renewables could
provide an additional 5 – 10 basis points
to ROE if approved as planned.
A ±1% deviation in sales would result in a
±$15M change to margin revenues
$320 – $345M
2009 Guidance
2010+ Drivers
Delivering Value: Today and Tomorrow
29

PSE&G has been working with key stakeholders…
Federal
Collaborated with EEI and NRDC on key energy positions for
the American Recovery and Reinvestment Act of 2009
State
Worked with the Governor’s office and the New Jersey BPU to
craft programs that would create jobs and stimulate the New
Jersey economy
Worked with solar developers and the New Jersey BPU on
“Solar 4 All” program that will help the state meet aggressive
requirements for renewable portfolio standards
Working with key legislators on Rate Stabilization legislation
that will correct deficiencies in the current rate making process
Federal and State
Secured additional LIHEAP and NJ SHARES funding to assist
customers with energy bills
… to guide rulemaking.
Delivering Value: Today and Tomorrow
30

2008 Regulatory Activities
A.
Solar Loan Program
($105M)
Approved April 2008
Up to 30MW
B.
Demand Response
($63M)
Filed August 2008. Decision
pending
Reduce demand by residential
and small commercial
customers by 150MW
C.
Carbon Abatement
Program ($47M)
Approved December 2008
Provides energy efficiency
programs
A
C
B
2009 Regulatory Activities
D.
Capital Economic Stimulus Infrastructure Investment
Program ($700M)
Filed January 2009, expected BPU decision in April 2009
Accelerate capital investments to promote economic stimulus and
promote job growth in NJ
E.
Solar Loan Program – Phase II
To be filed March 2009
F.
File Electric and Gas Distribution
base rate case
To be filed mid-2009
G.
Energy Efficiency Economic Stimulus Program
($200M)
Filed January 2009, expected BPU decision by mid-year 2009
Promote job growth and stimulate NJ economy via energy
efficiency expenditures
H.
Solar 4 All ($800M)
Filed February 2009, expected BPU decision by August 2009
120MW of utility-owned solar generation
D
E
G
H
I
2010 Regulatory Activities
I.
Resolve Electric and
Gas Distribution
base rate case
Normal BPU schedule would
have resolution of rate
proceeding by mid-2010
2011 will be first full year of
rate relief
2008
2009
2010
May
Dec
Dec
Jan
Jan
Jun
F
… with a manageable rate increase of 2% - 4% to customers.
$215M Filed
PSE&G is well positioned to respond to NJ’s needs…
Delivering Value: Today and Tomorrow
31

0
100
200
300
400
500
600
700
800
2009
2010
2011
Capital Infrastructure Stimulus
Energy Efficiency Stimulus
Solar II
Solar 4 All
… have potential to add 10% - 15% a year to earnings through 2011.
PSE&G Annual Potential Capital Investments
Rate Base Including Potential Investments
31%
4%
18%
47%
28%
22%
5%
45%
Electric Transmission
Electric Distribution
Gas Distribution
Energy Master Plan
$9.8B
$8.8B
2011
2010
An additional ~$1.4B of
investments to be added
2009-2011 if appropriate
regulatory treatment is
received
Filed positions:
10.3% ROE
51% Equity Ratio
PSE&G’s additional investment proposals …
Delivering Value: Today and Tomorrow
32

Projects to NY
Neptune HVDC project (685 MW)
Sayreville to Long Island
Linden VFT project (330 MW) Linden
to Staten Island
Bergen O66 project (670 MW)
Bergen to ConEd’s West 49th St
Roseland U2-046 HVDC project
(660MW) to ConEd’s West 49th St
Deans U2-047 HVDC project
(660MW) to Long Island
The Linden VFT project U2-077 (300
MW) Linden to NY
Bergen U2-100 project (1,000 MW)
connecting Bergen to NY
Projects to NJ
PSE&G’s evaluation of
the proposed backbone
Transmission projects:
Susquehanna -
Roseland
AEP Interstate-765
project into Deans
MidAtlantic Power
Pathway project into
Salem
As a result NJ will need new generation, DSM or additional
transmission imports.
Total Import
Capability
~ 5,000 MW
Total Export
Capability
~ 4,300 MW
2009-2019 NJ Summer Peak
Growth Rate = 1.7%
Sources: Imports: PSE&G Estimates; Exports: PJM 2008 RTEP; Load Growth: PJM 2009 Load Forecast Report
NJ’s load is expected to grow 3,800MW by 2019, with net imports
increasing ~700MW.
Delivering Value: Today and Tomorrow
33

Transmission Growth
PJM approved the $750M Susquehanna to
Roseland line in October 2007
Siting and permitting process underway
Incentives approved by FERC:
ROE: 12.93% (125 basis point adder)
100% CWIP in Rate Base
FERC approval of Sub-Transmission to
Transmission system reliability investments
represents about $340M through 2011, post-2011
~$60M per year
Other approved RTEP projects ~$250M also
contribute meaningfully to improved reliability and
earnings growth
PJM approved the Branchburg-Roseland-Hudson
line in November 2008. Additional 500 kV
investments brings potential capital expenditures to
approximately $1.0 -1.5B
These opportunities will require substantial deployment of capital with siting
and permitting as the major challenges.
Branchburg
Roseland
Jefferson
New Freedom
Smithburg
Deans
MAPP
Hope Creek
Salem
Project
I-765
Interstate
Project
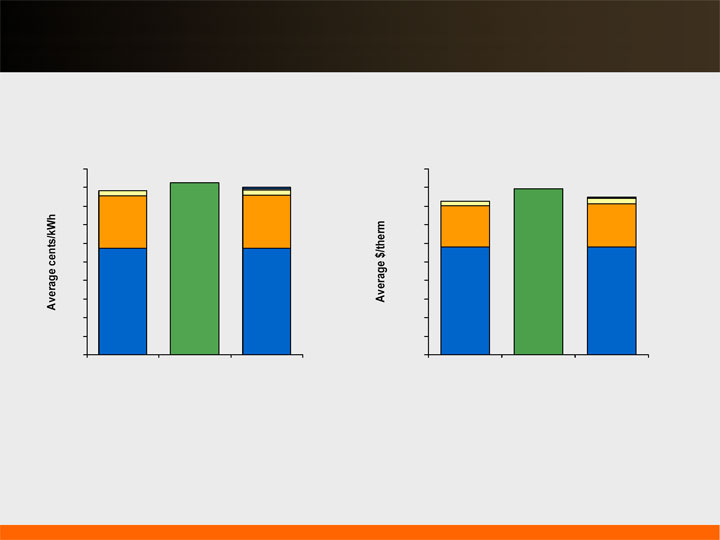
PSE&G implemented fully-forecasted formula rates with an 11.68%
base ROE, which provides attractive current return on investments.
Delivering Value: Today and Tomorrow
34
18.5
0
2
4
6
8
10
12
14
16
18
20
PSE&G
Average
2011
Based on tariff rates in effect in Nov 2008, does not include effects of the BGSS decreases effective Jan 1, 2009 and March 1, 2009.
… produces superior value to our electric and gas customers.
Electricity
(500kWh/month bill)
BGS
Delivery
Clauses
17.7
1.79
0.00
0.20
0.40
0.60
0.80
1.00
1.20
1.40
1.60
1.80
2.00
PSE&G
Average
2011
Gas
(100 therm/month bill)
BGSS
Delivery
Clauses
1.65
Source: Rates from PSE&G, NYPSC and PAPUC
1.70
BGSS
Delivery *
Clauses
BGS***
Delivery *
Clauses
Potential
Investments**
18.1
* Includes base rate increases
** Includes NJ stimulus filing (Capital and EEE), Solar 4 All and Solar II
Potential
Investments**
*** Assumes BGS/BGSS pricing remains constant
Combining operational excellence with prices comparable to
regional competitors …
Delivering Value: Today and Tomorrow
35

Earnings targets met
Transmission formula rate
treatment received from
FERC
Strong O&M control
Reduced Distribution capital
expenditures
National ReliabilityOne
Award winner
Earnings on track to meet
2009 guidance
Distribution base rate case
filing mid-2009 to address
capital and O&M recovery
Transmission investment
increasing
New customer information
system to go-live end of 1st
quarter
Active participant in shaping
State energy policy
Prepared to meet NJ’s
stimulus and energy goals
Resolve Distribution base
rate case by mid-2010
Investment program
responsive to NJ’s
economic and energy-
related goals
Transmission formula rates
provide current return on
invested capital
Earnings growth in line with
capital investment
Continue to lead the nation
in electric reliability
PSE&G – Delivering Value: Today and Tomorrow
Delivering
Value Today
Positioned for
the Future
Meeting
Commitments
Delivering Value: Today and Tomorrow
36

We make things work for you.
PSEG Energy Holdings -
Review and Outlook
Stephen Byrd
President and Chief Operating Officer, PSEG Energy Holdings

PSEG Energy Holdings – Delivering Value: Today and Tomorrow
Exceeded earnings
targets
Strong 2008 Texas
performance well
above expectations
Stable earnings from
US contracted
generation assets
Sale of international
assets yielded $1.5B over
2007-2008
Proactively reserved for
potential LILO/SILO
liability
Earnings on track to meet
2009 guidance
Achieving predictable
performance from
contracted US generation
assets
Improving Texas
operations via asset
management agreement
with PSEG Power
Redeemed approximately
$280M of Texas project
debt in the first quarter of
2009
Managing risk by limiting
growth in lease tax liability
Sufficient liquidity and
credit strength to fund
potential LILO/SILO liability
through cash, asset value
and debt capacity
Exploring opportunities to
optimize other U.S. assets
Pursuing attractive
renewable generation
opportunities
Compressed Air
Energy Storage
(CAES)
Solar
Offshore Wind
Meeting
Commitments
Delivering
Value Today
Positioned for
the Future
Delivering Value: Today and Tomorrow
38

PSEG Energy Holdings will continue to maximize the value of its
investment portfolio, …
PSEG Energy Holdings operates through two
primary subsidiaries:
PSEG Global
Owns approximately 2,400 MW of
domestic generation capacity
2,000 MW merchant CC in TX
400 MW contracted in CA, HI, NH
Small remaining international
investments with a total book value of
under $25M
Pursues unregulated renewables
opportunities: CAES, solar and
offshore wind
PSEG Resources
Generates earnings and cash from
lease investments (primarily in
energy-related assets)
Continues to opportunistically
monetize investments as appropriate
… while identifying opportunities for growth driven by climate change.
PSEG Energy Holdings
2009 Operating Earnings Guidance
$0 – $20M
TOTAL
($10 – 20)
PSEG Resources
$15 – $35
PSEG Texas
($5) – $5
PSEG Global
(excluding Texas)
2009 Operating Earnings Guidance
Delivering Value: Today and Tomorrow
39

By reducing its investment in international assets …
… Holdings has decreased its risk profile and improved its
business focus.
$0.4
$0.5
$0.5
$0.8
$2.2
$1.4
$0.1
2004
2006
2008
2009 Projected*
PSEG Global Invested Capital
($ Billions)
$2.6B
$1.9B
$0.6B
$0.8B
*Investment Includes redemption of Texas debt in February 2009
International
Domestic
Delivering Value: Today and Tomorrow
40

Texas assets are the major driver of PSEG Global’s business
results.
PSEG Texas projected EBITDA reflects higher maintenance costs and
market uncertainty.
Strong 2008 performance from favorable market in Spring 2008
Looking ahead to 2009:
Uncertainty on gross margin impact from new wind additions
Operations and maintenance costs approximately $20M higher in 2009 than 2007 as
plants enter periods of major maintenance
Longer-term:
Continued uncertainty from wind
Positive impact from transmission build-up and potential unit mothballing by other
generators
70 – 80
35 – 45%
140 – 150
16%
4.5 - 5.5
2009
PSEG
Market
214
162
$186
Gross
Margin ($M)
147
47.9%
14%
9.0
2008
104
48.7%
15%
6.9
2007
$130
54.4%
16%
$6.7
2006
EBITDA*
($M)
Capacity
Factors
Reserve
Margin
Nat. Gas
Henry Hub Spot
($/mmBtu)
*Excluding Mark-to-Market Accounting effects
Delivering Value: Today and Tomorrow
41

Global continues to focus on monetizing non-core assets …
International Assets:
Total book value of $24M in India and Venezuela
Other Domestic Assets:
GWF Energy (CA) – 363 MW (60% Ownership)
GWF & Hanford (CA) – 132 MW (50% Ownership)
Kalaeloa (HI) – 208 MW (50% Ownership)
Bridgewater (NH) – 16 MW (40% Ownership)
Conemaugh (PA) – 15 MW (4% Ownership)
Renewables:
Compressed Air Energy Storage (Energy Storage & Power joint venture):
Technology can be used to optimize an intermittent renewable energy source, such
as wind, by storing energy at night and releasing this stored energy during the day
when customers need power
Offshore Wind:
In October 2008, the New Jersey Office of Clean Energy (OCE) awarded a $4M
grant to a PSEG Global joint venture in order to advance the development of a
350 MW wind farm approximately 16 miles off the shore of southern New Jersey
Solar:
Ongoing additional opportunity evaluation and investment
… while enhancing the performance of domestic assets and
identifying opportunities for renewable growth.
Net other domestic owned
capacity: 395 MW;
Book value: $162M
Delivering Value: Today and Tomorrow
42

Resources is focused on managing its current investment
portfolio.
Net Investment in lease portfolio of $0.3B
Book investment of $2.3B less deferred taxes of $2.0B
Assuming 100% litigation loss, the lease portfolio would generate $2.1B of
after-tax cash over the remaining life of the portfolio
Net present value of after tax cash flow using 8% discount rate would be
approximately $800M
17
8
LILO/SILO Lease Termination Revenue
(54)
(43)
IRS LILO/SILO Interest**
48
51
Non-LILO/SILO Lease Revenue
2
27
LILO/SILO Lease Revenue
13
43
Total Lease Related
(22)
20
After Tax Earnings
(35)
2009 Forecast
($ Millions)
2008*
($ Millions)
PSEG Resources Earnings
(23)
Interest, G&A, Taxes & Other
*Normalized to exclude June LILO/SILO accounting adjustment.
**IRS Interest accrued for LILO/SILO tax deficit.
2009 earnings reflect reduced LILO/SILO lease income pending IRS
resolution.
PSEG Resources Lease Portfolio Overview
Delivering Value: Today and Tomorrow
43

Resources continues to monitor its tax risks …
June 2008 results included after tax charges of $490M:
$135M interest reserve
$355M reduced return due to cash flow timing
This charge will be reversed into income over the remaining terms of the
affected leases
Charge represents reserve against approximately 85% of potential
estimated liability
As of 12/31/08, $180M deposited with IRS
The forecast of cash available assumes interest payments to IRS to limit
growth in liability
PSEG anticipates paying between $500 - $920M for the tax years 1997 -
2003 to the IRS.
PSEG will then file for refund and commence litigation to recover these
amounts
… and maintains a flexible plan to handle the uncertainty.
Delivering Value: Today and Tomorrow
44

PSEG Energy Holdings – 2008 Earnings Drivers
2007
Operating
Earnings*
Global’s Lost
Income on
Asset Sales
Resources’
Lease Income
& LILO/SILO
Interest
Interest
Expense
Taxes
Texas Margin
Texas Mark to
Market Impact
2008
Operating
Earnings*
2008 MTM
2008
Operating
Earnings
without MTM
$99M
($65M)
($21M)
$34M
$18M
$26M
$123M
$101M
($14M)
$2M
Holdings 2007 vs 2008 Operating Earnings
*See page 139 for Items excluded from Income from Continuing Operations to reconcile to Operating Earnings
Delivering Value: Today and Tomorrow
45

2008 Operating
Earnings
without MTM
Texas Margin
and Major
Maintenance
Texas Project
Financing Paid
Off
Interest & Other
Global Taxes
Resources
Lease Income &
LILO/SILO
Interest
Resources
Interest, G&A,
Other & Taxes
2009 Guidance
PSEG Energy Holdings – 2009 Earnings Drivers
$99M
$0 – 20M
($50 - 40M)
($4 - 2M)
$17M
($20 - 16M)
($31 - 29M)
($11 - 9M)
Holdings 2008 Operating Earnings vs 2009 Guidance
Delivering Value: Today and Tomorrow
46

PSEG Energy Holdings – Business Drivers
$0 – 20M
2009 Guidance
2010+ Drivers
Sale of remaining international assets
(Book value $24M)
Continued defense of LILO/SILO lease
position with improved return post-
resolution
Focused management of domestic
contracted generation portfolio
Support of 2009 joint venture Energy
Storage & Power in efforts to license
CAES 2 technology
Pursuit of renewable development with
focus on Solar and Offshore Wind
Texas Spark Spread change of
±$5/MWh at market – impact of
approximately $0.03/share
Delivering Value: Today and Tomorrow
47

PSEG Energy Holdings — Delivering Value: Today and Tomorrow
Exceeded earnings
targets
Strong 2008 Texas
performance well
above expectations
Stable earnings from
US contracted
generation assets
Sale of international
assets yielded $1.5B over
2007-2008
Proactively reserved for
potential LILO/SILO
liability
Earnings on track to meet
2009 guidance
Achieving predictable
performance from
contracted US generation
assets
Improving Texas
operations via asset
management agreement
with PSEG Power
Redeemed approximately
$280M of Texas project
debt in the first quarter of
2009
Managing risk by limiting
growth in lease tax liability
Sufficient liquidity and
credit strength to fund
potential LILO/SILO liability
through cash, asset value
and debt capacity
Exploring opportunities to
optimize other U.S. assets
Pursuing attractive
renewable generation
opportunities
Compressed Air
Energy Storage
(CAES)
Solar
Offshore Wind
Meeting
Commitments
Delivering
Value Today
Positioned for
the Future
Delivering Value: Today and Tomorrow
48

We make things work for you.
PSEG Power – Overview
Bill Levis
President and Chief Operating Officer, PSEG Power

Delivering
Value Today
Positioned for
the Future
Meeting
Commitments
Achieved earnings targets
Improved operating
performance of generation
fleet
Environmental
commitments met
$1 Billion capital expense
on budget, met specs
Disciplined hedging
strategies have managed
earnings volatility and
reduced risk
On target to meet 2009
earnings guidance of
$1,210M to $1,285M
Continued Operational
Excellence Model (OEM)
implementation with
demonstrated
improvements at Fossil
Sustained, strong nuclear
performance
Successful multi-year
hedging strategy
supported by BGS, RPM in
liquid markets
Effective management of
costs and capital programs
to drive value
Low-cost, baseload
nuclear fleet benefits in
carbon constrained world
BET installation improves
operating capability of coal
fleet and enables a wide
variety of coals
Expansion opportunities
through existing
experience and
infrastructure, including
peaker bids
Strong free cash flow
PSEG Power - Delivering Value: Today and Tomorrow
Delivering Value: Today and Tomorrow
50

Low-cost portfolio
Regional focus in competitive, liquid
markets
Assets favorably located near
customers/load centers
Many units east of PJM
constraints
Southern NEPOOL/ Connecticut
Market knowledge and experience
to maximize the value of our assets
… with low cost plants, in good locations, within solid markets.
Power’s assets support commitments in a dynamic environment…
18%
45 %
9 %
27 %
Fuel Diversity
Coal
Gas
Oil
Nuclear
Pumped
Storage
1%
Energy Produced – 2008
53%
23%
23%
Pumped Storage
& Oil 1%
Nuclear
Coal
Gas
Total GWh: 55,300
Total MW: 13,576
Delivering Value: Today and Tomorrow
51
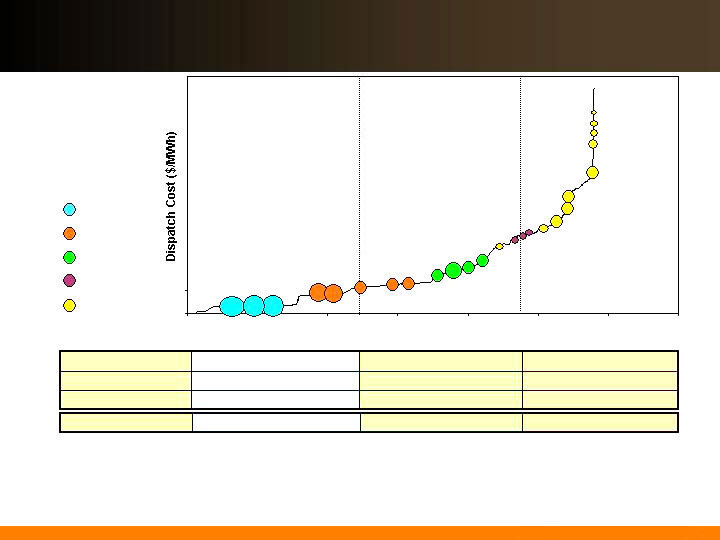
… of serving full requirement load contracts, while maintaining
optionality under a variety of conditions.
Power’s assets along the dispatch curve reduce the risk…
X
X
Ancillary Revenue
X
X
X
X
Capacity Revenue
X
X
Energy Revenue
X
X
Dual Fuel
Baseload units
Load following units
Peaking units
Illustrative
Salem
Hope
Creek
Keystone
Conemaugh
Hudson 2
Linden 1,2
Burlington 8-9-11
Edison 1-2-3
Essex 10-11-12
Bergen 1
Sewaren 1-4
Hudson 1
Mercer1, 2
Bergen 2
Sewaren 6
Mercer 3
Kearny 10-11
Linden 5-8 / Essex 9
Burlington 12 / Kearny 12
Peach
Bottom
Bridgeport
New
Haven
Nuclear
Coal
Combined Cycle
Steam
Peaking
BEC
Yards
Creek
National Park
Delivering Value: Today and Tomorrow
52

Nuclear has successfully transitioned to independent operations…
Industrial Safety Excellence
Lowest OSHA recordable rate ever
Equipment Reliability Excellence
Highest output ever, highest summer output ever
Forced Loss Rate improvement
Highest capacity factor of any unit in the country for Hope Creek
Refueling Outage Excellence
57 days – second fastest steam generator outage in industry
New industry standard on dose
Salem fall outage was the first PWR to complete Reactor Vessel Nozzle weld mitigation
requirements, and was completed within 18 hours of top quartile for standard outage
Strengthened Nuclear Fundamentals
Maintained site focus on Excellence – ensured organization focus on behaviors, highlighted nuclear safety culture principles weekly, strengthened industry peer group contacts and interaction.
Strengthened Stakeholder Confidence
Hope Creek Extended Power Uprate (EPU) – 150 MW
Successful NRC/FEMA graded emergency planning exercise
Successful NRC Force-on-Force evaluation
Withdrawal of National Guard and State Police
… and had a year of numerous accomplishments in 2008.
Delivering Value: Today and Tomorrow
53
Our nuclear performance has continued to improve…
79
80
97
94
92
97
96
96
97
96
97
2004
2005
2006
2007
2008
2009 Target
24.7
27.3
29.1
28.4
29.3
29.8
2004
2005
2006
2007
2008
2009 Target
INPO Index ( )
Highest capacity factor in the industry for Hope
Creek in 2008
Highest Nuclear output in Power’s history
2008 INPO Index for NJ Units of 92 would have
been 97, excluding planned Salem steam
generator replacement
Nuclear Generation Output ( )
(000’s GWH)
Forced Loss Rate ( )
(%)
3.1
2.1
0.6
0.7
0.6
0.6
0.6
0.6
1.0
11.1
0.7
2004
2005
2006
2007
2008
2009 Target
… as we maintain our relentless drive for excellence.
NJ Units
1st Quartile
NJ Units
1st Quartile
Delivering Value: Today and Tomorrow
54

Salem’s benchmarking against the industry assures a constant
striving for excellence…
… and Salem has closed gaps even with 2008 results impacted by a planned
steam generator outage.
Indicator
Unit
2004
2005
2006
2007
2008
2009 PROJ
1
2
Industrial Safety (OSHA)
1
2
1
2
1
2
Safety System Reliability
1
2
1
2
1
2
1
2
1
2
1
2
1
2
Production Cost
Fuel Reliability (annual value)
CM Backlogs (annual value)
1
2
Forced Outages (annual value)
Significant Events
Emergency Diesel Generators (3-year avg)
Auxiliary Feedwater (3-year avg)
Safety Injection (3-year avg)
Chemistry Performance/Effectiveness Index
Capacity Factor
Forced Loss Rate
Refueling Outage Duration (annual value)
INPO Index (not an average)
Collective Radiation Exposure
Unplanned Scram Rate (per 7000 hrs)
Key
N/A
4th Quartile
3rd Quartile
2nd Quartile
1st Quartile
Delivering Value: Today and Tomorrow
55

Hope Creek’s performance against its peers has greatly improved…
… and has set top quartile performance goals across the board for
2009.
Indicator
2004
2005
2006
2007
2008
2009 PROJ
INPO Index (not an average)
Industrial Safety (OSHA)
Collective Radiation Exposure
Unplanned Scram Rate (per 7000 hrs)
Significant Events
Safety System Reliability
Emergency Diesel Generators (3-year avg)
Residual Heat Removal (3-year avg)
High Pressure Coolant Injection (3-year avg)
Chemistry Performance/Effectiveness Index (18 month)
Capacity Factor
Forced Loss Rate
Refueling Outage Duration (annual value)
Production Cost
Fuel Reliability (annual value)
CM Backlogs (annual value)
Forced Outages (annual value)
Key
4th Quartile
3rd Quartile
2nd Quartile
1st Quartile
Delivering Value: Today and Tomorrow
56

Fossil met most 2008 objectives…
Capture value through Operational Excellence Model implementation
Achieved record output in 2008
Achieved record summer output in 2008
Hudson / Mercer back end technology implementation
Completed Mercer 1&2 baghouse installation, also completed first full year
Bridgeport Harbor – baghouse operations
Met all Consent Decree milestones
Early benefit from balance of plant work at Hudson
Outage planning and execution, seasonal readiness
Total planned outage days completed ahead of schedule
Shortened peaking outage durations (Spare LM6000)
Integrate operation with growth opportunities
Transitioned management of Texas operations into Fossil
Won Request For Proposal (RFP) for peaker at New Haven
Opacity Controls
Decrease in opacity events by 62% since 2006 and by 35% from 2007 to 2008
… and continues to improve through implementation of the
Operational Excellence Model.
Delivering Value: Today and Tomorrow
57

Power’s coal capacity is an area identified for improvement…
Outages related to the installation
of BET have reduced output in
2007 – 2009
Continued drive to enhance our
environmental footprint
Output ( )
(000’s GWh)
15.3
14.9
13.1
13.0
13.0
2005
2006
2007
2008
2009 Target
Forced Outage Rate ( )
(% EFORD)
11.1
11.3
7.9
8.4
6.0
2005
2006
2007
2008
2009 Target
SO
2
and NOx Rates ( )
(lb/mmbtu)
1.12
1.01
0.91
0.96
0.73
0.34
0.29
0.20
0.21
0.16
2005
2006
2007
2008
2009 Target
… and BET and major capital improvements will prepare us for the
future.
SO2
NOx
Delivering Value: Today and Tomorrow
58
Power’s Combined Cycle capacity has shown significant
improvement…
Output has shown continued upward
trend based on market dynamics
and operational excellence model
Approaching top quartile forced
outage rate
Benefits from heat rate improvement
program
Output ( )
(000’s GWh)
12.2
12.1
9.9
7.6
4.3
2005
2006
2007
2008
2009 Target
Forced Outage Rate ( )
(% EFORD)
7.0
3.4
2.5
1.8
1.1
2005
2006
2007
2008
2009 Target
Period Heat Rate ( )
(mmbtu/kwh)
7,847
7,928
7,768
7,587
7,552
2005
2006
2007
2008
2009 Target
… benefiting from operating enhancements and market dynamics.
*
*
*
*
*Includes Texas
Delivering Value: Today and Tomorrow 59

Performance has improved for Power’s peaking fleet…
Peaking start success results in
opportunities in ancillary and
real time markets
Significant improvements driven by
investments in the facilities
Peaking provides flexibility in serving
load and managing needs of a diverse
market
Start Success ( )
97
99
97
99
99
2005
2006
2007
2008
2009 Target
Forced Outage Rate ( )
(% EFORD)
17.2
22.8
18.9
12.7
8.0
2005
2006
2007
2008
2009 Target
Equivalent Availability ( )
86
76
77
91
93
2005
2006
2007
2008
2009 Target
… and will be increasingly relied upon as markets tighten.
Delivering Value: Today and Tomorrow 60

The mission of the units in the peaking fleet varies by type of unit…
… with a balance of opportunities in energy, capacity and ancillary
products.
Gross Margin Contribution From All Peaking Units
Peaking provides optionality
Value of peaking units should increase
with increase in renewables
Peaking helps in serving BGS product
Energy Units
Technology
Capacity
Energy
Capacity
Ancillary
Forced Outage Rate
# Starts
Burlington 12
LM 6000
168
X
X
X
Kearny 12
LM 6000
175
X
X
X
Essex 9
GE 7 EA
81
X
X
X
Linden 5,6,7,8
GE 7 EA
336
X
X
X
760
4%
4,351
Ancillary Units
Edison 1, 2, 3
FT4
504
X
X
Essex 10, 11, 12
FT4
536
X
X
Burlington 9, 11
FT4
364
X
X
1,404
11%
7,402
Capacity Units
Kearny 10 ,11
FT4
250
X
Sewaren 6
FT4
105
X
Mercer 3
FT4
115
X
Salem 3
FT4
22
X
Bridgeport Harbor 4, Kearny 9
FT4
36
X
National Park, Bergen 3, Burlington 8
FT4
63
X
591
29%
176
Energy
Capacity
Ancillary
Delivering Value: Today and Tomorrow 61

Benchmarking has helped Fossil identify areas for improvement…
Units by Groups: Coal: Hudson 2, Mercer 1&2 and Bridgeport 3 CC: Bergen 1&2 BEC, Linden 1&2 and *Texas (starting in 2008) ; Peaking: CT units
… and through the Operational Excellence Model we intend to close the
gaps for a potential $50M - $75M gain in gross margin.
2004
2005
2006
2007
2008
2009 PROJ
Maintenance Outage Hours
Maintenance Outage Hours
Maintenance Outage Hours
Indicator
Equivalent Availability
Forced Outage Rate (EFORd)
Equivalent Derate Hours
Forced Outage Occurences
Planned Outage Hours
FOR
Equivalent Availability
Forced Outage Rate (EFORd)
Equivalent Derate Hours
Forced Outage Occurences
Planned Outage Hours
FOR
Equivalent Availability
Forced Outage Rate (EFORd)
Equivalent Derate Hours
Forced Outage Occurences
Planned Outage Hours
FOR
Key
4th Quartile
3rd Quartile
2nd Quartile
1st Quartile
Delivering Value: Today and Tomorrow 62

2009 Objectives…
Successful Summer Run
Mercer/Hudson BET
Effective Cost Management
Streamline Outages
Continue OEM Implementation
Industrial Safety Excellence
Equipment Reliability
Excellence
Refueling Outage Excellence
Developing Our People
Effective Cost Management
… will focus our actions to help us achieve our goals.
Nuclear 2009 Objectives
Fossil 2009 Objectives
Delivering Value: Today and Tomorrow 63

The value of Power’s nuclear fleet…
Uprates
Peach Bottom 2 and 3 anticipate incremental 32 MW through
steam path retrofit
Potential for significant uprates remain for the future
License Renewal
Licenses at Peach Bottom 2 and 3 have been renewed
through 2033 and 2034 (respectively)
Power anticipates filing license renewal in the third quarter of
2009 for Salem 1, Salem 2 and Hope Creek
New Nuclear
Power’s Southern New Jersey site is a strong location for a new
nuclear unit
Power currently preparing Early Site Permit application for
submission in the second quarter of 2010
… can be improved through uprates, license renewal, and expansion.
Delivering Value: Today and Tomorrow 64

Our capital investment program …
Capex Planned
No Additional Capex Planned
… reduces emissions and positions the company for success.
Hudson (NJ)
Mercer (NJ)
Keystone (PA)
Bridgeport (CT)
Conemaugh (PA)
SCR
SCR
SCR
Low NOx
No additional
2010
Burners
Capex
Scrubber
Scrubber
Scrubber
Ultra-low
Scrubber
2010
2009
2009
Sulfur Coal
Baghouse
Baghouse
Scrubber
Baghouse
Scrubber
2010
2008
(PA compliant)
2008
(PA compliant)
$700 - $750M
$220M
$160M
Capital Expenditures*
NO
x
SO
2
Mercury / Particulate
Forecasted Environmental
*Excludes IDC
Delivering Value: Today and Tomorrow
65

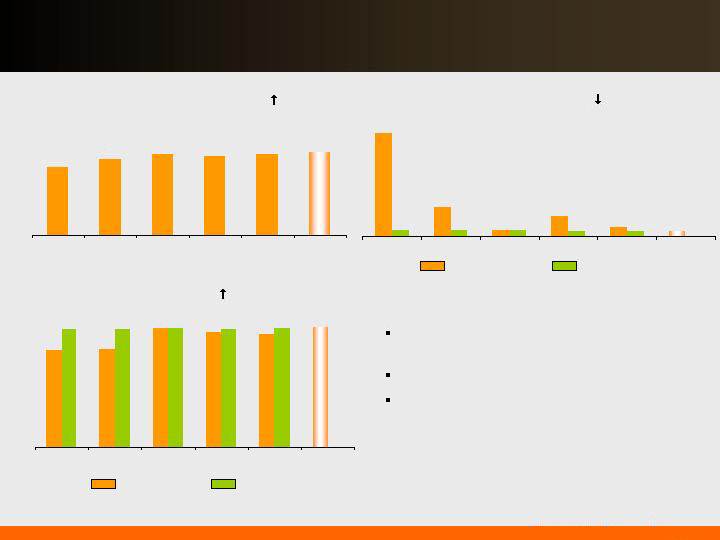
Fossil’s projected environmental capital spending declines over
time…
… and we anticipate higher output, lower emissions, and greater
flexibility in coal sources.
Coal Environmental Capital
Coal Emissions Output
Aggregate emissions will decline nearly 66%
after installation of the pollution control
equipment
The installation will allow for fuel flexibility in
future years
Fossil spending on BET reached a peak of $491
million in 2008
Fossil’s coal fleet will be well positioned by
2010, with a dramatic reduction in capital
spending on pollution control equipment
Coal - NOx
Coal – SO2
352
491
381
175
4
$0
$300
$600
2007
2008
2009
2010
2011
0
20,000
40,000
60,000
80,000
2007
2008
2009
2010
2011
Complete
To Go
Delivering Value: Today and Tomorrow
66
0
20
40
60
80
100
120
140
160
180
200
0
10
20
30
40
50
60
70
80
0
2
4
6
8
10
12
14
16
18
20
Source: EPA, EIA (2006 and 2007) and PSEG Projection
PSEG Projected NOX Emission Rate for 2011
versus 2007 400 U.S. Coal Plants
Conemaugh
Keystone
Bridgeport
Hudson Mercer
NOx
Keystone
Bridgeport
Conemaugh
Hudson Mercer
SO2
PSEG Projected SO2 Emission Rate for 2011
versus 2007 400 U.S. Coal Plants
Keystone
Hudson Mercer
Bridgeport
Conemaugh
Mercury
PSEG Projected HG Emission Rate for 2011
versus 2006 400 U.S. Coal Plants
Power’s coal assets are undergoing environmental upgrades…
… which will dramatically reduce emissions and prepare the units for the future.
Delivering Value: Today and Tomorrow
67

-
500
1,000
1,500
2,000
2,500
3,000
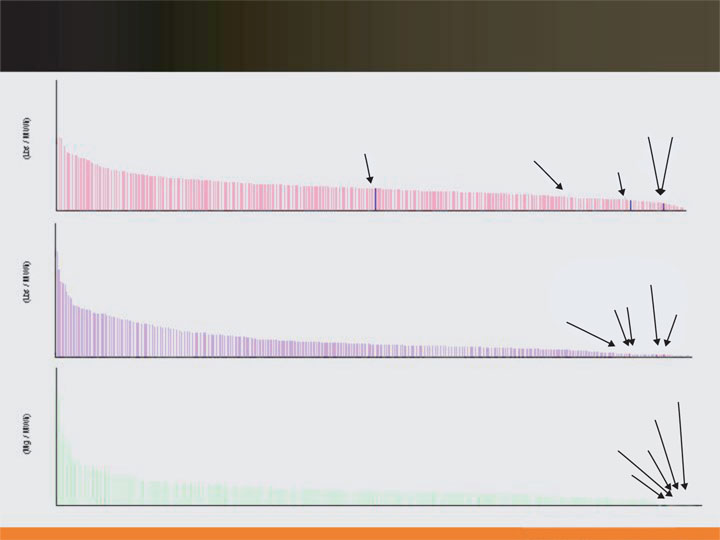
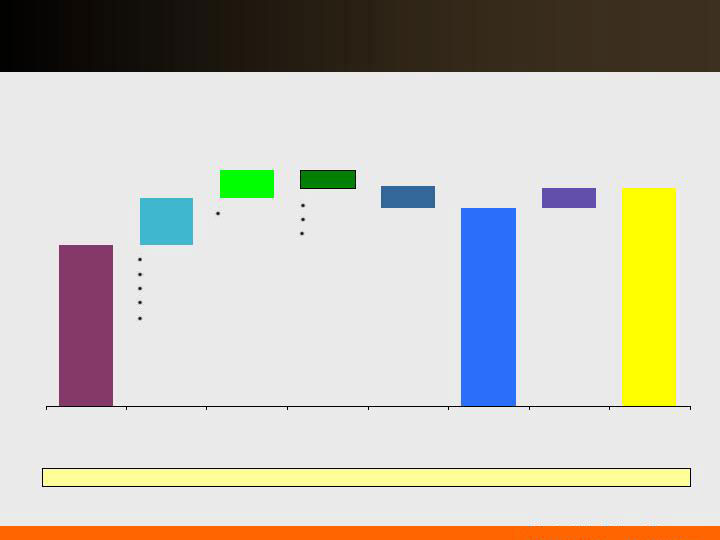
Power’s fleet is well positioned for carbon legislation…
… based on its low carbon footprint.
Sources: 2007 EIA 906920 (generation & emission); eGRID 2006 (PJM Interconnection Data)
CO2 Emission Rate (lbs/MWh) Ranking
(PJM Connected Power Plants)
Delivering Value: Today and Tomorrow
68

Power has demonstrated success in managing large capital
projects…
In Service
($millions)
Bridgeport Harbor 3 Baghouse
2007 160
Salem Steam Generator
2008 240
Hope Creek Uprate
2008 180
Mercer Baghouse
2008 260
Hudson Balance of Plant
2007 - 2008 115
~$1Billion
Near Term
Spent To Go
Keystone Scrubber
2009 111 27
Mercer Scrubber
2009 135 95
Hudson Scrubber/SCR/Baghouse
2010 291 438
$537 $560
… with projects placed in service and achieving/exceeding desired
results.
In Service
Date
In Service
Date
($millions)
Power’s annual capital
spend for sustainability
has averaged $200M -
$225M over recent years
Depreciation expense is
expected to increase from
2008 ($164M) to 2011
($280M)
Delivering Value: Today and Tomorrow
69

Fossil is well positioned for growth…
Site Development
Opportunities in upcoming PJM capacity auction
Connecticut Peakers
Deliver on successful RFP efforts
Compressed Air Energy Storage (CAES)
Enabling technology for renewables
Power’s experience will help in managing in a
changing environment
Integration of assets into the portfolio
Renewables in Texas
RECs in managing full requirements contracts
… leveraging our existing infrastructure and experience.
Delivering Value: Today and Tomorrow
70

PSEG Power – Market Overview
We make things work for you.
Joe Hopf
President, PSEG Energy Resources & Trade

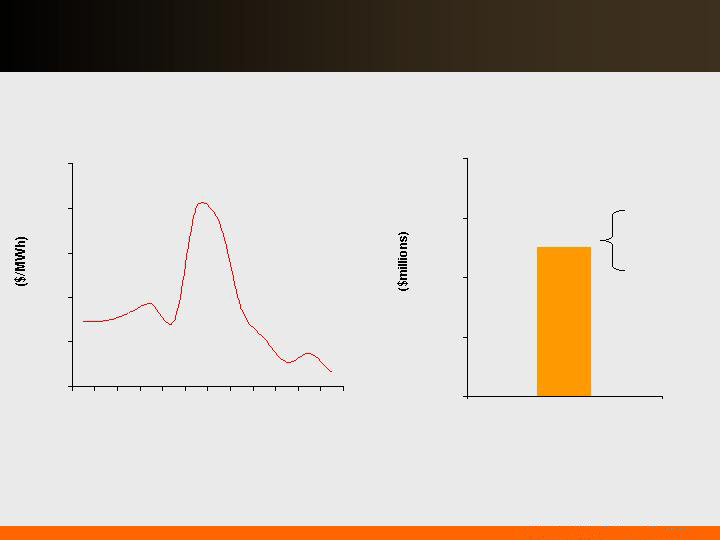
While commodity markets have been turbulent …
Energy markets showed high
volatility in 2008
Capacity markets continue to
be effective
Hedging strategy designed to
enhance stability and visibility
of earnings
Gas asset optimization and
other products round out a
strong portfolio
… Power benefits from operating in liquid transparent markets.
Disciplined approach to
hedging — controls in place to
manage through volatile
markets
Hedging philosophy manages
risk to a range of outcomes
Range of Potential Results 2009 – 2011
(Illustrative)
2009 2010 2011
$
Delivering Value: Today and Tomorrow
72

Power’s hedging strategy secures pricing for near term output…
Sell expected nuclear and coal output forward over a two to three
year horizon
Contract fuel to balance position
Buy gas short-term as we sell output from gas units
Utilize liquid markets to manage risk - BGS provides foundation
Annual recontracting opportunity
3-year term mitigates volatility
BGS volume at maximum tranches is approximately 50% of
Power’s coal and nuclear output
Utilize with ancillaries services market and FTRs
… which mitigates the impact of market movements on earnings.
Delivering Value: Today and Tomorrow
73

2003
2004
2005
2006
2007
2008
2009
Increase in Full Requirements
Component Due to:
Increased Congestion (East/West Basis)
Increase in Capacity Markets/RPM
Volatility in Market Increases Risk
Premium
The recent successful completion of the seventh BGS auction...
Market Perspective – BGS Auction Results
… cushions the impact of volatile markets on customers.
Note: BGS prices reflect PSE&G Zone
Full Requirements
3 Year Average
Round the Clock
PJM West
Forward Energy
Price
$55.05
$65.41
~ $18
~ $21
$102.51
~ $32
$98.88
~ $41
~ $43
$111.50
~ $47
$103.72
$55.59
~ $21
Capacity
Load shape
Transmission
Congestion
Ancillary services
Risk premium
Green
$33 - $34
$36 - $37
$44 - $46
$67 - $70
$58-$60
$68 - $71
$56 - $58
*
*2009 RTC price was ~ $50/MWh at time of auction
Delivering Value: Today and Tomorrow
74

-
2,000
4,000
6,000
8,000
10,000
12,000
-
2,000
4,000
6,000
8,000
10,000
12,000
Power’s output is sold forward…
… through full requirement contracts and other hedging transactions.
2009 2010 2011
2009 2010 2011
Nuclear
Coal
CC
Steam / Pk
Existing Hedges
Existing Loads+ Hedges
Existing Loads+ Hedges + Potential Future BGS
Total Fleet On-Peak Average MW
Total Fleet Off-Peak Average MW
Delivering Value: Today and Tomorrow
75
Our hedging strategy has been effective in 2008 in volatile
markets…
$800
$900
$1,000
$1,100
$1,200
… resulting in strong 2008 results for Power.
$1,110
$1,010
Guidance
Range
$50
$70
$90
$110
$130
$150
2008 Average Monthly PJM West Energy Price
2008 Operating Earnings*
Jan
Dec
$1,050
*See page 139 for Items excluded from Income from Continuing Operations to reconcile to Operating Earnings
Delivering Value: Today and Tomorrow
76

Commodity prices have been volatile…
*Average of 2 historical months and 10 forward months
… but Power’s diverse asset portfolio and hedging strategy has
mitigated the effect of volatility, providing strong results.
$0
$5
$10
2004
2005
2006
2007
2008
2009
Fwd*
2010
Fwd
2011
Fwd
$0
$20
$40
$60
$80
$100
2004
2005
2006
2007
2008
2009
Fwd*
2010
Fwd
2011
Fwd
$0
$20
$40
$60
$80
$100
2004
2005
2006
2007
2008
2009
Fwd*
2010
Fwd
2011
Fwd
$0
$20
$40
$60
$80
$100
$120
2004
2005
2006
2007
2008
2009
Fwd *
2010
Fwd
2011
Fwd
Henry Hub NYMEX
($/MMBTU)
Western Hub RTC
($/MWh)
West Hub On Peak
($/MWh)
Central Appalachian Coal
($/Ton)
Note: Forward prices as of 2/6/09
Delivering Value: Today and Tomorrow
77
The effect of our hedging/forward sales strategy…
Power’s hedging strategy
secures pricing over a 2 - 3 year
future time horizon.
The 3 year BGS Auction period
has the effect of pulling forward
prices back.
… is to create a realized price that is a blend of prior and future pricing,
moderating volatility.
*PJM West Average of 2 historical months and 10 forward months as of 2/6/09
$0
$20
$40
$60
$80
$100
2004
2005
2006
2007
2008
2009 Fwd
2010 Fwd
2011 Fwd
PJM West
PS Zone vs PJM West Basis
2009 realized
price
*
Delivering Value: Today and Tomorrow
78

$10
$20
$30
$40
$50
$60
$70
2005
2006
2007
2008
2009
2010
2011
Annual Average
Historical Monthly
Forecast
Note: Forward prices as of 02/06/09
Spark spreads are in line with rising historical averages…
PJM Western Hub Spark Spread (On-Peak – Henry Hub * 7.5 Heat Rate)
PJM Western Hub Dark Spread (RTC – Central Appalachian Coal * 10 Heat Rate)
$0
$10
$20
$30
$40
$50
2005
2006
2007
2008
2009
2010
2011
… but near term dark spreads have declined as coal prices have risen.
Delivering Value: Today and Tomorrow
79
$50
$52
$54
$56
$58
$60
$62
$64
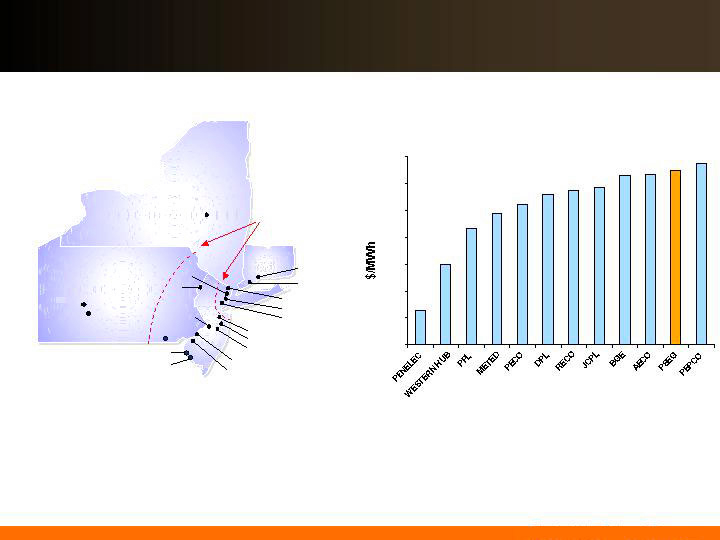
Power’s assets are well positioned…
… deriving higher prices based on locational value.
Historical 5-year Average PJM Energy Price
(Around the Clock)
Note: Reflects prices of original PJM load zones
Current plant locations,
site expansion capability
System Interface
New Haven
Bridgeport
Bethlehem Energy Center
(Albany)
Bergen
Kearny
Essex
Sewaren
Edison
Linden
Mercer
Burlington
National Park
Hudson
Conemaugh
Keystone
Peach Bottom
Hope Creek
Salem
Yards Creek
Delivering value: Today and Tomorrow
80
Expanded PJM Energy (000’s GWh)
0
300
600
900
Actual
2008 Forecast
2009 Forecast
Regional Energy Demand Growth (%)
-1%
0%
1%
2%
3%
4%
2009
2010
2011
2012
2013
PJM
EMAAC
New Jersey
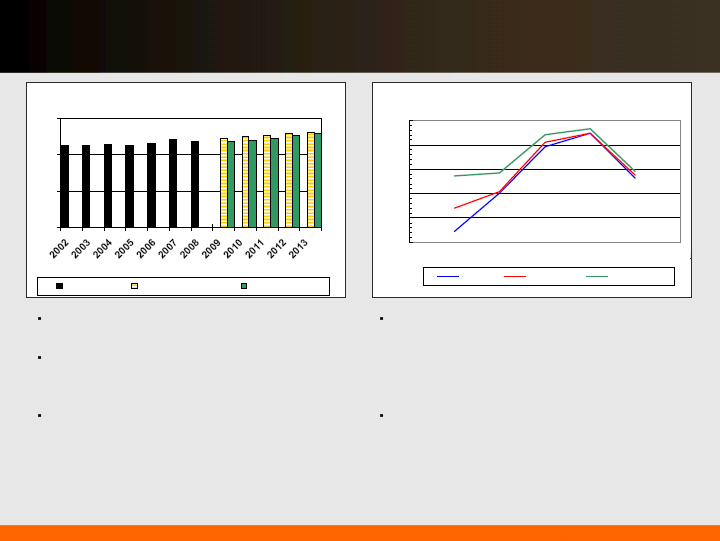
PJM forecasts New Jersey to maintain a
higher demand growth rate than the
EMAAC region and the overall PJM
region off a lower 2008 base
The ultimate demand will be driven by
the economy, but Power’s assets are well
located to manage through difficult times
Electricity demand is anticipated to show
moderate declines
PJM’s January 2009 load forecast
reflects a 0.6% drop in demand from ’08
to ’09
The growth rate forecast is more bearish
than last year’s forecast for ’09 and ’10,
but higher starting in ’11, with absolute
load levels nearly recovered by ‘13
Electric load growth is affected by the economy …
… with Power well positioned during challenging times.
Delivering value: Today and Tomorrow
81
… Power expects to see continued strong margins from PJM’s
Reliability Pricing Model.
Through the new capacity construct, and pricing at auction
prices…
Power Capacity Receiving RPM
PJM Zones
2007 / 2008
2008 / 2009
2009 / 2010
2010 / 2011
2011 / 2012
Eastern MAAC*
$197.67
$148.80
$191.32
$174.29
$110.00
MAAC
---
---
$191.32 (a)
$174.29
$110.00
Rest of Pool
$40.80
$111.92
$102.04
$174.29
$110.00
* Majority of Power’s assets
(a) – includes APS
MW
Power Total Capacity
13,576
Less New England
(977)
Less New York
(747)
PJM Capacity
11,852
Less RMR (Hudson 1)
(355)
11,497
Less Forced Outage (EFORD)
(881)
Available PJM Capacity
10,616
Less Capacity Absorbed By BGS Pre-RPM
Less Bilateral Capacity Sales Pre-RPM
Equals Capacity Available to Receive RPM Pricing
PJM Capacity Available to Receive Auction Pricing
0
2,000
4,000
6,000
8,000
10,000
12,000
07/08
08/09
09/10
10/11
11/12
Delivering value: Today and Tomorrow
82

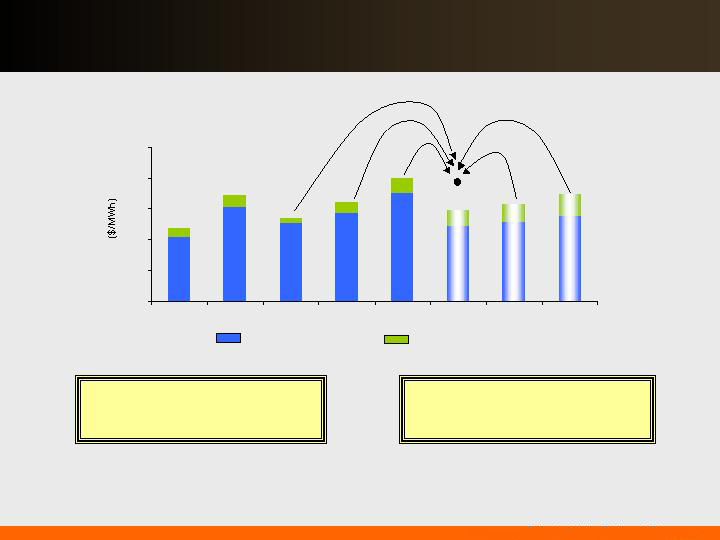
Capacity as an element of the overall pricing for BGS…
… contributed approximately $16/MWh to the 2009 BGS auction price.
*Excludes CTRs
$/MW-day
2009-2010 Auction
$191.32
2010-2011 Auction
$174.29
2011-2012 Auction
$110.00
Three Year Average ($/MW-day)
$158.54
Three Year Average ($/MW-day)
$158.54
MW per Tranche (varies by EDC)
~110
Days per Year
365
Capacity Cost per Tranche
$6,365,000
MW per Tranche (varies by EDC)
~110
Hours per Year
8,760
Load Factor (varies by EDC and demand)
~42%
MWh per Tranche
404,000
Capacity Cost per MWh
~$16
MWh per Tranche
Capacity Price per RPM Auction
Capacity Price per BGS Tranche
Delivering value: Today and Tomorrow
83

2,847
3,914
7,951
2,035
46,300
80,600
Prior FERC Approval of RPM
After FERC Approval of RPM
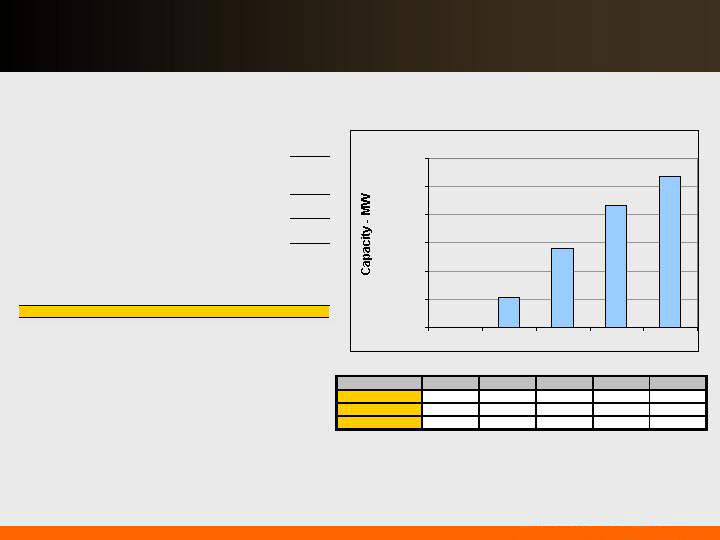
The market has responded to RPM …
… with proposals for additional capacity in the queue.
Resources Added Since RPM Began
(16,700 MW)
Proposed Generation in PJM Queue
(MW)
Net exports have decreased by nearly 3,000 MW
Withdrawn deactivation requests and
postponed/cancelled retirements have accounted
for nearly 4,000 MW
Almost 8,000 MW of new generation resources
DSM Resources have increased in each auction
RPM has prompted substantial generation
proposals, with over 34,000 MW added to the
queue since FERC approved RPM
Power has requested PJM study adding 1,000
MW, with the expectation of bidding 300 to 400
MW at our NJ sites in the next auction
Demand Resources
Increase in Generation
Retained Generation
Decrease in Net Exports
Delivering value: Today and Tomorrow
84

PJM is preparing for the 2012/2013 capacity auction…
The 6th RPM auction for capacity in PJM will take place in May 2009
Auction will cover the period of June 2012 – May 2013
Potential changes from prior auction include:
Update to Net Cost of New Entry from $171/MW-day to $286/MW-day
for the RTO ($62/kw-yr to $104/kw-yr)
Duquesne load participation
Locational Delivery Areas (LDAs) include PSEG zone/ PS North
Other issues
PJM issued planning parameters, including LDAs, on Feb 13
FERC expected to rule on proposed changes on March 27
… with a FERC decision anticipated in the near term.
Delivering Value: Today and Tomorrow
85

Gas Asset Optimization
Large wholesale provider to PSE&G and others
Storage capacity of 80 Bcf (in the Gulf and market regions)
Firm transportation of 1.1 Bcf/Day (on ten pipelines)
Off-system sales margins shared with residential customers
Commercial & Industrial customers (C&I) sales priced monthly at market
Storage spreads capture Summer/Winter price differential on C&I sales
Weather and price volatility drive results
Ancillary Services
Area regulation
Voltage regulation
Black start
Emissions Credits
… continuing to provide $100 to $200 million in margin.
Power has other attractive sources of revenues …
Delivering Value: Today and Tomorrow
86

RGGI
States
The Regional Greenhouse Initiative (RGGI)…
Cooperative effort by Northeast
states to design a regional cap-and-
trade program to reduce carbon
dioxide (CO2) emissions
Timeline
January 1, 2009 – Implementation
Quarterly auctions have been held
September 2008 clearing price
of $3.07/ton on 12.6M
allowances
December 2008 clearing price
of $3.38/ton on 31.5M
allowances
March 2009 auction for 32M
tons
Power’s anticipated CO2 emissions in
the RGGI regions is 15 – 16M tons
… is in place in the Northeast and may be a precursor to the
adoption of a national program.
ME
NY
DE
NH
VT
MA
NJ
RI
PA
MD
CT
Delivering Value: Today and Tomorrow
87

We make things work for you.
PSEG Power – Financial Overview
Daniel Cregg
Vice President, PSEG Power Finance
2007 Operating
Earnings*
Energy
Capacity
Cost
NDT and MTM
2008 Operating
Earnings*
2008 NDT and
MTM
2008 Operating
Earnings
without NDT
and MTM
… with the achievement of record earnings.
Power met its 2008 earnings commitment…
$949M
$1,107M
$80M
$134M
Operations
Uprates
BGS
Recontracting
Fuel
Full year
RPM
O&M
Depreciation
Other
($50M)
$57M
Power’s 2007 vs 2008 Operating Earnings
$1,050M
$1,850M EBITDA $2,170M
($63M)
*See page 139 for Items excluded from Income from Continuing Operations to reconcile to Operating Earnings
Delivering Value: Today and Tomorrow
89

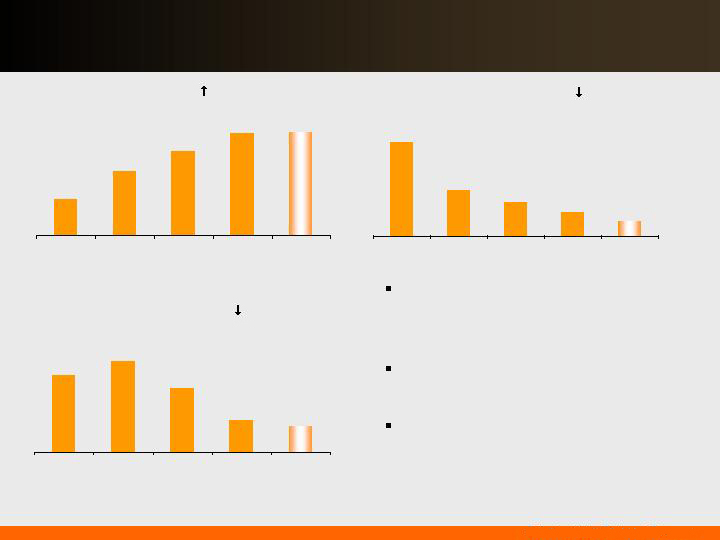
Power’s results have also generated strong cash flow…
Cash from Operations
Strong cash flow from operations
Cash from Investing
Disciplined approach to investing
Near term conclusion of planned environmental build
Cash from Financing
Successful program to access retail markets yielded
approximately $210 million at 6% - 6.5%
… with benefits derived from many areas.
Cash from Operations
(↑)
($Million)
$600
$1,200
$1,800
2006
2007
2008
Delivering Value: Today and Tomorrow
90

2008 Operating
Earnings without
NDT and MTM
Energy
Capacity
Other Margin
Cost
2009 Guidance
… with visible sources of value to achieve this result.
Power’s commitment in 2009 reflects continued earnings
growth…
$1,107M
$1,210 -
$1,285M
$90 – 100M
($25 – 15M)
$88 – 133M
O&M (pension)
Depreciation
Other
($50 – 40M)
Power’s 2008 Operating Earnings vs 2009 Guidance
Operations
Uprates
BGS
Recontracting
Fuel
More capacity
open to auction
BGSS
Other
$2,170M EBITDA $2,350 - $2,450M
Delivering Value: Today and Tomorrow
91
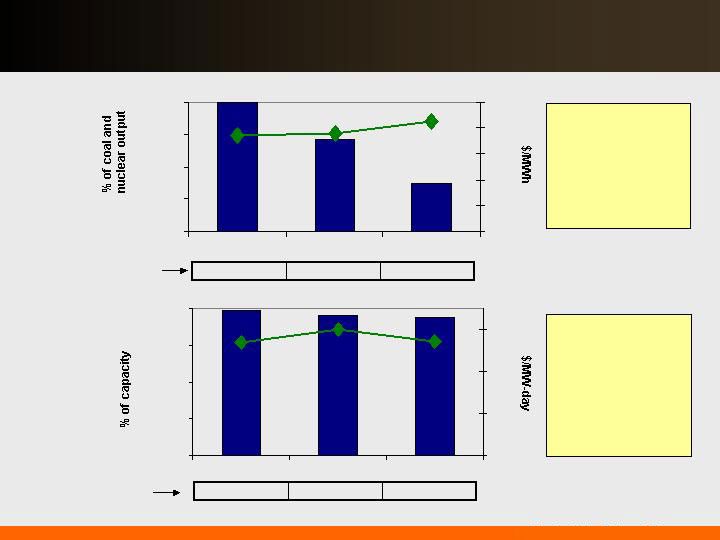
0%
25%
50%
75%
100%
2009
2010
2011
$40
$50
$60
$70
$80
$90
0%
25%
50%
75%
100%
2009
2010
2011
$0
$50
$100
$150
Power’s hedging program provides near-term stability from
market volatility…
… while remaining open to long-term market forces.
Estimated EPS impact of
$10/MWh PJM West around
the clock price change*
(~$2/mmbtu gas change)
Contracted Capacity
Estimated EPS impact of
$30/MW-day capacity
price change*
Price
(right
scale)
*As of February 2009; Assuming normal market commodity correlations
Power has
contracted at
attractive prices,
which includes
locational basis
and load shaping
premium.
The pricing for
most of Power’s
capacity has been
fixed through May
2012, with the
completion of
auctions in PJM
and NE.
% sold
(left
scale)
$0.25 - $0.45
$0.10 - $0.20
$0.01 - $0.02
$0.00 - $0.01
$0.00 - $0.01
$0.00 - $0.01
Contracted Energy
Price
(right
scale)
% sold
(left
scale)
Delivering Value: Today and Tomorrow
92

Power’s coal hedging strategy is matched up with generation…
…with hedged coal pricing aligned with coal output sold.
$0
$10
$20
$30
$40
$50
2008
2009
2010
2011
Anticipated Coal Cost
(Cost/MWh)
Hedged
Open
Mid $20’s
Mid $20’s
Low $40’s
High $40’s/$50
To
High $30’s
High $40’s/$50
Indicative
Pricing
($/MWh)
Prices lower,
moderating
Northern
Appalachian
Conemaugh
Prices lower,
moderating
Northern
Appalachian
Keystone
More limited
segment of
coal market
Metallurgical
Mercer
Flexibility after
BET in 2010
Adaro /
Domestic
Hudson
Higher price,
lower BTU,
enviro coal
Adaro
Bridgeport
Harbor
Comments
Coal Type
Station
Delivering Value: Today and Tomorrow
93

$0
$5
$10
2008
2009
2010
2011
Anticipated Nuclear Fuel Cost
(Cost/MWh)
Power has hedged its nuclear fuel needs through 2011…
… with increased pricing over that time horizon.
Hedged
Delivering Value: Today and Tomorrow
94

… including market and operational factors.
Power’s earnings for 2010 will be subject to many influences…
$1,210 – $1,285M
Revenue/Margin
Nuclear output largely contracted
Dark Spread change of $5/MWh at
market – impact of $0.05-$0.10/share
Spark Spread change of $5/MWh at
market – impact of $0.05-$0.10/share
Capacity change of $30/MW-day –
impact of $0.00-$0.01/share
Operations
Operational excellence – 1% change in
nuclear capacity factor – impact of
$0.01-$0.03/share
O&M 1% change – impact of
~$0.01/share
Depreciation increase of ~$0.03/share
due to capital in service
2009 Guidance
2010+ Drivers
Delivering Value: Today and Tomorrow
95

As national carbon regulation looks increasingly likely…
… Power should benefit based on its low carbon fleet.
The diversity of the portfolio makes Power well positioned to capture
value in a wide range of potential regulatory outcomes.
CO2 $/Ton Impact on PJM Prices and Power’s EBITDA
Illustration at $20 CO2:
(2008 Data)
55 TWh
x ~ $12 to $14/MWh
~ $660 – $770 M revenue
20M tons
x $20/ton
~ $400 M expense
The impact on
electric prices
moderates at higher
CO2 prices as:
-the fleet dispatch
changes, and
-the CO2 intensity of
the grid goes down.
$0
$100
$200
$300
$400
$500
$600
$700
$0
$10
$20
$30
$40
CO2 Price ($/ton)
Delivering Value: Today and Tomorrow
96

Delivering
Value Today
Positioned for
the Future
Meeting
Commitments
Achieved earnings targets
Improved operating
performance of generation
fleet
Environmental
commitments met
$1 Billion capital expense
on budget, met specs
Disciplined hedging
strategies have managed
earnings volatility and
reduced risk
On target to meet 2009
earnings guidance of
$1,210M to $1,285M
Continued Operational
Excellence Model (OEM)
implementation with
demonstrated
improvements at Fossil
Sustained, strong nuclear
performance
Successful multi-year
hedging strategy
supported by BGS, RPM in
liquid markets
Effective management of
costs and capital programs
to drive value
Low-cost, baseload
nuclear fleet benefits in
carbon constrained world
BET installation improves
operating capability of coal
fleet and enables a wide
variety of coals
Expansion opportunities
through existing
experience and
infrastructure, including
peaker bids
Strong free cash flow
PSEG Power - Delivering Value: Today and Tomorrow
Delivering Value: Today and Tomorrow
97

PSEG – Financial Review and
Outlook
We make things work for you.
Tom O’Flynn
Executive Vice President and Chief Financial Officer

Balanced business mix
Federal and State policies
provide opportunities for
growth – Leadership
position in energy policy
Major Power capital
projects nearing
completion
Financial strength
provides flexibility
Dividend payout target of
40%-50% provides room
for growth
Delivering
Value Today
Positioned for
the Future
Meeting
Commitments
Achieved earnings
targets
Operational excellence
drove results
Balance sheet
strengthened; credit
outlook improved
Attractive dividend
growth rate
2009 earnings guidance
represents continued
growth
Operational excellence
improving results
Multi-year hedging
strategy, including BGS
mitigates market risk
Dividend increased – 6th
consecutive year; 102nd
year of paying an annual
dividend
Strong financial position –
credit metrics, liquidity
PSEG - Delivering Value: Today and Tomorrow
Delivering Value: Today and Tomorrow
99
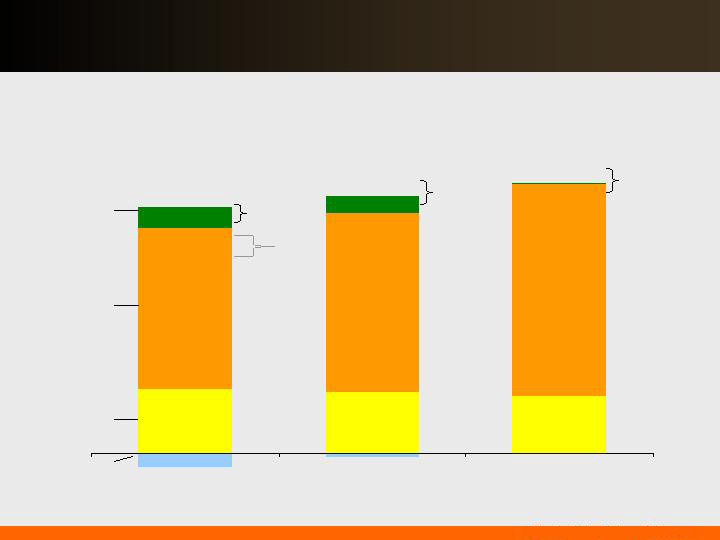
$376
$360
$949
$1,050
$123
$101
($63)
$320 - $345
$1,210 - $1,285
$0 - $20
($24)
($10) - $0
2007
2008
2009
$2.72
$2.57
$2.50
$2.30
We achieved our 2008 earnings guidance …
… and expect continued earnings growth in 2009.
$2.72*
Holdings
PSE&G
Power
Parent
Operating Earnings by Subsidiary
$2.92*
$3.05
$2.80
Guidance
Range
Guidance
Range
$3.25
$3.00
Guidance
Range
Initial
Guidance
*See page 139 for Items excluded from Income from Continuing Operations to reconcile to Operating Earnings
Delivering Value: Today and Tomorrow
100

PSEG Consolidated
2008 Sources and Uses
Proceeds from asset sales provided further support for debt
reduction.
$0.0
$1.0
$2.0
$3.0
$4.0
Sources
Uses
Share Repurchases
Cash Ops*
(Non-GAAP)
Shareholder
Dividend
Investment
(includes
Nuclear
Fuel)
Debt
Reduction
Net Asset
Sales
Internally generated cash in 2008 exceeded investment needs.
* Cash Ops (Non-GAAP) represents Cash Ops adjusted for securitization principal repayment, taxes associated with asset sales, and IRS deposits.
IRS Deposit
Delivering Value: Today and Tomorrow
101

Consolidated
PSE&G
Power
Holdings
Net Short Term Debt / (Investments)
(0.2)
(0.0)
-
-
Total Long-Term Debt
7.2
3.5
2.9
0.5
Preferred Stock
0.1
0.1
-
-
Common Equity
7.8
3.6
3.9
1.1
Total Capitalization
14.9
7.2
6.8
1.6
2008 Year-End Capital Structure*
$ Billions
45%
50%
55%
2007
2008
48%
50%
47%
50%
53%
2007
2008
PSE&G
Regulatory Equity Ratio
PSEG Consolidated
Total Debt to Total Capitalization
Our balance sheet has been strengthened …
… which provides us substantial financial flexibility.
*Excludes securitization and non-recourse debt
~$525M reduction in Net Debt
excluding PSE&G
~
~
Delivering Value: Today and Tomorrow
102

35%
40%
45%
50%
55%
2007
2008
2009
20%
25%
30%
35%
2007
2008
2009
PSEG
Funds from Operations / Total Debt
PSEG Power
Funds from Operations / Total Debt
Target Mid-20’s
»
Target Mid-30’s
»
We are meeting or exceeding key credit measures …
… maximizing financial flexibility in uncertain credit markets.
Delivering Value: Today and Tomorrow
103

PSE&G’s investments in Energy Efficiency, Stimulus and Solar are
conditioned upon receiving reasonable rate treatment.
Future investments are weighted towards PSE&G and growth.
2009 - 2011 Capital Expenditures
$0
$500
$1,000
$1,500
$2,000
$2,500
2009
2010
2011
Power –
Sustainability
PSE&G -
Distribution
Infrastructure
Power – BET
Environmental
PSE&G -
Transmission
PSE&G - Other
Solar 4 All
Pending
Filings
Energy Efficiency
Solar II
Power –
Growth
Delivering Value: Today and Tomorrow
104

PSEG Power had substantial and growing …
… excess cash due to declining capital expenditures.
2008
2009
~ $525M
Excess Cash Flow
Cash Ops
excluding
changes in
working capital
Less: Investing
including Capex
of $822M and
Nuclear Fuel of
$150M
$129M
$800M - $900M
Improving
Earnings &
Cash Ops
Declining
Capex
Excess Cash Flow =
Potential Dividends
PSEG Power Cash Flow
2009 Capex =
$693M
vs.
Sustainability
Capex =
$200M - $225M
$1.2B - $1.3B
Excluding
Non-Recurring
Capex
Excess Cash at
Maintenance
Capex Levels
Delivering Value: Today and Tomorrow
105

PSE&G’s asset base is growing.
2009
Guidance
Retained
Earnings
Debt
Financing
Other Cash
Ops
2009
$320M - $345M
“Normal Dividends”
$100M - $150M
Capex Debt
Financing
Base Capex
~ $850M
Dividends to the Parent are dependent on capital needs.
PSE&G Cash Flow
Cash Flow Drivers
Capital Spending
(Pending Filings)
Earnings
Dividends / Capital
Contributions Dependent
on Capital Spending
Cash Flow from
adjustments to NI
including
Depreciation
Delivering Value: Today and Tomorrow
106

Unused Debt Capacity
$750M
Earnings
Capex declines annually
by an average of $150M
during 2010 and 2011
$800M - $900M
Earnings
Capital Program (Pending
Filings)
Ongoing Drivers of Change
Potential One-Time Impacts
Dividend Range
(“Normalized”)
Equity Ratio 1%
Dividend $75M
Cash on Hand
Plus: Asset Value
Plus: Net Debt Capacity
Potential Tax Liability
$100M - $150M
$750M
$225M - $375M
$800M - $900M
$100M - $150M
($675M)
2009
2009
(Sustainability Capex Only)
$100M - $150M
PSE&G Dividend
$750M
Unused Debt Capacity
(One-Time)
$625M - $775M
Excess Cash
$1.2B - $1.3B
Power Dividend
($675M)
Shareholder Dividend
PSEG has meaningful excess cash which can…
… be redeployed toward attractive risk-adjusted investments.
Delivering Value: Today and Tomorrow
107

…with most of our credit facilities extending until 2012.
We have substantial liquidity…
Non-PSE&G Credit Capacity
0
500
1,000
1,500
2,000
2,500
3,000
3,500
2009
2010
2011
2012
PSEG and PSEG
Power Multi-Year
Credit Facilities
Energy
Holdings
Credit
Facility
Bilaterals*,**
Facility
Expirations
December
($2.6B)
5.0%
BNP Paribas
5.2%
Citibank
5.6%
The Bank of New York
Mellon
5.6%
Wachovia Bank
5.6%
Barclays Bank
5.6%
Royal Bank of
Scotland
5.9%
Scotia Capital
9.2%
JP Morgan Chase**
9.9%
Bank of America (incl.
Merrill Lynch)
10.2%
Mizuho*
% of Total
Commitment
Institution
* Includes bilaterals expiring in March ($150M) and June 2009
($100M)
** Includes bilateral expiring June 2009 ($100M)
Delivering Value: Today and Tomorrow
108

… to mitigate impacts of current environment, including increasing
pension expense.
6.80%
6.50%
Discount Rate
31.0*
16.0
$15.0*
2008 Actual
162.0*
TOTAL
80.0
PSEG Power / Other
$82.0*
PSE&G
2009 Estimate
($millions)
* After capitalization and Service Company allocation
We are aggressively managing O&M costs …
PSE&G expects a
cost of service
adjustment
following our rate
case.
Estimated Pre-Tax Pension Expense
-2.0%
0.0%
2.0%
4.0%
6.0%
8.0%
O&M Including Pension*
O&M Excluding Pension
O&M Expense Growth Rates
Reflects restaffing
organization
2008 – 2009
2006 –
2008
2006 –
2008
* Excludes impact of utility recovery clauses
Delivering Value: Today and Tomorrow
109

2007
Operating
Earnings
without NDT
and MTM*
2008
Operating
Earnings
without NDT
and MTM*
Power
Utility
Holdings
Other
2009 Guidance
… with visible sources of value to achieve this result.
2009’s guidance reflects continued earnings growth…
$1,363M
$1,520 –
$1,650M
($40 – 15M)
($99 – 79M)
$103 – 178M
$14 – 24M
PSEG’s 2007-2008 Operating Earnings vs 2009 Guidance
$1,542M
Benefit of
lower debt
levels and
interest
expense
{EPS=
$2.68}
{EPS=
$3.03}
{EPS =
$3.00-
3.25}
*See page 138 for Operating Earnings without NDT and MTM
Delivering Value: Today and Tomorrow
110

Operational excellence, financial strength and disciplined investment…
… position us well in today’s market.
Low payout ratio and strong balance sheet provide support
Is dividend secure?
Strong balance sheet, credit metrics and liquidity
What is the impact of
credit market stress?
Strong cash flow well in excess of PSE&G’s equity
requirements
Do you need equity?
Carbon friendly
Federal and State Policy initiatives support capital plans
How is PSEG affected
by policy changes?
Multi-year hedging profile supported by core assets
Asset balance dampens relative fuel price volatility
Capacity markets provide stability
What’s the impact of
commodity volatility?
PSE&G current/pending rate needs equal 2-4% impact
BGS supply generally priced at market
What is impact on
customer from capital
programs?
PSEG Position
Market’s Questions
Delivering Value: Today and Tomorrow
111

Balanced business mix
Federal and State policies
provide opportunities for
growth – Leadership
position in energy policy
Major Power capital
projects nearing
completion
Financial strength
provides flexibility
Dividend payout target of
40%-50% provides room
for growth
Delivering
Value Today
Positioned for
the Future
Meeting
Commitments
Achieved earnings
targets
Operational excellence
drove results
Balance sheet
strengthened; credit
outlook improved
Attractive dividend
growth rate
2009 earnings guidance
represents continued
growth
Operational excellence
improving results
Multi-year hedging
strategy, including BGS
mitigates market risk
Dividend increased – 6th
consecutive year; 102nd
year of paying an annual
dividend
Strong financial position –
credit metrics, liquidity
PSEG - Delivering Value: Today and Tomorrow
Delivering Value: Today and Tomorrow
112

Public Service Enterprise Group
We make things work for you.

Executive Profiles
We make things work for you.

Ralph Izzo
Ralph Izzo was elected chairman and chief executive officer of Public Service Enterprise Group Incorporated (PSEG), in April 2007. He
was also named as the company’s president and chief operating officer, and a member of the board of directors of PSEG, in October
2006. Prior, Mr. Izzo was president and chief operating officer of Public Service Electric and Gas Company (PSE&G).
Since joining PSE&G in 1992 Mr. Izzo was elected to several executive positions within PSEG’s family of companies, including PSE&G
senior vice president – utility operations, PSE&G vice president – appliance service, PSEG vice president - corporate planning, Energis
Incorporated senior vice president – finance and information services, and PSE&G vice president - electric ventures. In these
capacities, he broadened his experience in the areas of general management, strategic planning and finance.
Mr. Izzo is a well-known leader within the utility industry, as well as the public policy arena. His public policy experience includes
service as an American Physical Society Congressional Science Fellow, in the office of U.S. Senator Bill Bradley. He also served four
years as a senior policy advisor in the Office of New Jersey Governor Thomas H. Kean, specializing in energy, science and technology.
Mr. Izzo’s career began as a research scientist at the Princeton Plasma Physics Laboratory, performing numerical simulations of fusion
energy experiments. He has published or presented over 35 papers on magnetohydrodynamic modeling. Mr. Izzo received his
Bachelor of Science and Master of Science degrees in mechanical engineering and his Doctor of Philosophy degree in applied physics
from Columbia University. He also completed the requirements for a Master of Business Administration degree, with a concentration in
finance from the Rutgers Graduate School of Management. He is listed in numerous editions of Who’s Who and has been the recipient
of national fellowships and awards.
Mr. Izzo is chairman of the board for the Center for Energy Workforce Development (CEWD), as well as for the Drumthwacket
Foundation. He serves on the board of directors for the New Jersey Chamber of Commerce, the New Jersey Utilities Association, the
Edison Electric Institute (EEI), and the Nuclear Energy Institute (NEI). Mr. Izzo is also a member of the Council on Competitiveness –
Energy Security; Innovation and Sustainability Initiative Steering Committee; and on the board of trustees for the New Jersey Network
Foundation.
Chairman, President and Chief
Executive Officer
Public Service Enterprise Group
Incorporated

Thomas M. O’Flynn
Thomas M. O’Flynn was named executive vice president and chief financial officer for Public Service Enterprise
Group Incorporated (PSEG), in July 2001. He is also the chief financial officer of Public Service Electric and Gas
Company (PSE&G), PSEG Power (Power), and PSEG Energy Holdings (Holdings). Mr. O’Flynn had been
president and chief operating officer of Holdings, until July 2008, overseeing the operations of its two main
subsidiaries: PSEG Global and PSEG Resources.
Mr. O’Flynn came to PSEG with 15 years of experience at Morgan Stanley, where he specialized in corporate
finance for electric and gas utility and power clients. As a managing director in Morgan Stanley’s global power and
utility group and head of the North American region, he worked with major energy companies on many strategic
advisory and financing transactions; including mergers and acquisitions, IPO offerings and capital raising
assignments. Also, while at Morgan Stanley he served as a financial advisor to PSEG, prior to becoming the
managing director of Morgan Stanley’s global power and utility group.
Mr. O’Flynn holds a degree from Northwestern University in economics and a Master of Business Administration
degree from the University of Chicago. He currently serves as the chairman of the finance executive advisory
committee of the Edison Electric Institute (EEI) and also serves on the board of directors for Nuclear Electric
Insurance Limited (NEIL), the New Jersey Performing Arts Center (NJPAC) and The Newark Museum.
Executive Vice President and Chief
Financial Officer
Public Service Enterprise Group
Incorporated

William Levis
William Levis was elected president and chief operating officer of PSEG Power (Power), effective June 2007. He had
been president and chief nuclear officer of PSEG Nuclear (Nuclear) since January 2007, while retaining his position as
Power’s president and COO. Power is a major unregulated independent power producer in the U.S. with three main
subsidiaries: PSEG Fossil, PSEG Nuclear, and PSEG Energy Resources and Trade.
Previously, Mr. Levis was also senior vice president and chief nuclear officer, as part of the Nuclear Operating Services
Agreement between PSEG and Exelon Corporation. Under his leadership Nuclear’s Salem and Hope Creek stations
have advanced to the highest performance levels in the stations’ history. Improvement in the stations’ work environment
has resulted in the closing of two long standing NRC cross-cutting issues - problem identification and resolution, and
safety conscious work environment.
Mr. Levis has more than 25 years of diversified experience in the nuclear power industry. Before coming to PSEG he
was Exelon Nuclear’s vice president Mid-Atlantic operations, where he provided executive oversight of day-to-day
operations of the Limerick, Peach Bottom, Three Mile Island and Oyster Creek Stations. He joined Exelon as the Byron
Station Manager in 1998 and was promoted to site vice president the following year. In 2001 he was named site vice
president at Limerick Generating Station.
Prior to joining Exelon Mr. Levis worked at Ontario Hydro’s Pickering Plant and held several positions over a five-year
period with Carolina Power & Light’s Brunswick facility. During this time the station was removed from the NRC Watch
List and set new records in the areas of safety, production and cost. Mr. Levis’ background also includes experience with
NRC, Westec Services, General Electric Nuclear Services and the U.S. Navy. He has a Bachelor of Science degree in
marine engineering from the U.S. Naval Academy and holds an SRO (senior reactor operator) certification. Mr. Levis
retired as a commander in the Naval Reserves and attained his professional engineer license in 1985.
President and Chief Operating Officer
PSEG Power

Ralph A. LaRossa
Ralph A. LaRossa was named president and chief operating officer of Public Service Electric and Gas
Company (PSE&G), in October 2006. Prior to this position he was vice president - electric delivery for PSE&G.
Mr. LaRossa joined PSE&G in 1985 as an associate engineer and advanced through a variety of management
positions in the utility’s gas and electric operations. Past positions include vice president - delivery operations
support, division manager - Metropolitan electric division, director - distribution operations, manager - gas
distribution, project manager for AWMS (automated work management system), assistant division manager,
district manager and field engineer in gas distribution. PSE&G is New Jersey’s largest electric and gas utility.
Mr. LaRossa is a graduate of Stevens Institute of Technology with a Bachelor of Engineering degree in industrial
engineering, and has completed the Harvard Business School’s Program for Management Development. In 1998
he received Gas Industry Magazine’s Outstanding Manager of the Year Award. Mr. LaRossa is a member of the
Association of Edison Illuminating Companies (committee on power delivery), the Electric Power Reliability
Institute (EPRI) research advisory committee, the PJM Designated Officers Committee, and the PJM
Transmission Owners Agreement administrative committee. He is also on the board of directors of Bergen
County’s United Way and a member of the Montclair State University board of trustees.
President and Chief Operating Officer
Public Service Electric and Gas Company

Stephen C. Byrd
Stephen C. Byrd was named president and chief operating officer of PSEG Energy Holdings (Holdings), in July
2008, and president of PSEG Global, in August 2008. Prior, he was senior vice president - - finance, business
development, strategy and M&A for Public Service Enterprise Group Incorporated (PSEG), since January 2007. As
senior vice president Mr. Byrd’s responsibilities also included overseeing finance matters for two subsidiaries - -
Public Service Electric and Gas Company (PSE&G) and Holdings.
Prior to joining PSEG, Mr. Byrd was executive director of the global energy and utilities group in the investment
banking firm of Morgan Stanley. In this position he had the lead role in developing transactions involving a
combination of investment banking, commodities and structured finance capabilities. On the M&A front Mr. Byrd
advised on a broad range of transactions, from less than $100 million in size to more than $40 billion. In the
financing area his lead execution roles included initial public stock offerings, principal investments in private
companies, convertible offerings and high-yield and investment grade debt offerings.
Mr. Byrd is a member of the New York State Bar Association and holds a joint Doctor of Law and Master of
Business Administration degree from the University of Virginia. He also earned a Bachelor of Business
Administration degree in finance from the College of William and Mary.
President and Chief Operating Officer
PSEG Energy Holdings
President
PSEG Global

Clarence (Joe) Hopf, Jr.
Clarence (Joe) Hopf, Jr. was named president of PSEG Energy Resources & Trade in June 2008. His
responsibilities include management of PSEG Power’s generation portfolio and basic gas supply service,
purchasing of fuel, mid- and back-office operations as well as trading and marketing activities.
Prior to joining PSEG, Mr. Hopf was president of PPL EnergyPlus in Allentown, PA, since 2006. He was
responsible for managing PPL’s wholesale/retail marketing and trading operation in the United States. Mr. Hopf
has held a variety of posts with increasing responsibility in the electric generation and energy trading business
since 1981. Prior to joining PPL in 2005 as a senior vice president, he served as a vice president at Goldman
Sachs in New York and, before that, at AmerenEnergy in St. Louis.
President
PSEG Energy Resources & Trade

Daniel J. Cregg
Daniel J. Cregg was named vice president – finance power for PSEG Services Corporation, in December 2006.
Prior to this appointment he was director – financial reporting and communications at PSEG Power, with
responsibilities including financial reporting and forecasting, investor communications, financings, rating agency
interactions, external reporting, and cash forecasting. He previously held leadership positions with Power in the
areas of financial valuations, competitive intelligence, and fundamental market modeling; with critical
responsibilities in Power’s development and strategic planning activities.
Previously, Mr. Cregg was director of PSEG corporate development. He joined PSEG in 1991 with overall
responsibility for tax planning, strategy and compliance for PSEG Energy Holdings, including domestic and
international tax structuring work for PSEG Global and PSEG Resources.
Prior to joining PSEG Mr. Cregg spent five years with the accounting and consulting firm of Deloitte and Touche,
providing services to a wide array of clients with an emphasis on the energy industry.
Mr. Cregg has been involved in raising awareness and funding for Sudden Infant Death Syndrome (SIDS) for the
last fifteen years. He is also an executive sponsor for Power’s diversity council and is a member of PEGPAC,
PSEG’s Political Action Committee.
Mr. Cregg holds a Master of Business Administration degree from the Wharton School of the University of
Pennsylvania, is a graduate of Lehigh University, where he received a bachelor’s degree in accounting and is a
certified public accountant.
Vice President – Finance Power
PSEG Services Corporation

Appendix
We make things work for you.

Proposed energy efficiency investment and savings
Investment Timeline
2009 – 2011 (18 months)
Category
Investment
Annual
Lifetime
Annual
Lifetime
Jobs
Residential
($ millions)
Whole House
$25
5,428
86,847
27,587
551,744
120
Multi-Family
25
5,428
86,847
27,587
551,744
60
10,856
173,694
55,174
1,103,488
180
Industrial & Commercial
Small Business
20
35,897
538,462
74,359
1,115,385
80
Muni/Local/State Government
35
49,595
743,927
82,186
1,232,794
143
Hospital Efficiency
35
73,200
1,098,000
748,466
11,226,994
140
Data Center
12
38,400
576,000
147,239
2,208,589
50
Tech Demo Sub-Program
12
18,947
284,210
192,000
2,880,000
50
Building
2
3,750
56,250
38,462
576,923
8
219,789
3,296,849
1,282,712
19,240,685
471
Admin Sales, Training, Evaluation, IT
24
TOTAL
$190
230,645
3,470,543
1,337,886
20,344,173
651
Savings (MWh)
Savings (Dtherms)
Delivering Value: Today and Tomorrow
123

Rate Mechanism
PSE&G proposes to recover the costs of the program through
an annual adjustment to electric and gas rates which would
not exceed 1%.
The cost of capital would be based on a capital structure
consisting of 51.2% common equity with a return on common
equity of 10.3%--consistent with the return allowed NJNG in
its December 2008 base rate case decision.
The Energy Efficiency Program revenue requirements would
include the recovery of lost distribution margin.
Delivering Value: Today and Tomorrow
124

PSE&G Solar 4 All Proposal
Neighborhood Solar (40 megawatts) - $264M investment
Solar panels on utility poles and street lights in neighborhoods throughout
PSE&G’s service territory.
Local Government Solar (43 megawatts) - $273M investment
Solar, owned and operated by PSE&G, on municipal and public school district
facilities. Local governments will receive a credit on their utility bill equal to the
amount of energy generated by the system.
Centralized Solar (35 megawatts) – $221M investment
Solar systems on PSE&G land/buildings.
Solar energy farms on brownfields, non-profit-owned real estate, and
underdeveloped real estate
HMFA/Affordable Housing Solar (2 megawatts) - $15M investment
Solar on New Jersey Housing and Mortgage Finance Agency (HMFA)-financed
or other affordable housing communities
PSE&G is seeking a 10.3% ROE on its equity capital invested (51.2% common equity
in its capital structure). Customer rate impact mitigated by benefits associated with ITC
and the value of electricity and Solar Renewable Energy Certificates (SRECs)
generated by the projects
NJ BPU has 180 days to respond.
Delivering Value: Today and Tomorrow
125

Income Recognition – $355 Million Charge
(400)
(200)
0
200
06/30/08
2009-
2013
2014-
2018
2019-
2023
2024-
2028
2029-
2034
Assumes issue is resolved with the IRS at current reserve levels
involving $900 - $950 million cash outflow in or by 2010.
$355
Delivering Value: Today and Tomorrow
126

PSEG Energy Holdings - Global’s US Generation Assets
Term
Counterparty
Fuel / Technology
% Owned
Total
MW
Merchant Generation
Term
Counter-party
Fuel / Technology
% Owned
Total
MW
Contracted Generation
2011
Penelec
Hydro
4%
15
Conemaugh
2010
Constellation
Biomass
(wood chips)
40%
16
Bridgewater
(New Hampshire)
2,395
2,734
Total Merchant &
Contracted Generation
2016
HECO
Oil
50%
208
Kalaeloa
(Hawaii)
2021
PG&E
Pet coke
50%
132
GWF & Hanford
(California)
2012
CDWR
Natural Gas-Fired
Peaker
60%
363
GWF Energy
(California)
Dec 31,
2010
Merchant 1,650
MW
Contract: 350
MW
Natural Gas-Fired
7FA CCGT
100%
2,000
PSEG Texas:
Odessa (West)
Guadalupe (South)
Delivering Value: Today and Tomorrow 127
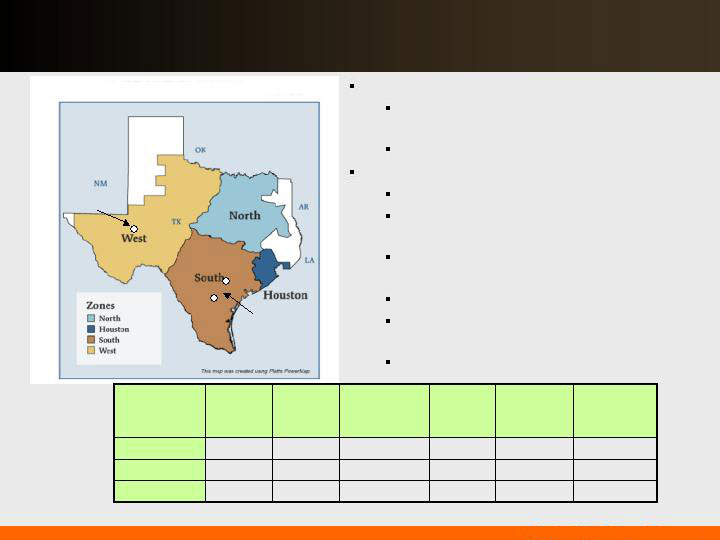
PSEG Energy Holdings - Texas Business Overview
40%
5,703
4,257
1,446
4,083
West
Odessa
-10%
19%
Reserve
Margin
2008*
15,365
20,170
Total
Gas
Nuclear,
Coal, Wind**
Hydro
Load
Zone
12,218
3,147
17,116
Houston
12,068
8,102
16,943
South
Guadalupe
* Reserve Margins calculated on data provided by ERCOT
** Wind is based on 8.7% of installed capacity (ERCOT Peak reliability % as of August 2008)
Texas (ERCOT) Electric Market Zones
Two 1,000 MW combined cycle facilities
Highly efficient gas-fired plants, on-line
in 2001
Forced outage rate less than 2%
Market Characteristics:
Bilateral forward market
Day ahead balancing and ancillary services
bid market
No capacity payments…margins derived
from energy and ancillary services
Nodal market transition likely in 2010
Natural gas units on the margin over 90%
of the time
Average load growth rate 2%
Odessa
Midland
Guadalupe
Austin
San Antonio
Delivering Value: Today and Tomorrow 128

PSEG Energy Holdings - Other International Generation
Modest investments: total of ~$24M (book value at 12/31/08)
Term
Counter-party
Fuel /
Technology
%
Owned
Total
MW
Asset
n/a
Merchant
Natural Gas
50%
120
Turboven
Maracay & Cagua,
Venezuela
2013
Manufacturas
de Papel C.A.
“Manpa”
Natural Gas
9%
40
TGM
Venezuela
2032
TNEB (State
Electricity
Board)
Naphtha /
Natural Gas
20%
330
PPN
Tamil Nadu, India
Delivering Value: Today and Tomorrow
129

PSEG Resources – Non LILO/SILO Lease Investments
* Includes booked residual
Reliant
Power Plant
Aug-00
2026 & 2034
Y
422
307
Dynegy
Power Plant
May-01
2031 & 2035
Y
359
267
EME 2
Power Plant
Aug-00
2030 & 2034
Y
333
217
Merrill Creek
Reservoir
Jun-88
2032
N
321
124
Grand Gulf
Nuc. Plant
Dec-88
2015
N
123
104
Qwest
Real Estate
Dec-91
2012
Y
204
88
Dutch Rail
Rail Cars
Oct-92
2010
N
49
49
Renaissance Ctr
Real Estate
Apr-88
2021
Y
62
38
Wal-Mart
Real Estate
Sep-91
2011-2025
Y
54
36
E-D Centers
Real Estate
Jun-90
2020 & 2021
Y
29
25
Whitehorn
Power Plant
Feb-00
2009
Y
15
15
Wal-Path
Real Estate
Apr-91
2021
Y
15
11
TOTAL
1,986
1,281
53%
56%
% Total Lease Portfolio
Average Life: 18.5 Years
Residual
2009-2035 Pre-tax
Cash Flow*
($ million)
Book
Investment
as of 12/31/08
($ million)
Agreement
Property
Type
Start
Lease
Termination
Delivering Value: Today and Tomorrow
130

PSEG Resources Portfolio – Top Ten Leases
AA+/Aa1
3%
70
540MW coal-fired generation facility in Netherlands
EZH
AA/Aa2
3%
73
Gas distribution network in Netherlands
EDON
BBB-/Ba1
4%
88
Qwest headquarters located in Denver, CO
US West/Qwest
A+/Aa3
4%
104
1,100 MW nuclear station in Mississippi
Grand Gulf
BBB/
A3
5%
124
Reservoir in NJ
Merrill Creek –
(PECO, MetEd,
Delmarva Power &
Light)
BBB-/Baa3
61%
1,475
Total Top Ten
A-/A3
95%
2,279
Total Leases
AA+/Aa1
5%
109
Electric distribution system in Austria
ESG
AA+/Aa1
5%
116
Gas distribution network in Netherlands
ENECO
BB-/B1
9%
217
Powerton & Joliet Generating Stations (IL)
2 coal-fired generating facilities (1,640 equity MW)
Edison Mission
Energy (EME)
B/B3
11%
267
Danskammer & Roseton Generating Station (NY) –
370 MW coal fired and 1,200 MW oil/gas fired
Dynegy Holdings
B+/Ba1
13%
307
Keystone, Conemaugh & Shawville (PA)
3 coal fired plants (1,162 equity MW)
REMA (Reliant)
Credit
Rating*
% of
Portfolio
$ Invested
(millions)
Equipment
Lessee
*Reflects lessee or additional equity collateral support
Delivering Value: Today and Tomorrow
131

Historical Forward Prices…
PJM Western Hub Dark Spread
($/MWh)
Western Hub RTC
($/MWh)
Central Appalachian Coal
($/Ton)
*All data monthly average
132
$40
$50
$60
$70
$80
$90
$100
$110
$120
$130
$50
$60
$70
$80
$90
$100
$10
$20
$30
$40
$50

$5
$6
$7
$8
$9
$10
$11
$12
$50
$60
$70
$80
$90
$100
$110
$10
$15
$20
$25
Historical Forward Prices…
PJM Western Hub Spark Spread
($/MWH)
Western Hub On Peak
($/MWh)
Natural Gas Henry Hub
($/MMbtu)
*All data monthly average
2009
2010
2011
Delivering Value: Today and Tomorrow
133

Operated by PSEG Nuclear
PSEG Ownership: 100%
Technology:
Boiling Water Reactor
Total Capacity: 1,211MW
Owned Capacity: 1,211MW
License Expiration: 2026
Operated by PSEG Nuclear
Ownership: PSEG - 57%,
Exelon – 43%
Technology:
Pressurized Water Reactor
Total Capacity: 2,345MW
Owned Capacity: 1,346MW
License Expiration: 2016 and
2020
Operated by Exelon
PSEG Ownership: 50%
Technology:
Boiling Water Reactor
Total Capacity: 2,224MW
Owned Capacity: 1,112MW
License Expiration: 2033
and 2034
Hope Creek
Salem Units 1 and 2
Peach Bottom Units 2 and 3
Our five unit nuclear fleet …
… is a critical element of Power’s success.
Delivering Value: Today and Tomorrow
134
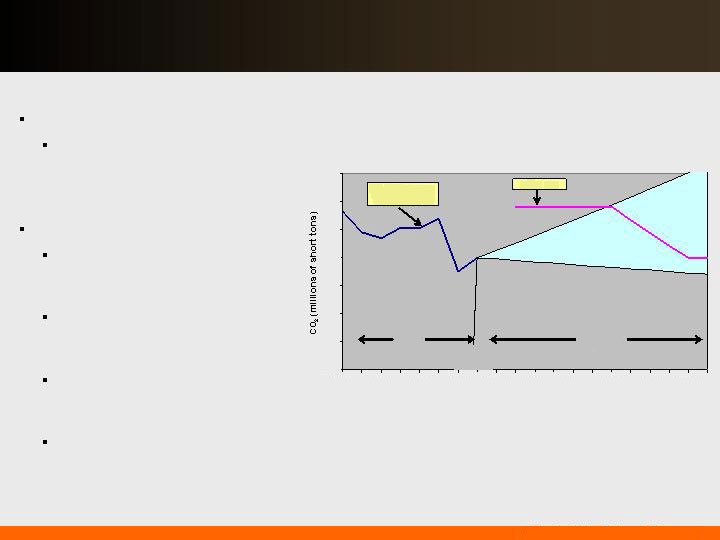
The RGGI cap on CO2 emission shows that headroom exists …
… compared to historical emission levels.
Affected Sources
Fossil-fired electric generating
units with a capacity of 25MW
and larger
200
190
Actual &
Forecast Co2
RGGI Cap
180
170
160
150
140
Actual
Projected
CO2 Emissions vs. RGGI Cap
(Actuals through 2007)
130
2000
2002
2004
2006
2008
2010
2012
2014
2016
2018
Targets and Timing
Three-year compliance periods
with the first running from 2009-
2011
Stabilization of CO2 emissions at
recent levels through 2015
(~188 million tons per year)
Achieve a 10% reduction of CO2
emissions below recent levels by
2019
This translates into ~13%
reduction below 1990 levels or
~35% reduction from Business
as Usual (BAU) levels by 2020
Delivering Value: Today and Tomorrow
135

The implementation of carbon will address the critical issue of global
warming…
~$12.00 - ~$14.00
100%
Total
$0.00
$0.00
0%
Nuclear
$4.80 - $3.60
$8.00
60%- 45%
Gas CC
$1.20 - $0.60
$12.00
10% - 5%
CTs
$6.00 - $10.00
$20.00
30% - 50%
Coal
Impact
$/MWh
On margin
(approximate)
Dispatch curve implication @ $20/ton*
By Fuel Type
$12.0
$18.0
$30.0
@$30
$8.0
$12.0
$20.0
@$20
$4.0
$6.0
$10.0
@$10
Price ($/MWh)
0.4
0.6
1.0
Carbon tons/MWh
CC
CTs
Coal
PSEG Power Generation by Fuel
… and activity continues in the direction of a national program.
*For illustration purposes – potential impact of CO2 on power prices with current dispatch – not an indication of net effect on income.
Energy Produced – 2008
53%
23%
23%
Nuclear
Coal
Gas
Total GWh: 55,300
Pumped Storage
& Oil 1%
Delivering Value: Today and Tomorrow 136

Capacity value conversion table ($)
$140
$110
$100
$90
$80
Megawatt / Day
11.50
9.00
8.20
7.40
6.58
= Megawatt hour
50.40
39.60
36.00
32.40
28.80
= Kilowatt / Year
4.20
3.30
3.00
2.70
2.40
= Kilowatt / Month
Megawatt / Day Kilowatt / Month = (1 Megawatt / 1000) * 30 days
Kilowatt / Month Kilowatt / Year = (1 Kilowatt per month *12 months)
Kilowatt / Year Megawatt hour = (($ per Kilowatt / Year * 1000) / (# of hours in a year)) * load factor
Load factor for PEG = 50%
Delivering Value: Today and Tomorrow 137

Operating Earnings Without NDT and MTM
*See page 139 for Items excluded from Income from Continuing Operations to reconcile to Operating Earnings
Unaudited ($ millions)
2008
2007
2006
Operating Earnings*
1,487
$
1,385
$
866
$
Less:
NDT Activity
(71)
12
11
MTM
16
10
28
Operating Earnings Without NDT and MTM
1,542
$
1,363
$
827
$
Earnings per share:
2008
2007
2006
Operating Earnings*
2.92
$
2.72
$
1.72
$
Less:
NDT Activity
(0.14)
0.02
0.02
MTM
0.03
0.02
0.06
Operating Earnings Without NDT and MTM
3.03
$
2.68
$
1.64
$
Fully Diluted Average Shares Outstanding
508M
509M
505M
Delivering Value: Today and Tomorrow
138

Items Excluded from Income from Continuing Operations to
Reconcile to Operating Earnings
Please see Slide 3 for an explanation of PSEG’s use of Operating Earnings as a non-GAAP financial measure
and how it differs from Net Income.
Pro-forma Adjustments, net of tax
2008
2007
2006
Earnings Impact (in Millions)
Asset Sales and Impairments:
Impairment of PPN
(9)
$
(2)
$
-
$
Impairment of Turboven
(4)
(7)
-
Loss on Sale of Chilquinta and Luz del Sur
-
(23)
-
Loss on Sale of RGE
-
-
(178)
Premium on Bond Redemption
(1)
(28)
(7)
Total Asset Sales and Impairments
(14)
(60)
(185)
Lease Reserves
(490)
-
-
Total Pro-forma to Operating Earnings
(504)
$
(60)
$
(185)
$
Fully Diluted Average Shares Outstanding (in Millions)
508
509
505
Per Share Impact (Diluted)
Asset Sales and Impairments:
Impairment of PPN
(0.02)
$
-
$
-
$
Impairment of Turboven
(0.01)
(0.01)
-
Loss on Sale of Chilquinta and Luz del Sur
-
(0.05)
-
Loss on Sale of RGE
-
-
(0.70)
Premium on Bond Redemption
-
(0.06)
(0.03)
Total Asset Sales and Impairments
(0.03)
(0.12)
(0.73)
Lease Reserves
(0.96)
-
-
Total Pro-forma to Operating Earnings
(0.99)
$
(0.12)
$
(0.73)
$
For the Twelve Months Ended
December 31,
PUBLIC SERVICE ENTERPRISE GROUP INCORPORATED
Reconciling Items Excluded from Continuing Operations to Compute Operating Earnings
(Unaudited)
Delivering Value: Today and Tomorrow
139