
Public Service Enterprise Group
41st EEI Financial Conference
November 7, 2006

Forward-Looking Statements
This presentation includes forward-looking statements within the meaning of the Private
Securities Litigation Reform Act of 1995, that are subject to risks and uncertainties. The factors
that could cause actual results of Public Service Enterprise Group Incorporated (PSEG), Public
Service Electric and Gas Company, PSEG Power LLC, and PSEG Energy Holdings L.L.C.
(collectively, the PSEG Companies) to differ materially from these forward-looking statements
include those discussed herein as well as those discussed in (1) the PSEG Companies’ 2005
Annual Report on Form 10-K, and 2006 Quarterly Reports on Form 10-Q in (a) Forward Looking
Statements (b) Risk Factors, and (c) Management’s Discussion and Analysis of Financial
Condition and Results of Operations and (2) other factors discussed in filings with the SEC by the
PSEG Companies. Readers are cautioned not to place undue reliance on these forward-looking
statements, which apply only as of the date of this presentation. None of the PSEG Companies
undertakes any obligation to publicly release any revision to its forward-looking statements to
reflect events or circumstances after the date of this presentation.
1

Agenda
PSEG Overview
Ralph Izzo
PSE&G Update
PSEG Power Update
Tom O’Flynn
Energy Holdings Update
PSEG Update
2

PSEG Overview
Ralph Izzo
President and Chief Operating Officer
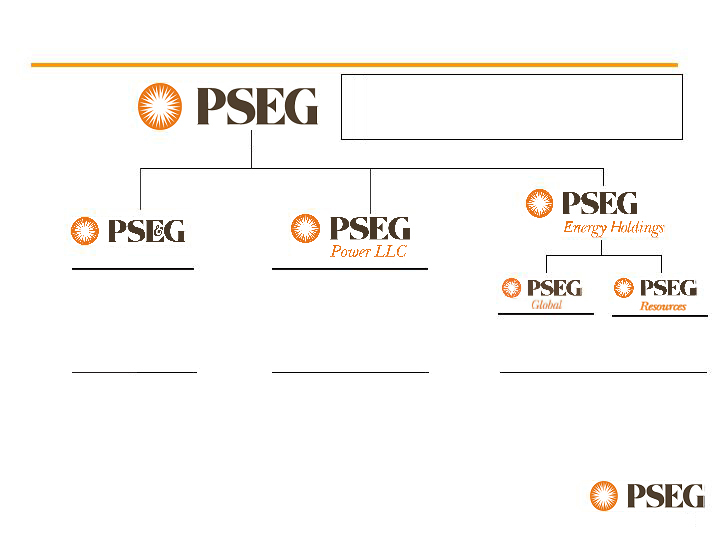
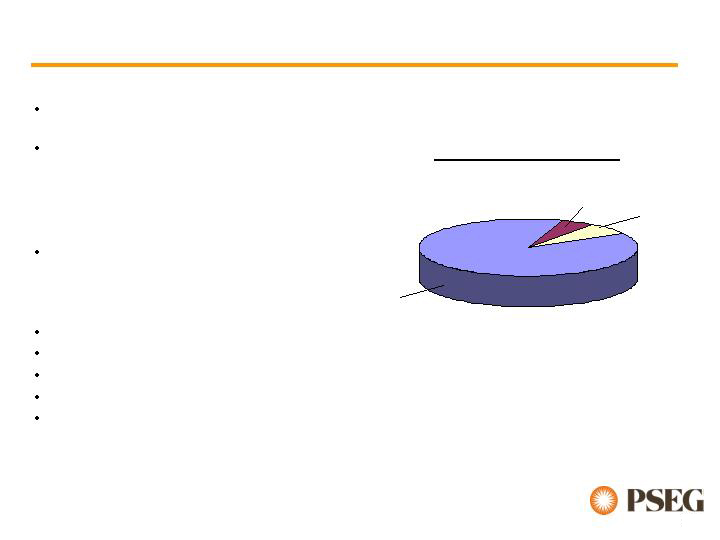
PSEG Overview
Electric Customers: 2.1M
Gas Customers: 1.7M
Nuclear Capacity: 3,494 MW
Total Capacity: 14,636 MW
Traditional T&D
Leveraged
Leases
2006E Operating Earnings(1)(2): $875M - $950M
2006 EPS Guidance(1)(2): $3.45 - $3.75
Assets (as of 9/30/06): $28.7B
Domestic/Int’l
Energy
Regional
Wholesale Energy
(1)
Includes the parent impact of $(60-70)M
(2)
Income from Continuing Operations, excluding merger-related costs and
excludes gains/losses from asset sales
(3) Income from Continuing Operations, excluding merger-related costs of $3M for
PSE&G and $12M for PSEG Power
2005 Results: $347M(3) $418M(3) $196M
2006 Range: $250M - $270M(2) $500M - $550M(2) $185M - $205M(2)
4

Operations
PSE&G consistently demonstrates top reliability performance
Significant improvement in nuclear operations
Regulatory
PSE&G settlement demonstrates return to constructive environment
Environmental – nearing NJ coal solution
Energy Markets
Power benefiting from higher prices and lower risk through forward hedges
Utility customers insulated through staggered BGS
Financial
Strong earnings growth in 2007 and 2008
Improving credit measures
Reduced international exposure
As a standalone company, we have made steady
progress across a variety of areas.
Our objective is to build on these results to make
a strong company even stronger.
5
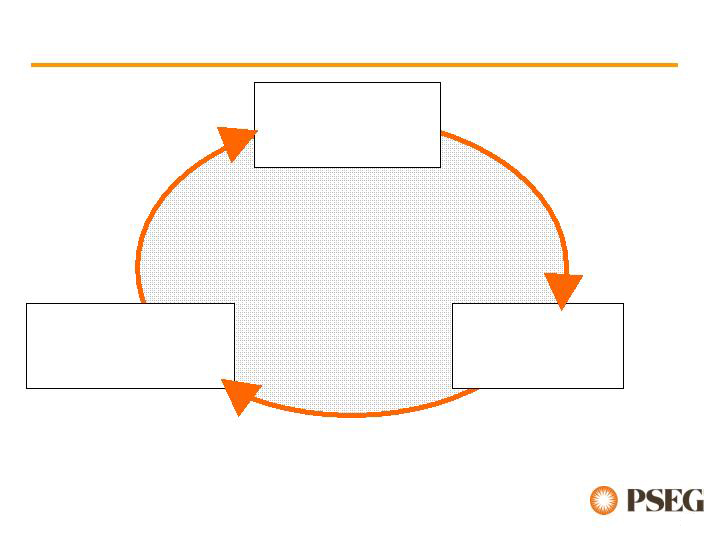
Financial
Strength
We will focus on the basics of operational
excellence...
…to produce financial strength that will be
deployed through disciplined investment.
Operational
Excellence
Disciplined
Investment
6

Solidify improvements in nuclear and fossil operations
Extended Nuclear Operations Services Agreement
Considering long term alternatives for Nuclear Operations
Implement fair and timely rate relief
Awaiting final BPU approval of electric distribution financial
review and gas distribution rate case
Targeted Restaffing
Preserve cost savings
Selectively rethink the organization
Recruit new and diverse talent
In the near-term, sustaining operational excellence
requires addressing top priorities…
…which will serve as the basis for continually
increasing our financial strength.
7
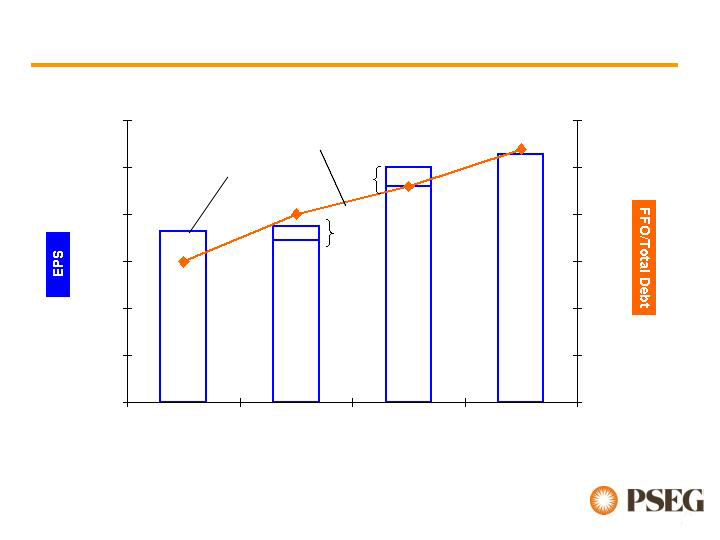
Strong earnings and cash flows will be used to
further delever the balance sheet.
Improving our credit profile will enable us to
maximize growth opportunities.
$0.00
$1.00
$2.00
$3.00
$4.00
$5.00
$6.00
2005 Actual
2006 Guidance
2007 Guidance
2008 Est.
0%
5%
10%
15%
20%
25%
30%
Excess
of 10%
Growth
FFO/
Total Debt
EPS
*
*
* Guidance range.
8

…and decide how to grow the generation and
delivery businesses.
From a position of financial strength, we will make
disciplined investments…
Near-term:
Capitalize on opportunities for rate base growth
Optimize our existing generation portfolio
Environmental improvements at NJ coal stations
Take a hard look at the pace of monetizing international assets
Longer-term:
Flexibility to pursue growth in core businesses and regions
Leverage strength in attractive markets
Consider a range of strategic alternatives
9

By positioning ourselves as industry thought
leaders…
Environmental leadership
Engage in policy debate
Pledged support to develop Energy Master Plan in New Jersey
Workforce development
Partner with higher education institutions
Recruit new and diverse talent
Technology adapters
Evaluate use of technology to improve customer service and work
management systems
Capture opportunities for revenue growth and cost savings
…we can create shareholder value over the
long-term.
10

PSE&G
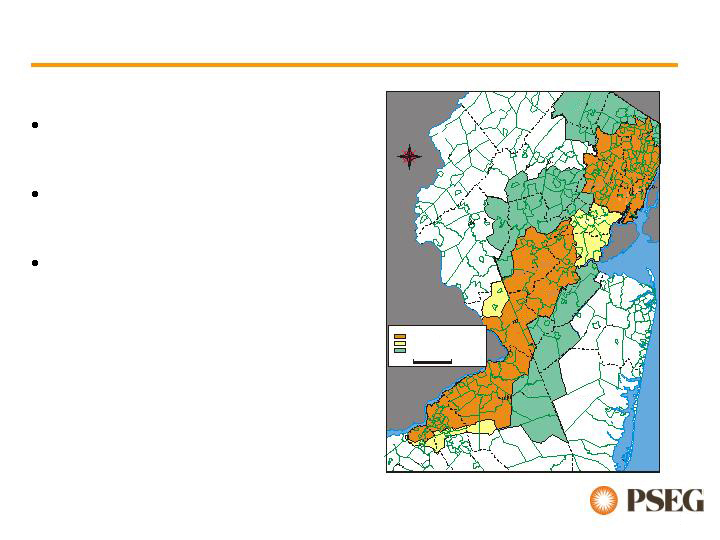
PSE&G Overview
0
1 2 3 4 5 6 7 8 9
10 ml
Sussex Co.
Passaic Co.
Warren Co.
Bergen Co.
Morris Co.
Essex Co.
Hudson Co.
Hunterdon Co.
Union Co.
STATEN
ISLAND
Somerset Co.
Middlesex Co.
Mercer Co.
Monmouth Co.
Burlington Co.
Ocean Co.
Gloucester Co.
Camden Co.
COMBINED ELECTRIC & GAS TERRITORIES
ELECTRIC TERRITORY
GAS TERRITORY
KEY:
N
E
W
S
2.1 M electric customers
1.7 M gas customers
2,600 sq miles in service
territory
12
PSE&G is recognized as a top performing utility…
…providing a foundation for satisfied customers
and a constructive regulatory environment
80
75
70
65
60
Worse
Better
0.80
0.75
0.70
0.65
0.60
Worse
Better
96
97
98
99
100
Worse
Better
CAIDI (Duration of Outages) - Minutes
SAIFI (Frequency of Outages) - % of Customers
Gas Leak Response (Less than 1 hour) - % Response
PSE&G
PSE&G
Benchmark
1st Quartile
Benchmark
1st Quartile
PSE&G
Benchmark
1st Quartile
13

Fair outcomes on both cases will help ensure…
Settlement agreement with BPU staff, Public Advocate, and other parties
Gas Base Rate case provides for $79M of gas margin
$40M increase in rates
$39M decrease in non-cash expenses
Electric Distribution financial review provides $47M of additional revenues
Base rates remain effective until November 2009
New Jersey regulatory climate providing a fair return to investors
Opportunity to earn a ROE of 10%
…our continued ability to provide safe, reliable
service to customers and fair returns to shareholders.
14

Looking forward PSE&G…
Continues to invest in its assets for the future
Distribution System Reinforcements
Transmission Investments
Customer Service
Is committed to meeting customer needs and
expectations
Maintains constructive regulatory relations regarding
traditional utility matters
15

PSEG Power
Tom O’Flynn
PSEG Chief Financial Officer

PSEG Power Overview
Diverse asset mix mitigates risk and provides strong
returns
15,000 MW of nuclear, coal, gas, oil and hydro facilities
Low-cost portfolio
Strong cash generator
Regional focus with demonstrated BGS success
Assets favorably located
Many units east of PJM constraint
Southern NEPOOL/Connecticut constraint
Near customers/load centers
Integrated generation and portfolio management
optimizes asset-based revenues
17
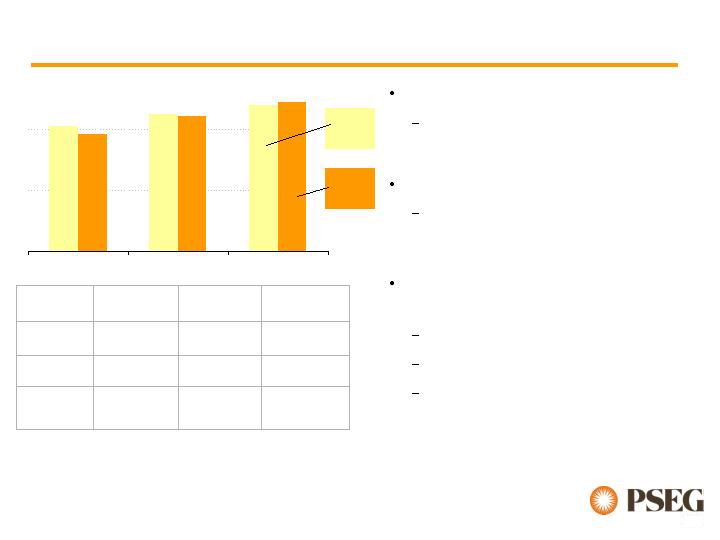
Capacity Factors
82%
90%
96%
77%
89%
98%
2004
2005
2006 YTD
*Uprate of 127MW scheduled for Fall 2007
Strong operational performance
Capacity factors: YTD ~96%
Summer ~100%
Outage management
Site records achieved, including most
recent 21 day refueling outage at
Salem 2
Continuing the Nuclear Operating
Services Agreement for two years
Moving into a transition phase
Option to extend for additional year
Reviewing a number of long-term
alternatives
Exelon
Operated
PSEG
Operated
(NOSA)
PSEG
Operated
(NOSA)
Operations
Jointly Owned
Jointly Owned
PSEG Owned
Ownership
1,112MW
1,323MW
1,059MW*
PSEG MW
Owned
Peach Bottom
2 & 3
Salem
1 & 2
Hope Creek*
Total
Fleet
Strong results under the Nuclear Operating Services
Agreement with Exelon continue…
…while we consider longer-term alternatives.
NJ
Fleet
18
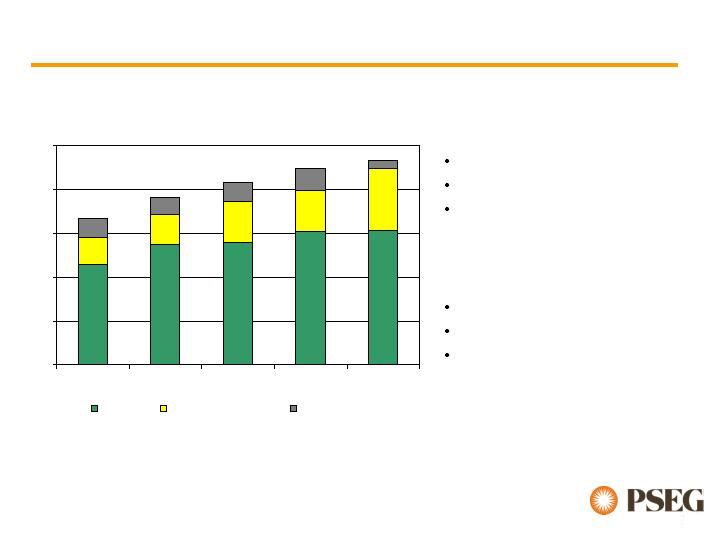
Strong Fossil Operations round out a diverse portfolio…
0
5,000
10,000
15,000
20,000
25,000
2002
2003
2004
2005
2006 Est.
Coal
Combined Cycle
Peaking & Other
Total Fossil Output (Gwh)
A Diverse 11,000 MW Fleet
2,400 MW coal
4,300 MW combined cycle
4,500 MW peaking and other
Strong Performance
Continued growth in output
Improved fleet performance
Constructive progress on an
environmental resolution
regarding Hudson
…in which over 80% of fleet output is from low
cost coal and nuclear facilities
19
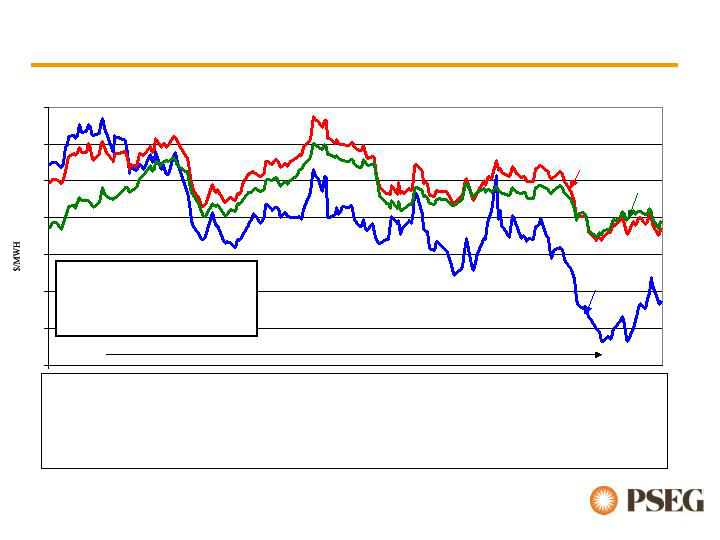
Calendar Forward Prices - PJM West RTC
40
45
50
55
60
65
70
75
Strong electric prices support growth in margins…
…as Power secures a stable revenue stream
through a strategy of forward hedging
Average PJM West RTC Price
2005 = $60/mwh
2004 = $42/mwh
2003 = $38/mwh
2006
2008
2007
Nov ‘05
Nov ‘06
10-40%
65-80%
85-95%
>95%
Percent of coal and nuclear energy output hedged
$0.65-$0.95
$0.20-$0.35
$0.10-$0.15
Est’d impact of $10/mwh PJM West RTC price change*
* - Assuming normal market dynamics
2009
2008
2007
2006
20
Strengthening of capacity market design…
New England
Forward Capacity Market (FCM)
scheduled to begin 12/1/06
Transition period prices have been
established
12/1/06 – 5/31/08 $36.60/kw-yr
6/1/08 – 5/31/09 $45.00/kw-yr
6/1/09 – 5/31/10 $49.20/kw-yr
First auction scheduled in 2008 for
2010 delivery
PJM
FERC Order 4/20/06
Locational pricing
Settlement filed with FERC 9/29/06
Anticipated implementation 6/1/07
PJM simulations show pricing from
$20/kw-yr to mid $30’s/kw-yr
…provides appropriate market signals, and enhances
margin for Power’s 15,000MW fleet.
Total Generating Capacity
PSEG Power
PJM
NY
NE
21
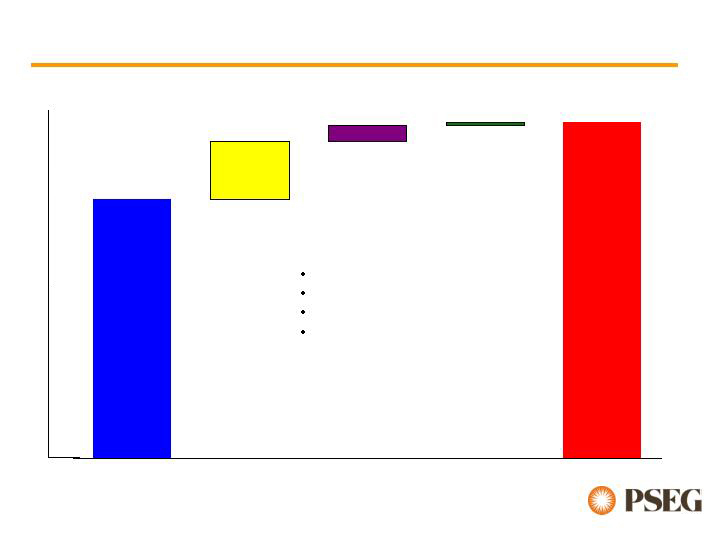
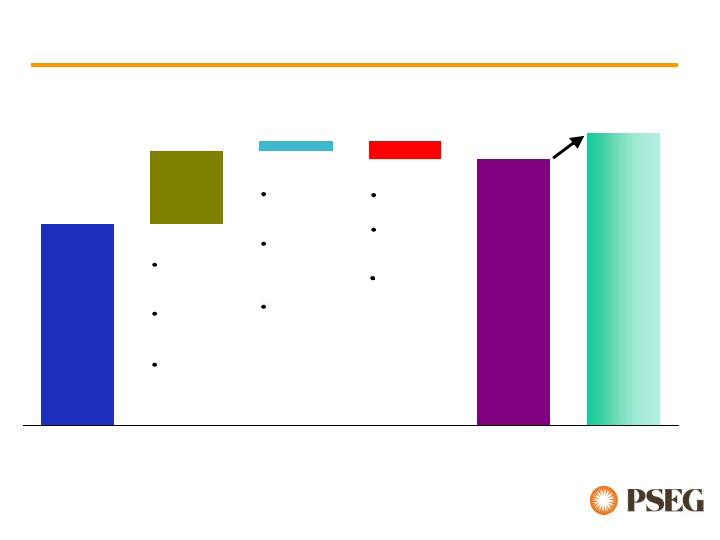
The year over year improvements…
Energy
Capacity
Other
…drive growth in PSEG’s 2007 earnings
guidance.
2007E
Gross Margin
2006E
Gross
Margin
Key Drivers
BGS Pricing
UI Recontracting
Other Recontracting
Capacity Markets
$400M - $500M
$100M - $150M
$2.5B-
$2.0B-
$1.5B-
$1.0B-
$0.5B-
$0M - $50M
22

PSEG Energy Holdings
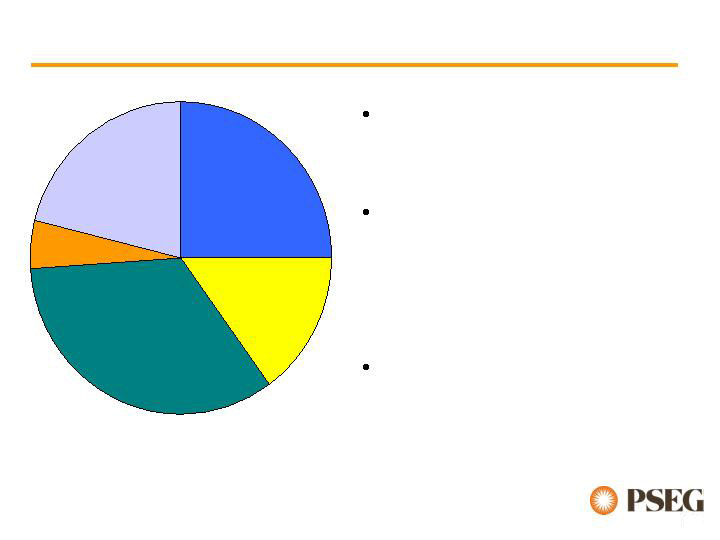
Energy Holdings Overview
PSEG
Resources
Latin American
Distribution
Texas Merchant
Generation
(2,000 MW)
International
Generation
Other fully contracted
US Generation
Projected 2007 Earnings
Contribution
Global’s risk profile
substantially improved
Vast majority of earnings
from U.S. generation and
Latin American
distribution
Strong earnings
contribution from Texas
24
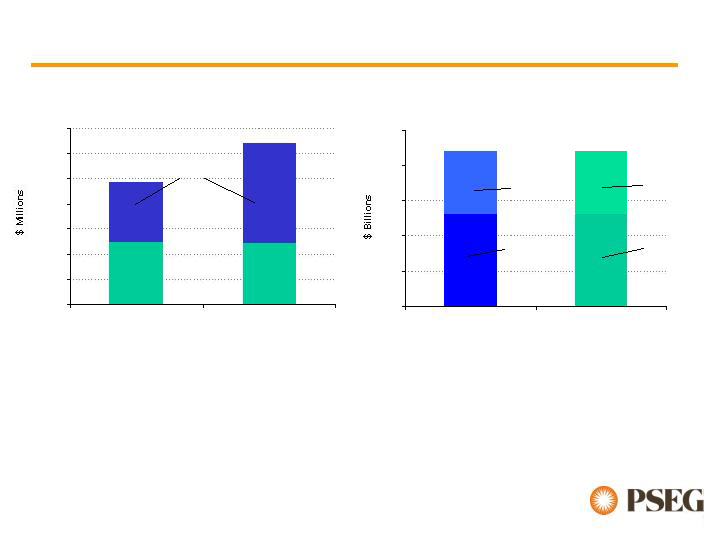
Holdings has provided meaningful earnings and
cash flow…
* For investments accounted for under the equity method of accounting, includes Global’s share of net earnings, including
Interest Expense and Income Tax Expense. Excludes loss on sale of RGE of $263M in 2006 and Global G&A – Unallocated.
…which has supported debt reduction and return
of capital to PSEG
EBIT* For the Nine Months Ended September
$0
$50
$100
$150
$200
$250
$300
$350
2005
2006
North
America
Sources & Uses of Cash from 2004 - 2006 (YTD)
$0.0
$0.5
$1.0
$1.5
$2.0
$2.5
Sources
Uses
Asset
Sales
Cash Ops/
Cash on
Hand
Reduced
Debt
Return
Capital/
Dividends
Global providing meaningful
domestic earnings
Significant decapitalization
totaling $2.2B from 2004 -
2006 (YTD)
25

Looking Forward Energy Holdings…
Optimize Texas assets
Take a hard look at the pace of monetizing international
assets
Maintain financial and operational stability of existing
assets
26

PSEG
PSEG 2007 Earnings Outlook & Drivers
2006 Guidance
Power
PSE&G
Holdings
2007 Guidance
2008
$3.45 - $3.75
$4.60 - $5.00
Excess
of 10%
Growth
Forward
Hedging
Re-contracting
- PJM/NE
Capacity
Market Design
Gas Rate
Case
Electric
Financial
Review
Weather
Texas
2006 RGE
Sale
New
Accounting
Standard
28
Public Service Enterprise Group
29