Exhibit 99
| | | | |
 | | Investor News | | NYSE:PEG |
For further information, contact:
| | |
• Kathleen A. Lally, Vice President – Investor Relations | | Phone: 973-430-6565 |
• Greg McLaughlin, Sr. Investor Relations Analyst | | Phone: 973-430-6568 |
• Yaeni Kim, Sr. Investor Relations Analyst | | Phone: 973-430-6596 |
PSEG ANNOUNCES 2010 FIRST QUARTER RESULTS
$0.97 PER SHARE FROM NET INCOME
$0.84 PER SHARE OF OPERATING EARNINGS
Company Maintains 2010 Operating Earnings Guidance of $3.00-$3.25 Per Share
(May 5, 2010) – Public Service Enterprise Group (PSEG) reported today First Quarter 2010 Net Income and Income from Continuing Operations of $491 million or $0.97 per share as compared to $444 million or $0.88 per share for the First Quarter of 2009. Operating Earnings for the first quarter of 2010 were $425 million or $0.84 per share compared to the First Quarter of 2009 Operating Earnings of $482 million or $0.95 per share.
PSEG believes that the non-GAAP financial measure of “Operating Earnings” provides a consistent and comparable measure of performance of its businesses to help shareholders understand performance trends. Operating Earnings exclude the impact of returns/(losses) associated with NDT and MTM accounting. The table below provides a reconciliation of PSEG’s Net Income to Operating Earnings (a non-GAAP measure) for the first quarter. See Attachment 10 for a complete list of items excluded from Income from Continuing Operations in the determination of Operating Earnings.
PSEG CONSOLIDATED EARNINGS (unaudited)
First Quarter Comparative Results
2010 and 2009
| | | | | | | | | | | | | | |
| | | Income ($millions) | | | Diluted Earnings
Per Share | |
| | | 2010 | | 2009 | | | 2010 | | 2009 | |
Net Income/Income from Continuing Ops | | $ | 491 | | $ | 444 | | | $ | 0.97 | | $ | 0.88 | |
Less: Excluded Items | | | 66 | | | (38 | ) | | | 0.13 | | | (0.07 | ) |
Operating Earnings (Non-GAAP) | | $ | 425 | | $ | 482 | | | $ | 0.84 | | $ | 0.95 | |
| | | | | Avg. Shares | | | 507M | | 507M | |
“The economy has shown signs of stabilizing, but pricing in our markets remains difficult” said Ralph Izzo, chairman, president and chief executive officer of PSEG. He went on to say, “our results were also hurt by a devastating rain and wind storm which struck New Jersey in March. However, the exemplary performance of our employees—along with aid from other utilities—resulted in customers returning to service within a week. Our ongoing focus on operational excellence, and our commitment to maintaining financial strength should support the long-term needs of our customers and shareholders in an evolving energy market. This focus continues to support our operating earnings guidance for 2010 of $3.00-$3.25 per share.”
Operating Earnings Review and Outlook by Operating Subsidiary
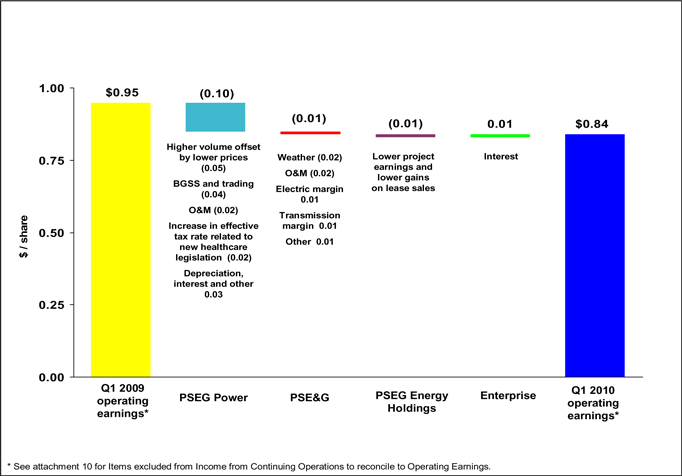
See Attachment 5 for detail regarding the quarter-over-quarter reconciliations for each of PSEG’s businesses.
PSEG Power
PSEG Power reported operating earnings of $298 million ($0.59 per share) for the first quarter of 2010 compared with operating earnings of $352 million ($0.69 per share) for the first quarter of 2009. PSEG Power’s operating earnings for 2009 have been adjusted to reflect the inclusion of the results for the Texas gas-fired generating assets transferred from PSEG Energy Holdings during the fourth quarter of last year.
PSEG Power’s results in the first quarter of 2010 were affected by weak power prices which more than offset a 7% increase in volume. The reduction in prices reduced Power’s quarter-over-quarter earnings by $0.05 per share. This impact from lower pricing includes the effect of customer migration from BGS, which saw a slight increase over levels experienced in the fourth quarter of 2009. Customer migration away from BGS amounted to $0.01 per share. A decline in gas prices and volumes associated with BGSS and other trading related activity reduced Power’s earnings during the quarter by $0.04 per share. Earnings comparisons were also hurt by an increase in O&M associated with planned major maintenance programs in Texas and New York which reduced earnings by $0.02 per share. A quarter-over-quarter decline in depreciation and financing costs improved Power’s earnings comparisons by $0.03 per share. Results were also affected by a one-time increase in taxes associated with new health care legislation enacted in March 2010 which reduced earnings by $0.02 per share.
The nuclear fleet continued its strong performance. The nuclear generation operated by PSEG Power performed at an average capacity factor of 97.2% during the quarter; including PSEG Power’s 50% interest in the Peach Bottom units, the fleet operated at an average capacity factor during the quarter of 97.3%. Even though weather for the quarter was warmer than normal, a combination of cold weather and higher pricing in the months of January and February supported an increase in generation from the coal-fired fleet which operated at an average capacity factor during the quarter of 57%. The combined cycle fleet benefited from market opportunities, operating at an average capacity factor of 45% during the quarter versus a 35% capacity factor during the year ago quarter.
PSE&G
PSE&G reported operating earnings of $117 million ($0.23 per share) for the first quarter of 2010 compared with operating earnings of $123 million ($0.24 per share) for the first quarter of 2009.
The results for the quarter were affected by several factors. Warmer than normal weather during the quarter in contrast to colder than normal weather experienced in 2009’s first quarter reduced the demand for gas heating, and lowered quarter-over-quarter earnings by $0.02 per share. Heating Degree Days in the quarter were 3.8% below normal and 10.5% below 2009’s first quarter. This decline in demand was partially offset by an increase in transmission revenues which added $0.01 per share. An improvement in demand related margin on electric sales to the commercial sector added $0.01 per share. Weather-normalized electric sales were flat versus year ago levels as a slight
increase in sales to residential customers was offset by a small decline in sales to commercial and industrial customers. The company experienced several storms during the quarter including extreme weather in March, resulting in an increase in operating and maintenance expense of $0.02 per share.
PSE&G continues to await a decision on its request to increase electric ($139.8 million) and gas ($64.4 million) rates for a total increase in revenue of $204 million. The company’s request has been adjusted from its original request for an increase in revenue of $239 million. A decision is anticipated by mid-year.
PSE&G received the New Jersey BPU’s written order in late April approving the Susquehanna-Roseland transmission line. Subject to obtaining certain other necessary approvals, the company plans to begin construction of the line this summer between Hopatcong Borough and Roseland Township.
PSEG Energy Holdings
PSEG Energy Holdings reported operating earnings of $7 million ($0.01 per share) for the first quarter of 2010 versus operating earnings of $11 million ($0.02 per share) during the first quarter of 2009. The results for 2009 have been adjusted to reflect the transfer of the Texas gas-fired generating assets to PSEG Power during the fourth quarter of 2009.
The decline in operating earnings for the quarter reflects lower project earnings and lower gains on lease sales which together reduced quarter over quarter earnings by $0.01 per share.
Financings
PSE&G and PSEG Power completed a number of financings during the quarter which had the net effect of reducing the cost of financing for PSEG Power and extending out the maturity schedule of both companies’ long-term debt.
######
FORWARD-LOOKING STATEMENT
Readers are cautioned that statements contained in this presentation about our and our subsidiaries’ future performance, including future revenues, earnings, strategies, prospects and all other statements that are not purely historical, are forward-looking statements for purposes of the safe harbor provisions under The Private Securities Litigation Reform Act of 1995. Although we believe that our expectations are based on reasonable assumptions, we can give no assurance they will be achieved. The results or events predicted in these statements may differ materially from actual results or events. Factors which could cause results or events to differ from current expectations include, but are not limited to:
| | • | | Adverse changes in energy industry, law, policies and regulation, including market structures and rules, and reliability standards. |
| | • | | Any inability of our transmission and distribution businesses to obtain adequate and timely rate relief and regulatory approvals from federal and state regulators. |
| | • | | Changes in federal and state environmental regulations that could increase our costs or limit operations of our generating units. |
| | • | | Changes in nuclear regulation and/or developments in the nuclear power industry generally, that could limit operations of our nuclear generating units. |
| | • | | Actions or activities at one of our nuclear units located on a multi-unit site that might adversely affect our ability to continue to operate that unit or other units at the same site. |
| | • | | Any inability to balance our energy obligations, available supply and trading risks. |
| | • | | Any deterioration in our credit quality. |
| | • | | Availability of capital and credit at commercially reasonable terms and our ability to meet cash needs. |
| | • | | Any inability to realize anticipated tax benefits or retain tax credits. |
| | • | | Changes in the cost of or interruption in the supply of fuel and other commodities necessary to the operation of our generating units. |
| | • | | Delays or unforeseen cost escalations in our construction and development activities. |
| | • | | Adverse performance of our decommissioning and defined benefit plan trust fund investments, and changes in discount rates and funding requirements. |
| | • | | Changes in technology and increased customer conservation. |
For further information, please refer to our Annual Report on Form 10-K, including Item 1A. Risk Factors, and subsequent reports on Form 10-Q and Form 8-K filed with the Securities and Exchange Commission. These documents address in further detail our business, industry issues and other factors that could cause actual results to differ materially from those indicated in this presentation. In addition, any forward-looking statements included herein represent our estimates only as of today and should not be relied upon as representing our estimates as of any subsequent date. While we may elect to update forward-looking statements from time to time, we specifically disclaim any obligation to do so, even if our internal estimates change, unless otherwise required by applicable securities laws.
Attachment 1
PUBLIC SERVICE ENTERPRISE GROUP INCORPORATED
Operating Earnings and Per Share Results by Subsidiary
(Unaudited)
| | | | | | | |
| | | For the Three Months
Ended March 31, | |
| | | 2010 | | 2009 | |
| Earnings Results ($ Millions) | | | | | | | |
PSEG Power | | $ | 298 | | $ | 352 | |
PSE&G | | | 117 | | | 123 | |
PSEG Energy Holdings | | | 7 | | | 11 | |
PSEG | | | 3 | | | (4 | ) |
| | | | | | | |
Operating Earnings | | $ | 425 | | $ | 482 | |
| | | | | | | |
Reconciling Items(a) | | | 66 | | | (38 | ) |
| | | | | | | |
Net Income | | $ | 491 | | $ | 444 | |
| | | | | | | |
Fully Diluted Average Shares Outstanding (in Millions) | | | 507 | | | 507 | |
| | | | | | | |
| Per Share Results (Diluted) | | | | | | | |
PSEG Power | | $ | 0.59 | | $ | 0.69 | |
PSE&G | | | 0.23 | | | 0.24 | |
PSEG Energy Holdings | | | 0.01 | | | 0.02 | |
PSEG | | | 0.01 | | | — | |
| | | | | | | |
Operating Earnings | | $ | 0.84 | | $ | 0.95 | |
| | | | | | | |
Reconciling Items(a) | | | 0.13 | | | (0.07 | ) |
| | | | | | | |
Net Income | | $ | 0.97 | | $ | 0.88 | |
| | | | | | | |
| (a) | See attachment 10 for details of items excluded from Continuing Operations to compute Operating Earnings. Income from Continuing Operations for the three months ended March 31, 2010 and 2009 is equal to Net Income. |
Note 1:
Income from Continuing Operations includes preferred stock dividends relating to PSE&G of $1 million for the three months ended March 31, 2010 and 2009.
Attachment 2
PUBLIC SERVICE ENTERPRISE GROUP INCORPORATED
Consolidating Statements of Operations
(Unaudited, $ Millions)
| | | | | | | | | | | | | | | | | | | | |
| | | For the Three Months Ended March 31, 2010 | |
| | | PSEG | | | OTHER (a) | | | PSEG
POWER | | | PSE&G | | | PSEG ENERGY
HOLDINGS | |
OPERATING REVENUES | | $ | 3,680 | | | $ | (1,103 | ) | | $ | 2,303 | | | $ | 2,444 | | | $ | 36 | |
OPERATING EXPENSES | | | | | | | | | | | | | | | | | | | | |
Energy Costs | | | 1,768 | | | | (1,103 | ) | | | 1,331 | | | | 1,540 | | | | — | |
Operation and Maintenance | | | 704 | | | | (8 | ) | | | 285 | | | | 414 | | | | 13 | |
Depreciation and Amortization | | | 232 | | | | 4 | | | | 48 | | | | 177 | | | | 3 | |
Taxes Other Than Income Taxes | | | 42 | | | | — | | | | — | | | | 42 | | | | — | |
| | | | | | | | | | | | | | | | | | | | |
Total Operating Expenses | | | 2,746 | | | | (1,107 | ) | | | 1,664 | | | | 2,173 | | | | 16 | |
| | | | | | | | | | | | | | | | | | | | |
OPERATING INCOME | | | 934 | | | | 4 | | | | 639 | | | | 271 | | | | 20 | |
Income from & Impairment on Equity Method Investments | | | 3 | | | | — | | | | — | | | | — | | | | 3 | |
Other Income and Deductions | | | 27 | | | | (3 | ) | | | 25 | | | | 4 | | | | 1 | |
Other Than Temporary Impairments | | | (1 | ) | | | — | | | | (1 | ) | | | — | | | | — | |
Interest Expense | | | (116 | ) | | | 3 | | | | (40 | ) | | | (77 | ) | | | (2 | ) |
Preferred Stock Dividends | | | — | | | | 1 | | | | — | | | | (1 | ) | | | — | |
| | | | | | | | | | | | | | | | | | | | |
INCOME FROM CONTINUING OPERATIONS BEFORE INCOME TAXES(b) | | | 847 | | | | 5 | | | | 623 | | | | 197 | | | | 22 | |
Income Tax Expense | | | (356 | ) | | | (2 | ) | | | (259 | ) | | | (80 | ) | | | (15 | ) |
| | | | | | | | | | | | | | | | | | | | |
NET INCOME | | $ | 491 | | | $ | 3 | | | $ | 364 | | | $ | 117 | | | $ | 7 | |
| | | | | | | | | | | | | | | | | | | | |
Reconciling Items Excluded from Continuing Operations(C): | | | 66 | | | | — | | | | 66 | | | | — | | | | — | |
| | | | | | | | | | | | | | | | | | | | |
OPERATING EARNINGS | | $ | 425 | | | $ | 3 | | | $ | 298 | | | $ | 117 | | | $ | 7 | |
| | | | | | | | | | | | | | | | | | | | |
| |
| | | For the Three Months Ended March 31, 2009 | |
| | | PSEG | | | OTHER (a) | | | PSEG
POWER | | | PSE&G | | | PSEG ENERGY
HOLDINGS | |
OPERATING REVENUES | | $ | 3,920 | | | $ | (1,323 | ) | | $ | 2,464 | | | $ | 2,735 | | | $ | 44 | |
OPERATING EXPENSES | | | | | | | | | | | | | | | | | | | | |
Energy Costs | | | 2,068 | | | | (1,322 | ) | | | 1,531 | | | | 1,859 | | | | — | |
Operation and Maintenance | | | 674 | | | | (8 | ) | | | 274 | | | | 395 | | | | 13 | |
Depreciation and Amortization | | | 207 | | | | 4 | | | | 51 | | | | 149 | | | | 3 | |
Taxes Other Than Income Taxes | | | 44 | | | | — | | | | — | | | | 44 | | | | — | |
| | | | | | | | | | | | | | | | | | | | |
Total Operating Expenses | | | 2,993 | | | | (1,326 | ) | | | 1,856 | | | | 2,447 | | | | 16 | |
| | | | | | | | | | | | | | | | | | | | |
OPERATING INCOME | | | 927 | | | | 3 | | | | 608 | | | | 288 | | | | 28 | |
Income from & Impairment on Equity Method Investments | | | 10 | | | | — | | | | — | | | | — | | | | 10 | |
Other Income and Deductions | | | 17 | | | | (6 | ) | | | 20 | | | | — | | | | 3 | |
Other Than Temporary Impairments | | | (61 | ) | | | (1 | ) | | | (60 | ) | | | — | | | | — | |
Interest Expense | | | (145 | ) | | | (4 | ) | | | (50 | ) | | | (79 | ) | | | (12 | ) |
Preferred Stock Dividends | | | — | | | | 1 | | | | — | | | | (1 | ) | | | — | |
| | | | | | | | | | | | | | | | | | | | |
INCOME (LOSS) FROM CONTINUING OPERATIONS BEFORE INCOME TAXES(b) | | | 748 | | | | (7 | ) | | | 518 | | | | 208 | | | | 29 | |
Income Tax (Expense) Benefit | | | (304 | ) | | | 3 | | | | (204 | ) | | | (85 | ) | | | (18 | ) |
| | | | | | | | | | | | | | | | | | | | |
NET INCOME (LOSS) | | $ | 444 | | | $ | (4 | ) | | $ | 314 | | | $ | 123 | | | $ | 11 | |
| | | | | | | | | | | | | | | | | | | | |
Reconciling Items Excluded from Continuing Operations(C): | | | (38 | ) | | | — | | | | (38 | ) | | | — | | | | — | |
| | | | | | | | | | | | | | | | | | | | |
OPERATING EARNINGS (LOSS) | | $ | 482 | | | $ | (4 | ) | | $ | 352 | | | $ | 123 | | | $ | 11 | |
| | | | | | | | | | | | | | | | | | | | |
| (a) | Primarily includes financing activities and donations at the parent and intercompany eliminations. |
| (b) | Income from Continuing Operations before Income Taxes includes preferred stock dividends relating to PSE&G of $1 million for the three months ended March 31, 2010 and 2009. |
| (c) | See attachment 10 for details of items excluded from Continuing Operations to compute Operating Earnings. Income from Continuing Operations for the three months ended March 31, 2010 and 2009 is equal to Net Income. |
Attachment 3
PUBLIC SERVICE ENTERPRISE GROUP INCORPORATED
Capitalization Schedule
(Unaudited, $ Millions)
| | | | | | | | |
| | | March 31,
2010 | | | December 31,
2009 | |
DEBT | | | | | | | | |
Commercial Paper and Loans | | $ | — | | | $ | 530 | |
Long-Term Debt | | | 6,834 | | | | 6,781 | |
Securitization Debt | | | 1,298 | | | | 1,343 | |
Project Level, Non-Recourse Debt | | | 41 | | | | 42 | |
| | | | | | | | |
Total Debt | | | 8,173 | | | | 8,696 | |
SUBSIDIARY’S PREFERRED STOCK WITHOUT MANDATORY REDEMPTION | | | — | | | | 80 | |
| | | | | | | | |
STOCKHOLDERS’ EQUITY | | | | | | | | |
Common Stock | | | 4,793 | | | | 4,788 | |
Treasury Stock | | | (590 | ) | | | (588 | ) |
Retained Earnings | | | 5,022 | | | | 4,704 | |
Accumulated Other Comprehensive Loss | | | (24 | ) | | | (116 | ) |
| | | | | | | | |
Total Common Stockholders’ Equity | | | 9,201 | | | | 8,788 | |
Noncontrolling Interests - Equity Investments | | | 9 | | | | 10 | |
| | | | | | | | |
Total Equity | | | 9,210 | | | | 8,798 | |
| | | | | | | | |
Total Capitalization | | $ | 17,383 | | | $ | 17,574 | |
| | | | | | | | |
Attachment 4
PUBLIC SERVICE ENTERPRISE GROUP INCORPORATED
CONDENSED CONSOLIDATED STATEMENTS OF CASH FLOWS
(Unaudited, $ Millions)
| | | | | | | | |
| | | For the Three Months
Ended March 31, | |
| | | 2010 | | | 2009 | |
CASH FLOWS FROM OPERATING ACTIVITIES | | | | | | | | |
Net Income | | $ | 491 | | | $ | 444 | |
Adjustments to Reconcile Net Income to Net Cash Flows From Operating Activities | | | 581 | | | | 945 | |
| | | | | | | | |
NET CASH PROVIDED BY OPERATING ACTIVITIES | | | 1,072 | | | | 1,389 | |
| | | | | | | | |
NET CASH USED IN INVESTING ACTIVITIES | | | (318 | ) | | | (165 | ) |
| | | | | | | | |
NET CASH USED IN FINANCING ACTIVITIES | | | (792 | ) | | | (313 | ) |
| | | | | | | | |
Net Increase (Decrease) in Cash and Cash Equivalents | | | (38 | ) | | | 911 | |
Cash and Cash Equivalents at Beginning of Period | | | 350 | | | | 321 | |
| | | | | | | | |
Cash and Cash Equivalents at End of Period | | $ | 312 | | | $ | 1,232 | |
| | | | | | | | |
Attachment 5
PUBLIC SERVICE ENTERPRISE GROUP INCORPORATED
Quarter-over-Quarter EPS Reconciliation
March 31, 2010 vs. March 31, 2009
(Unaudited)
Attachment 6
PSEG POWER LLC
Generation Measures
(Unaudited)
| | | | | | |
| | | GWhr Breakdown | |
| | | Three Months Ended
March 31, | |
| | | 2010 | | | 2009 | |
Nuclear - NJ | | 5,344 | | | 5,488 | |
Nuclear - PA | | 2,437 | | | 2,329 | |
| | | | | | |
Total Nuclear | | 7,781 | | | 7,817 | |
Fossil - Coal - NJ | | 1,148 | | | 776 | |
Fossil - Coal - PA | | 1,431 | | | 1,434 | |
Fossil - Coal - CT | | 361 | | | 493 | |
| | | | | | |
Total Coal | | 2,940 | | | 2,703 | |
Fossil - Oil & Natural Gas - NJ | | 2,671 | | | 1,820 | |
Fossil - Oil & Natural Gas - NY | | 855 | | | 704 | |
Fossil - Oil & Natural Gas - CT | | 4 | | | 97 | |
Fossil - Oil & Natural Gas - TX | | 1,536 | | | 1,596 | |
| | | | | | |
Total Oil & Natural Gas | | 5,066 | | | 4,217 | |
Fossil - Pumped Storage | | (19 | ) | | (24 | ) |
| | | | | | |
| | 15,768 | | | 14,713 | |
| |
| | | % Generation by Fuel Type | |
| | | Three Months Ended
March 31, | |
| | | 2010 | | | 2009 | |
Nuclear - NJ | | 34 | % | | 37 | % |
Nuclear - PA | | 15 | % | | 16 | % |
| | | | | | |
Total Nuclear | | 49 | % | | 53 | % |
Fossil - Coal - NJ | | 7 | % | | 5 | % |
Fossil - Coal - PA | | 9 | % | | 9 | % |
Fossil - Coal - CT | | 3 | % | | 4 | % |
| | | | | | |
Total Coal | | 19 | % | | 18 | % |
Fossil - Oil & Natural Gas - NJ | | 17 | % | | 12 | % |
Fossil - Oil & Natural Gas - NY | | 5 | % | | 5 | % |
Fossil - Oil & Natural Gas - CT | | 0 | % | | 1 | % |
Fossil - Oil & Natural Gas - TX | | 10 | % | | 11 | % |
| | | | | | |
Total Oil & Natural Gas | | 32 | % | | 29 | % |
Fossil - Pumped Storage | | 0 | % | | 0 | % |
| | | | | | |
| | 100 | % | | 100 | % |
Attachment 7
PUBLIC SERVICE ELECTRIC & GAS COMPANY
Retail Sales and Revenues
(Unaudited)
March 31, 2010
Electric Sales and Revenues
| | | | | | |
| | | Three Months
Ended | | Change vs.
2009 | |
Sales (millions kwh) | | | | | | |
Residential | | | 3,167 | | -2.1 | % |
Commercial & Industrial | | | 6,973 | | -1.0 | % |
Street Lighting | | | 103 | | 0.1 | % |
Other | | | 3 | | 0.5 | % |
| | | | | | |
Total | | | 10,246 | | -1.3 | % |
| | | | | | |
Revenue ($ millions) | | | | | | |
Residential | | $ | 537 | | -0.6 | % |
Commercial & Industrial | | | 576 | | -16.3 | % |
Street Lighting | | | 20 | | -0.2 | % |
Other Operating Revenues* | | | 92 | | 37.8 | % |
| | | | | | |
Total | | $ | 1,225 | | -6.8 | % |
| | | | | | |
| | |
| | | Three Months
Ended | | Change vs.
2009 | |
Weather Data | | | | | | |
THI Hours - Actual | | | 0 | | 0.0 | % |
THI Hours - Normal | | | 37 | | | |
| * | Primarily sales of Non-Utility Generator energy to PJM and Transmission related revenues. |
Attachment 8
PUBLIC SERVICE ELECTRIC & GAS COMPANY
Retail Sales and Revenues
(Unaudited)
March 31, 2010
Gas Sold and Transported
| | | | | | |
| | | Three Months
Ended | | Change vs.
2009 | |
Sales (millions therms) | | | | | | |
Residential Sales | | | 644 | | -8.4 | % |
Commercial & Industrial - Firm Sales | | | 243 | | -8.9 | % |
Commercial & Industrial - Interr. & Cogen | | | 36 | | -25.3 | % |
| | | | | | |
Total | | | 923 | | -9.4 | % |
| | | | | | |
Gas Transported - Firm Sales | | | 198 | | 2.4 | % |
Gas Transported - Non-Firm | | | 202 | | 6.9 | % |
Revenue ($ millions) | | | | | | |
Residential Sales | | $ | 533 | | -24.5 | % |
Commercial & Industrial - Firm Sales | | | 181 | | -6.6 | % |
Commercial & Industrial - Interr. & Cogen | | | 23 | | -21.0 | % |
Other Operating Revenues* | | | 37 | | 9.6 | % |
| | | | | | |
Total | | $ | 774 | | -19.5 | % |
| | | | | | |
Gas Transported | | | 443 | | -3.1 | % |
| | |
| | | Three Months
Ended | | Change vs.
2009 | |
Weather Data | | | | | | |
Degree Days - Actual | | | 1,977 | | -10.5 | % |
Degree Days - Normal | | | 2,056 | | | |
| * | Primarily Appliance Service. |
Attachment 9
PUBLIC SERVICE ENTERPRISE GROUP INCORPORATED
Statistical Measures
(Unaudited)
| | | | | | | | |
| | | For the Three Months
Ended March 31 | |
| | | 2010 | | | 2009 | |
Weighted Average Common Shares Outstanding (000’s) | | | | | | | | |
Basic | | | 505,950 | | | | 505,986 | |
Diluted | | | 507,147 | | | | 506,548 | |
Stock Price at End of Period | | $ | 29.52 | | | $ | 29.47 | |
Dividends Paid per Share of Common Stock | | $ | 0.3425 | | | $ | 0.3325 | |
Dividend Payout Ratio* | | | 44.7 | % | | | 41.7 | % |
Dividend Yield | | | 4.5 | % | | | 4.4 | % |
Price/Earnings Ratio* | | | 9.8 | | | | 9.5 | |
Rate of Return on Average Common Equity* | | | 17.6 | % | | | 21.1 | % |
Book Value per Common Share | | $ | 18.19 | | | $ | 16.20 | |
Market Price as a Percent of Book Value | | | 162 | % | | | 182 | % |
Total Shareholder Return | | | -10.2 | % | | | 2.4 | % |
| * | Calculation based on Operating Earnings for the 12 month period ended |
Attachment 10
PUBLIC SERVICE ENTERPRISE GROUP INCORPORATED
Reconciling Items Excluded from Continuing Operations(a) to Compute Operating Earnings
(Unaudited)
| | | | | | | |
| | | For the Three Months
Ended March 31, | |
Pro-forma Adjustments, net of tax | | 2010 | | 2009 | |
| Earnings Impact ($ Millions) | | | | | | | |
Gain (Loss) on Nuclear Decommissioning Trust (NDT) Fund Related Activity | | $ | 10 | | $ | (23 | ) |
Gain (Loss) on Mark-to-Market (MTM) | | | 56 | | | (15 | ) |
| | | | | | | |
Total Pro-forma adjustments | | $ | 66 | | $ | (38 | ) |
| | | | | | | |
Fully Diluted Average Shares Outstanding (in Millions) | | | 507 | | | 507 | |
| | | | | | | |
| Per Share Impact (Diluted) | | | | | | | |
Gain (Loss) on NDT Fund Related Activity | | $ | 0.02 | | $ | (0.04 | ) |
Gain (Loss) on MTM | | | 0.11 | | | (0.03 | ) |
| | | | | | | |
Total Pro-forma adjustments | | $ | 0.13 | | $ | (0.07 | ) |
| | | | | | | |
| (a) | Income from Continuing Operations for the three months ended March 31, 2010 and 2009 is equal to Net Income. |