 Public Service Enterprise Group PSEG Earnings Conference Call 2 nd Quarter 2010 July 30, 2010 Exhibit 99.1 |
1 Forward-Looking Statement Readers are cautioned that statements contained in this presentation about our and our subsidiaries' future performance, including future revenues, earnings, strategies, prospects, consequences and all other statements that are not purely historical, are forward-looking statements for purposes of the safe harbor provisions under The Private Securities Litigation Reform Act of 1995. When used herein, the words “anticipate”, “intend”, “estimate”, “believe”, “expect”, “plan”, “should”, “hypothetical”, “potential”, “forecast”, “project”, variations of such words and similar expressions are intended to identify forward-looking statements. Although we believe that our expectations are based on reasonable assumptions, they are subject to risks and uncertainties and we can give no assurance they will be achieved. The results or developments projected or predicted in these statements may differ materially from what may actually occur. Factors which could cause results or events to differ from current expectations include, but are not limited to: • Adverse changes in energy industry law, policies and regulation, including market structures, transmission planning and rules, and reliability standards. • Any inability of our transmission and distribution businesses to obtain adequate and timely rate relief and regulatory approvals from federal and state regulators. • Changes in federal and state environmental regulations that could increase our costs or limit operations of our generating units. • Changes in nuclear regulation and/or developments in the nuclear power industry generally that could limit operations of our nuclear generating units. • Actions or activities at one of our nuclear units located on a multi-unit site that might adversely affect our ability to continue to operate that unit or other units located at the same site. • Any inability to balance our energy obligations, available supply and trading risks. • Any deterioration in our credit quality. • Availability of capital and credit at commercially reasonable terms and conditions and our ability to meet cash needs. • Any inability to realize anticipated tax benefits or retain tax credits. • Changes in the cost of, or interruption in the supply of, fuel and other commodities necessary to the operation of our generating units. • Delays in receipt of necessary permits and approvals for our construction and development activities. • Delays or unforeseen cost escalations in our construction and development activities. • Increase in competition in energy markets in which we compete. • Adverse performance of our decommissioning and defined benefit plan trust fund investments and changes in discount rates and funding requirements. • Changes in technology and customer usage patterns. For further information, please refer to our Annual Report on Form 10-K, including Item 1A. Risk Factors, and subsequent reports on Form 10-Q and Form 8-K filed with the Securities and Exchange Commission. These documents address in further detail our business, industry issues and other factors that could cause actual results to differ materially from those indicated in this presentation. In addition, any forward-looking statements included herein represent our estimates only as of today and should not be relied upon as representing our estimates as of any subsequent date. While we may elect to update forward-looking statements from time to time, we specifically disclaim any obligation to do so, even if our internal estimates change, unless otherwise required by applicable securities laws. |
2 GAAP Disclaimer PSEG presents Operating Earnings in addition to its Net Income reported in accordance with accounting principles generally accepted in the United States (GAAP). Operating Earnings is a non-GAAP financial measure that differs from Net Income because it excludes gains or losses associated with Nuclear Decommissioning Trust (NDT), Mark-to-Market (MTM) accounting, and other material one-time items. PSEG presents Operating Earnings because management believes that it is appropriate for investors to consider results excluding these items in addition to the results reported in accordance with GAAP. PSEG believes that the non-GAAP financial measure of Operating Earnings provides a consistent and comparable measure of performance of its businesses to help shareholders understand performance trends. This information is not intended to be viewed as an alternative to GAAP information. The last two slides in this presentation include a list of items excluded from Income from Continuing Operations to reconcile to Operating Earnings, with a reference to that slide included on each of the slides where the non-GAAP information appears. |
PSEG 2010 Q2 Review Ralph Izzo Chairman, President and Chief Executive Officer * * * * * * * * * * |
 4 Q2 2010 Earnings Summary $ 318 $ 331 Operating Earnings $ 311 $ 224 Income from Continuing Operations / Net Income (7) (107) Reconciling Items, Net of Tax $ 0.63 $ 0.65 EPS from Operating Earnings* 2009 2010 $ millions (except EPS) Quarter ended June 30 * See page 33 for Items excluded from Income from Continuing Operations to reconcile to Operating Earnings. |
 5 Q2 2010 Earnings Summary $ 800 $ 756 Operating Earnings $ 755 $ 715 Income from Continuing Operations / Net Income (45) (41) Reconciling Items, Net of Tax $ 1.58 $ 1.49 EPS from Operating Earnings* 2009 2010 $ millions (except EPS) Six months ended June 30 * See page 34 for Items excluded from Income from Continuing Operations to reconcile to Operating Earnings. |
 6 PSEG – Q2 2010 Focused on operational excellence PSE&G focused on meeting reliability Power’s generation volumes increased 20% quarter-over-quarter Foundation laid for the future BPU approved settlement of PSE&G electric and gas rate case PSE&G aligning capital and O&M with revenue to ensure capability of earning authorized return Investments for the future Susquehanna-Roseland in-service date delayed by 2 years PSE&G assessing reliability enhancing transmission investments Meeting Environmental Standards: Completion of BET construction on schedule for year-end 2010 Financing position Debt financings lowered cost and extended maturities Lease termination reduced potential tax liability to $550 million $415 million contributed to pension trust Focused on building a financially strong, environmentally friendly energy business |
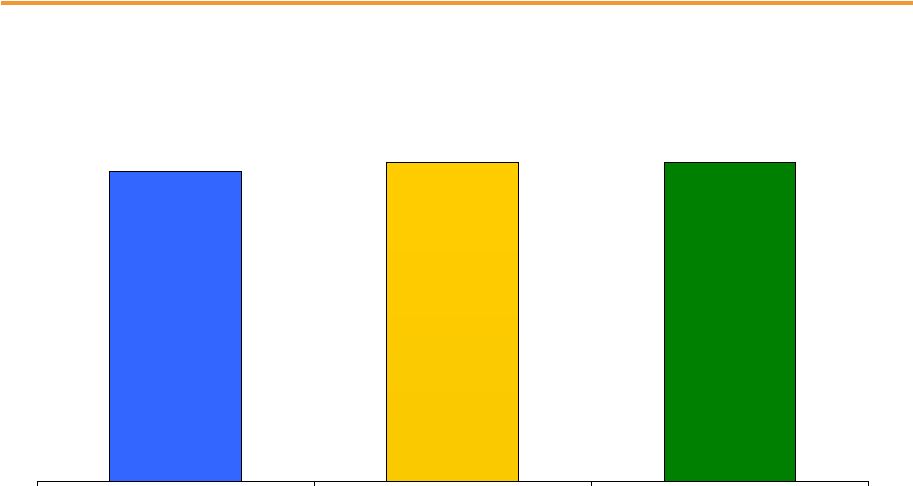 7 2008 Operating Earnings* 2009 Operating Earnings* 2010 Guidance $3.00 - $3.25 PSEG – Maintaining 2010 Guidance $3.03 * See page 35 for Items excluded from Income from Continuing Operations to reconcile to Operating Earnings. $3.12 |
PSEG 2010 Q2 Operating Company Review Caroline Dorsa Executive Vice President and Chief Financial Officer * * * * * * * * * * |
 9 Q2 Operating Earnings by Subsidiary $ 318 1 21 43 $ 253 2009 $ 331 5 12 75 $ 239 2010 Operating Earnings Earnings per Share -- 0.01 Enterprise $ 0.63 $ 0.65 Operating Earnings* 0.04 0.02 PSEG Energy Holdings 0.09 0.15 PSE&G $ 0.50 $ 0.47 PSEG Power 2009 2010 $ millions (except EPS) Quarter ended June 30 * See page 33 for Items excluded from Income from Continuing Operations to reconcile to Operating Earnings. |
 10 Q2 Operating Earnings by Subsidiary $ 800 (3) 31 166 $606 2009 $ 756 8 19 192 $ 537 2010 Operating Earnings Earnings per Share (0.01) 0.02 Enterprise $ 1.58 $ 1.49 Operating Earnings* 0.06 0.03 PSEG Energy Holdings 0.33 0.38 PSE&G $ 1.20 $ 1.06 PSEG Power 2009 2010 $ millions (except EPS) Six months ended June 30 •See page 34 for Items excluded from Income from Continuing Operations to reconcile to Operating Earnings. |
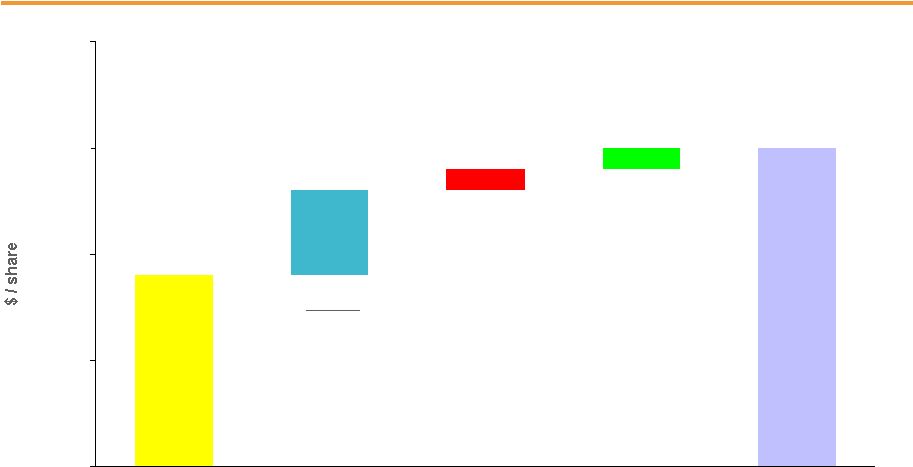
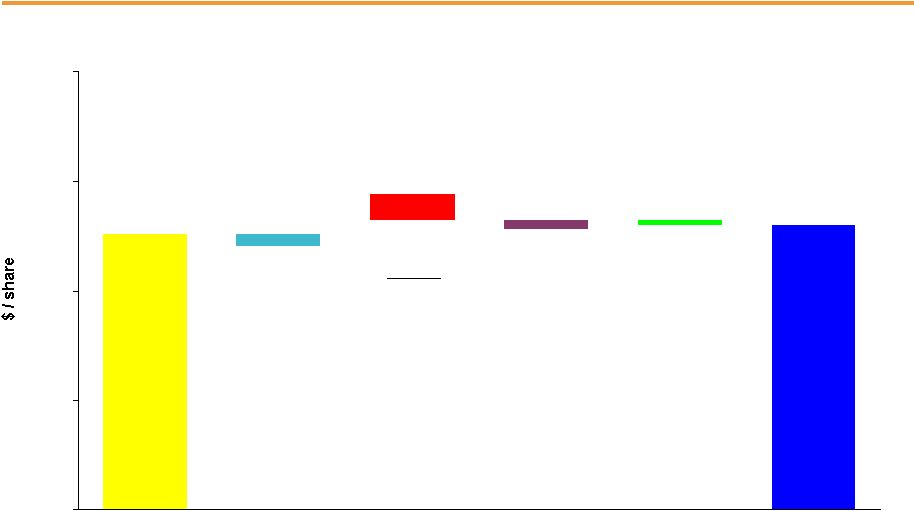 11 $0.65 0.01 (0.02) 0.06 (0.03) $0.63 0.00 0.25 0.50 0.75 1.00 PSEG EPS Reconciliation – Q2 2010 versus Q2 2009 Q2 2010 operating earnings* Q2 2009 operating earnings* Interest Higher volume offset by lower prices 0.02 O&M 0.01 WPT (0.02) Taxes (0.02) SO2 Impairment (0.02) PSEG Power Weather 0.01 Margins: Electric 0.03 Transmission 0.01 O&M 0.01 Taxes & Misc. 0.01 D&A (0.01) PSE&G PSEG Energy Holdings Enterprise Lower gains on lease sales and lower project earnings (0.05) Tax Benefits for Solar & Other Projects 0.02 Interest 0.01 •See page 33 for Items excluded from Income from Continuing Operations to reconcile to Operating Earnings. |
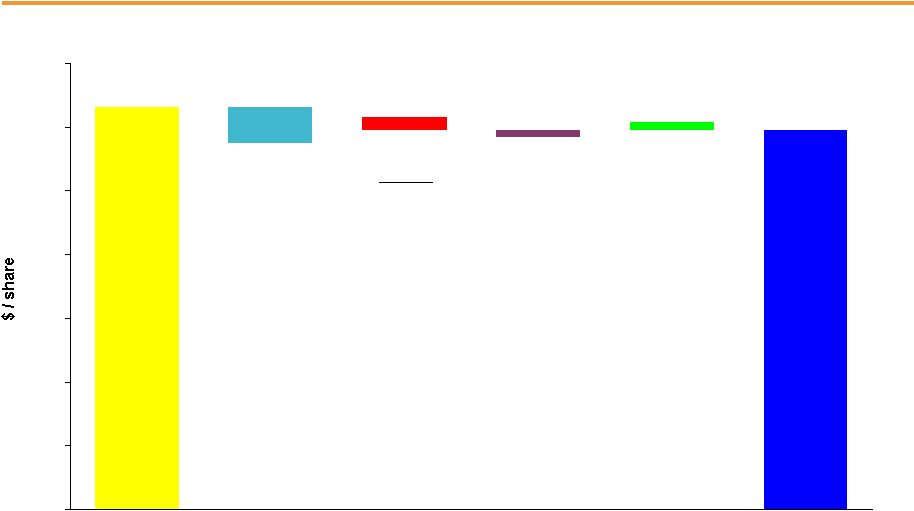 12 $1.49 0.03 (0.03) 0.05 (0.14) $1.58 0.00 0.25 0.50 0.75 1.00 1.25 1.50 1.75 PSEG EPS Reconciliation – YTD 2010 versus YTD 2009 YTD 2010 operating earnings* YTD 2009 operating earnings* Interest Higher volume offset by lower prices (0.04) WPT (0.05) SO2 Impairment (0.02) BGSS (0.01) D&A 0.01 Taxes (0.01) Increase in effective tax rate related to healthcare legislation (0.02) PSEG Power Weather (0.02) Margins: Electric 0.04 Transmission 0.02 Appliance Service 0.01 Taxes & Misc. 0.02 O&M (0.01) D&A (0.01) PSE&G PSEG Energy Holdings Enterprise Lower gains on lease sales and lower project earnings (0.06) Tax Benefits for Solar and Other Projects 0.02 Interest 0.01 * See page 34 for Items excluded from Income from Continuing Operations to reconcile to Operating Earnings. |
PSEG Power 2010 Q2 Review * * * * * * * * * * |
 14 PSEG Power – Q2 2010 EPS Summary (21) (24) (45) Mark-to-Market, Net of Tax (7) 17 10 NDT Funds Related Activity, Net of Tax ($ 5) $ 1,363 $ 1,358 Operating Revenues ($ 0.03) $ 0.50 $ 0.47 EPS from Operating Earnings* (42) 246 204 Income from Continuing Operations / Net Income (14) 253 239 Operating Earnings Variance Q2 2009 Q2 2010 $ millions (except EPS) * See page 33 for Items excluded from Income from Continuing Operations to reconcile to Operating Earnings. |
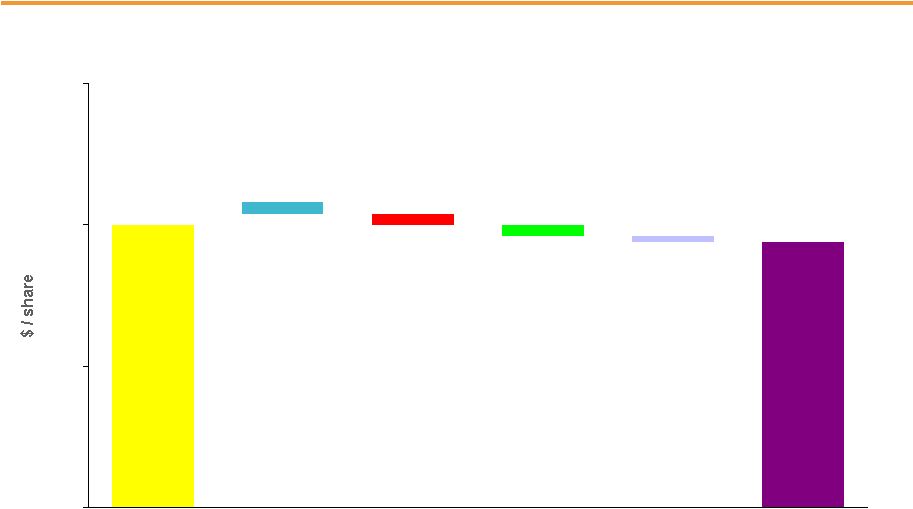 15 $0.50 0.02 (0.02) (0.02) $0.47 (0.01) 0.00 0.25 0.50 0.75 Higher volume offset by lower prices PSEG Power EPS Reconciliation – Q2 2010 versus Q2 2009 Q2 2010 operating earnings* Q2 2009 operating earnings* * See page 33 for Items excluded from Income from Continuing Operations to reconcile to Operating Earnings. WPT O&M 0.01 Taxes (0.02) SO2 Impairment |
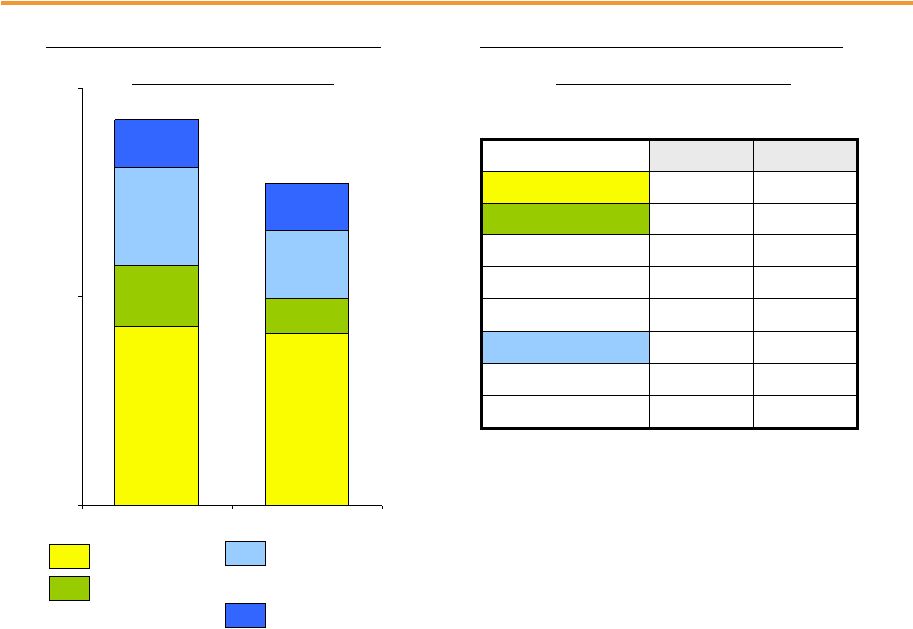 16 PSEG Power – Generation Measures 7,487 7,196 2,595 1,470 4,090 2,887 1,937 2,010 0 8,750 17,500 2010 2009 Quarter ended June 30 Total Nuclear Total Coal* Oil & Natural Gas – excluding Texas * Includes figures for Pumped Storage PSEG Power – Generation (GWh) 13,490 16,182 Oil & Natural Gas - Texas PSEG Power – Capacity Factors (%) 41% 43% Texas 37% 52% PJM and NY Combined Cycle 35% 83% 42% 95.0% 2010 30% CT 80% PA 20% NJ Coal 93.4% Nuclear 2009 Six months ended June 30 |
 17 PSEG Power – Fuel Costs 178 236 Oil & Gas* 47 100 Coal 19.27 23.30 $ / MWh 13,490 16,182 Total Generation (GWh) 260 377 Total Fuel Costs 35 41 Nuclear Total Fossil ($ millions) 225 336 2009 2010 Quarter ended June 30 PSEG Power – Fuel Costs * Includes Texas. |
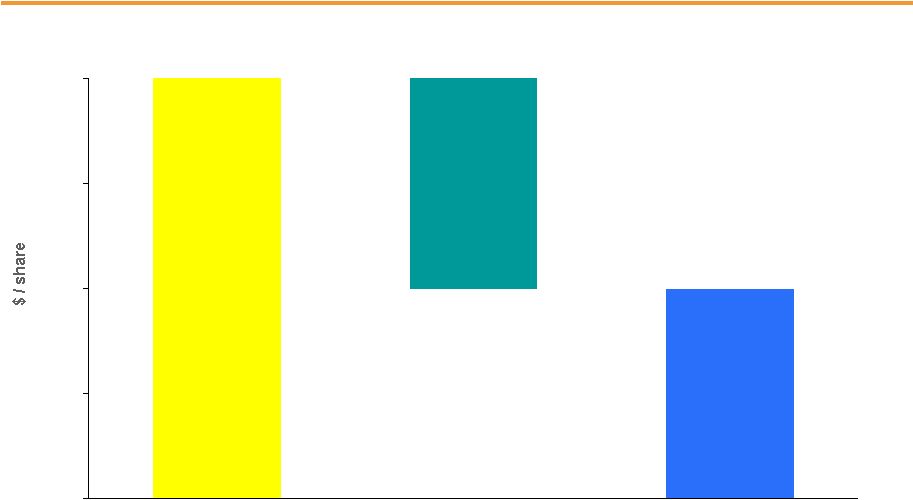
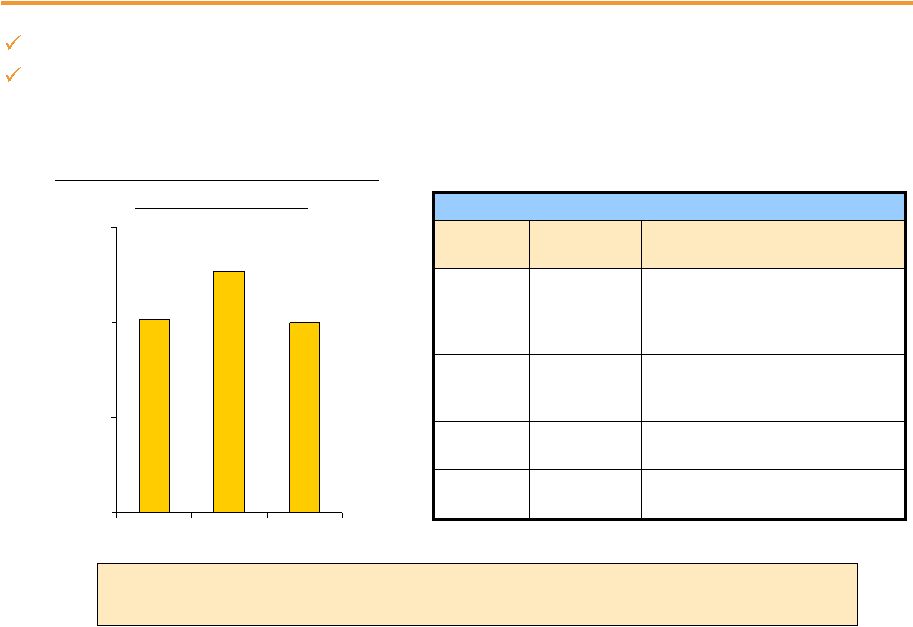 18 PSEG Power – Gross Margin Performance $0 $25 $50 $75 2010 2009 2008 $63 $51 Quarter ended June 30 Volume increased 20% vs. year ago in response to weather-related demand Margins influenced by BGS migration and impairment of excess SO2 emission allowances Decline in gross margin influenced by lower spark spread. $29 Texas Regional Performance $14 $20 $688 Q2 Gross Margin ($M) Q2 Performance Region Improvement in generation offset by decline in price. New York Volumes and margins lower vs. year ago, reflecting decline in dark spreads. New England Margin improvement aided by strong weather-related demand offset by lower pricing and ($0.01) SO2 impairment. PJM PSEG Power Gross Margin ($/MWh)* * Excludes Texas Increase in generation was predominantly from combined cycle and coal with continued strong nuclear. $50 |
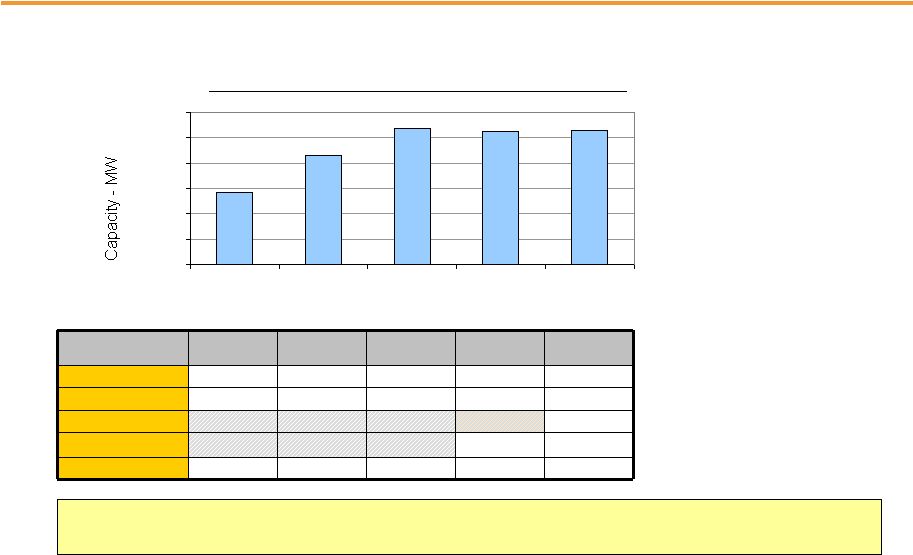 19 … with sites in the eastern part of PJM. Reliability Pricing Model – locational value of Power’s generating fleet recognized… With nearly 1/3 of its capacity in PS North and nearly 2/3 of its capacity in MAAC and EMAAC, Power’s assets in congested locations received higher pricing in the 2013/2014 RPM Auction. • Locational value of Power’s fleet recognized • Bid for 89 MW of new capacity accepted for 2013/2014 auction; in-service June 2013 • On schedule to complete 178MW of previously cleared peaking capacity by June 2012 $27.73 $16.46 $110.00 $174.29 $102.04 Rest of Pool $245.00 $185.00 PSEG North Zone $245.00 PSEG $133.37 $139.73 2012 / 2013 $226.15 $245.00 2013/2014 $110.00 $174.29 $191.32 MAAC $110.00 $174.29 $191.32 Eastern MAAC 2011 / 2012 2010 / 2011 2009 / 2010 $/MW-day PJM Zones 0 2,000 4,000 6,000 8,000 10,000 12,000 09/10 10/11 11/12 12/13 13/14 PJM Capacity Available to Receive Auction Pricing |
 20 PSEG Power – Q2 Operating Highlights Q2 output + 20% added $0.05 to EPS Q2 nuclear capacity factor at 92.6% Combined cycle and coal units captured market opportunities Operations Regulatory and Market Environment Financial Lower pricing reduced Q2 earnings ($0.03) per share which includes the impact of customer migration of ($0.01) per share; mark-to-market related to lower volumes on other full requirements contracts was ($0.02) per share RPM auction results support locational value of assets Power on track to complete Back-End-Technology construction at Hudson and Mercer by year-end Bid accepted for 89 MW peaker at Kearny for 2013 in-service Power debt exchange to reduce financing cost and extend maturities |
PSE&G 2010 Q2 Review * * * * * * * * * * |
 22 PSE&G – Q2 2010 Earnings Summary 28 1,493 1,465 Total Operating Expenses (2) 26 28 Taxes Other than Income Taxes Operating Expenses 62 979 917 Energy Costs 1 344 343 Operation & Maintenance (33) 144 177 Depreciation & Amortization $ 0.06 $ 0.09 $ 0.15 EPS from Operating Earnings* 32 43 75 Operating Earnings ($ 107) $ 1,643 $ 1,536 Operating Revenues Variance Q2 2009 Q2 2010 $ millions (except EPS) * See page 33 for Items excluded from Income from Continuing Operations to reconcile to Operating Earnings. |
 23 $0.09 0.04 0.01 0.01 $0.15 0.00 0.05 0.10 0.15 0.20 ` PSE&G EPS Reconciliation – Q2 2010 versus Q2 2009 Q2 2010 operating earnings* Q2 2009 operating earnings* Weather * See page 33 for Items excluded from Income from Continuing Operations to reconcile to Operating Earnings. O&M 0.01 Taxes & Misc. 0.01 D&A (0.01) Margins: Electric 0.03 Transmission 0.01 |
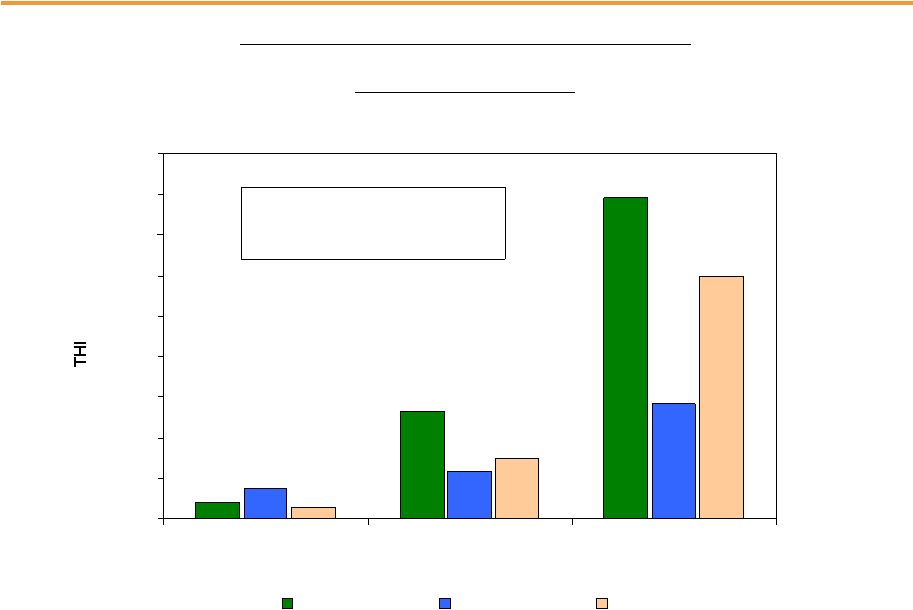 24 PSE&G – Monthly Weather Data 1,333 3,954 208 376 586 1,412 140 749 2,999 0 500 1,000 1,500 2,000 2,500 3,000 3,500 4,000 4,500 April May June 2010 2009 Normal 2010 vs. 2009 vs. Normal PSE&G Monthly Temperature Humidity Index (THI) + 131% Q2 2010 vs. Q2 2009 + 41% Q2 2010 vs. Normal |
 25 PSE&G – Q2 Operating Highlights NJ BPU approved stipulated settlement in June providing for $100 million in electric and gas revenue based on authorized ROE of 10.3% and Equity Ratio of 51.2% Refunding $122 million to resolve issues related to the Market Transition Charge over the next 24 months BPU plans to hold separate hearings on rate treatment of consolidated taxes and SBC Susquehanna-Roseland Transmission in-service date delayed by 2 years PSE&G has reduced its distribution related capital budgets by $140 million over 2010-2012 PSE&G distribution operations earned an 8.3% return on equity for the trailing 12 months Operations Regulatory and Market Environment Financial Economic indicators appear to have stabilized but have yet to indicate a recovery Focused on maintaining reliability |
PSEG Energy Holdings 2010 Q2 Review * * * * * * * * * * |
 27 PSEG Energy Holdings – Q2 2010 Earnings Summary ($0.02) $ 0.04 $ 0.02 EPS from Operating Earnings* ($ 9) $ 21 $12 Income from Continuing Operations / Net Income ($ 75) $ 95 $ 20 Operating Revenues Variance Q2 2009 Q2 2010 $ millions (except EPS) * See page 33 for Items excluded from Income from Continuing Operations to reconcile to Operating Earnings. |
 28 $0.02 (0.02) $0.04 0.00 0.01 0.02 0.03 0.04 PSEG Energy Holdings EPS Reconciliation – Q2 2010 versus Q2 2009 Q2 2010 operating earnings* Q2 2009 operating earnings* Lower gains on lease sales and lower project earnings (0.05) Tax Benefits for Solar & Other Projects 0.02 Interest 0.01 * See page 33 for Items excluded from Income from Continuing Operations to reconcile to Operating Earnings. |
 29 PSEG Energy Holdings – Q2 Operating Highlights Financial Termination of additional lease in Q2 reduced potential tax liability at quarter-end to $550 million; $320 million of cash on deposit at IRS Solar projects in Ohio and Florida exceeding expectations; NJ solar project is operating as planned Reviewing opportunity for additional investments in solar under PPA arrangements |
PSEG * * * * * * * * * * * * |
 31 2010 Operating Earnings Guidance $ 3.12 $ 1,579 $ 10 $ 43 $ 321 $ 1,205 2009A* $ 3.00 – $ 3.25 $ 1,520 – $ 1,645 $ 5 – $15 $ 30 – $ 40 $ 425 – $ 455 $ 1,060 – $ 1,135 2010E Enterprise Earnings per Share Operating Earnings* PSEG Energy Holdings PSE&G PSEG Power $ millions (except EPS) * See page 35 for Items excluded from Income from Continuing Operations to reconcile to Operating Earnings. |
 32 PSEG Liquidity as of June 30, 2010 PSEG Liquidity as of June 30, 2010 Expiration Total Available Company Facility Date Facility Usage Liquidity 5-Year Credit Facility (Power) Dec-12 $1,600 1 $231 $1,369 5-Year Credit Facility (PSEG) Dec-12 $1,000 2 $182 $818 2-Year Credit Facility (Power) Jul-11 $350 $0 $350 PSE&G 5-Year Credit Facility Jun-12 $600 3 $214 $386 Total $3,550 $2,923 1 Power Facility reduces by $75 million in 12/2011 2 PSEG Facility reduces by $47 million in 12/2011 3 PSE&G Facility reduces by $28 million in 6/2011 PSEG / Power ($Millions) |
 33 Items Excluded from Income from Continuing Operations to Reconcile to Operating Earnings Please see Page 2 for an explanation of PSEG’s use of Operating Earnings as a non-GAAP financial measure and how it differs from Net Income. Pro-forma Adjustments, net of tax 2010 2009 Earnings Impact ($ Millions) Gain (Loss) on Nuclear Decommissioning Trust (NDT) Fund Related 10 $ 17 $ Activity (PSEG Power) Gain (Loss) on Mark-to-Market (MTM) (PSEG Power) (45) (24) Market Transition Charge Refund (PSE&G) (72) - Total Pro-forma adjustments (107) $ (7) $ Fully Diluted Average Shares Outstanding (in Millions) 507 507 Per Share Impact (Diluted) Gain (Loss) on NDT Fund Related Activity (PSEG Power) 0.02 $ 0.03 $ Gain (Loss) on MTM (PSEG Power) (0.09) (0.05) Market Transition Charge Refund (PSE&G) (0.14) - Total Pro-forma adjustments (0.21) $ (0.02) $ (a) Income from Continuing Operations for the three months ended June 30, 2010 and 2009 is equal to Net Income. For the Three Months Ended 30-Jun |
 34 Items Excluded from Income from Continuing Operations to Reconcile to Operating Earnings Please see Page 2 for an explanation of PSEG’s use of Operating Earnings as a non-GAAP financial measure and how it differs from Net Income. Pro-forma Adjustments, net of tax 2010 2009 Earnings Impact ($ Millions) Gain (Loss) on Nuclear Decommissioning Trust (NDT) Fund Related 20 $ (6) $ Activity (PSEG Power) Gain (Loss) on Mark-to-Market (MTM) (PSEG Power) 11 (39) Market Transition Charge Refund (PSE&G) (72) - Total Pro-forma adjustments (41) $ (45) $ Fully Diluted Average Shares Outstanding (in Millions) 507 507 Per Share Impact (Diluted) Gain (Loss) on NDT Fund Related Activity (PSEG Power) 0.04 $ (0.01) $ Gain (Loss) on MTM (PSEG Power) 0.02 (0.08) Market Transition Charge Refund (PSE&G) (0.14) - Total Pro-forma adjustments (0.08) $ (0.09) $ (a) Income from Continuing Operations for the six months ended June 30, 2010 and 2009 is equal to Net Income. For the Six Months Ended 30-Jun |
 35 Items Excluded from Income from Continuing Operations to Reconcile to Operating Earnings Please see Page 2 for an explanation of PSEG’s use of Operating Earnings as a non-GAAP financial measure and how it differs from Net Income. Pro-forma Adjustments, net of tax 2009 2008 Earnings Impact ($ Millions) Gain (Loss) on Nuclear Decommissioning Trust (NDT) Fund Related Activity (PSEG Power) 9 $ (71) $ Gain (Loss) on Mark-to-Market (MTM) (PSEG Power) (25) 16 Lease Transaction Reserves - (490) Net Reversal of Lease Transaction Reserves 29 - Asset Impairments - (13) Premium on Bond Redemption - (1) Total Pro-forma adjustments 13 $ (559) $ Fully Diluted Average Shares Outstanding (in Millions) 507 508 Per Share Impact (Diluted) Gain (Loss) on Nuclear Decommissioning Trust (NDT) Fund Related Activity (PSEG Power) 0.02 $ (0.14) $ Gain (Loss) on Mark-to-Market (MTM) (PSEG Power) (0.05) 0.03 Lease Transaction Reserves - (0.96) Net Reversal of Lease Transaction Reserves 0.05 - Asset Impairments - (0.03) Premium on Bond Redemption - - Total Pro-forma adjustments 0.02 $ (1.10) $ For the Twelve Months Ended December 31, |