 PSEG Public Service Enterprise Group Goldman Sachs Power & Utility Conference August 12, 2010 Exhibit 99 |
 2 Forward-Looking Statement Readers are cautioned that statements contained in this presentation about our and our subsidiaries' future performance, including future revenues, earnings, strategies, prospects, consequences and all other statements that are not purely historical, are forward-looking statements for purposes of the safe harbor provisions under The Private Securities Litigation Reform Act of 1995. When used herein, the words “anticipate”, “intend”, “estimate”, “believe” “expect”, “plan”, “should”, “hypothetical”, “potential”, “forecast”, “project”, variations of such words and similar expressions are intended to identify forward- looking statements. Although we believe that our expectations are based on reasonable assumptions, they are subject to risks and uncertainties and we can give no assurance they will be achieved. The results or developments projected or predicted in these statements may differ materially from what may actually occur. Factors which could cause results or events to differ from current expectations include, but are not limited to: • Adverse changes in energy industry law, policies and regulation, including market structures, transmission planning and rules, and reliability standards. • Any inability of our transmission and distribution businesses to obtain adequate and timely rate relief and regulatory approvals from federal and state regulators. • Changes in federal and state environmental regulations that could increase our costs or limit operations of our generating units. • Changes in nuclear regulation and/or developments in the nuclear power industry generally that could limit operations of our nuclear generating units. • Actions or activities at one of our nuclear units located on a multi-unit site that might adversely affect our ability to continue to operate that unit or other units located at the same site. • Any inability to balance our energy obligations, available supply and trading risks. • Any deterioration in our credit quality. • Availability of capital and credit at commercially reasonable terms and conditions and our ability to meet cash needs. • Any inability to realize anticipated tax benefits or retain tax credits. • Changes in the cost of, or interruption in the supply of, fuel and other commodities necessary to the operation of our generating units. • Delays in receipt of necessary permits and approvals for our construction and development activities. • Delays or unforeseen cost escalations in our construction and development activities. • Increase in competition in energy markets in which we compete. • Adverse performance of our decommissioning and defined benefit plan trust fund investments and changes in discount rates and funding requirements. • Changes in technology and customer usage patterns. For further information, please refer to our Annual Report on Form 10-K, including Item 1A. Risk Factors, and subsequent reports on Form 10-Q and Form 8-K filed with the Securities and Exchange Commission. These documents address in further detail our business, industry issues and other factors that could cause actual results to differ materially from those indicated in this presentation. In addition, any forward-looking statements included herein represent our estimates only as of today and should not be relied upon as representing our estimates as of any subsequent date. While we may elect to update forward-looking statements from time to time, we specifically disclaim any obligation to do so, even if our internal estimates change, unless otherwise required by applicable securities laws. |
 3 GAAP Disclaimer PSEG presents Operating Earnings in addition to its Net Income reported in accordance with accounting principles generally accepted in the United States (GAAP). Operating Earnings is a non-GAAP financial measure that differs from Net Income because it excludes gains or losses associated with Nuclear Decommissioning Trust (NDT), Mark-to-Market (MTM) accounting, and other material one-time items. PSEG presents Operating Earnings because management believes that it is appropriate for investors to consider results excluding these items in addition to the results reported in accordance with GAAP. PSEG believes that the non-GAAP financial measure of Operating Earnings provides a consistent and comparable measure of performance of its businesses to help shareholders understand performance trends. This information is not intended to be viewed as an alternative to GAAP information. The last two slides in this presentation include a list of items excluded from Income from Continuing Operations to reconcile to Operating Earnings, with a reference to that slide included on each of the slides where the non-GAAP information appears. |
 PSEG – Defining the Future Caroline Dorsa Executive Vice President and Chief Financial Officer |
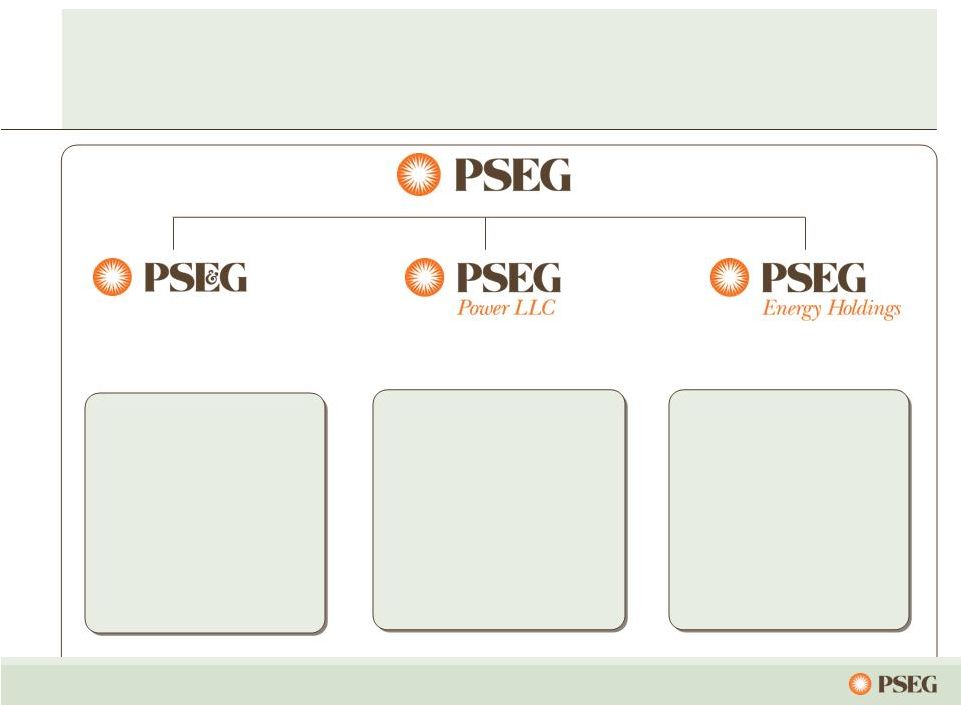 PSEG: the right mix for the opportunities of today and tomorrow PSE&G positioned PSE&G positioned to meet NJ’s to meet NJ’s energy policy and energy policy and economic growth economic growth objectives. objectives. Electric & Gas Delivery and Transmission PSEG Power’s low-cost baseload nuclear and coal fleet is geographically well positioned and environmentally responsible. Regional Wholesale Energy PSEG Energy Holdings positioned to pursue attractive renewable generation opportunities: • Solar • Offshore wind • Compressed Air Energy Storage (CAES) Renewable Investments 5 |
 6 A successful track record… … provides the confidence to capitalize on the opportunities of tomorrow. PSEG Power resumed independent control of nuclear fleet, produced record levels of generation and achieved top quartile performance; fossil fleet retrofitted to meet more stringent environmental requirements. PSE&G consistently recognized for reliability; investment programs expanded to meet NJ’s goals for economic growth and clean energy. Business focus improved; balance sheet strengthened; Holdings’ financial risk lessened with sale of international investments, termination of offshore leases Operational and financial focus has allowed PSEG to meet/exceed earnings objectives in each of the past three years. History of returning cash to shareholders through common dividend. 2007 2008 2009 |
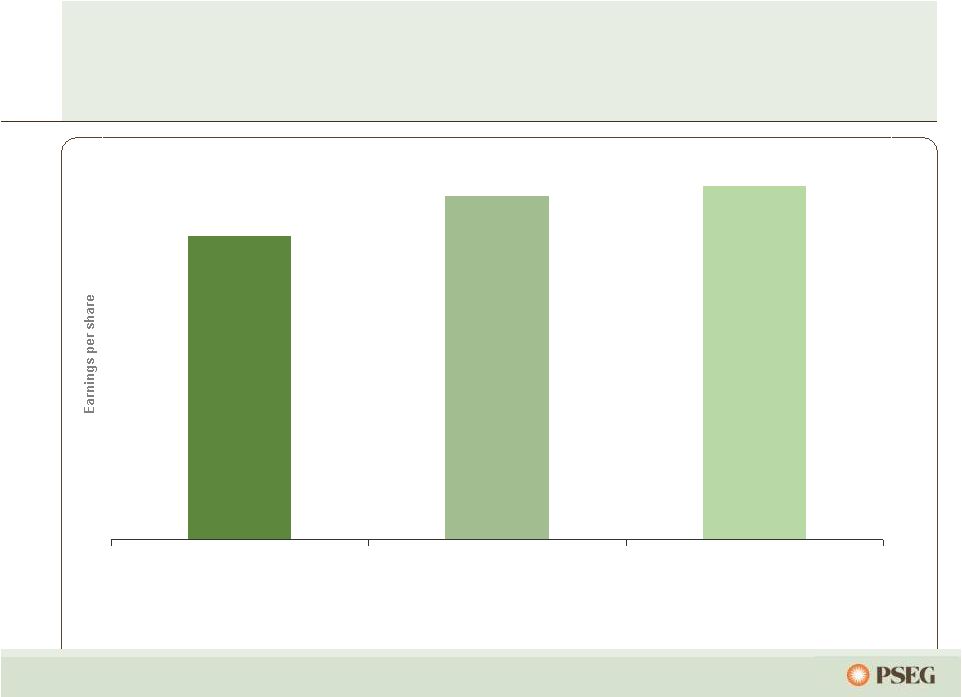 7 Earnings growth achieved… … through higher energy market pricing, increased production and lower costs. * See Page 36 for Items excluded from Income from Continuing Operations to reconcile to Operating Earnings. $2.68 $3.03 $3.12 2007 Operating Earnings* 2008 Operating Earnings* 2009 Operating Earnings* |
 8 2008 Operating Earnings* 2009 Operating Earnings* 2010 Guidance $3.00 - $3.25 PSEG – Maintaining 2010 Guidance $3.03 $3.12 * See Page 36 for Items excluded from Income from Continuing Operations to reconcile to Operating Earnings. |
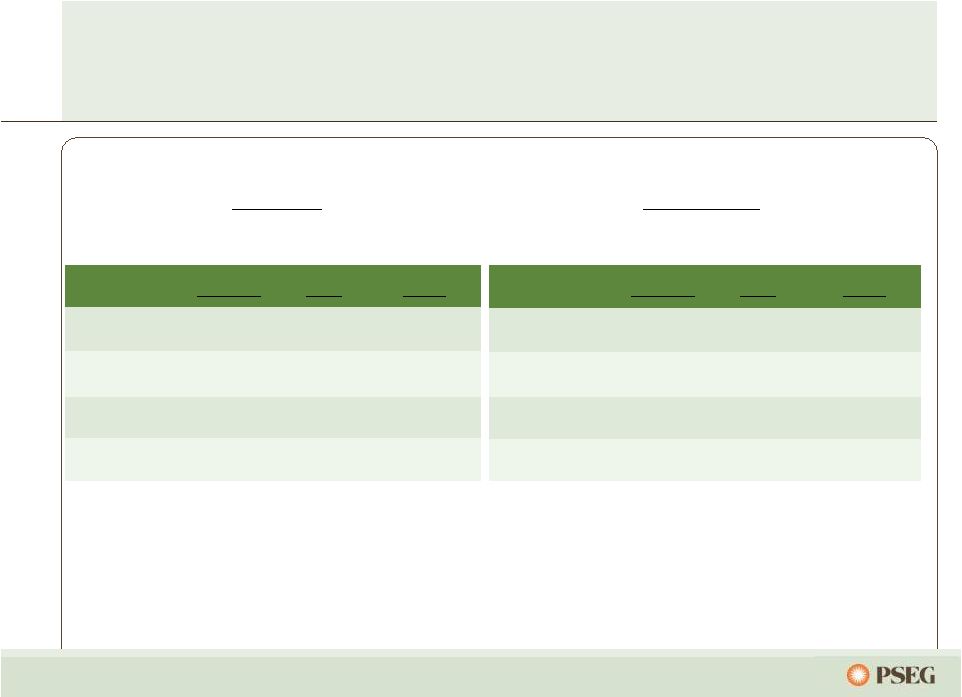
 9 Q2 2010 Operating Earnings by Subsidiary $ 800 (3) 31 166 $606 2009 $ 756 8 19 192 $ 537 2010 Operating Earnings Earnings per Share (0.01) 0.02 Enterprise $ 1.58 $ 1.49 Operating Earnings* 0.06 0.03 PSEG Energy Holdings 0.33 0.38 PSE&G $ 1.20 $ 1.06 PSEG Power 2009 2010 $ millions (except EPS) Six months ended June 30 •See Page 35 for Items excluded from Income from Continuing Operations to reconcile to Operating Earnings. |
 10 PSEG 2010 Operating Earnings Guidance $ 3.12 $ 1,579 $ 10 $ 43 $ 321 $ 1,205 2009A* $ 3.00 – $ 3.25 $ 1,520 – $ 1,645 $ 5 – $15 $ 30 – $ 40 $ 425 – $ 455 $ 1,060 – $ 1,135 2010E Enterprise Earnings per Share Operating Earnings* PSEG Energy Holdings PSE&G PSEG Power $ millions (except EPS) * See Page 36 for Items excluded from Income from Continuing Operations to reconcile to Operating Earnings. |
 11 $2,091 $1,993 $163 $30 2008 2009 Sustainability Plan Non-pension O&M Expense (1) Pension Expense Manage Staffing Levels Control General and Administrative Expenses Capture Productivity Gains (1) Excludes O&M related to PSE&G clauses We have successfully managed our O&M … … through benchmarking efforts and operational excellence. $2,121M $2,156M |
 12 $1,000 $1,250 $1,500 $1,750 $2,000 $2,250 2009 2010 2011 2012 PSEG Consolidated O&M (1) C.A.G.R. (’09 –’12) = 0.7% (1) Excludes O&M related to PSE&G clauses Aggressive employee management of our O&M, including 2010 wage freeze … …and improving pension expense, will result in modest O&M growth. * * * *estimated |
 13 2009 Operating Earnings* 2010 Guidance Rigorous cost controls, hedging strategy and improved utility capital recovery… …help mitigate the risk of weak prices in 2010. $3.12 $3.00 - $3.25 PSE&G: Network Transmission Service (NTS) revenue increase for 2010 from 2009 ~ $0.03 EPS 2009 earned ROE = 8.3% 1% change in Distribution earned ROE in 2010 ~ $0.07 EPS 1% change in load in 2010 ~ $0.02 EPS PSEG Power: Revenue/Margin Nuclear output fully contracted Dark Spread change of $5/MWh at market – impact of $0.02-$0.04/share Spark Spread change of $5/MWh at market – impact of $0.04-$0.08/share Operations 1% change in nuclear capacity factor – impact of $0.01-$0.03/share O&M 1% change – impact of ~$0.01/share Drivers *See page 36 for Items excluded from Income from Continuing Operations to reconcile to Operating Earnings |
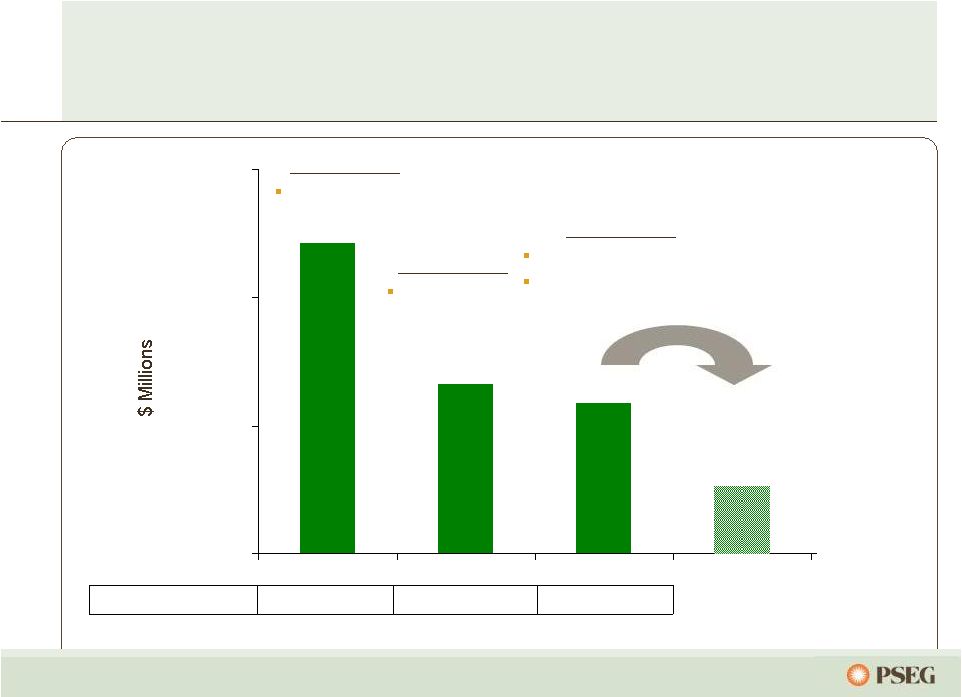 14 Cash Exposure Net of $320M of IRS Deposits 12/31/08 12/31/09 July 2010 2 5 17 # of LILO/SILO Leases 2009 Activities Terminated 12 LILO / SILO leases 2010 Activities Terminated 3 leases Pursue additional lease termination opportunities 2008 Activities Terminated 1 LILO / SILO lease Exposure to our potential lease tax liability… …was reduced with aggressive asset management. $660 ~$1,200 ~$80 ~$400 $- $500 $1,000 $1,500 |
 PSE&G – Review and Outlook |
 PSE&G is the largest utility in New Jersey providing electric, gas and transmission services,… …and delivering renewable and energy efficiency solutions for customers. * Actual ** Weather normalized = estimated annual growth per year over forecast period *** Lifetime GWh + Lifetime Dtherms converted to GWh 60% 31% Residential 36% 58% Commercial 0.4%** 0.4% - 1.3%** Projected Annual Load Growth (2009 – 2012) Sales Mix 3,500 M Therms 41,961 GWh Electric Sales and Gas Sold and Transported (0.4%)* (0.6%)* Historical Annual Load Growth (2005 - 2009) 4% 11% Industrial 1.7 Million 3.2% Gas 2.1 Million 3.0% Customers Growth (2004 – 2009) Electric 0.5%* Historical Annual Peak Load Growth 2005-2009 1,442 Network Circuit Miles Key Statistics Transmission 2.1%** Projected PJM Peak Load Growth 2009-2012 13,512 GWh 230 GWh Energy Efficiency Initiative (lifetime equivalent)*** 80 MW 1 MW Solar 4 All 11.6 MW 2009 Renewables and Energy Efficiency Solar Loan 81 MW Total 16 |
 17 2009: Success in meeting State’s energy and economic development goals… …with reasonable contemporaneous returns. 340 354 694 April 2009 NJ Capital Infrastructure Stimulus 30 17 47 December 2008 Carbon Abatement 63 2 65 July 2009 Demand Response 143 - 143 November 2009 Solar Loan II 50 55 $105 April 2008 Solar Loan I $1,220 $539 $1,759 Total 146 44 190 July 2009 Economic Energy Efficiency Stimulus 448 67 515 July 2009 Solar 4 All Remaining Spending Thru 6/30/10 Total Amount Approval Date ($ Millions) |
 18 New Jersey Electric & Gas Rate Agreement -- A Balancing of Interests 51.2% Equity Ratio 11.25% Return on Equity $6.2B $2.3B $3.8B Rate Base $204.2M $64.4M $139.8M Increase Total Gas Electric 51.2% Equity Ratio 10.3% Return on Equity $6.0B $2.27B $3.75B Rate Base $100.0M $26.5M $73.5M Increase Total Gas Electric Request Agreement … in a difficult economic environment. |
 19 Projects to NY Neptune HVDC project (685 MW) Sayreville to Long Island Linden VFT project (330 MW) Linden to Staten Island Bergen O66 project (670 MW*) Bergen to ConEd's West 49th St Bergen U2-100 project (800 MW**) connecting Bergen to NY Projects to NJ PSE&G’s evaluation of the proposed backbone Transmission projects: Susquehanna - Roseland*** Branchburg- Roseland- Hudson**** As a result NJ will need new generation, DSM or additional transmission imports. Total Import Capability ~ 2,000 MW Total Export Capability ~ 2,500 MW 2010-2020 NJ Summer Peak Growth Rate = 1.6% Sources: Imports: PSE&G Estimates; Exports: PJM 2009 RTEP; Load Growth: PJM 2010 Load Forecast Report NJ’s load is expected to grow 3,450MW by 2020, with net imports decreasing ~500MW. * Project has firm contract for 320MW; ** Project in queue – no firm contracts; *** PSE&G has announced a 2-year delay of the in-service date for the S-R Transmission line.; ****PSE&G has placed development activities for the B-R-H Transmission line on hold pending further guidance from PJM. |
 PSEG Power – Review and Outlook |
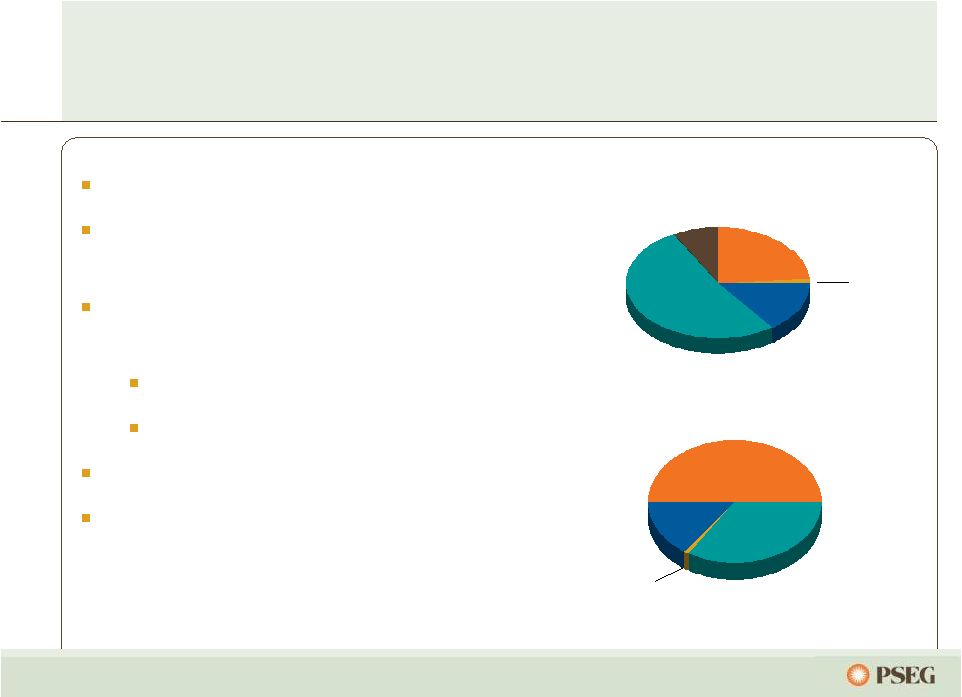 21 Low-cost portfolio Regional focus in competitive, liquid markets Assets favorably located near customers/load centers Many units east of PJM constraints Southern NEPOOL/ Connecticut Texas assets – low cost combined cycle Market knowledge and experience to maximize the value of our assets … with low cost plants, in good locations, within solid markets. Power’s assets drive value in a dynamic environment… 15% 52% 8% Fuel Diversity Coal Gas Oil Nuclear Pumped Storage 1% Energy Produced (Twelve months ended December 31, 2009) Total GWh: 59,808 51% 15% 34% Pumped Storage & Oil <1% Nuclear Coal Gas Total MW: 15,548 24% 8% |
 22 Power’s Northeast assets are located in attractive markets near load centers … ... and the fleet has expanded to include 2,000MW in Texas. |
 23 … while maintaining optionality under a variety of conditions. Power’s PJM assets along the dispatch curve reduce the risk of serving full requirement load contracts… X X Ancillary Revenue X X X X Capacity Revenue X X Energy Revenue X X Dual Fuel Peaking units Baseload units Load following units Illustrative Salem Hope Creek Keystone Conemaugh Hudson 2 Linden 1,2 Burlington 8-9-11 Edison 1-2-3 Essex 10-11-12 Bergen 1 Sewaren 1-4 Hudson 1 Mercer1, 2 Bergen 2 Sewaren 6 Mercer 3 Kearny 10-11 Linden 5-8 / Essex 9 Burlington 12 / Kearny 12 Peach Bottom Nuclear Coal Combined Cycle Steam Peaking Yards Creek National Park Salem 3 Bergen 3 |
 24 Stringent environmental challenges are on the horizon, with potentially broad industry impacts… Controls on coal units done or under way Power’s relative position very strong High NOx, SO 2 , Hg (CATR) High Regional High High Industry Impact Emission restrictions net favorable to Power Carbon Peaking fleet replacement strategy Upwind states anticipated to increase NOx stringency Ozone air quality standards (HEDD) EPA required to perform cost-benefit analysis Issue widely shared across industry Potential capital spend exposure Once-through cooling water (316(b)) Power uses dry fly ash systems Ash has been tested as non-hazardous Coal ash regulation Power’s Positioning Issue …but Power’s clean fleet is very competitively positioned for success. |
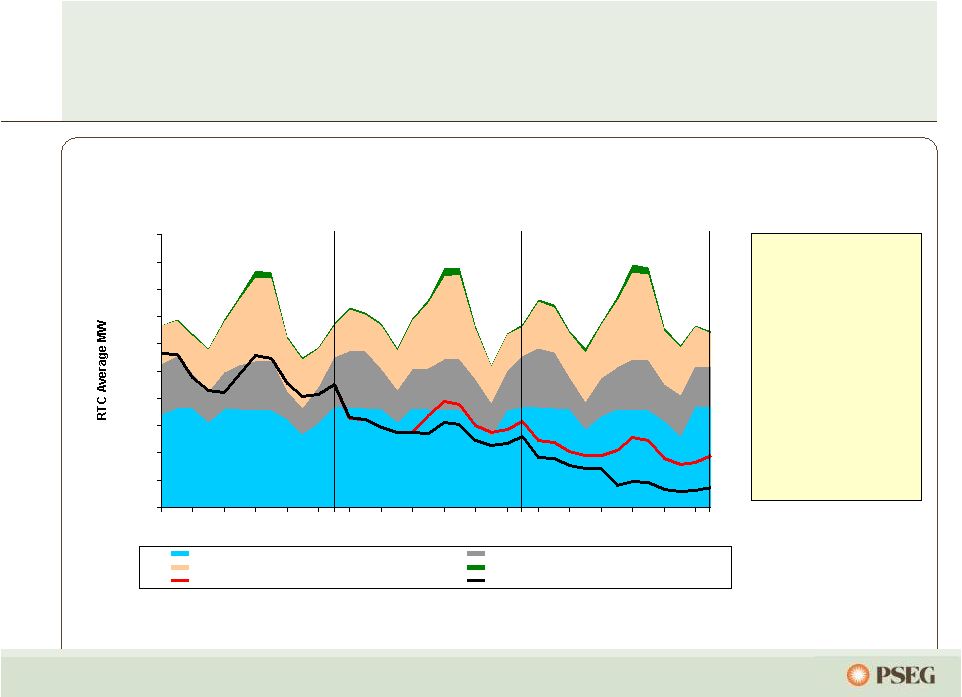 25 The result of Power’s hedging strategy is a portfolio of contracted output… … which dampens the impact of market volatility on earnings in the near term. Power’s anticipated nuclear and coal output is contracted over the next few years: 2010: 100% 2011: 65-70% 2012: 25-30% Total Fleet RTC Average 0 1000 2000 3000 4000 5000 6000 7000 8000 9000 10000 Nuclear / Pumped Storage Coal Combined Cycle (CC) Steam and Peakers Existing BGS, Other Load Contracts, Hedges + Future BGS Existing BGS, Other Load Contracts, and Hedges 2010 2011 2012 |
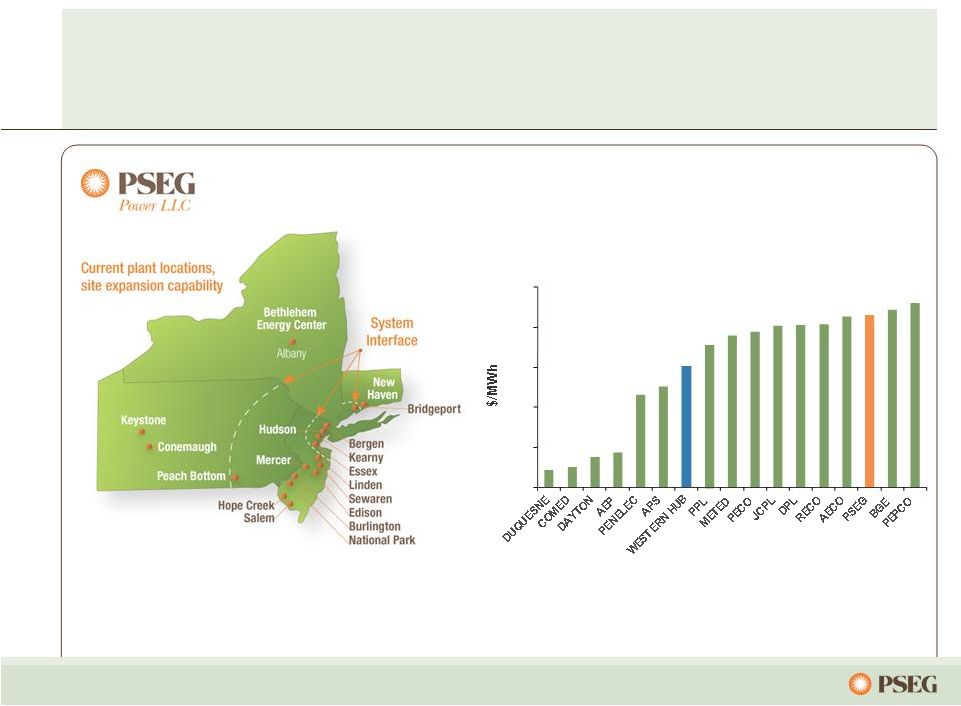 Power’s assets are well positioned near load centers… … which resulted in a 9% growth in PJM gross margin from 2008 to 2009. Note: excludes Dominion (less than 5 years of history) 26 $40 $45 $50 $55 $60 $65 Historical 5-year Average PJM Energy Price (Around the Clock) |
 27 Full Requirements Component Increase in Capacity Markets/RPM Growing Renewable Energy Requirements Component for Market Risk Through Power’s participation in each of the BGS auctions… Market Perspective – BGS Auction Results … we have developed an expertise in serving full-requirements contracts. 2003 2004 2005 2006 2007 2008 2009 2010 3 Year Average Round the Clock PJM West Forward Energy Price $55.59 Capacity Load shape Transmission Congestion Ancillary services Risk premium Green $33 - $34 $36 - $37 $44 - $46 $67 - $70 $58 - $60 $68 - $71 $56 - $58 $48 - $50 ~ $21 $55.05 ~ $18 $65.41 ~ $21 $102.51 ~ $32 $98.88 ~ $41 $111.50 ~ $43 $103.72 ~ $47 $95.77 ~ $47 Note: BGS prices reflect PSE&G Zone |
 28 … with sites in the eastern part of PJM. Reliability Pricing Model – locational value of Power’s generating fleet recognized… With nearly 1/3 of its capacity in PS North and nearly 2/3 of its capacity in MAAC and EMAAC, Power’s assets in congested locations received higher pricing in the 2013/2014 RPM Auction. • Locational value of Power’s fleet recognized • Bid for 89 MW of new capacity accepted for 2013/2014 auction; in-service June 2013 • On schedule to complete 178 MW of previously cleared peaking capacity by June 2012 $27.73 $16.46 $110.00 $174.29 $102.04 Rest of Pool $245.00 $185.00 PSEG North Zone $245.00 PSEG $133.37 $139.73 2012 / 2013 $226.15 $245.00 2013/2014 $110.00 $174.29 $191.32 MAAC $110.00 $174.29 $191.32 Eastern MAAC 2011 / 2012 2010 / 2011 2009 / 2010 $/MW-day PJM Zones 0 2,000 4,000 6,000 8,000 10,000 12,000 09/10 10/11 11/12 12/13 13/14 PJM Capacity Available to Receive Auction Pricing |
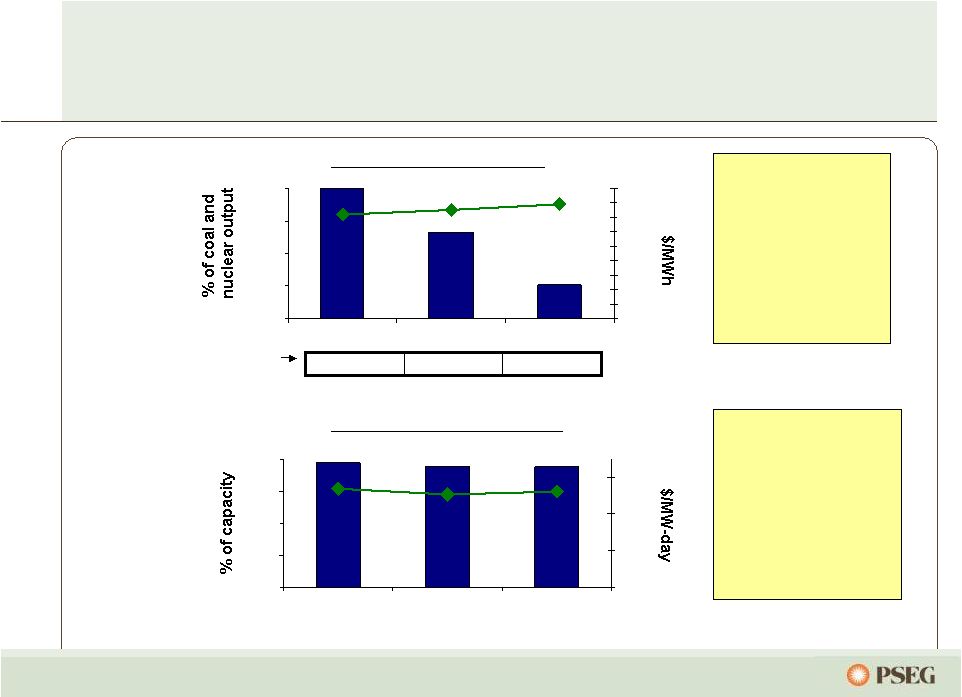 29 0% 25% 50% 75% 100% 2010 2011 2012 $0 $10 $20 $30 $40 $50 $60 $70 $80 $90 0% 25% 50% 75% 100% 2010 2011 2012 $0 $50 $100 $150 Power’s hedging program provides near- term stability from market volatility… … while remaining open to long-term market forces. Estimated EPS impact of $10/MWh PJM West around the clock price change* (~$2/mmbtu gas change) Contracted Capacity Price (right scale) * As of June 30, 2010 Assuming normal market commodity correlation and demand ** Excludes Texas – No capacity market Power has contracted for a considerable percentage of its future output over the next two years at attractive prices. The pricing for most of Power’s capacity has been fixed through May 2014, with the completion of auctions in PJM and NE. % sold (left scale) $0.30 - $0.60 $0.10 - $0.30 $0.05 - $0.10 Contracted Energy Price (right scale) % sold (left scale) ** * |
 30 PSEG value proposition PSEG provides investors with a balanced portfolio of assets within a shifting landscape for energy. PSEG’s focus on operational excellence and O&M control will yield benefits now, and over the long-term. PSEG’s capital commitments are focused on improving reliability and service quality at attractive risk-adjusted returns. PSEG’s strong balance sheet and cash flow support a capital program that will benefit shareholders through ongoing support of dividends and opportunity for future growth. |
 31 PSEG is advantaged… … with a strong balance sheet and cash flow to pursue an investment program that seizes the opportunities of tomorrow. Right Assets, Right Markets Operational Flexibility Environmental Infrastructure Improvements Integrated business model with assets located close to load centers Dispatch flexibility of operating assets and trading capability supports margins in full-requirements markets Environmentally responsible; pursuing investments in renewables; nuclear uprates Investments to improve reliability and functionality of grid 2010 |
 Appendix |
 33 PSEG Power – Gross Margin Performance $0 $25 $50 $75 2010 2009 2008 $63 $51 Quarter ended June 30 Volume increased 20% vs. year ago in response to weather-related demand Margins influenced by BGS migration and impairment of excess SO2 emission allowances Decline in gross margin influenced by lower spark spread. $29 Texas Regional Performance $14 $20 $688 Q2 Gross Margin ($M) Q2 Performance Region Improvement in generation offset by decline in price. New York Volumes and margins lower vs. year ago, reflecting decline in dark spreads. New England Margin improvement aided by strong weather-related demand offset by lower pricing and ($0.01) SO2 impairment. PJM PSEG Power Gross Margin ($/MWh)* * Excludes Texas Increase in generation was predominantly from combined cycle and coal with continued strong nuclear $50 |
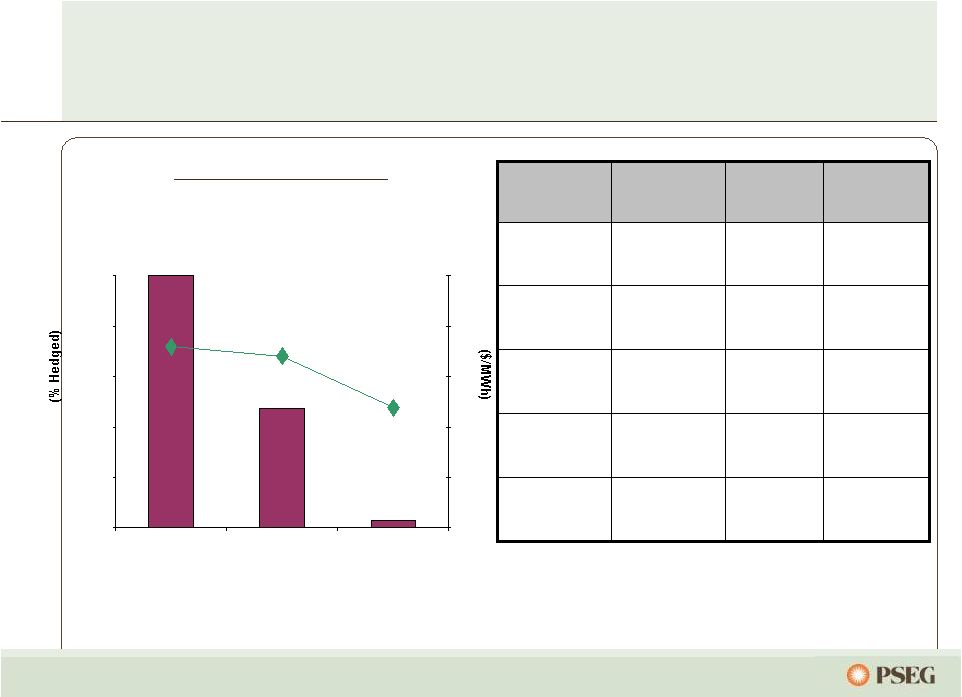 34 Power’s coal hedging reflects 2010 supply matched with 2010 sales… … while maintaining flexibility on supply post BET installation. Contracted Coal Mid $20’s To High $20’s Mid $20’s To High $20’s Mid $40’s To Low $40’s Mid $40’s To Low $40’s High $40’s To Mid $40’s Indicative Pricing ($/MWh) Prices lower, moderating Northern Appalachian Conemaugh Prices lower, moderating Northern Appalachian Keystone More limited segment of coal market Metallurgical CAPP/NAPP Mercer Flexibility after BET in 2010 Adaro (2010) CAPP/NAPP (2011+) Hudson Higher price, lower BTU, enviro coal Adaro Bridgeport Harbor Comments Coal Type Station % Hedged (left scale) $/MWh (right scale) 0% 20% 40% 60% 80% 100% 2010 2011 2012 $0 $10 $20 $30 $40 $50 |
 35 Items Excluded from Income from Continuing Operations to Reconcile to Operating Earnings Please see Page 3 for an explanation of PSEG’s use of Operating Earnings as a non-GAAP financial measure and how it differs from Net Income. Pro-forma Adjustments, net of tax 2010 2009 Earnings Impact ($ Millions) Gain (Loss) on Nuclear Decommissioning Trust (NDT) Fund Related 20 $ (6) $ Activity (PSEG Power) Gain (Loss) on Mark-to-Market (MTM) (PSEG Power) 11 (39) Market Transition Charge Refund (PSE&G) (72) - Total Pro-forma adjustments (41) $ (45) $ Fully Diluted Average Shares Outstanding (in Millions) 507 507 Per Share Impact (Diluted) Gain (Loss) on NDT Fund Related Activity (PSEG Power) 0.04 $ (0.01) $ Gain (Loss) on MTM (PSEG Power) 0.02 (0.08) Market Transition Charge Refund (PSE&G) (0.14) - Total Pro-forma adjustments (0.08) $ (0.09) $ (a) Income from Continuing Operations for the six months ended June 30, 2010 and 2009 is equal to Net Income. For the Six Months Ended 30-Jun |
 36 Items Excluded from Income from Continuing Operations to Reconcile to Operating Earnings Please see Page 3 for an explanation of PSEG’s use of Operating Earnings as a non-GAAP financial measure and how it differs from Net Income. Pro-forma Adjustments, net of tax 2009 2008 2007 Earnings Impact ($ Millions) Gain (Loss) on Nuclear Decommissioning Trust (NDT) Fund Related Activity 9 $ (71) $ 12 $ Gain (Loss) on Mark-to-Market (MTM) (25) 16 10 Lease Transaction Reserves - (490) - Net Reversal of Lease Transaction Reserves 29 - - Asset Sales and Impairments - (13) �� (32) Premium on Bond Redemption - (1) (28) Merger-related Costs - - - Total Pro-forma adjustments 13 $ (559) $ (38) $ Fully Diluted Average Shares Outstanding (in Millions) 507 508 509 Per Share Impact (Diluted) Gain (Loss) on Nuclear Decommissioning Trust (NDT) Fund Related Activity 0.02 $ (0.14) $ 0.02 $ Gain (Loss) on Mark-to-Market (MTM) (0.05) 0.03 0.02 Lease Transaction Reserves - (0.96) - Net Reversal of Lease Transaction Reserves 0.05 - - Asset Impairments - (0.03) (0.06) Premium on Bond Redemption - - (0.06) Merger-related Costs - - - Total Pro-forma adjustments 0.02 $ (1.10) $ (0.08) $ PUBLIC SERVICE ENTERPRISE GROUP INCORPORATED For the Twelve Months Ended December 31, Reconciling Items Excluded from Continuing Operations to Compute Operating Earnings (Unaudited) |