 Public Service Enterprise Group PSEG Earnings Conference Call 3 rd Quarter 2010 October 27, 2010 Exhibit 99.1 |
1 Forward-Looking Statement Readers are cautioned that statements contained in this presentation about our and our subsidiaries' future performance, including future revenues, earnings, strategies, prospects, consequences and all other statements that are not purely historical, are forward-looking statements for purposes of the safe harbor provisions under The Private Securities Litigation Reform Act of 1995. When used herein, the words “anticipate”, “intend”, “estimate”, “believe”, “expect”, “plan”, “should”, “hypothetical”, “potential”, “forecast”, “project”, variations of such words and similar expressions are intended to identify forward-looking statements. Although we believe that our expectations are based on reasonable assumptions, they are subject to risks and uncertainties and we can give no assurance they will be achieved. The results or developments projected or predicted in these statements may differ materially from what may actually occur. Factors which could cause results or events to differ from current expectations include, but are not limited to: • Adverse changes in energy industry law, policies and regulation, including market structures, transmission planning and cost allocation rules, including rules regarding who is permitted to build transmission going forward, and reliability standards • Any inability of our transmission and distribution businesses to obtain adequate and timely rate relief and regulatory approvals from federal and state regulators. • Changes in federal and state environmental regulations that could increase our costs or limit operations of our generating units. • Changes in nuclear regulation and/or developments in the nuclear power industry generally that could limit operations of our nuclear generating units. • Actions or activities at one of our nuclear units located on a multi-unit site that might adversely affect our ability to continue to operate that unit or other units located at the same site. • Any inability to balance our energy obligations, available supply and trading risks. • Any deterioration in our credit quality. • Availability of capital and credit at commercially reasonable terms and conditions and our ability to meet cash needs. • Any inability to realize anticipated tax benefits or retain tax credits. • Changes in the cost of, or interruption in the supply of, fuel and other commodities necessary to the operation of our generating units. • Delays in receipt of necessary permits and approvals for our construction and development activities. • Delays or unforeseen cost escalations in our construction and development activities. • Adverse changes in the demand for or price of the capacity and energy that we sell into wholesale electricity markets, • Increase in competition in energy markets in which we compete. • Adverse performance of our decommissioning and defined benefit plan trust fund investments and changes in discount rates and funding requirements. • Changes in technology and customer usage patterns. For further information, please refer to our Annual Report on Form 10-K, including Item 1A. Risk Factors, and subsequent reports on Form 10-Q and Form 8-K filed with the Securities and Exchange Commission. These documents address in further detail our business, industry issues and other factors that could cause actual results to differ materially from those indicated in this presentation. In addition, any forward-looking statements included herein represent our estimates only as of today and should not be relied upon as representing our estimates as of any subsequent date. While we may elect to update forward-looking statements from time to time, we specifically disclaim any obligation to do so, even if our internal estimates change, unless otherwise required by applicable securities laws. |
2 GAAP Disclaimer PSEG presents Operating Earnings in addition to its Net Income reported in accordance with accounting principles generally accepted in the United States (GAAP). Operating Earnings is a non-GAAP financial measure that differs from Net Income because it excludes gains or losses associated with Nuclear Decommissioning Trust (NDT), Mark-to-Market (MTM) accounting, and other material one-time items. PSEG presents Operating Earnings because management believes that it is appropriate for investors to consider results excluding these items in addition to the results reported in accordance with GAAP. PSEG believes that the non-GAAP financial measure of Operating Earnings provides a consistent and comparable measure of performance of its businesses to help shareholders understand performance trends. This information is not intended to be viewed as an alternative to GAAP information. The last two slides in this presentation include a list of items excluded from Income from Continuing Operations to reconcile to Operating Earnings, with a reference to that slide included on each of the slides where the non-GAAP information appears. |
PSEG 2010 Q3 Review Ralph Izzo Chairman, President and Chief Executive Officer * * * * * * * * |
 4 Q3 2010 Earnings Summary - - Discontinued Operations, Net of Tax $ 0.92 $ 1.06 EPS from Operating Earnings* $ 488 $ 567 Net Income 488 567 Income from Continuing Operations 24 29 Reconciling Items, Net of Tax $ 464 $ 538 Operating Earnings 2009 2010 $ millions (except EPS) Quarter Ended September 30 * See page 36 for Items excluded from Income from Continuing Operations to reconcile to Operating Earnings. |
 5 YTD Earnings Summary - - Discontinued Operations, Net of Tax $ 2.50 $ 2.55 EPS from Operating Earnings* $1,243 $1,282 Net Income 1,243 1,282 Income from Continuing Operations (21) (12) Reconciling Items, Net of Tax $ 1,264 $1,294 Operating Earnings 2009 2010 $ millions (except EPS) Nine Months Ended September 30 * See page 36 for Items excluded from Income from Continuing Operations to reconcile to Operating Earnings. |
 6 PSEG – Q3 2010: Company Execution Strong in Quarter Q3 2010 results Higher generation output Cost control efforts aiding margins New utility rates in effect Hottest New Jersey summer on record Challenging markets Still weak economy Weak natural gas price environment; customer migration Sharpened business focus Texas generating assets – process continuing for potential sale Revised capital spending forecast reflects updated Transmission projects 2 additional lease terminations; 1 cross border lease remaining Company position continues to receive recognition World Index - Dow Jones Sustainability Index Carbon Disclosure Project |
PSEG 2010 Q3 Operating Company Review Caroline Dorsa Executive Vice President and Chief Financial Officer * * * * * * * * |
 8 2008 Operating Earnings* 2009 Operating Earnings* 2010 Guidance $3.00 - $3.25 PSEG – Maintaining 2010 Guidance $3.03 * See page 37 for Items excluded from Income from Continuing Operations to reconcile to Operating Earnings. $3.12 |
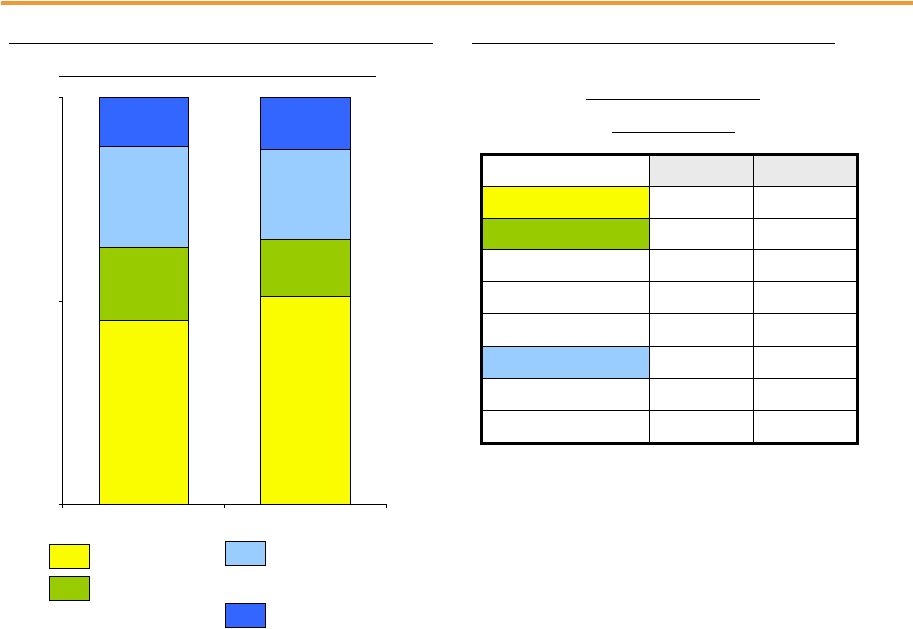
 9 Q3 Operating Earnings by Subsidiary $ 464 20 (1) 87 $ 358 2009 $ 538 4 24 155 $355 2010 Operating Earnings Earnings per Share 0.04 0.01 Enterprise $ 0.92 $ 1.06 Operating Earnings* - 0.05 PSEG Energy Holdings 0.17 0.30 PSE&G $ 0.71 $ 0.70 PSEG Power 2009 2010 $ millions (except EPS) Quarter Ended September 30 * See page 36 for Items excluded from Income from Continuing Operations to reconcile to Operating Earnings. |
 10 YTD Operating Earnings by Subsidiary $ 1,264 17 30 253 $ 964 2009 $1,294 12 43 347 $892 2010 Operating Earnings Earnings per Share 0.03 0.02 Enterprise $ 2.50 $ 2.55 Operating Earnings* 0.06 0.09 PSEG Energy Holdings 0.50 0.68 PSE&G $ 1.91 $ 1.76 PSEG Power 2009 2010 $ millions (except EPS) Nine Months Ended September 30 * See page 36 for Items excluded from Income from Continuing Operations to reconcile to Operating Earnings. |
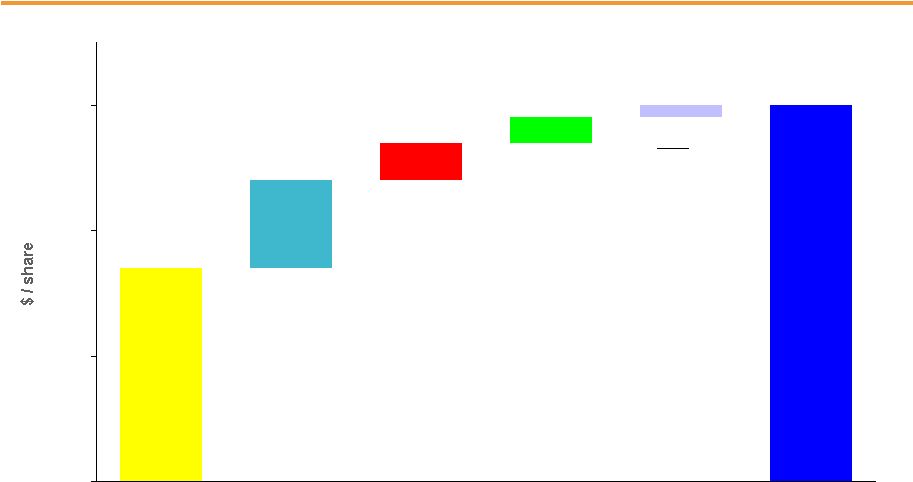
 11 $1.06 (0.03) 0.05 0.13 (0.01) $0.92 0.00 0.20 0.40 0.60 0.80 1.00 1.20 PSEG EPS Reconciliation – Q3 2010 versus Q3 2009 Q3 2010 Operating Earnings* Q3 2009 Operating Earnings* Higher Generating Volume Offset by Lower Prices .00 Nuclear (.03) Weather .03 Migration (.01) WPT (.02) Other .02 PSEG Power Electric & Gas Margin (Including Rate Increases) .06 Transmission Margin .01 Weather .03 O&M .02 Other .01 PSE&G PSEG Energy Holdings Enterprise 2009 Debt Exchange Cost Eliminated in Consolidation .04 Interest .01 •See page 36 for Items excluded from Income from Continuing Operations to reconcile to Operating Earnings. 2009 Debt Exchange Benefit Eliminated in Consolidation (.04) Interest .01 |
 12 $2.50 (0.15) 0.18 0.03 (0.01) $2.55 1.00 1.25 1.50 1.75 2.00 2.25 2.50 2.75 PSEG EPS Reconciliation – YTD 2010 versus YTD 2009 Nine Months Ended 9/30/2010 Operating Earnings* Nine Months Ended 9/30/2009 Operating Earnings* Interest .03 2009 Debt Exchange Benefit Eliminated in Consolidation (.04) Higher volume offset by lower prices (.05) Weather .05 Migration (.03) Economy (.01) Nuclear (.01) WPT (.07) ; BGSS (.01) O&M (.01); Other .03 SO 2 Impairment (.02) Increase in effective tax rate related to healthcare legislation (.02) PSEG Power Electric & Gas Margin (Including Rate Increases) .07 Transmission .03 Other .02 Appliance Service .01 Weather .02 O&M .01 Depreciation, Taxes & Other .02 PSE&G PSEG Energy Holdings Enterprise 2009 Lease Sales & Other Investments (.06) Interest .03 Effective Tax Rate and Other .02 2009 Debt Exchange Cost Eliminated in Consolidation .04 * See page 36 for Items excluded from Net Income to reconcile to Operating Earnings. |
PSEG Power 2010 Q3 Review * * * * * * * * * * |
 14 PSEG Power – Q3 2010 EPS Summary 2 17 19 Mark-to-Market, Net of Tax 3 7 10 NDT Funds Related Activity, Net of Tax $ 99 $ 1,564 $1,663 Operating Revenues $ (0.01) $ 0.71 $ 0.70 EPS from Operating Earnings* $ 2 $ 382 $ 384 Net Income (3) 358 355 Operating Earnings Variance Q3 2009 Q3 2010 $ millions (except EPS) * See page 36 for Items excluded from Income from Continuing Operations to reconcile to Operating Earnings. |
 15 $0.70 0.02 0.02 (0.05) $0.71 0.00 0.25 0.50 0.75 1.00 Nuclear (.03) WPT (.02) PSEG Power EPS Reconciliation – Q3 2010 versus Q3 2009 Q3 2010 Operating Earnings* Q3 2009 Operating Earnings* Weather .03 Higher Generation Volumes Offset by Lower Prices .00 Migration (.01) * See page 36 for Items excluded from Income from Continuing Operations to reconcile to Operating Earnings. Rabbi Trust Gains .01 Taxes .01 |
 16 PSEG Power – Generation Measures 7,309 7,738 3,131 2,241 7,409 6,253 0 10,000 20,000 2010 2009 Quarter Ended September 30 Total Nuclear Total Coal* Total Oil & Natural Gas * Includes figures for Pumped Storage. PSEG Power – Generation (GWh) 16,232 17,849 22,577 22,751 8,647 6,389 18,571 15,296 0 10,000 20,000 30,000 40,000 50,000 2010 2009 Nine Months Ended September 30 44,436 49,795 |
 17 PSEG Power – Generation Measures 45 51 18 14 25 13 22 12 0 50 100 2010 2009 Nine Months Ended September 30 Total Nuclear Total Coal* Oil & Natural Gas – excluding Texas * Includes figures for Pumped Storage PSEG Power – % Generation Contribution Oil & Natural Gas - Texas PSEG Power – Capacity Factors (%) 45% 47% Texas 43% 56% PJM and NY Combined Cycle 41% 86% 43% 93.1% 2010 25% CT 79% PA 23% NJ Coal 93.8% Nuclear** 2009 Nine Months Ended September 30 **Total Nuclear Fleet - PS Share |
 18 PSEG Power – Fuel Costs 232 318 Oil & Gas 97 122 Coal 22.67 26.95 $ / MWh 16,232 17,849 Total Generation (GWh) 368 481 Total Fuel Cost 39 41 Nuclear Total Fossil ($ millions) 329 440 2009 2010 Quarter Ended September 30 PSEG Power – Fuel Costs 641 817 Oil & Gas 240 336 Coal 22.30 25.65 $ / MWh 44,436 49,795 Total Generation (GWh) 991 1,277 Total Fuel Cost 110 124 Nuclear Total Fossil ($ millions) 881 1,153 2009 2010 Nine Months Ended September 30 |
 19 PSEG Power – Gross Margin Performance $0 $25 $50 $75 2010 2009 $0 $25 $50 $75 2010 2009 $64 $57 Quarter Ended September 30 Nine Months Ended September 30 $63 $55 In Q3, PJM total gross margin was sustained by strong weather-related demand, with higher volumes offsetting lower realized prices Salem Unit 1’s 17-day unplanned outage reduced nuclear generation and earnings by $0.03 per share Low spark spreads, partially offset by increase in gas-fired generation. $18 New York Regional Performance $41 $15 $856 Gross Margin ($M) Q3 2010 Performance Region Generation flat with year-ago levels. Texas Generation increased with strong weather-related demand. New England Q3 contribution to gross margin ($M) flat versus year ago. A 10% increase in generation offsetting lower realized prices and the cost of the Salem nuclear outage. PJM PSEG Power Gross Margin ($/MWh)* *Excludes Texas. |
 20 PSEG Power – Q3 Operating Highlights 10% increase in total output Weighted average combined cycle capacity factor of 59% vs. 52% in Q3 2009 Weighted average coal capacity factor of 60% vs 43% in Q3 2009 Q3 nuclear fleet capacity factor of 89.4%; Hope Creek refueling outage underway in Q4 2010 Operations Financial Power markets affected by hottest summer on record in NJ, weak economic growth, and an excess supply of gas Actively managing coal inventory Exploring the sale of Texas gas-fired assets (2,000 MW) New, 5-year $100 million bilateral credit facility Regulatory and Market Environment |
PSE&G 2010 Q3 Review * * * * * * * * * * |
 22 PSE&G – Q3 2010 Earnings Summary (35) 1,717 1,682 Total Operating Expenses 1 30 31 Taxes Other than Income Taxes Operating Expenses (52) 1,167 1,115 Energy Costs (24) 351 327 Operation & Maintenance 40 169 209 Depreciation & Amortization $ 0.13 $ 0.17 $ 0.30 EPS from Operating Earnings* $ 68 $ 87 $ 155 Operating Earnings / Net Income $ 64 $ 1,943 $ 2,007 Operating Revenues Variance Q3 2009 Q3 2010 $ millions (except EPS) * See page 36 for Items excluded from Income from Continuing Operations to reconcile to Operating Earnings. |
 23 $0.17 0.07 0.03 0.02 0.01 $0.30 0.00 0.10 0.20 0.30 PSE&G EPS Reconciliation – Q3 2010 versus Q3 2009 Q3 2010 Operating Earnings* Q3 2009 Operating Earnings* Weather .03 O&M * See page 36 for Items excluded from Income from Continuing Operations to reconcile to Operating Earnings. Electric & Gas Margin (Including Rate Increases) .06 Transmission .01 Other Rabbi Trust Gains .02 Taxes .01 D&A (.01) Interest (.01) |
 24 56 33 38 27 5 147 55 0 50 100 150 200 250 2010 Normal 2009 July August September Q3 2010 Was The Warmest Summer on Record in New Jersey Third Quarter Number of Hours Where the Temperature was Equal or Greater than 90 o F 40 230 93 … with peak-producing hours up by over 4.5x 2009 levels |
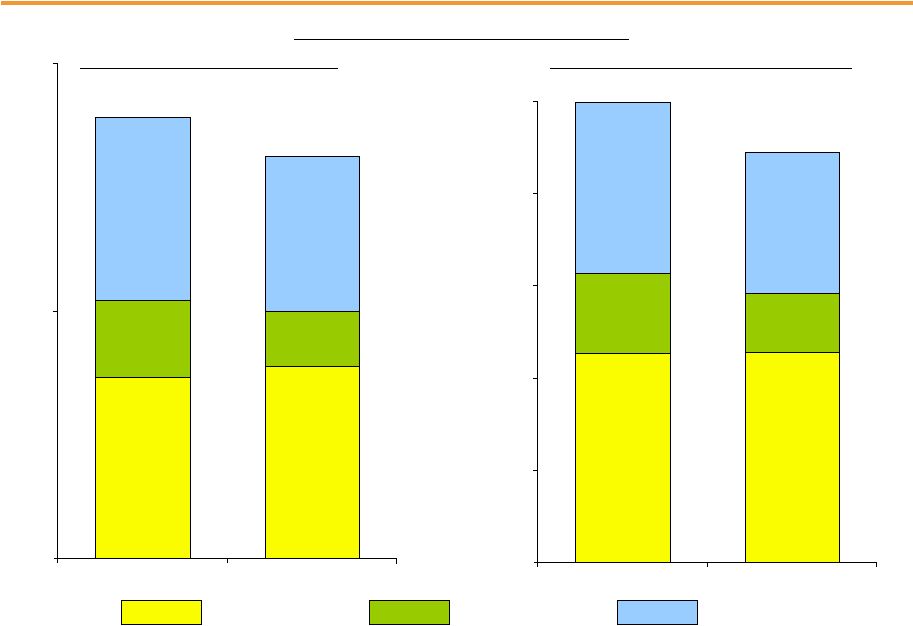
 25 PSE&G Capital Spending: 2010-2013 PSE&G Capital Spending: 2010-2013 $6,130 $1,590 $1,490 $1,450 $1,600 Total $890 $30 $190 $320 $350 Renewables/EMP $2,170 $420 $390 $460 $900 Distribution $3,070 $1,140 $910 $670 $350 Transmission 2010-2013E 2013E 2012E 2011E 2010E* ($ Millions) Capital program provides growth in rate base of 9.5% per year from 2009 base of $7.3 Billion Transmission investment represents 50% of planned capex over 2010-2013 and is expected to comprise 31% of PSE&G rate base by 2013 Supportive regulatory treatment with contemporaneous recovery should align earnings growth with investment *Estimate |
 26 PSE&G – Q3 Operating Highlights PSE&G Electric and Gas rate increases effective in June and July 2010, respectively B-R-H Transmission Line re-configured to a 230 KV project with underground components; 2015 in-service date Reliability projects related to the S-R Transmission in-service delay identified EMP review underway; 2011 update expected Updated PSE&G Capital Forecast for 2010-2013 calls for $6.1 Billion investment program Rate Base Growth (CAGR) of 9.5% per year Distribution’s average return on equity for the 12 months ended September 30, 2010 was 9.5% Operations Financial Economic indicators have yet to point to sustained recovery Electric sales skewed by the hottest summer on record in NJ Temperature Humidity Index was 30% above normal and 68% above 2009’s mild summer Regulatory and Market Environment |
PSEG Energy Holdings 2010 Q3 Review * * * * * * * * * * |
 28 PSEG Energy Holdings – Q3 2010 Earnings Summary - - - Discontinued Operations, Net of Tax - - - Mark-to-Market, Net of Tax $0.05 $ 0.00 $ 0.05 EPS from Operating Earnings* $ 25 $ (1) $ 24 Net Income $ 25 $ (1) $ 24 Operating Earnings Variance Q3 2009 Q3 2010 $ millions (except EPS) * See page 36 for Items excluded from Income from Continuing Operations to reconcile to Operating Earnings. |
 29 $0.05 0.05 (0.01) 0.01 $0.0 0.00 0.01 0.02 0.03 0.04 0.05 0.06 PSEG Energy Holdings EPS Reconciliation – Q3 2010 versus Q3 2009 Q3 2010 Operating Earnings* Q3 2009 Operating Earnings* G&A Taxes Other * See page 36 for Items excluded from Income from Continuing Operations to reconcile to Operating Earnings. Resources Global Holdings Taxes 2009 Debt Exchange Cost Eliminated in Consolidation .04 Interest .01 |
 30 PSEG Energy Holdings – Q3 Operating Highlights Financial Termination of 2 additional leases in Q3 reduced net cash exposure at quarter-end to $330 million; $320 million of cash on deposit at IRS Solar projects in Ohio and Florida placed in-service; NJ solar project is operating as planned Continuing to review opportunities for additional investments in solar under PPA arrangements In December 2010, Holdings will redeem the remaining $127 Million of its 8.5% Senior Notes |
 31 $660 ~$1,200 ~$10 ~$330 $- $500 $1,000 $1,500 2008 2009 2010 Cash Exposure Net of $320M of IRS Deposits 2009 Activities Terminated 12 LILO/SILO leases 2010 Activities Terminated 4 LILO/SILO leases to date Pursue additional lease termination opportunities 2008 Activities Terminated 1 LILO/SILO lease Exposure to our potential lease tax liability… …was reduced with aggressive asset management. 1 5 17 # of LILO/SILO Leases Remaining* 12/31/2008 12/31/2009 9/30/2010 *LILO/SILO leases are international leveraged leases. |
PSEG * * * * * * * * * * |
 33 2010 Operating Earnings Guidance By Subsidiary $ 3.12 $ 1,579 $ 10 $ 43 $ 321 $ 1,205 2009A* $ 3.00 – $ 3.25 $ 1,520 – $ 1,645 $ 5 – $15 $ 30 – $ 40 $ 425 – $ 455 $ 1,060 – $ 1,135 2010E Enterprise Earnings per Share Operating Earnings* PSEG Energy Holdings PSE&G PSEG Power $ millions (except EPS) * See page 37 for Items excluded from Income from Continuing Operations to reconcile to Operating Earnings. |
 34 PSEG – Q3 2010 Utility capital spending will result in 9.5% rate base growth CAGR – primarily driven by transmission investment Migration impacts are meeting expectations but accelerating realization of current market Forward price curve is weak and getting weaker |
 35 PSEG Liquidity as of October 20, 2010 PSEG Liquidity as of October 20, 2010 Expiration Total Available Company Facility Date Facility Usage Liquidity 5-Year Credit Facility (Power) Dec-12 $1,600 1 $173 $1,427 5-Year Credit Facility (PSEG) Dec-12 $1,000 2 $14 $986 5-Year Bilateral Facility (Power) Sep-15 $100 $100 $0 2-Year Credit Facility (Power) Jul-11 $350 $0 $350 PSE&G 5-Year Credit Facility Jun-12 $600 3 $0 $600 Total $3,650 $3,363 1 Power Facility reduces by $75 million in 12/2011 2 PSEG Facility reduces by $47 million in 12/2011 3 PSE&G Facility reduces by $28 million in 6/2011 PSEG / Power ($Millions) |
 36 Items Excluded from Income from Continuing Operations to Reconcile to Operating Earnings Please see Page 2 for an explanation of PSEG’s use of Operating Earnings as a non-GAAP financial measure and how it differs from Net Income. Pro-forma Adjustments, net of tax 2010 2009 2010 2009 Earnings Impact ($ Millions) Gain (Loss) on Nuclear Decommissioning Trust (NDT) 10 $ 7 $ 30 $ 1 $ Fund Related Activity (PSEG Power) Gain (Loss) on Mark-to-Market (MTM) (PSEG Power) 19 17 30 (22) Net Reversal of Lease Transaction Reserves (Energy Holdings) - - - - Market Transition Charge Refund (PSE&G) - - (72) - Total Pro-forma adjustments 29 $ 24 $ (12) $ (21) $ Fully Diluted Average Shares Outstanding (in Millions) 507 507 507 507 Per Share Impact (Diluted) Gain (Loss) on NDT Fund Related Activity (PSEG Power) 0.02 $ 0.01 $ 0.06 $ - $ Gain (Loss) on MTM (PSEG Power) 0.04 0.03 0.06 (0.05) Net Reversal of Lease Transaction Reserves (Energy Holdings) - - - - Market Transition Charge Refund (PSE&G) - - (0.14) - Total Pro-forma adjustments 0.06 $ 0.04 $ (0.02) $ (0.05) $ (a) Income from Continuing Operations for the three and nine months ended September 30, 2010 and 2009. December 31, 2009 is equal to Net Income. PUBLIC SERVICE ENTERPRISE GROUP INCORPORATED Reconciling Items Excluded from Continuing Operations to Compute Operating Earnings (Unaudited) For the Three Months Ended For the Nine Months Ended September 30, September 30, (a) |
 37 Items Excluded from Income from Continuing Operations to Reconcile to Operating Earnings Please see Page 2 for an explanation of PSEG’s use of Operating Earnings as a non-GAAP financial measure and how it differs from Net Income. Pro-forma Adjustments, net of tax 2009 2008 Earnings Impact ($ Millions) Gain (Loss) on Nuclear Decommissioning Trust (NDT) Fund Related Activity (PSEG Power) 9 $ (71) $ Gain (Loss) on Mark-to-Market (MTM) (PSEG Power) (25) 16 Lease Transaction Reserves - (490) Net Reversal of Lease Transaction Reserves 29 - Asset Impairments - (13) Premium on Bond Redemption - (1) Total Pro-forma adjustments 13 $ (559) $ Fully Diluted Average Shares Outstanding (in Millions) 507 508 Per Share Impact (Diluted) Gain (Loss) on Nuclear Decommissioning Trust (NDT) Fund Related Activity (PSEG Power) 0.02 $ (0.14) $ Gain (Loss) on Mark-to-Market (MTM) (PSEG Power) (0.05) 0.03 Lease Transaction Reserves - (0.96) Net Reversal of Lease Transaction Reserves 0.05 - Asset Impairments - (0.03) Premium on Bond Redemption - - Total Pro-forma adjustments 0.02 $ (1.10) $ For the Twelve Months Ended December 31, |