 PSEG Public Service Enterprise Group 2011 EEI Financial Conference November 6-9, 2011 Exhibit 99 |
 2 Forward-Looking Statement Readers are cautioned that statements contained in this presentation about our and our subsidiaries' future performance, including future revenues, earnings, strategies, prospects, consequences and all other statements that are not purely historical, are forward-looking statements for purposes of the safe harbor provisions under The Private Securities Litigation Reform Act of 1995. When used herein, the words “will”, “anticipate”, “intend”, “estimate”, “believe”, “expect”, “plan”, “should”, “hypothetical”, “potential”, “forecast”, “project”, variations of such words and similar expressions are intended to identify forward-looking statements. Although we believe that our expectations are based on reasonable assumptions, they are subject to risks and uncertainties and we can give no assurance they will be achieved. The results or developments projected or predicted in these statements may differ materially from what may actually occur. Factors which could cause results or events to differ from current expectations include, but are not limited to: • adverse changes in energy industry law, policies and regulation, including market structures and a potential shift away from competitive markets toward subsidized market mechanisms, transmission planning and cost allocation rules, including rules regarding how transmission is planned and who is permitted to build transmission in the future, and reliability standards, • any inability of our transmission and distribution businesses to obtain adequate and timely rate relief and regulatory approvals from federal and state regulators, • changes in federal and state environmental regulations that could increase our costs or limit our operations, • changes in nuclear regulation and/or general developments in the nuclear power industry, including various impacts from any accidents or incidents experienced at our facilities or by others in the industry that could limit operations of our nuclear generating units, • actions or activities at one of our nuclear units located on a multi-unit site that might adversely affect our ability to continue to operate that unit or other units located at the same site, • any inability to balance our energy obligations, available supply and trading risks, • any deterioration in our credit quality, or the credit quality of our counterparties, including in our leveraged leases, • availability of capital and credit at commercially reasonable terms and conditions and our ability to meet cash needs, • any inability to realize anticipated tax benefits or retain tax credits, • changes in the cost of, or interruption in the supply of, fuel and other commodities necessary to the operation of our generating units, • delays in receipt of necessary permits and approvals for our construction and development activities, • delays or unforeseen cost escalations in our construction and development activities, • adverse changes in the demand for or price of the capacity and energy that we sell into wholesale electricity markets, • increase in competition in energy markets in which we compete, • challenges associated with recruitment and/or retention of a qualified workforce, • adverse performance of our decommissioning and defined benefit plan trust fund investments and changes in discount rates and funding requirements, and • changes in technology and customer usage patterns. For further information, please refer to our Annual Report on Form 10-K, including Item 1A. Risk Factors, and subsequent reports on Form 10-Q and Form 8-K filed with the Securities and Exchange Commission. These documents address in further detail our business, industry issues and other factors that could cause actual results to differ materially from those indicated in this presentation. In addition, any forward-looking statements included herein represent our estimates only as of today and should not be relied upon as representing our estimates as of any subsequent date. While we may elect to update forward-looking statements from time to time, we specifically disclaim any obligation to do so, even if our internal estimates change, unless otherwise required by applicable securities laws. |
 3 GAAP Disclaimer PSEG presents Operating Earnings in addition to its Net Income reported in accordance with accounting principles generally accepted in the United States (GAAP). Operating Earnings is a non-GAAP financial measure that differs from Net Income because it excludes gains or losses associated with Nuclear Decommissioning Trust (NDT), Mark-to-Market (MTM) accounting, and other material one-time items. PSEG presents Operating Earnings because management believes that it is appropriate for investors to consider results excluding these items in addition to the results reported in accordance with GAAP. PSEG believes that the non-GAAP financial measure of Operating Earnings provides a consistent and comparable measure of performance of its businesses to help shareholders understand performance trends. This information is not intended to be viewed as an alternative to GAAP information. The last two slides in this presentation include a list of items excluded from Income from Continuing Operations to reconcile to Operating Earnings, with a reference to that slide included on each of the slides where the non-GAAP information appears. |
 PSEG – Defining the Future Ralph Izzo Chairman, President and Chief Executive Officer Caroline Dorsa Executive Vice President and Chief Financial Officer |
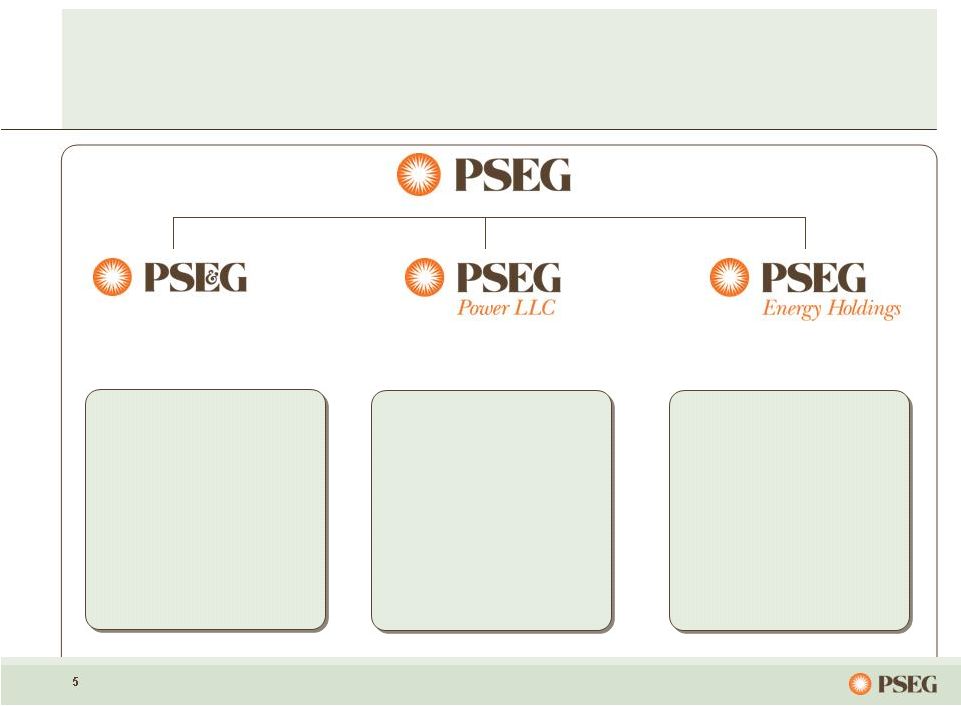 5 PSEG Advantage: Right platform to deliver value to customers and investors… Electric & Gas Delivery and Transmission Regional Wholesale Energy Renewable Investments …with a track record for safeguarding shareholder interests. $17.3B Market Cap* $29.9B Assets** *Market capitalization as of October 31, 2011; asset value as of September 30, 2011. PSE&G positioned to meet NJ’s energy policy and economic growth objectives with a $5.2 billion investment program through 2013 PSEG Power’s low-cost, base load and load following fleet is geographically well positioned and environmentally responsible PSEG Energy Holdings positioned to pursue attractive renewable generation opportunities |
 6 PSEG Advantage: Asset mix, strong operations… Reliability One Award winner for Mid-Atlantic Region – 9 year in a row Regulatory agreements and cost control provide opportunity for improved returns Investment program focused on growth and providing customers with clean, reliable energy PSEG Power PSE&G …with balance sheet to support growth. Asset mix Strong platform open to improvement in the market Well-run, low-cost generating fleet combined with fuel flexibility supports margins Hedging strategy mitigates near-term risk Major environmental compliance capital program completed Actively working to defend competitive power markets Reducing risk Building a platform for renewables and investing through PPA-supported projects International lease investments terminated Resources carefully monitoring remaining traditional leases and other investments PSEG Energy Holdings th |
 7 Year to Date Operating Earnings – by Subsidiary Operating Earnings Earnings per Share $ millions (except EPS) 2011 2010 2011 2010 PSEG Power $ 710 $ 879 $ 1.40 $ 1.73 PSE&G 422 347 0.83 0.69 PSEG Energy Holdings 6 43 0.01 0.09 Enterprise 14 12 0.03 0.02 Operating Earnings* $ 1,152 $ 1,281 $ 2.27 $ 2.53 Nine months ended September 30 * See page 62 for Items excluded from Income from Continuing Operations to reconcile to Operating Earnings. |
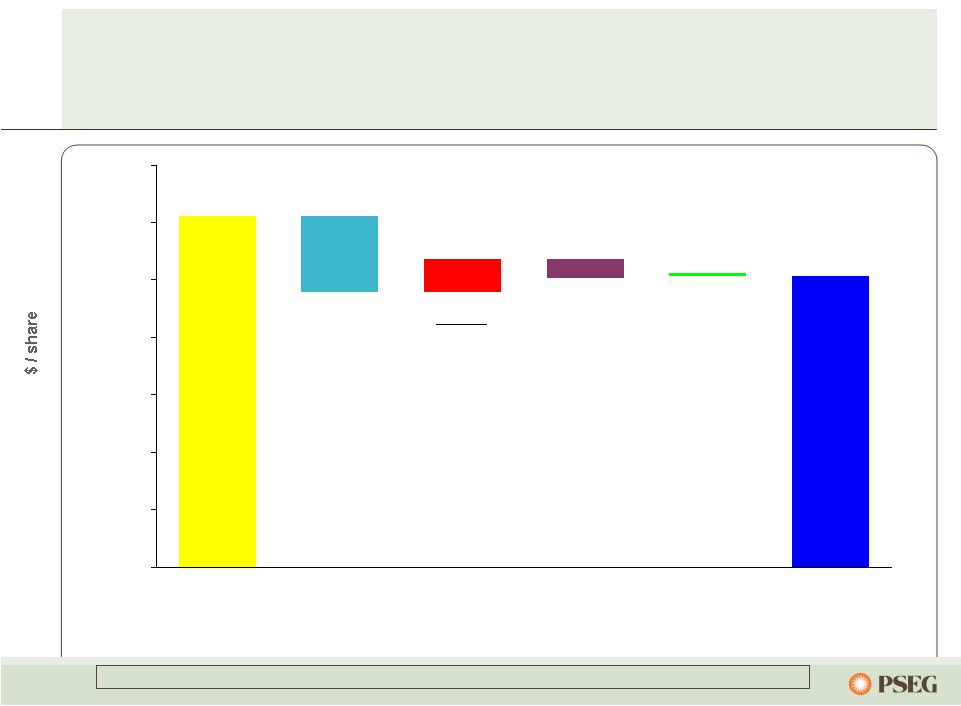 8 $2.53 (0.33) 0.14 (0.08) 0.01 $2.27 1.00 1.25 1.50 1.75 2.00 2.25 2.50 2.75 PSEG EPS Reconciliation – YTD 2011 versus YTD 2010 Nine Months Ended 9/30/2011 Operating Earnings* Nine Months Ended 9/30/2010 Operating Earnings* Interest Lower Pricing (0.22) Lower Generating Volumes (0.03) Migration (0.02) Coal Optimization 0.06 O&M (0.06) D&A and Interest (0.06) WPT 0.02 Other (0.02) PSEG Power Margins: Rate Relief 0.04 Transmission 0.03 Renewables, Capital Stimulus and Other 0.06 O&M 0.04 Weather 0.03 D&A (0.03) Taxes (0.02) Other (0.01) PSE&G PSEG Energy Holdings Enterprise Absence of Gain on Lease Sales and Impairments (0.04) ES&P Investment Write-off (0.01) Other (0.03) * See page 62 for Items excluded from Net Income to reconcile to Operating Earnings. |
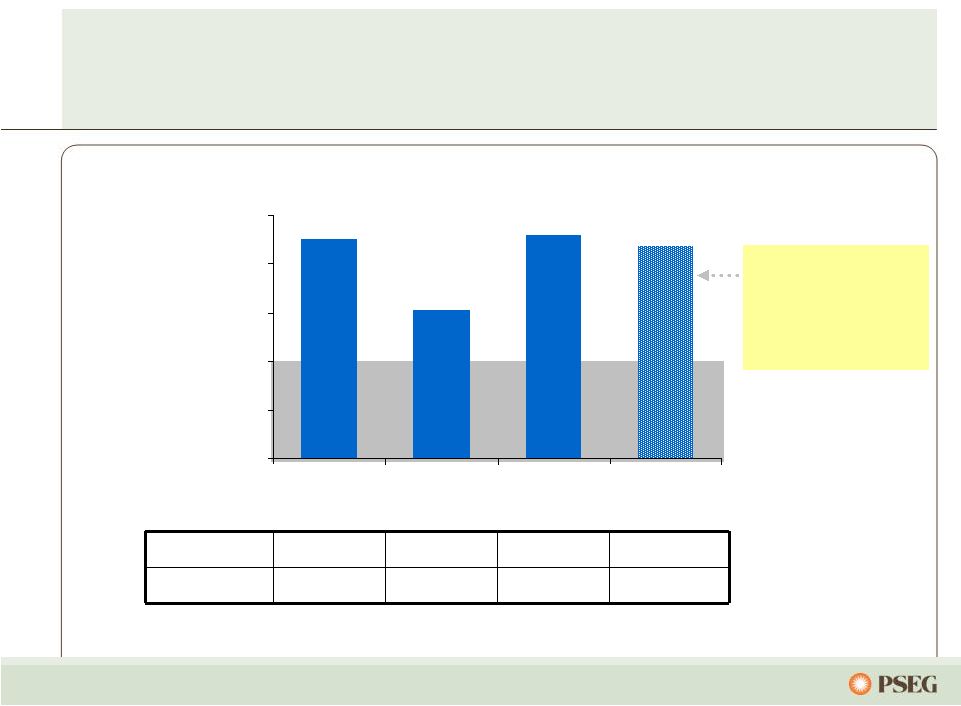
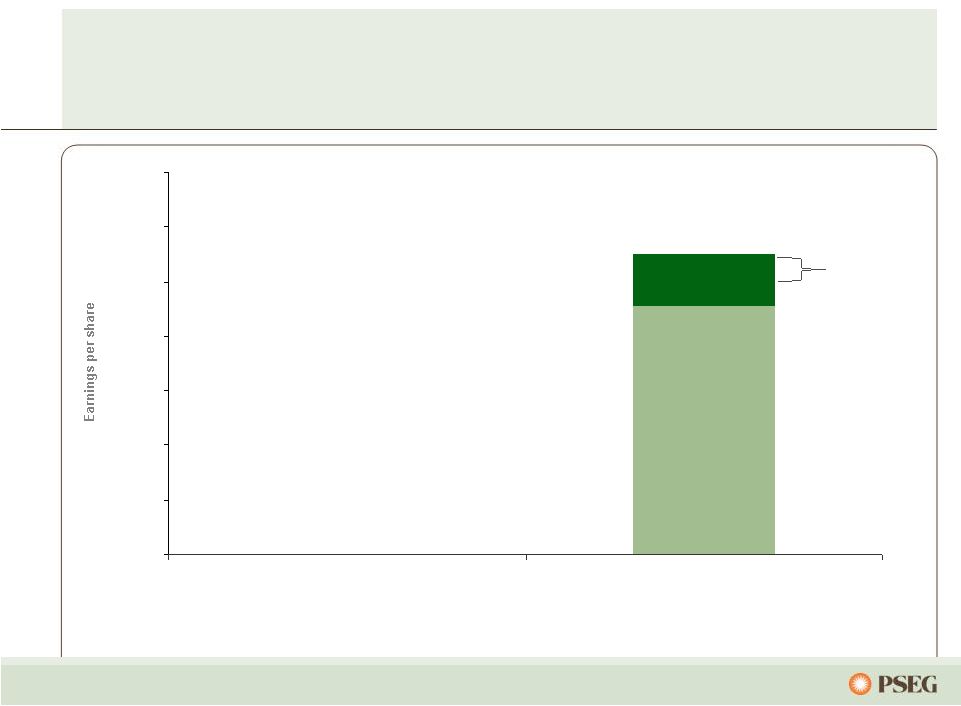  9 Outlook for 2011 Operating Earnings at Upper End of Range $3.12 $0.00 $0.50 $1.00 $1.50 $2.00 $2.50 $3.00 $3.50 2010 Operating Earnings* 2011E Earnings Guidance* * See page 63 for Items excluded from Income from Continuing Operations to reconcile to Operating Earnings. $2.75E $2.50E Strong 9-month results support full-year 2011 EPS at upper end of guidance. $2.27 Operating EPS YTD Actual |
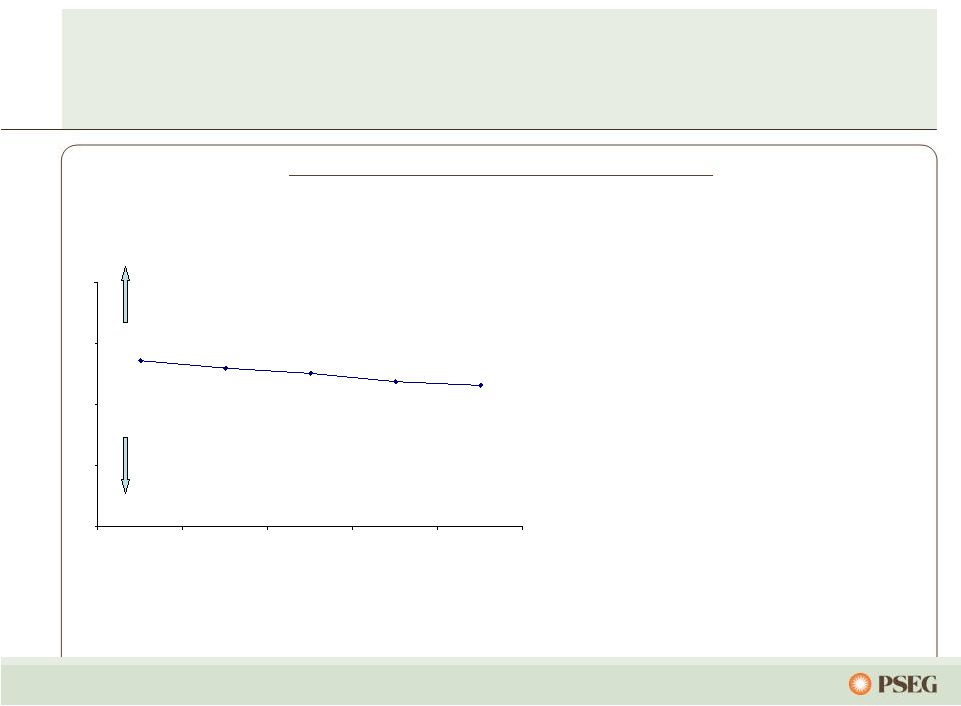
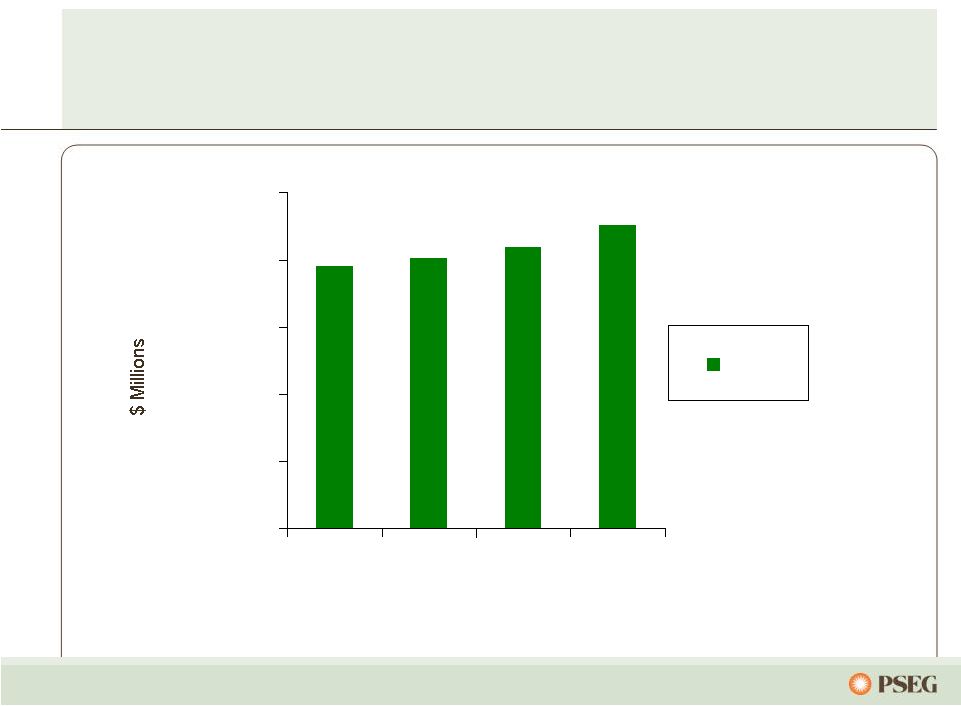 10 $1,000 $1,250 $1,500 $1,750 $2,000 $2,250 2010 2011E 2012E 2013E O&M PSEG Consolidated O&M (1) CAGR (’10-’13) = 1-2% (1) Excludes O&M related to PSE&G clauses. E: Estimate. CAGR: Compound annual growth rate. Focus on expense management… …expected to limit CAGR in O&M, including pension, to 1-2%. |
 11 PSEG Consolidated Debt / Capitalization (1) Includes debt due within one year and short-term debt; excludes Securitization Debt and Non-Recourse Debt. $0 $2 $4 $6 $8 $10 $12 $14 $16 $18 2009 2010 9/30/2011 Equity Debt (1) Preferred Stock Debt 7,311 7,812 7,925 Preferred Stock 80 0 0 Common Shareholders Equity 8,788 9,633 10,159 Debt plus Equity 16,179 17,445 18,084 Debt Ratio 45.2% 44.8% 43.8% (in $Millions) |
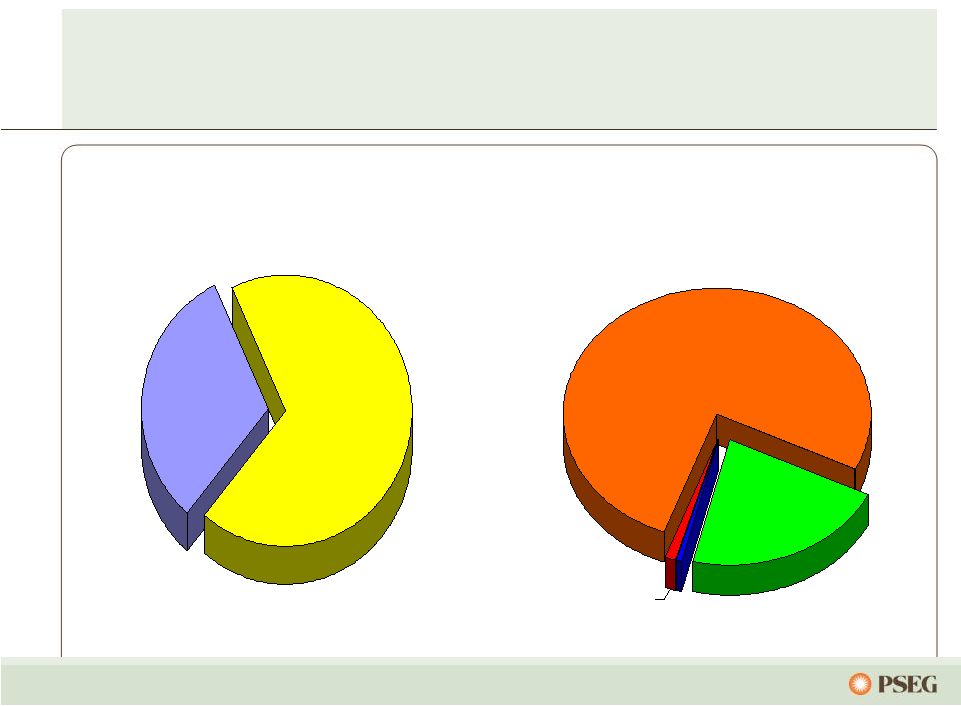 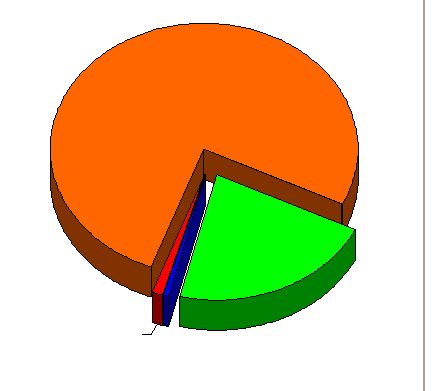 12 Growth $4.72 B 69% Maintenance $2.13 B 31% PSEG’s consolidated capital spending is focused on growth Parent SC $0.07 B 1% Power $1.50 B 22% PSE&G $5.24 B 76% Holdings $0.04 B 1% PSEG 2011-2013E Capital Spending $6.85 Billion* by Subsidiary PSEG 2011-2013E Capital Spending $6.85 Billion* Growth vs. Maintenance Spend *E: Estimate . |
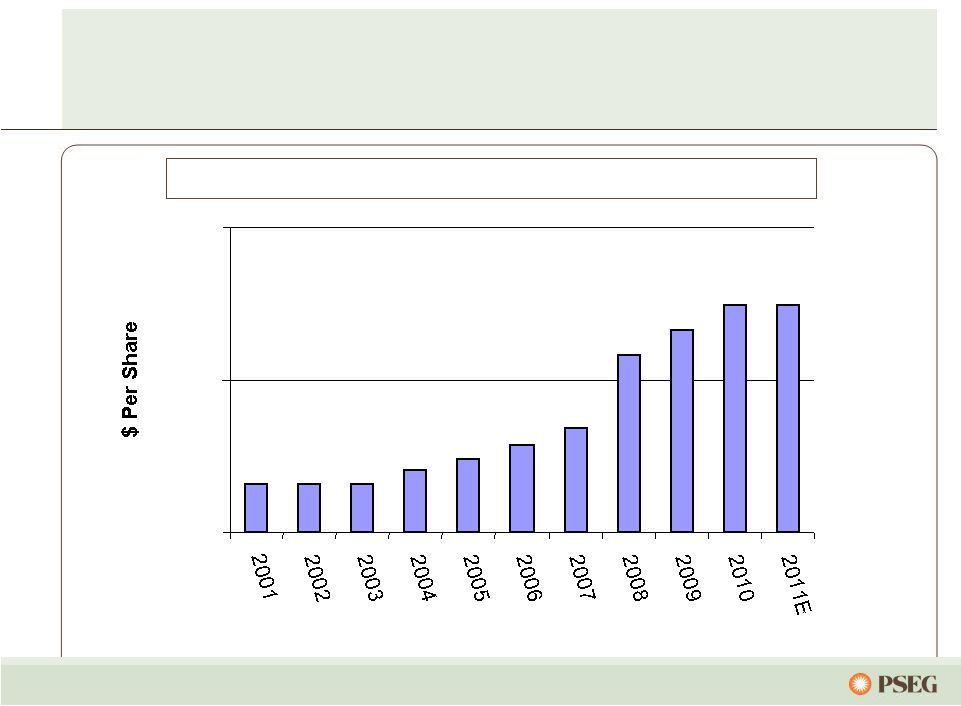 $1.08 $1.08 $1.08 $1.10 $1.12 $1.14 $1.17 $1.29 $1.33 $1.37 $1.37 $1.00 $1.25 $1.50 13 PSEG Dividend – a major source of return to shareholders … PSEG Annual Common Dividend Per Share 2001-2011E … with a 104-year track record. |
 14 PSEG Advantage Well-run, low-cost generating platform open to improvement in power markets Solid operating performance, regulatory agreements, and cost control enhance ability of utility to earn authorized returns Financial Strength Operational Excellence Balance sheet strength, combined with the flexibility and liquidity to finance growth opportunities Our $6.9 billion capital investment program for 2011-2013 is oriented to growth 400 MW of new peaking capacity in New Jersey and Connecticut for 2012 Major environmental compliance capital program completed Disciplined Investment |
 PSEG Power – Review and Outlook |
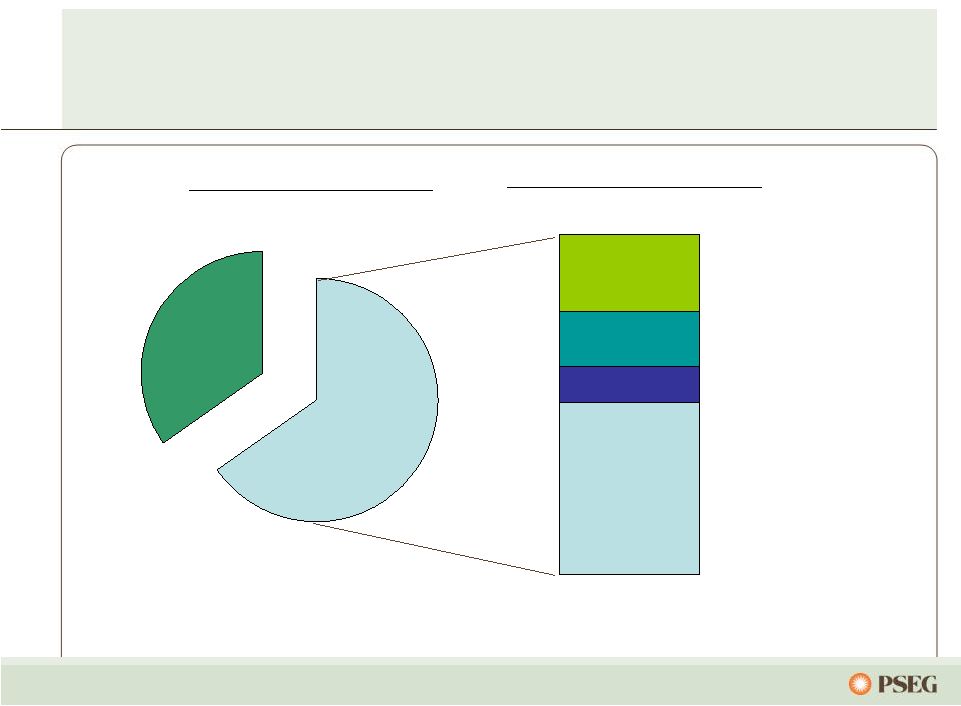
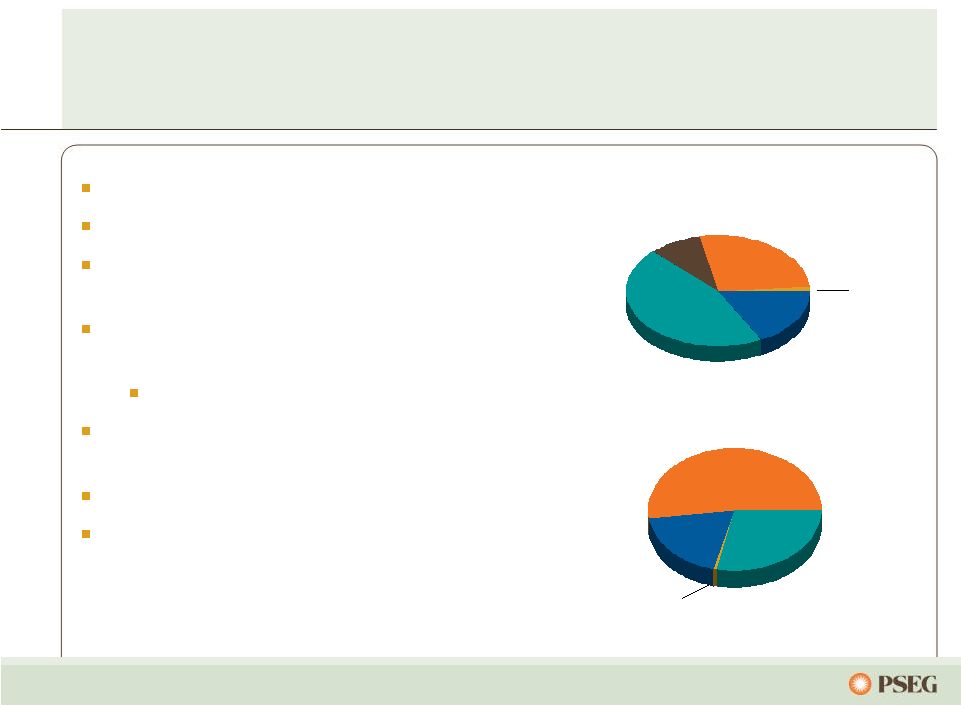 16 Low-cost portfolio Fuel flexibility Regional focus in competitive, liquid markets Assets favorably located near customers/load centers Many units east of PJM constraints Market knowledge and experience to maximize the value of our assets Nuclear plants re-licensed Multiple emission controls installed … and is well-positioned to respond to EPA regulations. 18% 45% 8% Fuel Diversity* Coal Gas Oil Nuclear Pumped Storage 1% Energy Produced* Total GWh: 56,727 52% 19% 28% Pumped Storage & Oil <1% Nuclear Coal Gas Total MW: 13,538 27% 9% * Twelve months ended December 31, 2010. Power has focused on optimizing its assets in a dynamic environment… |
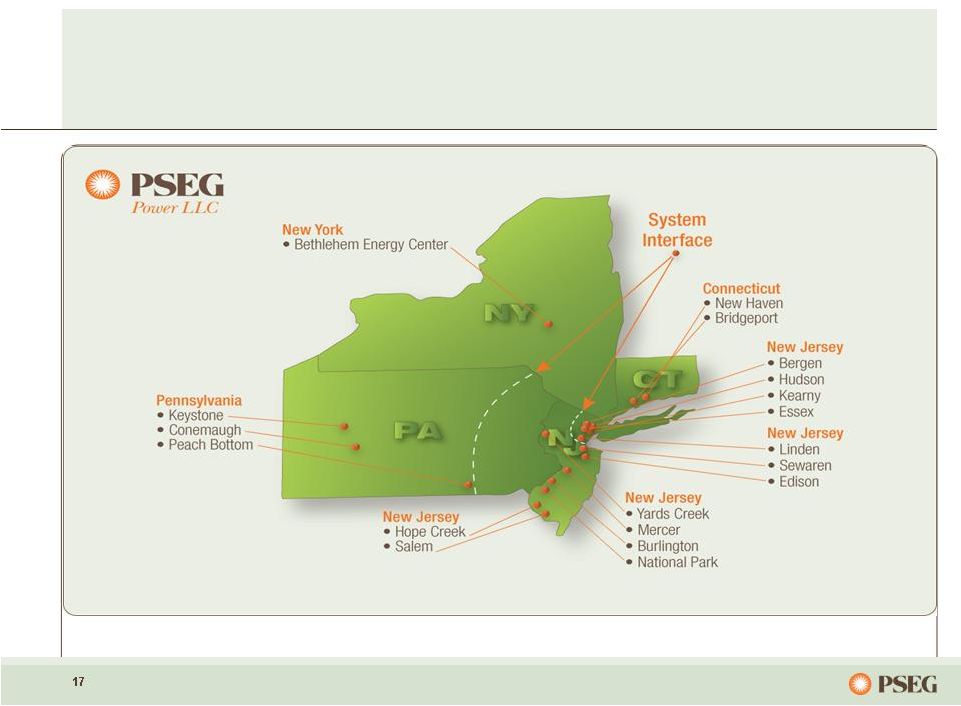 17 ... and the fleet achieved record generation levels in 2010. Power’s Northeast assets are located in attractive markets near load centers... |
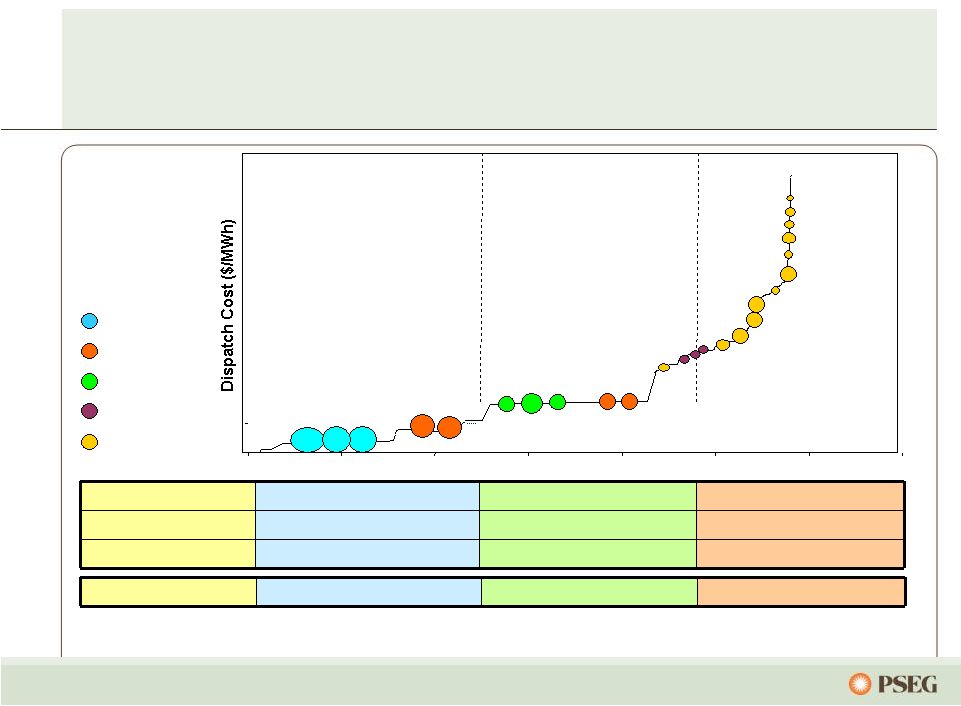 18 … while maintaining fuel optionality under a variety of conditions. Power’s PJM assets along the dispatch curve reduce the risk of serving full requirement load contracts… Energy Revenue X X X Capacity Revenue X X X Ancillary Revenue X X Dual Fuel X X Peaking units Load following units Nuclear Coal Combined Cycle Steam Peaking Baseload units Illustrative Salem Hope Creek Keystone Conemaugh Hudson 2 Linden 1,2 Burlington 8-9-11 Edison 1-2-3 Essex 10-11-12 Bergen 1 Sewaren 1-4 Hudson 1 Mercer 1, 2 Bergen 2 Sewaren 6 Mercer 3 Kearny 10-11 Linden 5-8 / Essex 9 Burlington 12 / Kearny 12 Peach Bottom Yards Creek National Park Salem 3 Bergen 3 |
 19 19 -$10 $0 $10 $20 $30 $40 $50 $0 $10 $20 $30 $40 $50 $60 $70 2005 2006 2007 2008 2009 2010 2011 2012 2013 Annual Average Historical Monthly Forecast Note: Forward prices as of October 2011. PJM Western Hub Spark Spread (On-Peak – Henry Hub x 7.5 Heat Rate) PJM Western Hub Dark Spread (RTC – Central Appalachian Coal x 10 Heat Rate) … while forward dark spreads have remained low. Forward spark spreads have increased significantly from earlier this year… |
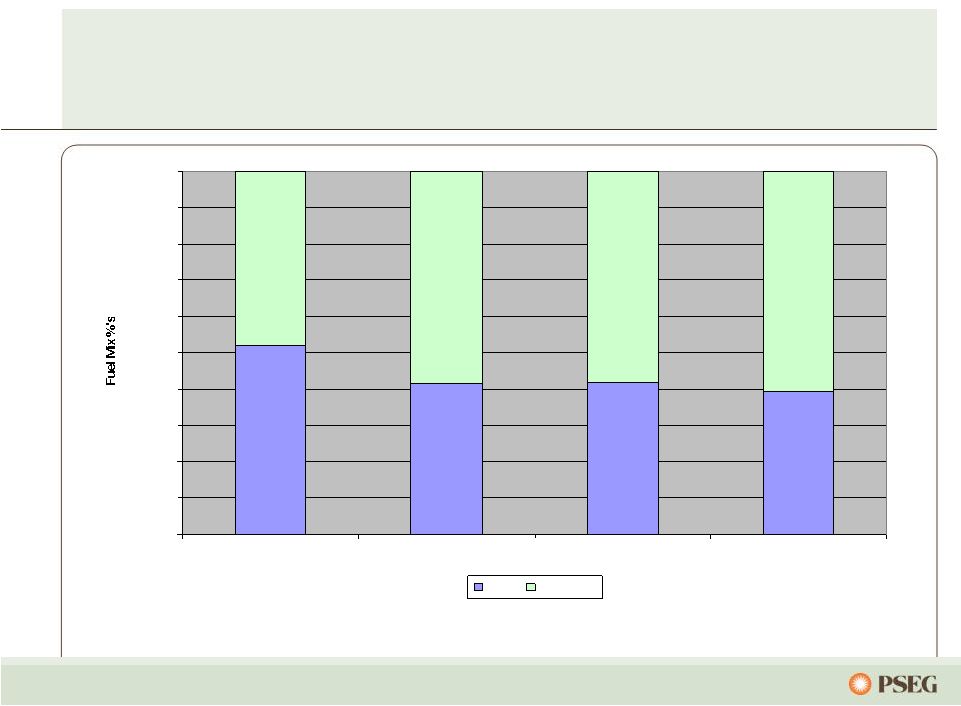 20 Power’s fleet benefits from fuel mix and dispatch flexibility … Coal/Gas fuel mix has changed to ~40/60 due to gas commodity pricing vs coal. 52% 42% 42% 39% 48% 58% 58% 61% 0% 10% 20% 30% 40% 50% 60% 70% 80% 90% 100% 2008 2009 2010 2011 July YTD Coal Gas CC |
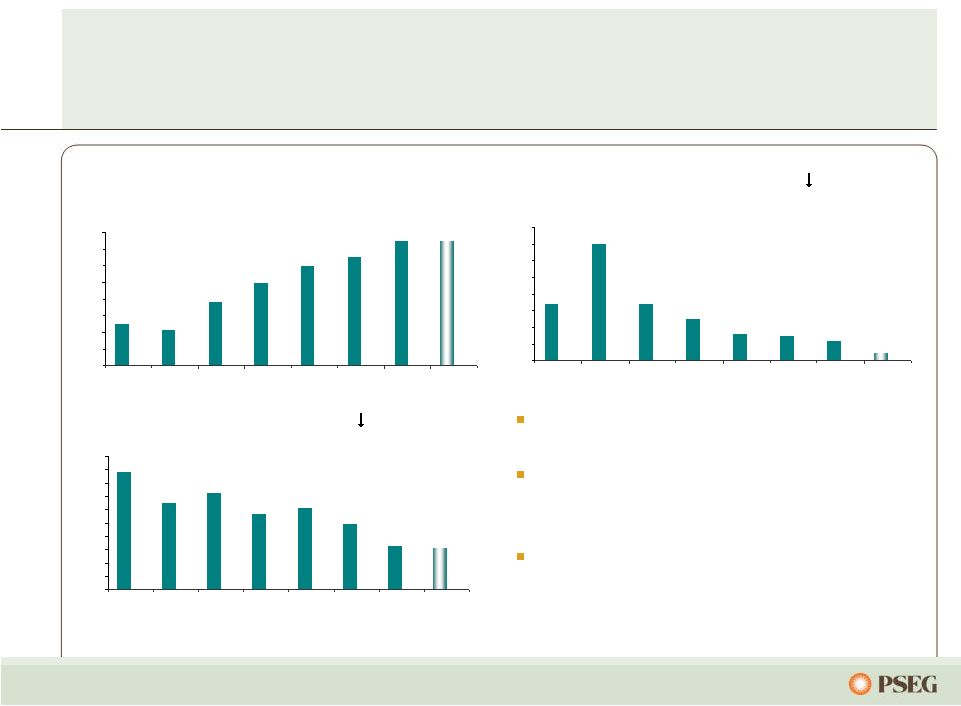
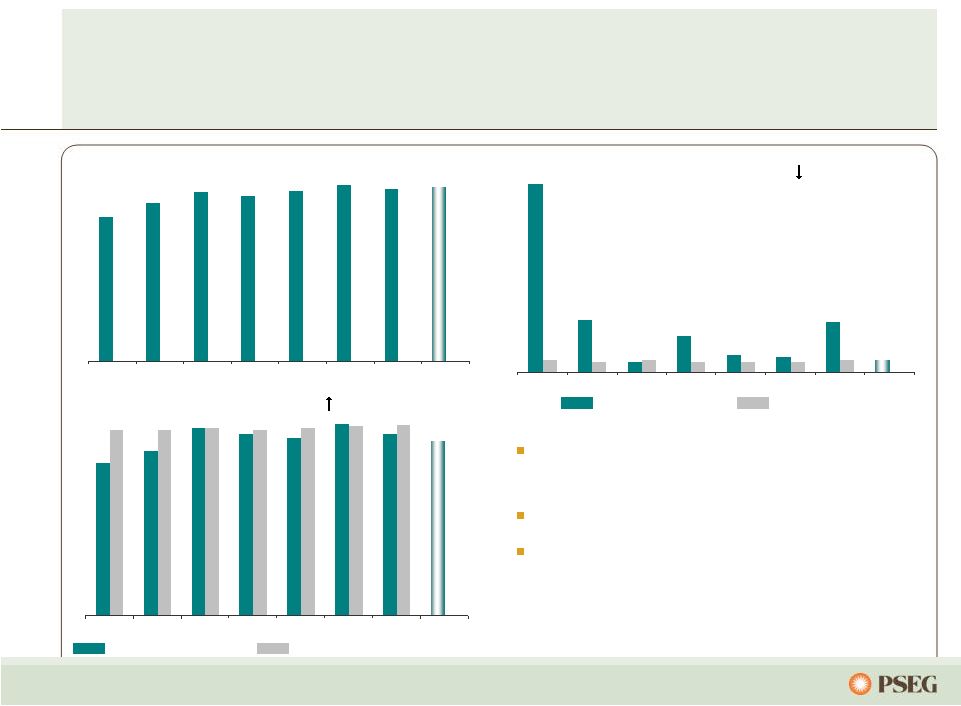 st st 21 11.1 3.1 0.6 2.1 1.0 0.9 3.0 0.7 0.7 0.6 0.7 0.6 0.6 0.6 0.7 2004 2005 2006 2007 2008 2009 2010 2011 E 24.7 27.3 29.1 28.4 29.3 30.3 29.6 30.0 2004 2005 2006 2007 2008 2009 2010 2011 E 79.0 85.0 97.097.0 94.0 91.7 99.098.0 93.9 90.3 96.0 96.0 96.0 97.0 98.5 2004 2005 2006 2007 2008 2009 2010 2011 E** Salem Unit 2 set a new all time generation record Five year average generation was 29 GWh Salem 1 transformer forced outage in 2010 impacted forced loss rate by ~ 60% … as we maintain our drive for excellence. INPO Index ( ) NJ Units 1 Quartile NJ Units * Total PS share nuclear generation **Index revised Jan 2011; average scores 4-7 points lower Nuclear Generation Output* (000’s GWh) Forced Loss Rate ( ) (%) Our nuclear performance has improved… 1 Quartile |
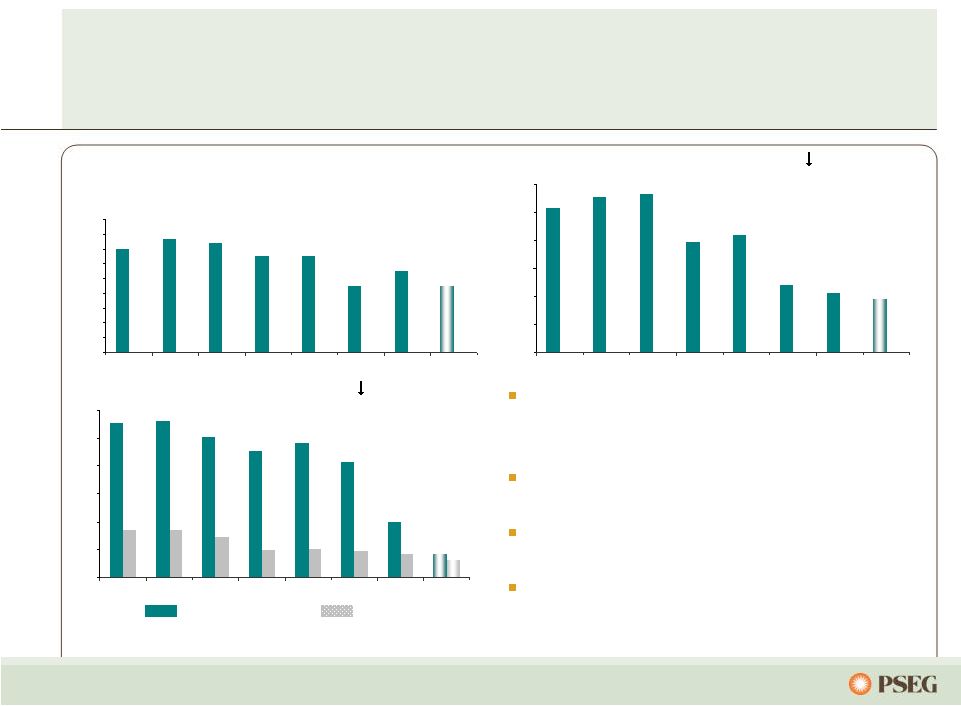 22 Power’s coal fleet has seen significant efficiency improvements… 14 15 15 13 13 9 11 9 0 2 4 6 8 10 12 14 16 18 2004 2005 2006 2007 2008 2009 2010 2011 E 10.3 11.1 11.3 7.9 8.4 4.8 4.2 3.8 0 2 4 6 8 10 12 2004 2005 2006 2007 2008 2009 2010 2011 E 1.11 1.12 1.01 0.91 0.96 0.83 0.4 0.34 0.34 0.29 0.20 0.21 0.19 0.17 0.13 0.17 0 0.2 0.4 0.6 0.8 1 1.2 2004 2005 2006 2007 2008 2009 2010 2011 E Market conditions were beneficial to increased output in 2010 Forced outage rate continues to improve Environmental footprint upgraded with BET BET coal flexibility … as back-end technology investment has prepared us for the future. Output (000’s GWh) Forced Outage Rate ( ) (% EFORD) SO 2 and NO x Rates ( ) (lb/mmbtu) SO2 NO x |
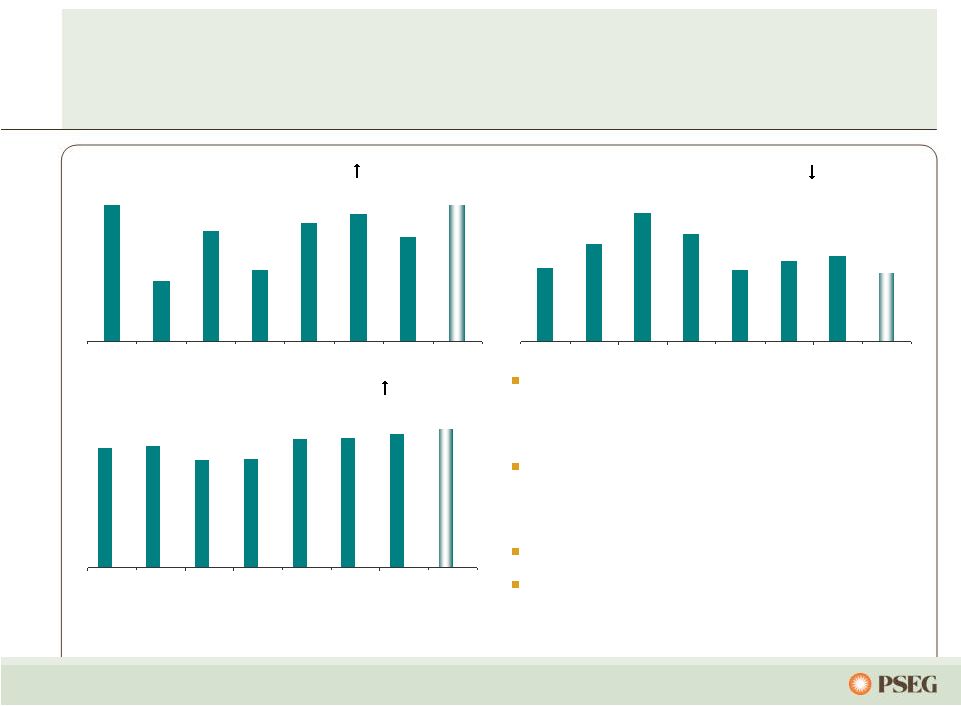
 23 Power’s combined cycle fleet benefits from operating enhancements… 5 4 8 10 12 13 15 15 0 2 4 6 8 10 12 14 16 2004 2005 2006 2007 2008 2009 2010 2011 E 3.4 7 3.4 2.5 1.6 1.5 1.2 0.46 0 1 2 3 4 5 6 7 8 2004 2005 2006 2007 2008 2009 2010 2011 E 8079 7847 7928 7768 7810 7691 7533 7514 7200 7300 7400 7500 7600 7700 7800 7900 8000 8100 8200 2004 2005 2006 2007 2008 2009 2010 2011 E Output (000’s GWh) Forced Outage Rate ( ) (% EFORD) Period Heat Rate ( ) (mmbtu/KWh) Highest output ever in 2010 Continued improvement in forced outage rate Benefiting from heat rate improvement program …and continues to react to market dynamics. All data excludes Texas |
 24 13 17 23 19 13 14 15 12 2004 2005 2006 2007 2008 2009 2010 2011 E 85 86 76 77 91 92 95 98 2004 2005 2006 2007 2008 2009 2010 2011 E Consistent record of start success provides opportunities in ancillary and real time markets Adds flexibility in serving load and managing the needs of a diverse market environment Approximately 8,400 starts during 2010 HEDD* is anticipated to reduce fleet size … and provides the ability to follow load during periods of high demand. % Start Success ( ) Forced Outage Rate ( ) (% EFORD) Equivalent Availability ( ) (%) 99.7 96.5 98.6 97.0 98.9 99.3 98.3 99.7 2004 2005 2006 2007 2008 2009 2010 2011 E Our peaking fleet rounds out a diverse generation portfolio… *High Electric Demand Day (HEDD): New Jersey NO x regulation. |
 25 Source: MJ Bradley, PSEG 2010 2011 2012 2013 2014 2015 2016 2017 2018 Haz. Air Pollutants Criteria Pollutants Greenhouse Gases Coal Combustion 316(b) Compliance with Federal GHG Reporting Rule Compliance with PSD/BACT and Title V Applies to GHG Emissions from New and Modified Sources Compliance with Utility MACT Pre-Compliance Period Develop Utility MACT Develop Transport Rule Interim CAIR Phase-in of CCR Regulations Develop Coal Combustion Residuals Rule Develop 316(b) Regulations Revised Ozone NAAQS may require further NO x reductions Phase-In of 316b Regulations by 2020 Compliance with GHG NSPS Develop GHG NSPS …to meet EPA environmental regulations. Today Compliance with Cross-State Air Pollution Rule Power is well-positioned under numerous outcomes… |
 26 …with Power generally well-positioned for the relative near term. PSEG Power’s Position Hazardous Air Pollutants (HAPs) • Fleet generally well-positioned on Hg, Particulate Matter, and HCl • Comprehensive coal controls in place (SCR planned at Conemaugh) Criteria Pollutants (CSAPR) • Fleet well-positioned on NO x and SO2 Greenhouse Gases (GHG) • Limited exposure to GHG BACT requirements • Potentially benefit from NSPS with trading Coal Combustion Residuals • Dry ash systems in use at Power’s coal units • Coal ash and scrubber waste tested as non-hazardous 316(b) Cooling Water Regulations • Share general industry exposure • Over $150M in estuary enhancement program at Salem • Potential capital spend exposure EPA air requirements are expected to influence markets Uplift to market prices expected as a result of retirements, derates, higher variable O&M costs, and/or higher emission allowance prices The potential impacts to Power vary… |
 27 Current Regulations and Compliance Measures Description Hudson (NJ) Mercer (NJ) Keystone (PA) Bridgeport (CT) Conemaugh (PA) NO x SCR SCR SCR Low NO x Burners SCR 2014 SO 2 Scrubber Scrubber Scrubber Ultra-low Sulfur Coal Scrubber Mercury/ Particulate Baghouse & Activated Carbon Baghouse & Activated Carbon Scrubber & SCR, ESP Baghouse & Activated Carbon Scrubber & SCR, ESP Capital Spend Planned No Additional Capital Spend Planned Power’s investment program to mitigate air pollutants… …has placed it in good position to meet anticipated regulatory requirements. |
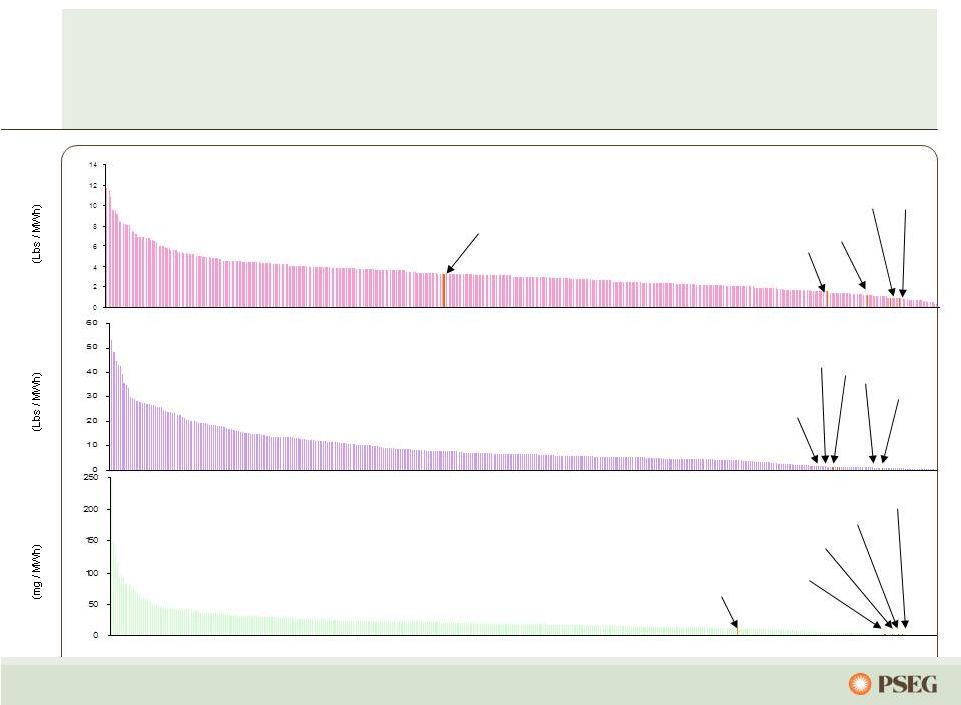 28 Source: EPA (2009), EIA (2009), and PSEG Projections PSEG Projected NO x Emission Rate for 2011 versus 2009 400 U.S. Coal Plants Conemaugh Hudson Bridgeport Mercer Keystone NO x Keystone Bridgeport Conemaugh Hudson Mercer SO 2 PSEG Projected SO2 Emission Rate for 2011 versus 2009 400 U.S. Coal Plants Keystone Conemaugh Bridgeport Mercer Mercury PSEG Projected HG Emission Rate for 2011 versus 2009 400 U.S. Coal Plants Hudson …leaving Power’s coal fleet among the cleanest in the country. PSEG Power’s environmental program has resulted in dramatically lower emissions… |
 29 The NJ DEP is considering an extension to the permits of water-injected HEDD units in the state… PSEG 2,787 Others 1,482 RMR ends in 2011 Conversion to Gas *Replacing 200 MW with 270 MW of new peaking in 2012 at Kearny. Retire May 2015 or extend to 2017 New Jersey HEDD Capacity ICAP MW PSEG Power HEDD Capacity ICAP MW … which will affect the timing of retiring these units. Water- injected, 1,408 Uncontrolled 571* Sewaren 1-4 453 Hudson 1 355 |
 30 …through a balanced, portfolio hedging strategy. Power will continue to utilize a hedging strategy that incorporates full requirement load contracts and contracting using other products to secure pricing over a 2-3 year forward horizon Forward prices, spark spreads, and heat rates have improved in 2011, benefiting companies with the right assets in the right locations BGS continues to be an important part of our hedging strategy Three year nature of BGS provides reduced volatility for customers and generation providers Impact of migration on margin in 2011 has diminished with decline in headroom PSEG Power, as part of P3, is an active participant in market discussions challenging subsidized pricing Power’s fleet is economically optimized… |
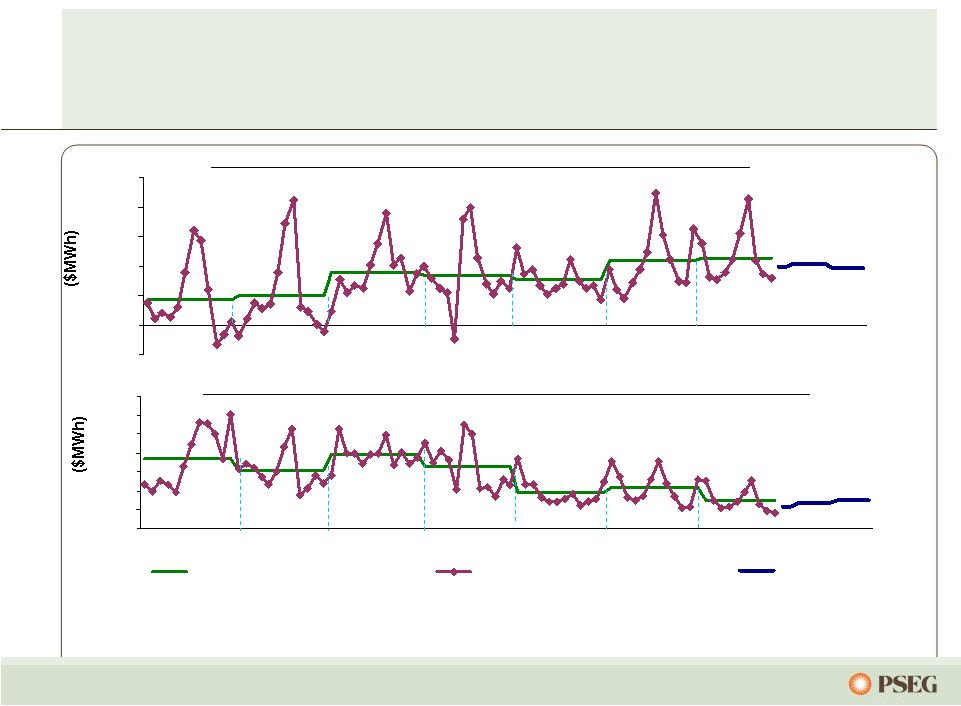
 31 Full Requirements Component Increase in Capacity Markets/RPM Growing Renewable Energy Requirements Component for Market Risk Market Perspective – BGS Auction Results … we have developed an expertise in serving full-requirements contracts. 3 Year Average Round the Clock PJM West Forward Energy Price Note: BGS prices reflect PSE&G Zone 2003 2004 2005 2006 2007 2008 2009 2010 2011 $55.59 $33 - $34 $36 - $37 $44 - $46 $67 - $70 $58 - $60 $68 - $71 $56 - $58 $48 - $50 ~ $21 $55.05 ~ $18 $65.41 ~ $21 $102.51 ~ $32 $98.88 ~ $41 $111.50 ~ $43 $103.72 ~ $47 $95.77 ~ $47 $45 - $47 ~ $48 $94.30 Through Power’s participation in each of the BGS auctions… Capacity Load shape Transmission Congestion Ancillary services Risk premium Green |
 32 …with 2011’s margin affected by weather and improved market prices. • Migration has grown steadily from 2009 – 2011 – Market prices have been below BGS prices – Retail penetration has expanded to include residential customers – Approximate average migration of ~10% in 2009; ~24% in 2010; and forecasted to be 32% to 33% in 2011, assuming 33% to 35% at year-end • Power margin is a direct function of headroom (the difference between the market price of power versus the average price paid by customers under the BGS rate) • Headroom has varied by year – 2009 headroom was high as mild weather resulted in low market prices – 2010 headroom was low as extreme weather resulted in high market prices – 2011 headroom affected by higher market pricing – Retail providers are more likely to promote switching if headroom is seen as sustainable Migration and headroom are a function of market and BGS price differentials… |
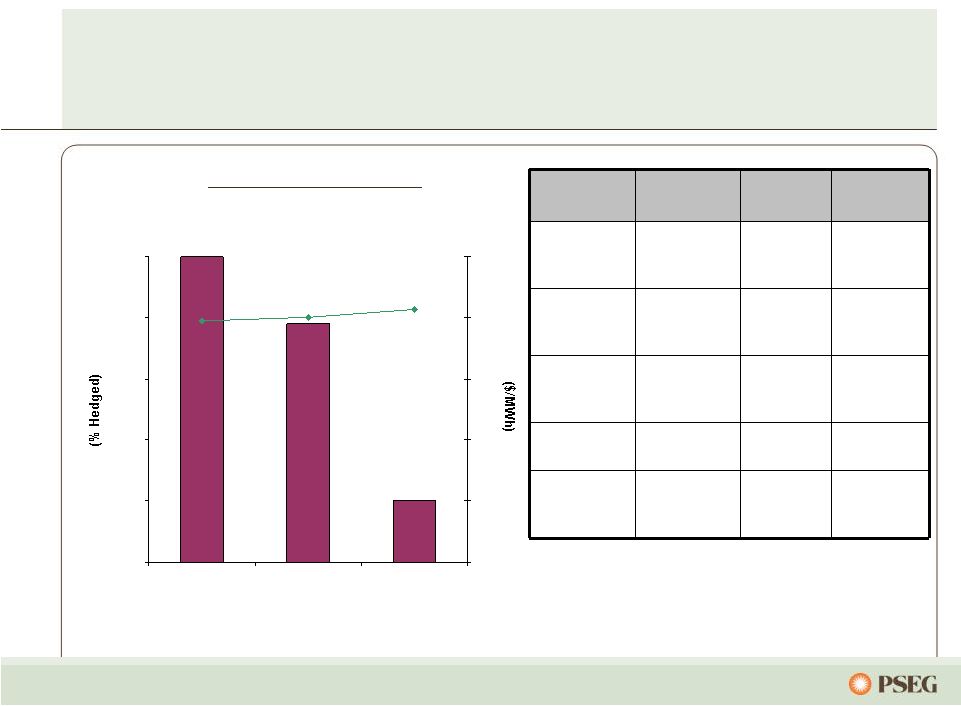
 33 Hedging Update… … our strategy is to hedge our base load generation long term. Contracted Energy* 2011 2012 2013 Oct - Dec Volume TWh 8 36 36 Base Load % Hedged 100% 80-85% 40-45% (Nuclear and Base Load Coal) Price $/MWh $68** $63 $61 Volume TWh 5 22 22 Intermediate Coal, Combined % Hedged 46% Cycle, Peaking Price $/MWh $68** $63 $61 Volume TWh 13 58 58 Total % Hedged 80% 50-55% 25-30% Price $/MWh $68** $63 $61 *Hedge percentages and prices as of September 30, 2011 for the October 2011 and forward time frame. **Average price for full-year 2011. Revenues of full requirement load deals based on contract price, including renewable energy credits, ancillary, and transmission components but excluding capacity. Hedges include positions with MTM accounting treatment and options. |
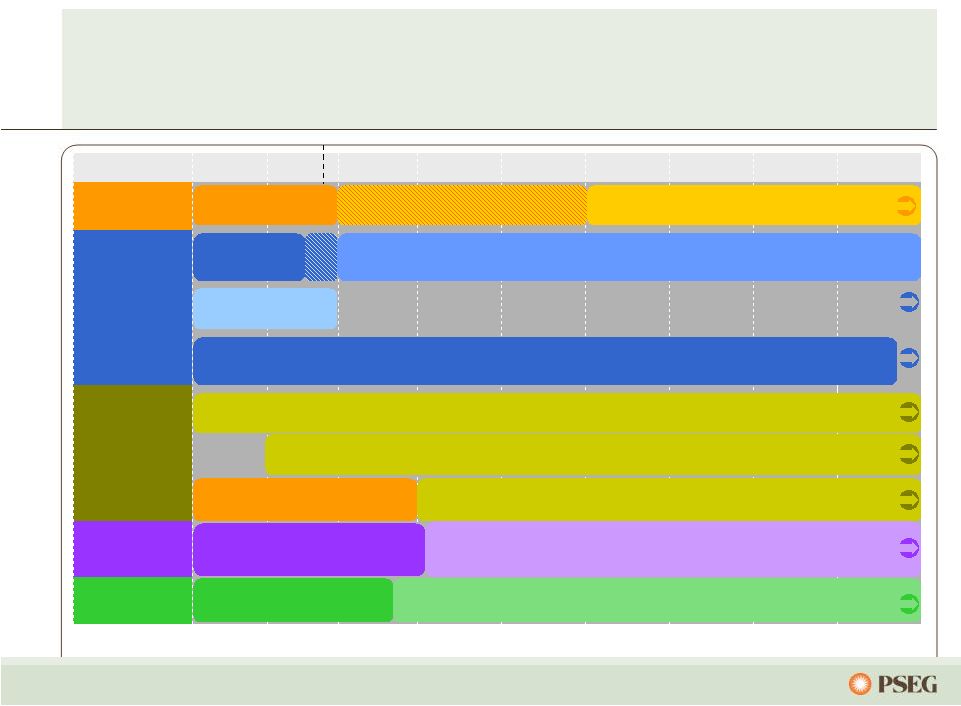
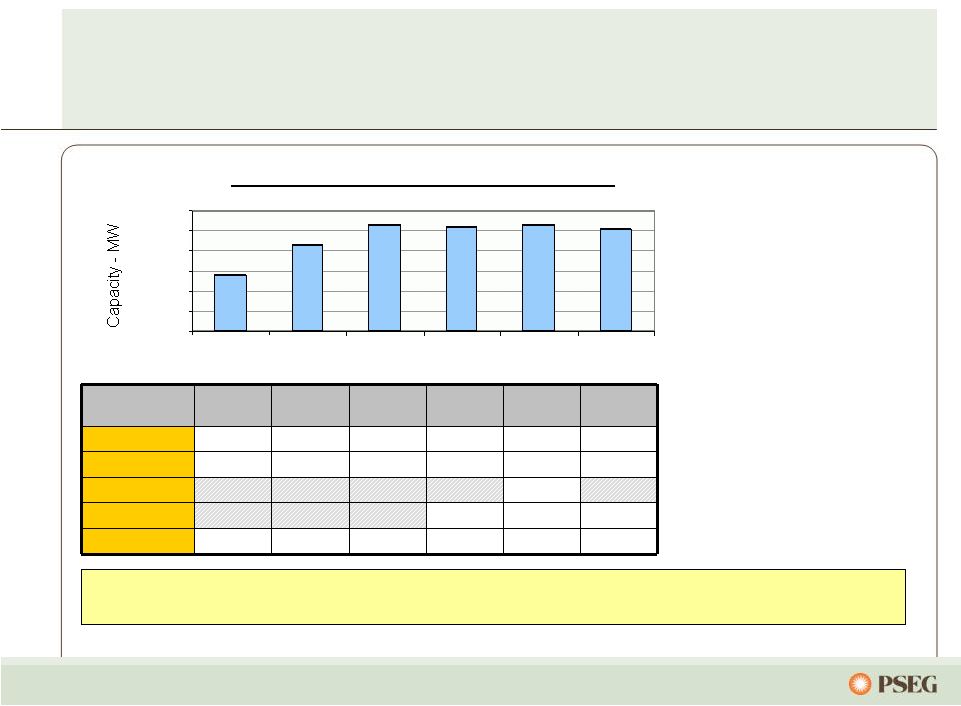 34 … with sites in the eastern part of PJM. With nearly 1/3 of its capacity in PS North and nearly 2/3 of its capacity in EMAAC, Power’s assets in congested locations received higher pricing. • Locational value of Power’s fleet recognized. • Bid for 89 MW of new capacity accepted for 2013/2014 auction; in-service June 2012. • On schedule to complete 178 MW of previously cleared peaking capacity by June 2012. • Latest auction influenced by updated demand forecast and transfer capabilities. $/MW-day PJM Zones 2009 / 2010 2010 / 2011 2011 / 2012 2012 / 2013 2013 / 2014 2014 / 2015 Eastern MAAC $191.32 $174.29 $110.00 $139.73 $245.00 $136.50 MAAC $191.32 $174.29 $110.00 $133.37 $226.15 $136.50 PSEG $245.00 PSEG North Zone $185.00 $245.00 $225.00 Rest of Pool $102.04 $174.29 $110.00 $16.46 $27.73 $125.99 Reliability Pricing Model – locational value of Power’s generating fleet recognized… PJM Capacity Available to Receive Auction Pricing 0 2,000 4,000 6,000 8,000 10,000 12,000 09/10 10/11 11/12 12/13 13/14 14/15 |
 PSE&G – Review and Outlook |
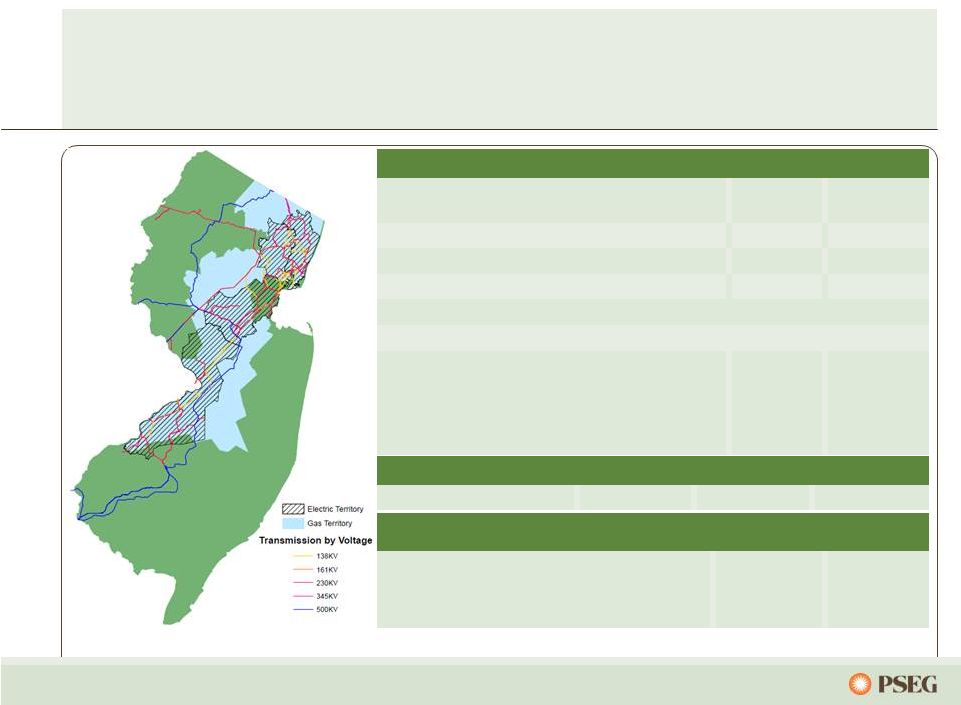 36 PSE&G is the largest utility in New Jersey providing electric, gas and transmission services… …and delivering renewable and energy efficiency solutions for customers. * Actual ** Weather normalized = estimated annual growth per year over forecast period *** Energy Efficiency Annualized Savings (75% Electric/25% Gas Equivalent) Electric Gas Customers Growth (2005 – 2010) 2.2 Million 4.0% 1.8 Million 4.0% Electric Sales and Gas Sold and Transported 43,645 GWh 3,465 M Therms Historical Annual Load Growth Distribution (2006 - 2010) (0.5%)* (1.0%)* Historical Annual Peak Load Growth Transmission (2006 – 2010) (0.1%) Projected Annual Load Growth (2011 – 2013) 1.3%** 0.8%** Projected Annual Load Growth Transmission (2011 – 2013) 1.4% Sales Mix Residential 33% 61% Commercial 57% 36% Industrial 10% 3% Transmission Electric Gas Approved Rate of Return 11.68% ROE 10.3% ROE 10.3% ROE Renewables and Energy Efficiency 2009-2010 Total Program Plan Solar Loan 19 MW 81 MW Solar 4 All 28 MW 80 MW Energy Efficiency Initiative (lifetime equivalent)*** 389 GWh 604 GWh |
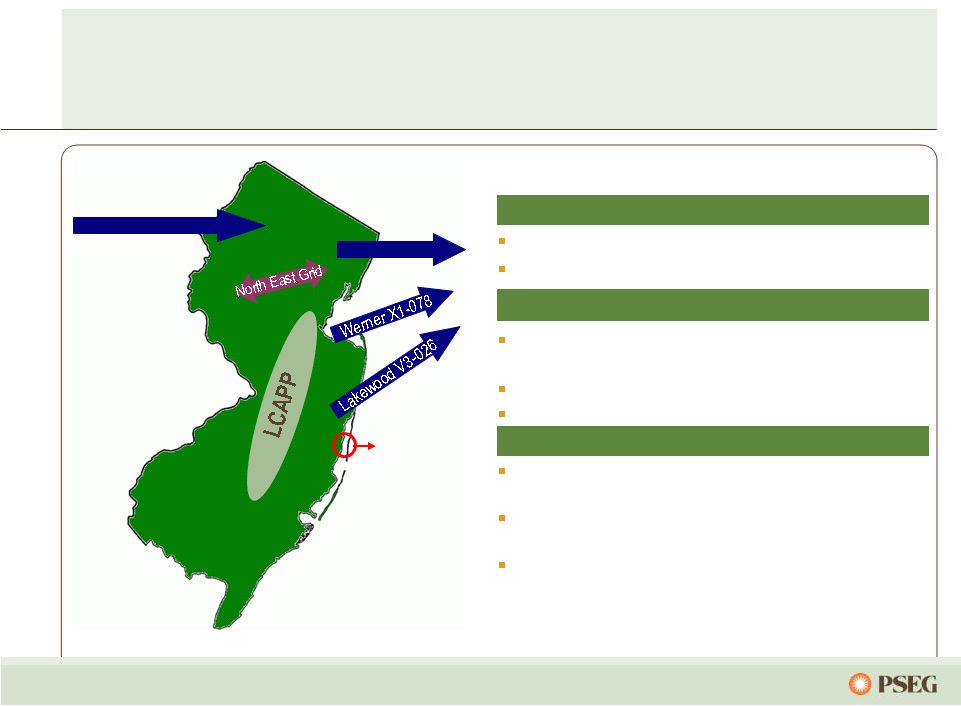 37 New Jersey’s energy future requires continued investment… … while adapting to changes in resources. Transmission Capacity Growth Transmission Capacity Reductions Susquehanna-Roseland ~1,500 MW North East Grid ~200 MW Bergen O66 - Bergen to ConEd's West 49th Street ~(670 MW*) Lakewood V3-026 - Lakewood to New York ~550 MW Werner X1-078 - Werner to New York ~525MW Other Impacts to NJ Long-term Capacity Agreement Pilot Program (LCAPP) ~2,000 MW Exelon has entered into an agreement with the state of New Jersey to close Oyster Creek in 2019 ~(700 MW) 2010-2020 Demand growth of ~1% based on 2011 PJM Load Forecast report ~1,125 MW * Project has firm contract for 320MW Net impact to New Jersey is ~130MW by 2020 Susquehanna-Roseland Bergen O66 Sources: Imports: PSE&G Estimates; Exports: PJM 2009 RTEP; Load Growth: PJM 2011 Load Forecast Report Arrows are general indicators and not intended to represent actual route Oyster Creek |
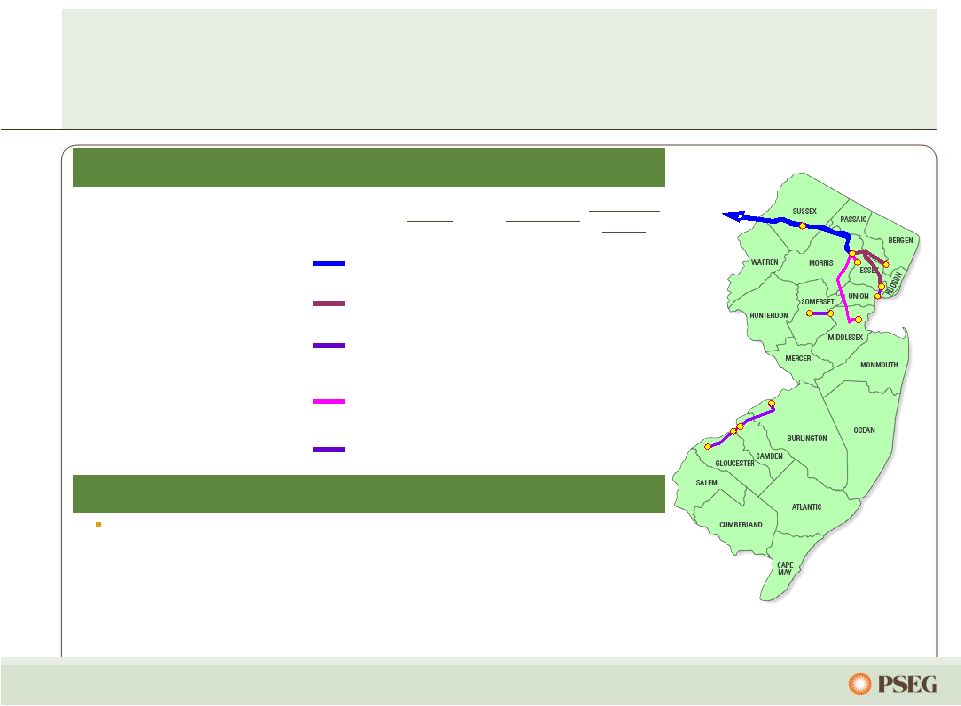 38 Transmission investment recovery is supported by formula rate treatment… ($ Millions) Phase In-Service Spending Up To Susquehanna-Roseland* Engineering / Licensing 2014 East 2015 West $750 North East Grid Preliminary Design 2015 $895 Burlington – Camden 230kV Conversion** Engineering / Licensing 2014 $381 North Central Reliability** Engineering / Licensing 2014 $336 Mickleton – Gloucester – Camden** Preliminary Design 2015 $435 … and CWIP in rate base for certain projects. *CWIP in Rate Base and 1.25% ROE incentive treatment approved. ** CWIP in rate base approved. Transmission Projects Future Projects Future Transmission project spending will be influenced by PJM evaluation, potentially adding additional projects over 2011 – 2015 and revising required in-service dates. Hopatcong Hopatcong W Orange W Orange Burlington Burlington Gloucester Hopatcong Hopatcong W Orange W Orange Camden Mickleton Hopatcong Hopatcong W Orange W Orange Burlington Burlington Gloucester Hopatcong Hopatcong W Orange W Orange Camden Mickleton Bergen Hudson Bayonne Sewaren Middlesex Bridgewater Roseland |
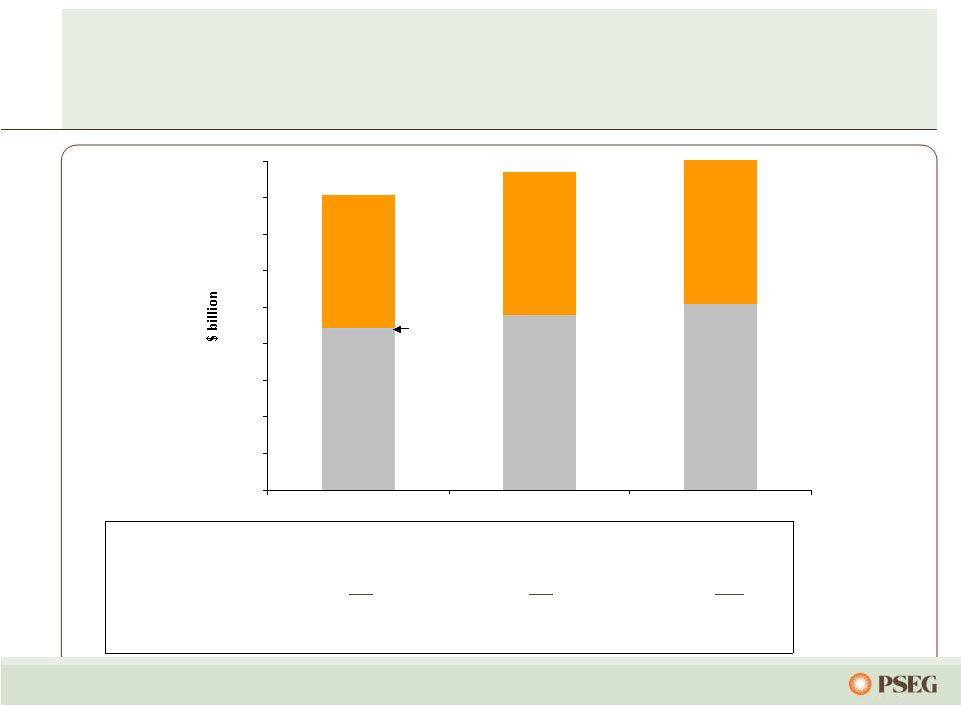
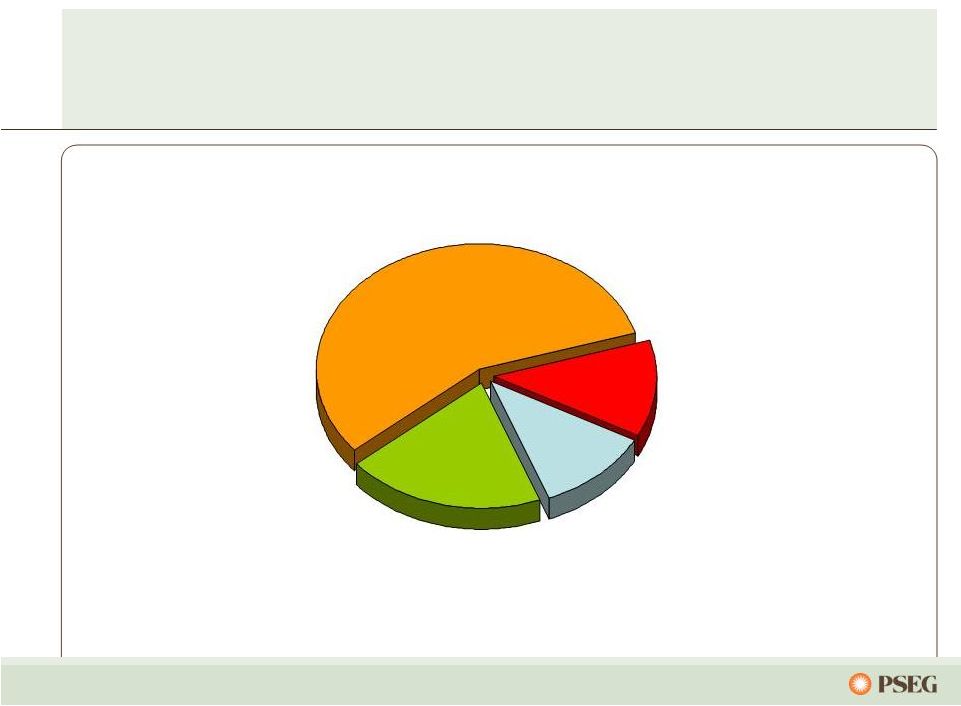 39 PSE&G’s capital program calls for investing $5.2 billion… …through investment in transmission and distribution. *E: Estimate. 2011-2013E Utility Capital Spending $5.2 Billion* Renewables/EMP $0.7 B Gas Utility $0.6 B 11% Electric Distribution $1.0 B 20% Transmission $2.9 B 56% 13% |
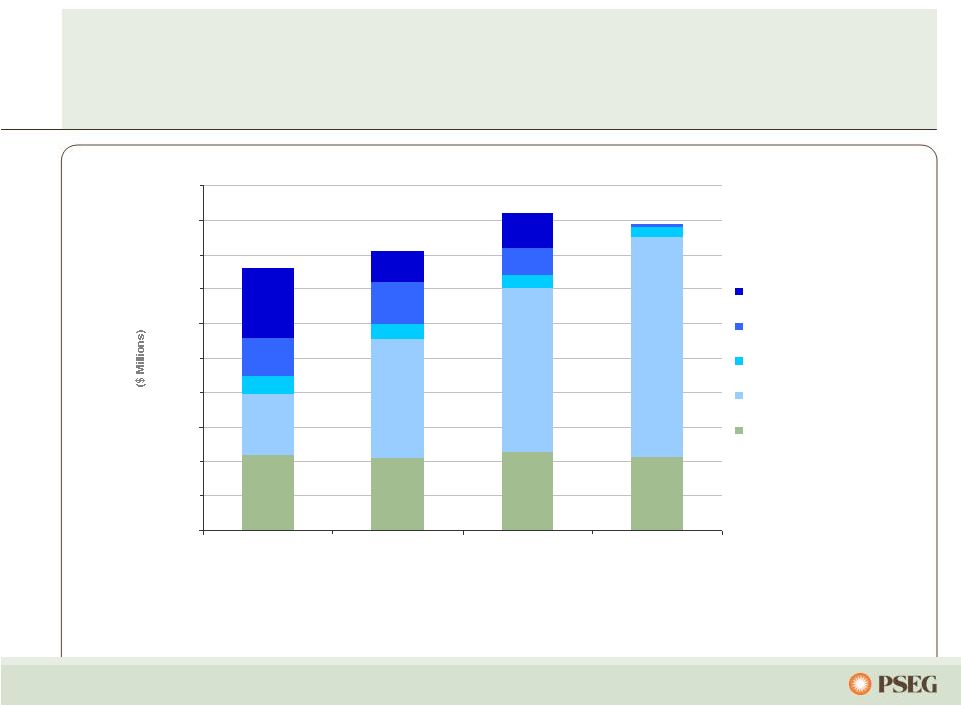
 40 $0 $200 $400 $600 $800 $1,000 $1,200 $1,400 2010 2011 2012 2013 Susquehanna-Roseland * RTEP 230 kV Conversions Other RTEP 69kV Transmission Other Transmission FERC’s Transmission formula rate order grants PSE&G an 11.68% ROE and a fully-forecasted cost of service Transmission represents approximately 56% of planned investment over the 2011-2013 plan and is expected to comprise ~33% of PSE&G rate base by 2013 Supportive regulatory treatment with contemporaneous recovery is key to align earnings growth with investment Execution of the Transmission plan is critical to achieving PSE&G’s future growth. Transmission Investment by Major Category** * Susquehanna-Roseland approved for 12.93% ROE. ** 2010 is actual data, 2011-2013 is projected data. |
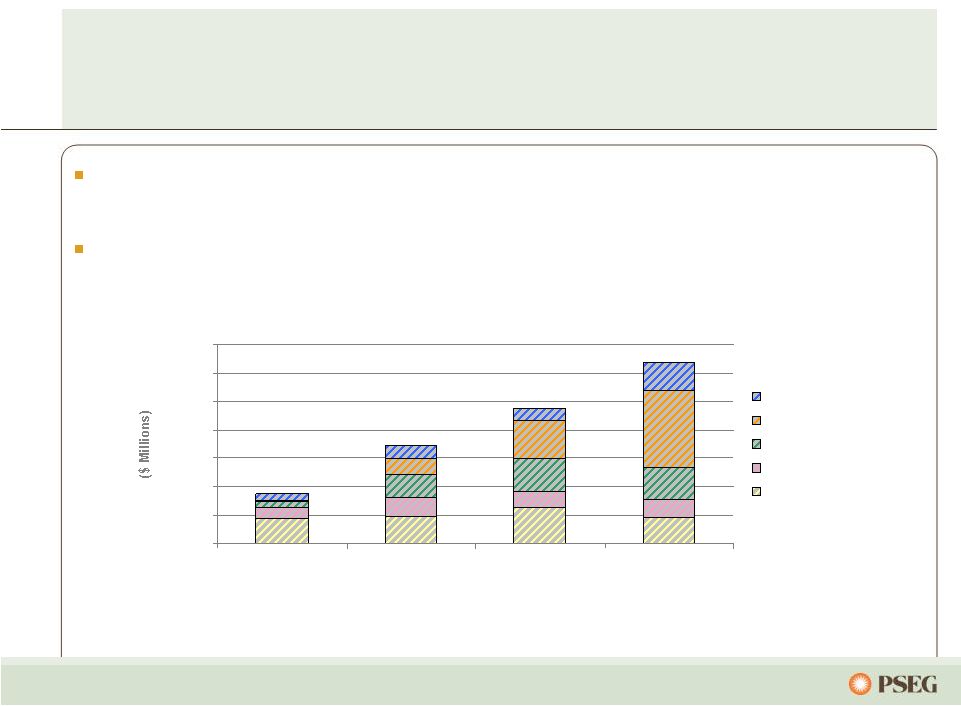
 41 Our 2011 – 2013 capital plan calls for investing $5.2 billion… $0 $200 $400 $600 $800 $1,000 $1,200 $1,400 $1,600 $1,800 $2,000 2010 2011E 2012E 2013E NJ Infrastructure Stimulus Solar Energy Efficiency Transmission Core Investment …with contemporaneous recovery mechanisms approved for ~$3.1 billion. PSE&G Capital Expenditures E: Estimated. |
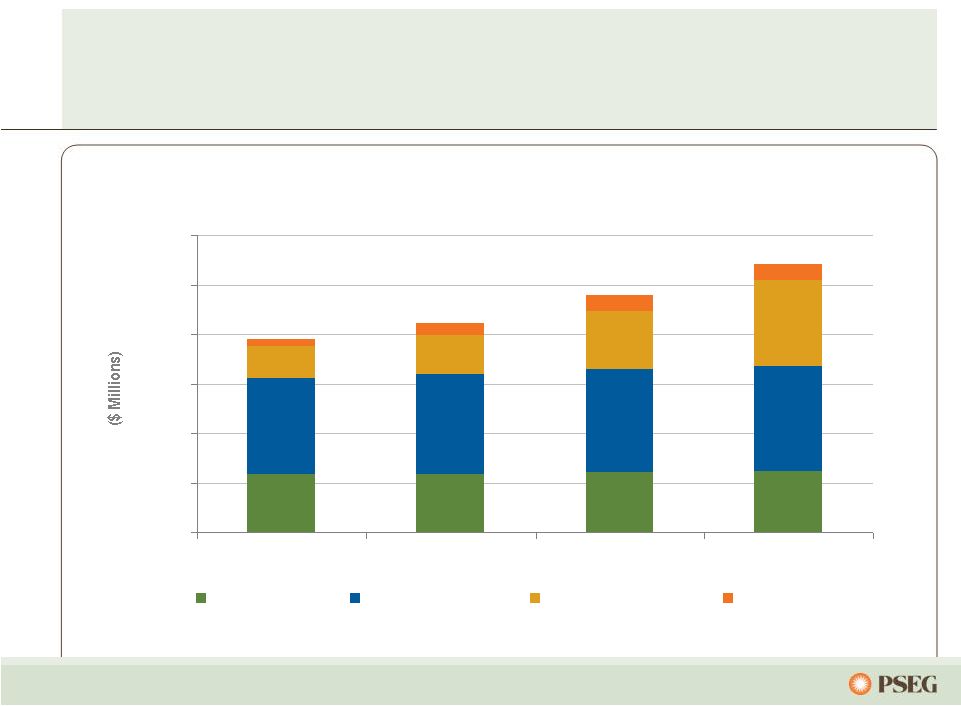 42 PSE&G’s investment program provides opportunity for ~11%* annualized growth in rate base PSE&G Projected Rate Base** *Starting from 2010 Rate Base of $7.8 billion. **2010 is actual data; 2011-2013 is projected data. $0 $2,000 $4,000 $6,000 $8,000 $10,000 $12,000 2010 2011 2012 2013 Gas Distribution Electric Distribution Electric Transmission Energy Master Plan |
 43 Investment program supporting NJ’s energy and economic goals has led to 45 MW of solar… … with 30 MW in development. ($ Millions) Approval Date Total Amount Spending Thru 9/2011 Remaining Spending Thru 2013 Solar Loan I & II April 2008/ November 2009 $248 $104 $140 Carbon Abatement December 2008 46 36 10 NJ Capital Infrastructure Stimulus I April 2009 694 702 - Solar 4 All * July 2009 465 298 155 Energy Efficiency Economic Stimulus July 2009 166 123 43 Demand Response July 2009 65 13 32 Energy Efficiency Economic Stimulus Extension July 2011 95 - 91 NJ Capital Infrastructure Stimulus II July 2011 273 10 263 Total $2,052 $1,286 $734 * Filing amount based on installation of 80MW, total forecasted spend is lower due to a lower cost per watt to install. |
 PSEG Energy Holdings - Review & Outlook |
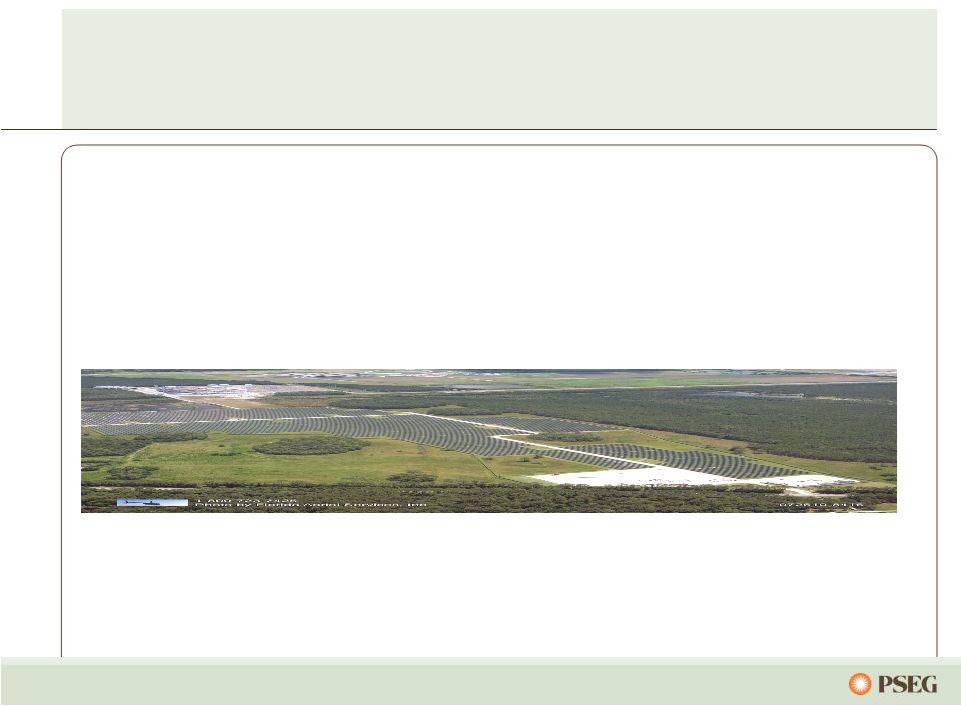 45 Energy Holdings is pursuing renewable energy alternatives with emphasis on solar • Solar is a good strategic fit for PSEG – Predictable and attractive returns through long-term Power Purchase Agreements with creditworthy counterparties – Improves geographic, technology, regulatory and market risk profile – Strong relationships established across the value chain – Favorable tax attributes, long-term earnings, short construction cycles and proven technology • Solar In-Service – Installed 29 MW at three locations; ~$117 million investment to date – Projects completed ahead of schedule and under budget; operating performance better than plan |
 46 PSEG Energy Holdings has made significant reductions in size and risks International Energy: Global has disposed of all but one international asset Domestic Generation: Only 176 MW of Global’s legacy domestic generation assets remain LILO/SILO: Resources terminated all 18 LILO/SILO leases Traditional Leases: Resources continues to carefully manage the remaining traditional leases and other investments $264 million gross investment in a lease receivable from Dynegy resulting in an after-tax charge of $170 million, or $0.34 per share Energy Holdings fully reserved its Leveraged Lease Reserve: |
 PSEG – Financial Review and Outlook |
 48 25% 30% 35% 40% 45% 50% 2008 2009 2010 2011-2013E Average PSEG Power Funds from Operations / Total Debt Power’s credit metrics remain strong ... Power’s free cash flow produces strong credit measures and provides sufficient cushion for potential gas price volatility Free Cash Flow (1) ~750 ~950 ~750 Average: ~725 Dividends to Parent 500 850 550 Average: ~475 (in $Millions) (1) Free Cash Flow represents cash from operations less cash used for investing. E: Estimate. … providing opportunities for growth investments. |
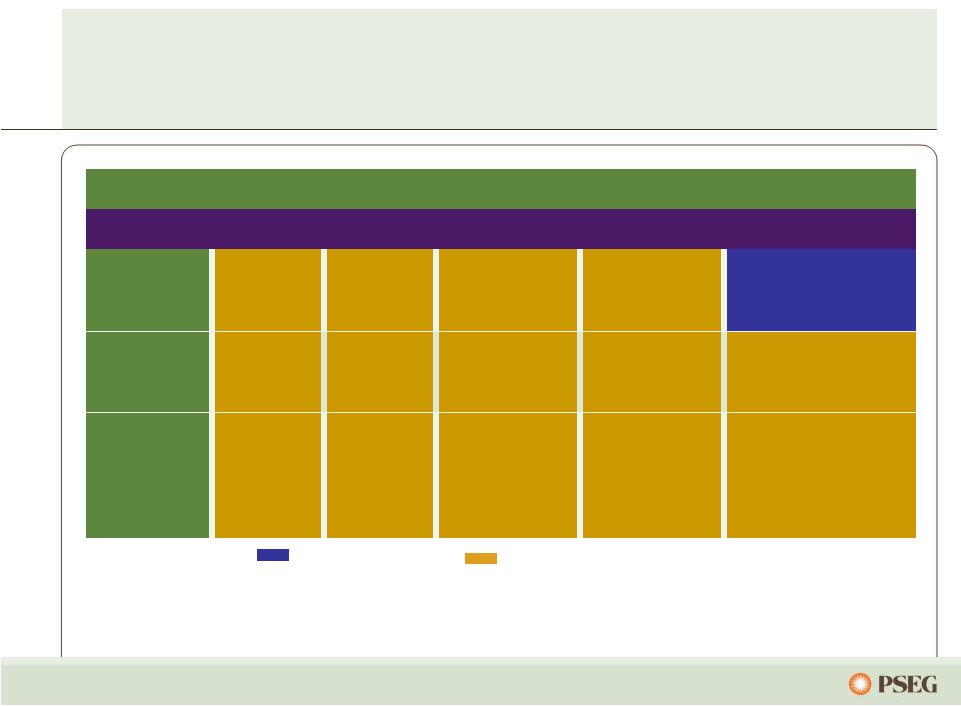
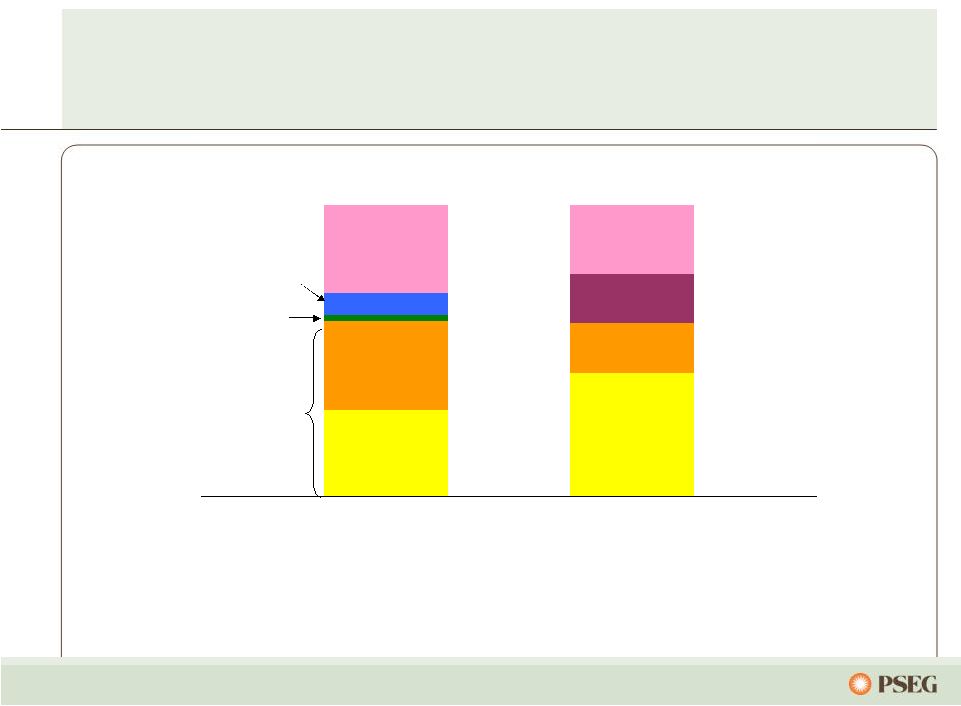 49 PSEG’s internally generated cash flow between 2011 – 2013 … … supports capital investment and the shareholder dividend without the need for equity issuance. * Cash from Operations adjusts for securitization principal repayments ~$0.7B. E: Estimate. ** 2011-2012 includes bonus depreciation of ~$0.9B offset by ~$0.1B in 2013. Sources Uses Power Cash from Ops Debt Issued PSE&G Investment Debt Redeemed Shareholder Dividend PSEG Consolidated 2011 – 2013E Sources and Uses PSE&G Cash from Ops* Power Investment Asset Sale Proceeds Includes: Bonus Depreciation = ~$0.8B** Pension Contribution = ~($0.5B) Other Net Cash Flow |
 50 PSEG Advantage – Value Proposition: Compelling Risk-Adjusted Total Return Investment Opportunity Value Drivers Disciplined Capital Allocation •Clean and reliable nuclear, coal, and natural gas-fired generation fleet •Large, reliable electric and gas distribution operations •Heat rates and spark spreads are expected to improve further •Environmental compliance costs •Potential retirements of 11 to 25 GW of existing generation in PJM •Market prices must rise to incent new generation investment •PSEG positioned to benefit from higher utilization and market heat rates as capacity factors improve •Investments at PSE&G to yield ~11% CAGR in rate base •Pursuing growth investments with reasonable, risk-adjusted returns •Monetizing non-core assets through asset sales •Strong balance sheet provides flexibility and liquidity to finance growth opportunities in our shareholders’ best interest – without dilution •104-year history of paying an annual common stock dividend •Returning capital to shareholders over time |
 51 PSEG received a perfect score of 100 on the Corporate Equality Index and Best Places to Work 2010 Survey conducted by the Human Rights Campaign. The Edison Award. Presented annually by EEI and recognizes U.S. and international electric utilities for their innovation and role in advancing the industry. Our focus on customers, community and employees… PSE&G named America’s Most Reliable Utility 4 of past 6 years Mid-Atlantic Region winner for the 9 straight year Carbon Performance Leadership Index (CPLI) 2010. Named Maplecroft Climate Innovation Index (CII) utility sector Leader. Second year in World Index, fourth year in the North American Index. PSEG is one of only two U.S. electric companies in the World Index. … has been widely recognized. th |
 Appendix |
 53 0% 10% 20% 30% 40% 2011/2012 2012/2013 2013/2014 2014/2015 2015/2016 …but over the longer term, many influences will dictate sources of market sufficiency. Unforecasted influences that could increase capacity: =>Government interventions – for example, LCAPP =>Load/demand rate of change =>Demand response / Economic recovery Unforecasted influences that could decrease capacity: =>Government regulations – for example, environmental retirements =>Load/demand rate of change =>Demand response / Economic recovery PJM Forecasted Capacity Reserves (1) PJM • Reserve margins to tighten, due to: – Load growth – Announced unit retirements (2) – Anticipated environmental retirements • PJM estimates that 11 to 25 GW of coal is at risk (3) • Likely 3+ GW of oil / gas retirements due to HEDD and MACT EMAAC • Most of Power’s assets located in EMAAC • Anticipated retirements, driven primarily by HEDD and HAPs- MACT rules, beyond the coal retirements already announced • Transmission projects expected to increase net imports into EMAAC, partially offsetting retirements • Local legislation (NJ LCAPP) could initially increase reserve margins, but would discourage long-term merchant investment (1) Reserve margin forecast from PJM as of March 2011. One percent of reserve margin equals ~1.3 GW of supply. (2) PJM’s reserve projections assume only 3.2 GW of retirements. (3) Source: PJM report as of August 2011. PJM has adequate reserves to meet near-term demand… |
 54 Power’s coal hedging reflects 2011 supply matched with 2011 sales… … while maintaining flexibility on supply post BET installation. 0% 20% 40% 60% 80% 100% 2011 2012 2013 $0 $10 $20 $30 $40 $50 Contracted Coal Station Coal Type Pricing ($/MWh)* Comments Bridgeport Harbor Adaro High $40’s Higher price, lower BTU, enviro coal Hudson CAPP Mid $40’s Flexibility after BET in 2010 Mercer Metallurgical CAPP/NAPP Low $40’s More limited segment of coal market Keystone NAPP High $20’s Prices moderating Conemaugh NAAP High $20’s to Low $30’s Prices moderating % Hedged (left scale) $/MWh (right scale) * Commodity plus transportation. |
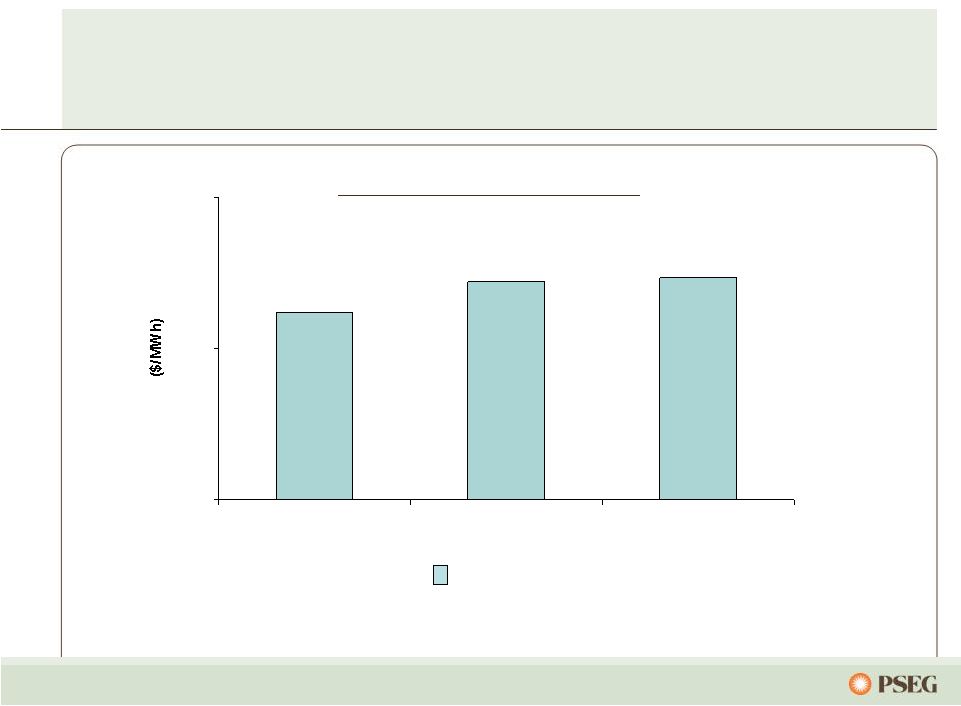 55 $0 $5 $10 2011 2012 2013 Anticipated Nuclear Fuel Cost … with increased costs over that time horizon. Hedged Power has fully hedged its nuclear fuel needs through 2013… |
 56 Operated by PSEG Nuclear PSEG Ownership: 100% Technology: Boiling Water Reactor Total Capacity: 1,197MW Owned Capacity: 1,197MW License Expiration: 2046 License renewal approved July 2011 Next Refueling 2012 Operated by PSEG Nuclear Ownership: PSEG – 57% Exelon – 43% Technology: Pressurized Water Reactor Total Capacity: 2,337MW Owned Capacity: 1,342MW License Expiration: 2036 and 2040 License renewal approved June 2011 Next Refueling Unit 1 – Fall 2011 (underway) Unit 2 – Fall 2012 Operated by Exelon PSEG Ownership: 50% Technology: Boiling Water Reactor Total Capacity: 2,245MW Owned Capacity: 1,122MW License Expiration: 2033 and 2034 Next Refueling Unit 2 – 2012 Unit 3 – Fall 2011 (completed) Hope Creek Salem Units 1 and 2 Peach Bottom Units 2 and 3 … is a critical element of Power’s success. Our five unit nuclear fleet… |
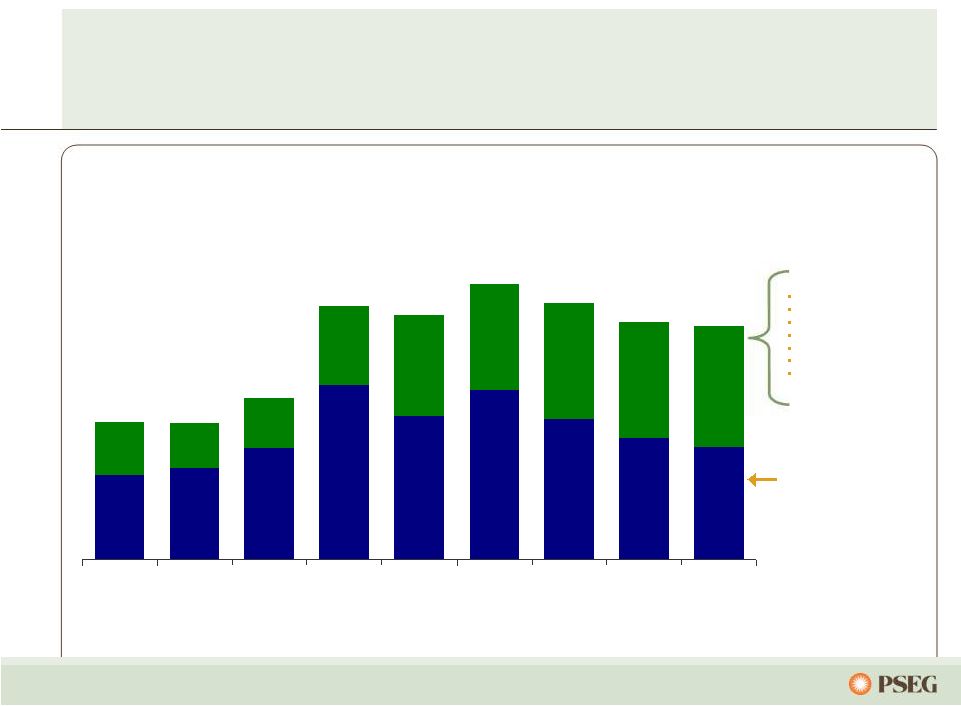
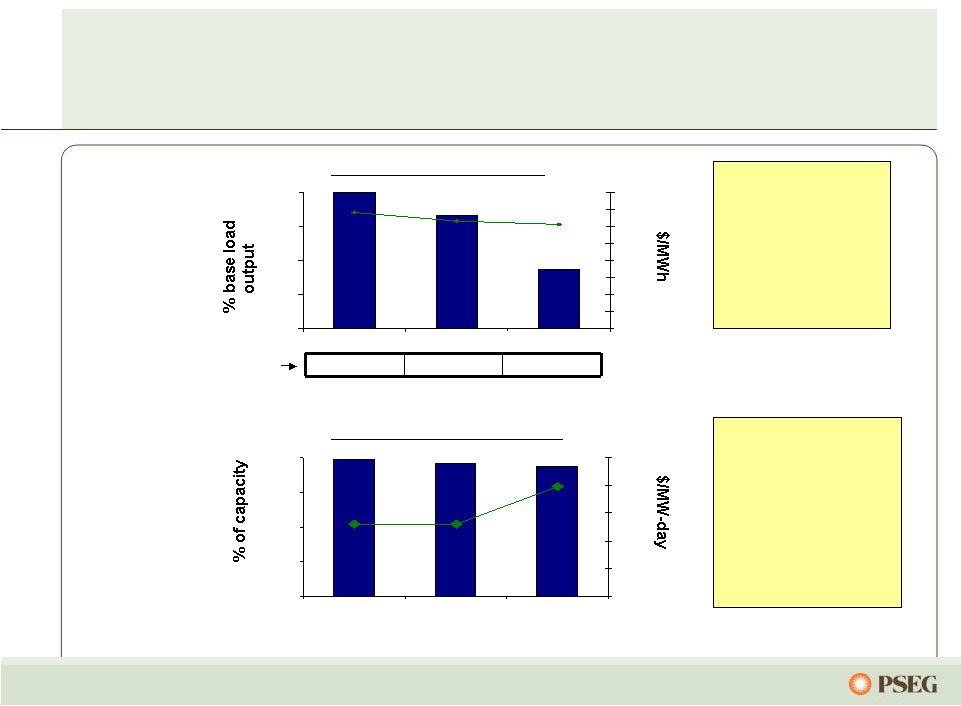 57 0% 25% 50% 75% 100% 2011 2012 2013 $0 $50 $100 $150 $200 $250 0% 25% 50% 75% 100% 2011 2012 2013 $0 $10 $20 $30 $40 $50 $60 $70 $80 … while remaining open to long-term market forces. Estimated EPS impact of $5/MWh PJM West around the clock price change* (~$1/mmbtu gas change) Contracted Capacity Price (right scale) * As of October 2011, assuming normal market commodity correlation and demand. Power has contracted for a considerable percentage of its future output over the next two years. The pricing for most of Power’s capacity has been fixed through May 2014, with the completion of auctions in PJM and NE. % sold (left scale) Contracted Energy Price (right scale) % sold (left scale) * $0.02 - $0.06 $0.14 - $0.28 $0.20 - $0.40 Power’s hedging program provides near-term stability from market volatility… |
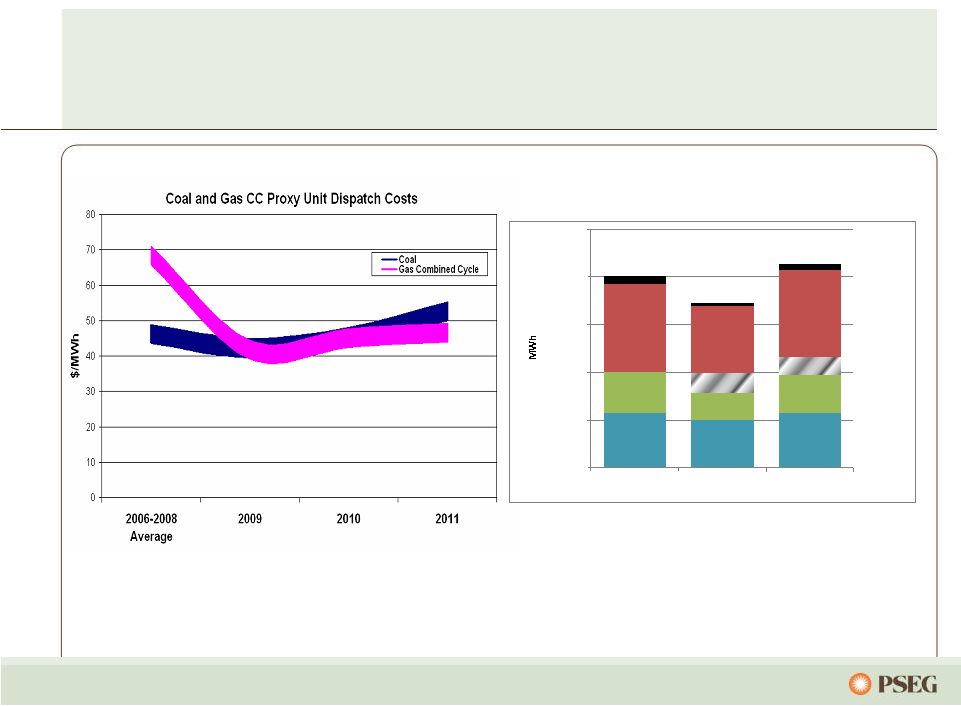 58 Gas competed favorably with coal in 2010, with operational flexibility favoring gas… … and Power’s diverse fleet is positioned to compete under various market conditions. PJM Fleet Flexibility Base Coal Base Coal Base Coal CC/Coal CC/Coal CC PK PK PK Int Coal Int Coal Int Coal CC CC - 5,000 10,000 15,000 20,000 25,000 2008 2009 2010 Note: Forward prices as of February 2011. |
 59 PSEG 2011 Operating Earnings Guidance - by Subsidiary $ millions (except EPS) 2011E 2010A PSEG Power $ 765 – $ 855 $ 1,091 PSE&G $ 495 – $ 520 $ 430 PSEG Energy Holdings $ 0 – $ 5 $ 49 Enterprise $ 5 – $ 15 $ 14 Operating Earnings* $ 1,265 – $ 1,395 $ 1,584 Earnings per Share $ 2.50 – $ 2.75 $ 3.12 * See Page 63 for Items excluded from Income from Continuing Operations to reconcile to Operating Earnings. |
 60 PSEG Resources Leveraged Lease Portfolio Lessee Equipment 9/30/11 Invested ($millions) S&P Credit Rating* REMA (GenOn) Keystone, Conemaugh & Shawville (PA) 3 coal fired plants (1,162 equity MW) 331 B Dynegy Holdings** Danskammer & Roseton Generating Station (NY) 370 MW coal fired and 1,200 MW oil/gas fired 0 NA Edison Mission Energy (EME) Powerton & Joliet Generating Stations (IL) 2 coal-fired generating facilities (1,640 equity MW) 219 B- Merrill Creek – (PECO, MetEd, Delmarva P& L) Reservoir in NJ 129 BBB, BBB-, BBB+ Grand Gulf Nuclear station in Mississippi (154 equity MW) 100 A+ US West/Qwest*** Qwest headquarters located in Denver, CO 119 NR Renaissance Ctr. GM headquarters located in Detroit, MI 41 BB+ Wal-Mart Portfolio of 17 Wal-Mart stores 29 AA E-D Centers Portfolio of 8 shopping centers 23 NR Total Leases $991 *Indicative recent rating reflecting either Lessee, additional equity collateral support or parent company unsecured debt rating. ** In Q3 2011, Energy Holdings fully reserved its $264 million gross investment in a lease receivable from Dynegy resulting in an after-tax charge of $170 million, or $0.34 per share. *** Qwest was acquired by Century Link. NR – Not Rated, NA – Not Applicable. |
 61 PSEG Consolidated Debt / Capitalization (1) Long-Term Debt includes Debt due within one year; excludes Securitization Debt and Non-Recourse Debt. December 31, 2009 December 31, 2010 September 30, 2011 PSE&G Short-Term Debt - $ - $ - $ PSEG Money Pool Short-Term Debt 530 64 - Total Short-term Debt 530 64 - Long-Term Debt (1) : Power 3,121 3,455 3,350 PSE&G 3,571 4,283 4,535 Holdings 127 - - Parent / Services (38) 10 40 Total Long-Term Debt 6,781 7,748 7,925 Preferred Stock 80 - - Total Common Stockholders' Equity 8,788 9,633 10,159 TOTAL CAPITALIZATION 16,179 $ 17,445 $ 18,084 $ December 31, 2009 December 31, 2010 September 30, 2011 Debt 7,311 $ 7,812 $ 7,925 $ Preferred Stock 80 - - Total Common Stockholders' Equity 8,788 9,633 10,159 Debt Plus Equity 16,179 $ 17,445 $ 18,084 $ Debt Ratio 45.2% 44.8% 43.8% |
  62 Items Excluded from Income from Continuing Operations to Reconcile to Operating Earnings Please see Page 3 for an explanation of PSEG’s use of Operating Earnings as a non-GAAP financial measure and how it differs from Net Income. Pro-forma Adjustments, net of tax 2011 2010 2011 2010 Earnings Impact ($ Millions) Gain (Loss) on Nuclear Decommissioning Trust (NDT) Fund Related Activity (PSEG Power) 7 $ 10 $ 49 $ 30 $ Gain (Loss) on Mark-to-Market (MTM) (PSEG Power) 8 16 16 28 Lease Transaction Reserves (Energy Holdings) (170) - (170) - Market Transition Charge Refund (PSE&G) - - - (72) Total Pro-forma adjustments (155) $ 26 $ (105) $ (14) $ Fully Diluted Average Shares Outstanding (in Millions) 507 507 507 507 Per Share Impact (Diluted) Gain (Loss) on NDT Fund Related Activity (PSEG Power) 0.01 $ 0.02 $ 0.10 $ 0.06 $ Gain (Loss) on MTM (PSEG Power) 0.02 0.03 0.03 0.05 Lease Transaction Reserves (Energy Holdings) (0.34) - (0.34) - Market Transition Charge Refund (PSE&G) - - - (0.14) Total Pro-forma adjustments (0.31) $ 0.05 $ (0.21) $ (0.03) $ September 30, September 30, For the Three Months Ended For the Nine Months Ended PUBLIC SERVICE ENTERPRISE GROUP INCORPORATED Reconciling Items Excluded from Continuing Operations to Compute Operating Earnings (Unaudited) |
 63 Items Excluded from Income from Continuing Operations to Reconcile to Operating Earnings Pro-forma Adjustments, net of tax 2010 2009 Earnings Impact ($ Millions) Gain (Loss) on Nuclear Decommissioning Trust (NDT) Fund Related Activity (PSEG Power) 46 $ 9 $ Gain (Loss) on Mark-to-Market (MTM) (PSEG Power) (1) (11) Net Reversal of Lease Transaction Reserves (Energy Holdings) - 29 Market Transition Charge Refund (PSE&G) (72) - Total Pro-forma adjustments (27) $ 27 $ Fully Diluted Average Shares Outstanding (in Millions) 507 507 Per Share Impact (Diluted) Gain (Loss) on NDT Fund Related Activity (PSEG Power) 0.09 $ 0.02 $ Gain (Loss) on MTM (PSEG Power) - (0.02) Net Reversal of Lease Transaction Reserves (Energy Holdings) - 0.05 Market Transition Charge Refund (PSE&G) (0.14) - Total Pro-forma adjustments (0.05) $ 0.05 $ December 31, PUBLIC SERVICE ENTERPRISE GROUP INCORPORATED Reconciling Items Excluded from Continuing Operations to Compute Operating Earnings (Unaudited) For the Twelve Months Ended Please see Page 3 for an explanation of PSEG’s use of Operating Earnings as a non-GAAP financial measure and how it differs from Net Income. |