 2 Forward-Looking Statement EXHIBIT 99 Readers are cautioned that statements contained in this presentation about our future performance, including future revenues, earnings, strategies, prospects, consequences and all other statements that are not purely historical, are forward-looking statements for purposes of the safe harbor provisions under The Private Securities Litigation Reform Act of 1995. When used herein, the words “anticipate”, “intend”, “estimate”, “believe”, “expect”, “plan”, “should”, “hypothetical”, “potential”, “forecast”, “project”, variations of such words and similar expressions are intended to identify forward-looking statements. Although we believe that our expectations are based on reasonable assumptions, they are subject to risks and uncertainties and we can give no assurance they will be achieved. The results or developments projected or predicted in these statements may differ materially from what may actually occur. Factors which could cause results or events to differ from current expectations include, but are not limited to: • adverse changes in the demand for or price of the capacity and energy that we sell into wholesale electricity markets, • adverse changes in energy industry law, policies and regulation, including market structures and a potential shift away from competitive markets toward subsidized market mechanisms, transmission planning and cost allocation rules, including rules regarding how transmission is planned and who is permitted to build transmission in the future, and reliability standards, • any inability of our transmission and distribution businesses to obtain adequate and timely rate relief and regulatory approvals from federal and state regulators, • changes in federal and state environmental regulations that could increase our costs or limit our operations, • changes in nuclear regulation and/or general developments in the nuclear power industry, including various impacts from any accidents or incidents experienced at our facilities or by others in the industry, that could limit operations of our nuclear generating units, • actions or activities at one of our nuclear units located on a multi-unit site that might adversely affect our ability to continue to operate that unit or other units located at the same site, • any inability to balance our energy obligations, available supply and trading risks, • any deterioration in our credit quality, or the credit quality of our counterparties, including in our leveraged leases, • availability of capital and credit at commercially reasonable terms and conditions and our ability to meet cash needs, • any inability to realize anticipated tax benefits or retain tax credits, • changes in the cost of, or interruption in the supply of, fuel and other commodities necessary to the operation of our generating units, • delays in receipt of necessary permits and approvals for our construction and development activities, • delays or unforeseen cost escalations in our construction and development activities, • any inability to achieve or continue to sustain, our expected levels of operating performance, • increase in competition in energy supply markets as well as competition for certain rate-based transmission projects, • challenges associated with recruitment and/or retention of a qualified workforce, • adverse performance of our decommissioning and defined benefit plan trust fund investments and changes in discount rates and funding requirements, and • changes in technology and customer usage patterns. For further information, please refer to our Annual Report on Form 10-K, including Item 1A. Risk Factors, and subsequent reports on Form 10-Q and Form 8-K filed with the Securities and Exchange Commission. These documents address in further detail our business, industry issues and other factors that could cause actual results to differ materially from those indicated in this presentation. In addition, any forward-looking statements included herein represent our estimates only as of today and should not be relied upon as representing our estimates as of any subsequent date. While we may elect to update forward-looking statements from time to time, we specifically disclaim any obligation to do so, even if our internal estimates change, unless otherwise required by applicable securities laws. |
 3 GAAP Disclaimer PSEG presents Operating Earnings in addition to its Net Income reported in accordance with generally accepted accounting principles in the United States (GAAP). Operating Earnings is a non-GAAP financial measure that differs from Net Income because it excludes gains or losses associated with Nuclear Decommissioning Trust (NDT), Mark-to-Market (MTM) accounting, and other material one-time items. PSEG presents Operating Earnings because management believes that it is appropriate for investors to consider results excluding these items in addition to the results reported in accordance with GAAP. PSEG believes that the non-GAAP financial measure of Operating Earnings provides a consistent and comparable measure of performance of its businesses to help shareholders understand performance trends. This information is not intended to be viewed as an alternative to GAAP information. The last page in this presentation (Page A) includes a list of items excluded from Income from Continuing Operations to reconcile to Operating Earnings, with a reference to that slide included on each of the slides where the non-GAAP information appears. |
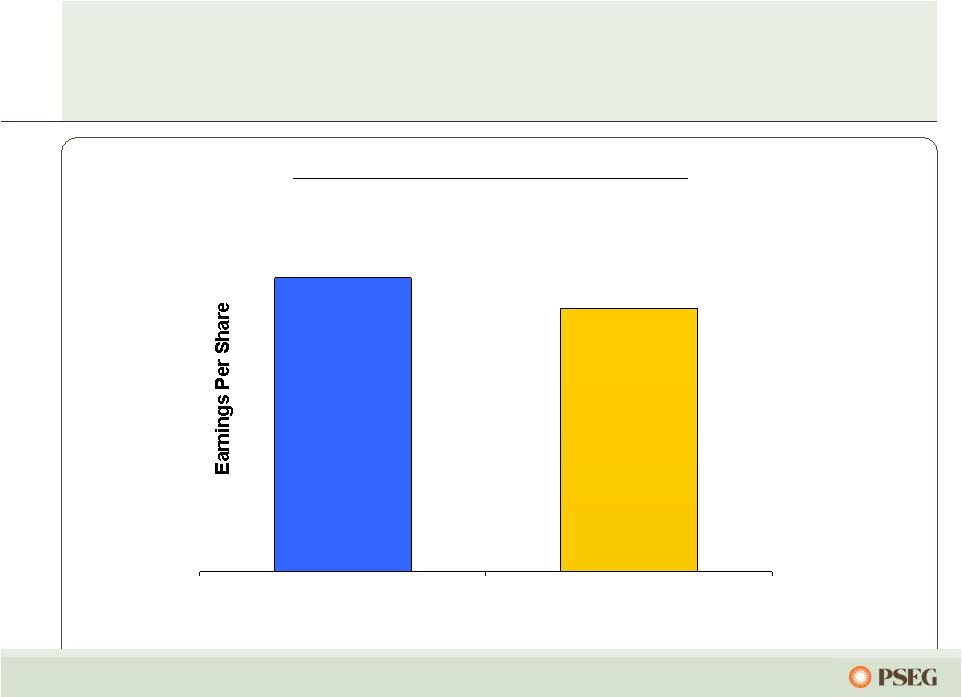 10 Our 2012 earnings guidance is influenced by a decline in energy prices and increased investment at PSE&G 2012 Operating Earnings Forecast *See page A for Items excluded from Income from Continuing Operations to reconcile to Operating Earnings; All periods reflect Texas in Discontinued Operations. E=Estimate. 2011 Operating Earnings* 2012 Guidance $2.25 to $2.50E $2.74 |
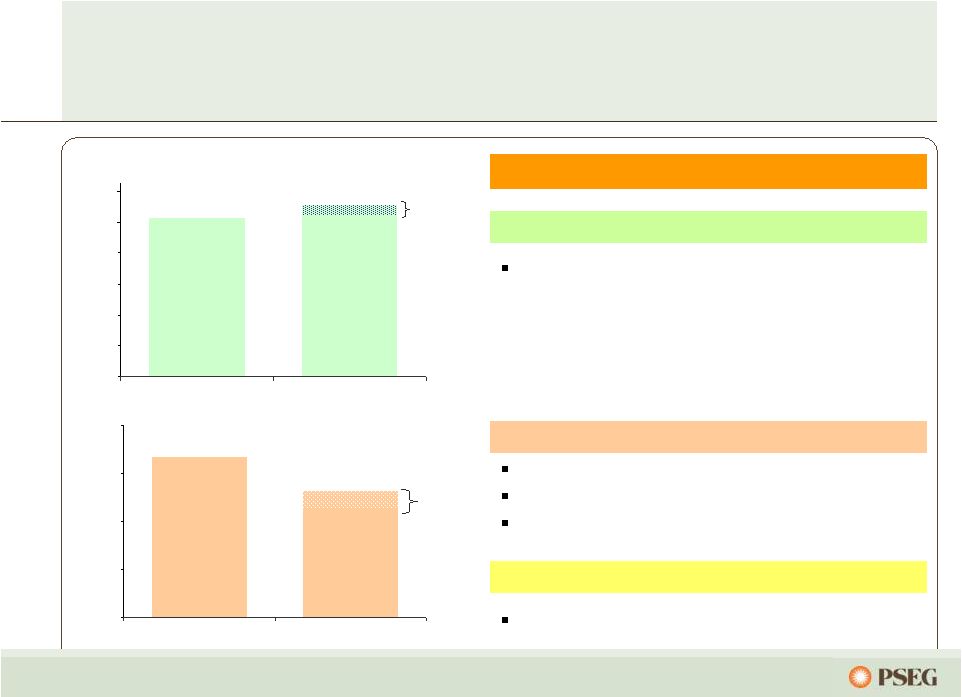 13 Guidance $1.31 $1.13 PSEG’s 2012 earnings guidance of $2.25 to $2.50 reflects continued improvement at PSE&G and a decline in margins at Power $0.00 $0.20 $0.40 $0.60 $0.80 $1.00 $1.20 2011 Operating Earnings* 2012E Earnings Guidance* PSE&G Earnings Per Share 2012 Assumptions PSE&G Growth in investments that provide contemporaneous returns — Transmission — Distribution economic stimulus programs — Programs supporting NJ’s Energy Master Plan Power Impacted by lower energy prices Near term effects minimized by hedges in place ~400MW new Peaking capacity in-service mid 2012 Energy Holdings / Parent Operating earnings guidance of $0.07 to $0.09 $0.00 $0.50 $1.00 $1.50 $2.00 2011 Operating Earnings* 2012E Earnings Guidance* Power Earnings Per Share Guidance $1.10 $1.05 *See page A for Items excluded from Income from Continuing Operations to reconcile to Operating Earnings; 2011 reflects Texas in Discontinued Operations. E = Estimate |
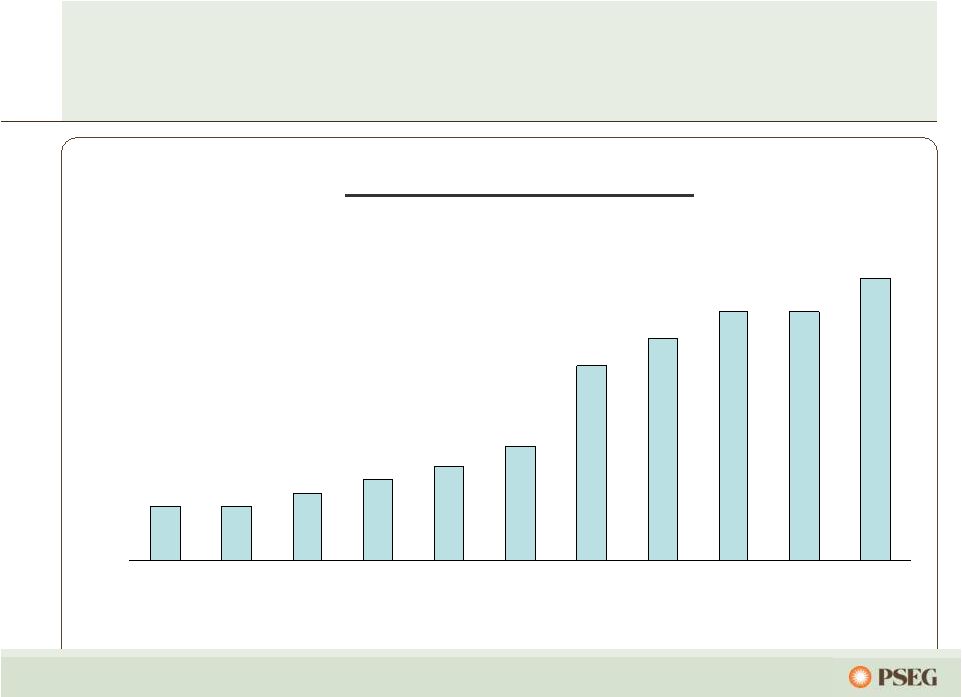 21 The business of PSEG: Returning cash to investors through common dividends and preserving flexibility to invest for future growth PSEG Annual Dividend Rate $1.08 $1.08 $1.10 $1.12 $1.14 $1.17 $1.29 $1.33 $1.37 $1.37 $1.42 2002 2003 2004 2005 2006 2007 2008 2009 2010 2011 2012 Payout Ratio 111% 62% 70% 63% 66% 43% 44% 43% 44% 50% 60%* 5-year Rate of Growth 3.95% 10-year Rate of Growth 2.78% *Based on mid-point of 2012 operating earnings guidance. |
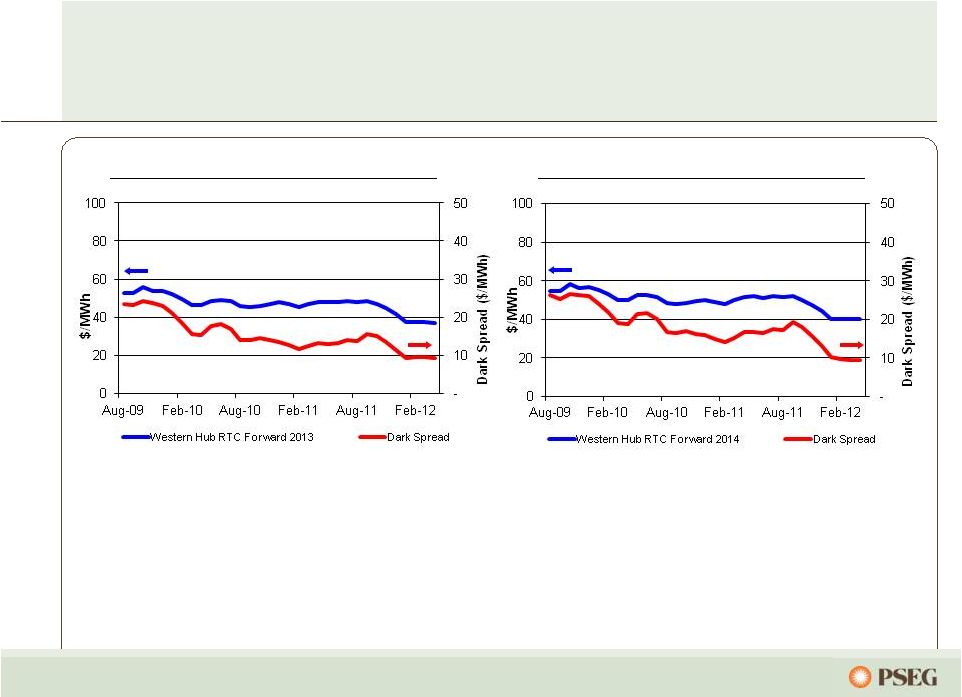 34 Actively managing our fleet in a volatile commodity market, with an asset profile that provides diverse opportunities for value creation • Steep natural gas decline has had a major impact on US power prices and Dark Spreads • Coal prices have been supported by long-term contracting and international demand • Decline in Dark Spread has led to reduced coal-fired generation in the last 15 months • Power’s investments in dual-fuel capability at Hudson and Mercer coal units have made them more attractive than many other coal units in this environment, and we have switched to gas generation as economics dictate 2014 Forward Prices & Dark Spread* 2013 Forward Prices & Dark Spread* * As of April 27, 2012. |
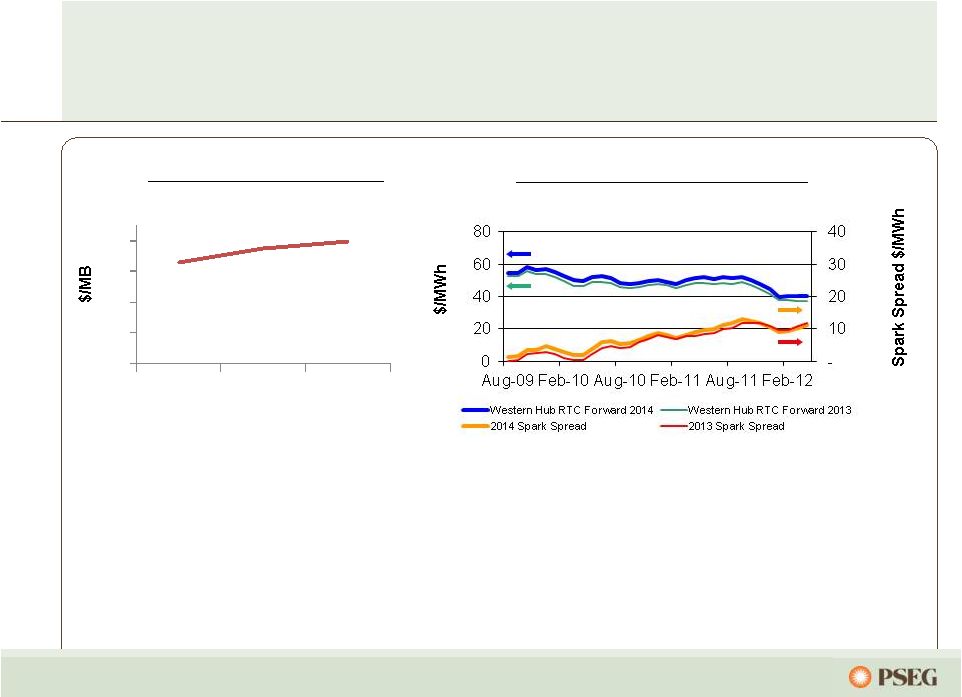 35 • Low power prices are not a good environment for any merchant generator, although Power is more of a hybrid with long-term contracting through BGS sales as well as forward hedging • Forward markets signal continued strength in Spark Spreads and Heat Rates • Strong spark spreads in the Northeast have benefitted our gas-fired fleet • Power is well positioned with hedged nuclear output and efficient combined cycle margin contribution Henry Hub Gas Forwards* 2013 and 2014 RTC Forward Prices & Spark Spread* 0 1 2 3 4 2013 2014 2015 Managing our fleet to capitalize on volatility * As of April 27, 2012. |
 48 PSEG Resources Leveraged Lease Portfolio Lessee Equipment 3/31/12 Invested ($ millions) S&P Credit Rating* REMA (GenOn) Keystone, Conemaugh & Shawville (PA) 3 coal fired plants (1,162 equity MW) 334 B Dynegy Holdings Danskammer & Roseton Generating Station (NY) 370 MW coal fired and 1,200 MW oil/gas fired - - Edison Mission Energy (EME) Powerton & Joliet Generating Stations (IL) 2 coal-fired generating facilities (1,640 equity MW) 218 CCC+ Merrill Creek – (PECO, MetEd, Delmarva P&L) Reservoir in NJ 130 BBB, BBB-, BBB+ Grand Gulf Nuclear station in Mississippi (154 equity MW) 66 A+ Renaissance Ctr. Office towers located in Detroit, MI leased to GM 41 BB+ Wal-Mart Portfolio of 6 Wal-Mart stores 12 AA E-D Centers Portfolio of 8 shopping centers 23 NR Total Leases $824 *Indicative recent rating as of 4/16/2012 reflecting either Lessee, additional equity collateral support or parent company unsecured debt rating. |
 50 PSEG 2012 Operating Earnings Guidance - By Subsidiary $ millions (except EPS) 2012E 2011 PSEG Power $575 – $665 $ 845 PSE&G $530 – $560 $ 521 PSEG Energy Holdings/Parent $35 – $45 $ 23 Operating Earnings* $1,140 – $1,270 $ 1,389 Earnings per Share $ 2.25 – $ 2.50 $2.74 * See page A for Items excluded from Income from Continuing Operations to reconcile to Operating Earnings. |
 57 Tax Update Definitive agreement reached with the IRS that settles the tax treatment for challenged lease transactions (LILO/SILO) for all tax years Settlement reached with the IRS for all federal audit issues for tax years 1997-2006 Expected net refund of ~$170M |
 Items Excluded from Income from Continuing Operations to Reconcile to Operating Earnings Please see Page 3 for an explanation of PSEG’s use of Operating Earnings as a non-GAAP financial measure and how it differs from Net Income. Page A Attachment 10 2012 2011 2011 2010 2009 Earnings Impact ($ Millions) Gain (Loss) on Nuclear Decommissioning Trust (NDT) Fund Related Activity (PSEG Power) 5 $ 27 $ 50 $ 46 $ 9 $ Gain (Loss) on Mark-to-Market (MTM) (a) (PSEG Power) 52 4 107 (1) (11) Lease Related Activity (PSEG Energy Holdings) 4 - (173) - 29 Market Transition Charge Refund (PSE&G) - - - (72) - Gain on Sale of Qwest Building (Energy Holdings) - - 34 - - Total Pro-forma adjustments 61 $ 31 $ 18 $ (27) $ 27 $ Fully Diluted Average Shares Outstanding (in Millions) 507 507 507 507 507 Per Share Impact (Diluted) Gain (Loss) on NDT Fund Related Activity (PSEG Power) 0.01 $ 0.05 $ 0.10 $ 0.09 $ 0.02 $ Gain (Loss) on MTM (a) (PSEG Power) 0.10 0.01 0.21 - (0.02) Lease Related Activity (PSEG Energy Holdings) 0.01 - (0.34) - 0.05 Market Transition Charge Refund (PSE&G) - - - (0.14) - Gain on Sale of Qwest Building (Energy Holdings) - - 0.06 - - Total Pro-forma adjustments 0.12 $ 0.06 $ 0.03 $ (0.05) $ 0.05 $ (a) Includes the financial impact from positions with forward delivery months. For the Three Months Ended For the Year Ended March 31, PUBLIC SERVICE ENTERPRISE GROUP INCORPORATED Reconciling Items Excluded from Continuing Operations to Compute Operating Earnings (Unaudited) Pro-forma Adjustments, net of tax December 31, |