 Public Service Enterprise Group PSEG Earnings Conference Call 2 nd Quarter 2014 July 30, 2014 EXHIBIT 99.1 |
 1 Forward-Looking Statement Certain of the matters discussed in this report about our and our subsidiaries' future performance, including, without limitation, future revenues, earnings, strategies, prospects, consequences and all other statements that are not purely historical constitute “forward-looking statements” within the meaning of the Private Securities Litigation Reform Act of 1995. Such forward-looking statements are subject to risks and uncertainties, which could cause actual results to differ materially from those anticipated. Such statements are based on management's beliefs as well as assumptions made by and information currently available to management. When used herein, the words “anticipate,” “intend,” “estimate,” “believe,” “expect,” “plan,” “should,” “hypothetical,” “potential,” “forecast,” “project,” variations of such words and similar expressions are intended to identify forward-looking statements. Factors that may cause actual results to differ are often presented with the forward-looking statements themselves. Other factors that could cause actual results to differ materially from those contemplated in any forward-looking statements made by us herein are discussed in filings we make with the United States Securities and Exchange Commission (SEC), including our Annual Report on Form 10-K and subsequent reports on Form 10-Q and Form 8-K and available on our website: http://www.pseg.com. These factors include, but are not limited to: • adverse changes in the demand for or the price of the capacity and energy that we sell into wholesale electricity markets, • adverse changes in energy industry law, policies and regulation, including market structures and a potential shift away from competitive markets toward subsidized market mechanisms, transmission planning and cost allocation rules, including rules regarding how transmission is planned and who is permitted to build transmission in the future, and reliability standards, • any inability of our transmission and distribution businesses to obtain adequate and timely rate relief and regulatory approvals from federal and state regulators, • changes in federal and state environmental regulations and enforcement that could increase our costs or limit our operations, • changes in nuclear regulation and/or general developments in the nuclear power industry, including various impacts from any accidents or incidents experienced at our facilities or by others in the industry, that could limit operations of our nuclear generating units, • actions or activities at one of our nuclear units located on a multi-unit site that might adversely affect our ability to continue to operate that unit or other units located at the same site, • any inability to manage our energy obligations, available supply and risks, adverse outcomes of any legal, regulatory or other proceeding, settlement, investigation or claim applicable to us and/or the energy industry, • any deterioration in our credit quality or the credit quality of our counterparties, • availability of capital and credit at commercially reasonable terms and conditions and our ability to meet cash needs, • changes in the cost of, or interruption in the supply of, fuel and other commodities necessary to the operation of our generating units, • delays in receipt of necessary permits and approvals for our construction and development activities, • delays or unforeseen cost escalations in our construction and development activities, • any inability to achieve, or continue to sustain, our expected levels of operating performance, • any equipment failures, accidents, severe weather events or other incidents that impact our ability to provide safe and reliable service to our customers, and any inability to obtain sufficient insurance coverage or recover proceeds of insurance with respect to such events, • acts of terrorism, cybersecurity attacks or intrusions that could adversely impact our businesses, • increases in competition in energy supply markets as well as competition for certain transmission projects, • any inability to realize anticipated tax benefits or retain tax credits, • challenges associated with recruitment and/or retention of a qualified workforce, • adverse performance of our decommissioning and defined benefit plan trust fund investments and changes in funding requirements, • changes in technology, such as distributed generation and micro grids, and greater reliance on these technologies, and • changes in customer behaviors, including increases in energy efficiency, net-metering and demand response. All of the forward-looking statements made in this report are qualified by these cautionary statements and we cannot assure you that the results or developments anticipated by management will be realized or even if realized, will have the expected consequences to, or effects on, us or our business prospects, financial condition or results of operations. Readers are cautioned not to place undue reliance on these forward-looking statements in making any investment decision. Forward-looking statements made in this report apply only as of the date of this report. While we may elect to update forward-looking statements from time to time, we specifically disclaim any obligation to do so, even if internal estimates change, unless otherwise required by applicable securities laws. The forward-looking statements contained in this report are intended to qualify for the safe harbor provisions of Section 27A of the Securities Act of 1933, as amended, and Section 21E of the Securities Exchange Act of 1934, as amended. |
 2 GAAP Disclaimer PSEG presents Operating Earnings in addition to its Net Income reported in accordance with accounting principles generally accepted in the United States (GAAP). Operating Earnings is a non-GAAP financial measure that differs from Net Income because it excludes gains or losses associated with Nuclear Decommissioning Trust (NDT), Mark-to-Market (MTM) accounting, and other material one-time items. PSEG presents Operating Earnings because management believes that it is appropriate for investors to consider results excluding these items in addition to the results reported in accordance with GAAP. PSEG believes that the non-GAAP financial measure of Operating Earnings provides a consistent and comparable measure of performance of its businesses to help shareholders understand performance trends. This information is not intended to be viewed as an alternative to GAAP information. The last slide in this presentation includes a list of items excluded from Net Income to reconcile to Operating Earnings, with a reference to that slide included on each of the slides where the non- GAAP information appears. These materials and other financial releases can be found on the pseg.com website under the investor tab, or at http://investor.pseg.com/ |
 PSEG 2014 Q2 Review Ralph Izzo Chairman, President and Chief Executive Officer |
 4 Q2 Earnings Summary $ millions (except EPS) 2014 2013 Operating Earnings $ 245 $ 243 Reconciling Items, Net of Tax (33) 90 Net Income $ 212 $ 333 EPS from Operating Earnings* $ 0.49 $ 0.48 Quarter ended June 30 * See Slide A for Items excluded from Net Income to reconcile to Operating Earnings. |
 5 First Half 2014 Earnings Summary Six months ended June 30 $ millions (except EPS) Operating Earnings Reconciling Items, Net of Tax Net Income EPS from Operating Earnings* 2014 2013 $ 760 (162) $ 598 $ 1.50 $ 676 (23) $ 653 $ 1.33 * See Slide A for Items excluded from Net Income to reconcile to Operating Earnings. |
 6 PSEG – Q2 2014 Highlights Earnings on Track Operating earnings of $0.49 vs. $0.48 per share in Q2 2013 Increased earnings contribution from PSE&G’s investment in Transmission Expect 2014 Operating Earnings to be at the upper end of the $2.55 to $2.75 per share guidance range – assuming normal weather and plant operations for the balance of the year Operating Review PSEG Power output down 5% vs. Q2 2013 from Linden and Salem 2 outages, partially offset by improvement in coal generation PSE&G placed the 230 kV North Central Reliability transmission project in service Power’s fleet fully restored from storm outages PSEG Disciplined Capital Investment BPU approved $1.22 billion investment in PSE&G’s Energy Strong infrastructure program PJM deferred a final decision on its recommended solution, to be built by PSE&G, for the Artificial Island project via FERC 1000 competitive bidding process Market Developments Recent EPA actions on 316(b) and GHGs |
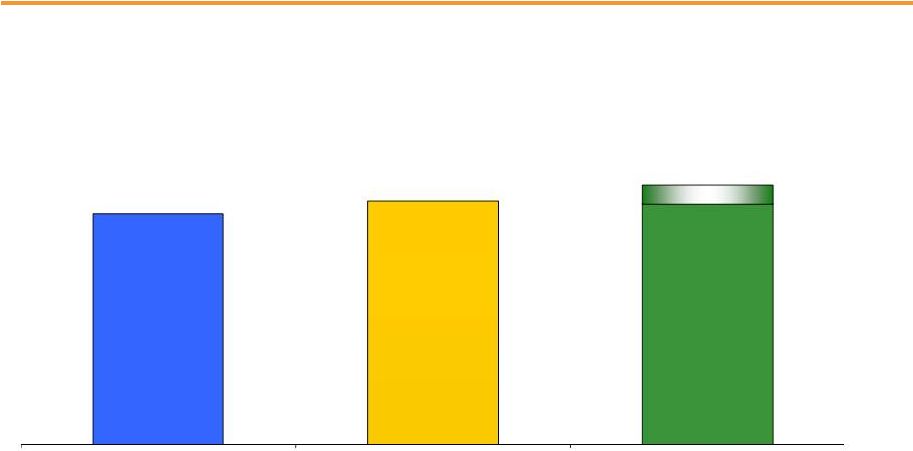 7 $2.55 - $2.75E PSEG – 2014 Earnings Guidance at the Upper End of Range $2.44 $2.58 2014 guidance reflects increased level of investment, pension savings and assumes normal weather and unit operations for rest of year 2012 Operating Earnings* 2013 Operating Earnings* 2014 Operating Earnings Guidance * See Slide A for Items excluded from Net Income to reconcile to Operating Earnings. E = Estimate. |
 PSEG 2014 Q2 Operating Company Review Caroline Dorsa EVP and Chief Financial Officer |
 9 Q2 Operating Earnings by Subsidiary Operating Earnings Earnings per Share $ millions (except EPS) 2014 2013 2014 2013 PSE&G $ 151 $ 121 $ 0.30 $ 0.24 PSEG Power 87 120 0.17 0.24 PSEG Enterprise/Other 7 2 0.02 - Operating Earnings* $ 245 $ 243 $ 0.49 $ 0.48 Quarter ended June 30 * See Slide A for Items excluded from Net Income to reconcile to Operating Earnings. |
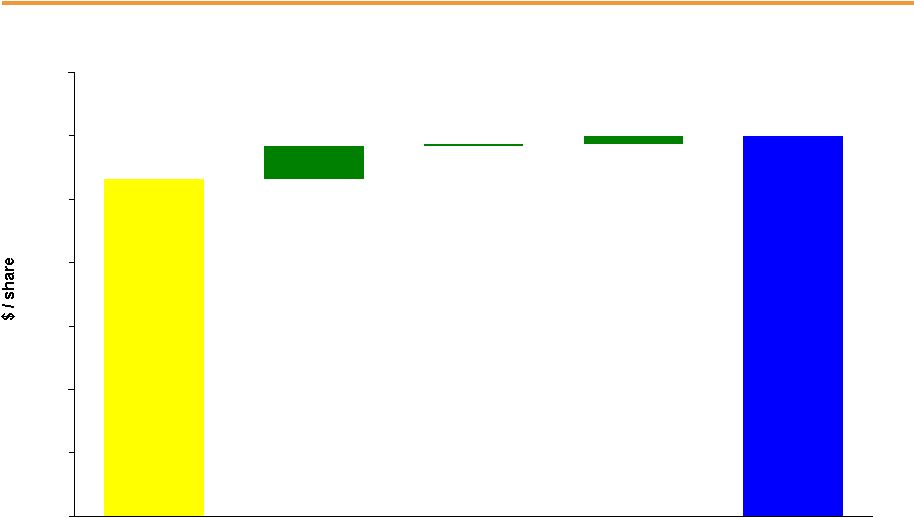
 10 $0.48 0.06 0.02 $0.49 (0.07) 0.00 0.10 0.20 0.30 0.40 0.50 0.60 PSEG EPS Reconciliation – Q2 2014 versus Q2 2013 Q2 2014 Operating Earnings* Q2 2013 Operating Earnings* PSEG Power PSE&G Enterprise/ Other Capacity 0.04 Re-Contracting & Market Pricing (0.04) Lower Volume (0.03) O&M (0.04) D&A (0.01) Taxes & Other 0.01 Transmission Net Earnings 0.03 Gas Volume & Other Revenue 0.01 Weather (0.01) O&M 0.02 Lower Interest Expense 0.01 PSEG Long Island and Other * See Slide A for Items excluded from Net Income to reconcile to Operating Earnings. |
 11 First Half Operating Earnings by Subsidiary Operating Earnings Earnings per Share $ millions (except EPS) 2014 2013 2014 2013 PSE&G $ 365 $ 300 $ 0.72 $ 0.59 PSEG Power 380 374 0.75 0.74 PSEG Enterprise/Other 15 2 0.03 - Operating Earnings* $ 760 $ 676 $ 1.50 $ 1.33 Six months ended June 30 •See Slide A for Items excluded from Net Income to reconcile to Operating Earnings. |
 12 $1.50 0.03 0.01 0.13 $1.33 0.00 0.25 0.50 0.75 1.00 1.25 1.50 1.75 PSEG EPS Reconciliation – First Half 2014 versus First Half 2013 YTD 2014 Operating Earnings* YTD 2013 Operating Earnings* Capacity 0.15 Re-Contracting & Market Pricing (0.04) Lower Volume (0.01) O&M (0.08) D&A (0.01) PSEG Power Transmission Net Earnings 0.06 Gas Volume, Demand & Other Revenue 0.03 Distribution O&M 0.02 Lower Interest Expense 0.01 Taxes & Other 0.01 PSE&G Enterprise/ Other PSEG Long Island and Other * See Slide A for Items excluded from Net Income to reconcile to Operating Earnings. |
 PSE&G 2014 Q2 Review |
 14 PSE&G – Q2 EPS Summary $ millions (except EPS) Q2 2014 Q2 2013 Variance Operating Revenues $ 1,435 $ 1,423 $ 12 Operating Expenses 565 580 (15) 362 369 (7) 217 207 10 - 14 (14) Total Operating Expenses 1,144 1,170 (26) Operating Earnings/Net Income $ 151 $ 121 $ 30 EPS from Operating Earnings/Net Income $ 0.30 $ 0.24 $ 0.06 Energy Costs Operation & Maintenance Depreciation & Amortization Taxes Other than Income Taxes |
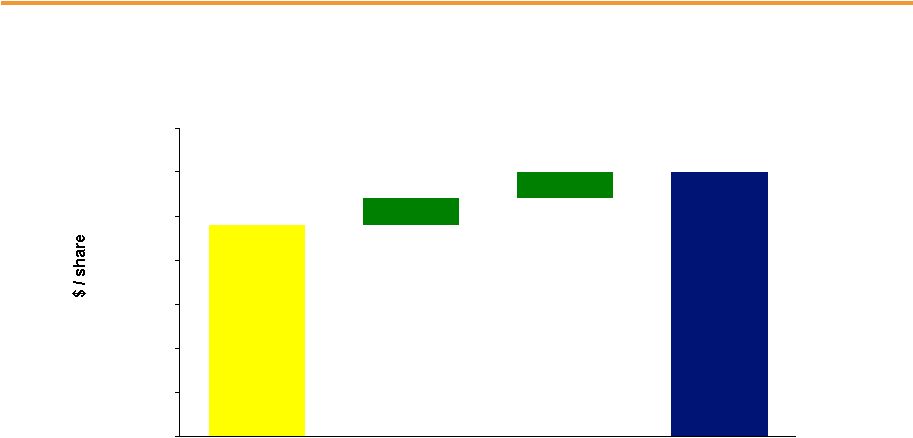 15 PSE&G EPS Reconciliation – Q2 2014 versus Q2 2013 Q2 2013 Operating Earnings* Q2 2014 Operating Earnings* * Operating Earnings is equal to Net Income. $0.24 0.03 0.03 $0.30 0.00 0.05 0.10 0.15 0.20 0.25 0.30 0.35 Transmission Net Earnings 0.03 Gas Volume & Other Revenue 0.01 Weather (0.01) O&M 0.02 Lower Interest Expense 0.01 |
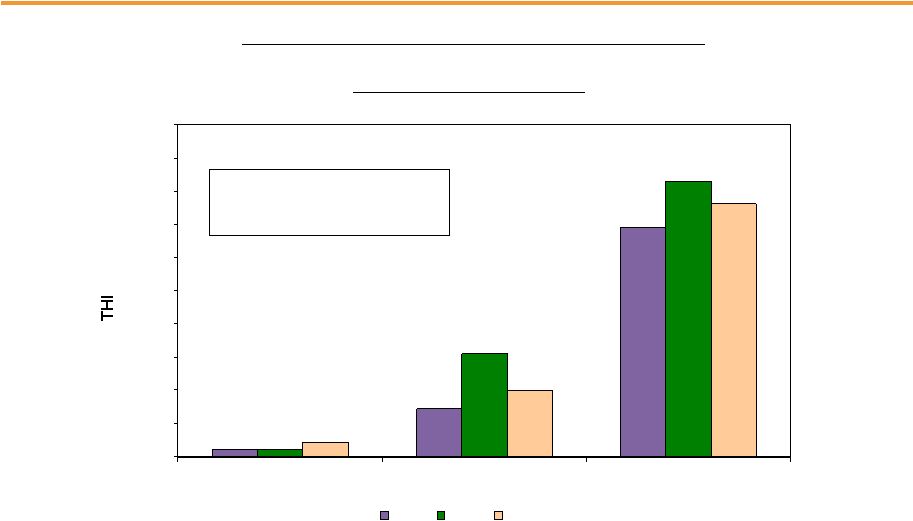 16 PSE&G – Monthly Summer Weather Data 84 579 2,771 83 1,242 3,330 170 794 3,054 0 400 800 1,200 1,600 2,000 2,400 2,800 3,200 3,600 4,000 April May June 2014 2013 Normal 2014 vs. 2013 vs. Normal PSE&G Monthly Temperature Humidity Index (THI) -26% Q2 2014 vs. Q2 2013 -15% Q2 2014 vs. Normal |
 17 PSE&G – Q2 2014 Operating Highlights Operations PSE&G received final NJBPU approval to invest $1.22 billion in the Energy Strong program PJM deferred a final decision on its recommended solution, to be built by PSE&G, for the Artificial Island project via FERC 1000 competitive bidding process Construction of major transmission lines progressing on schedule and on budget PSE&G residential gas customers to benefit from a proposed rate reduction this October, estimated to save the average customer $100 per year PSE&G plans to invest over $2.2 billion in its T&D system in 2014 PSE&G’s 2014-2018 Capital Spending increased to $11.3 billion with recently approved Energy Strong PSE&G earned its authorized return in the quarter PSE&G issued $250 million, 1.8% secured medium-term notes due June 2019 and $250 million, 4% secured medium-term notes due June 2044 S&P revised PSE&G’s credit rating outlook from Stable to Positive Financial Q2 2014 weather was milder than Q2 2013: Heating degree days were 3% below normal, and cooling load was 15% below normal Economy slowly improving, weather normalized electric sales up 1.6% YTD; residential demand up 0.5% and commercial sector up 1.3% in Q2 Gas deliveries (weather normal), up 7.5% in Q2 and up 4.4% for the YTD, continue to benefit from decline in supply costs Regulatory and Market Environment |
 PSEG Power 2014 Q2 Review |
 19 PSEG Power – Q2 EPS Summary $ millions (except EPS) Q2 2014 Q2 2013 Variance Operating Revenues $ 986 $ 1,193 $ (207) Operating Earnings 87 120 (33) Reconciling Items, Net of Tax** (33) 90 (123) Net Income $ 54 $ 210 $ (156) EPS from Operating Earnings* $ 0.17 $ 0.24 $ (0.07) * See Slide A for Items excluded from Net Income to reconcile to Operating Earnings. ** Includes the financial impact from Mark-to-Market positions with forward delivery months. |
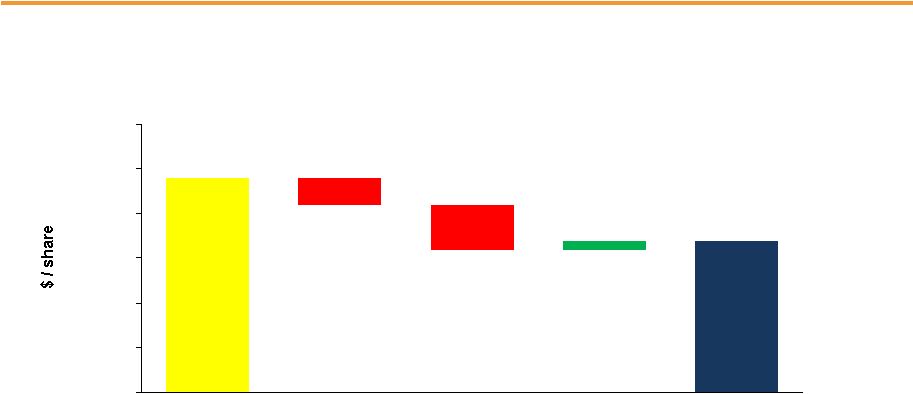 20 $0.24 0.01 $0.17 (0.03) (0.05) 0.00 0.05 0.10 0.15 0.20 0.25 0.30 Capacity 0.04 Lower Volume (0.03) Re-Contracting & Market Pricing (0.04) PSEG Power EPS Reconciliation – Q2 2014 versus Q2 2013 Q2 2014 Operating Earnings* Q2 2013 Operating Earnings* O&M (0.04) D&A (0.01) Taxes and Other * See Slide A for Items excluded from Net Income to reconcile to Operating Earnings. |
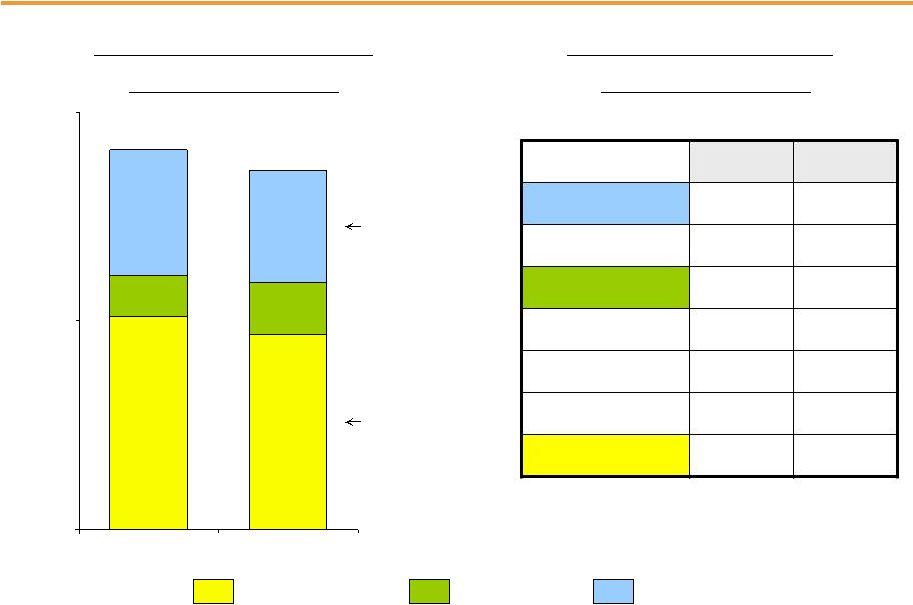 21 PSEG Power – Q2 2014 Generation Measures 7,147 6,538 4,187 3,788 1,724 1,384 0 7,000 14,000 2013 2014 Quarter ended June 30 Total Nuclear Total Coal* Oil & Natural Gas Generation by Fuel (GWh)** 12,050 Quarter ended June 30 2013 2014 Combined Cycle PJM and NY 57% 49% Coal* NJ (Coal/Gas) 8% 14% PA 70% 80% CT 3% 4% Nuclear 88% 81% 12,718 Fleet Capacity Factors (%) 54% of Output 31% of Output * Includes figures for Pumped Storage; also includes Natural Gas fuel switching intervals. ** Excludes Solar and Kalaeloa. |
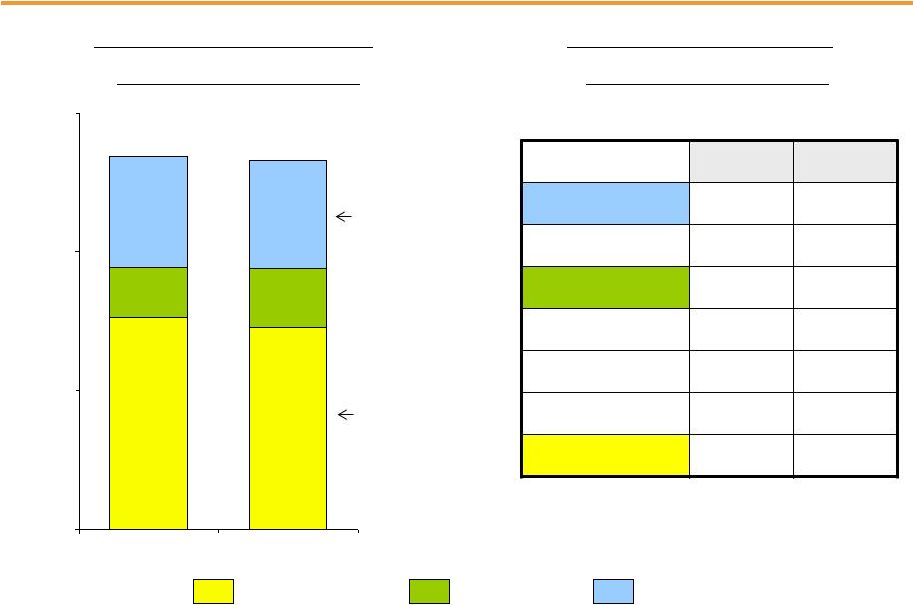 22 PSEG Power – YTD 2014 Generation Measures 15,284 14,588 7,764 3,590 4,266 8,001 0 10,000 20,000 30,000 2013 2014 Six Months ended June 30 Total Nuclear Total Coal* Oil & Natural Gas 26,875 26,618 Six Months ended June 30 2013 2014 Combined Cycle PJM and NY 55% 48% Coal* NJ (Coal/Gas) 13% 17% PA 78% 81% CT 19% 38% Nuclear 94% 90% 29% of Output 55% of Output Generation by Fuel (GWh)** Fleet Capacity Factors (%) * Includes figures for Pumped Storage; also includes Natural Gas fuel switching intervals. ** Excludes Solar and Kalaeloa. |
 23 PSEG Power – Fuel Costs Quarter ended June 30 ($ millions) 2013 2014 Coal $30 $40 Oil & Gas 160 119 Total Fossil 190 159 Nuclear 52 47 Total Fuel Cost $242 $206 Total Generation (GWh) 12,718 12,050 $ / MWh 19.03 17.10 PSEG Power – Fuel Costs YTD June 30 ($ millions) 2013 2014 Coal $96 $127 Oil & Gas 338 484 Total Fossil 434 611 Nuclear 110 109 Total Fuel Cost $544 $720 Total Generation (GWh) 26,875 26,618 $ / MWh 20.24 27.05 |
 24 PSEG Power – Gross Margin Performance $0 $10 $20 $30 $40 $50 2012 2013 2014 $42 $43 Quarter ended June 30 Weather-driven volatility pushed natural gas and power prices to multi-year highs; Q2 spot prices in PJM peaked in April Decline in average hedge prices Capacity prices reset on June 1 to ~$166/MW-day and remain stable for the next three capacity years Fuel flexibility and access to lower cost Marcellus gas continue to benefit margin Q2 2014 Regional Performance Region Gross Margin ($M) 2014 Performance PJM $468 Higher capacity pricing for most of the quarter offset lower hedge prices. Output hurt by outages at Linden and Salem 2. New England $18 Higher volume offset lower priced hedges. New York $18 Higher volume offset lower pricing. PSEG Power Gross Margin ($/MWh) $43 |
 25 Hedging Update… Contracted Energy* * Hedge percentages and prices as of June 30, 2014. Revenues of full requirement load deals based on contract price, including renewable energy credits, ancillary, and transmission components but excluding capacity. Hedges include positions with MTM accounting treatment and options. Jul-Dec 2014 2015 2016 Volume TWh 17 36 36 Base Load % Hedged 100% 100% 45-50% (Nuclear and Base Load Coal) Price $/MWh $50 $50 $51 Volume TWh 13 21 19 Intermediate Coal, Combined % Hedged 35-40% 5-10% 0% Cycle, Peaking Price $/MWh $50 $50 $51 Volume TWh 30 55-57 55-57 Total % Hedged 70-75% 65-70% 30-35% Price $/MWh $50 $50 $51 |
 26 PSEG Power – Q2 2014 Operating Highlights Q2 output down 5% due to Linden and Salem 2 outages Advance gas path uprates (~63MW) completed at Linden Output of NJ coal units was 10% coal, 90% gas fueled in Q2; 45% coal, 55% gas for the YTD Operations Financial Regulatory and Market Environment Capacity pricing for the 2014/2015 capacity year reset to $166 MW/day on June 1 Access to Marcellus gas benefited off-system sales and reduced the fleet’s cost of gas FERC and PJM reviewing implications of circuit court ruling on use of DR in capacity auctions Power recorded a charge of $25 million in Q1 2014 related to potential liability associated with the discovery of bidding errors in the PJM energy market. Power identified additional errors in Q2 2014, as well as differences between the quantity of energy offered into the market and the amount for which it was compensated in the capacity market. Power has corrected these errors. This matter remains under review with the FERC, PJM and its Independent Market Monitor. We are unable to estimate the ultimate impact or predict any resulting penalties or other costs associated with the matter at this time. Power’s total debt as a percentage of capital at June 30 was 32% S&P revised PSEG Power’s credit rating outlook from Stable to Positive |
 PSEG |
 28 PSEG Financial Highlights Maintaining 2014 operating earnings guidance of $2.55 - $2.75 per share, expecting results at upper end of the range Focused on maintaining operating efficiency and customer reliability PSE&G expected to grow at double-digit rate in 2014 and provide over 50% of operating earnings PSE&G expanded capital program of $11.3 billion over 2014-2018 is expected to further support double digit rate base growth PSEG capital program now projected at $13.1 billion over the 2014-2018 period PSE&G has begun construction of Energy Strong infrastructure projects and continues to build out its Transmission plan on-time and on-budget Financial position remains strong Positive cash from Power and increasing cash flow from PSE&G supports sustainable dividend growth and funds capital spending program without the need to issue equity PSEG’s debt as a percentage of capital was 42% at June 30 Standard & Poor’s revised the credit rating outlooks of PSEG, PSE&G and PSEG Power from Stable to Positive in May Long history of returning cash to the shareholder through the common dividend, with opportunity for consistent and sustainable dividend growth |
 29 PSEG 2014 Operating Earnings Guidance - By Subsidiary $ millions (except EPS) 2014E 2013 2012 PSE&G $705 – $745 $612 $528 PSEG Power $550 – $610 $710 $663 PSEG Enterprise/Other $35 – $40 $(13) $45 Operating Earnings* $1,290 – $1,395 $1,309 $1,236 Earnings per Share $2.55 – $2.75 $2.58 $2.44 * See Slide A for Items excluded from Net Income to reconcile to Operating Earnings. E = Estimate. |
 Expiration Total Available Company Facility Date Facility Usage Liquidity ($Millions) PSE&G 5-year Credit Facility Mar-18 $600 1 $13 $587 5-Year Credit Facility (Power) Apr-19 $1,600 $114 $1,486 5-Year Credit Facility (Power) Mar-18 $1,000 2 $0 $1,000 5-Year Bilateral (Power) Sep-15 $100 $100 $0 5-year Credit Facility (PSEG) Apr-19 $500 $8 $492 5-year Credit Facility (PSEG) Mar-18 $500 3 $0 $500 Total $4,300 $4,065 1 PSE&G Facility to be reduced by $29M on April 15, 2016 $278 2 Power Facility to be reduced by $48M on April 15, 2016 PSE&G ST Investment $224 3 PSEG Facility to be reduced by $23M on April 15, 2016 Total Liquidity Available $4,567 Total Parent / Power Liquidity $3,756 PSEG / Power PSEG Money Pool ST Investment PSEG Liquidity as of June 30, 2014 30 $235 |
 A Items Excluded from Net Income to Reconcile to Operating Earnings Please see Slide 2 for an explanation of PSEG’s use of Operating Earnings as a non-GAAP financial measure and how it differs from Net Income. 2014 2013 2014 2013 2013 2012 Earnings Impact ($ Millions) Operating Earnings 245 $ 243 $ 760 $ 676 $ 1,309 $ 1,236 $ Gain (Loss) on Nuclear Decommissioning Trust (NDT) Fund Related Activity (PSEG Power) 14 8 23 17 40 52 Gain (Loss) on Mark-to-Market (MTM) (a) (PSEG Power) (42) 80 (174) (25) (74) (10) Lease Related Activity (PSEG Enterprise/Other) - - - - - 36 Storm O&M, net of insurance recoveries (PSEG Power) (5) 2 (11) (15) (32) (39) Net Income 212 $ 333 $ 598 $ 653 $ 1,243 $ 1,275 $ Fully Diluted Average Shares Outstanding (in Millions) 508 507 508 507 508 507 Per Share Impact (Diluted) Operating Earnings 0.49 $ 0.48 $ 1.50 $ 1.33 $ 2.58 $ 2.44 $ Gain (Loss) on NDT Fund Related Activity (PSEG Power) 0.02 0.02 0.04 0.04 0.08 0.10 Gain (Loss) on MTM (a) (PSEG Power) (0.08) 0.16 (0.34) (0.05) (0.14) (0.02) Lease Related Activity (PSEG Enterprise/Other) - - - - - 0.07 Storm O&M, net of insurance recoveries (PSEG Power) (0.01) - (0.02) (0.03) (0.07) (0.08) Net Income 0.42 $ 0.66 $ 1.18 $ 1.29 $ 2.45 $ 2.51 $ (a) Includes the financial impact from positions with forward delivery months. June 30, June 30, December 31, (Unaudited) PUBLIC SERVICE ENTERPRISE GROUP INCORPORATED Reconciling Items, net of tax Three Months Ended Six Months Ended Year Ended |