 Forward-Looking Statement EXHIBIT 99 2 Certain of the matters discussed in this report about our and our subsidiaries' future performance, including, without limitation, future revenues, earnings, strategies, prospects, consequences and all other statements that are not purely historical constitute “forward-looking statements” within the meaning of the Private Securities Litigation Reform Act of 1995. Such forward-looking statements are subject to risks and uncertainties, which could cause actual results to differ materially from those anticipated. Such statements are based on management's beliefs as well as assumptions made by and information currently available to management. When used herein, the words “anticipate,” “intend,” “estimate,” “believe,” “expect,” “plan,” “should,” “hypothetical,” “potential,” “forecast,” “project,” variations of such words and similar expressions are intended to identify forward-looking statements. Factors that may cause actual results to differ are often presented with the forward-looking statements themselves. Other factors that could cause actual results to differ materially from those contemplated in any forward-looking statements made by us herein are discussed in filings we make with the United States Securities and Exchange Commission (SEC), including our Annual Report on Form 10-K and subsequent reports on Form 10-Q and Form 8-K and available on our website: http://www.pseg.com. These factors include, but are not limited to: adverse changes in the demand for or the price of the capacity and energy that we sell into wholesale electricity markets, adverse changes in energy industry law, policies and regulation, including market structures and a potential shift away from competitive markets toward subsidized market mechanisms, transmission planning and cost allocation rules, including rules regarding how transmission is planned and who is permitted to build transmission in the future, and reliability standards, any inability of our transmission and distribution businesses to obtain adequate and timely rate relief and regulatory approvals from federal and state regulators, changes in federal and state environmental regulations and enforcement that could increase our costs or limit our operations, changes in nuclear regulation and/or general developments in the nuclear power industry, including various impacts from any accidents or incidents experienced at our facilities or by others in the industry, that could limit operations of our nuclear generating units, actions or activities at one of our nuclear units located on a multi-unit site that might adversely affect our ability to continue to operate that unit or other units located at the same site, any inability to manage our energy obligations, available supply and risks, adverse outcomes of any legal, regulatory or other proceeding, settlement, investigation or claim applicable to us and/or the energy industry, any deterioration in our credit quality or the credit quality of our counterparties, availability of capital and credit at commercially reasonable terms and conditions and our ability to meet cash needs, changes in the cost of, or interruption in the supply of, fuel and other commodities necessary to the operation of our generating units, delays in receipt of necessary permits and approvals for our construction and development activities, delays or unforeseen cost escalations in our construction and development activities, any inability to achieve, or continue to sustain, our expected levels of operating performance, any equipment failures, accidents, severe weather events or other incidents that impact our ability to provide safe and reliable service to our customers, and any inability to obtain sufficient insurance coverage or recover proceeds of insurance with respect to such events, acts of terrorism, cybersecurity attacks or intrusions that could adversely impact our businesses, increases in competition in energy supply markets as well as competition for certain transmission projects, any inability to realize anticipated tax benefits or retain tax credits, challenges associated with recruitment and/or retention of a qualified workforce, adverse performance of our decommissioning and defined benefit plan trust fund investments and changes in funding requirements, changes in technology, such as distributed generation and micro grids, and greater reliance on these technologies, and changes in customer behaviors, including increases in energy efficiency, net-metering and demand response. All of the forward-looking statements made in this report are qualified by these cautionary statements and we cannot assure you that the results or developments anticipated by management will be realized or even if realized, will have the expected consequences to, or effects on, us or our business prospects, financial condition or results of operations. Readers are cautioned not to place undue reliance on these forward-looking statements in making any investment decision. Forward-looking statements made in this report apply only as of the date of this report. While we may elect to update forward-looking statements from time to time, we specifically disclaim any obligation to do so, even if internal estimates change, unless otherwise required by applicable securities laws. The forward-looking statements contained in this report are intended to qualify for the safe harbor provisions of Section 27A of the Securities Act of 1933, as amended, and Section 21E of the Securities Exchange Act of 1934, as amended. |
 GAAP Disclaimer PSEG presents Operating Earnings in addition to its Income from Continuing Operations/Net Income reported in accordance with accounting principles generally accepted in the United States (GAAP). Operating Earnings is a non- GAAP financial measure that differs from Income from Continuing Operations/Net Income because it excludes gains or losses associated with Nuclear Decommissioning Trust (NDT), Mark-to-Market (MTM) accounting, and other material one-time items. PSEG presents Operating Earnings because management believes that it is appropriate for investors to consider results excluding these items in addition to the results reported in accordance with GAAP. PSEG believes that the non-GAAP financial measure of Operating Earnings provides a consistent and comparable measure of performance of its businesses to help shareholders understand performance trends. This information is not intended to be viewed as an alternative to GAAP information. Slides A and B at the end of this presentation include a list of items excluded from Income from Continuing Operations/Net Income to reconcile to Operating Earnings, with a reference to that slide included on each of the slides where the non-GAAP information appears. These materials and other financial releases can be found on the pseg.com website under the investor tab, or at http://investor.pseg.com/ 3 |
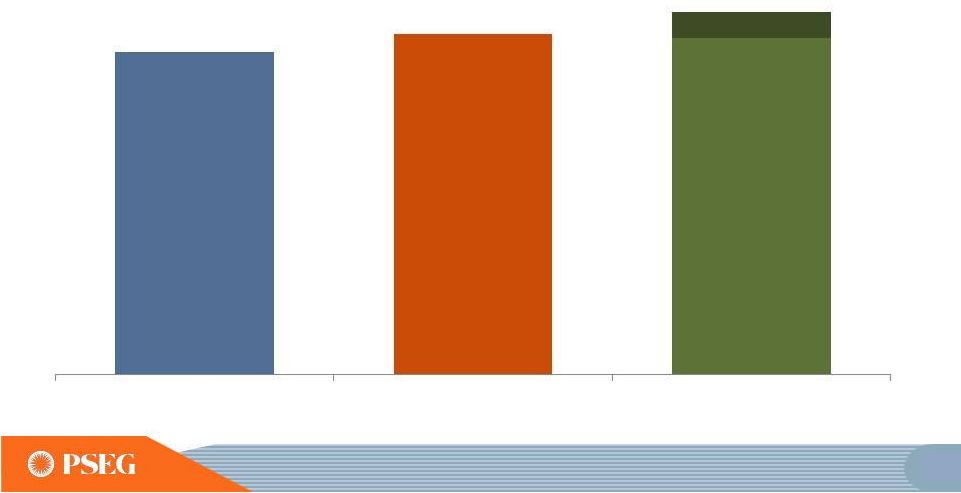 PSEG 2014 Operating Earnings expected to be at the upper end of guidance range $2.44 $2.58 $2.55 - $2.75E Reflects increased level of utility investment, pension savings and assumes normal weather and unit operations for the rest of year 8 2012 2013 2014 Guidance SEE SLIDE A FOR ITEMS EXCLUDED FROM INCOME FROM CONTINUING OPERATIONS/NET INCOME TO RECONCILE TO OPERATING EARNINGS. E = ESTIMATE. |
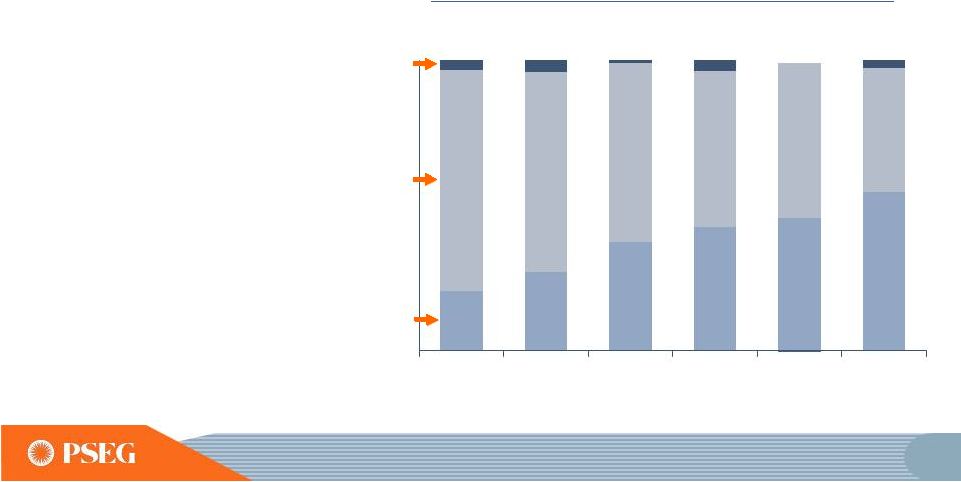 Operating Earnings Mix Long term investment program has driven increased earnings contribution from stable, regulated business *SEE SLIDE A FOR ITEMS EXCLUDED FROM INCOME FROM CONTINUING OPERATIONS/ NET INCOME TO RECONCILE TO OPERATING EARNINGS; DISCONTINUED OPERATIONS REFLECT TEXAS. E=ESTIMATE ** 2014 PERCENTS USE MIDPOINT OF EARNINGS GUIDANCE. Power’s diverse fuel mix and dispatch flexibility continues to generate earnings and free cash flow PSE&G’s investment in transmission has diversified its asset base and, coupled with other investments and cost controls, supported compound annual earnings growth of ~18% over 2009 – 2013 Operating Earnings* Contribution by Subsidiary (%) PSE&G Power Other $2.44 $2.58 $2.55 - $2.75E $3.12 $2.74 $3.09 2009 2010 2011 2012 2013 2014E** 9 20% 27% 38% 43% 47% 54% 76% 69% 62% 54% 54% 43% |
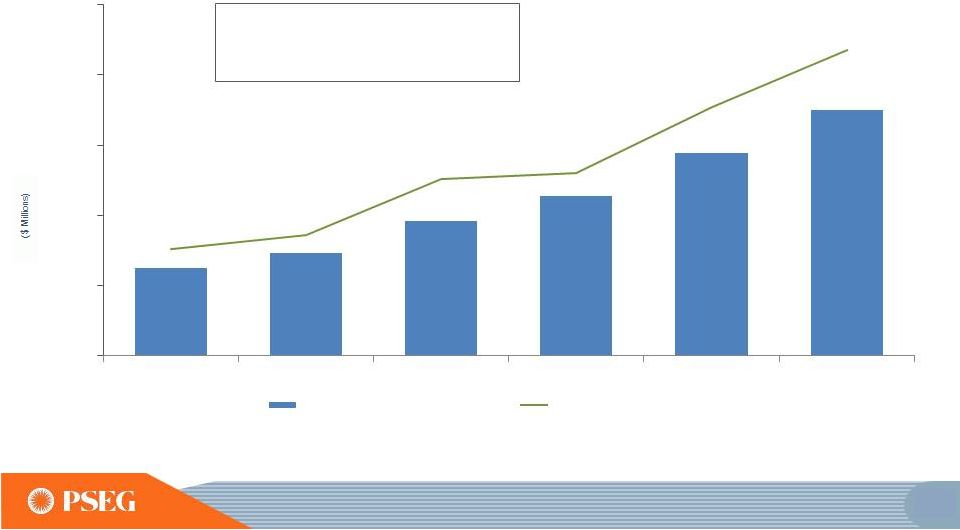 PSEG’s business profile has been transformed through significant growth in utility capital spending, and we have consistently identified attractive opportunities for additional investment 3 YR AVG 3 YR AVG ENDED 3 YEAR AVERAGE PSE&G CAPITAL SPENDING GREW AT A RATE OF 23% PER YEAR FROM 2008 - 2013 AVERAGE PSE&G CAPITAL SPENDING FOR THE 3-YEAR PERIOD ENDING IN BASE YEAR. PSE&G TOTAL CAPITAL SPENDING IN BASE YEAR. 3 YR AVG 3 YR AVG 3 YR AVG 3 YR AVG 3 YR AVG 3 YR AVG 11 $620 $729 $958 $1,138 $1,443 $1,749 $761 $855 $1,257 $1,302 $1,770 $2,175 $0 $500 $1,000 $1,500 $2,000 $2,500 2008 2009 2010 2011 2012 2013 PSE&G Total Capex |
 PSEG Q2 2014 Financial Highlights *SEE SLIDE B FOR ITEMS EXCLUDED FROM NET INCOME TO RECONCILE TO OPERATING EARNINGS Earnings on Track Operating earnings of $0.49 vs. $0.48 per share in Q2 2013 Increased earnings contribution from PSE&G’s investment in Transmission Expect 2014 Operating Earnings to be at the upper end of the $2.55 to $2.75 per share guidance range – assuming normal weather and plant operations for the balance of the year Operating Review PSEG Power output down 5% vs. Q2 2013 from Linden and Salem 2 outages, partially offset by improvement in coal generation PSE&G placed the 230 kV North Central Reliability transmission project in service Power’s fleet fully restored from storm outages PSEG Disciplined Capital Investment BPU approved $1.22 billion investment in PSE&G’s Energy Strong infrastructure program PJM deferred a final decision on its recommended solution, to be built by PSE&G, for the Artificial Island project via FERC 1000 competitive bidding process Market Developments Recent EPA actions on 316(b) and GHGs 16 |
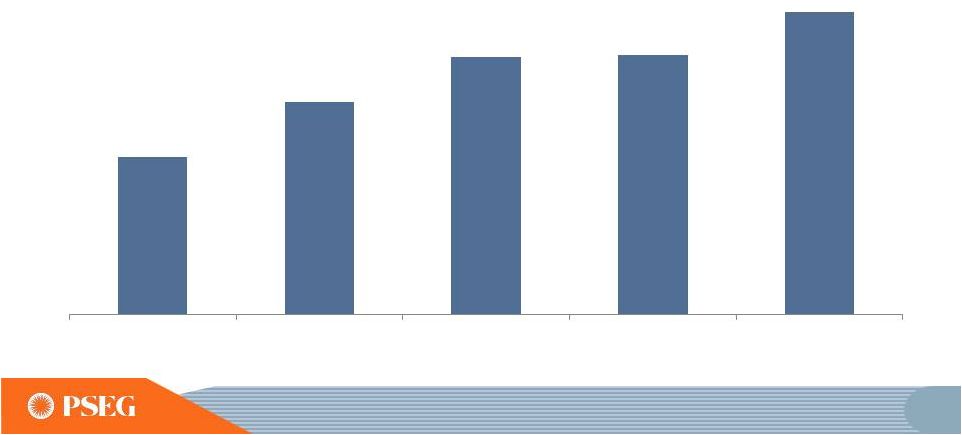 PSE&G’s operating earnings grew ~18% per year over the 5-year period with increased investment, cost control and supportive rate mechanisms *SEE SLIDE A FOR ITEMS EXCLUDED FROM INCOME FROM CONTINUING OPERATIONS/NET INCOME TO RECONCILE TO OPERATING EARNINGS. PSE&G Operating Earnings* Per Share 22 $0.63 $0.85 $1.03 $1.04 $1.21 2009 2010 2011 2012 2013 |
 Successfully worked with regulators to develop multiple solutions for New Jersey’s energy and economic development goals 24 ENERGY EFFICIENCY assisting customers with controlling energy usage: $0.3B RENEWABLES creative solutions to install solar generation: $0.7B DISTRIBUTION improving electric and gas delivery infrastructure: $1.0B • Solar Loan I – 2008 • Solar Loan II – 2009 • Solar 4 All – 2009 • Solar Loan III – 2013 • Solar 4 All Ext – 2013 • Carbon Abatement – 2008 • Energy Efficiency – 2009 • Demand Response – 2009 • Energy Efficiency Ext – 2011 • NJ Capital Infrastructure Program 1 (CIP 1) – 2009 • NJ Capital Infrastructure Program 2 (CIP 2) – 2011 • Energy Strong – 2014 Invested ~$2.0B through 2013 Plan to invest additional ~$1.6B through 2018 in approved program Filed for Energy Efficiency Extension II in August 2014 for ~$100 million NOTE: SPENDING THROUGH 2013 UNLESS INDICATED OTHERWISE |
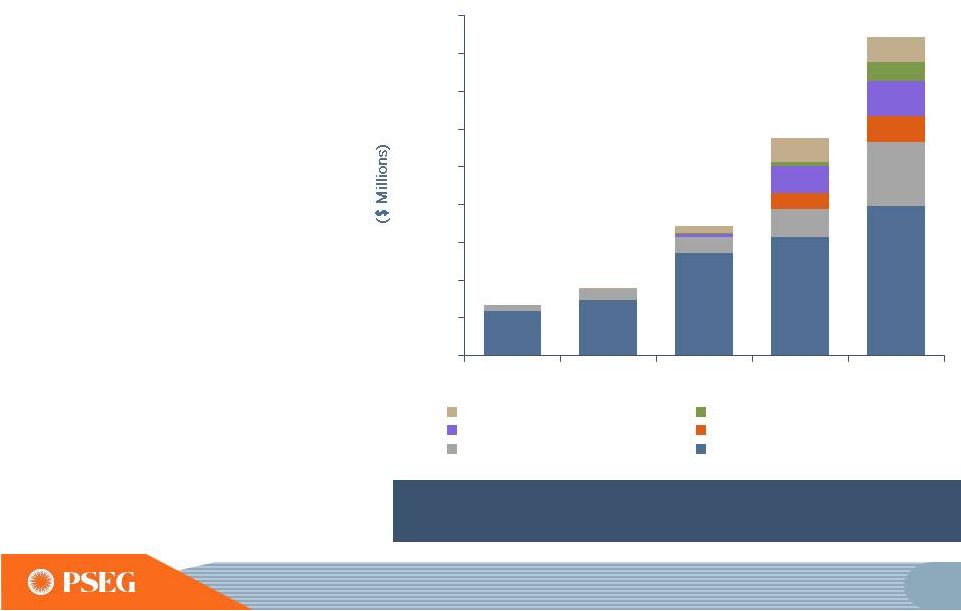 Transmission represented ~36% of rate base at YE 2013 up from ~15% at YE 2009 Transmission has delivered, and has grown to represent ~36% of rate base PSE&G’s Transmission Capital Expenditures 30 - 200 400 600 800 1,000 1,200 1,400 1,600 1,800 2009 2010 2011 2012 2013 Burlington-Camden Mickleton-Gloucester-Camden North Central Reliability Northeast Grid Susquehanna-Roseland Remaining Transmission |
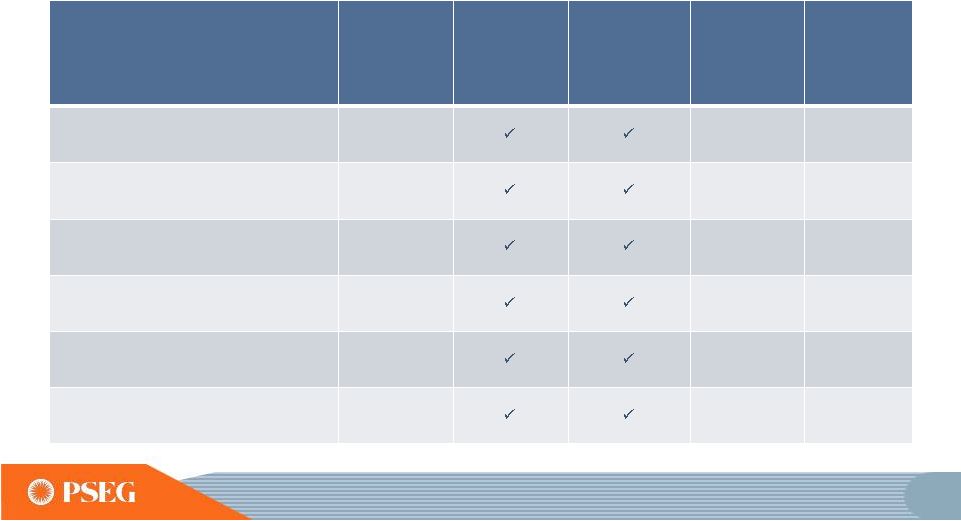 PSE&G’s existing major transmission investment program remains on schedule and on budget Major Transmission Projects Project Roster Approved ROE Inclusion of CWIP in Rate Base 100% Recovery of Costs Due to Abandonment Project Estimate Up To ($ Millions) Expected In-service Date Susquehanna-Roseland 12.93% $790 June 2014 / June 2015 Northeast Grid Reliability 11.93% $907 June 2015 North Central Reliability 11.68% $390 Completed Burlington–Camden 230kV 11.68% $399 Completed Mickleton–Gloucester–Camden 230kV 11.68% $435 June 2015 Bergen—Linden Corridor 345kV 11.68% $1,200 June 2018 31 |
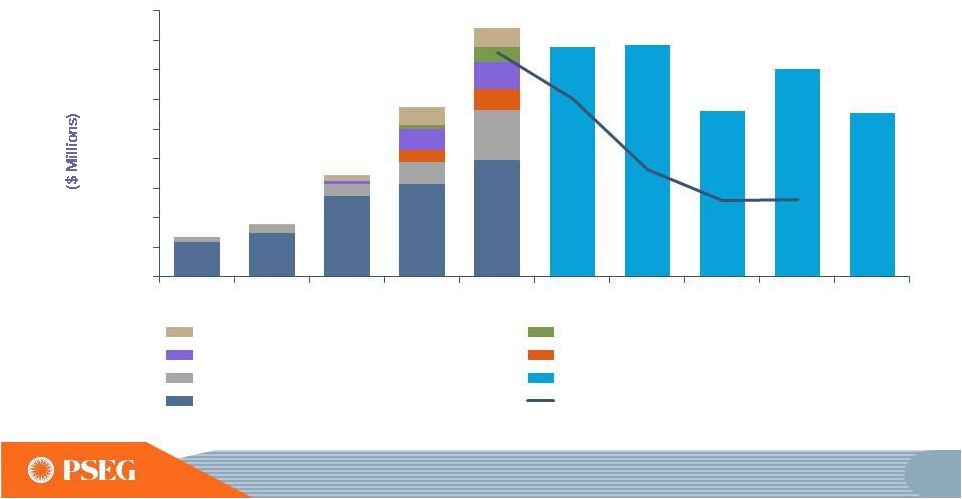 Planned transmission spend of $6.8 billion is driven by PJM reliability projects, 69kV conversions and life-cycle replacement projects PSE&G’s Transmission Capital Expenditures Previous Forecast for 2013-2017 E= ESTIMATE - 200 400 600 800 1,000 1,200 1,400 1,600 1,800 2009 2010 2011 2012 2013 2014E 2015E 2016E 2017E 2018E Burlington-Camden Mickleton-Gloucester-Camden North Central Reliability Northeast Grid Susquehanna-Roseland Future Identified Transmission Remaining Transmission 38 |
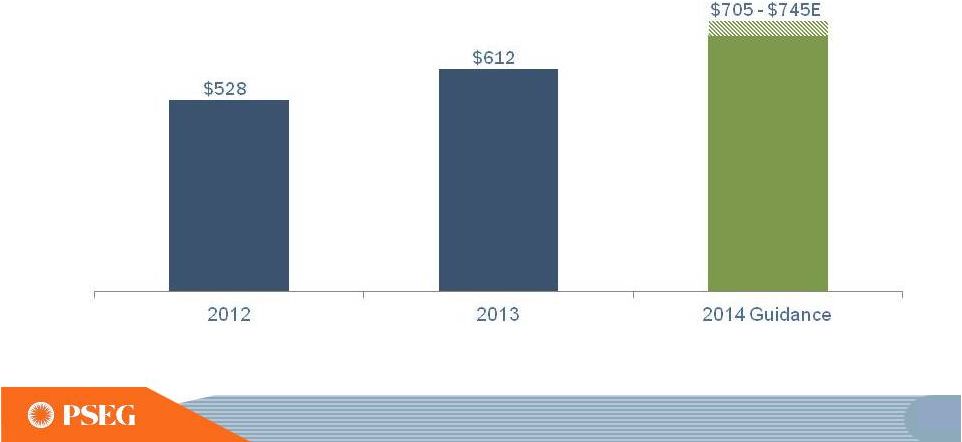 PSE&G’s 2014 operating earnings to benefit from increased investment in transmission and on-going cost control E=ESTIMATE PSE&G Operating Earnings* ($ Millions) 41 *SEE SLIDE A FOR ITEMS EXCLUDED FROM INCOME FROM CONTINUING OPERATIONS/NET INCOME TO RECONCILE TO OPERATING EARNINGS. |
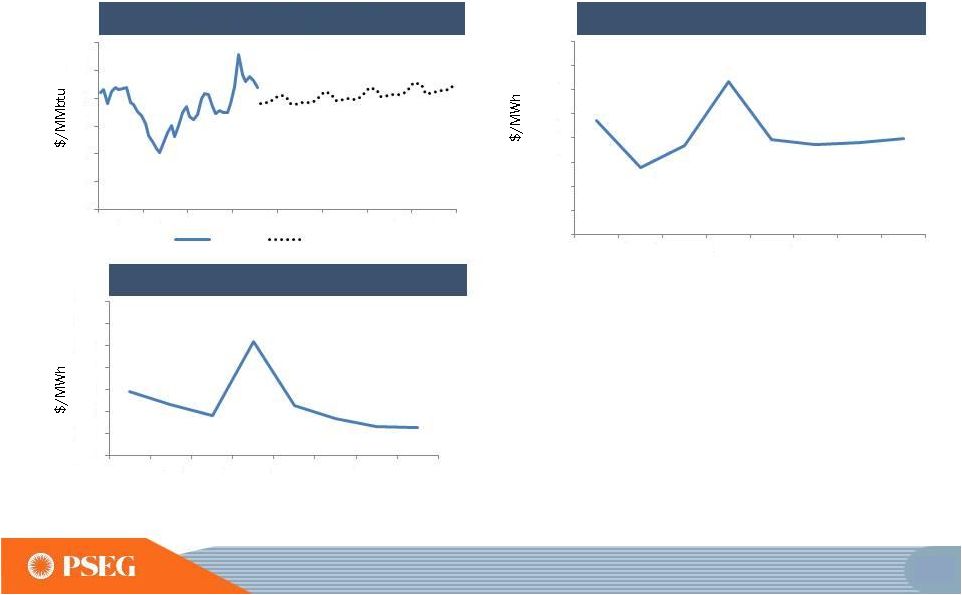 • Environmental restrictions may tighten market • Insufficient gas infrastructure continues to place upward pressure on fuel prices during seasonal peaks • Market liquidity remains weak beyond 2015 $ $1 $2 $3 $4 $5 $6 1/1/2011 1/1/2012 1/1/2013 1/1/2014 1/1/2015 1/1/2016 1/1/2017 1/1/2018 Historical Forward $20 $25 $30 $35 $40 $45 $50 $55 $60 2011 2012 2013 2014F 2015F 2016F 2017F 2018F $10 $14 $18 $22 $26 $30 $34 $38 2011 2012 2013 2014 F 2015 F 2016 F 2017 F 2018 F Market Review: Long-term fundamentals remain sound NYMEX Natural Gas Price PJM West RTC PJM West Spark Spreads 67 F=FORWARDS AS OF 8/13/2014, 2014F INCLUDES HISTORY AND FORWARDS |
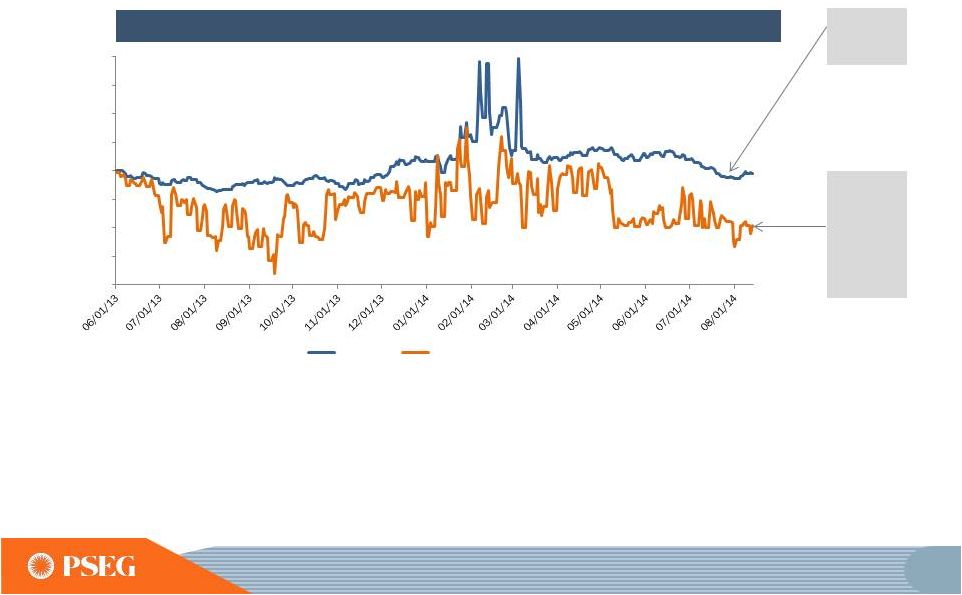 Competitive Advantage: ~25% of Power’s gas for generation comes from Marcellus • Our combined cycle and peaking assets have been able to take advantage of locational gas price volatility driven by production and logistical constraints • Lower cost shale supply provides additional savings during periods of lower residential gas demand Market Prices for Natural Gas Access to Lower Cost Shale Gas in Marcellus and Utica Spot Natural Gas Prices: June 2013 – August 2014* *AS OF 8/13/2014 72 $- $1 $2 $3 $4 $5 $6 $7 $8 Henry Hub Leidy -Transco (Marcellus) |
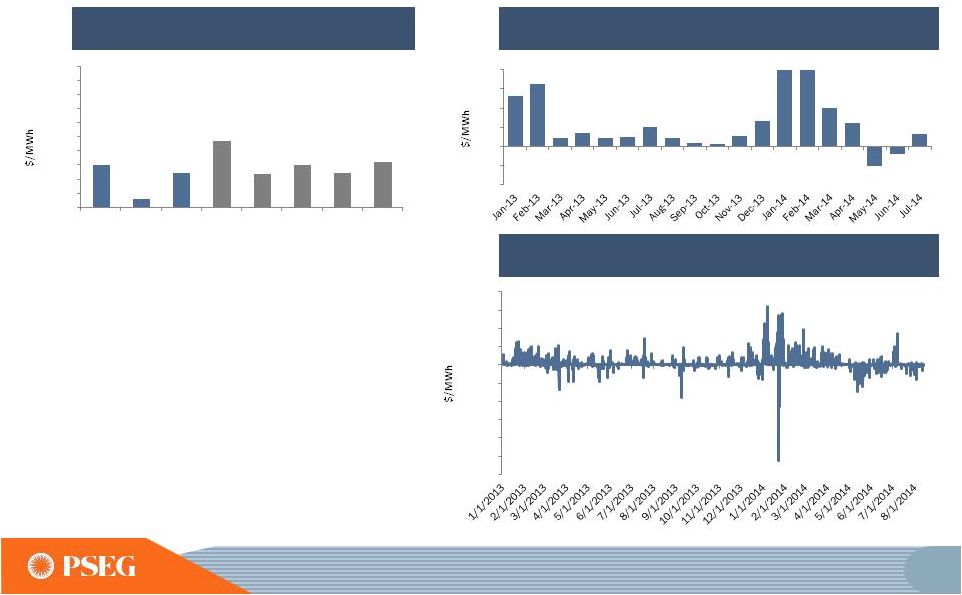 Competitive Advantage: Locational advantage from short term basis volatility $45 - $47 $37 - $38 $56 - $58 $39 - $40 ANNUAL FORWARD (F) BASIS TO PJM-WEST AS OF 8/13/2014. 2014F INCLUDES HISTORY AND FORWARDS. • Annual basis benefits baseload units • Intermediate units flexible to seasonal opportunities • Combined Cycle and Peaking units positioned to optimize daily and hourly volatility PS Zone Annual Basis to PJM-W PS Zone Day Ahead On Peak Monthly Basis to PJM-W PS Zone Real Time On Peak Hourly Basis to PJM-W 73 $- $2 $4 $6 $8 $10 $12 $14 $16 $18 $20 2011 2012 2013 2014 F 2015 F 2016 F 2017 F 2018 F $(10) $(5) $- $5 $10 $15 $20 $(600) $(500) $(400) $(300) $(200) $(100) $- $100 $200 $300 $400 |
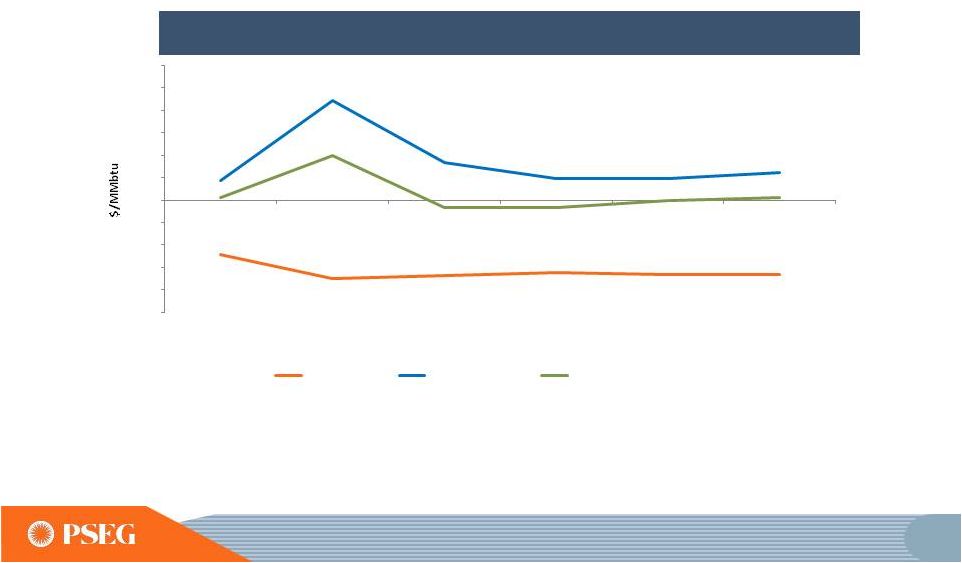 Forward curve shows that Marcellus shale supply averages over $1.50/MMbtu discount year-round through 2018 Sustainable Advantage: Fuel advantage continues throughout the curve Basis to Henry Hub 2013 AVERAGE 6/1/13-12/31/13; F= FORWARDS AS OF 8/13/14. 2014F INCLUDES HISTORY AND FORWARDS. LEIDY BASIS FROM ICE/BROKER QUOTES 77 (2.50) (2.00) (1.50) (1.00) (0.50) - 0.50 1.00 1.50 2.00 2.50 3.00 2013 2014F 2015F 2016F 2017F 2018F Leidy Basis to HH TRANS Z6 Basis to HH TET M3 Basis to HH |
 Improving Operating Earnings and increased contribution from PSE&G PSEG Operating Earnings $ Millions (except EPS) 2012 2013 2014E PSE&G $528 $612 $705 - $745 PSEG Power $663 $710 $550 - $610 Enterprise/Other $45 ($13) $35 - $40 Operating Earnings* $1,236 $1,309 $1,290 - $1,395 Operating EPS* $2.44 $2.58 $2.55 - $2.75 Regulated % of Earnings 43% 47% 53% - 55% * SEE SLIDE A FOR ITEMS EXCLUDED FROM INCOME FROM CONTINUING OPERATIONS/NET INCOME TO RECONCILE TO OPERATING EARNINGS. NOTE: 2012 OPERATING EARNINGS RE-STATED FOR TRANSFER OF ASSETS FROM PSEG HOLDINGS TO PSEG POWER. E=ESTIMATE. 91 |
 PSEG’s longer-term outlook is influenced by Power’s hedge position and increased investment at PSE&G 2015E 2016E Each $0.75/mcf Change in Natural Gas Each $2/MWh Change in Spark Spread Each $5/MWh Change in Dark Spread Each 1% Change in Nuclear Capacity Factor Segment EPS Drivers Each $100 Million of Incremental Investment Each 1% Change in Sales Electric Gas Each 1% Change in O&M Each 10 bp Change in ROE $0.01 $0.01 $0.01 $0.01 $0.01 $0.08 - $0.11 $0.04 $0.04 $0.01 $0.00 $0.04 $0.02 $0.01 $0.01 $0.01 $0.01 $0.01 $0.01 E = ESTIMATE Sensitivities derived from typical annual market variability* * Estimated annual variability approximating one standard deviation based on 2011 – 2013 historical data and forward curve estimates applied to PSEG Power open positions POWER EARNINGS SENSITIVITIES UPDATED FOR 7/31/2014 PRICE CURVES. 93 |
 Items Excluded from Income from Continuing Operations/Net Income to Reconcile to Operating Earnings PLEASE SEE PAGE 3 FOR AN EXPLANATION OF PSEG’S USE OF OPERATING EARNINGS AS A NON-GAAP FINANCIAL MEASURE AND HOW IT DIFFERS FROM NET INCOME. Includes the financial impact from positions with forward delivery months. A 2013 2012 2011 2010 2009 2008 Earnings Impact ($ Millions) Operating Earnings 1,309 $ 1,236 $ 1,389 $ 1,584 $ 1,567 $ 1,478 $ Gain (Loss) on Nuclear Decommissioning Trust (NDT) Fund Related Activity (PSEG Power) 40 52 50 46 9 (71) Gain (Loss) on Mark-to-Market (MTM) (a) (PSEG Power) (74) (10) 107 (1) (11) 14 Lease Transaction Activity (PSEG Enterprise/Other) - 36 (173) - 29 (490) Storm O&M (PSEG Power) (32) (39) - - - - Market Transition Charge Refund (PSE&G) - - - (72) - - Gain (Loss) on Asset Sales and Impairments (PSEG Enterprise/Other) - - 34 - - (13) Income from Continuing Operations 1,243 $ 1,275 $ 1,407 $ 1,557 $ 1,594 $ 918 $ Discontinued Operations - - 96 7 (2) 270 Net Income 1,243 $ 1,275 $ 1,503 $ 1,564 $ 1,592 $ 1,188 $ Fully Diluted Average Shares Outstanding (in Millions) 508 507 507 507 507 508 Per Share Impact (Diluted) Operating Earnings 2.58 $ 2.44 $ 2.74 $ 3.12 $ 3.09 $ 2.91 $ Gain (Loss) on NDT Fund Related Activity (PSEG Power) 0.08 0.10 0.10 0.09 0.02 (0.14) Gain (Loss) on MTM (a) (PSEG Power) (0.14) (0.02) 0.21 - (0.02) 0.03 Lease Transaction Activity (PSEG Enterprise/Other) - 0.07 (0.34) - 0.05 (0.96) Storm O&M (PSEG Power) (0.07) (0.08) - - - - Market Transition Charge Refund (PSE&G) - - - (0.14) - - Gain (Loss) on Asset Sales and Impairments (PSEG Enterprise/Other) - - 0.06 - - (0.03) Income from Continuing Operations 2.45 $ 2.51 $ 2.77 $ 3.07 $ 3.14 $ 1.81 $ Discontinued Operations - - 0.19 0.01 - 0.53 Net Income 2.45 $ 2.51 $ 2.96 $ 3.08 $ 3.14 $ 2.34 $ For the Year Ended December 31, (Unaudited) PUBLIC SERVICE ENTERPRISE GROUP INCORPORATED Reconciling Items, net of tax (a) |