 Forward-Looking Statement 2 EXHIBIT 99 Certain of the matters discussed in this report about our and our subsidiaries' future performance, including, without limitation, future revenues, earnings, strategies, prospects, consequences and all other statements that are not purely historical constitute “forward-looking statements” within the meaning of the Private Securities Litigation Reform Act of 1995. Such forward-looking statements are subject to risks and uncertainties, which could cause actual results to differ materially from those anticipated. Such statements are based on management's beliefs as well as assumptions made by and information currently available to management. When used herein, the words “anticipate,” “intend,” “estimate,” “believe,” “expect,” “plan,” “should,” “hypothetical,” “potential,” “forecast,” “project,” variations of such words and similar expressions are intended to identify forward-looking statements. Factors that may cause actual results to differ are often presented with the forward- looking statements themselves. Other factors that could cause actual results to differ materially from those contemplated in any forward-looking statements made by us herein are discussed in filings we make with the United States Securities and Exchange Commission (SEC), including our Annual Report on Form 10-K and subsequent reports on Form 10-Q and Form 8-K and available on our website: http://www.pseg.com. These factors include, but are not limited to: adverse changes in the demand for or the price of the capacity and energy that we sell into wholesale electricity markets, adverse changes in energy industry law, policies and regulation, including market structures and transmission planning, any inability of our transmission and distribution businesses to obtain adequate and timely rate relief and regulatory approvals from federal and state regulators, changes in federal and state environmental regulations and enforcement that could increase our costs or limit our operations, changes in nuclear regulation and/or general developments in the nuclear power industry, including various impacts from any accidents or incidents experienced at our facilities or by others in the industry, that could limit operations of our nuclear generating units, actions or activities at one of our nuclear units located on a multi-unit site that might adversely affect our ability to continue to operate that unit or other units located at the same site, any inability to manage our energy obligations, available supply and risks, adverse outcomes of any legal, regulatory or other proceeding, settlement, investigation or claim applicable to us and/or the energy industry, any deterioration in our credit quality or the credit quality of our counterparties, availability of capital and credit at commercially reasonable terms and conditions and our ability to meet cash needs, changes in the cost of, or interruption in the supply of, fuel and other commodities necessary to the operation of our generating units, delays in receipt of necessary permits and approvals for our construction and development activities, delays or unforeseen cost escalations in our construction and development activities, any inability to achieve, or continue to sustain, our expected levels of operating performance, any equipment failures, accidents, severe weather events or other incidents that impact our ability to provide safe and reliable service to our customers, and any inability to obtain sufficient insurance coverage or recover proceeds of insurance with respect to such events, acts of terrorism, cybersecurity attacks or intrusions that could adversely impact our businesses, increases in competition in energy supply markets as well as for transmission projects, any inability to realize anticipated tax benefits or retain tax credits, challenges associated with recruitment and/or retention of a qualified workforce, adverse performance of our decommissioning and defined benefit plan trust fund investments and changes in funding requirements, changes in technology, such as distributed generation and micro grids, and greater reliance on these technologies, and changes in customer behaviors, including increases in energy efficiency, net-metering and demand response. All of the forward-looking statements made in this report are qualified by these cautionary statements and we cannot assure you that the results or developments anticipated by management will be realized or even if realized, will have the expected consequences to, or effects on, us or our business prospects, financial condition or results of operations. Readers are cautioned not to place undue reliance on these forward-looking statements in making any investment decision. Forward-looking statements made in this report apply only as of the date of this report. While we may elect to update forward-looking statements from time to time, we specifically disclaim any obligation to do so, even if internal estimates change, unless otherwise required by applicable securities laws. The forward-looking statements contained in this report are intended to qualify for the safe harbor provisions of Section 27A of the Securities Act of 1933, as amended, and Section 21E of the Securities Exchange Act of 1934, as amended. |
 GAAP Disclaimer These materials and other financial releases can be found on the pseg.com website under the investor tab, or at http://investor.pseg.com/ PSEG presents Operating Earnings and Adjusted Earnings Before Interest, Taxes, Depreciation and Amortization (EBITDA) in addition to its Income from Continuing Operations/Net Income reported in accordance with accounting principles generally accepted in the United States (GAAP). Operating Earnings and Adjusted EBITDA are non-GAAP financial measures that differ from Income from Continuing Operations/Net Income. Operating Earnings exclude gains or losses associated with Nuclear Decommissioning Trust (NDT), Mark-to-Market (MTM) accounting, and other material one-time items. PSEG presents Operating Earnings because management believes that it is appropriate for investors to consider results excluding these items in addition to the results reported in accordance with GAAP. PSEG believes that the non-GAAP financial measure of Operating Earnings provides a consistent and comparable measure of performance of its businesses to help shareholders understand performance trends. PSEG is presenting Adjusted EBITDA because it provides investors with additional information to compare our business performance to other companies and understand performance trends. Adjusted EBITDA excludes the same items as our Operating Earnings measure as well as income tax expense, interest expense, depreciation and amortization and major maintenance expense costs at Power’s fossil generation facilities. This information is not intended to be viewed as an alternative to GAAP information. The last three slides in this presentation (Slides A, B and C) include a list of items excluded from Income from Continuing Operations/Net Income to reconcile to Operating Earnings and Adjusted EBITDA with a reference to that slide included on each of the slides where the non-GAAP information appears. 3 |
 Delivering on commitments and realizing growth Operational Excellence • PSE&G: Mid-Atlantic Reliability Award (13 th consecutive year), top ranked among eastern electric and gas utilities in business customer satisfaction • PSEG Power: Record output from combined cycle units • PSEG Long Island: Demonstrated management and integration capability through a successful transition in first year • PSEG: Cost-control benefits continue Financial Strength • Earnings performance exceeded guidance in 2014 • Cash flows and business mix support strong credit ratings and ability to fully fund robust investment pipeline without issuing new equity • Increased rate of dividend growth in 2015 Disciplined Investment • PSE&G Transmission capital program execution and growth Energy Strong infrastructure program underway Energy efficiency program extension Further growth planned – Gas System Modernization Program • Power: Unit uprates, PennEast Pipeline, Solar Source and Keys CCGT 7 |
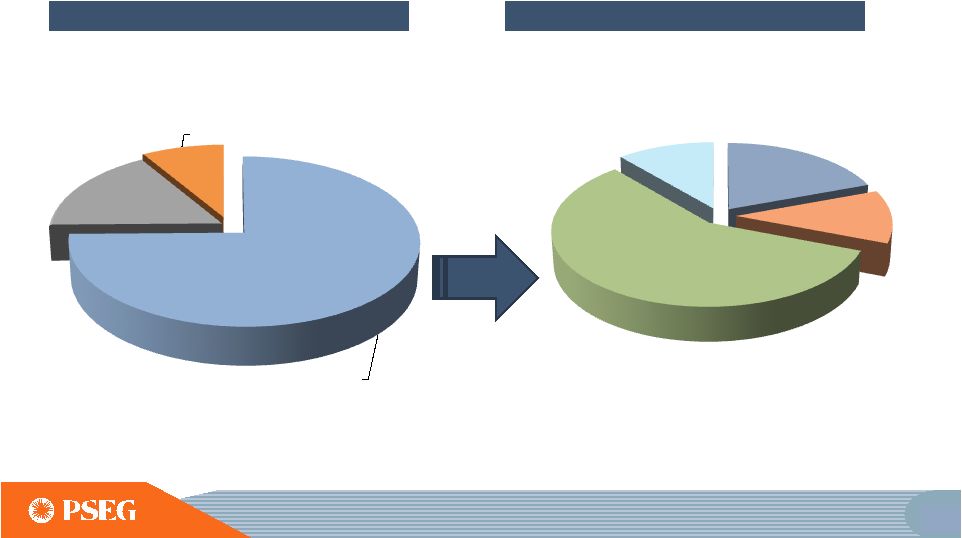
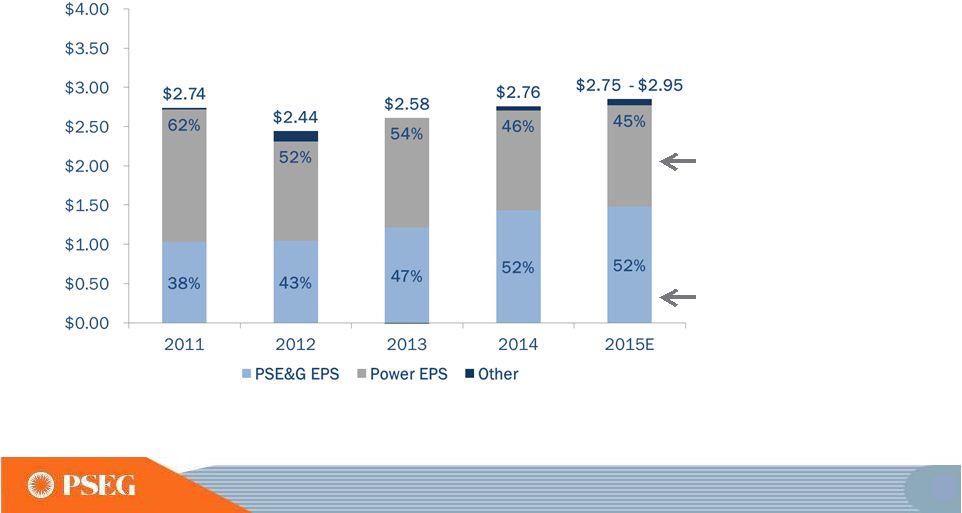 ** ** Operating Earnings Disciplined investment program and focus on operational excellence have supported growth Power’s diverse fuel mix and dispatch flexibility continue to generate strong earnings and free cash flow in low price environment PSE&G’s investment program has driven double digit compound annual earnings growth since 2010 Operating Earnings* Contribution by Subsidiary *SEE SLIDE A FOR ITEMS EXCLUDED FROM INCOME FROM CONTINUING OPERATIONS/ NET INCOME TO RECONCILE TO OPERATING EARNINGS. E=ESTIMATE ** 2015 PERCENTS USE MIDPOINT OF EARNINGS GUIDANCE. 8 |
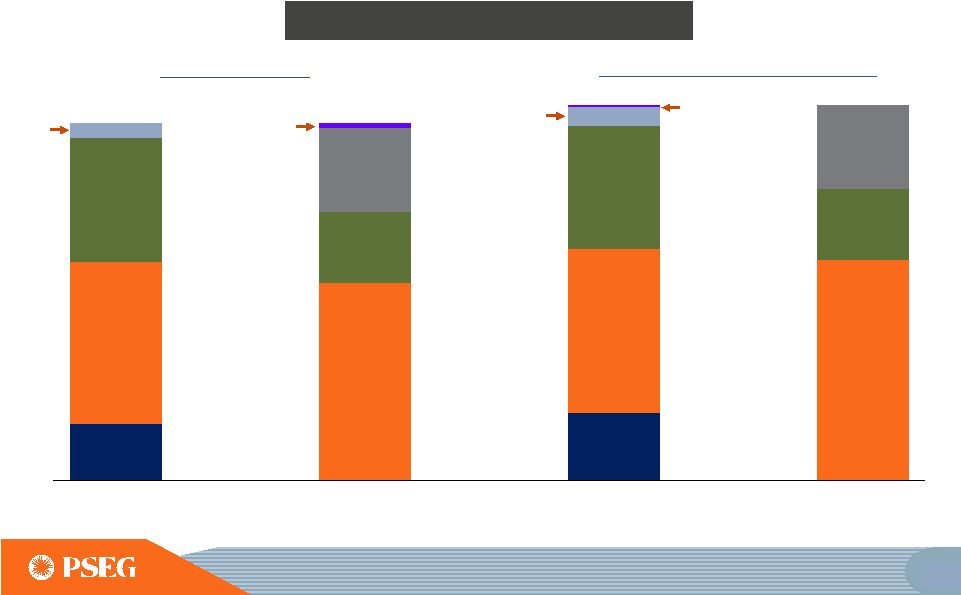
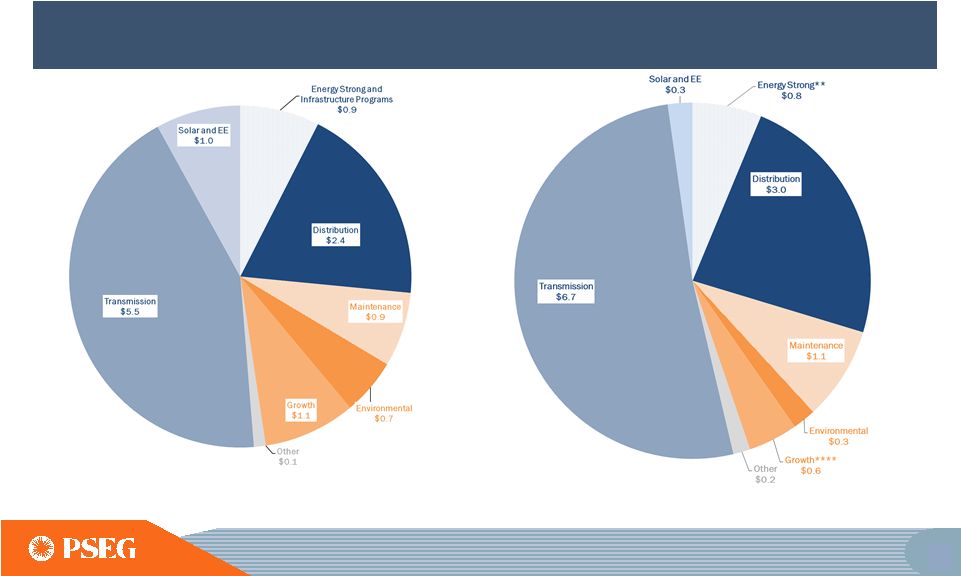 Robust pipeline of investment opportunities supports growth objectives 2015E - 2019E*: $13 Billion 2010 – 2014: $12.6 Billion Power Total*** $2.7B PSE&G Total $9.8B PSE&G Total $10.8B PSEG Capital Spending Power Total*** $2.0B 2015E–2019E: • $2.2B of capital for Gas System Modernization Program, Artificial Island and Keys CCGT would be incremental *INCLUDES ALL PLANNED SPENDING. **ENERGY STRONG EXCLUDES RISK AND CONTINGENCY. ***POWER CAPITAL SPENDING EXCLUDES NUCLEAR FUEL. ****INCLUDES PENNEAST PIPELINE EQUITY INVESTMENT OF $0.1B. E=ESTIMATE. DATA AS OF MARCH 2, 2015. DOES NOT REFLECT $825 - $875 MILLION KEYS INVESTMENT ANNOUNCED ON JUNE 17, 2015 9 |
 Balance sheet strength supports capital allocation Timeframe Actions taken 2010 – 2014: Transformed business mix • Applied $16 billion towards investments and dividends • Improved credit ratings • Monetized Energy Holdings’ portfolio • Strong balance sheet sustained during period of low power prices, while increasing the dividend 2015 – Forward: Strong financial position supports continued growth • Increased rate of dividend growth in 2015 • $13 billion investment program through 2019 • Gas System Modernization Program, Artificial Island and Keys CCGT increase capital program by up to $2.2 billion through 2019 • Financial capability supports further expansion of the current capital plan 10 |
 Power – Growing value by improving market rules and developing investment opportunities Value Source Opportunities and Actions Taken Improving rules will better recognize value of our fleet • PJM’s Capacity market – 2014 limits on demand response and August 2015 Capacity Performance auction • Demand response treatment at U.S. Courts / FERC • Energy price formation at FERC • Increasing air standards through Federal and State regulations Our footprint provides growth opportunities • Nuclear and Combined Cycle plant uprates underway • New build Keys CCGT in SWMAAC (Maryland) • Brownfield expansions at existing sites New peakers built at New Haven and Kearny sites Continue to explore further opportunities • PennEast pipeline - equity investment and gas portfolio enhancement • Solar Source owns ~123 MW*, with significant project pipeline • Continue to seek opportunities to expand the fleet *PROJECT SIZE IN MEGAWATTS SHOWN IN DC (DIRECT CURRENT), AC EQUIVALENT IS 96 MW. 15 SWMAAC = SOUTHWEST MID-ATLANTIC AREA COUNCIL - LOCATIONAL DELIVERABILITY AREA WITHIN PJM. |
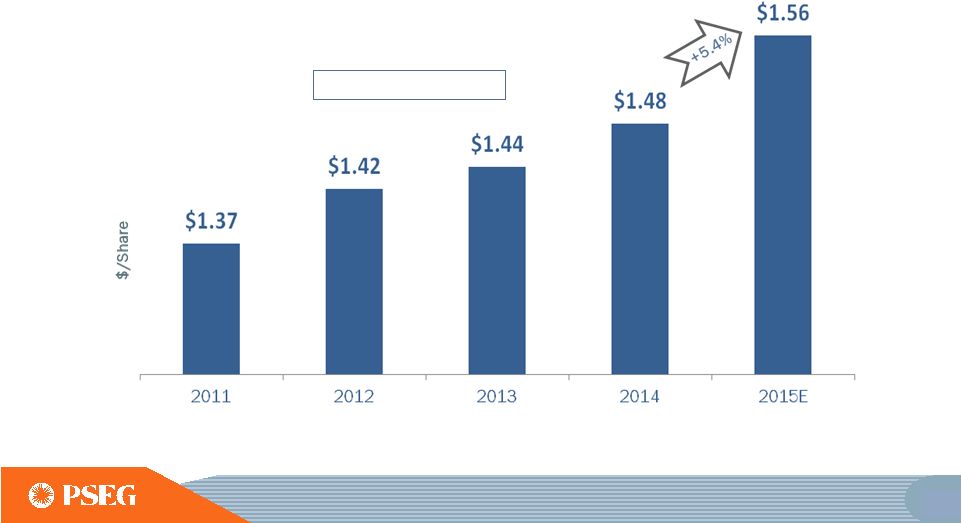 PSEG Annual Dividend An increased dividend growth rate with potential for consistent and sustainable growth given our business mix and financial position Payout Ratio 50% 58% 56% 54% 55%* PSEG Annual Dividend Rate 2011-2014 CAGR: 2.6% *2015E PAYOUT RATIO REFLECTS THE MIDPOINT OF OPERATING EARNINGS GUIDANCE. E=ESTIMATE 16 |
 Focus areas over business plan horizon PSE&G • Capital program execution – Transmission, Energy Strong and additional programs • Operational excellence and cost control • Regulatory framework • Continue to develop incremental growth opportunities PSEG Power • Operational excellence and cost control • Strong performance at Nuclear and Fossil to maximize fleet value in dynamic markets • Monitor and shape market rules - Capacity markets and environmental regulations • Develop growth opportunities - Keys CCGT in SWMAAC* PSEG Long Island • Continue execution – Integration and achievement of performance metrics *SWMAAC = SOUTHWEST MID-ATLANTIC AREA COUNCIL - LOCATIONAL DELIVERABILITY AREA WITHIN PJM. 17 |
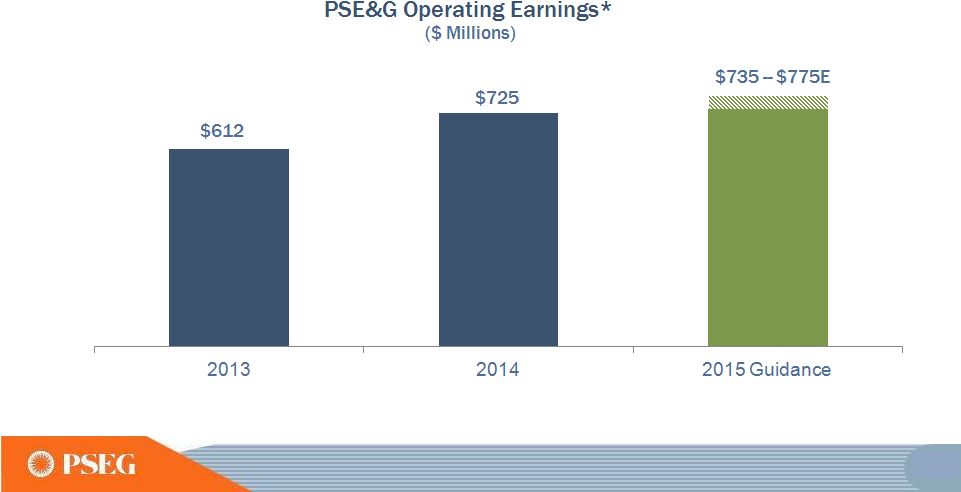 PSE&G’s 2015 operating earnings expected to benefit from increased investment in Transmission *SEE SLIDE A FOR ITEMS EXCLUDED FROM NET INCOME TO RECONCILE TO OPERATING EARNINGS. E =ESTIMATE. DATA AS OF MARCH 2, 2015. 37 |
 Financial Strength Disciplined Investment Operational Excellence • Maximize value of existing generating plants through implementation of the Operational Excellence Model (OEM) • Workforce engagement and development • Deliver on Business Plan Commitments • Maintain competitive markets and improve constituent communication on issues important to Power • Successfully complete the Advanced Gas Path (AGP) uprates • Seek new opportunities in target markets (PJM, ISO-NE, NYISO) • Develop our renewables business (solar) • Maintain new nuclear option by successfully managing the Early Site Permit (ESP) process PSEG Power Delivering on priorities • OEM implemented and achieving measures • Resource sharing program between Nuclear & Fossil initiated • Exceeded earnings guidance in 2014 • Ongoing effort in key markets showing success • Successful court outcome against subsidized generation • Accelerated schedule for AGP to maximize opportunity • LIPA contract for fuel and generation dispatch began January 1, 2015 • Solar Source’s portfolio is 123 MW DC • Nuclear ESP is expected in 2016 • New build Keys CCGT targeted in-service 2018 in Maryland 43 |
 Power’s PJM assets along the dispatch curve reduce the risk of serving full requirement load contracts and can take advantage of volatile market conditions Energy Revenue X X X Capacity Revenue X X X Ancillary Revenue X X Dual Fuel X X • Base Load ensures cash flow certainty • Load Following provides ability to serve load shape • Readiness for Capacity Performance (CP) • Keys CCGT to be added to dispatch in 2018E • Peaking takes advantage of real-time prices and reduces operational risk • Dual fuel capability at 87% of load following and peaking units Illustrative Salem Hope Creek Keystone Conemaugh Hudson 2 Linden 1,2 Bergen 1 Mercer 1, 2 Bergen 2 Peach Bottom Essex 9 Sewaren 1-4 Burlington 12 Yards Creek Base Load Units Peaking Units Load Following Units Kearny 12-13-14 Nuclear Coal Coal/Gas Combined Cycle Steam Combustion Turbine / Pumped Storage Linden 5-8 POST - HEDD E=ESTIMATE 47 |
 PSEG Power’s fleet is among the lowest emitting in the industry 0 10,000 20,000 30,000 40,000 50,000 60,000 70,000 80,000 90,000 10,000 20,000 30,000 40,000 50,000 60,000 70,000 2006 2007 2008 2009 2010 2011 2012 2013 2014 • Mercury reduced 80% across the timeframe above • More efficient testing and improved operational flexibility through utilization of Continuous Emission Monitoring System testing 50 |
 PSEG Power CCGT/Fossil initiatives Actions Taken to Create Value Capacity • New Keys CCGT 755MW online in 2018E adds geographic diversity to fleet • Advanced Gas Path (AGP) investments 2014 through 2018 to provide additional efficient capacity, heat rate improvements • New lower cost gas line at BEC with Dominion Performance • EPRI efficiency initiatives • GE initiatives for large data analytic • Consolidation of unit testing • Auto tuning software Maintenance • Ongoing outage efficiency improvement • Improvements to reliability • Central fleet monitoring and diagnostic center E = ESTIMATE 57 |
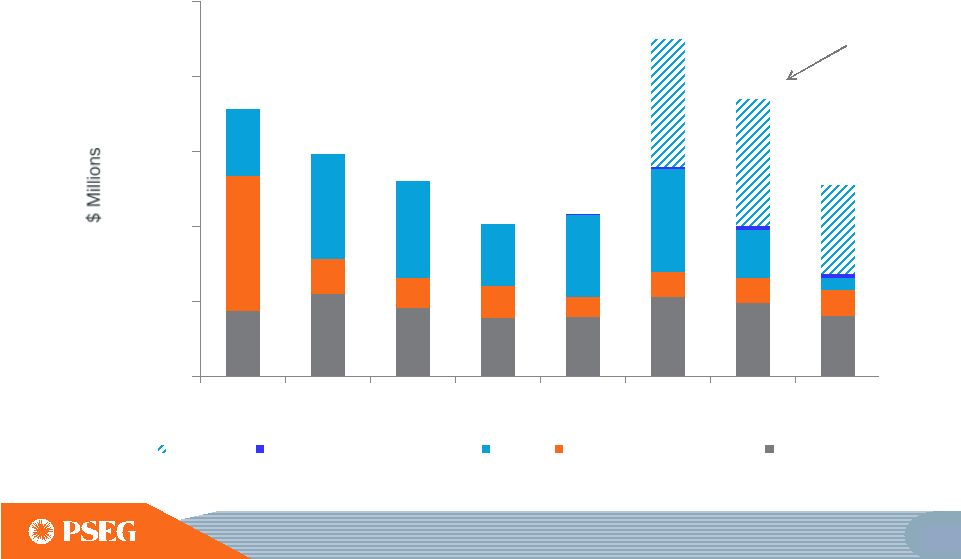 $0 $200 $400 $600 $800 $1,000 2010 2011 2012 2013 2014 2015E 2016E 2017E Keys CCGT Penn East (equity investment) Growth Environmental/Regulatory* Maintenance PSEG Power’s capital expenditures dedicated toward growing portfolio *BASED ON CURRENTLY KNOWN AND QUANTIFIABLE ENVIRONMENTAL REQUIREMENTS. E=ESTIMATE. INCREMENTAL INVESTMENT IN KEYS 2015E-2017E 58 |
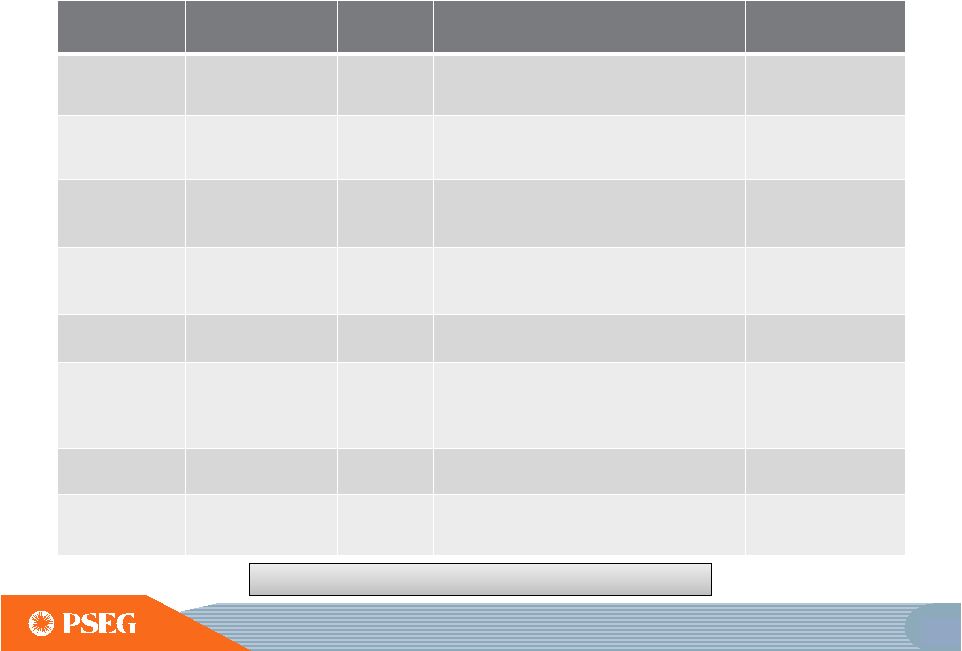 PSEG Power’s Growth Investments Site Project Cost ($ millions) Benefits Status Maryland Keys 755 MW CCGT $825 - $875 Geographic diversity within PJM; highly efficient gas fired unit in SWMAAC 2018 BEC Dominion Gas Line $8 Access to a 2 nd , lower cost gas supply: $8-9 million/year increase in margin Completed Linden AGP Upgrade $69 Increased capacity and improved heat rate: 63 MW capacity increase ~1.2% heat rate improvement Completed CA / TX / VT Solar Source Projects $44 Increased capacity: 21 MW Completed Peach Bottom Peach Bottom EPU (2014 – 2015) $417 Increased capacity: 130 MW PB2 March 2015, PB3 in 2016 Bergen / BEC Future AGP Upgrades: Bergen (2015) BEC (2017-2018) $98 Increased capacity and improved heat rate: 88 MW capacity increase ~1.2% heat rate improvement Underway Various Interim ISA’s* No cost Increased capacity: 69 MW Completed Eastern PA to Mercer, NJ PennEast Pipeline $119 Estimated Earnings in 2019: $13 million Underway Total Increased Capacity – 1,126 MW * INTERCONNECTION SERVICE AGREEMENTS. 59 |
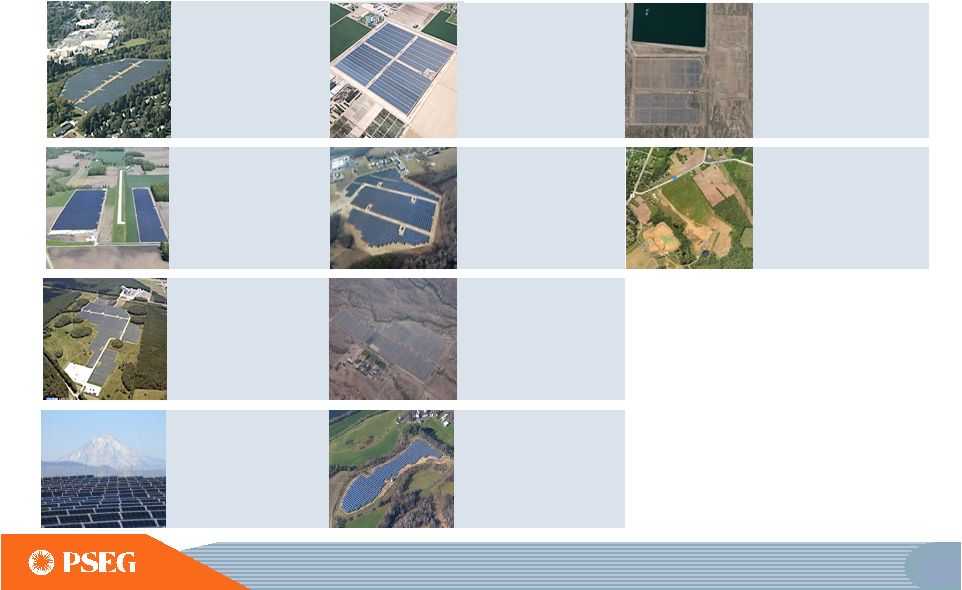 Shasta A & B California (4 MW) COD March 2014 Polycrystalline - single axis Investment $13 million 20 year PPAs with PG&E Hackettstown (Mars) New Jersey (2 MW) COD September 2009 Thin film panels – fixed tilt Investment $13 million 15 year PPA with Mars, Inc. Wyandot Ohio (12 MW) COD May 2010 Thin film panels – fixed tilt Investment $44 million 20 year PPA with AEP JEA Florida (15 MW) COD September 2010 Thin film panels – fixed tilt Investment $59 million 30 year PPA with JEA Queen Creek Arizona (25 MW) COD October 2012 Polycrystalline - single axis Investment $75 million 20 year PPA with SRP Milford Delaware (15 MW) COD December 2012 Polycrystalline - fixed tilt Investment $47 million 20 year PPA with DEMEC Badger I Arizona (19 MW) COD November 2013 Polycrystalline - single axis Investment $48 million 30 year PPA with APS PSEG Solar Source owns ~123 MW of solar facilities * with long term contracted revenues Newman Texas (13 MW) COD December 2014 Polycrystalline - single axis Investment $22 million 30 year PPA with El Paso Elec. Whitcomb Vermont (4 MW) COD October 2014 Polycrystalline – fixed tilt Investment $10 million 25 year PPA with VT Electric Power Producers, Inc. *PROJECT SIZE IN MEGAWATTS SHOWN IN DC (DIRECT CURRENT), AC EQUIVALENT IS 96 MEGAWATTS. E=ESTIMATE. Rockfish Maryland (13 MW) COD - June 2015E Polycrystalline - single axis 20 year PPA with SMECO 61 |
 Power’s 2015 operating earnings maintain solid performance Power Operating Earnings* ($ Millions) 2013 2014 2015 Guidance $710 $642 $620 – $680E 2015 Observations • 75-80% hedged at $52/MWh • Increase in average hedge price for energy helps mitigate reset in capacity price and volume * SEE SLIDE A FOR ITEMS EXCLUDED FROM NET INCOME TO RECONCILE TO OPERATING EARNINGS. E = ESTIMATE. 66 |
 PJM Capacity Performance Proposal: aims to increase electric supply reliability • Capacity performance (CP) product places emphasis on reliability, with robust performance standards, imposition of higher penalty structure and enhanced opportunities for cost recovery to encourage reliability • Elimination of 2.5% holdback offsetting weak demand growth, making all capacity resources annual products in end state, net CONE bidding safe harbor, and the change in the demand curve (VRR) support price formation and improve resource adequacy • Generator performance/flexibility is key objective for units with secure fuel supply capable of meeting more stringent operating standards June 2015 FERC Accepted PJM’s Modified CP Proposal July/August 2015 Transition Auctions for 2016/2017 & 2017/2018 Capacity Years August 2015 RPM Auction for 2018/2019 Capacity Year 74 |
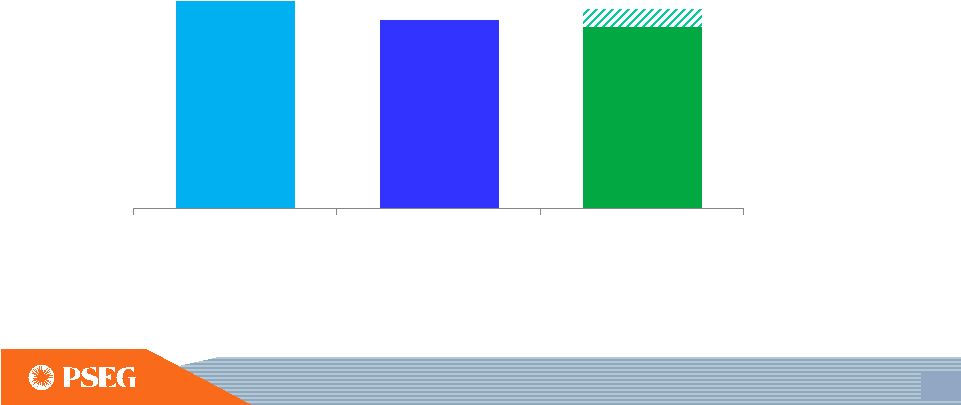
 Capacity Performance: >90% of PSEG’s PJM capacity meets the new capacity performance standards with minimal to moderate investment CP Compliant Assets** How does our fleet stack up? * Combined Cycle Steam Nuclear Combustion Turbine * EXCLUDES 205MW OF PUMPED STORAGE. ** KEYS 755 MW CCGT UNIT EXPECTED TO BE CP COMPLIANT IN 2018 Meets CP Requirement with No to Minimal Investment Moderate Investment to Meet CP Requirement Larger Investment to Meet CP Requirement 75 |
 Strong financial position to support our business initiatives 2014 Financial Position Strong 2014 earnings growth Exceeded earnings guidance Executed major PSE&G capital program Strong balance sheet with no long term Parent debt Solid credit metrics 2015 and Beyond Third year of anticipated positive earnings growth in 2015 Controlled O&M growth Balance Sheet and Cash Flow support investment program without equity issuance Substantial additional investment capacity Growth in PSE&G investments with contemporaneous/formula rate returns and new Power investment Consistent and strong cash flow from both Power and PSE&G Potential for accelerated and sustainable dividend growth 83 |
 ~$1.6B ~$0.6B ~$2.2B ~$1.9B ~$6.7B ~$14.3B ~$1.3B ~$13.0B PSEG 2015– 2019E Capital Expenditures (1) PSEG growth spend represents ~70% of total investment Power & Other Maintenance PSE&G Distribution Maintenance Power Growth* PSE&G Transmission Growth PSE&G Energy Strong, Solar and New Business Planned Growth Investment ~$9.2B PSEG Planned Spend Maintenance ~$3.8B PSE&G Potential Upside PSEG Potential Spend Potential Upside ~$1.3B (1) INCLUDES AFUDC AND IDC; PENNEAST PIPELINE EQUITY INVESTMENT OF~$0.1B IS INCLUDED IN POWER GROWTH. E = ESTIMATE. *DOES NOT REFLECT $825 - $875 MILLION KEYS INVESTMENT ANNOUNCED ON JUNE 17, 2015. 88 |
 Substantial internal cash generation supports our planned growth capital program and potential investment opportunities without the need for equity Sources Uses Sources Uses PSE&G Cash from Ops (1) PSE&G Cash Investment PSE&G Net Debt PSEG 2015 - 2019E Sources and Uses PSE&G Cash from Ops (1) PSE&G Net Debt Planned Programs Including Potential Upside Projects Shareholder Dividend Power Cash from Ops Shareholder Dividend Power Cash from Ops Power Cash Investment (3) PSE&G Cash Investment Power Net Debt Other Cash Flow (2) Other Cash Flow (2) Power Net Debt Power Cash Investment (3) (1) PSE&G CASH FROM OPERATIONS ADJUSTS FOR SECURITIZATION PRINCIPAL REPAYMENTS OF ~$260M FROM 2015-2019 (2) OTHER CASH FLOW INCLUDES PSEG LI, HOLDINGS NET CASH FLOW, INVESTED CASH, AND PARENT SHORT-TERM DEBT (3) POWER CASH INVESTMENT INCLUDES NUCLEAR FUEL AND EMISSION PURCHASES. DOES NOT REFLECT $825 - $875 MILLION KEYS INVESTMENT ANNOUNCED ON JUNE 17, 2015. E = ESTIMATE. 91 |
 0% 10% 20% 30% 40% 50% 60% 70% Power’s key credit metric remains strong providing opportunity for incremental investment* 2015-2017E Average Increased contribution to earnings from the more stable regulated business Power’s annual Cash From Operations and Funds From Operations each average ~$1.4B over the 2015 to 2017 period supported by: - Capacity Revenues - Hedged Generation - O&M Control Financial strength can be used to pursue future growth in both businesses beyond current plans 2013 2014 PSEG Power Funds from Operations / Debt *DOES NOT REFLECT $825 - $875 MILLION KEYS INVESTMENT ANNOUNCED ON JUNE 17, 2015. E= ESTIMATE 92 |
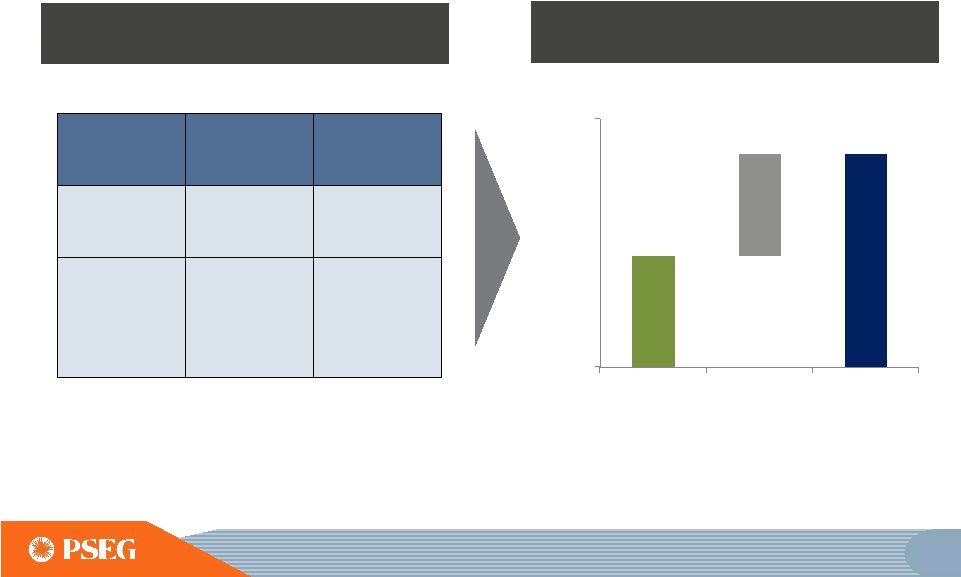 Total Incremental Investment Capacity through 2017 Substantial Investment Capacity to pursue additional growth without the need for equity $0.0 $4.0 Power Parent Total ($ Billions) Power PSEG Estimate ~ 55% ~30% Minimum Threshold 30% Low - 20’s Average Funds from Operations /Debt 2015 - 2017 Our incremental investment capacity can support over $6B in regulated investments DOES NOT REFLECT THE IMPACT OF $825 - $875 MILLION KEYS CCGT INVESTMENT ANNOUNCED JUNE 17, 2015. 93 |
 PSEG 2015 Guidance for Operating Income – by Subsidiary and PSEG Power Adjusted EBITDA Anticipates Another Year of Growth in Operating Earnings $ millions (except EPS) 2015E 2014 PSE&G $735 - $775 $725 PSEG Power $620 - $680 $642 PSEG Enterprise/Other $40 - $45 $33 Operating Earnings* $1,395 - $1,500 $1,400 Earnings per Share $2.75 - $2.95E $2.76 PSEG Power Adjusted EBITDA** $ millions (except EPS) 2015E 2014 PSEG Power $1,545 - $1,645 $1,584 * SEE SLIDE A FOR ITEMS EXCLUDED FROM NET INCOME TO RECONCILE TO OPERATING EARNINGS; INCLUDES THE FINANCIAL IMPACT FROM MARK-TO-MARKET POSITIONS WITH FORWARD DELIVERY MONTHS. ** SEE SLIDE B FOR A RECONCILIATION OF ADJUSTED EBITDA TO OPERATING EARNINGS AND NET INCOME. E = ESTIMATE. 96 |
 PSEG Summary • Our 2014 earnings of $2.76 exceeded our revised operating earnings guidance of $2.60 - $2.75 per share • Continued third year of anticipated positive earnings trend in 2015 with operating earnings guidance of $2.75 to $2.95 per share • Continued 5 th straight year of expected double digit, 5 year growth in rate base • Anticipated high single digit earnings growth at PSE&G on three-year basis from 2014 to 2017, driven by transmission investments and planned programs • Power’s continued focus on operational excellence, market expertise and financial strength delivers value in current price environment • Strong Balance Sheet and Cash Flow support PSE&G’s capital program and Power’s new investment opportunity without the need for equity • Our $0.08 per share dividend increase is consistent with our long history of returning cash to the shareholder through the common dividend, with potential for consistent and sustainable growth 99 |
 Items Excluded from Income from Continuing Operations/Net Income to Reconcile to Operating Earnings PLEASE SEE PAGE 3 FOR AN EXPLANATION OF PSEG’S USE OF OPERATING EARNINGS AS A NON-GAAP FINANCIAL MEASURE AND HOW IT DIFFERS FROM NET INCOME. 2014 2013 2012 2011 2010 2009 Earnings Impact ($ Millions) Operating Earnings 1,400 $ 1,309 $ 1,236 $ 1,389 $ 1,584 $ 1,567 $ Gain (Loss) on Nuclear Decommissioning Trust (NDT) Fund Related Activity (PSEG Power) 68 40 52 50 46 9 Gain (Loss) on Mark-to-Market (MTM) (PSEG Power) 66 (74) (10) 107 (1) (11) Lease Transaction Activity (PSEG Enterprise/Other) - - 36 (173) - 29 Storm O&M (PSEG Power) (16) (32) (39) - - - Market Transition Charge Refund (PSE&G) - - - - (72) - Gain (Loss) on Asset Sales and Impairments (PSEG Enterprise/Other) - - - 34 - - Income from Continuing Operations 1,518 $ 1,243 $ 1,275 $ 1,407 $ 1,557 $ 1,594 $ Discontinued Operations - - - 96 7 (2) Net Income 1,518 $ 1,243 $ 1,275 $ 1,503 $ 1,564 $ 1,592 $ Fully Diluted Average Shares Outstanding (in Millions) 508 508 507 507 507 507 Per Share Impact (Diluted) Operating Earnings 2.76 $ 2.58 $ 2.44 $ 2.74 $ 3.12 $ 3.09 $ Gain (Loss) on NDT Fund Related Activity (PSEG Power) 0.13 0.08 0.10 0.10 0.09 0.02 Gain (Loss) on MTM (PSEG Power) 0.13 (0.14) (0.02) 0.21 - (0.02) Lease Transaction Activity (PSEG Enterprise/Other) - - 0.07 (0.34) - 0.05 Storm O&M (PSEG Power) (0.03) (0.07) (0.08) - - - Market Transition Charge Refund (PSE&G) - - - - (0.14) - Gain (Loss) on Asset Sales and Impairments (PSEG Enterprise/Other) - - - 0.06 - - Income from Continuing Operations 2.99 $ 2.45 $ 2.51 $ 2.77 $ 3.07 $ 3.14 $ Discontinued Operations - - - 0.19 0.01 - Net Income 2.99 $ 2.45 $ 2.51 $ 2.96 $ 3.08 $ 3.14 $ (Unaudited) For the Year Ended December 31, PUBLIC SERVICE ENTERPRISE GROUP INCORPORATED Reconciling Items, net of tax (a) Includes the financial impact from positions with forward delivery months. A (a) (a) |
 Items Excluded from Net Income to Reconcile to Operating Earnings and Adjusted EBITDA PLEASE SEE PAGE 3 FOR AN EXPLANATION OF PSEG’S USE OF OPERATING EARNINGS AND ADJUSTED EBITDA AS NON-GAAP FINANCIAL MEASURES AND HOW THEY DIFFER FROM NET INCOME. B 2015 2014 Adjusted EBITDA 626 $ 651 $ 1,584 $ Fossil Major Maintenance, pre-tax (49) (58) (144) Depreciation and Amortization, pre-tax (b) (77) (73) (291) Interest Expense, pre-tax (b) (31) (31) (120) Income Taxes (b) (191) (196) (387) Operating Earnings 278 $ 293 $ 642 $ Gain (Loss) on NDT Fund Related Activity, pre-tax 7 19 138 Gain (Loss) on MTM, pre-tax (a) (34) (223) 111 Storm O&M, net of insurance recoveries, pre-tax 127 (10) (27) Income Taxes related to Operating Earnings reconciling items (43) 85 (104) Net Income 335 $ 164 $ 760 $ (a) Includes the financial impact from positions with forward delivery months. (b) Excludes amounts related to Operating Earnings reconciling items ($ Millions, Unaudited) PSEG Power Adjusted EBITDA Reconcilation Year Ended December 31, 2014 Reconciling Items Three Months Ended March 31, |