 We have the energy to make things better … for you, for our investors and for our stakeholders. EXHIBIT 99 |
 2 Forward-Looking Statement Certain of the matters discussed in this report about our and our subsidiaries' future performance, including, without limitation, future revenues, earnings, strategies, prospects, consequences and all other statements that are not purely historical constitute “forward-looking statements” within the meaning of the Private Securities Litigation Reform Act of 1995. Such forward-looking statements are subject to risks and uncertainties, which could cause actual results to differ materially from those anticipated. Such statements are based on management's beliefs as well as assumptions made by and information currently available to management. When used herein, the words “anticipate,” “intend,” “estimate,” “believe,” “expect,” “plan,” “should,” “hypothetical,” “potential,” “forecast,” “project,” variations of such words and similar expressions are intended to identify forward-looking statements. Factors that may cause actual results to differ are often presented with the forward-looking statements themselves. Other factors that could cause actual results to differ materially from those contemplated in any forward-looking statements made by us herein are discussed in filings we make with the United States Securities and Exchange Commission (SEC), including our Annual Report on Form 10-K and subsequent reports on Form 10-Q and Form 8-K and available on our website: http://www.pseg.com. These factors include, but are not limited to: • adverse changes in the demand for or the price of the capacity and energy that we sell into wholesale electricity markets, • adverse changes in energy industry law, policies and regulation, including market structures and transmission planning, • any inability of our transmission and distribution businesses to obtain adequate and timely rate relief and regulatory approvals from federal and state regulators, • changes in federal and state environmental regulations and enforcement that could increase our costs or limit our operations, • changes in nuclear regulation and/or general developments in the nuclear power industry, including various impacts from any accidents or incidents experienced at our facilities or by others in the industry, that could limit operations of our nuclear generating units, • actions or activities at one of our nuclear units located on a multi-unit site that might adversely affect our ability to continue to operate that unit or other units located at the same site, • any inability to manage our energy obligations, available supply and risks, • adverse outcomes of any legal, regulatory or other proceeding, settlement, investigation or claim applicable to us and/or the energy industry, • any deterioration in our credit quality or the credit quality of our counterparties, • availability of capital and credit at commercially reasonable terms and conditions and our ability to meet cash needs, • changes in the cost of, or interruption in the supply of, fuel and other commodities necessary to the operation of our generating units, • delays in receipt of necessary permits and approvals for our construction and development activities, • delays or unforeseen cost escalations in our construction and development activities, �� any inability to achieve, or continue to sustain, our expected levels of operating performance, • any equipment failures, accidents, severe weather events or other incidents that impact our ability to provide safe and reliable service to our customers, and any inability to obtain sufficient insurance coverage or recover proceeds of insurance with respect to such events, • acts of terrorism, cybersecurity attacks or intrusions that could adversely impact our businesses, • increases in competition in energy supply markets as well as for transmission projects, • any inability to realize anticipated tax benefits or retain tax credits, • challenges associated with recruitment and/or retention of a qualified workforce, • adverse performance of our decommissioning and defined benefit plan trust fund investments and changes in funding requirements, • changes in technology, such as distributed generation and micro grids, and greater reliance on these technologies, and • changes in customer behaviors, including increases in energy efficiency, net-metering and demand response. All of the forward-looking statements made in this report are qualified by these cautionary statements and we cannot assure you that the results or developments anticipated by management will be realized or even if realized, will have the expected consequences to, or effects on, us or our business prospects, financial condition or results of operations. Readers are cautioned not to place undue reliance on these forward-looking statements in making any investment decision. Forward-looking statements made in this report apply only as of the date of this report. While we may elect to update forward-looking statements from time to time, we specifically disclaim any obligation to do so, even if internal estimates change, unless otherwise required by applicable securities laws. The forward-looking statements contained in this report are intended to qualify for the safe harbor provisions of Section 27A of the Securities Act of 1933, as amended, and Section 21E of the Securities Exchange Act of 1934, as amended. |
 3 GAAP Disclaimer These materials and other financial releases can be found on the pseg.com website under the investor tab, or at http://investor.pseg.com/ PSEG presents Operating Earnings and Adjusted Earnings Before Interest, Taxes, Depreciation and Amortization (EBITDA) in addition to its Income from Continuing Operations/Net Income reported in accordance with accounting principles generally accepted in the United States (GAAP). Operating Earnings and Adjusted EBITDA are non-GAAP financial measures that differ from Income from Continuing Operations/Net Income. Operating Earnings exclude gains or losses associated with Nuclear Decommissioning Trust (NDT), Mark-to-Market (MTM) accounting, and other material one-time items. PSEG presents Operating Earnings because management believes that it is appropriate for investors to consider results excluding these items in addition to the results reported in accordance with GAAP. PSEG believes that the non-GAAP financial measure of Operating Earnings provides a consistent and comparable measure of performance of its businesses to help shareholders understand performance trends. PSEG is presenting Adjusted EBITDA because it provides investors with additional information to compare our business performance to other companies and understand performance trends. Adjusted EBITDA excludes the same items as our Operating Earnings measure as well as income tax expense, interest expense, depreciation and amortization and major maintenance expense costs at Power’s fossil generation facilities. This information is not intended to be viewed as an alternative to GAAP information. The last three slides in this presentation (Slides A, B and C) include a list of items excluded from Income from Continuing Operations/Net Income to reconcile to Operating Earnings and Adjusted EBITDA with a reference to that slide included on each of the slides where the non-GAAP information appears. |
 PSEG OVERVIEW EXECUTIVE VICE PRESIDENT AND CHIEF FINANCIAL OFFICER Caroline Dorsa PRESIDENT PSEG POWER ER&T Shahid Malik VICE PRESIDENT INVESTOR RELATIONS Kathleen Lally |
 5 Operational Excellence: Maintaining reliability and improving performance as we control costs in low price environment Financial Strength: Strong financial position supports investment program and dividend growth Disciplined Investment: • Balanced business mix • Robust pipeline of opportunities Results: • Project 3 rd year of EPS growth • Increased rate of dividend growth • Best in class utility growth rate • Addition of efficient CCGT capacity enhances market position • Upside potential from power markets DISCIPLINED INVESTMENT OPERATIONAL EXCELLENCE FINANCIAL STRENGTH ENGAGED WORKFORCE PSEG’s Strategy Investment program delivering results |
 6 Two complementary businesses A stable platform, each with growth opportunities Strategy: Investment program enhances competitive position with addition of efficient CCGT capacity Value Proposition: Provides substantial free cash flow in current environment and upside from market rule improvements Assets $12B Operating Earnings $642M Regional Competitive Generation Strategy: Investments aligned with public policy and customer needs infrastructure program – focused on transmission – produces double-digit rate base growth through 2019 Assets $22B Operating Earnings $725M Electric & Gas Delivery and Transmission 2014 2014 ASSETS AND OPERATING EARNINGS ARE FOR THE YEAR ENDED 12/31/2014. PSE&G AND POWER DO NOT ADD TO TOTAL DUE TO PARENT AND PSEG LONG ISLAND ACTIVITY. SEE SLIDE A FOR ITEMS EXCLUDED FROM INCOME FROM CONTINUING OPERATIONS/NET INCOME TO RECONCILE TO OPERATING EARNINGS. Value Proposition: An $11 billion |
 7 Delivering on commitments and realizing growth Operational Excellence • PSE&G: Mid-Atlantic Reliability Award (13 th consecutive year), top ranked among eastern electric and gas utilities in business customer satisfaction • PSEG Power: Record output from combined cycle units • PSEG Long Island: Demonstrated management and integration capability through a successful transition in first year • PSEG: Cost-control benefits continue Financial Strength • Updated operating earnings guidance for 2015 to $2.80-$2.95 per share from $2.75-$2.95 per share • Cash flows and business mix support strong credit ratings and ability to fully fund robust investment pipeline without issuing new equity • Increased rate of dividend growth in 2015 Disciplined Investment • PSE&G Capital program = rate base growth of 10% over 5 years with increased investment in Transmission and Electric and Gas distribution Further growth planned – Gas System Modernization Program • Power: Keys & Sewaren CCGTs, uprates, PennEast Pipeline, and Solar Source |
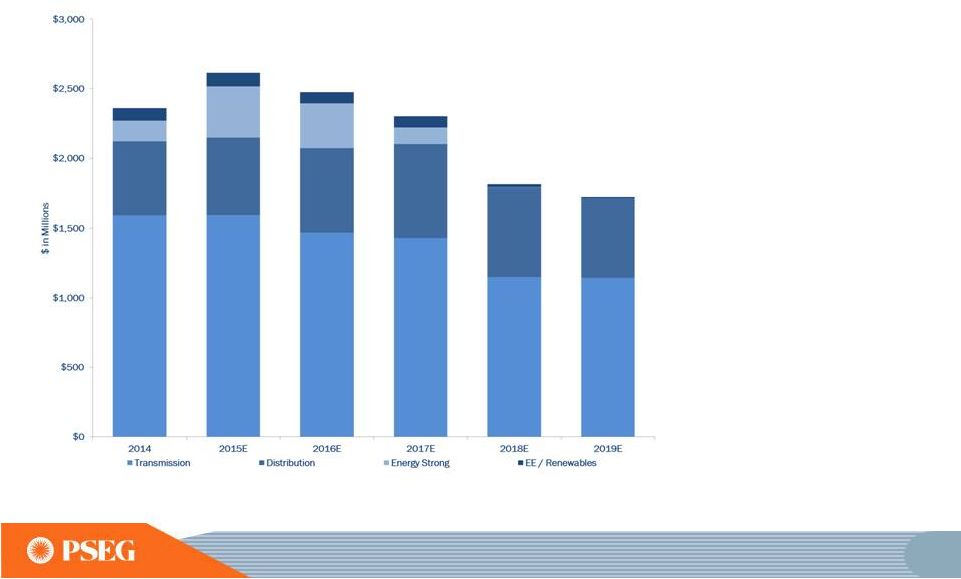
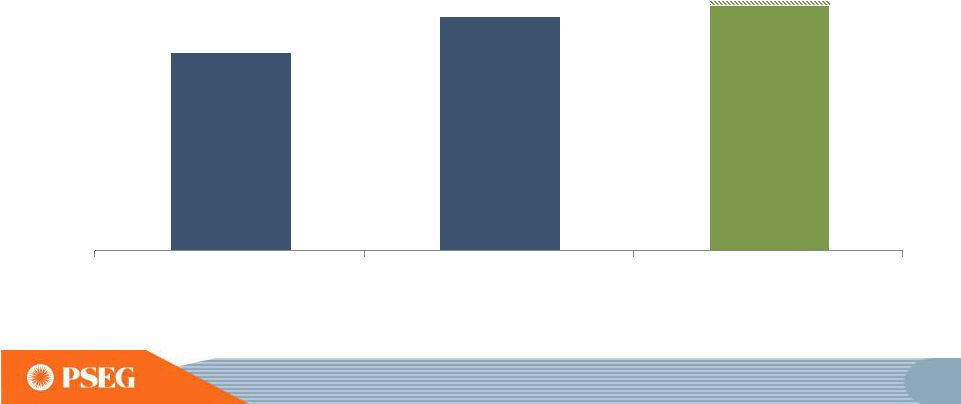
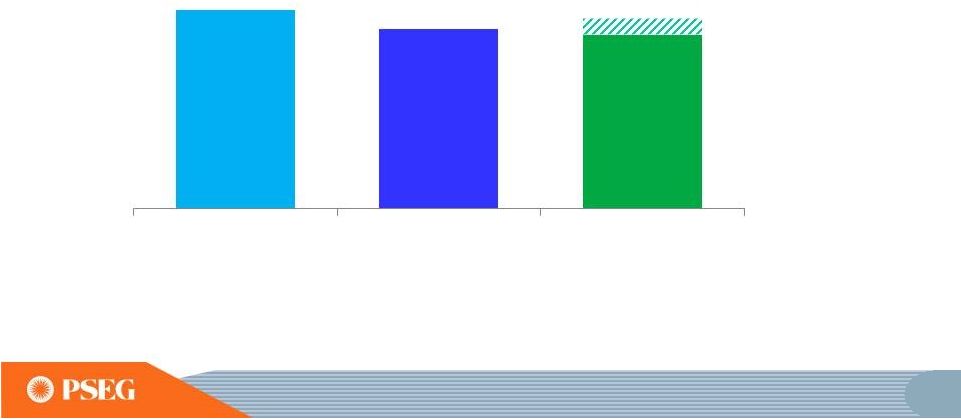
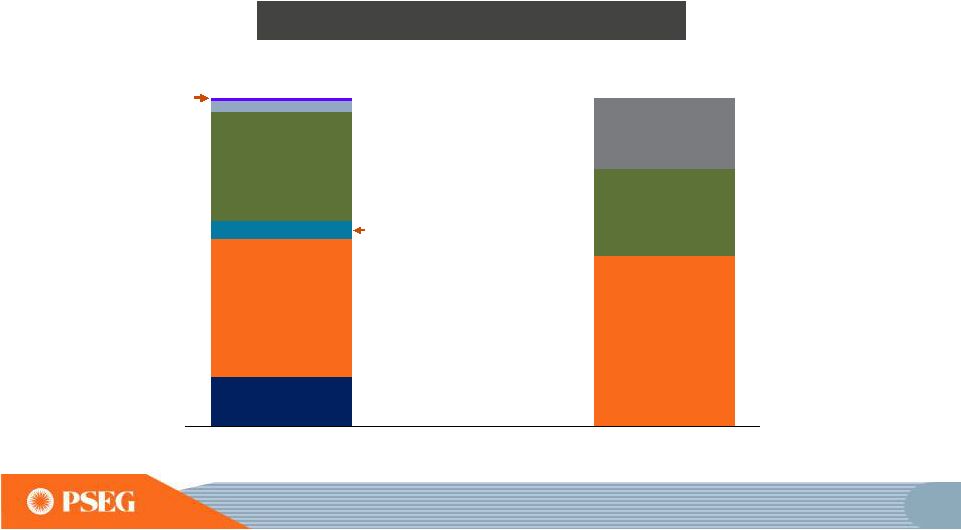
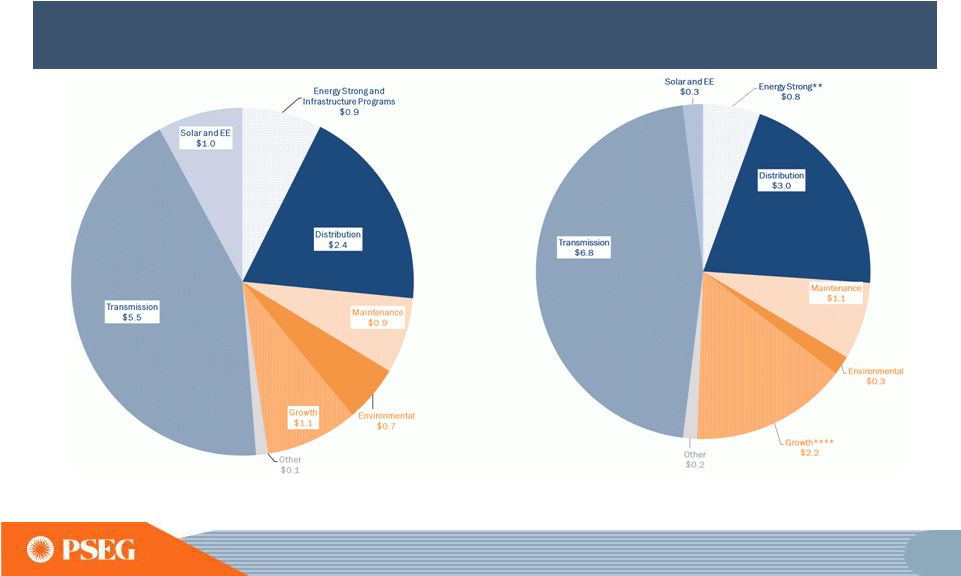 8 Robust pipeline of investment opportunities supports >15% growth in capital spending over the period 2015E - 2019E*: $14.7Billion 2010 – 2014: $12.6 Billion Power Total*** $2.7B PSE&G Total $9.8B PSE&G Total $10.9B PSEG Capital Spending Power Total*** $3.6B 2015E–2019E: • Potential incremental capital for Gas System Modernization Program *INCLUDES ALL PLANNED SPENDING. **ENERGY STRONG EXCLUDES RISK AND CONTINGENCY. ***POWER CAPITAL SPENDING EXCLUDES NUCLEAR FUEL. ****INCLUDES PENNEAST PIPELINE EQUITY INVESTMENT OF $0.1B. E=ESTIMATE. DATA AS OF AUGUST 4, 2015 |
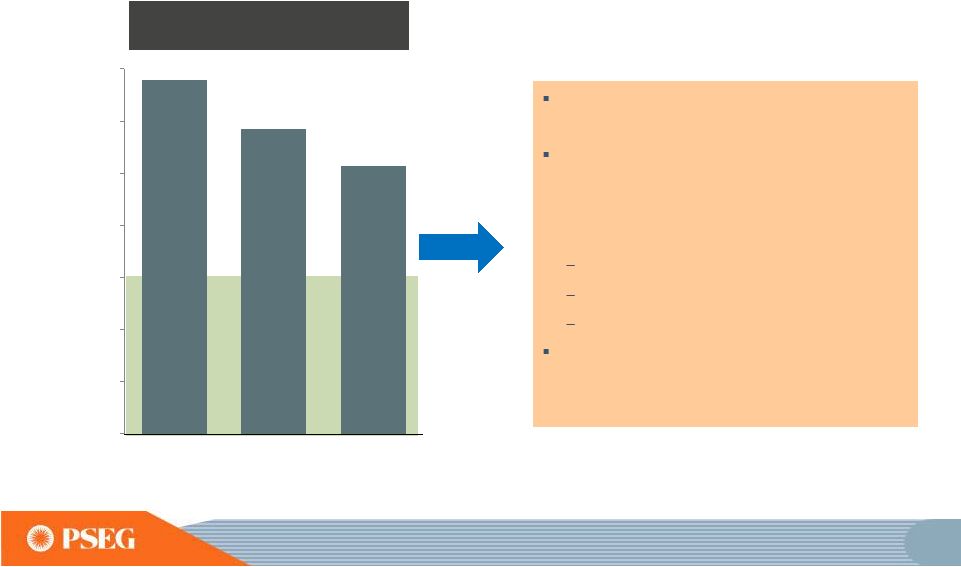
 9 Balance sheet strength supports capital allocation Timeframe Actions taken 2010 – 2014: Transformed business mix • Applied $16 billion towards investments and dividends • Improved credit ratings • Monetized Energy Holdings’ portfolio • Strong balance sheet sustained during period of low power prices, while increasing the dividend 2015 – Forward: Strong financial position supports continued growth • Increased rate of dividend growth in 2015 • $14.5 billion+ investment program through 2019 • Gas System Modernization Program could increase capital investment by up to $1.6 billion as filed • Financial capability supports further expansion of the current capital plan |
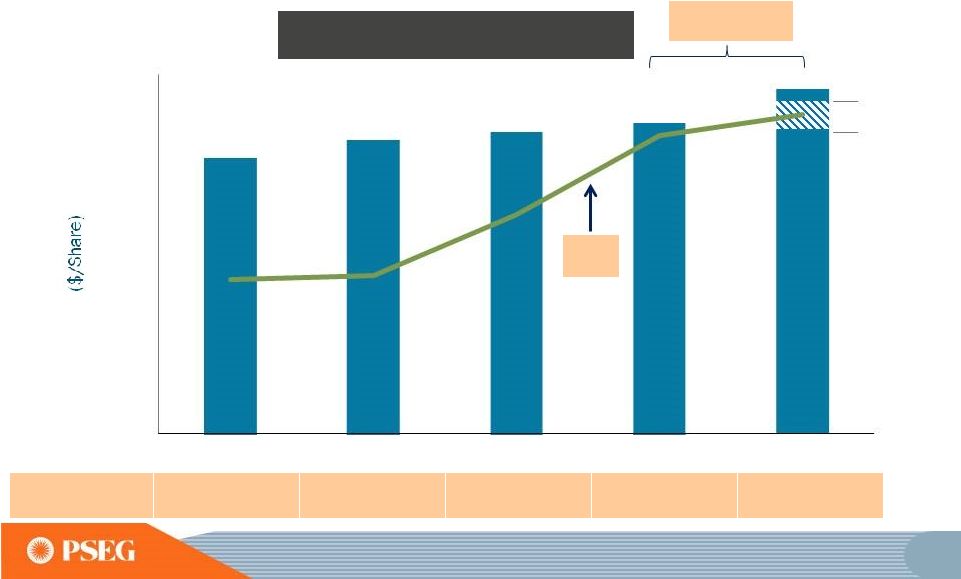
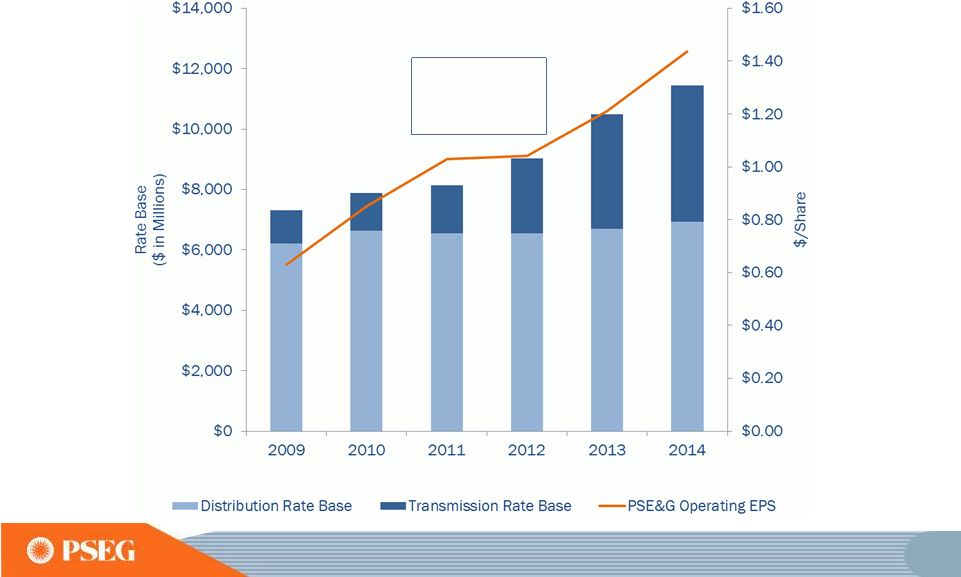 10 PSE&G’s investment program Meeting public policy goals and customer needs PSE&G Rate Base and Operating Earnings* *SEE SLIDE A FOR ITEMS EXCLUDED FROM INCOME FROM CONTINUING OPERATIONS/ NET INCOME TO RECONCILE TO OPERATING EARNINGS. 2009-2014 Operating EPS CAGR: 18% |
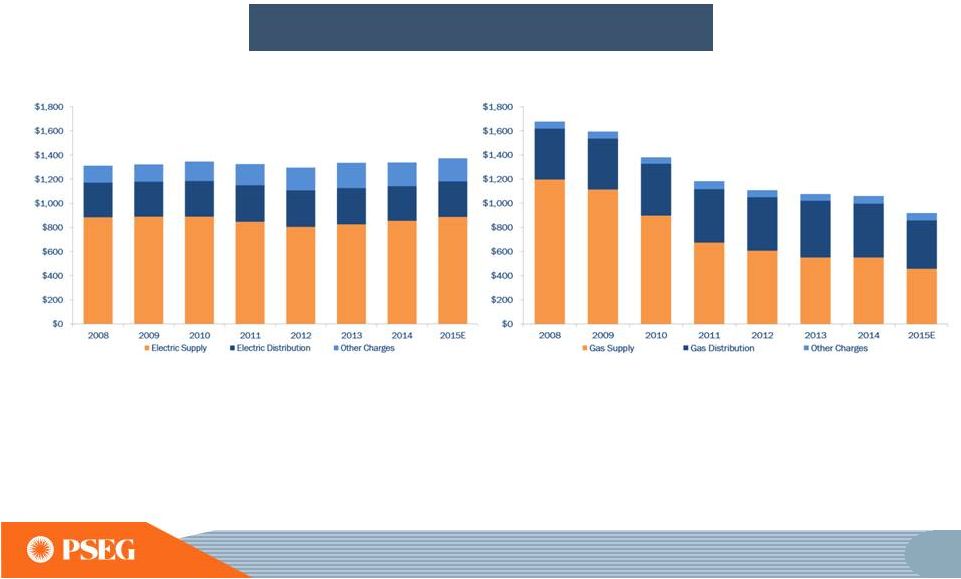 11 Containing customer bills while investing in the system • PSE&G customers’ combined electric and gas bills declined 23% over the period. • Low gas prices drove rate decreases; in addition, gas customers received bill credits of ~$400 in total from 2012 through 2014. Gas Electric PSE&G Typical Residential Customer Bills* *FOR ALL YEARS THE BILLING ASSUMES 7,200 KWH FOR ELECTRIC AND 1,010 THERMS FOR GAS ANNUALLY. E = ESTIMATE 11 |
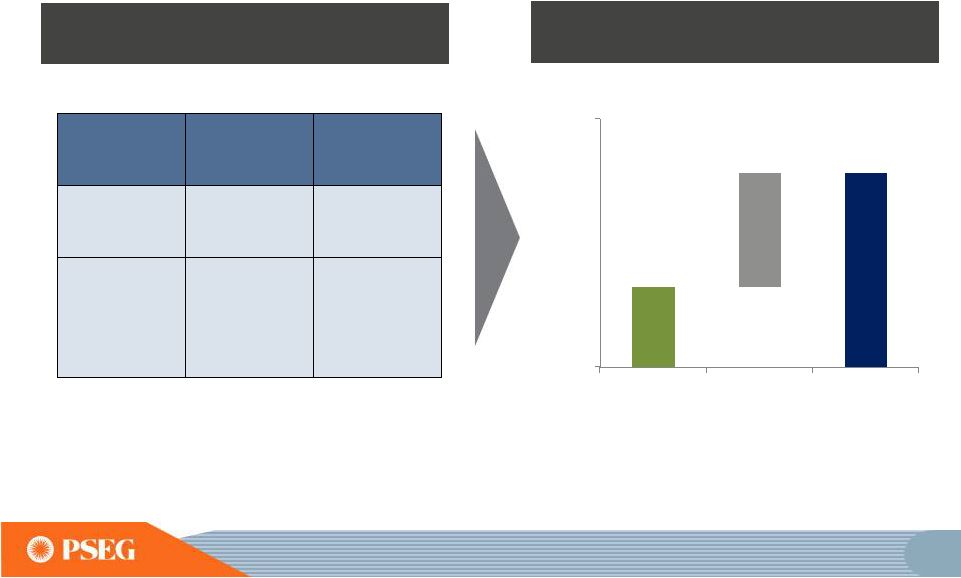
 12 PSE&G’s robust capital investment pipeline drives double-digit rate base growth through 2019 E=ESTIMATE PSE&G Capital Projects 2015E–2019E: • Potential incremental capital for Gas System Modernization Program • Planned capital spend supports high single digit earnings growth at PSE&G through 2017 • Transmission expected to grow to >50% of rate base in 2019 • Seeking to broaden platform to expand energy efficiency and other investments |
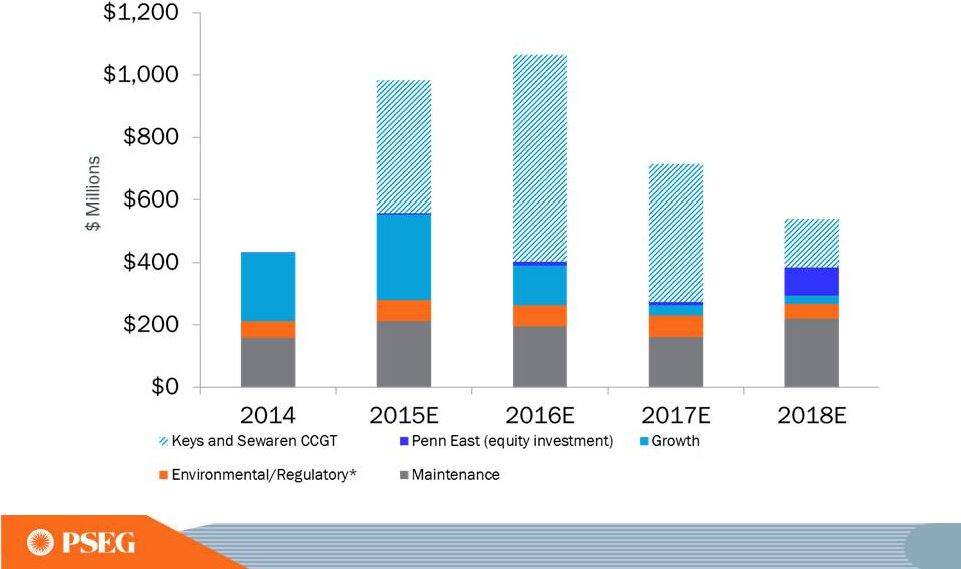 13 PSEG Power’s capital expenditures focused on improving efficiency and reliability *BASED ON CURRENTLY KNOWN AND QUANTIFIABLE ENVIRONMENTAL REQUIREMENTS. E=ESTIMATE. (Peach Bottom EPU, AGP, Solar) |
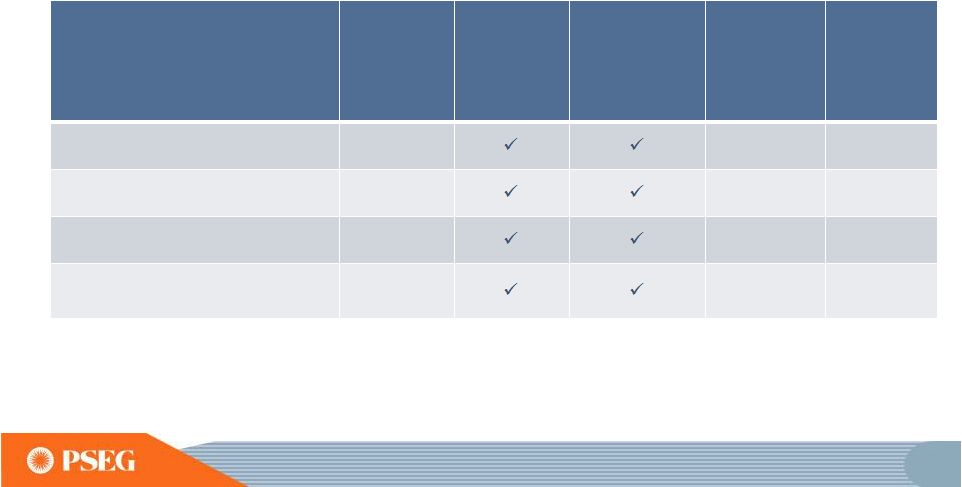
 14 Economic Drivers Outlook Combined Cycle Nuclear Scrubbed Coal Peakers Renewable Energy Margins • Low natural gas and energy prices • Robust portfolio of gas pipeline contracts n/a n/a Capacity Markets • Tightened rules proposed for capacity performance n/a Environmental Regulations • Tighter air emissions standards Location • Assets in well-designed markets, premium regions • Opportunities on brownfield sites n/a 3.3 3.7 2.4 2.3 0.1 4.7 3.8 2.4 1.8 0.1 Power’s fleet has the desired attributes to be successful in today’s and tomorrow’s market *AS OF AUGUST 2015 APPROXIMATELY 1.3 GW UNDER DEVELOPMENT - KEYS AND SEWAREN CCGT UNITS, WHICH ARE TARGETED TO GO INTO SERVICE IN 2018 ALONG WITH RETIREMENT OF OLDER SEWAREN UNITS • • • Largest nuclear site in the eastern U.S. and ownership in large, fully scrubbed coal facilities at Keystone and Conemaugh provide economies of scale that enhance energy margins in current low market, and provide for upside potential if prices improve. Dual fuel peakers meet reliability criteria in capacity markets and provide option value in energy market. Opportunity exists to repower peakers that do not meet NJ HEDD environmental regulations. Combined cycle units Keys and Sewaren, expected to be operational in 2018, will enhance emissions performance and have a combined average 2015 - PSEG Power Total Capacity 11.8 GW 2018 - PSEG Power Total Capacity 12.8 GW * heat rate of approximately 6,800. |
 15 Power – Growing value by improving market rules and developing investment opportunities Value Source Opportunities and Actions Taken Improving rules will better recognize value of our fleet • PJM’s Capacity market – 2014 limits on demand response and August 2015 Capacity Performance auction • Demand response treatment at U.S. Courts / FERC • Energy price formation at FERC • Increasing air standards through Federal and State regulations Our footprint provides growth opportunities • Nuclear and Combined Cycle plant uprates underway • New build Keys CCGT in SWMAAC* (MD) and Sewaren 7 in EMAAC* • Brownfield expansions at existing sites New peakers built at New Haven and Kearny sites Continue to explore further opportunities • PennEast pipeline - equity investment and gas portfolio enhancement • Solar Source owns ~148 MW**, with significant project pipeline • Continue to seek opportunities to expand the fleet * SWMAAC = SOUTHWEST MID-ATLANTIC AREA COUNCIL \EMAAC = EASTERN MID-ATLANTIC AREA COUNCIL LOCATIONAL DELIVERABILITY AREA WITHIN PJM. **PROJECT SIZE IN MEGAWATTS SHOWN IN DC (DIRECT CURRENT), AC EQUIVALENT IS 115 MW. |
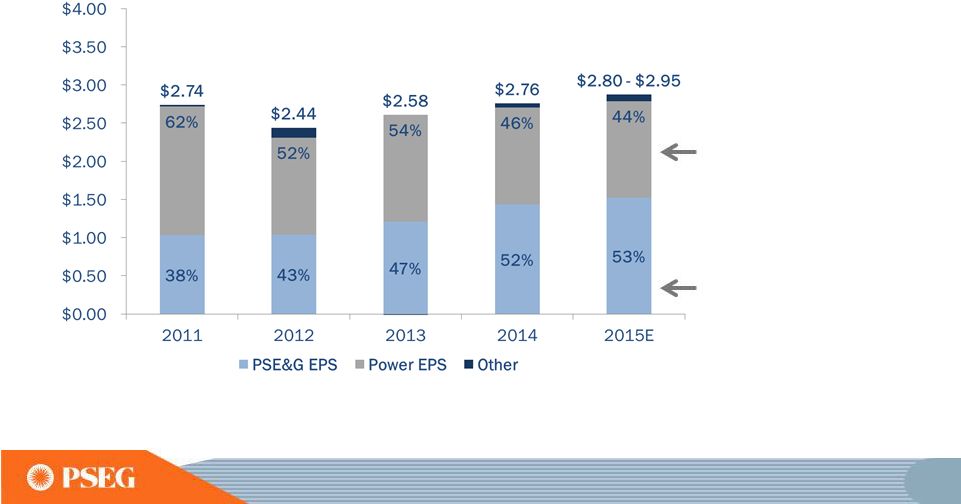 16 Operating Earnings Disciplined investment program and focus on operational excellence have supported growth mix and dispatch flexibility continue to generate strong earnings and free cash flow in low price environment PSE&G’s investment program has driven double digit compound annual earnings growth since 2010 Operating Earnings* Contribution by Subsidiary *SEE SLIDE A FOR ITEMS EXCLUDED FROM INCOME FROM CONTINUING OPERATIONS/ NET INCOME TO RECONCILE TO OPERATING EARNINGS. E=ESTIMATE ** 2015 PERCENTS USE MIDPOINT OF UPDATED EARNINGS GUIDANCE. ** ** Power’s diverse fuel |
 17 PSEG Annual Dividend An increased dividend growth rate with potential for consistent and sustainable growth given our business mix and financial position Payout Ratio 50% 58% 56% 54% 54%* PSEG Annual Dividend Rate 2011-2014 CAGR: 2.6% *2015E PAYOUT RATIO REFLECTS THE MIDPOINT OF UPDATED OPERATING EARNINGS GUIDANCE. E=ESTIMATE |
 18 Focus areas over business plan horizon *SWMAAC = SOUTHWEST MID-ATLANTIC AREA COUNCIL/EMAAC = EASTERN MID-ATLANTIC AREA COUNCIL LOCATIONAL DELIVERABILITY AREA WITHIN PJM. • • • • • • • • • PSE&G PSEG Power PSEG Long Island Capital program execution – Transmission, Energy Strong and GSMP program Operational excellence and cost control Regulatory framework Continue to develop incremental growth opportunities Continue execution – Integration and achievement of performance metrics Operational excellence and cost control Timely construction of new growth opportunities – Keys Energy Center CCGT in SWMAAC* and Sewaren 7 CCGT in EMAAC* Zones Strong performance at Nuclear and Fossil to maximize fleet value in dynamic markets Monitor and shape market rules - Capacity markets and environmental regulations |
 19 PSEG’s Value Proposition • A stable platform with predictable earnings and a robust investment pipeline • PSE&G – Best in class utility performance and growth profile • PSEG Power – Repositioning fleet to enhance efficiency and reliability in the current market environment • Strong balance sheet – Supports strong credit rating, growth objectives and the potential for consistent and sustainable dividend growth |
 PSE&G |
 21 PSE&G strategy Building a sustainable platform that balances reliability, customer rates and public policy to ensure growth at reasonable returns DISCIPLINED INVESTMENT OPERATIONAL EXCELLENCE FINANCIAL STRENGTH ENGAGED WORKFORCE |
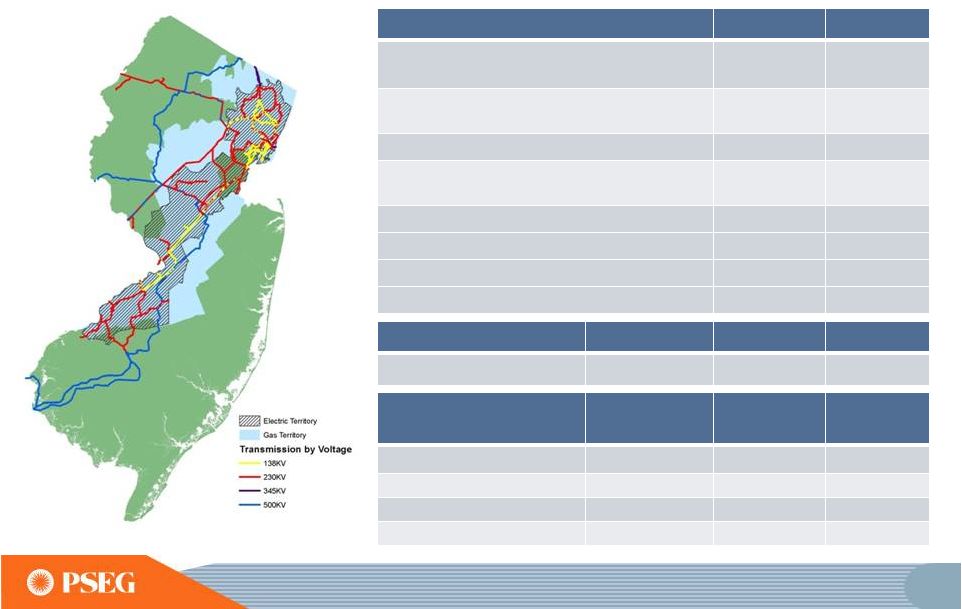 22 PSE&G is the largest electric and gas distribution and transmission utility company in New Jersey Electric Gas Customers Growth (2010 – 2014) 2.2 Million 0.3% 1.8 Million 0.3% 2014 Electric Sales and Gas Sold and Transported 40,737 GWh 2,628M Therms* Projected Annual Load Growth (2015 – 2017)** 1.1% 0.5% Projected Annual Load Growth Transmission (2015 – 2017) 0.9% Sales Mix Residential 32% 60% Commercial 58% 36% Industrial 10% 4% Transmission Electric Gas Approved Rate of Return*** 11.68% ROE 10.3% ROE 10.3% ROE 2009-June 2015 Total Program Plan Total Investment thru June 2015 Solar Loan Capacity 83 MW 178.5 MW $250M Solar 4 All Capacity 100 MW 125 MW $527M EE Annual Electric savings 206 GWh ~250 GWh EE Annual Gas savings 6.5 M Therms ~10 M Therms * GAS FIRM ONLY SALES. ** ESTIMATED ANNUAL GROWTH PER YEAR, ASSUMES NORMAL WEATHER. *** SOME PROJECTS APPROVED FOR SPECIFIC ROE. Renewables & Energy Efficiency Approved Programs |
 23 Mid-Atlantic ReliabilityOne award winner for 13 years in a row |
 24 PSE&G’s service and reliability is being recognized by customers |
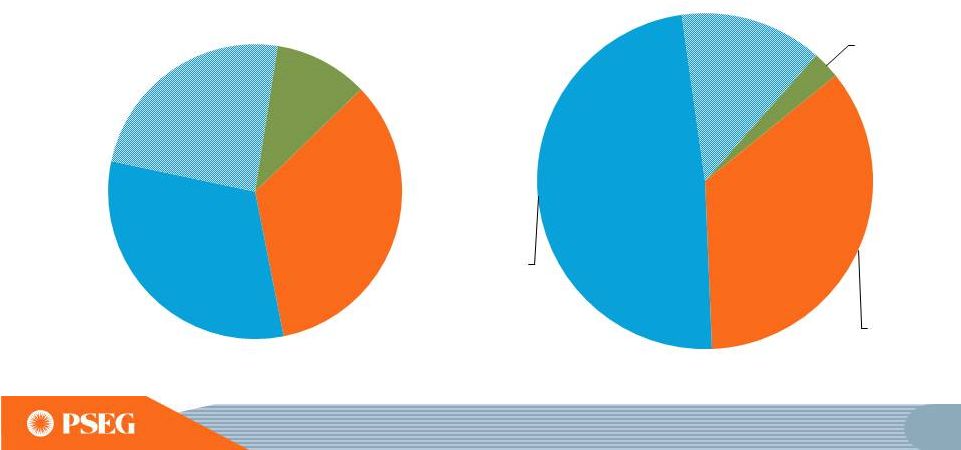 25 PSE&G plans to invest $10.9B over the next five years PSE&G’s Capital Expenditures* *INCLUDES AFUDC. E=ESTIMATE. Distribution 34% Other Transmission 32% Major Transmission Incentive Projects 24% Solar/Energy Efficiency 10% 2010-2014 $9.8B Distribution 35% Other Transmission 48% Major Transmission Incentive Projects 14% Solar/Energy Efficiency 3% 2015-2019E $10.9B |
 26 PSE&G’s major Transmission projects have been completed on schedule and on budget Major Transmission Investments Project Roster Approved ROE Inclusion of CWIP in Rate Base 100% Recovery of Costs Due to Abandonment Estimate Up To ($ Millions) Expected In-service Date Susquehanna-Roseland 12.93% $790 Completed North Central Reliability 11.68% $390 Completed Burlington–Camden 230kV 11.68% $399 Completed Mickleton–Gloucester–Camden 230kV 11.68% $435 Completed |
 27 A robust pipeline of Transmission investments focus on reliability improvements and replacement of aging infrastructure Project Roster Approved ROE Program Description Estimate Up To ($ Millions) Expected In-service Date Northeast Grid Reliability 11.93% PJM baseline project receiving CWIP in rate base treatment $907 Jun-Dec 2015 Bergen—Linden Corridor 345kV 11.68% PJM baseline project receiving CWIP in rate base treatment $1,200 June 2018 PJM Regional Transmission Expansion Plan (RTEP) – multiple projects 11.68% PJM mandated system reliability projects $1,900 Various 69kV Upgrade – multiple projects 11.68% Upgrade of 26kV to 69kV $1,500 Various Transmission Lifecycle – multiple projects 11.68% Replacement of aging infrastructure $1,100 Various Transmission Hardening– multiple projects 11.68% Reliability projects focused on system resiliency $650 Various Artificial Island 11.68% PJM Baseline Project $110-$130* 2019* * PJM ESTIMATE |
 28 Major Transmission programs focus on reliability and replacing aging infrastructure • PJM’s Regional Transmission Expansion Plan (RTEP) identifies system enhancements needed for reliability • 69kV system upgrades improve system reliability and provide capacity for future growth • Transmission Lifecycle is an ongoing program to manage transmission asset life to maintain and improve system integrity and reliability • Transmission Hardening projects focus on increasing system resiliency |
 29 PSE&G is successfully executing on Energy Strong with ~$330M deployed Program Approved Spend thru June 2015 Flood Mitigation $620M $56M Electric Contingency Reconfiguration $100M $49M Electric Advanced Technology $100M $32M Gas Utilization Pressure Cast Iron (UPCI) $350M $185M Gas Metering & Regulating (M&R) $50M $6M TOTAL $1,220M $328M |
 30 PSE&G has successfully worked with regulators to develop multiple solutions for New Jersey’s energy and economic development goals • Solar Loan I – 2008 • Solar Loan II – 2009 • Solar 4 All – 2009 • Solar Loan III – 2013 • Solar 4 All Ext – 2013 RENEWABLES creative solutions to install solar generation • Carbon Abatement – 2008 • Demand Response – 2009 • Energy Efficiency (EE) – 2009 • EE Extension – 2011 • EE Extension II – 2015 ENERGY EFFICIENCY assisting customers with controlling energy usage • NJ Capital Infrastructure Program 1 (CIP 1) – 2009 • NJ Capital Infrastructure Program 2 (CIP 2) – 2011 • Energy Strong – 2014 DISTRIBUTION improving electric and gas delivery infrastructure To date we have invested over $2B in the above programs Over $1B ahead in Energy Strong, Energy Efficiency Ext II and Solar programs Gas System Modernization Program would increase potential investment by up to $1.6B |
 31 Extension of PSE&G’s award winning Energy Efficiency program • Energy Efficiency Extension II approved by the BPU in April 2015 will extend the investment and time frame for three previously approved programs already in the marketplace, allowing PSE&G to factor in lessons learned and balance policy issues • $95M of rate base investment approved at an ROE of 9.75% • Extends existing programs, two of which have sizable waiting lists: • Hospitals • Multifamily • Direct install – government, non-profit, and small business • Allows PSE&G to leverage past investments in people, capabilities, systems and processes |
 32 Gas System Modernization Program of ~$1.6B focused on aging gas main replacement • PSE&G’s gas distribution system currently operates and maintains over 4,800 miles of cast iron and unprotected steel main, the largest such system in any single state • As filed, GSMP provides for investment of ~$1.6B focused on replacing cast iron and unprotected steel main over a five-year period, beginning mid-2016 • Program will replace approximately 160 miles of main per year • Requested accelerated clause-based recovery similar to the Energy Strong program with a 9.75% ROE • GSMP is the next phase of a long-term replacement program to reduce the average life of cast iron and unprotected steel main • Benefits: • Methane emission reduction is estimated at 24,500 metric tons of CO 2 equivalent per year* • Higher pressure system allows usage of high efficiency appliances by customers * EPA SUBPART W METHODOLOGY. |
 33 Traditional Recovery Mechanisms Distribution Base Rates FERC Formula Rates Transmission PSE&G continues to receive contemporaneous/ formula rate recovery on ~70% of its investment program Clause Recovery Mechanisms Energy Strong / Infrastructure / Solar / Energy Efficiency E = ESTIMATE. DATA AS OF AUGUST 31, 2015 20% 56% 24% 2010-2014 PSE&G Capital Spending by Recovery Method $9.8B 10% 62% 28% 2015-2019E PSE&G Capital Spending by Recovery Method $10.9B |
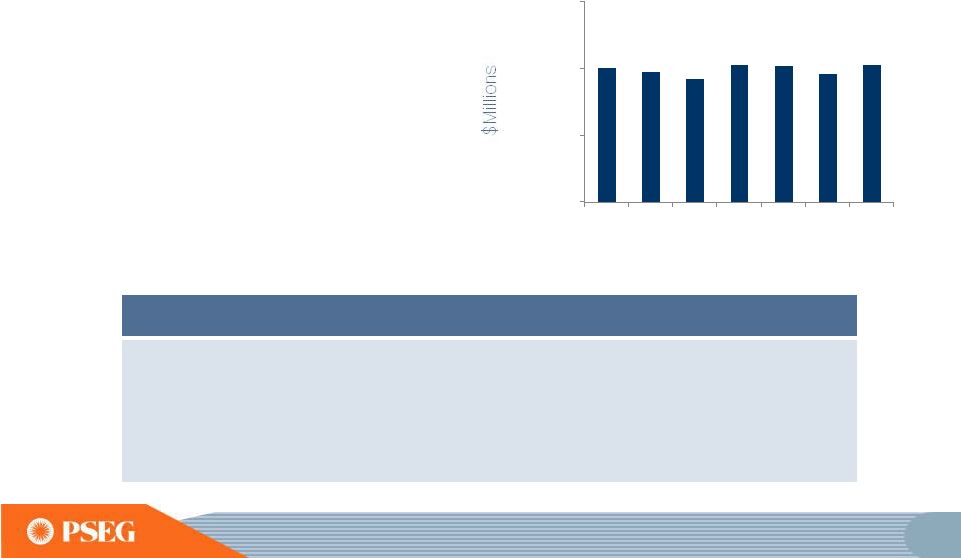 34 Cost control actions taken: • PSE&G is utilizing the Lean Six Sigma discipline to achieve costs savings and process improvements • Conducted organizational reviews resulting in streamlining of processes through restructuring • Continued focus on vendor and inventory practices ensuring maximum value • Successful management of pension 2009 to 2015 CAGR = 0.3% PSE&G O&M Expense E=ESTIMATE PSE&G has controlled costs through process improvements and will continue to drive future efficiencies $0 $500 $1,000 $1,500 2009 2010 2011 2012 2013 2014 2015E |
 35 PSE&G’s 2015 operating earnings expected to benefit from increased investment in Transmission $612 $725 2013 2014 2015 Guidance PSE&G Operating Earnings* ($ Millions) $760 -- $775E** *SEE SLIDE A FOR ITEMS EXCLUDED FROM NET INCOME TO RECONCILE TO OPERATING EARNINGS. E =ESTIMATE. **UPDATED GUIDANCE ON JULY 31, 2015. |
 PSEG LONG ISLAND |
 37 PSEG Long Island is focused on improving customer service and reliability • Provide best-in-class customer service, including building on our new Call Center Technology platform to better serve our customers • According to J.D. Power, in 2014 PSEG Long Island showed the most improvement in overall customer satisfaction of any large electric utility, anywhere in the nation • Work to maintain industry-leading service reliability • Improve every aspect of the storm response process • Leveraged our new Outage Management System to improve storm logistics and outage coordination • Contributed $0.02* to PSEG’s earnings per share in 2014, as expected * EXCLUDES THE ENERGY RESOURCES & TRADE CONTRACT, WHICH WILL BE INCLUDED IN PSEG POWER’S RESULTS. |
 PSEG POWER |
 39 PSEG Power strategy Excellence in operating our units safely, reliably, cost- competitively and in an environmentally, responsible manner DISCIPLINED INVESTMENT OPERATIONAL EXCELLENCE FINANCIAL STRENGTH ENGAGED WORKFORCE |
 40 PSEG Power creating value by responding to changing markets and regulations Safety/Environmental Focus Fleet Diversity/Efficiency Focus Financial/Economic Focus Regulatory Focus • Nuclear units have performed well for ten consecutive years • Hope Creek recorded its second highest output in its history • Fleet diversity across the dispatch curve and fuel types provide flexibility to meet changing market conditions • Bergen 1 & 2 and Linden 1 individually, and the CCGT fleet in total, set generation records in 2014 • Kearny 13 & 14 have shown increasing output in each year since start-up • Getting the most out of existing fleet • Locational advantage • O&M control programs have delivered a CAGR of 2.6% between 2009 and 2015 • Sites offer competitive advantage for expansion • Strong regulatory performance • Industry leadership in the changing business environment |
 41 Financial Strength Disciplined Investment Operational Excellence • Maximize value of existing generating plants through implementation of the Operational Excellence Model (OEM) • Workforce engagement and development • Deliver on Business Plan Commitments • Maintain competitive markets and improve constituent communication on issues important to Power • Successfully complete the Advanced Gas Path (AGP) uprates • Seek new opportunities in target markets (PJM, ISO-NE, NYISO) • Develop our renewables business (solar) • Maintain new nuclear option by successfully managing the Early Site Permit (ESP) process PSEG Power Delivering on priorities • OEM implemented and achieving measures • Resource sharing program between Nuclear & Fossil initiated • Exceeded earnings guidance in 2014 • Ongoing effort in key markets showing success • Successful court outcome against subsidized generation • Accelerated schedule for AGP to maximize opportunity • LIPA contract for fuel and generation dispatch began January 1, 2015 • Solar Source’s portfolio is 148 MW DC • Nuclear ESP is expected in 2016 • New build Keys CCGT in Maryland and Sewaren 7 in New Jersey – both targeted in-service 2018 |
 42 PSEG Power met 2014’s challenges Storm and weather challenges • All of the generation sites affected by SuperStorm Sandy were restored to service by mid-2014, with ongoing repairs • Cold weather extremes created a challenging operating environment, but also presented opportunities Market challenges • Transmission (outages and build outs) and gas markets resulted in pressure on basis • Lower gas cost impacted dark spread pressuring coal unit dispatch • Load impacted by economy Value delivered • Expedited return from storm outages, restored margin opportunities • High availability when needed • Flexibility of portfolio captured real- time basis opportunities • Captured value through coal/gas switching, unit flexibility • Management of gas assets benefited customers and fleet • Achieved fuel cost savings |
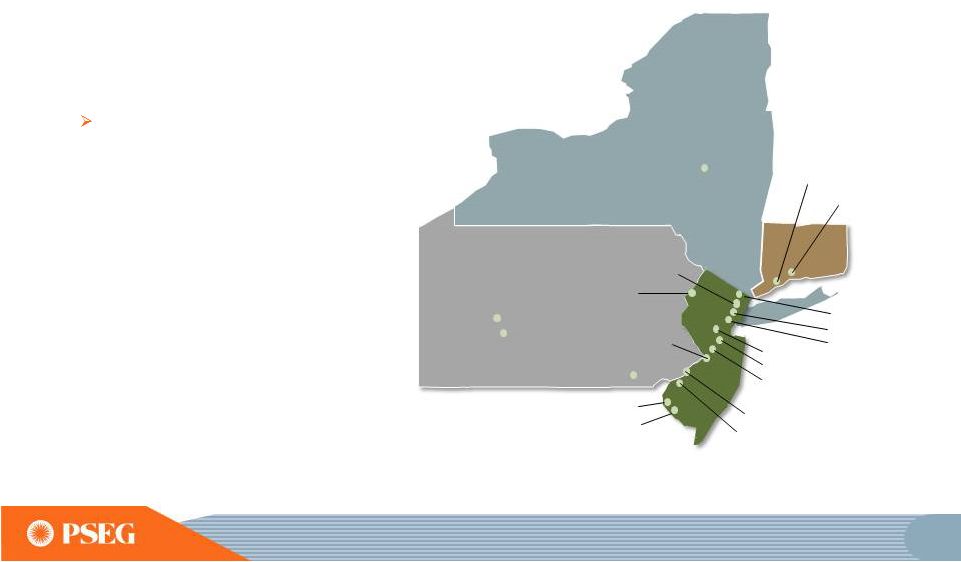 43 PSEG Power has generating assets in three competitive markets • Assets located near load centers • Low cost portfolio Fuel flexibility with gas cost advantage • Positioned to benefit from volatility in real-time markets • Readiness for capacity performance (CP) in PJM • Fleet positioned to maintain diversity and efficiency after HEDD • Sites suitable for expansion ISO New England New York ISO PJM New Haven Bridgeport Bethlehem Energy Center (Albany) Conemaugh Keystone Peach Bottom Bergen Kearny Essex Sewaren Edison Linden Mercer Burlington National Park Hudson Hope Creek Salem Yards Creek |
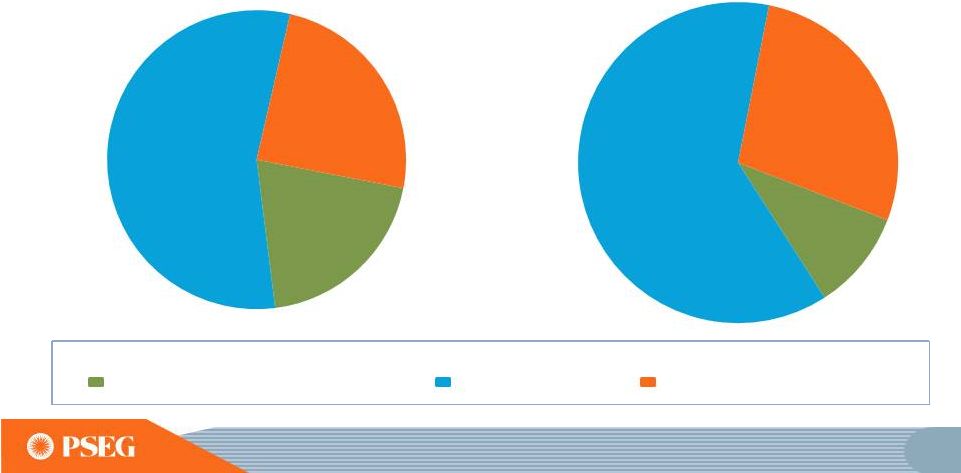
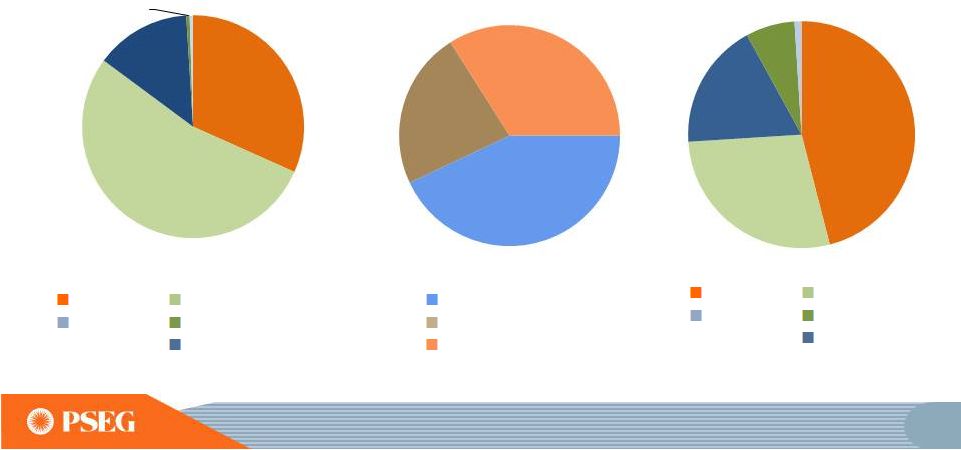 44 PSEG Power value advantaged by asset diversity, fuel flexibility and location Fuel Diversity* Total MW: 13,146 Energy Produced* Total GWh: 54,162 Energy Market Served* Total MW: 13,146 Load Following Peaking Base load Gas Pumped Storage Nuclear Oil Coal** Gas Pumped Storage Nuclear Oil Coal** *2014, EXCLUDES SOLAR AND KALAELOA. **INCLUDES NEW JERSEY UNITS THAT FUEL SWITCH TO GAS. 32% 54% 14% <1% <1% 44% 22% 34% 46% 28% 18% 7% 1% |
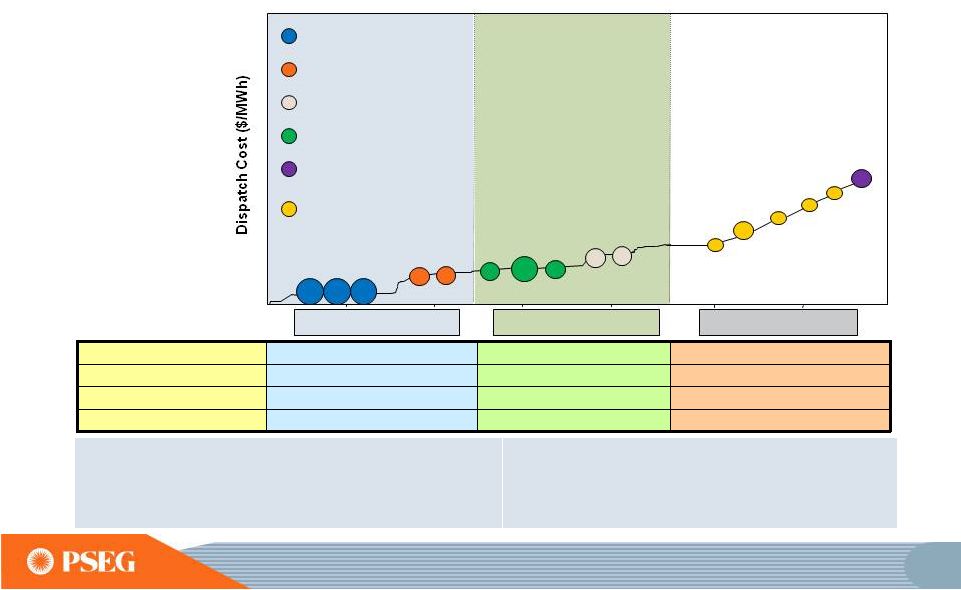 45 Power’s PJM assets along the dispatch curve reduce the risk of serving full requirement load contracts and can take advantage of volatile market conditions Energy Revenue X X X Capacity Revenue X X X Ancillary Revenue X X Dual Fuel X X • Base Load ensures cash flow certainty • Load Following provides ability to serve load shape • Readiness for Capacity Performance (CP) • Keys & Sewaren 7 to be added to dispatch in 2018E • Peaking takes advantage of real-time prices and reduces operational risk • Dual fuel capability at 87% of load following and peaking units POST - HEDD E = ESTIMATE Illustrative Salem Hope Creek Keystone Conemaugh Hudson 2 Linden 1,2 Bergen 1 Mercer 1, 2 Bergen 2 Peach Bottom Essex 9 Sewaren 1-4 Burlington 12 Yards Creek Base Load Units Peaking Units Load Following Units Kearny 12-13-14 Nuclear Coal Coal/Gas Combined Cycle Steam Combustion Turbine / Pumped Storage Linden 5-8 |
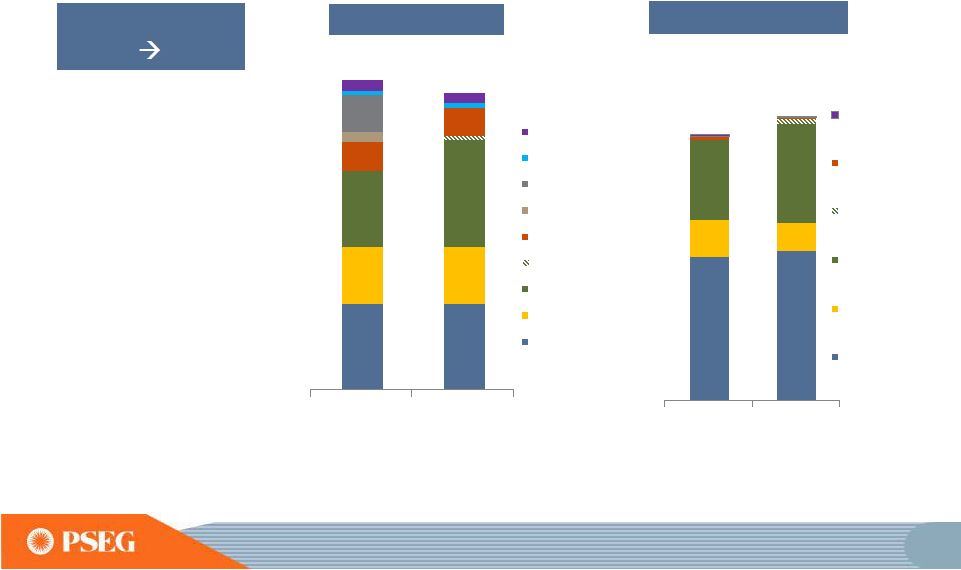 46 PSEG Power will maintain diversity and efficiency after a realignment of the fleet following HEDD retirements 2014 2018 Oil Pumped Storage HEDD Other gas Peakers AGP/PB EPU CCGT Coal Nuclear • Maintain fuel diversity • Maintain load-serving capability • Maintain low cost structure • Environmental improvement • Peach Bottom (PB) uprate • Advanced Gas Path (AGP) • Combined cycle units Keys and Sewaren operational in 2018 Objective 2015 2018 13,146 MW 12,600 MW Fuel Diversity 2014 2018 Oil, Other gas, HEDD, Pumped storage Peakers AGP/PB EPU CCGT Coal Nuclear E Energy Produced 57 - 59 TWh 54 TWh E E=ESTIMATE. |
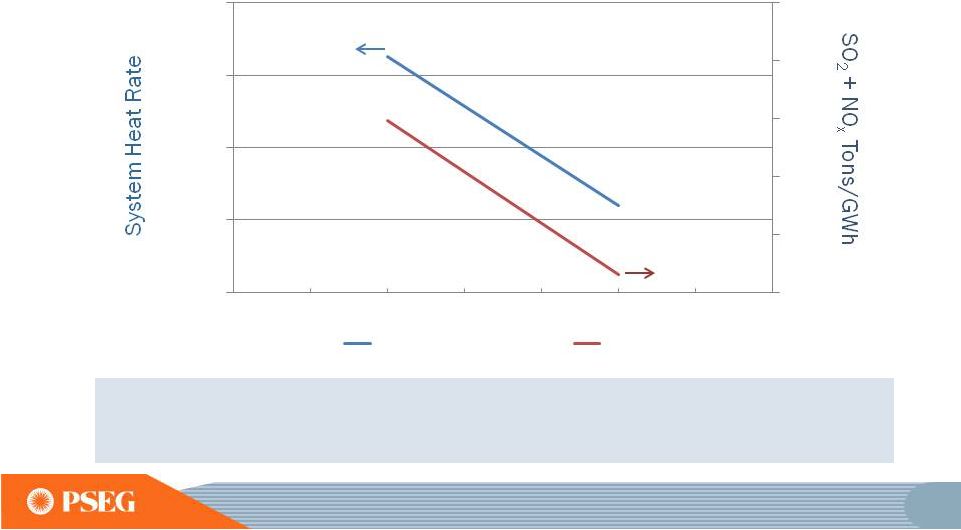 47 PSEG Power’s fleet will experience heat rate and emissions improvements • AGP (Advanced Gas Path) investments • Other Efficiency improvements • HEDD retirements • Keys/Sewaren Combined Cycle Development (2018) E=ESTIMATE. 0.5 0.6 0.7 0.8 0.9 1.0 8,500 9,000 9,500 10,000 10,500 Heat Rate NOx + SO2 2014 2018E |
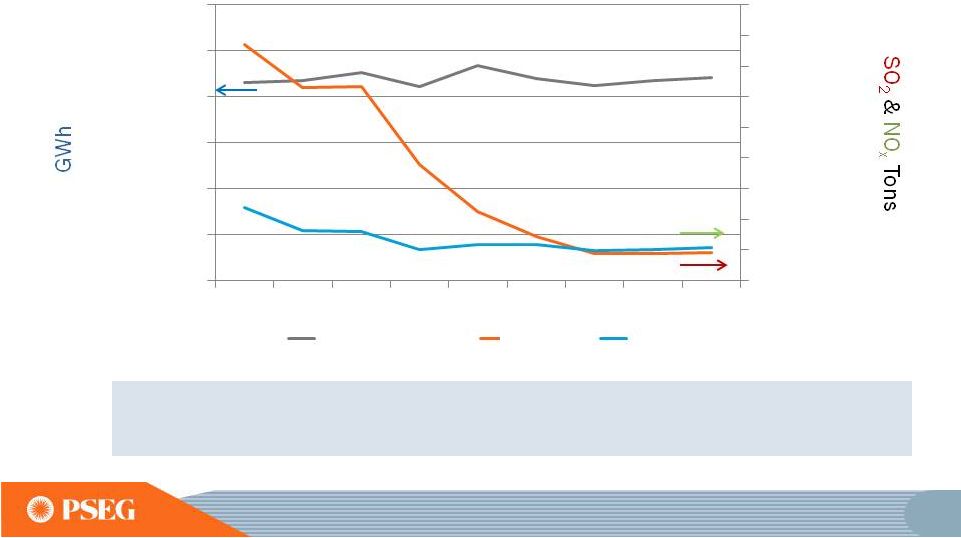 48 PSEG Power’s fleet is among the lowest emitting in the industry • Mercury reduced 80% across the timeframe above • More efficient testing and improved operational flexibility through utilization of Continuous Emission Monitoring System testing 0 10,000 20,000 30,000 40,000 50,000 60,000 70,000 80,000 90,000 10,000 20,000 30,000 40,000 50,000 60,000 70,000 2006 2007 2008 2009 2010 2011 2012 2013 2014 Generation SO2 NOx |
 49 PSEG Power Nuclear is a critical element of our success Hope Creek • Operated by PSEG Nuclear • PSEG Ownership: 100% • Technology: Boiling Water Reactor • Total Capacity: 1,178 MW • Owned Capacity: 1,178 MW • License Expiration: 2046 • Next Refueling Fall 2016 Salem Units 1 and 2 • Operated by PSEG Nuclear • PSEG Ownership: 57% • Technology: Pressurized Water Reactor • Total Capacity: 2,307 MW • Owned Capacity: 1,324 MW • License Expiration: 2036 and 2040 • Next Refueling Unit 1 – Spring 2016 Unit 2 -- Fall 2015 Peach Bottom Units 2 and 3 • Operated by Exelon • PSEG Ownership: 50% • Technology: Boiling Water Reactor • Total Capacity: 2,242 MW • Owned Capacity: 1,121 MW • License Expiration: 2033 and 2034 • Next Refueling Unit 2 - Spring 2016 Unit 3 - Fall 2015 • Uprate: 130 MW (PS Share) Unit 2 - March 2015 Unit 3 - 2016 |
 50 PSEG Power Nuclear has competitive advantages • Continued strong nuclear operations • Nuclear excellence program • Top quartile of cost performance/MWh Brought security services in-house • Significant earnings contributor • Recruitment of the best new and experienced talent, and attractive training program • Fukushima action plan in response to NRC staff review FLEX* plan submitted with implementation underway • Peach Bottom extended power uprate, 130 MW Power’s share, scheduled in service 2015/2016 • Active and influential participation at INPO, NEI, EPRI, USA Alliance *STRATEGY KNOWN AS THE “DIVERSE AND FLEXIBLE MITIGATION CAPABILITY” OR FLEX, ADDRESSES RECOMMENDATIONS OF THE NUCLEAR REGULATORY COMMISSION’S FUKUSHIMA TASK FORCE. |
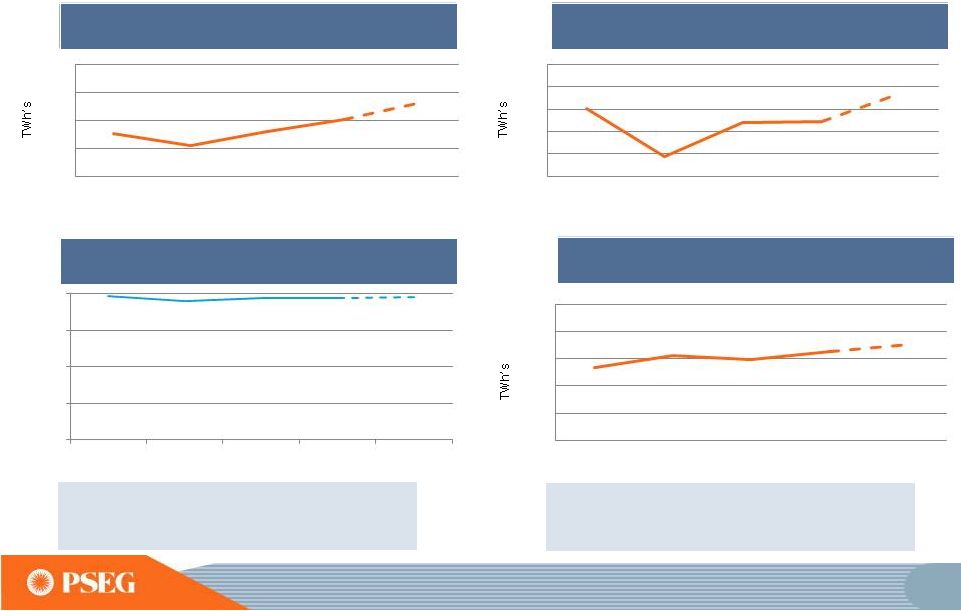 51 PSEG Power’s Fossil Fleet has shown improvement in performance *LM6000 AND 7EA UNITS E = ESTIMATE. Fossil Generation Coal Generation Peaking Start Success* Combined Cycle Generation • Fossil Generation rebounded with market • Peaking Units maintain high start success • Record output from Kearny 13 & 14 peakers • Combined Cycle Generation set record • Bergen AGP uprate project scheduled for 2015 80% 85% 90% 95% 100% 2011 2012 2013 2014 2015 E 5 6 7 8 9 10 2011 2012 2013 2014 2015 E 10 12 14 16 18 20 2011 2012 2013 2014 2015 E 20 23 25 28 30 2011 2012 2013 2014 2015 E |
 52 PSEG Power initiatives result in continuing improvement in combined cycle heat rate AGP projected efficiency improvement 2015-2018 2018E* E= ESTIMATE. *The weighted average Combined Cycle Heat Rate in 2018, with the addition of Sewaren 7 and Keys Energy Center, will be approximately 7,250 7,200 7,300 7,400 7,500 7,600 7,700 7,800 2008 2009 2010 2011 2012 2013 2014 |
 53 PSEG Power CCGT/Fossil initiatives Actions Taken to Create Value Capacity • New Keys CCGT 755MW online in 2018 adds geographic diversity to fleet • Sewaren 7 CCGT 540 MW online in 2018 improves fleet efficiency • Advanced Gas Path (AGP) investments 2014 through 2018 to provide additional efficient capacity, heat rate improvements • New lower cost gas line at BEC with Dominion Performance • EPRI efficiency initiatives • GE initiatives for large data analytic • Consolidation of unit testing • Auto tuning software Maintenance • Ongoing outage efficiency improvement • Improvements to reliability • Central fleet monitoring and diagnostic center |
 PSEG Power developing 1,300 MW of new, efficient CCGT capacity in MD and NJ • Construction of 755 MW Keys Energy Center to begin this Fall to build a new, natural gas fired power plant in Maryland (SWMAAC*) at an estimated cost of $825 to $875 million • Power cleared a new 540 MW CCGT unit, Sewaren 7 located in New Jersey (EMAAC*), in the recent 2018/2019 RPM auction; the unit is expected to cost ~$600 million and is targeted to be in service in 2018; older Sewaren units will be retired upon completion of the new unit • PSEG Fossil will oversee the construction and operation of both PSEG Keys Energy Center and Sewaren 7 PJM *SWMAAC = SOUTHWEST/EMAAC = EASTERN MID-ATLANTIC AREA COUNCIL LOCATIONAL DELIVERABILITY AREA WITHIN PJM. SEWAREN 7 SITE KEYS ENERGY CENTER SITE 54 |
 55 PSEG Power’s Growth Investments Site Project Estimate ($ millions) Benefits Status Maryland Keys 755 MW CCGT $825 - $875 Geographic diversity within PJM; highly efficient gas fired unit in SWMAAC 2018E Sewaren Unit 7 540 MW CCGT $600 Improved efficiency and reliability; increase in capacity 2018E Peach Bottom Peach Bottom EPU (2014 – 2015) $417 Increased capacity: 130 MW PB2 May 2015, PB3 in 2016 Bergen / BEC Future AGP Upgrades: Bergen (2015) BEC (2017-2018) $98 Increased capacity and improved heat rate: 88 MW capacity increase ~1.2% heat rate improvement Underway Various Interim ISA’s* No cost Increased capacity: 69 MW Completed Eastern PA to Mercer, NJ PennEast Pipeline $119 Estimated Earnings in 2019: $13 million Underway * INTERCONNECTION SERVICE AGREEMENTS. E = ESTIMATE. **NET OF PLANNED RETIREMENTS. Total Increased Capacity – 1,132 MW ** |
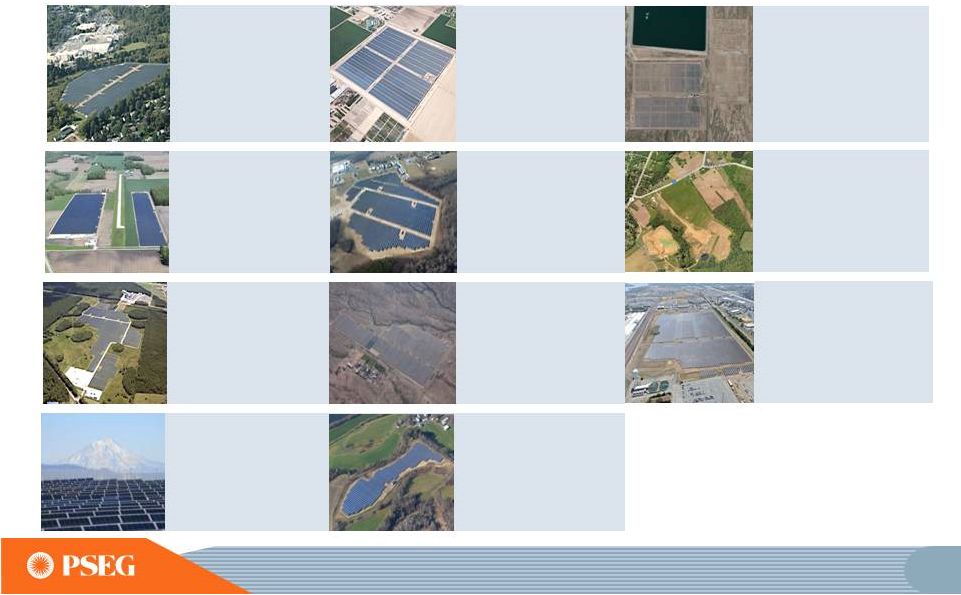 56 PSEG Solar Source owns ~148 MW of solar facilities with long term contracted revenues* *PROJECT SIZE IN MEGAWATTS SHOWN IN DC (DIRECT CURRENT) Shasta A & Shasta B California (2 x 2 MW) COD March 2014 Polycrystalline - single axis Investment $13 million 20 year PPAs with PG&E Hackettstown (Mars) New Jersey (2 MW) COD September 2009 Thin film panels – fixed tilt Investment $13 million 15 year PPA with Mars, Inc. Wyandot Ohio (12 MW) COD May 2010 Thin film panels – fixed tilt Investment $44 million 20 year PPA with AEP JEA Florida (15 MW) COD September 2010 Thin film panels – fixed tilt Investment $59 million 30 year PPA with JEA Queen Creek Arizona (25 MW) COD October 2012 Polycrystalline - single axis Investment $75 million 20 year PPA with SRP Milford Delaware (15 MW) COD December 2012 Polycrystalline - fixed tilt Investment $47 million 20 year PPA with DEMEC Badger I Arizona (19 MW) COD November 2013 Polycrystalline – single axis Investment $48 million 30 year PPA with APS Newman Texas (13 MW) COD December 2014 Polycrystalline - single axis Investment $22 million 30 year PPA with El Paso Elec. Whitcomb Vermont (4 MW) COD October 2014 Polycrystalline – fixed tilt Investment $10 million 25 year PPA with VT Electric Power Producers, Inc. Rockfish Maryland (13 MW) COD July 2015 Polycrystalline - single axis Investment $22 million 20 year PPA with SMECO Columbia California (25.5 MW) COD Sept 2015 Est. Polycrystalline – fixed tilt Investment $55 million 20 year PPA with PG&E |
 57 Gas Asset Optimization • Large wholesale provider to PSE&G and others • Storage capacity of approximately 75 Bcf (in the Gulf and market regions) • Firm transportation of 1.3 Bcf/day on seven pipelines • Off-system sales margins shared with residential customers • Commercial & Industrial customers (C&I) • Weather and price volatility Ancillary Services LIPA fuel and energy dispatch management PSEG Power has other attractive sources of revenues to round out a robust portfolio, in addition to energy and capacity |
 58 PSEG Power is an established leader within the industry INPO • National Nuclear Accrediting Board NEI • Communications Advisory Committee • Board of Directors • Board of Directors Executive Committee • Emergency Preparedness Working Group • Security Working Group • Fukushima Response Steering Committee • Joint Information System Task Force • Nuclear Strategic Issues Advisory Committee Steering Group EPRI • Chairman Nuclear Power Council • Executive Committee Nuclear Power Council BWR Owners Group • Vice Chair of the Executive Oversight Committee Utilities Service Alliance (USA) Fleet • Chair EPSA • Executive committee member UWAG • Chair of the Cooling Systems Committee PJM/NY/ISO-NE • Member of various Committees at PJM • Chairman & Vice-Chair of the Supplier Sector of the New England Power Pool (NEPOOL) • Chair of the PJM Power Providers Board • Board member & member of the board’s Executive Committee of Independent Power Producers of New York (IPPNY) EEI • Member of water resources subcommittee National Coal Council • Member of Executive Committee |
 59 Developing People to drive operational excellence and to optimize the workforce • Succession planning and development planning • Recent CNO retirement & succession was part of the plan • Training & development of employees • Rotational assignments for key leaders in PSEG Power • Outreach programs • Employee engagement • Shared resources between Fossil and Nuclear (outage support) • Diversity & inclusion |
 60 Cost control actions taken: • Fossil plant assessment • CCGT material condition assessment • Vendor contract renegotiations • Nuclear security services brought in- house to control costs • Nuclear maintenance productivity study • Nuclear outage efficiency initiative • Materials management 2009 to 2015 CAGR = 2.6% Power O&M Expense* *EXCLUDES IMPACTS FROM STORM RECOVERY COSTS. E=ESTIMATE PSEG Power’s focus on costs has resulted in moderate increase in O&M for seven years $0 $500 $1,000 $1,500 2009 2010 2011 2012 2013 2014 2015E |
 61 Power’s 2015 operating earnings maintain solid performance Power Operating Earnings* ($ Millions) 2015 Observations • Increase in average hedge price for energy helps mitigate reset in capacity price and volume * SEE SLIDE A FOR ITEMS EXCLUDED FROM NET INCOME TO RECONCILE TO OPERATING EARNINGS. E = ESTIMATE. $710 $642 $620 – $680E 2013 2014 2015 Guidance 61 |
 PSEG POWER ER&T |
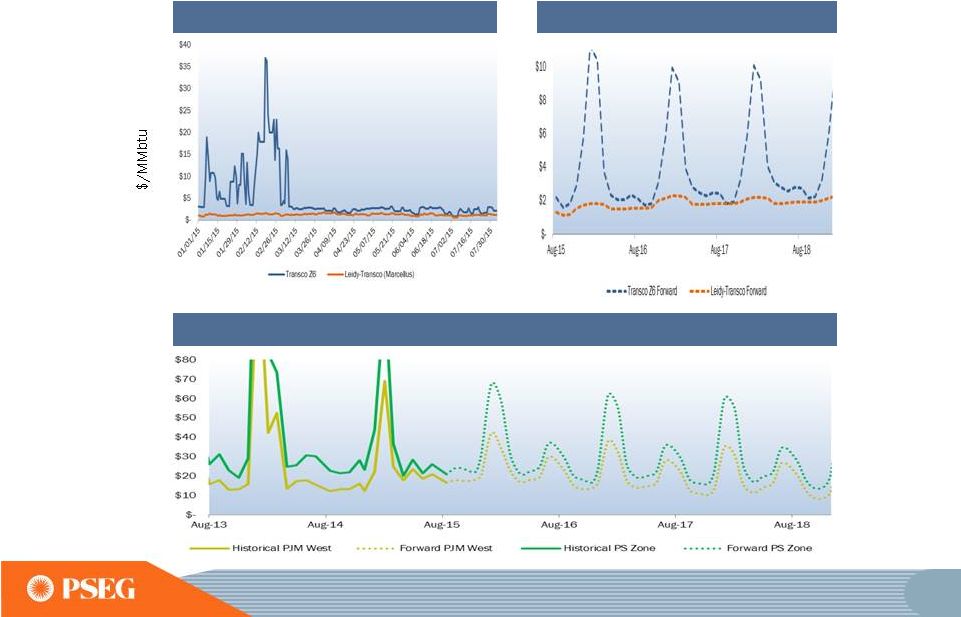 Market Review: Winter Z6 gas prices retain seasonal volatility; spark spreads have continued to be robust in PJM FORWARDS AS OF AUGUST 3, 2015 2015 YTD Z6 PJM West vs. PS Zone Spark Spreads (2013-2018) 2015-2018 Z6 63 |
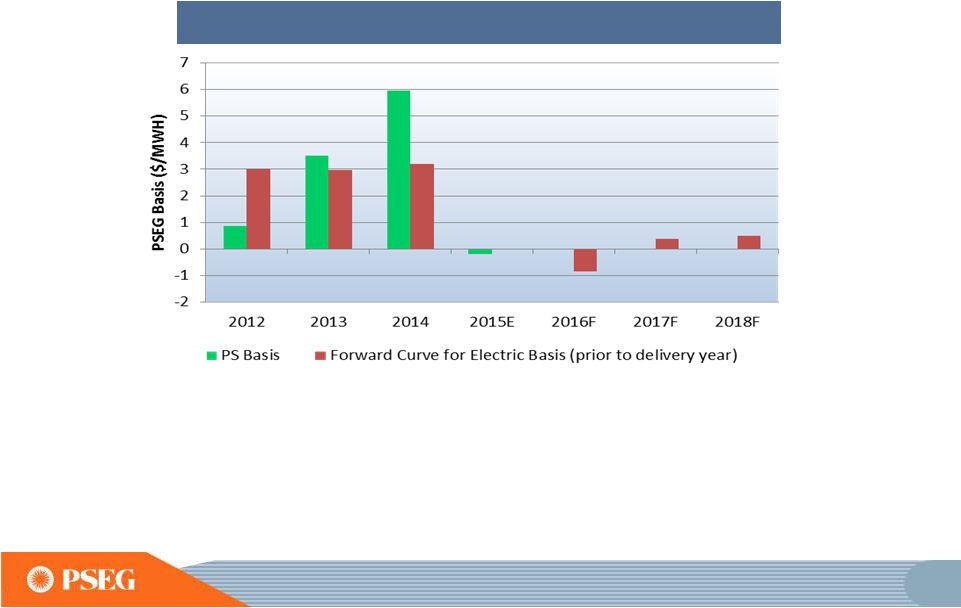 64 ANNUAL FORWARD BASIS TO PJM-WEST AS OF AUGUST 3, 2015. E = YTD ACTUAL PLUS FORWARD; F = FORWARD Power Basis in Eastern PJM: Expected to be volatile and negative on an annual basis for 2015 and 2016 PS Zone RTC Basis to PJM West Electric Basis is negative however it is viewed to be stabilizing and turning back to positive within 2 years due to: • Export of ~18 bcf/day of gas which will significantly strengthen regional gas prices • Easing of transmission constraints in Virginia/Maryland • Construction of significant new gas-fired generation in VA/MD |
 65 Market Review: PSEG’s extensive gas asset portfolio gives unparalleled access to Marcellus Shale gas • PSEG Power maintains a robust portfolio of pipeline and storage assets in the Mid-Atlantic • PSEG Power’s gas for generation was ~100 BCF in 2014, of which >60% was supplied by Shale gas • PSEG Power procured over 400 BCF in 2014 with ~75% going to PSE&G’s utility gas customers • When gas is surplus to customer needs, PSEG Power sells surplus to others; margins from such sales benefit PSE&G gas customers and PSEG Power Eastern PA Shale Western PA Shale Gulf Coast Delivered Gas 40% 20% 6% 34% Power’s Gas for Generation in 2014 |
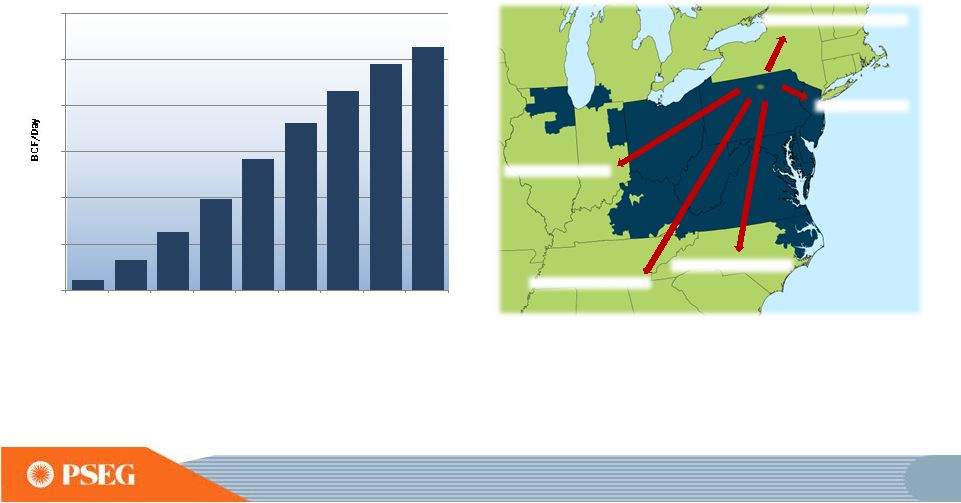 66 Market Review: New pipelines will move significant quantities of Marcellus gas out of the region by 2018 New pipeline investment is expected to increase takeaway capacity from the low cost Marcellus/Utica shale and reduce regional surpluses and increase gas prices by 2018 New England 3.4 bcf/d Southeast 6.4 bcf/d Midwest 5.9 bcf/d Gulf Coast 3.1 bcf/d NJ/NY 1.4 bcf/d Pipeline capacity grows significantly by 2018 Historical and Expected Marcellus Production 0 5 10 15 20 25 30 2010 2011 2012 2013 2014 2015 2016 2017 2018 |
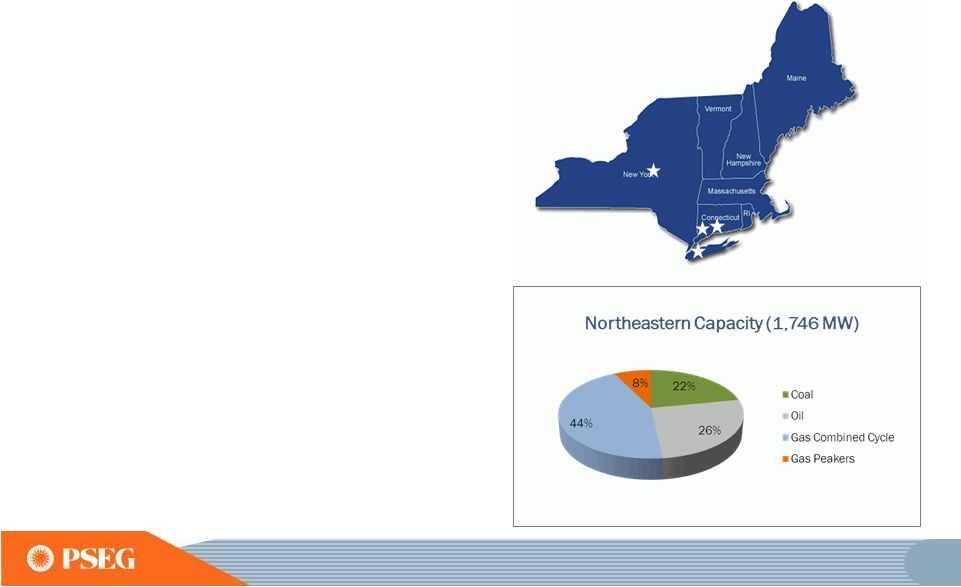 67 Northeast Portfolio: New York and New England New England (972 MW) • Small but dynamic market • Significant improvement in market construct • High volatility due to extreme (winter) weather conditions • Significant siting and permitting challenges • Gas pipeline infrastructure poses supply challenges/opportunity New York (774 MW) • Single state ISO • Investment in new lateral to connect to the Dominion pipeline at Bethlehem Energy Center (BEC) allows for access to fuel supply from Marcellus • Long Island Power Authority Fuel Management Contract |
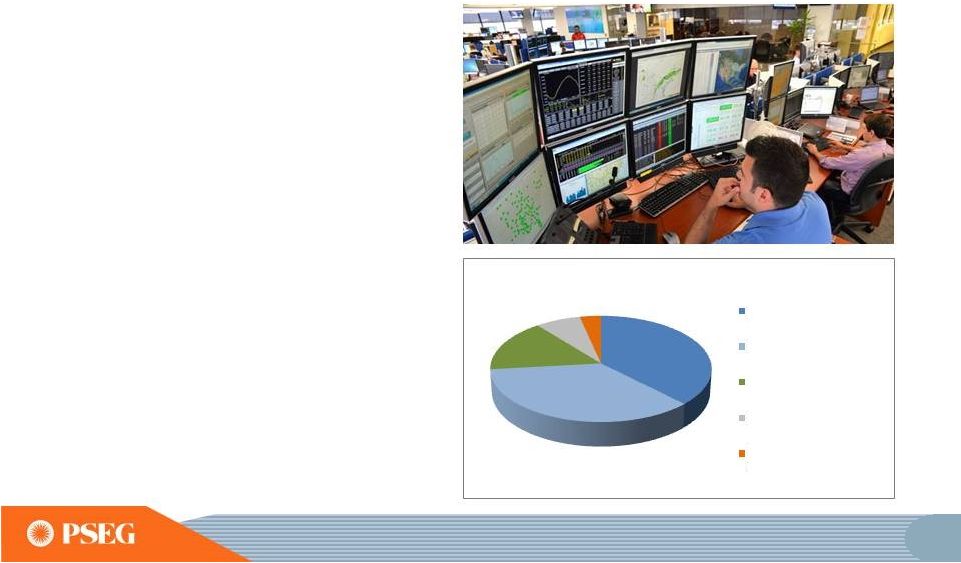 PSEG Power acting as an agent for LIPA began January 2015 • Performing ISO bidding for LIPA’s 6,000 MWs of generation/tolls • Procuring natural gas and oil for the majority of these assets • Scheduling two DC transmission cables (ISO-NE and PJM) into Long Island • Entering into financial hedges to reduce LIPA customer’s price volatility This relationship has provided PSEG Power: • Additional experience in Eastern NY and Connecticut markets • Bigger natural gas footprint • Fee-based services contract Northeast Portfolio: Expanding our footprint with PSEG Long Island Steam Combustion Turbine Cables Combined Cycle Resource Recovery, Pumped Storage, Solar 3% 7% 16% 36% 38% LIPA Capacity (6,163 MW) 68 |
 69 … and transition auctions offer upside in revenue from CP product Capacity Market Pricing: ~98% of Power’s PJM fleet that cleared the 2018/2019 RPM auction, met the new CP standards RPM – Auction Results ($/MW-day) 2015 / 2016* 2016 / 2017*+ 2017 / 2018 2018 / 2019 Power’s Average Prices* $168 $172 $165 $215 Rest of Pool Prices $136 $59 $120 $165/$150 (CP/Base) Power’s Cleared Capacity (MW) 8,750 8,700 8,700 8,650 *PSEG POWER’S AVERAGE PRICES AND CLEARED CAPACITY (MW) REFLECT BASE AND INCREMENTAL RPM AUCTION RESULTS AS OF SEPTEMBER 1, 2015. DELIVERY YEAR RUNS FROM JUNE 1 TO MAY 31 OF THE NEXT CALENDAR YEAR. + INCLUDES CP TRANSITION AUCTION RESULTS AS OF SEPTEMBER 1, 2015 |
 Auction Results: BGS Auction provides ability to forward hedge our generation and protect our power basis BGS sales account for approximately 20% of our forward portfolio of hedges $/MWH; BGS PRICES REFLECT PSE&G ZONE; RESULTS FOR 2013-2015 ARE THE NEW BLENDED PRICES BEGINNING JUNE 1, 2015. 2011 2012 2013 2014 2015 $94.30 $83.88 ~ $46 $92.18 ~ $48 ~ $53 ~ $59 $97.39 $45 - $47 $39 - $40 $37 - $38 $38 - $39 ~ $62 $37 - $38 $99.54 Capacity Load shape Transmission Congestion Ancillary services Risk premium Green 3 Year Average Round the Clock PJM West Forward Energy Price 70 |
 71 HEDGE PERCENTAGES AND PRICES AS OF JUNE 30, 2015. REVENUES OF FULL REQUIREMENT LOAD DEALS BASED ON CONTRACT PRICE, INCLUDING RENEWABLE ENERGY CREDITS, ANCILLARY, AND TRANSMISSION COMPONENTS BUT EXCLUDING CAPACITY. HEDGES INCLUDE POSITIONS WITH MTM ACCOUNTING TREATMENT AND OPTIONS. EXCLUDES SOLAR AND KALAELOA. Jul-Dec 2015 2016 2017 Volume TWh 18 37 37 Base Load % Hedged 100% 85-90% 50-55% (Nuclear and Base Load Coal) Price $/MWh $53 $51 $50 Volume TWh 11 19 18 Intermediate Coal, Combined % Hedged 30-35% 0% 0% Cycle, Peaking Price $/MWh $53 -- -- Volume TWh 25-30 55-57 55-57 Total % Hedged 70-75% 55-60% 30-35% Price $/MWh $53 $51 $50 Hedging strategy: designed to protect gross margin while leveraging the portfolio |
 72 PSEG Power’s Value Proposition • Re-positioning fleet to improve efficiency and reliability in attractive markets • Advantaged by low cost structure, fuel diversity and dispatch flexibility • Value add from strong gas supply capability • Significant drive by regulatory bodies to improve market constructs • Low capital requirements to meet enhanced performance standards • Organic growth opportunities to increase nuclear and combined cycle generation • Hedging strategy is responsive to changing market dynamics, providing attractive returns and free cash flow |
 PSEG FINANCIAL REVIEW & OUTLOOK |
 74 Strong financial position to support our business initiatives 2014 Financial Position Strong 2014 earnings growth Exceeded earnings guidance Executed major PSE&G capital program Strong balance sheet with no long term Parent debt Solid credit metrics 2015 and Beyond Third year of anticipated positive earnings growth in 2015 Controlled O&M growth Balance Sheet and Cash Flow support investment program without equity issuance Substantial additional investment capacity Growth in PSE&G investments with contemporaneous/formula rate returns and new Power investment Consistent and strong cash flow from both Power and PSE&G Potential for accelerated and sustainable dividend growth |
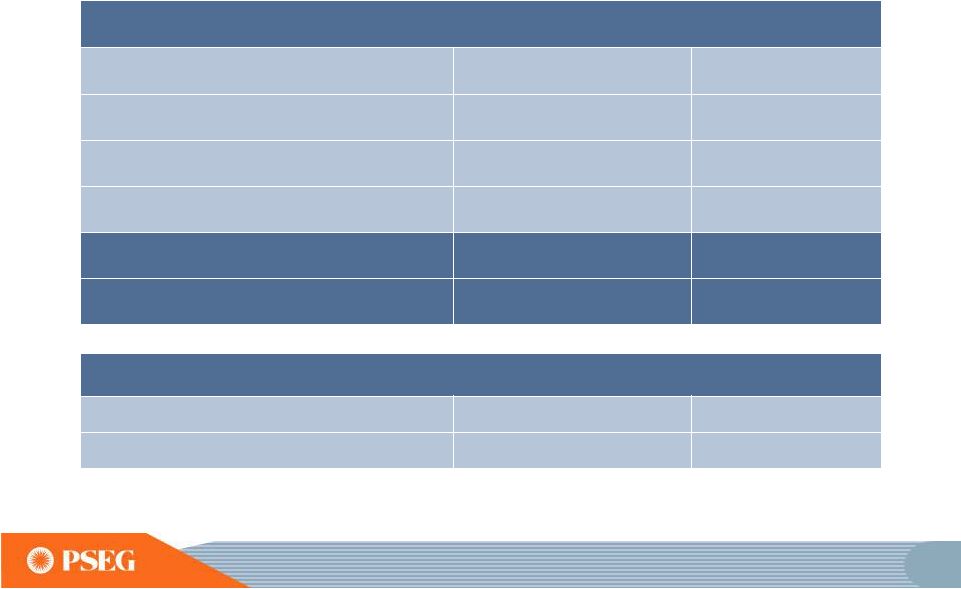 75 PSEG 2015 Updated Guidance for Operating Income – by Subsidiary, and PSEG Power Adjusted EBITDA Anticipates Another Year of Growth in Operating Earnings $ millions (except EPS) 2015E 2014 PSE&G $760 - $775 $725 PSEG Power $620 - $680 $642 PSEG Enterprise/Other $40 - $45 $33 Operating Earnings* $1,420 - $1,500 $1,400 Earnings per Share $2.80 - $2.95E $2.76 PSEG Power Adjusted EBITDA** $ millions (except EPS) 2015E 2014 PSEG Power $1,545 - $1,645 $1,584 * SEE SLIDE A FOR ITEMS EXCLUDED FROM NET INCOME TO RECONCILE TO OPERATING EARNINGS; INCLUDES THE FINANCIAL IMPACT FROM MARK-TO-MARKET POSITIONS WITH FORWARD DELIVERY MONTHS. ** SEE SLIDE B FOR A RECONCILIATION OF ADJUSTED EBITDA TO OPERATING EARNINGS AND NET INCOME. E = ESTIMATE. |
 76 ~$1.6B ~$2.2B ~$2.2B ~$1.9B ~$6.8B ~$14.7B PSEG 2015 – 2019E Capital Expenditures (1) PSEG growth spend represents ~75% of total investment Power & Other Maintenance PSE&G Distribution Maintenance Power Growth PSE&G Transmission Growth PSE&G Distribution Growth PSEG Planned Spend Maintenance ~$3.8B (1) INCLUDES AFUDC AND IDC, KEYS ENERGY CENTER, SEWAREN, PENNEAST PIPELINE EQUITY INVESTMENT OF~$0.1B IS INCLUDED IN POWER GROWTH. E = ESTIMATE. Planned Growth Investment ~$10.9B |
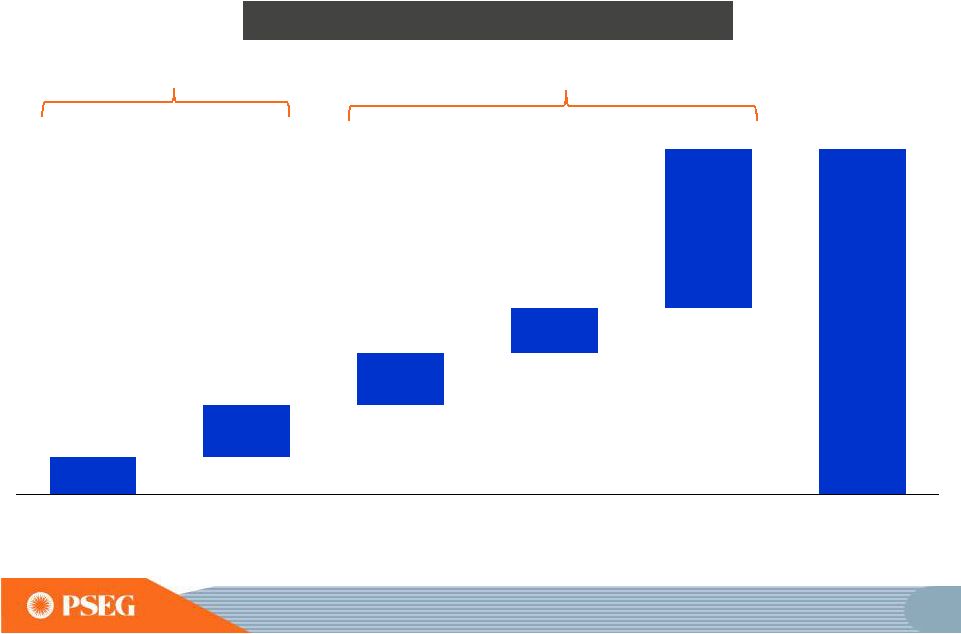
 77 2014 – 2017E Rate Base CAGR Growth of ~12% Distribution Transmission PSE&G’s Capital Program drives double-digit growth in rate base through 2019 ~$11.4B ~$16.0B ~$6.9B ~$4.5B ~$2.2B ~$9.8B ~$3.1B ~$8.5B Rate Base Growth ~$0.1B 2014 Rate Base Planned 2017E Rate Base Planned 2019E Rate Base ~$1.5B ~$8.4B ~$7.6B ~$18.3B 2014 – 2019E Rate Base CAGR Growth of ~10% Rate Base Growth E = ESTIMATE |
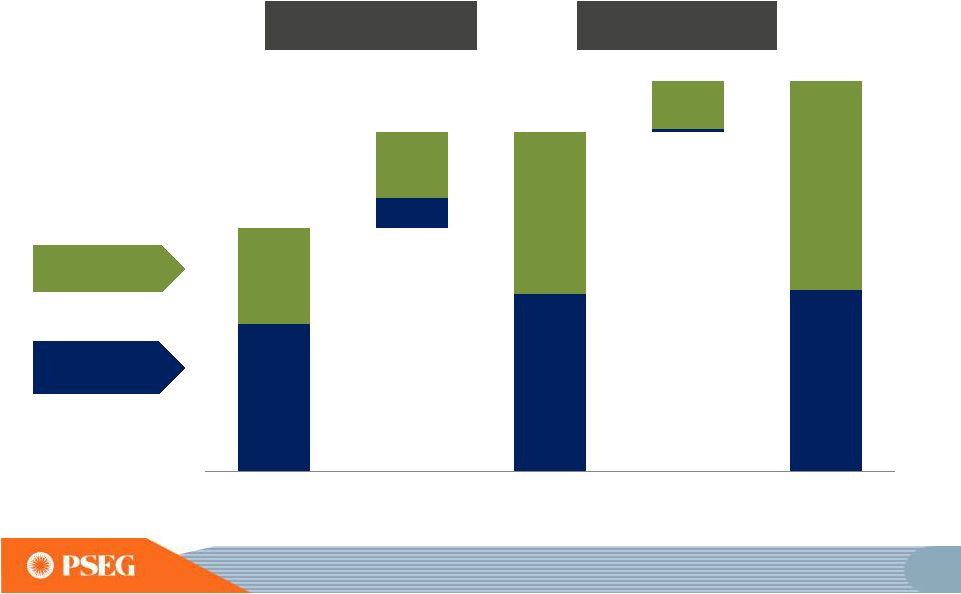
 78 0% 5% 10% 15% Continuing our track record of 5 year double digit rate base growth leading to high single-digit growth in earnings through 2017 2010 – 2015E PSE&G 5 Year Rate Base CAGR 2011 – 2016E 2012 – 2017E 2013 – 2018E 2014 – 2019E ~11% ~13% ~12% ~10% ~10% E = ESTIMATE |
 79 PSEG 2015 - 2019E Sources and Uses Utilizing financial strength to issue debt at the parent level in support of regulated growth Sources Uses PSE&G Cash from Ops (1) PSE&G Cash Investment (1) PSE&G CASH FROM OPERATIONS ADJUSTS FOR SECURITIZATION PRINCIPAL REPAYMENTS OF ~$260M FROM 2015-2019 (2) OTHER CASH FLOW INCLUDES PSEG LI, HOLDINGS NET CASH FLOW, INVESTED CASH, AND PARENT SHORT-TERM DEBT (3) POWER CASH INVESTMENT INCLUDES NUCLEAR FUEL AND EMISSION PURCHASES E = ESTIMATES. PSE&G Net Debt Shareholder Dividend Power Cash from Ops Power Net Debt Other Cash Flow (2) Parent Long-Term Debt Power Cash Investment (3) |
 80 0% 10% 20% 30% 40% 50% 60% 70% Power’s key credit metric remains strong providing opportunity for incremental investment* 2015-2017E Average Increased contribution to earnings from the more stable regulated business Power’s annual Cash From Operations and Funds From Operations average approximately $1.3+ B over the 2015 to 2017 period supported by: Capacity Revenues Hedged Generation O&M Control Financial strength can be used to pursue future growth in both businesses beyond current plans 2013 2014 PSEG Power Funds from Operations / Debt *INCLUDES KEYS ENERGY CENTER AND SEWAREN. E= ESTIMATE |
 81 Substantial Investment Capacity to pursue additional growth without the need for equity* $0.0 $3.0 Power Parent Total ($ Billions) Power PSEG Estimate ~ 50% ~27% Minimum Threshold 30% ~20% Our incremental investment capacity can support growth at both PSE&G and Power *INCLUDES KEYS ENERGY CENTER, SEWAREN. E= ESTIMATE Average Funds from Operations /Debt 2015 - 2017 Total Incremental Investment Capacity through 2017 |
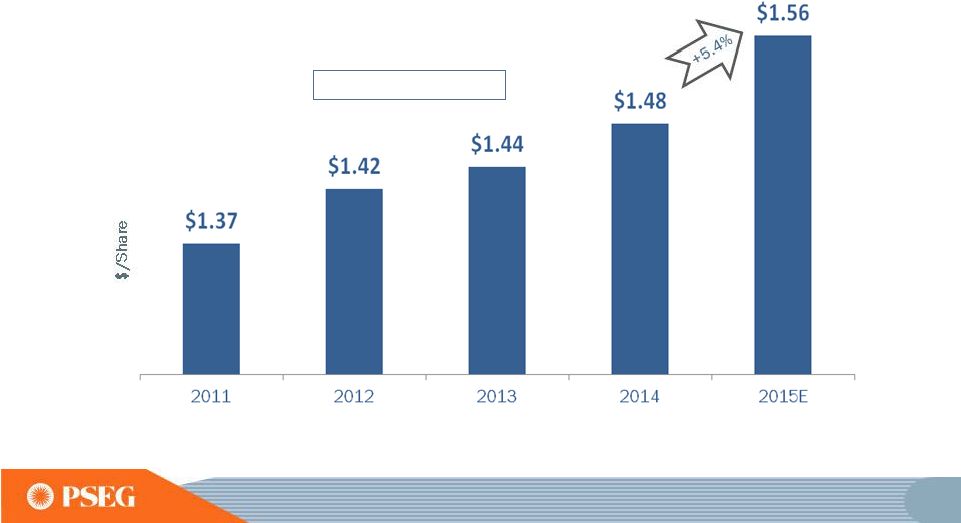
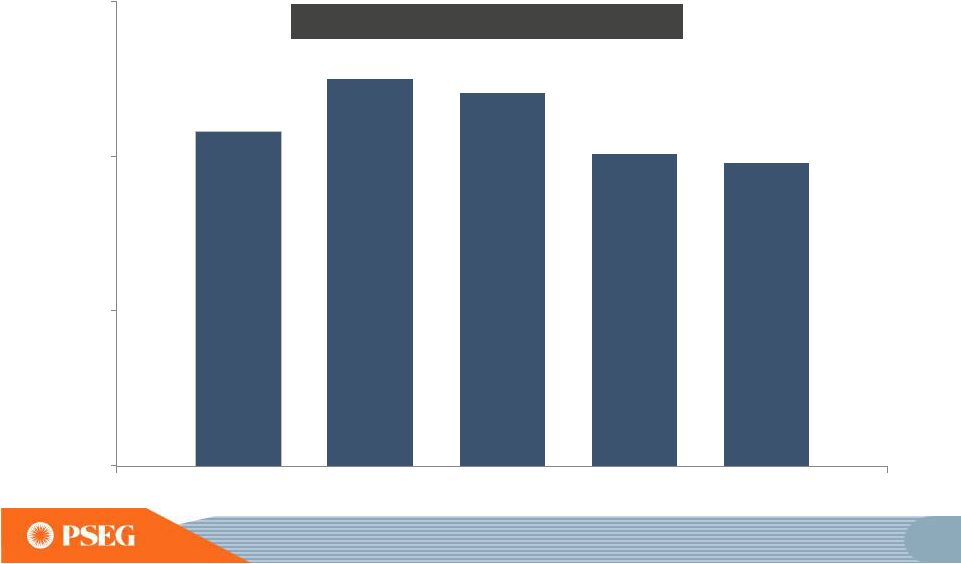
 82 PSE&G EPS Annual Dividend Per Share 2011 – 2014 CAGR: 2.6% Potential for consistent and sustainable dividend growth given significant contribution from regulated earnings and Power’s strong free cash flow 5.4% increase Payout Ratio 50% 58% 56% 54% 54% (1) $1.53 $1.50 $0.60 $0.80 $1.00 $1.20 $1.40 $1.60 2015E 2013 2014 2012 2011 $1.37 $1.44 $1.48 $1.56 82 (1) THE 2015 PAYOUT RATIO IS BASED ON THE MIDPOINT OF PSEG’S 2015 UPDATED OPERATING EARNINGS GUIDANCE OF $2.80 - $2.95E PER SHARE. SEE SLIDE A FOR ITEMS EXCLUDED FROM INCOME FROM CONTINUING OPERATIONS/NET INCOME TO RECONCILE TO OPERATING EARNINGS.E= ESTIMATE. $1.42 |
 83 PSEG’s longer-term outlook is influenced by Power’s hedge position and increased investment at PSE&G 2015E ** 2016E Each $0.75/mcf Change in Natural Gas Each $2/MWh Change in Spark Spread Each $5/MWh Change in Dark Spread Each 1% Change in Nuclear Capacity Factor Segment EPS Drivers Each $100 Million of Incremental Investment Each 1% Change in Sales Electric Gas Each 1% Change in O&M Each 10 basis point Change in Distribution ROE Each 10 basis point Change in Transmission ROE $0.01 $0.01 $0.01 $0.01 $0.01 $0.01 $0.03-$0.06 $0.04 $0.04 $0.01 $0.01-$0.02 $0.02 $0.01 $0.01 $0.01 $0.01 $0.01 $0.01 $0.01 $0.01 Sensitivities derived from typical annual market variability* * Estimated annual variability approximating one standard deviation based on 2011 – 2013 historical data and forward curve estimates applied to PSEG Power open positions. ** July-December 2015. E = ESTIMATE. POWER EARNINGS SENSITIVITIES UPDATED FOR 2015 BGS AUCTION AND 12/31/14 PRICE CURVES. 2015E 2016E 2017E $0.10-$0.13 $0.04 $0.04 $0.01 $0.01 $0.01 $0.01 $0.01 $0.01 $0.01 2017E |
 84 PSEG Summary • Continued third year of anticipated positive earnings trend in 2015 with updated operating earnings guidance of $2.80 to $2.95 per share • Continued 5 th straight year of expected double digit, 5-year growth in rate base • Anticipated high single digit earnings growth at PSE&G on a three-year basis from 2014 to 2017, driven by transmission investments and planned programs • Power’s continued focus on operational excellence, market expertise and financial strength delivers value in current price environment • Power realigning its portfolio with new, efficient CCGT investments in MD and NJ • Strong Balance Sheet and Cash Flow support PSE&G’s capital program and Power’s new investment opportunities without the need for equity • Our $0.08 per share dividend increase for 2015 is consistent with our long history of returning cash to the shareholder through the common dividend, with potential for consistent and sustainable growth |
 PSE&G APPENDIX 85 |
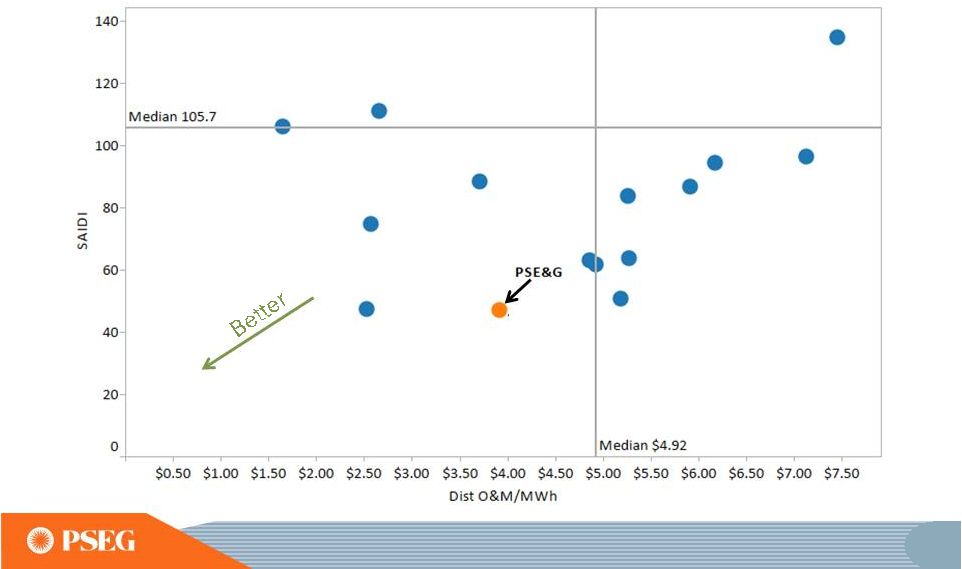 PSE&G provides high reliability at below average cost which creates superior value to customers SAIDI = SYSTEM AVERAGE INTERRUPTION DURATION INDEX, A MEASURE OF AVERAGE OUTAGE DURATION FOR ALL CUSTOMERS SERVED, EXCLUDING MAJOR EVENTS. SOURCES: PSE&G PEER PANEL STUDY, FIRST QUARTILE BENCHMARK STUDY AND VARIOUS REGULATORY REPORTS. 86 |
 87 PSE&G prioritizes public safety while maintaining value to customers LEAK RESPONSE RATE = PERCENTAGE OF UTILITY RESPONSES TO REPORTED LEAKS WITHIN ONE HOUR. SOURCES: PSE&G PEER PANEL STUDY AND AGA BENCHMARK STUDY. |
 PSEG POWER AND ER&T APPENDIX 88 |
 89 Nuclear fuel needs have been hedged through 2017 Anticipated Nuclear Fuel Cost Hedged $0 $5 $10 2015 2016 2017 |
 90 The full requirements BGS rate recognizes the forward PJM capacity market price Capacity Price per RPM Auction for PSEG Zone Capacity Price per BGS Tranche 2015-2016 166 $ Three Year Average ($/MW-day) 2016-2017 177 $ Average MW per Tranche (varies by EDC) 2017-2018 175 $ Days per Year 173 $ Average Capacity Cost per Tranche $173 111 365 MWh per Tranche Average MW per Tranche (varies by EDC) 111 Hours per Year 8,768 Load Factor (varies by EDC) ~37% MWh per Tranche, approx. 355,000 Capacity Cost per MWh 20 $ Average Capacity Price ($/MW-day) 7,007,656 $ |
 PSEG FINANCIAL APPENDIX 91 |
 92 First Half Operating Earnings by Subsidiary Operating Earnings Earnings per Share $ millions (except EPS) 2015 2014 2015 2014 PSE&G $ 409 $ 365 $ 0.80 $ 0.72 PSEG Power 388 380 0.77 0.75 PSEG Enterprise/Other 21 15 0.04 0.03 Operating Earnings* $ 818 $ 760 $ 1.61 $ 1.50 Six months ended June 30 •SEE SLIDE C FOR ITEMS EXCLUDED FROM NET INCOME TO RECONCILE TO OPERATING EARNINGS. |
 93 $1.61 0.01 0.02 0.08 $1.50 0.00 0.25 0.50 0.75 1.00 1.25 1.50 1.75 PSEG EPS Reconciliation – First Half 2015 versus First Half 2014 YTD 2015 Operating Earnings* YTD 2014 Operating Earnings* Re-Contracting & Lower Cost to Serve 0.14 Gas Send-Out & Fixed Cost Recovery 0.04 Higher Volume 0.02 Capacity (0.18) O&M (0.02) D&A (0.01) Taxes & Other 0.03 PSEG Power Transmission Net Earnings 0.07 Gas Volume & Demand 0.02 Electric Volume & Demand 0.01 Distribution O&M (0.01) Taxes & Other (0.01) PSE&G Enterprise/ Other PSEG Long Island * SEE SLIDE C FOR ITEMS EXCLUDED FROM NET INCOME TO RECONCILE TO OPERATING EARNINGS. |
 94 PSEG Power’s Adjusted EBITDA - Q2 2015, YTD and Full-Year 2015 Guidance Three Months Ended June 30, Six Months (YTD) Ended June 30, Full-Year 2015 Guidance ($ in millions) 2015 2014 2015 2014 Low High Operating Earnings** $110 $87 $388 $380 $620 $680 Add: Fossil Major Maintenance, pre-tax 52 49 101 107 115 115 Depreciation & Amortization, pre-tax 75 73 152 146 305 305 Interest Expense, pre-tax 32 29 63 60 125 125 Income Taxes 32 38 223 234 380 420 Adjusted EBITDA $301 $276 $927 $927 $1,545E $1,645E PSEG Power - Adjusted EBITDA* * SEE SLIDE B FOR A RECONCILIATION OF ADJUSTED EBITDA TO OPERATING EARNINGS AND NET INCOME. E = ESTIMATE. ** SEE SLIDE A FOR ITEMS EXCLUDED FROM NET INCOME TO RECONCILE TO OPERATING EARNINGS; INCLUDES THE FINANCIAL IMPACT FROM MARK-TO-MARKET POSITIONS WITH FORWARD DELIVERY MONTHS. |
 95 June 30, 2015 $ Billions PSEG PSE&G Power Cash and Cash Equivalents $0.6 $0.2 $0.0 Short Term Debt $0.0 $0.0 N/A Long Term Debt (1) 9.2 6.6 2.5 Common Equity 12.7 7.2 5.7 Total Capitalization $21.9 $13.8 $8.2 Total Debt / Capitalization 42% 48% 31% PSE&G Regulated Equity Ratio (2) 51.7% Our balance sheet remains strong (1)INCLUDES L-T DEBT DUE WITHIN 1 YEAR; EXCLUDES SECURITIZATION DEBT OF $134 MILLION AND NON-RECOURSE DEBT OF $16 MILLION. (2)REGULATED EQUITY RATIO INCLUDES CUSTOMER DEPOSITS OF ~$98 MILLION AND EXCLUDES SHORT-TERM DEBT. |
 96 PSEG Sandy-related insurance settlement proceeds ($ millions, pre-tax) Pre-2015 2015 Total PSEG Power $44 $179 $223** PSE&G 6 35 41*** PSEG $50* $214 ~$264 * PSE&G RECEIVED $6 MILLION OF INSURANCE SETTLEMENT PROCEEDS IN Q4 2012. POWER RECEIVED $19 MILLION AND $25 MILLION OF INSURANCE SETTLEMENT PROCEEDS IN Q4 2012 AND Q2 2013, RESPECTIVELY. ** POWER SHARE OF PROCEEDS REDUCED O&M; PROPERTY, PLANT AND EQUIPMENT; INCREASED OTHER INCOME. *** PSE&G SHARE OF PROCEEDS REDUCED O&M; PROPERTY, PLANT AND EQUIPMENT; AND REGULATORY ASSETS. |
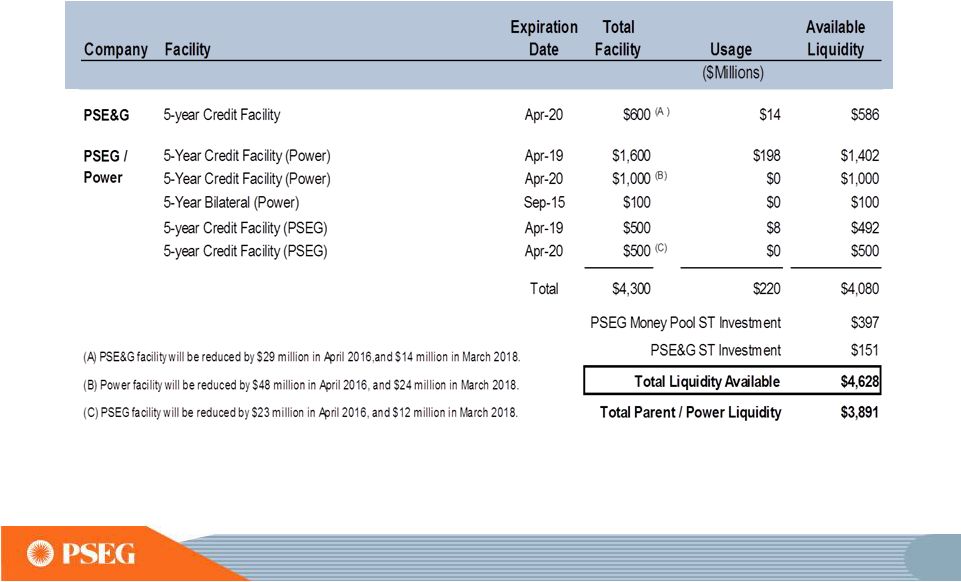 97 PSEG Liquidity as of June 30, 2015 |
 PSEG Energy Holdings Investment Portfolio Equipment Investment Balance* at 6/30/15 ($Millions) Merchant Energy Leases NRG REMA Keystone, Conemaugh & Shawville (PA) 3 coal-fired plants (1,162 equity MW) $355 NRG Energy, Inc./Midwest Gen** Powerton & Joliet Generating Stations (IL) 2 coal-fired generating facilities (1,640 equity MW) 218 Regulated Energy Leases Merrill Creek Reservoir in NJ (PECO, MetEd, Delmarva Power & Light) 150 Grand Gulf Nuclear station in Mississippi (175 equity MW) 29 Real Estate Leveraged Leases GM Renaissance Center; Wal-Marts 57 Real Estate Operating Leases Office Towers, Shopping Centers - 28 properties 39 Generation Legacy Assets GWF (in wind down stage), GSOE 2 Other Land 5 Total Holdings Investments $855 * BOOK BALANCE EXCLUDING DEFERRED TAX ACCOUNTS. **EME WAS ACQUIRED BY NRG ON APRIL 1 2014. 98 |
 Items Excluded from Income from Continuing Operations/Net Income to Reconcile to Operating Earnings PLEASE SEE PAGE 3 FOR AN EXPLANATION OF PSEG’S USE OF OPERATING EARNINGS AS A NON-GAAP FINANCIAL MEASURE AND HOW IT DIFFERS FROM NET INCOME. (a) Includes the financial impact from positions with forward delivery months. A 2014 2013 2012 2011 2010 2009 Earnings Impact ($ Millions) Operating Earnings 1,400 $ 1,309 $ 1,236 $ 1,389 $ 1,584 $ 1,567 $ Gain (Loss) on Nuclear Decommissioning Trust (NDT) Fund Related Activity (PSEG Power) 68 40 52 50 46 9 Gain (Loss) on Mark-to-Market (MTM) (PSEG Power) 66 (74) (10) 107 (1) (11) Lease Transaction Activity (PSEG Enterprise/Other) - - 36 (173) - 29 Storm O&M (PSEG Power) (16) (32) (39) - - - Market Transition Charge Refund (PSE&G) - - - - (72) - Gain (Loss) on Asset Sales and Impairments (PSEG Enterprise/Other) - - - 34 - - Income from Continuing Operations 1,518 $ 1,243 $ 1,275 $ 1,407 $ 1,557 $ 1,594 $ Discontinued Operations - - - 96 7 (2) Net Income 1,518 $ 1,243 $ 1,275 $ 1,503 $ 1,564 $ 1,592 $ Fully Diluted Average Shares Outstanding (in Millions) 508 508 507 507 507 507 Per Share Impact (Diluted) Operating Earnings 2.76 $ 2.58 $ 2.44 $ 2.74 $ 3.12 $ 3.09 $ Gain (Loss) on NDT Fund Related Activity (PSEG Power) 0.13 0.08 0.10 0.10 0.09 0.02 Gain (Loss) on MTM (PSEG Power) 0.13 (0.14) (0.02) 0.21 - (0.02) Lease Transaction Activity (PSEG Enterprise/Other) - - 0.07 (0.34) - 0.05 Storm O&M (PSEG Power) (0.03) (0.07) (0.08) - - - Market Transition Charge Refund (PSE&G) - - - - (0.14) - Gain (Loss) on Asset Sales and Impairments (PSEG Enterprise/Other) - - - 0.06 - - Income from Continuing Operations 2.99 $ 2.45 $ 2.51 $ 2.77 $ 3.07 $ 3.14 $ Discontinued Operations - - - 0.19 0.01 - Net Income 2.99 $ 2.45 $ 2.51 $ 2.96 $ 3.08 $ 3.14 $ (Unaudited) For the Year Ended December 31, PUBLIC SERVICE ENTERPRISE GROUP INCORPORATED Reconciling Items, net of tax (a) (a) |
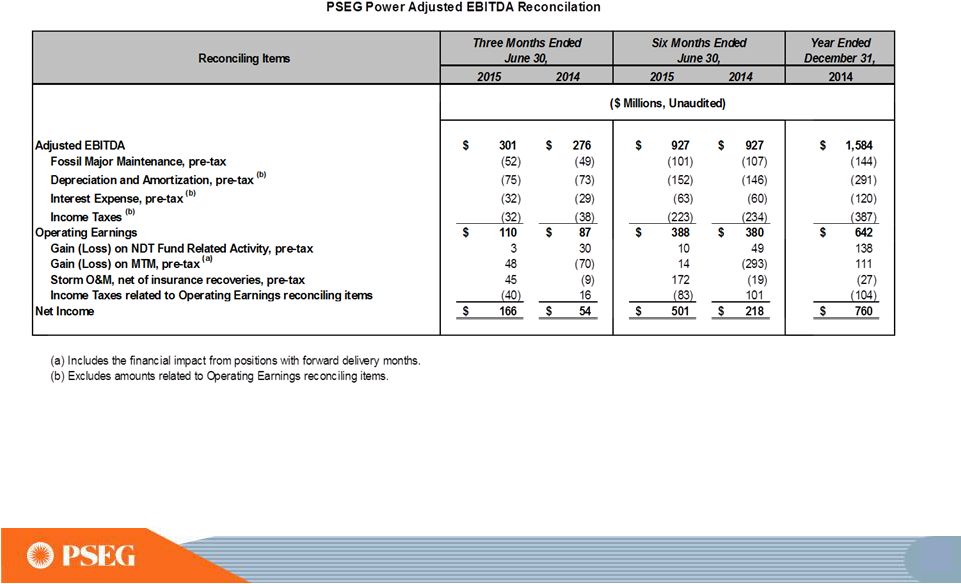 Items Excluded from Net Income to Reconcile to Operating Earnings and Adjusted EBITDA PLEASE SEE PAGE 3 FOR AN EXPLANATION OF PSEG’S USE OF OPERATING EARNINGS AND ADJUSTED EBITDA AS NON-GAAP FINANCIAL MEASURES AND HOW THEY DIFFER FROM NET INCOME. B |
 Items Excluded from Income from Continuing Operations/Net Income to Reconcile to Operating Earnings PLEASE SEE PAGE 3 FOR AN EXPLANATION OF PSEG’S USE OF OPERATING EARNINGS AS A NON-GAAP FINANCIAL MEASURE AND HOW IT DIFFERS FROM NET INCOME. C |