 Forward-Looking Statements Certain of the matters discussed in this report about our and our subsidiaries' future performance, including, without limitation, future revenues, earnings, strategies, prospects, consequences and all other statements that are not purely historical constitute “forward-looking statements” within the meaning of the Private Securities Litigation Reform Act of 1995. Such forward-looking statements are subject to risks and uncertainties, which could cause actual results to differ materially from those anticipated. Such statements are based on management's beliefs as well as assumptions made by and information currently available to management. When used herein, the words “anticipate,” “intend,” “estimate,” “believe,” “expect,” “plan,” “should,” “hypothetical,” “potential,” “forecast,” “project,” variations of such words and similar expressions are intended to identify forward-looking statements. Factors that may cause actual results to differ are often presented with the forward- looking statements themselves. Other factors that could cause actual results to differ materially from those contemplated in any forward-looking statements made by us herein are discussed in filings we make with the United States Securities and Exchange Commission (SEC) including our Annual Report on Form 10-K and subsequent reports on Form 10-Q and Form 8-K and available on our website: http://www.pseg.com. These factors include, but are not limited to: • adverse changes in the demand for or ongoing low pricing of the capacity and energy that we sell into wholesale electricity markets, • adverse changes in energy industry law, policies and regulations, including market structures and transmission planning, • any inability of our transmission and distribution businesses to obtain adequate and timely rate relief and regulatory approvals from federal and state regulators, including prudency reviews and disallowances, • any deterioration in our credit quality or the credit quality of our counterparties, • changes in federal and state environmental regulations and enforcement that could increase our costs or limit our operations, • adverse outcomes of any legal, regulatory or other proceeding, settlement, investigation or claim applicable to us and/or the energy industry, • changes in nuclear regulation and/or general developments in the nuclear power industry, including various impacts from any accidents or incidents experienced at our facilities or by others in the industry, that could limit operations or increase the cost of our nuclear generating units, • actions or activities at one of our nuclear units located on a multi-unit site that might adversely affect our ability to continue to operate that unit or other units located at the same site, • any inability to manage our energy obligations, available supply and risks, • delays or unforeseen cost escalations in our construction and development activities, or the inability to recover the carrying amount of our assets, • availability of capital and credit at commercially reasonable terms and conditions and our ability to meet cash needs, • increases in competition in energy supply markets as well as for transmission projects, • changes in technology, such as distributed generation and micro grids, and greater reliance on these technologies, • changes in customer behaviors, including increases in energy efficiency, net-metering and demand response, • adverse performance of our decommissioning and defined benefit plan trust fund investments and changes in funding requirements, • any equipment failures, accidents, severe weather events or other incidents that impact our ability to provide safe and reliable service to our customers, and any inability to obtain sufficient insurance coverage or recover proceeds of insurance with respect to such events, • acts of terrorism, cybersecurity attacks or intrusions that could adversely impact our businesses, • delays in receipt of necessary permits and approvals for our construction and development activities, • any inability to achieve, or continue to sustain, our expected levels of operating performance, • changes in the cost of, or interruption in the supply of, fuel and other commodities necessary to the operation of our generating units, • an extended economic recession, • an inability to realize anticipated tax benefits or retain tax credits, • challenges associated with recruitment and/or retention of a qualified workforce, and • changes in the credit quality and the ability of lessees to meet their obligations under our domestic leveraged leases. All of the forward-looking statements made in this report are qualified by these cautionary statements and we cannot assure you that the results or developments anticipated by management will be realized or even if realized, will have the expected consequences to, or effects on, us or our business prospects, financial condition or results of operations. Readers are cautioned not to place undue reliance on these forward-looking statements in making any investment decision. Forward-looking statements made in this report apply only as of the date of this report. While we may elect to update forward-looking statements from time to time, we specifically disclaim any obligation to do so, even if internal estimates change, unless otherwise required by applicable securities laws. The forward-looking statements contained in this report are intended to qualify for the safe harbor provisions of Section 27A of the Securities Act of 1933, as amended, and Section 21E of the Securities Exchange Act of 1934, as amended. 2 EXHIBIT 99 |
 GAAP Disclaimer These materials and other financial releases can be found on the pseg.com website under the investor tab, or at http://investor.pseg.com/ PSEG presents Operating Earnings in addition to its Income from Continuing Operations/Net Income reported in accordance with accounting principles generally accepted in the United States (GAAP). Operating Earnings is a non- GAAP financial measure that differs from Income from Continuing Operations/Net Income. Operating Earnings exclude gains or losses associated with Nuclear Decommissioning Trust (NDT), Mark-to-Market (MTM) accounting, and other material one-time items. PSEG presents Operating Earnings because management believes that it is appropriate for investors to consider results excluding these items in addition to the results reported in accordance with GAAP. PSEG believes that the non-GAAP financial measure of Operating Earnings provides a consistent and comparable measure of performance of its businesses to help shareholders understand performance trends. The last two slides in this presentation (Slides A and B) include a list of items excluded from Income from Continuing Operations/Net Income to reconcile to Operating Earnings, with a reference to that slide included on each of the slides where the non-GAAP information appears. 3 |
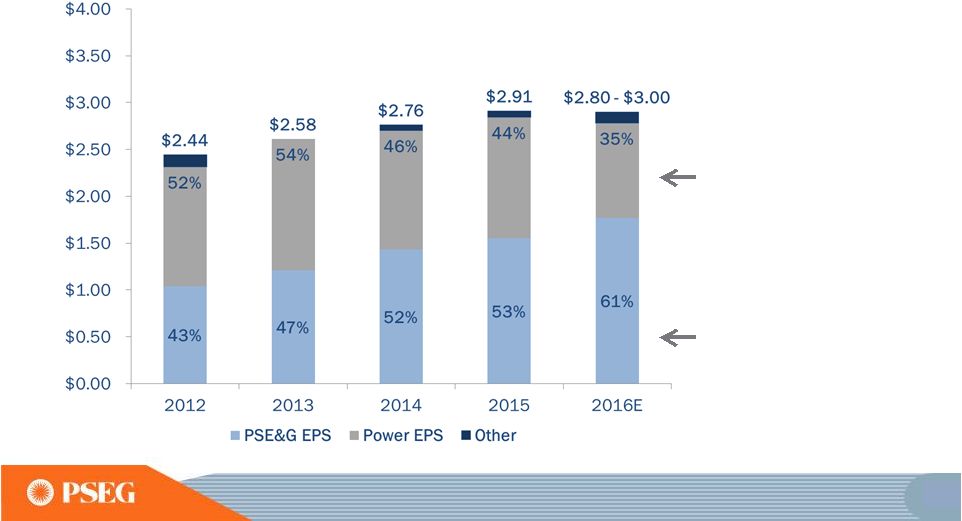 Operating Earnings Disciplined investment program and focus on operational excellence have supported growth Power’s diverse fuel mix and dispatch flexibility continue to generate strong earnings and free cash flow in low price environment PSE&G’s investment program has resulted in an increased contribution to PSEG’s earnings Operating Earnings* Contribution by Subsidiary *SEE SLIDE A FOR ITEMS EXCLUDED FROM INCOME FROM CONTINUING OPERATIONS/NET INCOME TO RECONCILE TO OPERATING EARNINGS. E=ESTIMATE ** 2016 PERCENTS USE MIDPOINT OF 2016 OPERATING EARNINGS GUIDANCE. ** ** 14 |
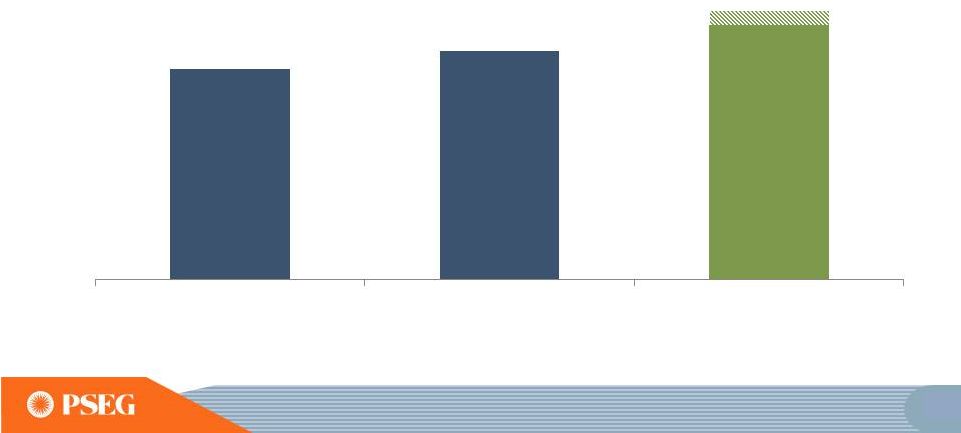 PSE&G’s 2016 operating earnings to benefit from investment programs and cost control E =ESTIMATE. 37 $725 $787 2014 2015 2016 Guidance PSE&G Operating Earnings ($ Millions) $875 -- $925E |
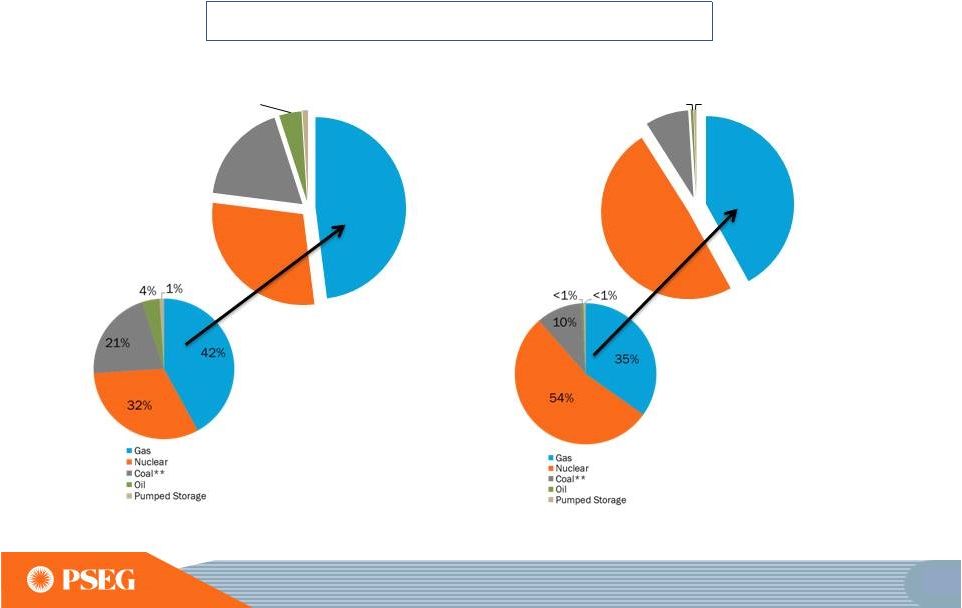 Power’s fleet to be transformed with addition of Keys, Sewaren 7 and Bridgeport Harbor in 2018-2019 2020E Fuel Diversity* Total MW: 13,100 2020E Energy Produced* Total GWh: 65,000 *EXCLUDES SOLAR AND KALAELOA E = ESTIMATE **INCLUDES NEW JERSEY UNITS THAT FUEL SWITCH TO GAS. Projected Fleet Comparison 2015 to 2020E 2015 Fuel Diversity* Total MW: 11,678 2015 Energy Produced* Total GWh: 55,213 49 48% 29% 18% 4% 1% 42% 49% 8% <1% <1% |
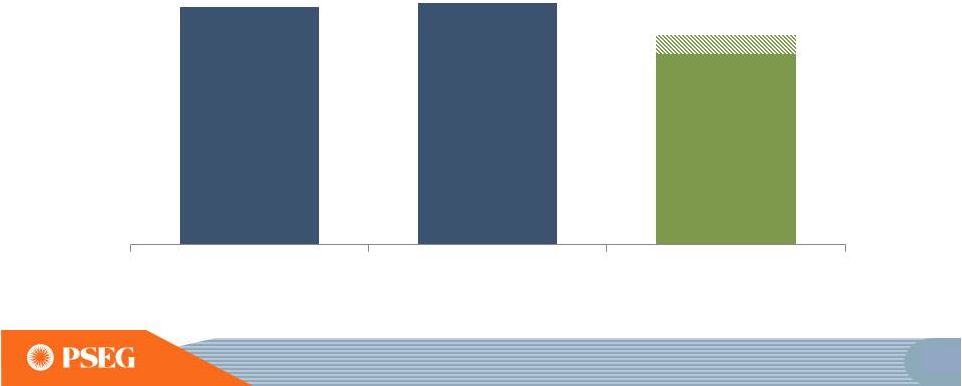 Power’s 2016 operating earnings incorporates impact from abnormally warm weather and retirement of capacity Power Operating Earnings* ($ Millions) *SEE SLIDE A FOR ITEMS EXCLUDED FROM NET INCOME TO RECONCILE TO OPERATING EARNINGS. E = ESTIMATE. 58 2014 2015 2016 Guidance $642 $653 $490 – $540E |
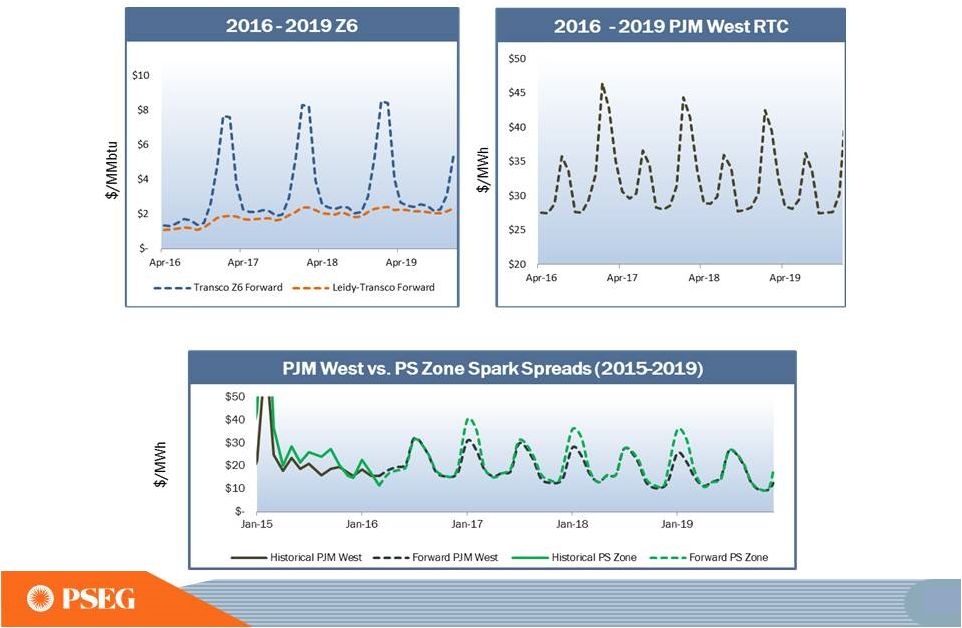 Market Review: Q1 2016 impacted by weather but forward gas and electric prices retain seasonal volatility FORWARDS AS OF MARCH 31, 2016 62 |
 Regulatory Framework: New capacity and energy market designs in PSEG’s core markets will better reward reliable generation units ISSUE /POLICY OUTCOME PJM CAPACITY • Higher payments for enhanced reliability (Capacity Performance) and lower energy revenues have raised absolute and relative value of capacity ENERGY PRICE FORMATION • FERC is driving ISO’s to improve their pricing constructs and rules – NOPRs and RTO reports addressing critical price formation issues DEMAND RESPONSE RULES • Stricter rules for eligibility and deployment; focus returns to wholesale reliability/comparability after U.S. Supreme Court (SCOTUS) ruling STATE INTERVENTION • SCOTUS dismissed the Maryland and New Jersey appeals in April 2016 • Ohio PPAs: FERC rescinded the previously approved waivers of the affiliate transaction standards and will review the PPAs under the affiliate abuse standards ISO-NE CAPACITY • Continued tightness in capacity markets • Zonal demand curves submitted for FERC approval (FCA 11) • Nuclear and coal units under pressure; closure of Pilgrim nuclear plant ENERGY • Proposed gas pipelines are receiving regulatory approvals slowly • 5 minute interval LMP settlements and fast start pricing expected Q2 2017 NYISO CAPACITY • Retirement of Fitzpatrick and Ginna and Western steam plants tighten market, but NYPSC directed to develop a clean energy standard that recognizes the value of nuclear ENERGY • Improvement in price formation during reserve shortage conditions FEDERAL ENVIRONMENTAL REGULATIONS • CPP rules stayed by SCOTUS • Some states will still prepare implementation plans for 2020+ timeframe • New PJM DR rules requiring that BTM diesel-fired generation employ environmental controls 65 |
 HEDGE PERCENTAGES AND PRICES AS OF MARCH 31, 2016. UPDATED WITH 2016 BGS AUCTION RESULTS. REVENUES OF FULL REQUIREMENT LOAD DEALS BASED ON CONTRACT PRICE, INCLUDING RENEWABLE ENERGY CREDITS, ANCILLARY, AND TRANSMISSION COMPONENTS BUT EXCLUDING CAPACITY. HEDGES INCLUDE POSITIONS WITH MTM ACCOUNTING TREATMENT AND OPTIONS. April-Dec 2016 2017 2018 Volume TWh 26 36 36 % Hedged 100% 75-80% 35-40% Price $/MWh $49 $49 $49 Volume TWh 14 19 24 % Hedged 25-30% 0% 0% Price $/MWh $49 - - Volume TWh 39-41 54-56 59-61 % Hedged 70-75% 50-55% 20-25% Price $/MWh $49 $49 $49 Hedging Strategy: Designed to protect gross margin while leveraging the portfolio 70 Base Load (Nuclear and Base Load Coal) Intermediate Coal, Combined Cycle, Peaking Total |
 PSEG Operating Earnings $ Millions (except EPS) 2012 2013 2014 2015 2016E Guidance PSE&G $528 $612 $725 $787 $875 - $925 PSEG Power $663 $710 $642 $653 $490 - $540 Enterprise/Other $45 ($13) $33 $36 $60 Operating Earnings* $1,236 $1,309 $1,400 $1,476 $1,425 - $1,525 Operating EPS* $2.44 $2.58 $2.76 $2.91 $2.80 - $3.00E % YOY Increase – PSE&G 15.9% 18.5% 8.6% 14.4% 1 % Regulated Earnings 43% 47% 52% 53% 61% 1 A higher regulated earnings mix due to growth in PSE&G earnings with a significant contribution from Power *SEE SLIDE A FOR ITEMS EXCLUDED FROM INCOME FROM CONTINUING OPERATIONS/NET INCOME TO RECONCILE TO OPERATING EARNINGS. 1 - BASED ON MID-POINT OF 2016 OPERATING EARNINGS GUIDANCE. E = ESTIMATE 77 |
 Strong financial position to support our business initiatives in 2016 and beyond 2016 and Beyond Earnings Continuing strong earnings trend in 2016 with guidance of $2.80 to $3.00 per share Investment Deploying significant capital at PSE&G for projects with contemporaneous returns Pursuing Power projects that satisfy risk adjusted return targets Cash Flow and Credit Metrics Continuing strong internal cash flow aided by bonus depreciation Funding investment program without equity issuance Dividends Providing $0.08 per share dividend increase in 2016 with opportunity for consistent and sustainable growth 78 |
 PSEG Summary • 2015 earnings of $2.91 were at the upper end of our upwardly revised operating earnings guidance of $2.85 - $2.95 per share • Forecast growth at PSE&G supports our 2016 guidance of $2.80 to $3.00 per share • Forecast high single-digit rate base growth at PSE&G on five year basis from 2015 to 2020, driven by investment in transmission and approved programs • Power’s investment program and continued focus on operational excellence with financial strength delivers value in current price environment • Strong Balance Sheet and Cash Flow support current capital program and investment in new opportunities without the need for equity • Our indicative $0.08 dividend per share increase for 2016 is consistent with our long history of returning cash to the shareholder through the common dividend, with opportunity for consistent and sustainable growth 90 |
 PSEG Financial Highlights Maintaining 2016 Operating Earnings* guidance of $2.80 - $3.00 per share Focused on maintaining operating efficiency and customer reliability Salem Q2 refueling outage extended to replace and repair baffle bolts in reactor vessel PSE&G expected to contribute over 60% of 2016 Operating Earnings* Infrastructure spend PSE&G T&D spend for 2016 expected to be $3 billion Power has begun construction of its CCGT units in Maryland and New Jersey Financial position remains strong Positive cash from Power and increasing cash flow from operations at PSE&G support dividend growth and fund capital spending program without the need to issue equity Debt as a percentage of capitalization was 44% at March 31 Increased common dividend 5.1% to indicative annual rate of $1.64 per share Increasing regulated earnings mix supports opportunity for dividend growth * SEE SLIDE B FOR ITEMS EXCLUDED FROM NET INCOME TO RECONCILE TO OPERATING EARNINGS. 99 |
 March 31, 2016 $ Billions PSEG PSE&G Power Cash and Cash Equivalents $0.6 $0.6 $0.0 Short Term Debt $0.0 $0.0 N/A Long Term Debt (2) 10.3 7.5 2.3 Common Equity 13.3 7.8 6.2 Total Capitalization $23.6 $15.3 $8.5 Total Debt / Capitalization 44% 49% 27% PSE&G Regulated Equity Ratio (1) 50.8% Our balance sheet remains strong (1) REGULATED EQUITY RATIO INCLUDES CUSTOMER DEPOSITS OF ~$96 MILLION AND EXCLUDES SHORT-TERM DEBT. (2) INCLUDES L-T DEBT DUE WITHIN 1 YEAR; EXCLUDES NON-RECOURSE DEBT OF $7 MILLION. 102 |
 PSEG Energy Holdings Investment Portfolio * BOOK BALANCE EXCLUDING DEFERRED TAX ACCOUNTS Equipment Investment Balance * at 03/31/16 ($millions) Merchant Energy Leases NRG REMA Keystone, Conemaugh & Shawville (PA) 3 coal-fired plants (1,162 equity MW) $ 355 NRG Energy, Inc. / Midwest Gen** Powerton & Joliet Generating Stations (IL) 2 coal-fired generating facilities (1,640 equity MW) $ 218 Regulated Energy Leases Merrill Creek Reservoir in NJ (PECO, MetEd, Delmarva Power & Light) $ 156 Grand Gulf Nuclear station in Mississippi (175 equity MW) $ 14 Real Estate Leveraged Leases GM Renaissance Center; Wal-Marts $ 58 Real Estate Operating Leases Office Towers, Shopping Centers - 26 properties $ 33 Other Land $ 5 Total Holdings Investments $839 104 |
 VICE PRESIDENT – INVESTOR RELATIONS PSEG SERVICES CORPORATION Kathleen Lally Kathleen A. Lally was named vice president – investor relations of PSEG Services Corporation in January 2007. Prior to joining PSEG Ms. Lally was a portfolio manager at the investment firm of Angelo Gordon & Company. She has extensive and diverse Wall Street experience, on both the buy side as an investor and sell side as an equity research analyst. She has worked on the buy side at JK Utility Advisory and Silcap, and has sell side experience at firms such as Salomon Brothers, Brown Brothers Harriman and DLJ-Pershing. Ms. Lally currently serves on the Board of the NJ Chapter of the Leukemia & Lymphoma Society. Ms. Lally holds a Bachelor of Arts degree in political science from St. Peter’s College and is a chartered financial analyst. 107 |
 Items Excluded from Income from Continuing Operations/Net Income to Reconcile to Operating Earnings PLEASE SEE PAGE 3 FOR AN EXPLANATION OF PSEG’S USE OF OPERATING EARNINGS AS A NON-GAAP FINANCIAL MEASURE AND HOW IT DIFFERS FROM NET INCOME. 2015 2014 2013 2012 2011 Earnings Impact ($ Millions) Operating Earnings 1,476 $ 1,400 $ 1,309 $ 1,236 $ 1,389 $ Gain (Loss) on Nuclear Decommissioning Trust (NDT) Fund Related Activity (PSEG Power) 8 68 40 52 50 Gain (Loss) on Mark-to-Market (MTM) (a) (PSEG Power) 93 66 (74) (10) 107 Lease Transaction Activity (PSEG Enterprise/Other) - - - 36 (173) Storm O&M (PSEG Power) 102 (16) (32) (39) - Gain (Loss) on Asset Sales and Impairments (PSEG Enterprise/Other) - - - - 34 Income from Continuing Operations 1,679 $ 1,518 $ 1,243 $ 1,275 $ 1,407 $ Discontinued Operations - - - - 96 Net Income 1,679 $ 1,518 $ 1,243 $ 1,275 $ 1,503 $ Fully Diluted Average Shares Outstanding (in Millions) 508 508 508 507 507 Per Share Impact (Diluted) Operating Earnings 2.91 $ 2.76 $ 2.58 $ 2.44 $ 2.74 $ Gain (Loss) on NDT Fund Related Activity (PSEG Power) 0.01 0.13 0.08 0.10 0.10 Gain (Loss) on MTM (a) (PSEG Power) 0.18 0.13 (0.14) (0.02) 0.21 Lease Transaction Activity (PSEG Enterprise/Other) - - - 0.07 (0.34) Storm O&M (PSEG Power) 0.20 (0.03) (0.07) (0.08) - Gain (Loss) on Asset Sales and Impairments (PSEG Enterprise/Other) - - - - 0.06 Income from Continuing Operations 3.30 $ 2.99 $ 2.45 $ 2.51 $ 2.77 $ Discontinued Operations - - - - 0.19 Net Income 3.30 $ 2.99 $ 2.45 $ 2.51 $ 2.96 $ (Unaudited) For the Year Ended December 31, Reconciling Items, net of tax PUBLIC SERVICE ENTERPRISE GROUP INCORPORATED (a) Includes the financial impact from positions with forward delivery months. A |