 Public Service Enterprise Group PSEG Earnings Conference Call 2 nd Quarter 2016 July 29, 2016 EXHIBIT 99.1 |
1 Forward-Looking Statements Certain of the matters discussed in this report about our and our subsidiaries' future performance, including, without limitation, future revenues, earnings, strategies, prospects, consequences and all other statements that are not purely historical constitute “forward-looking statements” within the meaning of the Private Securities Litigation Reform Act of 1995. Such forward-looking statements are subject to risks and uncertainties, which could cause actual results to differ materially from those anticipated. Such statements are based on management's beliefs as well as assumptions made by and information currently available to management. When used herein, the words “anticipate,” “intend,” “estimate,” “believe,” “expect,” “plan,” “should,” “hypothetical,” “potential,” “forecast,” “project,” variations of such words and similar expressions are intended to identify forward-looking statements. Factors that may cause actual results to differ are often presented with the forward-looking statements themselves. Other factors that could cause actual results to differ materially from those contemplated in any forward-looking statements made by us herein are discussed in filings we make with the United States Securities and Exchange Commission (SEC) including our Annual Report on Form 10-K and subsequent reports on Form 10-Q and Form 8-K and available on our website: http://www.pseg.com. These factors include, but are not limited to: • adverse changes in the demand for or ongoing low pricing of the capacity and energy that we sell into wholesale electricity markets, • adverse changes in energy industry law, policies and regulations, including market structures and transmission planning, • any inability of our transmission and distribution businesses to obtain adequate and timely rate relief and regulatory approvals from federal and state regulators, including prudency reviews, disallowances and changes in authorized returns, • any deterioration in our credit quality or the credit quality of our counterparties, • changes in federal and state environmental regulations and enforcement that could increase our costs or limit our operations, • adverse outcomes of any legal, regulatory or other proceeding, settlement, investigation or claim applicable to us and/or the energy industry, • changes in nuclear regulation and/or general developments in the nuclear power industry, including various impacts from any accidents or incidents experienced at our facilities or by others in the industry, that could limit operations or increase the cost of our nuclear generating units, • actions or activities at one of our nuclear units located on a multi-unit site that might adversely affect our ability to continue to operate that unit or other units located at the same site, • any inability to manage our energy obligations, available supply and risks, • delays or unforeseen cost escalations in our construction and development activities, or the inability to recover the carrying amount of our assets, • availability of capital and credit at commercially reasonable terms and conditions and our ability to meet cash needs, • increases in competition in energy supply markets as well as for transmission projects, • changes in technology, such as distributed generation, storage and micro grids, and greater reliance on these technologies, • changes in customer behaviors, including increases in energy efficiency, net-metering and demand response, • adverse performance of our decommissioning and defined benefit plan trust fund investments and changes in funding requirements, • any equipment failures, accidents, severe weather events or other incidents that impact our ability to provide safe and reliable service to our customers, and any inability to obtain sufficient insurance coverage or recover proceeds of insurance with respect to such events, • acts of terrorism, cybersecurity attacks or intrusions that could adversely impact our businesses, • delays in receipt of necessary permits and approvals for our construction and development activities, • any inability to achieve, or continue to sustain, our expected levels of operating performance, • changes in the cost of, or interruption in the supply of, fuel and other commodities necessary to the operation of our generating units, • an extended economic recession, • an inability to realize anticipated tax benefits or retain tax credits, • challenges associated with recruitment and/or retention of a qualified workforce, and • changes in the credit quality and the ability of lessees to meet their obligations under our domestic leveraged leases. All of the forward-looking statements made in this report are qualified by these cautionary statements and we cannot assure you that the results or developments anticipated by management will be realized or even if realized, will have the expected consequences to, or effects on, us or our business prospects, financial condition or results of operations. Readers are cautioned not to place undue reliance on these forward-looking statements in making any investment decision. Forward-looking statements made in this report apply only as of the date of this report. While we may elect to update forward-looking statements from time to time, we specifically disclaim any obligation to do so, even if internal estimates change, unless otherwise required by applicable securities laws. The forward-looking statements contained in this report are intended to qualify for the safe harbor provisions of Section 27A of the Securities Act of 1933, as amended, and Section 21E of the Securities Exchange Act of 1934, as amended. |
 2 GAAP Disclaimer PSEG presents Operating Earnings and Adjusted Earnings Before Interest, Taxes, Depreciation and Amortization (EBITDA) in addition to its Net Income reported in accordance with accounting principles generally accepted in the United States (GAAP). Operating Earnings and Adjusted EBITDA are non-GAAP financial measures that differ from Net Income. Operating Earnings exclude gains or losses associated with Nuclear Decommissioning Trust (NDT), Mark-to-Market (MTM) accounting, and material one-time items. Adjusted EBITDA excludes the same items as our Operating Earnings measure as well as income tax expense, interest expense, depreciation and amortization and major maintenance expense costs at Power’s fossil generation facilities. The last two slides in this presentation (Slides A and B) include a list of items excluded from Net Income to reconcile to Operating Earnings and Adjusted EBITDA with a reference to that slide included on each of the slides where the non-GAAP information appears. Management uses Operating Earnings and Adjusted EBITDA in its internal analysis, and in communications with investors and analysts, as a consistent measure for comparing PSEG’s financial performance to previous financial results. The presentation of Operating Earnings and Adjusted EBITDA is intended to complement, and should not be considered an alternative to, the presentation of Net Income, which is an indicator of financial performance determined in accordance with GAAP. In addition, Operating Earnings and Adjusted EBITDA as presented in this release may not be comparable to similarly titled measures used by other companies. Due to the forward looking nature of Operating Earnings and Adjusted EBITDA guidance, PSEG is unable to reconcile these non-GAAP financial measures to the most directly comparable GAAP financial measure. Management is unable to project certain reconciling items, in particular MTM and NDT gains (losses), for future periods due to market volatility. These materials and other financial releases can be found on the pseg.com website under the investor tab, or at http://investor.pseg.com/ |
 PSEG 2016 Q2 Review Ralph Izzo Chairman, President and Chief Executive Officer |
 4 Q2 Earnings Summary $ millions (except EPS) 2016 2015 Operating Earnings* $ 289 $ 289 Reconciling Items (102) 56 Net Income $ 187 $ 345 EPS from Net Income $ 0.37 $ 0.68 EPS from Operating Earnings* $ 0.57 $ 0.57 Quarter ended June 30 * See Slide A for Items excluded from Net Income to reconcile to Operating Earnings. |
 5 First Half Earnings Summary $ millions (except EPS) 2016 2015 Operating Earnings* $ 752 $ 818 Reconciling Items (94) 113 Net Income $ 658 $ 931 EPS from Net Income $ 1.30 $ 1.83 EPS from Operating Earnings* $ 1.48 $ 1.61 Six months ended June 30 * See Slide A for Items excluded from Net Income to reconcile to Operating Earnings. |
 6 PSEG – Q2 2016 Highlights Solid Results Net Income of $0.37 vs. $0.68 per share in Q2 2015 Operating Earnings of $0.57 vs. $0.57 per share in Q2 2015* Increased earnings contribution from PSE&G’s investment in Transmission Maintaining full-year 2016 Operating Earnings guidance of $2.80 - $3.00 per share Operating Review PSEG Power generating output declined by 6% vs. Q2 2015 – reflecting mild weather, low gas prices and impact of extended outage at Salem nuclear facility PSEG Disciplined Capital Investment PSE&G identifies more than $500 million of additional capital opportunities through 2020 Solar 4 All Extension II filing made with NJBPU in May with decision expected in Q4 Power’s construction of Keys and Sewaren CCGTs on schedule and on budget Market Developments RPM auction results for 2019/2020 reflected PJM’s downward revisions to the demand forecast and the effects of both new generation and uncleared generation from the prior year’s auction * See Slide A for Items excluded from Net Income to reconcile to Operating Earnings. |
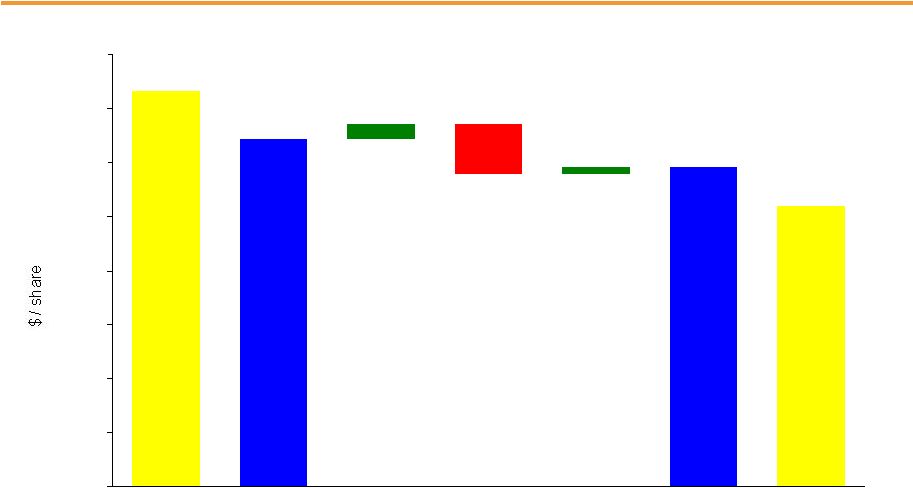
 7 $2.80 - $3.00E Maintaining 2016 Operating Earnings Guidance $2.76 * See Slide A for Items excluded from Net Income to reconcile to Operating Earnings. E = Estimate. $2.91 Reaching the upper end of our guidance range in 2016 will be difficult even with improvements seen in the power markets, expectations for warm summer weather, normal operations and management of O&M 2014 2015 2016 Operating Earnings* Guidance |
 PSEG 2016 Q2 Operating Company Review Dan Cregg EVP and Chief Financial Officer |
 9 Q2 Operating Results by Subsidiary Operating Results Earnings per Share $ millions (except EPS) 2016 2015 2016 2015 PSE&G $ 179 $ 167 $ 0.35 $ 0.33 PSEG Power* 91 110 0.18 0.22 PSEG Enterprise/Other 19 12 0.04 0.02 Operating Earnings* $ 289 $ 289 $ 0.57 $ 0.57 Reconciling Items (102) 56 (0.20) 0.11 Net Income $ 187 $ 345 $ 0.37 $ 0.68 Quarter ended June 30 * See Slide A for Items excluded from Net Income to reconcile to Operating Earnings. |
 10 PSEG EPS Reconciliation – Q2 2016 versus Q2 2015 Q2 2016 Net Income Q2 2015 Net Income PSEG Power PSE&G Enterprise/ Other * See Slide A for Items excluded from Net Income to reconcile to Operating Earnings. Re-Contracting/ Lower Prices/Gas Volumes (0.03) Capacity (0.02) Volume (0.01) O&M 0.07 Absence of 2015 Tax Credits and Other (0.05) Transmission Earnings 0.03 Distribution O&M and D&A (0.02) Taxes and Other 0.01 Q2 2015 Operating Earnings* Q2 2016 Operating Earnings* PSEG-LI Taxes and Other $0.68 0.02 (0.04) 0.02 $0.57 $0.57 $0.37 0.00 0.10 0.20 0.30 0.40 0.50 0.60 0.70 |
 11 First Half Operating Results by Subsidiary Operating Results Earnings per Share $ millions (except EPS) 2016 2015 2016 2015 PSE&G $ 441 $ 409 $ 0.87 $ 0.80 PSEG Power* 275 388 0.54 0.77 PSEG Enterprise/Other 36 21 0.07 0.04 Operating Earnings* $ 752 $ 818 $ 1.48 $ 1.61 Reconciling Items (94) 113 (0.18) 0.22 Net Income $ 658 $ 931 $ 1.30 $ 1.83 Six months ended June 30 * See Slide A for Items excluded from Net Income to reconcile to Operating Earnings. |
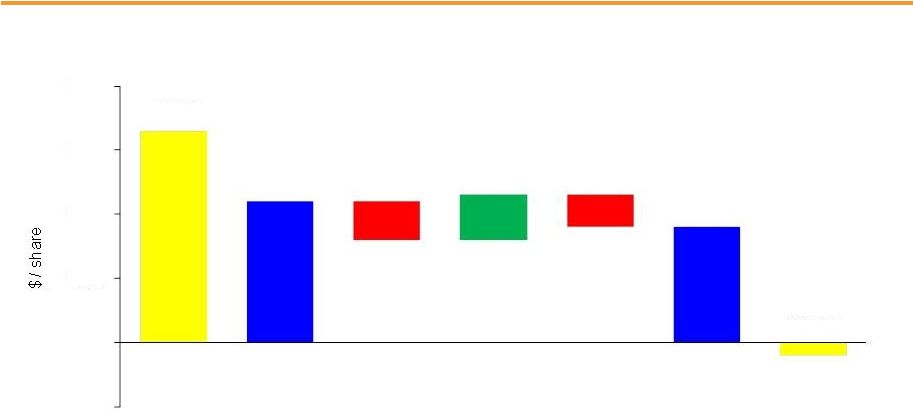
 12 0.00 0.25 0.50 0.75 1.00 1.25 1.50 1.75 2.00 PSEG EPS Reconciliation – First Half 2016 versus First Half 2015 YTD 2016 YTD 2016 Operating Earnings* YTD 2015 Net Income Re-Contracting/ Lower Prices/ Gas Volumes (0.12) Lower Gas Send- Out and Fixed Cost Recovery (0.12) Capacity (0.05) Volume (0.03) O&M 0.13 Lower Interest 0.01 Absence of 2015 Tax Credits and Other (0.05) PSEG Power Transmission Earnings 0.07 Weather (0.02) Gas Volume and Demand 0.01 Distribution O&M and D&A (0.03) Taxes and Other 0.04 PSE&G Enterprise/ Other PSEG-LI Taxes and Other * See Slide A for Items excluded from Net Income to reconcile to Operating Earnings. Net Income YTD 2015 Operating Earnings* $1.83 0.07 (0.23) 0.03 $1.61 $1.48 $1.30 |
 PSE&G 2016 Q2 Review |
 14 PSE&G – Q2 Earnings Summary $ millions (except EPS) Q2 2016 Q2 2015 Variance Operating Revenues $ 1,350 $ 1,466 $ (116) Operating Expenses Energy Costs 529 544 (15) Operation & Maintenance 352 368 (16) Depreciation & Amortization 136 234 (98) Total Operating Expenses 1,017 1,146 (129) Net Income $ 179 $ 167 $ 12 EPS from Net Income $ 0.35 $ 0.33 $ 0.02 |
 15 PSE&G EPS Reconciliation – Q2 2016 versus Q2 2015 Transmission Earnings 0.03 Taxes and Other 0.01 Distribution O&M and D&A Q2 2015 Net Income Q2 2016 Net Income $0.33 0.04 $0.35 (0.02) 0.00 0.10 0.20 0.30 0.40 |
 16 PSE&G – Q2 2016 Weather Data 2016 vs. 2015 vs. Normal PSE&G Monthly Weather Summary April May June April May June Monthly Temperature Humidity Index (THI) Monthly Heating Degree Days (HDD) Q2 2016 heating degree days were ~29% higher than Q2 2015 and ~7% higher than normal Q2 2016 temperature-humidity index was ~21% lower than Q2 2015 and ~5% lower than normal 365 170 5 327 56 35 360 131 13 0 100 200 300 400 500 2016 2015 Normal 129 1,164 2,497 34 1,836 2,943 166 809 2,994 0 500 1,000 1,500 2,000 2,500 3,000 3,500 2016 2015 Normal |
 17 PSE&G – Q2 2016 Operating Highlights Operations Solar 4 All II Extension filing has been deemed complete by the BPU for an expected Q4 2016 decision PSE&G residential gas customers to benefit from proposed rate reduction of 7.4% on October 1, estimated savings for the average gas customer of $64 per year if approved by the BPU Regulatory and Market Environment PSE&G made $1.4 billion of capital expenditures in the YTD period ended June 30 as part of its full year capital spending projected to be at least $3 billion PSE&G has identified ~$500 million of additional capital opportunities, including the Solar 4 All Extension II filing, to invest in its distribution business beyond the current $12 billion plan in the 2016 - 2020 period. PSE&G’s forecast of Net Income and Operating Earnings has been increased to $900 - $935 million from $875 - $925 million* Financial Q2 2016 weather was milder than Q2 2015 NJ economy continues to show improvement; but residential and commercial customer growth was offset by greater use of energy efficiency measures and lower industrial activity On a trailing 12-month basis, weather normalized electric sales for both residential and commercial customers were essentially flat, and industrial sales were lower by 2% * See Slide A for Items excluded from Net Income to reconcile to Operating Earnings. |
 PSEG Power 2016 Q2 Review |
 19 PSEG Power – Q2 Earnings Summary $ millions (except EPS) Q2 2016 Q2 2015 Variance Operating Revenues $ 714 $ 1,025 $ (311) Operating Earnings* 91 110 (19) Reconciling Items (102) 56 (158) Net Income (Loss) $ (11) $ 166 $ (177) EPS from Net Income (Loss) $ (0.02) $ 0.33 $ (0.35) EPS from Operating Earnings* $ 0.18 $ 0.22 $ (0.04) * See Slide A for Items excluded from Net Income to reconcile to Operating Earnings. |
 20 Re-Contracting/ Lower Prices/Gas Volumes (0.03) Capacity (0.02) Volume (0.01) PSEG Power EPS Reconciliation – Q2 2016 versus Q2 2015 Q2 2016 Net Loss Q2 2015 Net Income O&M * See Slide A for Items excluded from Net Income to reconcile to Operating Earnings. Absence of 2015 Tax Credits and Other Q2 2015 Operating Earnings* Q2 2016 Operating Earnings* $0.33 $0.22 0.07 $0.18 (0.06) (0.05) $(0.02) -0.10 0.00 0.10 0.20 0.30 0.40 |
 PSEG Power’s Adjusted EBITDA - Q2 2016, YTD and Full-Year 2016 Guidance Three Months Ended June 30, Six Months (YTD) Ended June 30, Full-Year 2016 Guidance ($ millions) 2016 2015 2016 2015 Low High Operating Earnings** $91 $110 $275 $388 $460 $525 Add: Fossil Major Maintenance, pre-tax 22 52 29 101 80 80 Depreciation & Amortization, pre-tax 81 75 161 152 340 340 Interest Expense, pre-tax 20 32 42 63 80 80 Income Taxes 58 32 181 223 310 350 Adjusted EBITDA $272 $301 $688 $927 $1,270E $1,375E 21 PSEG Power - Adjusted EBITDA* * See Slide B for a reconciliation of Adjusted EBITDA to Operating Earnings and Net Income. E = Estimate. ** See Slide A for Items excluded from Net Income to reconcile to Operating Earnings. |
 22 PSEG Power – Q2 2016 Generation Measures 7,129 6,983 4,831 4,551 912 1,273 0 7,000 14,000 2015 2016 Quarter ended June 30 Total Nuclear Total Coal** Oil & Natural Gas Generation by Fuel (GWh)* 13,233 Quarter ended June 30 * Excludes Solar and Kalaeloa. ** Includes figures for Pumped Storage; also includes Natural Gas fuel switching intervals. 2015 2016 Combined Cycle PJM and NY 64% 62% Coal** NJ (Coal/Gas) 3% 0% PA 73% 57% CT 0% 0% Nuclear 86% 83% 12,446 Fleet Capacity Factors (%) |
 23 PSEG Power – YTD 2016 Generation Measures 14,961 15,402 8,305 3,803 1,939 9,007 0 10,000 20,000 30,000 2015 2016 Six Months ended June 30 * Excludes Solar and Kalaeloa. ** Includes figures for Pumped Storage; also includes Natural Gas fuel switching intervals. Generation by Fuel (GWh)* 25,646 27,771 Six Months ended June 30 Fleet Capacity Factors (%) 2015 2016 Combined Cycle PJM and NY 59% 57% Coal** NJ (Coal/Gas) 9% 0% PA 82% 58% CT 34% 3% Nuclear 91% 91% Total Coal** Oil & Natural Gas Total Nuclear |
 24 PSEG Power – Q2 and YTD Fuel Costs Quarter ended June 30 ($ millions) 2015 2016 Coal $30 $22 Oil & Gas 82 64 Total Fossil 112 86 Nuclear 51 48 Total Fuel Cost $163 $134 Total Generation (GWh) 13,233 12,446 $ / MWh 12.32 10.77 PSEG Power – Fuel Costs YTD June 30 ($ millions) 2015 2016 Coal $112 $49 Oil & Gas 329 131 Total Fossil 441 180 Nuclear 106 105 Total Fuel Cost $547 $285 Total Generation (GWh) 27,771 25,646 $ / MWh 19.70 11.11 |
 25 PSEG Power – Gross Margin Performance Wholesale energy prices affected by over-supply of natural gas Extended refueling outage at Salem 1 to replace degraded baffle bolts Decrease in average hedge price of $2 MWh vs. Q2 2015 Q2 year-over-year capacity revenues reflect HEDD peaking capacity retirements in May 2015 Q2 2016 Regional Performance Region Gross Margin ($M) Q2 2016 Performance PJM $442 Lower market prices and lower volumes exacerbated by mild Q2 weather. New England $18 Slightly higher hedge value offset by lower volume and lower prices. New York $20 Lower volume and lower prices versus Q2 2015. PSEG Power Gross Margin* ($/MWh) $40 $0 $10 $20 $30 $40 $50 2014 2015 2016 $39 $42 Quarter ended June 30 |
 26 Hedging Update Contracted Energy* Jul-Dec 2016 2017 2018 Volume TWh 17 36 36 Base Load % Hedged 100% 80-85% 40-45% (Nuclear and Base Load Coal) Price $/MWh $50 $48 $46 Volume TWh 8 18 23 Intermediate Coal, Combined % Hedged 30-35% 0% 0% Cycle, Peaking Price $/MWh $50 -- -- Volume TWh 25-26 53-55 58-60 Total % Hedged 75-80% 55-60% 25-30% Price $/MWh $50 $48 $46 * Hedge percentages and prices as of June 30, 2016. Revenues of full requirement load deals based on contract price, including renewable energy credits, ancillary, and transmission components but excluding capacity. Hedges include positions with MTM accounting treatment and options. |
 27 PSEG Power – Q2 2016 Operating Highlights Q2 output down 6%; average nuclear capacity factor for the fleet was 83% vs. 86% in Q2 2015, as nuclear output declined by 2% to ~7 TWh, primarily reflecting the extended refueling outage at Salem 1 to replace degraded baffle bolts and an unplanned outage at Salem 2 – partly offset by increased output at Peach Bottom related to 130 MWs of recent EPU uprates CCGT availability remains strong; production down 4% on mild Q2 weather and lower demand Dispatch of coal units affected by decline in price of gas; fuel cost per MWh fell by 13% vs. Q2 2015 Operations Financial Regulatory and Market Environment PSEG Power’s average capacity pricing for the 2016/2017 capacity year reset to $172 MW/day on June 1 The 2019/2020 RPM auction results reflected PJM’s downward revisions to the demand forecast and the effects of both new generation and uncleared generation from the prior year’s auction Power cleared ~8,900 MW of capacity at an average price of $116 MW/day in the 2019/2020 RPM auction Power’s total debt as a percentage of capital was 32% at June 30 Power issued $700 million of 3.00% Senior Notes due 2021 Power’s forecast of Operating Earnings is revised to $460 - $525 million from $490 - $540 million; Adjusted EBITDA is lowered to $1,270 - $1,375 million from $1,320 - $1,400 million* * See Slide A for Items excluded from Net Income to reconcile to Operating Earnings; See Slide B for a reconciliation of Adjusted EBITDA to Operating Earnings and Net Income. |
 PSEG |
 29 PSEG Financial Highlights Maintaining full-year 2016 Operating Earnings guidance of $2.80 - $3.00 per share* Reaching the upper end of our guidance range in 2016 will be difficult even with improvements seen in the power markets, expectations for warm summer weather, normal operations and management of O&M Focused on meeting customer needs for clean, reliable, efficient delivery of energy Infrastructure Spend PSE&G capital spending on T&D for 2016 expected to top $3 billion PSE&G’s Gas System Modernization Program (GSMP) and Energy Strong continue Keys and Sewaren CCGTs construction is on schedule and on budget PSE&G has identified more than $500 million of additional infrastructure spend over the current capital spending plan of $12 billion in the 2016-2020 period Financial position remains strong Positive cash from Power and increasing cash flow from operations at PSE&G supports dividend growth and funds capital spending program without the need to issue equity Debt as a percentage of capitalization was 45% at June 30 * See Slide A for Items excluded from Net Income to reconcile to Operating Earnings. |
 30 PSEG 2016 Operating Earnings Guidance - By Subsidiary $ Millions (except EPS) 2016E 2015 PSE&G $900 - $935 $787 PSEG Power* $460 - $525 $653 PSEG Enterprise/Other $65 - $65 $36 Operating Earnings* $1,425 - $1,525 $1,476 Earnings per Share $2.80 - $3.00E $2.91 Segment Earnings Guidance and Prior Results $ Millions 2016E 2015 PSEG Power $1,270 - $1,375 $1,563 PSEG Power Adjusted EBITDA* * See Slide A for Items excluded from Net Income to reconcile to Operating Earnings and Slide B for Items excluded from Net Income to reconcile to Operating Earnings and Adjusted EBITDA. See Slide 21 for a reconciliation of Operating Earnings and Adjusted EBITDA for 2016E. E = Estimate. |
 PSEG Liquidity as of June 30, 2016 31 Expiration Total Available Company Facility Date Facility Usage Liquidity ($ millions) PSE&G 5-year Credit Facility Apr-20 $600 (A) $14 $586 PSEG Money Pool 5-Year Credit Facility (Power) Apr-19 $1,600 $189 $1,411 5-Year Credit Facility (Power) Apr-20 $953 (B) $13 $940 5-year Credit Facility (PSEG) Apr-19 $500 $10 $490 5-year Credit Facility (PSEG) Apr-20 $500 (C) $0 $500 Total Money Pool $3,553 $212 $3,341 Total $4,153 $226 $3,927 $445 (A) PSE&G facility will be reduced by $14 million in March 2018. PSE&G ST Investment $125 (B) Power facility will be reduced by $24 million in March 2018. Total Liquidity Available $4,497 (C) PSEG facility will be reduced by $12 million in March 2018. Total Money Pool Liquidity Available $3,786 PSEG / Power PSEG Money Pool ST Investment |
 A Items Excluded from Net Income to Reconcile to Operating Earnings Please see Slide 2 for an explanation of PSEG’s use of Operating Earnings as a non-GAAP financial measure and how it differs from Net Income. (a) Includes the financial impact from positions with forward delivery months. (b) Income tax effect calculated at 40.85% statutory rate, plus 20% tax on income (losses) from qualified NDT funds. PUBLIC SERVICE ENTERPRISE GROUP INCORPORATED Consolidated Operating Earnings Reconciliation 2016 2015 2016 2015 2015 2014 Operating Earnings 289 $ 289 $ 752 $ 818 $ 1,476 $ 1,400 $ Gain (Loss) on Nuclear Decommissioning Trust (NDT) Fund Related Activity, pre-tax (PSEG Power) - 3 (8) 10 24 138 Gain (Loss) on Mark-to-Market (MTM), pre-tax (a) (PSEG Power) (171) 48 (149) 14 157 111 Storm O&M, net of insurance recoveries, pre-tax (PSEG Power) - 45 - 172 172 (27) Income Taxes related to Operating Earnings reconciling items (b) 69 (40) 63 (83) (150) (104) Net Income 187 $ 345 $ 658 $ 931 $ 1,679 $ 1,518 $ Fully Diluted Average Shares Outstanding (in Millions) 508 508 508 508 508 508 Operating Earnings 0.57 $ 0.57 $ 1.48 $ 1.61 $ 2.91 $ 2.76 $ Gain (Loss) on NDT Fund Related Activity, pre-tax (PSEG Power) - 0.01 (0.01) 0.02 0.05 0.27 Gain (Loss) on MTM, pre-tax (a) (PSEG Power) (0.34) 0.09 (0.29) 0.02 0.31 0.22 Storm O&M, net of insurance recoveries, pre-tax (PSEG Power) - 0.09 - 0.34 0.34 (0.05) Income Taxes related to Operating Earnings reconciling items (b) 0.14 (0.08) 0.12 (0.16) (0.31) (0.21) Net Income 0.37 $ 0.68 $ 1.30 $ 1.83 $ 3.30 $ 2.99 $ Year-Ended June 30, December 31, Six Months Ended June 30, Three Months Ended Reconciling Items ($ Millions, Unaudited) ($ Per Share Impact - Diluted, Unaudited) |
 B Items Excluded from Net Income to Reconcile to Operating Earnings and Adjusted EBITDA Please see Slide 2 for an explanation of PSEG’s use of Operating Earnings and Adjusted EBITDA as non-GAAP financial measures and how they differ from Net Income. (a) Excludes amounts related to Operating Earnings reconciling items. (b) Net of capitalized interest. (c) Includes the financial impact from positions with forward delivery months. (d) Income tax effect calculated at 40.85% statutory rate, plus 20% tax on income (losses) from qualified NDT funds. PSEG Power Adjusted EBITDA Reconciliation 2016 2015 2016 2015 2015 Adjusted EBITDA 272 $ 301 $ 688 $ 927 $ 1,563 $ Fossil Major Maintenance, pre-tax (22) (52) (29) (101) (128) Depreciation and Amortization, pre-tax (a) (81) (75) (161) (152) (301) Interest Expense, pre-tax (a) (b) (20) (32) (42) (63) (120) Income Taxes (a) (58) (32) (181) (223) (361) Operating Earnings 91 $ 110 $ 275 $ 388 $ 653 $ Gain (Loss) on NDT Fund Related Activity, pre-tax - 3 (8) 10 24 Gain (Loss) on MTM, pre-tax (c) (171) 48 (149) 14 157 Storm O&M, net of insurance recoveries, pre-tax - 45 - 172 172 Income Taxes related to Operating Earnings reconciling items (d) 69 (40) 63 (83) (150) Net Income (Loss) (11) $ 166 $ 181 $ 501 $ 856 $ ($ Millions, Unaudited) Six Months Ended June 30, June 30, Three Months Ended Reconciling Items Year-Ended December 31, |