 Forward-Looking Statements Certain of the matters discussed in this report about our and our subsidiaries' future performance, including, without limitation, future revenues, earnings, strategies, prospects, consequences and all other statements that are not purely historical constitute “forward-looking statements” within the meaning of the Private Securities Litigation Reform Act of 1995. Such forward-looking statements are subject to risks and uncertainties, which could cause actual results to differ materially from those anticipated. Such statements are based on management's beliefs as well as assumptions made by and information currently available to management. When used herein, the words “anticipate,” “intend,” “estimate,” “believe,” “expect,” “plan,” “should,” “hypothetical,” “potential,” “forecast,” “project,” variations of such words and similar expressions are intended to identify forward-looking statements. Factors that may cause actual results to differ are often presented with the forward-looking statements themselves. Other factors that could cause actual results to differ materially from those contemplated in any forward-looking statements made by us herein are discussed in filings we make with the United States Securities and Exchange Commission (SEC) including our Annual Report on Form 10-K and subsequent reports on Form 10-Q and Form 8-K and available on our website: http://www.pseg.com. These factors include, but are not limited to: • adverse changes in the demand for or ongoing low pricing of the capacity and energy that we sell into wholesale electricity markets, • adverse changes in energy industry law, policies and regulations, including market structures and transmission planning, • any inability of our transmission and distribution businesses to obtain adequate and timely rate relief and regulatory approvals from federal and state regulators, including prudency reviews, disallowances and changes in authorized returns, • any deterioration in our credit quality or the credit quality of our counterparties, • changes in federal and state environmental regulations and enforcement that could increase our costs or limit our operations, • adverse outcomes of any legal, regulatory or other proceeding, settlement, investigation or claim applicable to us and/or the energy industry, • changes in nuclear regulation and/or general developments in the nuclear power industry, including various impacts from any accidents or incidents experienced at our facilities or by others in the industry, that could limit operations or increase the cost of our nuclear generating units, • actions or activities at one of our nuclear units located on a multi-unit site that might adversely affect our ability to continue to operate that unit or other units located at the same site, • any inability to manage our energy obligations, available supply and risks, • delays or unforeseen cost escalations in our construction and development activities, or the inability to recover the carrying amount of our assets, • availability of capital and credit at commercially reasonable terms and conditions and our ability to meet cash needs, • increases in competition in energy supply markets as well as for transmission projects, • changes in technology, such as distributed generation, storage and micro grids, and greater reliance on these technologies, • changes in customer behaviors, including increases in energy efficiency, net-metering and demand response, • adverse performance of our decommissioning and defined benefit plan trust fund investments and changes in funding requirements, • any equipment failures, accidents, severe weather events or other incidents that impact our ability to provide safe and reliable service to our customers, and any inability to obtain sufficient insurance coverage or recover proceeds of insurance with respect to such events, • acts of terrorism, cybersecurity attacks or intrusions that could adversely impact our businesses, • delays in receipt of necessary permits and approvals for our construction and development activities, • any inability to achieve, or continue to sustain, our expected levels of operating performance, • changes in the cost of, or interruption in the supply of, fuel and other commodities necessary to the operation of our generating units, • an extended economic recession, • an inability to realize anticipated tax benefits or retain tax credits, • challenges associated with recruitment and/or retention of a qualified workforce, and • changes in the credit quality and the ability of lessees to meet their obligations under our domestic leveraged leases. All of the forward-looking statements made in this report are qualified by these cautionary statements and we cannot assure you that the results or developments anticipated by management will be realized or even if realized, will have the expected consequences to, or effects on, us or our business prospects, financial condition or results of operations. Readers are cautioned not to place undue reliance on these forward-looking statements in making any investment decision. Forward-looking statements made in this report apply only as of the date of this report. While we may elect to update forward-looking statements from time to time, we specifically disclaim any obligation to do so, even if internal estimates change, unless otherwise required by applicable securities laws. The forward-looking statements contained in this report are intended to qualify for the safe harbor provisions of Section 27A of the Securities Act of 1933, as amended, and Section 21E of the Securities Exchange Act of 1934, as amended. EXHIBIT 99 2 |
 GAAP Disclaimer These materials and other financial releases can be found on the pseg.com website under the investor tab, or at http://investor.pseg.com/ PSEG presents Operating Earnings and Adjusted Earnings Before Interest, Taxes, Depreciation and Amortization (EBITDA) in addition to its Net Income reported in accordance with accounting principles generally accepted in the United States (GAAP). Operating Earnings and Adjusted EBITDA are non-GAAP financial measures that differ from Net Income. Operating Earnings exclude gains or losses associated with Nuclear Decommissioning Trust (NDT), Mark-to-Market (MTM) accounting, and material one-time items. Adjusted EBITDA excludes the same items as our Operating Earnings measure as well as income tax expense, interest expense, depreciation and amortization and major maintenance expense costs at Power’s fossil generation facilities. The last two slides in this presentation (Slides A and B) include a list of items excluded from Net Income to reconcile to Operating Earnings and Adjusted EBITDA with a reference to that slide included on each of the slides where the non-GAAP information appears. Management uses Operating Earnings and Adjusted EBITDA in its internal analysis, and in communications with investors and analysts, as a consistent measure for comparing PSEG’s financial performance to previous financial results. The presentation of Operating Earnings and Adjusted EBITDA is intended to complement, and should not be considered an alternative to, the presentation of Net Income, which is an indicator of financial performance determined in accordance with GAAP. In addition, Operating Earnings and Adjusted EBITDA as presented in this release may not be comparable to similarly titled measures used by other companies. Due to the forward looking nature of Operating Earnings and Adjusted EBITDA guidance, PSEG is unable to reconcile these non- GAAP financial measures to the most directly comparable GAAP financial measure. Management is unable to project certain reconciling items, in particular MTM and NDT gains (losses), for future periods due to market volatility. 3 |
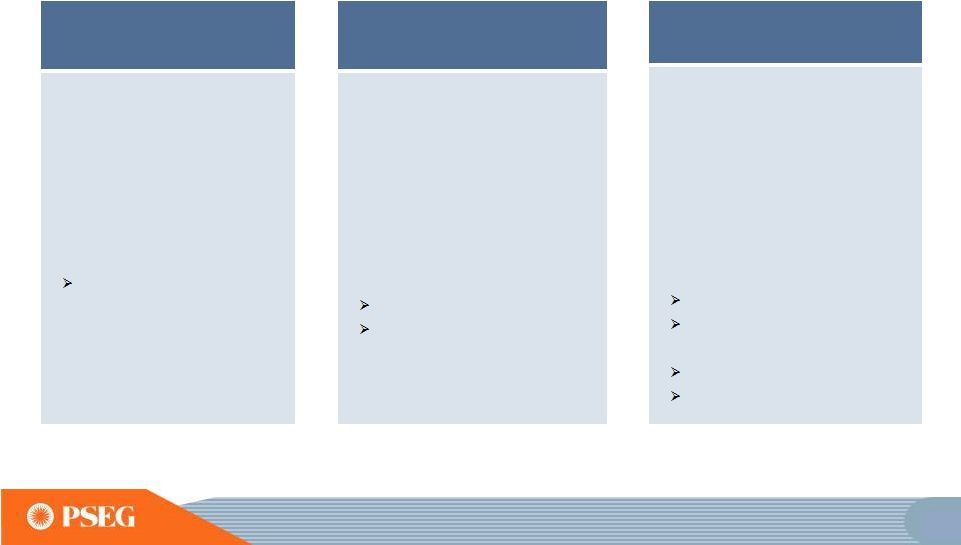
 Operational Excellence: Maintaining reliability and improving performance as we control costs in low price environment Financial Strength: Strong financial position supports investment program and dividend growth Disciplined Investment: • Balanced business mix • Robust pipeline of opportunities Results: • 3 rd year of Operating EPS* growth • Continued dividend growth • Best in class utility growth rate • Addition of efficient CCGT capacity enhances market position DISCIPLINED INVESTMENT DISCIPLINED INVESTMENT OPERATIONAL EXCELLENCE OPERATIONAL EXCELLENCE FINANCIAL STRENGTH FINANCIAL STRENGTH ENGAGED WORKFORCE ENGAGED WORKFORCE PSEG’s Strategy Investment program delivering results * SECOND YEAR OF EPS GROWTH. 6 |
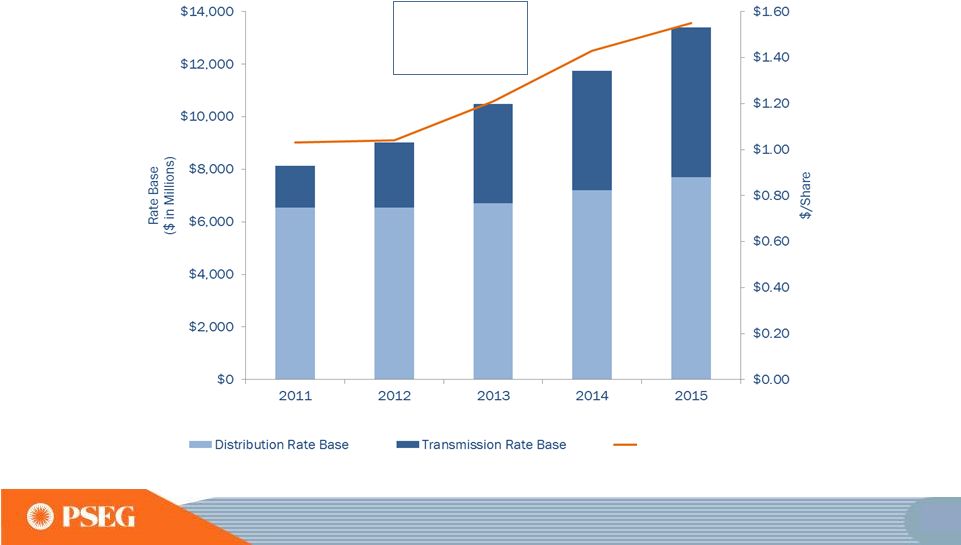 PSE&G’s investment program Meeting public policy goals and customer needs PSE&G Rate Base and Earnings * DISTRIBUTION RATE BASE INCLUDES SOLAR AND ENERGY EFFICIENCY 2011-2015 EPS CAGR: 11% PSE&G Earnings 11 |
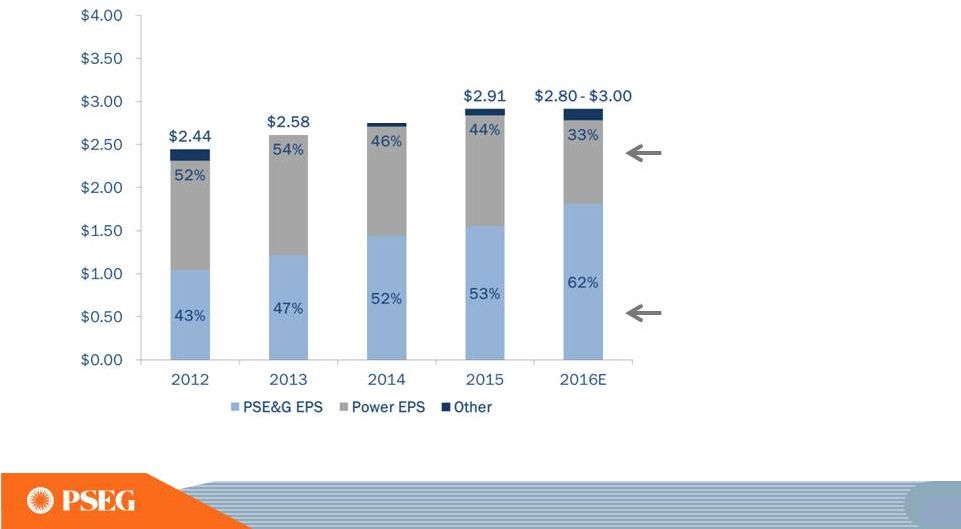 Operating Earnings Disciplined investment program and focus on operational excellence have supported growth Power’s diverse fuel mix and dispatch flexibility continue to generate strong earnings and free cash flow in low price environment PSE&G’s investment program has resulted in an increased contribution to PSEG’s earnings *SEE SLIDE A FOR ITEMS EXCLUDED FROM INCOME FROM CONTINUING OPERATIONS/NET INCOME TO RECONCILE TO OPERATING EARNINGS. E=ESTIMATE ** 2016 PERCENTS USE MIDPOINT OF 2016 OPERATING EARNINGS GUIDANCE. Operating Earnings* Contribution by Subsidiary ** ** 14 $2.76 |
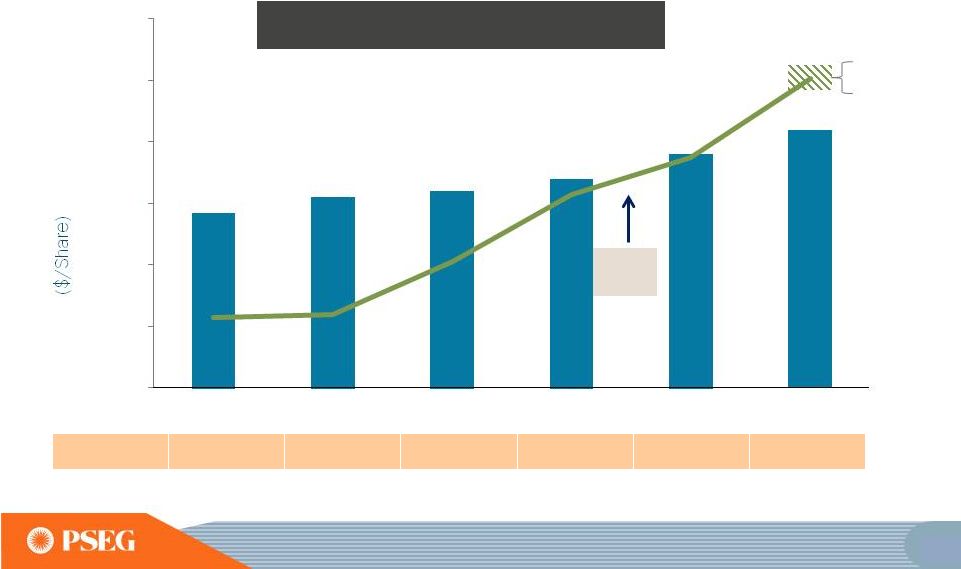
 Achieved ~11% annual earnings growth over the past four years through implementation of supportive rate mechanisms on our expanded capital program and cost control $1.03 $1.04 $1.21 $1.43 $1.55 2011 2012 2013 2014 2015 PSE&G Earnings Per Share 24 |
 Increasing investment across our portfolio Transmission • Large portfolio of projects to meet ongoing reliability and life-cycle requirements Electric Distribution • Base spending • Infrastructure investment programs with clause recovery Energy Strong (ES) and related programs Electric System Modernization Program (ESMP) Gas Distribution • Base spending • Infrastructure investment programs with clause recovery Energy Strong (ES) and related programs Gas System Modernization Program (GSMP) Solar and Energy Efficiency • Recently filed with NJBPU to extend our successful Solar 4 All program, with a request to invest an additional ~$240 million to develop an additional 100 MW dc of grid-connected solar capacity on landfills and brownfields by year-end 2021 26 |
 Solar – Investment supports New Jersey policy objectives which have evolved with focus on utility-scale landfill solar Program • Solar Loan I, II & III • Solar 4 All (S4A) • S4A Extension • Solar Loan III • S4A Extension Requested S4A Extension (for additional 100 MW dc ) focused on landfill and brownfield sites Investment ~$545M ~$140M May 2016 request to invest ~$240M in a multi-year program ROE / Recovery mechanism 9.75% - 10.3% Clause recovery 9.75% Clause recovery TBD Clause recovery 2011 – 2015 2016 – 2020 (base) Incremental to base – Emergent and ongoing 31 |
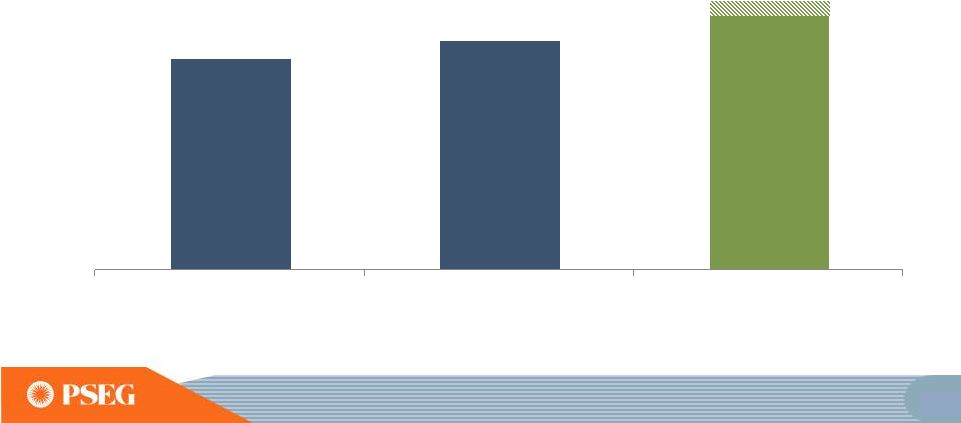 PSE&G’s 2016 earnings updated to reflect first-half 2016 results, expanded investment programs and cost control over the balance of the year $725 $787 2014 2015 2016 Guidance PSE&G Earnings ($ Millions) $900 -- $935E E =ESTIMATE. UPDATED AS OF JULY 29, 2016, 37 |
 Nuclear is a critical element of our success Hope Creek • Operated by PSEG Nuclear • PSEG Ownership: 100% • Technology: Boiling Water Reactor • Total Capacity: 1,176 MW • Owned Capacity: 1,176 MW • License Expiration: 2046 • Next Refueling Fall 2016 • Uprate 18MW Spring 2018 Salem Units 1 and 2 • Operated by PSEG Nuclear • PSEG Ownership: 57% • Technology: Pressurized Water Reactor • Total Capacity: 2,294 MW • Owned Capacity: 1,317 MW • License Expiration: 2036 and 2040 • Next Refueling Unit 1 – Fall 2017 Unit 2 – Spring 2017 Peach Bottom Units 2 and 3 • Operated by Exelon • PSEG Ownership: 50% • Technology: Boiling Water Reactor • Total Capacity: 2,502 MW • Owned Capacity: 1,251 MW • License Expiration: 2033 and 2034 • Next Refueling Unit 2 – Fall 2016 Unit 3 – Fall 2017 • Uprate: 130 MW (PS Share) Unit 2 – March 2015 Unit 3 – December 2015 52 |
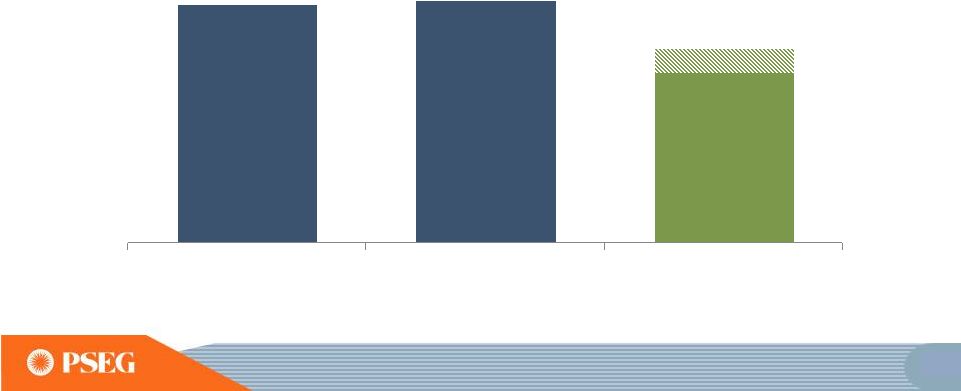 Power’s 2016 operating earnings range adjusted to incorporate results from the first half of 2016 Power Operating Earnings* ($ Millions) 2014 2015 2016 Guidance $642 $653 $460 – $525E *SEE SLIDE A FOR ITEMS EXCLUDED FROM NET INCOME TO RECONCILE TO OPERATING EARNINGS. E = ESTIMATE. UPDATED AS OF JULY 29, 2016. Net Income $760 Net Income $856 58 |
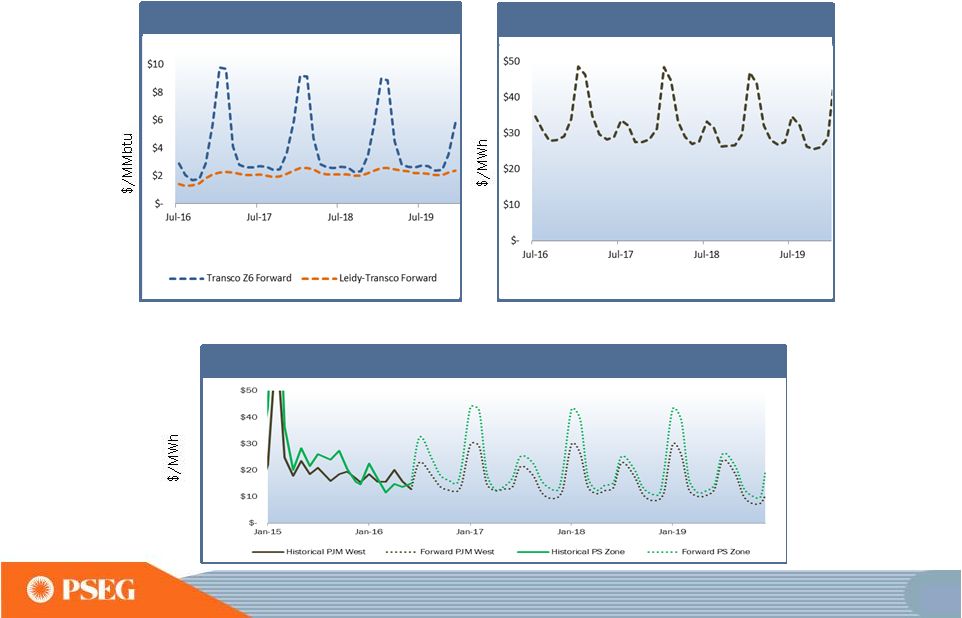 Market Review: YTD 2016 impacted by weather but forward gas and electric prices retain seasonal volatility FORWARDS AS OF JULY 25, 2016 PJM West vs. PS Zone Spark Spreads (2015-2019) 2016 - 2019 Z6 2016 - 2019 PJM West RTC 62 |
 HEDGE PERCENTAGES AND PRICES AS OF JUNE 30, 2016. UPDATED WITH 2016 BGS AUCTION RESULTS. REVENUES OF FULL REQUIREMENT LOAD DEALS BASED ON CONTRACT PRICE, INCLUDING RENEWABLE ENERGY CREDITS, ANCILLARY, AND TRANSMISSION COMPONENTS BUT EXCLUDING CAPACITY. HEDGES INCLUDE POSITIONS WITH MTM ACCOUNTING TREATMENT AND OPTIONS. Hedging Strategy: Designed to protect gross margin while leveraging the portfolio 70 Jul-Dec 2016 2017 2018 Volume TWh 17 36 36 Base Load % Hedged 100% 80-85% 40-45% (Nuclear and Base Load Coal) Price $/MWh $50 $48 $46 Volume TWh 8 18 23 Intermediate Coal, Combined % Hedged 30-35% 0% 0% Cycle, Peaking Price $/MWh $50 - - Volume TWh 25-26 53-55 58-60 Total % Hedged 75-80% 55-60% 25-30% Price $/MWh $50 $48 $46 |
 PSEG Operating Results $ Millions (except EPS) 2012 2013 2014 2015 2016E Guidance PSE&G $528 $612 $725 $787 $900 - $935 PSEG Power* $663 $710 $642 $653 $460 - $525 Enterprise/Other $45 ($13) $33 $36 $65 Operating Earnings* $1,236 $1,309 $1,400 $1,476 $1,425 - $1,525 Operating EPS* $2.44 $2.58 $2.76 $2.91 $2.80 - $3.00E Net Income $1,275 $1,243 $1,518 $1,679 EPS $2.51 $2.45 $2.99 $3.30 % YOY Increase – PSE&G 15.9% 18.5% 8.6% 16.6% 1 % Regulated Earnings 43% 47% 52% 53% 62% 1 A higher regulated earnings mix due to growth in PSE&G earnings with a significant contribution from Power *SEE SLIDE A FOR ITEMS EXCLUDED FROM NET INCOME TO RECONCILE TO OPERATING EARNINGS. 1 - BASED ON MID-POINT OF 2016 OPERATING EARNINGS GUIDANCE. E= ESTIMATE UPDATED AS OF JULY 29, 2016. 77 |
 Strong financial position to support our business initiatives in 2016 and beyond 2016 and Beyond Earnings Continuing strong earnings trend in 2016 with guidance of $2.80 to $3.00 per share Investment Deploying significant capital at PSE&G for projects with contemporaneous returns Pursuing Power projects that satisfy risk adjusted return targets Cash Flow and Credit Metrics Continuing strong internal cash flow aided by bonus depreciation Funding investment program without equity issuance Dividends Providing $0.08 per share dividend increase in 2016 with opportunity for consistent and sustainable growth 78 |
 PSE&G EPS Annual Dividend Per Share (2011-2016 CAGR: 3.7%) Opportunity for meaningful and sustainable dividend growth given significant contribution from PSE&G earnings and Power’s strong financial profile Payout Ratio 50% 58% 56% 54% 54% 57% (1) 88 $1.84E $1.77E $1.64 $1.37 $1.42 $1.44 $1.48 $1.56 $0.80 $1.00 $1.20 $1.40 $1.60 $1.80 $2.00 2011 2012 2013 2014 2015 2016E (1) THE 2016 PAYOUT RATIO IS BASED ON THE MIDPOINT OF PSEG'S 2016 OPERATING EARNINGS GUIDANCE OF $2.80-$3.00E PER SHARE. SEE SLIDE A FOR ITEMS EXCLUDED FROM INCOME FROM CONTINUING OPERATIONS/NET INCOME TO RECONCILE TO OPERATING EARNINGS. E=ESTIMATE |
 PSEG Summary • 2015 Operating Earnings of $2.91 were at the upper end of our upwardly revised guidance of $2.85 - $2.95 per share • Forecast high single-digit rate base growth at PSE&G on five year basis from 2015 to 2020, driven by investment in transmission and approved programs • Power’s investment program and continued focus on operational excellence with financial strength delivers value in current price environment • Strong Balance Sheet and Cash Flow support current capital program and investment in new opportunities without the need for equity • Our indicative $0.08 dividend per share increase for 2016 is consistent with our long history of returning cash to the shareholder through the common dividend, with opportunity for consistent and sustainable growth 90 |
 PSEG Financial Highlights * SEE SLIDE B FOR ITEMS EXCLUDED FROM NET INCOME TO RECONCILE TO OPERATING EARNINGS. Maintaining full-year 2016 Operating Earnings guidance of $2.80 - $3.00 per share* Reaching the upper end of our guidance range in 2016 will be difficult even with improvements seen in the power markets, expectations for warm summer weather, normal operations and management of O&M Focused on meeting customer needs for clean, reliable, efficient delivery of energy Infrastructure Spend PSE&G capital spending on T&D for 2016 expected to top $3 billion PSE&G’s Gas System Modernization Program (GSMP) and Energy Strong continue Keys and Sewaren CCGTs construction is on schedule and on budget PSE&G has identified more than $500 million of additional infrastructure spend over the current capital spending plan of $12 billion in the 2016-2020 period Financial position remains strong Positive cash from Power and increasing cash flow from operations at PSE&G supports dividend growth and funds capital spending program without the need to issue equity Debt as a percentage of capitalization was 45% at June 30 99 |
 June 30, 2016 $ Billions PSEG PSE&G Power Cash and Cash Equivalents $0.6 $0.2 $0.0 Short Term Debt $0.0 $0.0 N/A Long Term Debt (2) 10.9 7.5 2.9 Common Equity 13.3 8.0 6.3 Total Capitalization $24.2 $15.5 $9.2 Total Debt / Capitalization 45% 48% 32% PSE&G Regulated Equity Ratio (1) 51.4% Our balance sheet remains strong (1) REGULATED EQUITY RATIO INCLUDES CUSTOMER DEPOSITS OF ~$96 MILLION AND EXCLUDES SHORT-TERM DEBT. (2) INCLUDES L-T DEBT DUE WITHIN 1 YEAR; EXCLUDES NON-RECOURSE DEBT OF $7 MILLION. 102 |
 PSEG Energy Holdings Investment Portfolio Equipment Investment Balance * at 06/30/16 ($millions) Merchant Energy Leases NRG REMA Keystone, Conemaugh & Shawville (PA) 3 coal-fired plants (1,162 equity MW) $ 355 NRG Energy, Inc. / Midwest Gen** Powerton & Joliet Generating Stations (IL) 2 coal-fired generating facilities (1,640 equity MW) $ 218 Regulated Energy Leases Merrill Creek Reservoir in NJ (PECO, MetEd, Delmarva Power & Light) $ 159 Grand Gulf Nuclear station in Mississippi (175 equity MW) $ 13 Real Estate Leveraged Leases GM Renaissance Center; Wal-Marts $ 58 Real Estate Operating Leases Office Towers, Shopping Centers - 26 properties $ 32 Other Land $ 5 Total Holdings Investments $840 * BOOK BALANCE EXCLUDING DEFERRED TAX ACCOUNTS **EME AND ITS SUBSIDIARIES FILED CHAPTER 11 BANKRUPTCY ON 12/17/2012. EME WAS ACQUIRED BY NRG ON APRIL 1 2014. 104 |
 Items Excluded from Income from Continuing Operations/Net Income to Reconcile to Operating Earnings PLEASE SEE PAGE 3 FOR AN EXPLANATION OF PSEG’S USE OF OPERATING EARNINGS AS A NON-GAAP FINANCIAL MEASURE AND HOW IT DIFFERS FROM NET INCOME. A 2015 2014 2013 2012 Operating Earnings 1,476 $ 1,400 $ 1,309 $ 1,236 $ Gain (Loss) on Nuclear Decommissioning Trust (NDT) Fund Related Activity, pre-tax (PSEG Power) 24 138 86 104 Gain (Loss) on Mark-to-Market (MTM), pre-tax (a) (PSEG Power) 157 111 (125) (18) Storm O&M, net of insurance recoveries, pre-tax (PSEG Power) 172 (27) (54) (66) Lease Transaction Activity, pre-tax (PSEG Enterprise/Other) - - - 61 Income Taxes related to Operating Earnings reconciling items (b) (150) (104) 27 (42) Net Income 1,679 $ 1,518 $ 1,243 $ 1,275 $ Fully Diluted Average Shares Outstanding (in Millions) 508 508 508 507 Operating Earnings 2.91 $ 2.76 $ 2.58 $ 2.44 $ Gain (Loss) on NDT Fund Related Activity (PSEG Power) 0.05 0.27 0.17 0.21 Gain (Loss) on Mark-to-Market (MTM), pre-tax (a) (PSEG Power) 0.31 0.22 (0.25) (0.04) Storm O&M, net of insurance recoveries, pre-tax (PSEG Power) 0.34 (0.05) (0.11) (0.13) Lease Transaction Activity, pre-tax (PSEG Enterprise/Other) - - - 0.12 Income Taxes related to Operating Earnings reconciling items (b) (0.31) (0.21) 0.06 (0.09) Net Income 3.30 $ 2.99 $ 2.45 $ 2.51 $ (a) Includes the financial impact from positions with forward delivery months. (b) Income tax effect calculated at 40.85% statutory rate, plus 20% tax on income (losses) from qualified NDT funds. ($ Per Share Impact - Diluted, Unaudited) Consolidated Operating Earnings Reconciliation PUBLIC SERVICE ENTERPRISE GROUP INCORPORATED Reconciling Items For the Year Ended December 31, ($ Million, Unaudited) |
 Items Excluded from Income from Continuing Operations/Net Income to Reconcile to Operating Earnings PLEASE SEE PAGE 3 FOR AN EXPLANATION OF PSEG’S USE OF OPERATING EARNINGS AS A NON-GAAP FINANCIAL MEASURE AND HOW IT DIFFERS FROM NET INCOME. B 2016 2015 2016 2015 2015 2014 Operating Earnings 289 $ 289 $ 752 $ 818 $ 1,476 $ 1,400 $ Gain (Loss) on Nuclear Decommissioning Trust (NDT) Fund Related Activity, pre-tax (PSEG Power) - 3 (8) 10 24 138 Gain (Loss) on Mark-to-Market (MTM), pre-tax (a) (PSEG Power) (171) 48 (149) 14 157 111 Storm O&M, net of insurance recoveries, pre-tax (PSEG Power) - 45 - 172 172 (27) Income Taxes related to Operating Earnings reconciling items (b) 69 (40) 63 (83) (150) (104) Net Income 187 $ 345 $ 658 $ 931 $ 1,679 $ 1,518 $ Fully Diluted Average Shares Outstanding (in Millions) 508 508 508 508 508 508 Operating Earnings 0.57 $ 0.57 $ 1.48 $ 1.61 $ 2.91 $ 2.76 $ Gain (Loss) on NDT Fund Related Activity, pre-tax (PSEG Power) - 0.01 (0.01) 0.02 0.05 0.27 Gain (Loss) on MTM, pre-tax (a) (PSEG Power) (0.34) 0.09 (0.29) 0.02 0.31 0.22 Storm O&M, net of insurance recoveries, pre-tax (PSEG Power) - 0.09 - 0.34 0.34 (0.05) Income Taxes related to Operating Earnings reconciling items (b) 0.14 (0.08) 0.12 (0.16) (0.31) (0.21) Net Income 0.37 $ 0.68 $ 1.30 $ 1.83 $ 3.30 $ 2.99 $ (a) Includes the financial impact from positions with forward delivery months. (b) Income tax effect calculated at 40.85% statutory rate, plus 20% tax on income (losses) from qualified NDT funds. ($ Millions, Unaudited) ($ Per Share Impact - Diluted, Unaudited) PUBLIC SERVICE ENTERPRISE GROUP INCORPORATED Consolidated Operating Earnings Reconciliation Year-Ended June 30, December 31, Six Months Ended June 30, Three Months Ended Reconciling Items |