 Public Service Enterprise Group PSEG Earnings Conference Call 3rd Quarter 2016 October 31, 2016 EXHIBIT 99.1 |
1 Forward-Looking Statements Certain of the matters discussed in this report about our and our subsidiaries' future performance, including, without limitation, future revenues, earnings, strategies, prospects, consequences and all other statements that are not purely historical constitute “forward-looking statements” within the meaning of the Private Securities Litigation Reform Act of 1995. Such forward-looking statements are subject to risks and uncertainties, which could cause actual results to differ materially from those anticipated. Such statements are based on management's beliefs as well as assumptions made by and information currently available to management. When used herein, the words “anticipate,” “intend,” “estimate,” “believe,” “expect,” “plan,” “should,” “hypothetical,” “potential,” “forecast,” “project,” variations of such words and similar expressions are intended to identify forward-looking statements. Factors that may cause actual results to differ are often presented with the forward-looking statements themselves. Other factors that could cause actual results to differ materially from those contemplated in any forward-looking statements made by us herein are discussed in filings we make with the United States Securities and Exchange Commission (SEC) including our Annual Report on Form 10-K and subsequent reports on Form 10-Q and Form 8-K and available on our website: http://www.pseg.com. These factors include, but are not limited to: • adverse changes in the demand for or ongoing low pricing of the capacity and energy that we sell into wholesale electricity markets, • adverse changes in energy industry law, policies and regulations, including market structures and transmission planning, • any inability of our transmission and distribution businesses to obtain adequate and timely rate relief and regulatory approvals from federal and state regulators, including prudency reviews, disallowances and changes in authorized returns, • any deterioration in our credit quality or the credit quality of our counterparties, • changes in federal and state environmental regulations and enforcement that could increase our costs or limit our operations, • adverse outcomes of any legal, regulatory or other proceeding, settlement, investigation or claim applicable to us and/or the energy industry, • changes in nuclear regulation and/or general developments in the nuclear power industry, including various impacts from any accidents or incidents experienced at our facilities or by others in the industry, that could limit operations or increase the cost of our nuclear generating units, • actions or activities at one of our nuclear units located on a multi-unit site that might adversely affect our ability to continue to operate that unit or other units located at the same site, • any inability to manage our energy obligations, available supply and risks, • delays or unforeseen cost escalations in our construction and development activities, or the inability to recover the carrying amount of our assets, • availability of capital and credit at commercially reasonable terms and conditions and our ability to meet cash needs, • increases in competition in energy supply markets as well as for transmission projects, • changes in technology, such as distributed generation, storage and micro grids, and greater reliance on these technologies, • changes in customer behaviors, including increases in energy efficiency, net-metering and demand response, • adverse performance of our decommissioning and defined benefit plan trust fund investments and changes in funding requirements, • any equipment failures, accidents, severe weather events or other incidents that impact our ability to provide safe and reliable service to our customers, and any inability to obtain sufficient insurance coverage or recover insurance proceeds with respect to such events, • acts of terrorism, cybersecurity attacks or intrusions that could adversely impact our businesses, • delays in receipt of necessary permits and approvals for our construction and development activities, • any inability to achieve, or continue to sustain, our expected levels of operating performance, • changes in the cost of, or interruption in the supply of, fuel and other commodities necessary to the operation of our generating units, • economic recessions, • an inability to realize anticipated tax benefits or retain tax credits, • challenges associated with recruitment and/or retention of a qualified workforce, and • changes in the credit quality and the ability of lessees to meet their obligations under our domestic leveraged leases. All of the forward-looking statements made in this report are qualified by these cautionary statements and we cannot assure you that the results or developments anticipated by management will be realized or even if realized, will have the expected consequences to, or effects on, us or our business prospects, financial condition or results of operations. Readers are cautioned not to place undue reliance on these forward-looking statements in making any investment decision. Forward-looking statements made in this report apply only as of the date of this report. While we may elect to update forward-looking statements from time to time, we specifically disclaim any obligation to do so, even if internal estimates change, unless otherwise required by applicable securities laws. The forward-looking statements contained in this report are intended to qualify for the safe harbor provisions of Section 27A of the Securities Act of 1933, as amended, and Section 21E of the Securities Exchange Act of 1934, as amended. |
 2 GAAP Disclaimer PSEG presents Operating Earnings and Adjusted Earnings Before Interest, Taxes, Depreciation and Amortization (EBITDA) in addition to its Net Income reported in accordance with accounting principles generally accepted in the United States (GAAP). Operating Earnings and Adjusted EBITDA are non-GAAP financial measures that differ from Net Income. Operating Earnings exclude gains or losses associated with Nuclear Decommissioning Trust (NDT), Mark-to-Market (MTM) accounting, and material one-time items. Adjusted EBITDA excludes the same items as our Operating Earnings measure as well as income tax expense, interest expense, depreciation and amortization and major maintenance expense costs at Power’s fossil generation facilities. The last two slides in this presentation (Slides A and B) include a list of items excluded from Net Income to reconcile to Operating Earnings and Adjusted EBITDA with a reference to that slide included on each of the slides where the non-GAAP information appears. Management uses Operating Earnings in its internal analysis, and in communications with investors and analysts, as a consistent measure for comparing PSEG’s financial performance to previous financial results. Management believes Adjusted EBITDA is useful to investors and other users of our financial statements in evaluating operating performance because it provides them with an additional tool to compare business performance across companies and across periods. Management also believes that Adjusted EBITDA is widely used by investors to measure operating performance without regard to items such as income tax expense, interest expense, depreciation and amortization and major maintenance expense at Power’s fossil generation facilities, which can vary substantially from company to company depending upon, among other things, the book value of assets, capital structure, whether assets were constructed or acquired and accounting methods. Adjusted EBITDA also allows investors and other users to assess the underlying financial performance of our fleet before management’s decision to deploy capital. The presentation of Operating Earnings and Adjusted EBITDA is intended to complement, and should not be considered an alternative to, the presentation of Net Income, which is an indicator of financial performance determined in accordance with GAAP. In addition, Operating Earnings and Adjusted EBITDA as presented in this release may not be comparable to similarly titled measures used by other companies. Due to the forward looking nature of Operating Earnings and Adjusted EBITDA guidance, PSEG is unable to reconcile these non-GAAP financial measures to the most directly comparable GAAP financial measure. Management is unable to project certain reconciling items, in particular MTM and NDT gains (losses), for future periods due to market volatility. These materials and other financial releases can be found on the PSEG website at www.pseg.com , under the investor tab. From time to time, PSEG, PSE&G and PSEG Power release important information via postings on their corporate website at http://investor.pseg.com. Investors and other interested parties are encouraged to visit the corporate website to review new postings. The “email alerts” link at http://investor.pseg.com may be used to enroll to receive automatic email alerts and/or really simple syndication (RSS) feeds regarding new postings at http://investor.pseg.com/rss . |
 PSEG 2016 Q3 Review Ralph Izzo Chairman, President and Chief Executive Officer |
 4 Q3 Results Summary – Strong quarterly results Quarter ended September 30 * See Slide A for Items excluded from Net Income to reconcile to Operating Earnings (non-GAAP). $ millions (except EPS) 2016 2015 Net Income $ 327 $ 439 Reconciling Items 117 (36) Operating Earnings (non-GAAP)* $ 444 $ 403 EPS from Net Income $ 0.64 $ 0.87 EPS from Operating Earnings (non-GAAP)* $ 0.88 $ 0.80 |
 5 Year to Date Results Nine months ended September 30 * See Slide A for Items excluded from Net Income to reconcile to Operating Earnings (non-GAAP). $ millions (except EPS) 2016 2015 Net Income $ 985 $ 1,370 Reconciling Items 211 (149) Operating Earnings (non-GAAP)* $ 1,196 $ 1,221 EPS from Net Income $ 1.94 $ 2.70 EPS from Operating Earnings (non-GAAP)* $ 2.36 $ 2.41 |
 6 PSEG – Q3 2016 Highlights Operating Results in Q3 Net Income of $0.64 vs. $0.87 per share in Q3 2015 Operating Earnings (non-GAAP) of $0.88 vs. $0.80 per share in Q3 2015* Increased earnings contribution from PSE&G’s investment in Transmission Updating 2016 Operating Earnings (non-GAAP) guidance to $2.80 - $2.95 per share Operating Review PSEG Power generation met demand of the hottest summer weather in our 37 years of data Returned Salem units in late July following refueling and baffle bolt repairs at Unit 1 and transformer issues at Unit 2 PSE&G maintained high system reliability throughout extreme summer conditions PSEG Disciplined Capital Investment PSE&G identified >$600 million year to date of additional capital opportunities through 2020 Recent Solar 4 All Extension II settlement to invest $80 million over 3 years Power’s construction of Keys/Sewaren/Bridgeport Harbor CCGTs continue on schedule and on budget Market developments PSEG Power announced retirement of the Hudson and Mercer generating stations (totaling ~1,250 MW) planned for mid-2017 expected to improve its cash flow and return profile Energy Holdings recorded an impairment of $86 million (after-tax) related to the NRG REMA, LLC leveraged leases residual value * See Slide A for Items excluded from Net Income to reconcile to Operating Earnings (non-GAAP). |
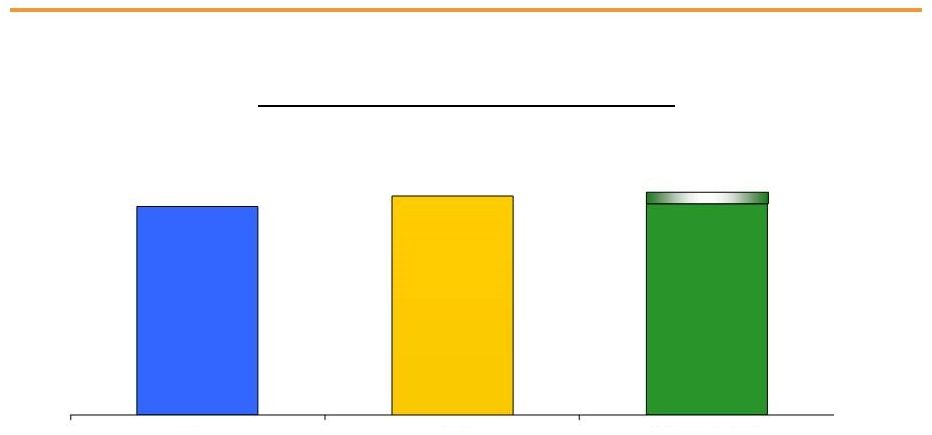 7 $2.80 - $2.95E PSEG Updating 2016 Full-Year Guidance $2.76 * See Slide A for Items excluded from Net Income to reconcile to Operating Earnings (non-GAAP). E = Estimate. $2.91 Operating Earnings* (non-GAAP) Guidance Strong third quarter results were not sufficient to offset the lack of a winter 2014 2015 2016 Guidance |
 PSEG 2016 Q3 Operating Company Review Dan Cregg EVP and Chief Financial Officer |
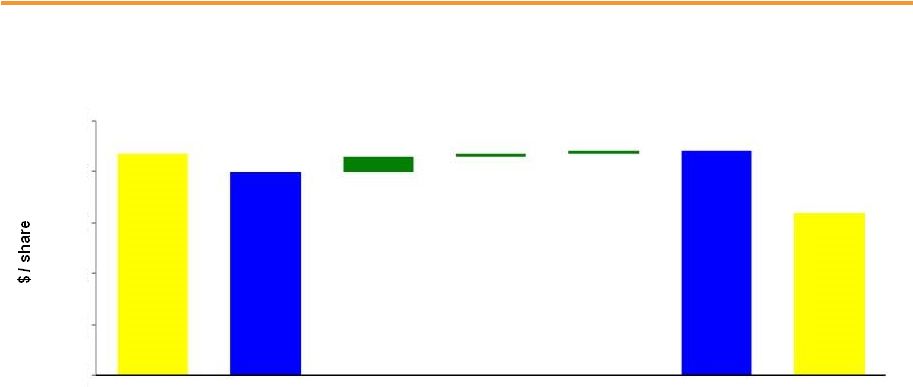 9 PSEG EPS Reconciliation – Q3 2016 versus Q3 2015 Q3 2016 Net Income Q3 2015 Net Income PSEG Power PSE&G Enterprise/ Other * See Slide A for Items excluded from Net Income to reconcile to Operating Earnings (non-GAAP). Re-Contracting/ Lower Prices/Gas Volumes (0.02) Lower Volume (0.01) O&M 0.03 Interest 0.01 D&A (0.01) Other 0.01 Transmission 0.03 Distribution Margin 0.02 Weather 0.01 Distribution O&M and D&A (0.02) Taxes and Other 0.02 Q3 2015 Operating Earnings (non-GAAP)* Q3 2016 Operating Earnings (non-GAAP)* PSEG-LI and Other $0.87 0.06 0.01 0.01 $0.80 $0.88 $0.64 1.00 0.80 0.60 0.40 0.20 0.00 |
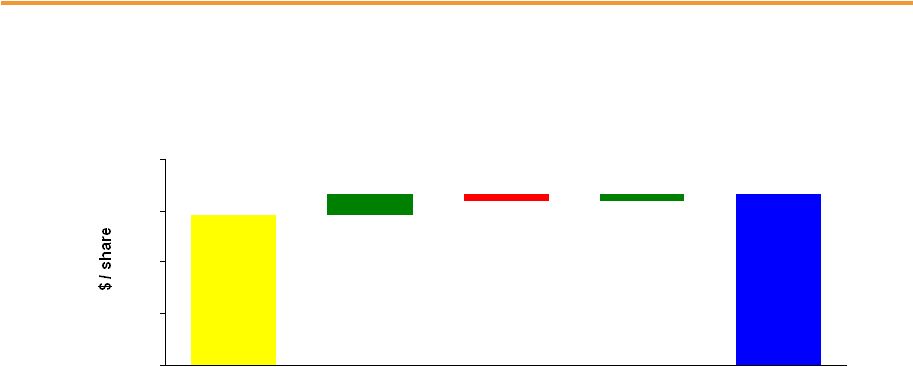
 10 0.00 0.50 1.00 1.50 2.00 2.50 3.00 PSEG EPS Reconciliation – YTD 2016 versus YTD 2015 YTD 2016 YTD 2016 Operating Earnings (non-GAAP)* YTD 2015 Net Income Re-Contracting/ Lower Prices/ Gas Volumes (0.11) Lower Gas Send- Out and Fixed Cost Recovery (0.14) Capacity (0.05) Volume (0.05) O&M 0.15 Interest 0.03 D&A (0.01) Absence of 2015 Tax Credits and Other (0.04) PSEG Power Transmission 0.09 Distribution Margin 0.02 Weather (0.01) Distribution O&M and D&A (0.05) Taxes and Other 0.08 PSE&G Enterprise/ Other PSEG-LI, Taxes and Other * See Slide A for Items excluded from Net Income to reconcile to Operating Earnings (non-GAAP). Net Income YTD 2015 Operating Earnings (non-GAAP)* $2.70 0.13 (0.22) 0.04 $2.41 $2.36 $1.94 |
 PSE&G 2016 Q3 Review |
 12 PSE&G – Q3 Summary of Results $ millions (except EPS) Q3 2016 Q3 2015 Variance Operating Revenues $ 1,684 $ 1,766 $ (82) Operating Expenses Energy Costs 721 740 (19) Operation & Maintenance 376 391 (15) Depreciation & Amortization 137 231 (94) Total Operating Expenses 1,234 1,362 (128) Net Income $ 255 $ 222 $ 33 EPS from Net Income $ 0.50 $ 0.44 $ 0.06 PSEG Operating Earnings (non-GAAP) do not include any adjustments related to PSE&G’s operations. |
 13 $0.44 0.06 0.02 $0.50 (0.02) 0.00 0.15 0.30 0.45 0.60 PSE&G EPS Reconciliation – Q3 2016 versus Q3 2015 Q3 2016 Net Income Q3 2015 Net Income Transmission 0.03 Electric Demand and Volume 0.02 Weather 0.01 O&M (0.01) D&A (0.01) Taxes 0.03 Other (0.01) Continued investment in system reliability is a driver of growth |
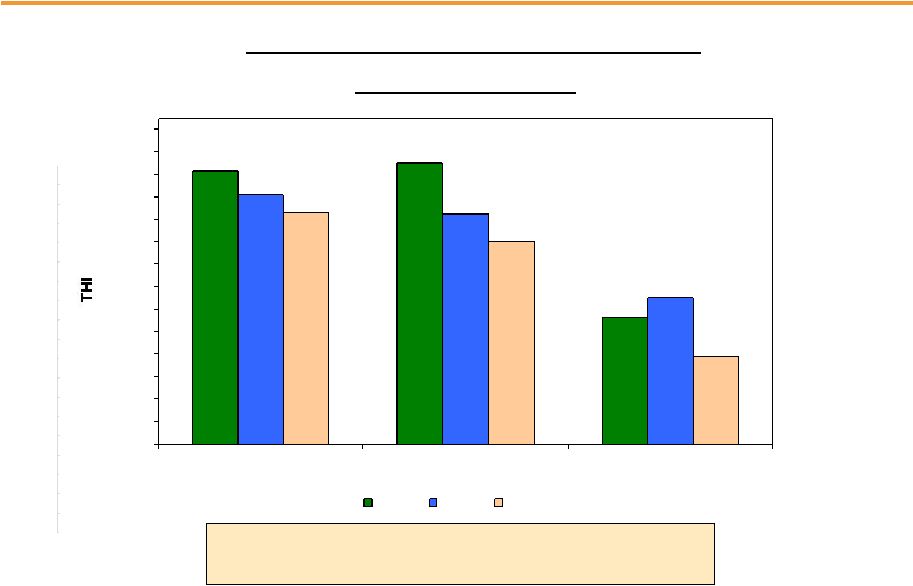 14 PSE&G – Monthly Summer Weather Data 6,068 6,254 2,818 5,548 5,106 3,242 5,151 4,521 1,930 0 500 1,000 1,500 2,000 2,500 3,000 3,500 4,000 4,500 5,000 5,500 6,000 6,500 7,000 July August September 2016 2015 Normal 2016 vs. 2015 vs. Normal PSE&G Monthly Temperature Humidity Index (THI) Q3 2016 temperature-humidity index was ~9% higher than Q3 2015 and ~30% higher than normal |
 15 PSE&G – Q3 Operating Highlights Solar 4 All Extension II settlement reached with BPU Staff and Division of Rate Counsel to invest $80 million over 3 years to develop 33 MWs of grid-connected, landfill and brownfield solar Proposal filed with the BPU for NJ Transit investment partnership to develop a new $270 million substation FERC Formula Rate filing submitted for ~$121 million in increased annual transmission revenue for new rates effective January 2017 PSE&G lowered residential gas rates for the 7 th straight year on 10/1; since 2009, average residential heating bills have declined by 51% PSE&G made ~$2.1 billion of capital expenditures in the YTD period ended September 30, as part of its planned spend of ~$3 billion for the full year Maintaining PSE&G’s forecast of 2016 full-year Net Income at $900 - $935 million Growth in transmission revenues added $0.03 per share over Q3 2015 Q3 2016 electric sales up ~4% on weather that was 9% warmer than Q3 2015 and 30% warmer than normal; Q3 was the hottest in the last 37 years of weather data Weather normalized electric sales advanced 0.1% in Q3 and were down (0.8%) for the YTD period O&M remains under control Operations Regulatory and Market Environment Financial |
 PSEG Power 2016 Q3 Review |
 17 PSEG Power – Q3 Summary of Results $ millions (except EPS) Q3 2016 Q3 2015 Variance Operating Revenues $ 1,075 $ 1,096 $ (21) Net Income 139 206 (67) Reconciling Items 31 (36) 67 Operating Earnings (non-GAAP)* $ 170 $ 170 $ - EPS from Net Income $ 0.27 $ 0.40 $ (0.13) EPS from Operating Earnings (non-GAAP)* $ 0.34 $ 0.33 $ 0.01 * See Slide A for Items excluded from Net Income to reconcile to Operating Earnings (non-GAAP). |
 18 $0.40 $0.33 0.03 0.01 $0.34 (0.03) $0.27 0.00 0.10 0.20 0.30 0.40 0.50 Re-Contracting/ Lower Prices (0.02) Lower Volume (0.01) PSEG Power EPS Reconciliation – Q3 2016 versus Q3 2015 O&M * See Slide A for Items excluded from Net Income to reconcile to Operating Earnings (non-GAAP). Other Q3 2016 Net Income Q3 2015 Net Income Q3 2015 Operating Earnings (non-GAAP)* Q3 2016 Operating Earnings (non-GAAP)* |
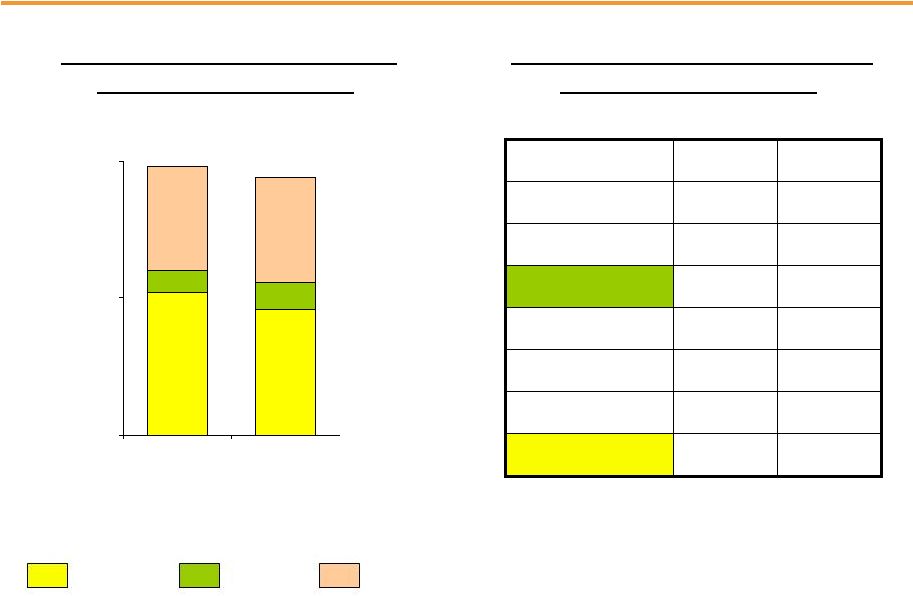 19 PSEG Power – Generation Measures 7,787 6,863 1,192 1,493 5,739 5,754 0 7,500 15,000 2015 2016 Quarter ended September 30 Total Nuclear Total Coal* Oil & Natural Gas * Includes figures for Pumped Storage. Includes Hudson and Mercer when run on gas. PSEG Power – Generation (GWh) 14,718 14,110 Quarter ended September 30 PSEG Power – Capacity Factors (%) 2015 2016 Combined Cycle PJM and NY 76.2% 73.6% Coal NJ (Coal/Gas) 3.7% 11.1% PA 65.1% 69.8% CT 1.3% 5.4% Nuclear 95.4% 80.2% |
 20 PSEG Power – Generation Measures 22,748 22,265 4,995 3,432 14,745 14,059 0 15,000 30,000 45,000 2015 2016 Nine Months ended September 30 * Includes figures for Pumped Storage. Includes Hudson and Mercer when run on gas. PSEG Power – Generation (GWh) 42,488 39,756 Nine Months ended September 30 PSEG Power – Capacity Factors (%) 2015 2016 Combined Cycle PJM and NY 64.6% 62.5% Coal* NJ (Coal/Gas) 7.5% 3.4% PA 76.3% 61.9% CT 23.8% 3.8% Nuclear 92.2% 87.5% Total Nuclear Total Coal* Oil & Natural Gas |
 21 PSEG Power – Fuel Costs Quarter ended September 30 ($ millions) 2015 2016 Coal 27 29 Oil & Gas 94 83 Total Fossil 121 112 Nuclear 56 49 Total Fuel Cost 177 161 Total Generation (GWh) 14,718 14,110 $ / MWh 12 11 PSEG Power – Fuel Costs Nine months ended September 30 ($ millions) 2015 2016 Coal 139 78 Oil & Gas 423 215 Total Fossil 562 293 Nuclear 162 154 Total Fuel Cost 724 447 Total Generation (GWh) 42,488 39,756 $ / MWh 17 11 |
 22 PSEG Power – Gross Margin Performance Capacity pricing and MWs were comparable year-over-year Lack of pipeline take away capacity kept pressure on local natural gas and power prices during a summer that exceeded last year’s hot weather Regional Performance Region Q3 2016 Gross Margin ($M) 2016 Performance PJM $551 Lower hedge prices partially offset by lower costs to serve New England $13 Higher prices supported increased volume New York $25 Lower volumes offset higher prices $0 $25 $50 2014 2015 2016 PSEG Power Gross Margin ($/MWh) $42 $42 $40 Quarter ended September 30 $0 $25 $50 2014 2015 2016 Nine months ended September 30 $43 $41 $44 |
 23 Hedging Update… Contracted Energy* * Hedge percentages and prices as of September 30, 2016. Revenues of full requirement load deals based on contract price, including renewable energy credits, ancillary, and transmission components but excluding capacity. Hedges include positions with MTM accounting treatment and options. **Volumes reflect rounding. Volume TWh 8 35 34 Base Load % Hedged 100% 100% 45-50% (Nuclear and Base Load Coal) Price $/MWh $48 $47 $45 Volume TWh 4 17 22 Intermediate Coal, Combined % Hedged 25-30% 0-5% 0% Cycle, Peaking Price $/MWh $48 $47 - Volume TWh 11-12 51-53 56-58 Total % Hedged 75-80% 65-70% 25-30% Price $/MWh $48 $47 $45 Oct-Dec 2016 2017 2018 |
 Early retirement of the Hudson and Mercer generating stations totaling ~1,250 MWs in June 2017 resulted in one-time charges in 3Q of $67 million (after-tax) covering impairments and closing costs; remaining capital cost will be depreciated from Q4 2016 through first-half 2017 24 PSEG Power – Q3 Operating Highlights Q3 output was down 4% vs. Q3 2015, YTD output down 6% from extended nuclear outages at Salem 1 and 2 CCGT capacity factor of 74% in Q3, YTD CCGT capacity factor of 63% Nuclear capacity factor of 80% in Q3, YTD nuclear capacity factor of 88% Updating PSEG Power’s full-year 2016 Operating Earnings (non-GAAP) guidance to $460 - $500 million from $460 - $525 million; and full-year 2016 Adjusted EBITDA (non-GAAP) guidance to $1.270 - $1.335 billion from $1.270 - $1.375 billion Power’s total debt as a percentage of capital at September 30 was 28% Operations Regulatory and Market Environment Financial |
 PSEG |
 26 PSEG Financial Highlights Updating full-year 2016 Operating Earnings (non-GAAP) guidance to $2.80 - $2.95 from $2.80 - $3.00 per share Strong third quarter results were not sufficient to offset the lack of a winter Focused on meeting customer needs for clean, reliable, efficient delivery of energy Infrastructure Spend PSE&G capital spending for 2016 expected to top $3 billion Keys, Sewaren and Bridgeport Harbor CCGT construction is on schedule and on budget PSE&G has identified more than $600 million year to date of additional infrastructure spend over the current capital spending plan of $12 billion in the 2016-2020 period Financial position remains strong Positive cash from Power and increasing cash flow from operations at PSE&G supports dividend growth and funds capital spending program without the need to issue equity Debt as a percentage of capitalization was 45% at September 30 Announced retirement of Hudson and Mercer generating stations (totaling ~1,250 MW) planned for mid-2017 expected to improve Power’s cash flow and return profile |
 APPENDIX |
 28 PSEG 2016 Operating Earnings Guidance - By Subsidiary $ millions (except EPS) 2016E 2015 PSE&G (Net Income) $900 - $935 $787 PSEG Power* $460 - $500 $653 PSEG Enterprise/Other* $65 - $65 $36 Operating Earnings (non-GAAP)* $1,425 - $1,500 $1,476 Operating EPS (non-GAAP)* $2.80 - $2.95E $2.91 Segment Operating Earnings Guidance and Prior Results (non-GAAP, except as noted)* $ millions 2016E 2015 PSEG Power $1,270 - $1,335 $1,563 PSEG Power Adjusted EBITDA (non-GAAP)* * See Slide A for Items excluded from Net Income to reconcile to Operating Earnings (non-GAAP) and Slide B for Items excluded from Net Income to reconcile to Operating Earnings (non-GAAP) and Adjusted EBITDA (non-GAAP). E=Estimate |
 PSEG Liquidity as of September 30, 2016 29 |
 A Items Excluded from Net Income to Reconcile to Operating Earnings (Non-GAAP) Please see Slide 2 for an explanation of PSEG’s use of Operating Earnings as a non-GAAP financial measure and how it differs from Net Income. 2016 2015 2016 2015 2015 2014 Net Income 327 $ 439 $ 985 $ 1,370 $ 1,679 $ 1,518 $ (Gain) Loss on Nuclear Decommissioning Trust (NDT) Fund Related Activity, pre-tax (PSEG Power) (4) 24 4 14 (24) (138) (Gain) Loss on Mark-to-Market (MTM), pre-tax (a) (PSEG Power) (58) (84) 91 (98) (157) (111) Storm O&M, net of insurance recoveries, pre-tax (PSEG Power) - - - (172) (172) 27 Hudson/Mercer Early Retirement, pre-tax (PSEG Power) 114 - 114 - - - Lease Related Activity, pre-tax (PSEG Enterprise/Other) 137 - 137 - - - Income Taxes related to Operating Earnings (non-GAAP) reconciling items (b) (72) 24 (135) 107 150 104 Operating Earnings (non-GAAP) 444 $ 403 $ 1,196 $ 1,221 $ 1,476 $ 1,400 $ Fully Diluted Average Shares Outstanding (in millions) 508 508 508 508 508 508 Net Income 0.64 $ 0.87 $ 1.94 $ 2.70 $ 3.30 $ 2.99 $ (Gain) Loss on NDT Fund Related Activity, pre-tax (PSEG Power) - 0.05 0.01 0.03 (0.05) (0.27) (Gain) Loss on MTM, pre-tax (a) (PSEG Power) (0.11) (0.17) 0.18 (0.19) (0.31) (0.22) Storm O&M, net of insurance recoveries, pre-tax (PSEG Power) - - - (0.34) (0.34) 0.05 Hudson/Mercer Early Retirement, pre-tax (PSEG Power) 0.22 - 0.22 - - - Lease Related Activity, pre-tax (PSEG Enterprise/Other) 0.27 - 0.27 - - - Income Taxes related to Operating Earnings (non-GAAP) reconciling items (b) (0.14) 0.05 (0.26) 0.21 0.31 0.21 Operating Earnings (non-GAAP) 0.88 $ 0.80 $ 2.36 $ 2.41 $ 2.91 $ 2.76 $ (a) Includes the financial impact from positions with forward delivery months. PUBLIC SERVICE ENTERPRISE GROUP INCORPORATED Consolidated Operating Earnings (non-GAAP) Reconciliation (b) Income tax effect calculated at 40.85% statutory rate, except for lease related activity which is calculated at a combined leveraged lease effective tax rate of 37% and NDT related activity which is calculated at the 40.85% statutory rate plus a 20% tax on income (losses) from qualified NDT funds. Year-Ended September 30, December 31, Nine Months Ended September 30, Three Months Ended Reconciling Items ($ millions, Unaudited) ($ Per Share Impact - Diluted, Unaudited) |
 B Items Excluded from Net Income to Reconcile to Adjusted EBITDA (non-GAAP) and Operating Earnings (non-GAAP) Please see Slide 2 for an explanation of PSEG’s use of Operating Earnings and Adjusted EBITDA as non-GAAP financial measures and how they differ from Net Income. 2016 2015 2016 2015 2015 Net Income (Loss) 139 $ 206 $ 320 $ 707 $ 856 $ (Gain) Loss on NDT Fund Related Activity, pre-tax (4) 24 4 14 (24) (Gain) Loss on MTM, pre-tax (a) (58) (84) 91 (98) (157) Storm O&M, net of insurance recoveries, pre-tax - - - (172) (172) Hudson/Mercer Early Retirement, pre-tax 114 - 114 - - Income Taxes related to Operating Earnings (non-GAAP) reconciling items (b) (21) 24 (84) 107 150 Operating Earnings (non-GAAP) 170 $ 170 $ 445 $ 558 $ 653 $ Fossil Major Maintenance, pre-tax 10 10 39 111 128 Depreciation and Amortization, pre-tax (c) 83 76 244 228 301 Interest Expense, pre-tax (c) (d) 23 30 65 93 120 Income Taxes (c) 111 115 292 338 361 Adjusted EBITDA (non-GAAP) 397 $ 401 $ 1,085 $ 1,328 $ 1,563 $ (a) Includes the financial impact from positions with forward delivery months. (c) Excludes amounts related to Operating Earnings (non-GAAP) reconciling items. (d) Net of capitalized interest. Nine Months Ended September 30, ($ millions, Unaudited) (b) Income tax effect calculated at 40.85% statutory rate, except for lease related activity which is calculated at a combined leveraged lease effective tax rate of 37% and NDT related activity which is calculated at the 40.85% statutory rate plus a 20% tax on income (losses) from qualified NDT funds. PSEG Power Adjusted EBITDA (non-GAAP) Reconciliation Three Months Ended Year Ended December 31, Reconciling Items September 30, 2016 2015 2016 2015 Net Income (Loss) (67) $ 11 $ (31) $ 32 $ Lease Related Activity, pre-tax 137 - 137 - Income Taxes related to Operating Earnings (non-GAAP) reconciling items (a) (51) - (51) - Operating Earnings (non-GAAP) 19 $ 11 $ 55 $ 32 $ (a) Income tax effect calculated at a combined leveraged lease effective tax rate of 37%. ($ millions, Unaudited) Operating Earnings (non-GAAP) Reconciliation Reconciling Items Three Months Ended Nine Months Ended September 30, September 30, PSEG Enterprise/Other |