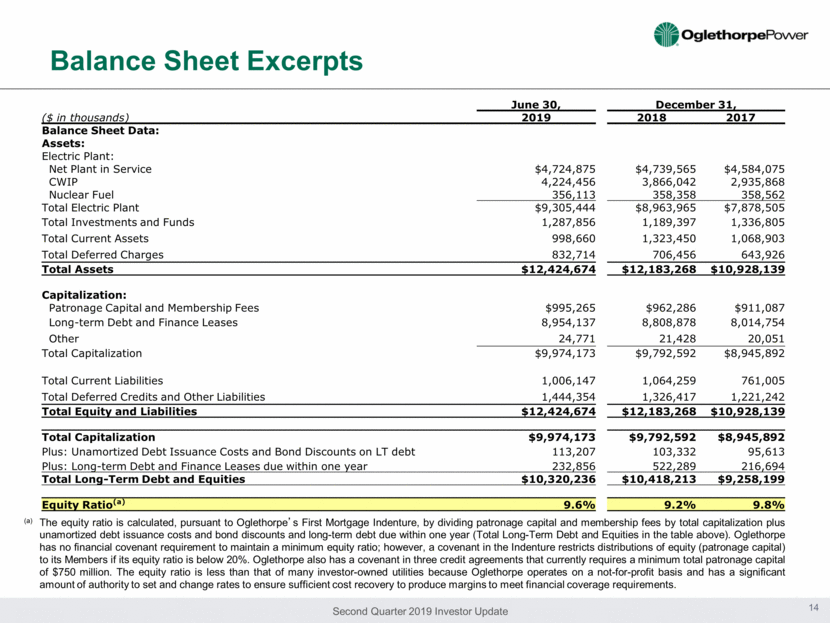
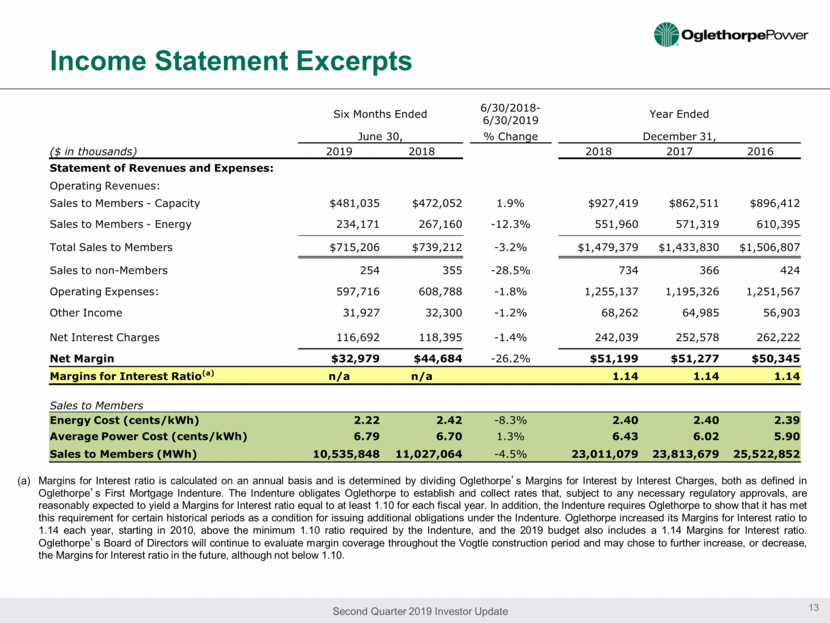
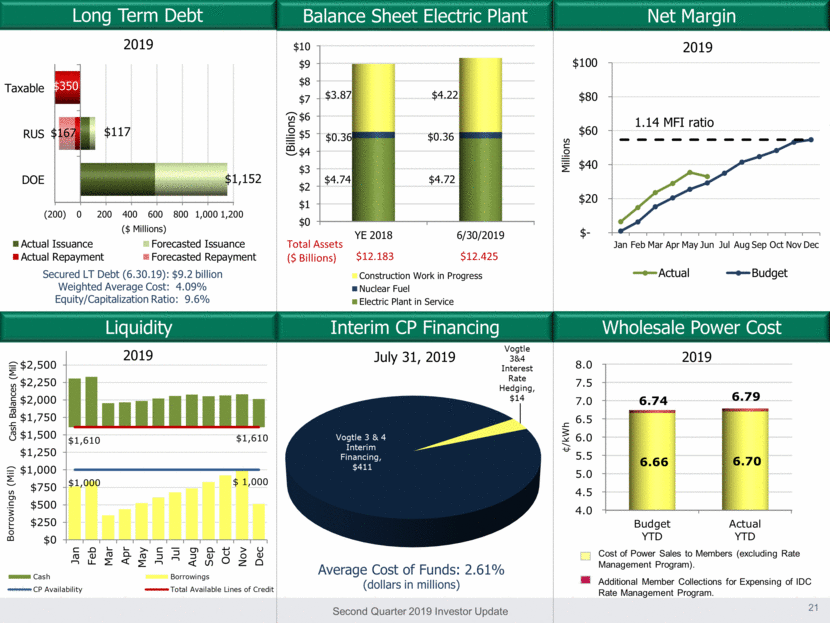
Balance Sheet Excerpts (a) The equity ratio is calculated, pursuant to Oglethorpe’s First Mortgage Indenture, by dividing patronage capital and membership fees by total capitalization plus unamortized debt issuance costs and bond discounts and long-term debt due within one year (Total Long-Term Debt and Equities in the table above). Oglethorpe has no financial covenant requirement to maintain a minimum equity ratio; however, a covenant in the Indenture restricts distributions of equity (patronage capital) to its Members if its equity ratio is below 20%. Oglethorpe also has a covenant in three credit agreements that currently requires a minimum total patronage capital of $750 million. The equity ratio is less than that of many investor-owned utilities because Oglethorpe operates on a not-for-profit basis and has a significant amount of authority to set and change rates to ensure sufficient cost recovery to produce margins to meet financial coverage requirements. 14 June 30, December 31, ($ in thousands) 2019 2018 2017 Balance Sheet Data: Assets: Electric Plant: Net Plant in Service $4,724,875 $4,739,565 $4,584,075 CWIP 4,224,456 3,866,042 2,935,868 Nuclear Fuel 356,113 358,358 358,562 Total Electric Plant $9,305,444 $8,963,965 $7,878,505 Total Investments and Funds 1,287,856 1,189,397 1,336,805 Total Current Assets 998,660 1,323,450 1,068,903 Total Deferred Charges 832,714 706,456 643,926 Total Assets $12,424,674 $12,183,268 $10,928,139 Capitalization: Patronage Capital and Membership Fees $995,265 $962,286 $911,087 Long-term Debt and Finance Leases 8,954,137 8,808,878 8,014,754 Other 24,771 21,428 20,051 Total Capitalization $9,974,173 $9,792,592 $8,945,892 Total Current Liabilities 1,006,147 1,064,259 761,005 Total Deferred Credits and Other Liabilities 1,444,354 1,326,417 1,221,242 Total Equity and Liabilities $12,424,674 $12,183,268 $10,928,139 Total Capitalization $9,974,173 $9,792,592 $8,945,892 Plus: Unamortized Debt Issuance Costs and Bond Discounts on LT debt 113,207 103,332 95,613 Plus: Long-term Debt and Finance Leases due within one year 232,856 522,289 216,694 Total Long-Term Debt and Equities $10,320,236 $10,418,213 $9,258,199 Equity Ratio(a) 9.6% 9.2% 9.8%
