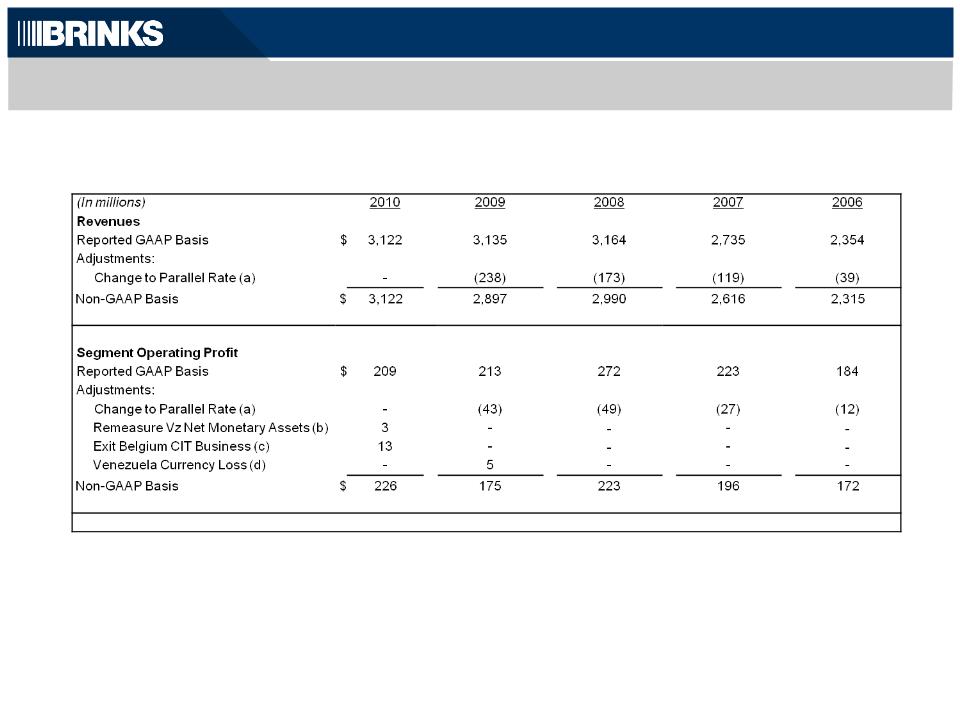
Non-GAAP Results - Reconciled to Amounts Reported under GAAP
Non-GAAP results described in this presentation are financial measures that are not required by, or presented in accordance with generally
accepted accounting principles (“GAAP”).
Purpose of Non-GAAP Information
The purpose of the non-GAAP information is to report our financial information
• without income and expense items described below in 2008, 2009 and 2010,
• as if our results from Venezuela had been translated at the less-favorable parallel exchange rate in 2006, 2007, 2008 and 2009, and
• after adjusting tax expense for items described below.
The non-GAAP information provides information to assist comparability and estimates of future performance. Brink’s believes these
measures are helpful in assessing operations and estimating future results and enable period-to-period comparability of financial
performance. Non-GAAP results should not be considered as an alternative to revenue or income amounts determined in accordance with
GAAP and should be read in conjunction with their GAAP counterparts.
a) To reduce revenues and segment operating income to reflect the 2009, 2008, 2007 and 2006 results of Venezuelan
subsidiaries had they been translated using the parallel currency exchange rate in effect at the time. The average parallel
exchange rate used for the 2009 non-GAAP full-year earnings was 6.0 bolivar fuertes to the U.S. dollar, compared to an
average rate of 2.2 bolivar fuertes to the U.S. dollar that was used for the GAAP financial statements. The official rate of
2.15 bolivar fuertes to the U.S. dollar was used for translation of Venezuela for most of 2009 until the parallel rate was
adopted during December. The use of the weaker rate to translate 2009 non-GAAP revenues and earnings of the
Venezuelan subsidiaries decreased each measure by 63%.
b) To reverse remeasurement gains and losses in Venezuela. For accounting purposes, Venezuela is considered a highly
inflationary economy. Under GAAP, subsidiaries that operate in Venezuela record gains and losses in earnings for the
remeasurement of bolivar fuerte-denominated net monetary assets.
c) To eliminate loss on exit of Belgium cash-in-transit (CIT) business.
d) To eliminate currency losses incurred in Venezuela related to increases in cash held in U.S. dollars by Venezuelan
subsidiaries. These losses would not have been incurred had the operations been translated at the parallel rate.
e) To eliminate gains/losses recognized related to acquisitions of controlling interests in subsidiaries that were previously
accounted for as equity method or cost method investments.
f) To eliminate royalty income from Brink’s Home Security.
g) To eliminate certain non-segment gains on sales of assets.
21