- BCO Dashboard
- Financials
- Filings
-
Holdings
- Transcripts
- ETFs
- Insider
- Institutional
- Shorts
-
8-K Filing
The Brink's Company (BCO) 8-KRegulation FD Disclosure
Filed: 5 Feb 13, 12:00am



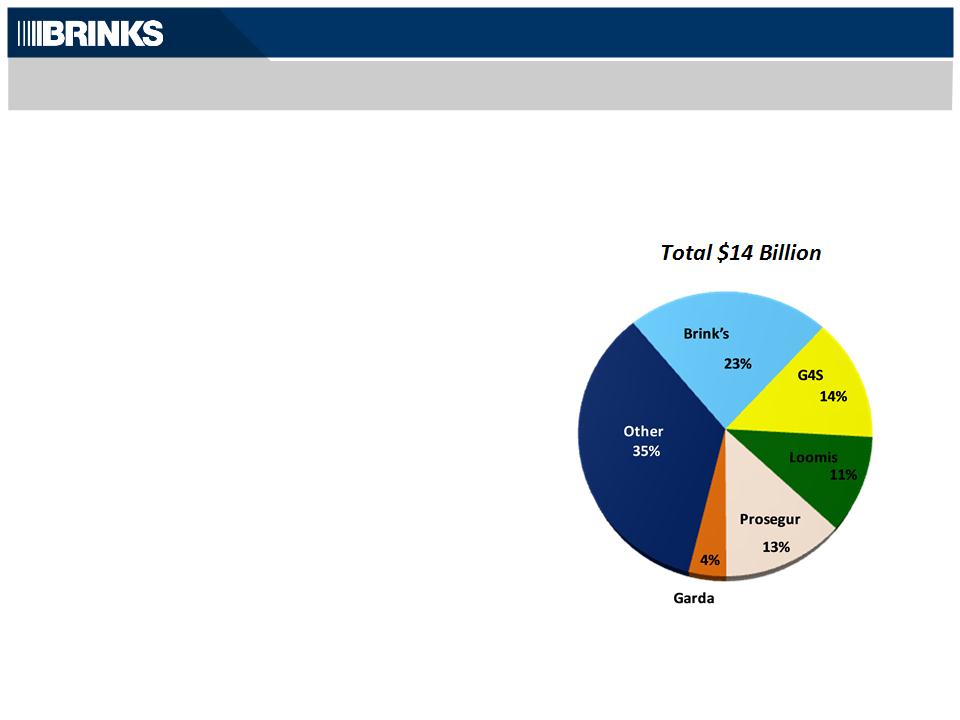
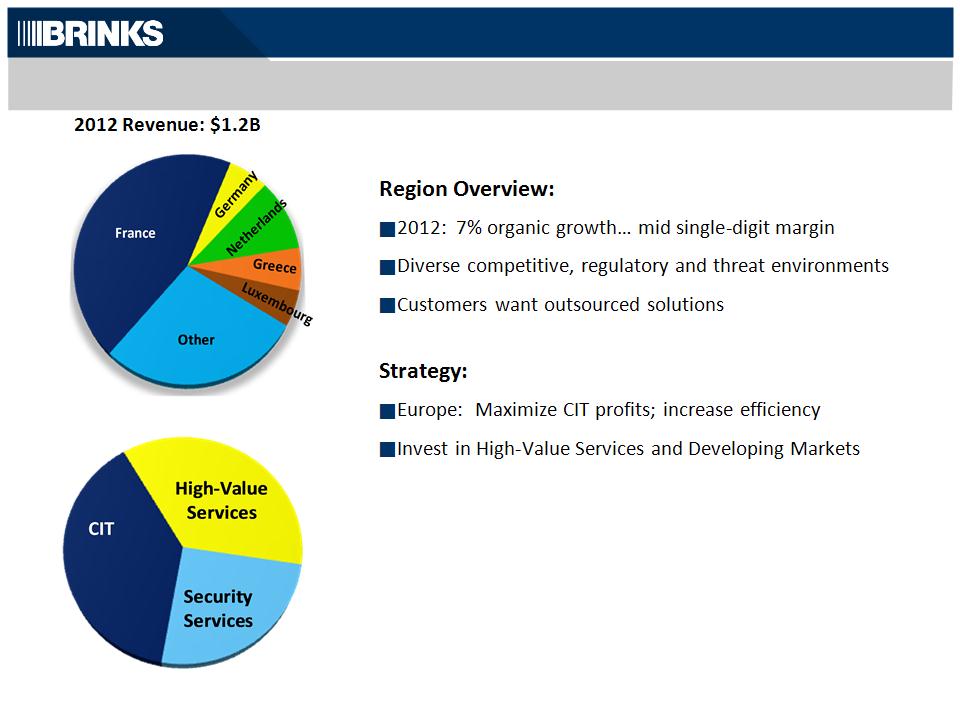
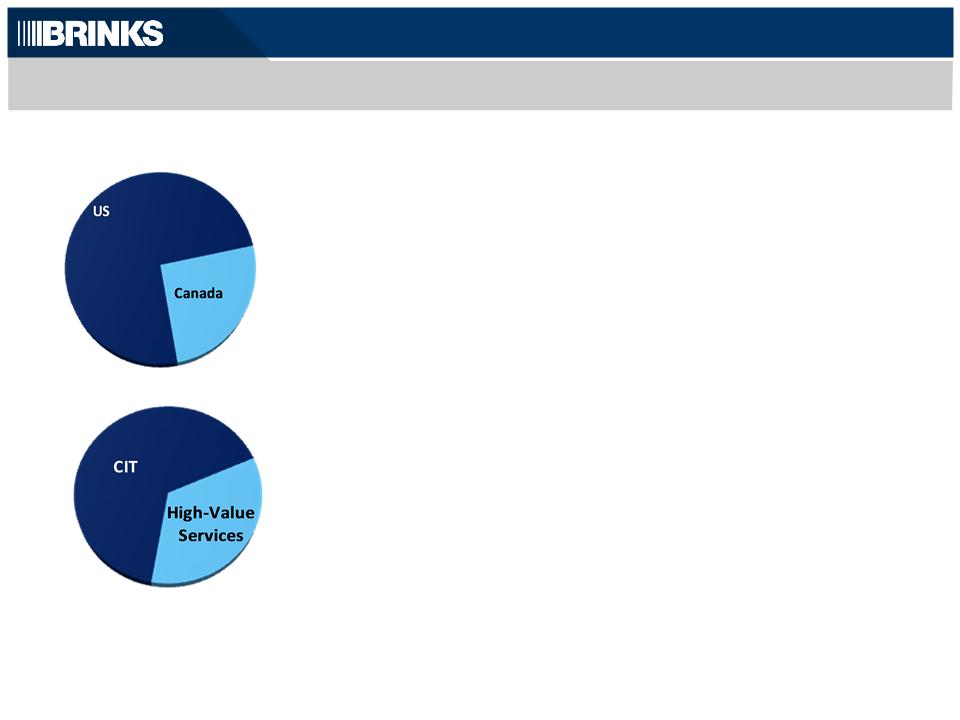

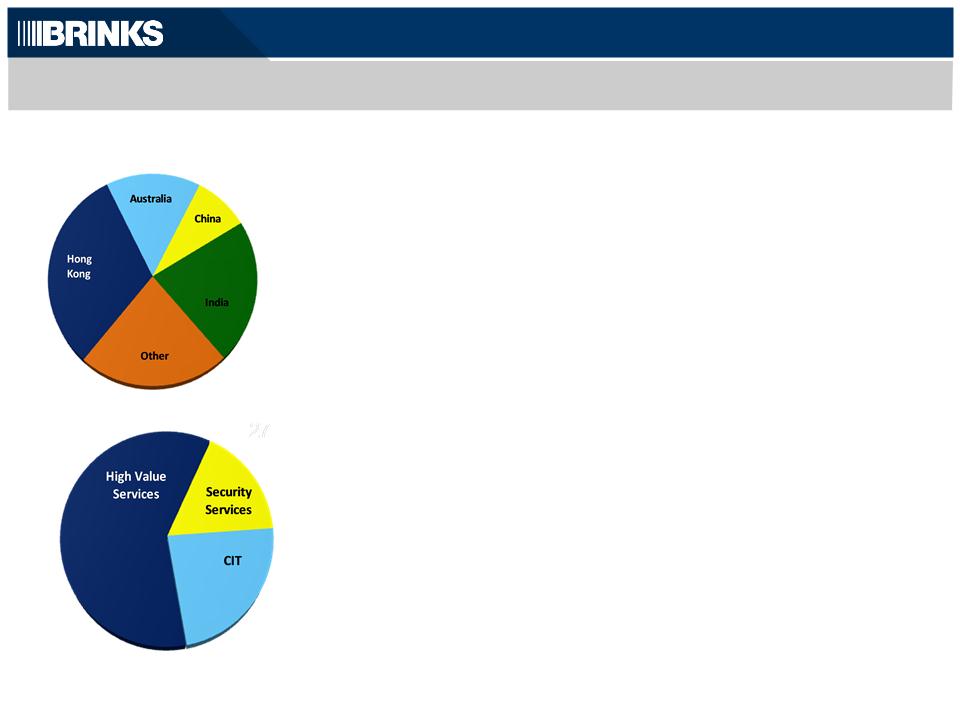


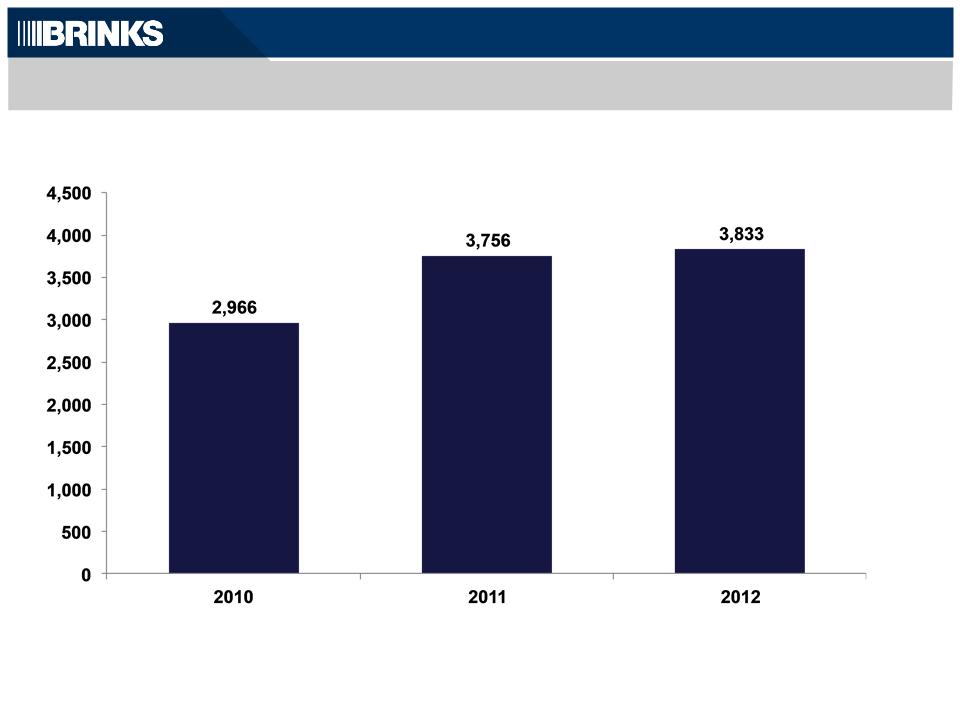
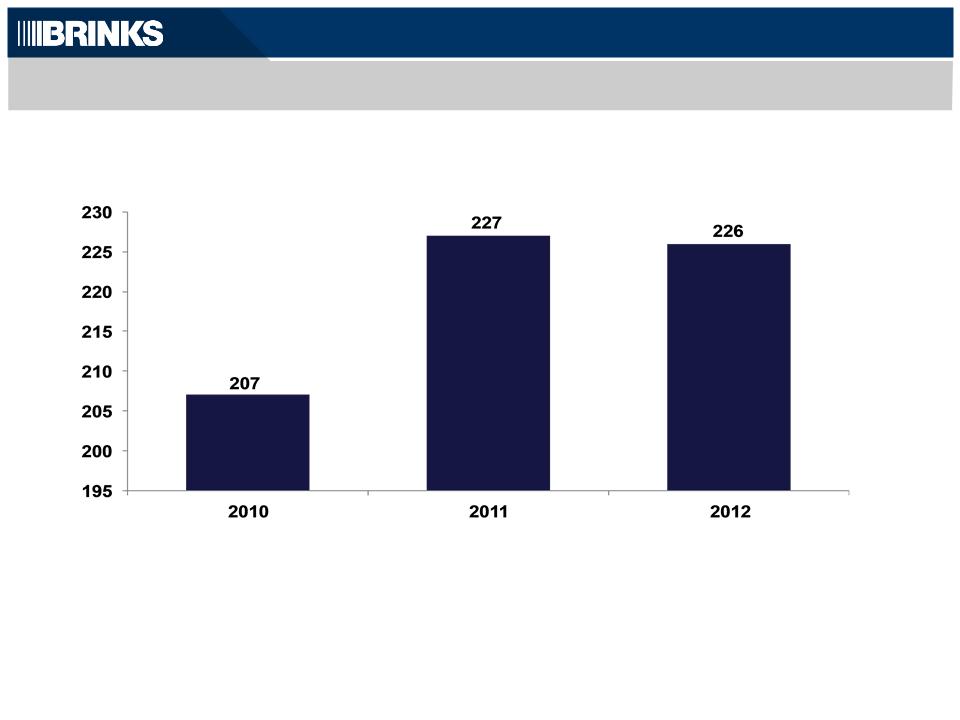
Segment | 244 | 267 | 268 |
Non-Segment | (36) | (41) | (42) |
Total | 207 | 227 | 226 |
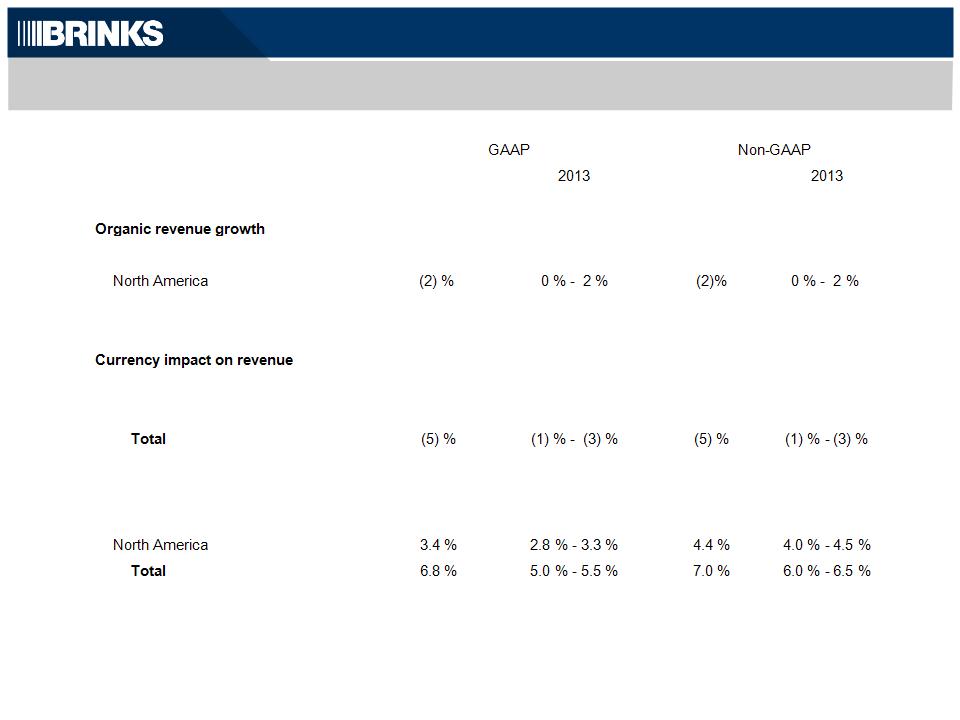
2012 | Estimate | 2012 | Estimate | ||||||||||
International | 11 % | 7 % - 9 % | 11 % | 7 % - 9 % | |||||||||
(2)% | |||||||||||||
Total | 7 % | 5 % - 8 % | 7 % | 5 % - 8 % | |||||||||
International | (7) % | (2) % - (4) % | (7) % | (2) % - (4) % | |||||||||
North America | flat | flat | flat | flat | |||||||||
Segment margin | |||||||||||||
International | 7 % | 6.0 % - 6.5 % | 7.8 % | 7.0 % - 7.5 % | |||||||||

2012 | 2011 | 2010 | ||||||
Sale of real estate in Venezuela | $ | (7) | - | - | ||||
Sale of U.S. Document Destruction business | - | (7) | - | |||||
Bargain Purchase of Mexican CIT business | - | (2) | (5) | |||||
Impairment of Cost Method Investment-Mexico | - | - | 14 | |||||
Other gains/losses on acquisitions/dispositions- Segment | (2) | - | - | |||||
Other gains/losses on acquisitions/dispositions- NonSegment | (1) | - | - | |||||
Selling costs related to acquisitions/dispositions | 1 | - | - | |||||
Sale of former operating assets | - | (1) | - | |||||
$ | (9) | (10) | 9 |
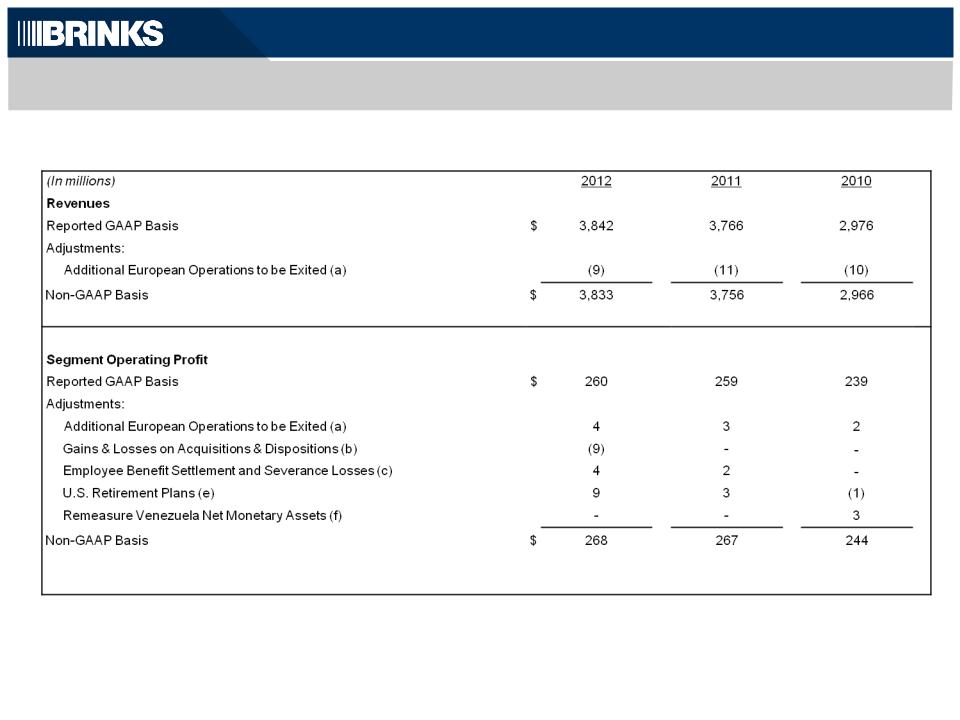

(In millions) | 2012 | 2011 | 2010 | ||||
Non-Segment | |||||||
Reported GAAP Basis | $ | (89) | (60) | (63) | |||
Adjustments: | |||||||
Gains & Losses on Acquisitions and Asset Dispositions (b) | (1) | (10) | 9 | ||||
CEO Retirement cost (d) | - | 4 | - | ||||
U.S. Retirement Plans (e) | 47 | 25 | 23 | ||||
Royalty from BHS (g) | - | - | (5) | ||||
Non-GAAP Basis | $ | (42) | (41) | (36) | |||
Total Operating Profit | |||||||
Reported GAAP Basis | $ | 171 | 200 | 177 | |||
Adjustments: | |||||||
Additional European Operations to be Exited (a) | 4 | 3 | 2 | ||||
Gains & Losses on Acquisitions and Asset Dispositions (b) | (9) | (10) | 9 | ||||
Employee Benefit Settlement & Severance Losses (c) | 4 | 2 | - | ||||
CEO Retirement Cost(d) | - | 4 | - | ||||
U.S. Retirement Plans (e) | 56 | 28 | 22 | ||||
Remeasure Venezuela Net Monetary Assets (f) | - | - | 3 | ||||
Royalty from BHS (g) | - | - | (5) | ||||
Non-GAAP Basis | $ | 226 | 227 | 207 | |||

December 31, | December 31, | |||
2012 | 2011 | |||
Debt: | ||||
Short-term | $ | 26.7 | 25.4 | |
Long-term | 362.6 | 364.0 | ||
Total Debt | 389.3 | 389.4 | ||
Cash and cash equivalents | 201.7 | 182.9 | ||
Less amounts held by cash logistics operations (a) | (44.0) | (25.1) | ||
Cash and Cash equivalents available for general corporate purposes | 157.7 | 157.8 | ||
Net Debt | $ | 231.6 | 231.6 |

Organic | Acquisitions/ | Currency | ||||||||||||
2011 | Change | Dispositions (b) | (c) | 2012 | Total | Organic | ||||||||
Revenues: | ||||||||||||||
EMEA | $ | 1,461 | 215 | 2 | (98) | 1,579 | 8% | 15% | ||||||
Latin America | 1,178 | 70 | - | (90) | 1,158 | (2)% | 6% | |||||||
Asia Pacific | 154 | 10 | - | (5) | 159 | 3% | 7% | |||||||
International | 2,792 | 296 | 2 | (193) | 2,897 | 4% | 11% | |||||||
North America | 974 | (24) | (3) | (3) | 945 | (3)% | (2)% | |||||||
Total | $ | 3,766 | 272 | (1) | (196) | 3,842 | 2% | 7% | ||||||
Operating profit: | ||||||||||||||
International | $ | 288 | 17 | (2) | (15) | 228 | - | 7% | ||||||
North America | 31 | 1 | - | - | 33 | 4% | 3% | |||||||
Segment operating profit | 259 | 18 | (2) | (15) | 260 | - | 7% | |||||||
Non-segment (a) | (60) | (21) | (8) | - | (89) | 49% | 35% | |||||||
Total | $ | 200 | (3) | (11) | (15) | 171 | (14)% | (1)% | ||||||
Segment operating margin: | ||||||||||||||
International | 8.2% | 7.9% | ||||||||||||
North America | 3.2% | 3.4% | ||||||||||||
Segment operating margin | 6.9% | 6.8% | ||||||||||||

(In millions) | Organic | Acquisitions/ | Currency | |||||||||||
2011 | Change | Dispositions (b) | (c) | 2012 | Total | Organic | ||||||||
Revenues: | ||||||||||||||
EMEA | $ | 1,461 | 215 | 2 | (98) | 1,579 | 8% | 15% | ||||||
Latin America | 1,167 | 71 | - | (89) | 1,149 | (2)% | 6% | |||||||
Asia Pacific | 154 | 10 | - | (5) | 159 | 3% | 7% | |||||||
International | 2,781 | 296 | 2 | (192) | 2,888 | 4% | 11% | |||||||
North America | 974 | (24) | (3) | (3) | 945 | (3)% | (2)% | |||||||
Total | $ | 3,756 | 273 | (1) | (194) | 3,833 | 2% | 7% | ||||||
Operating profit: | ||||||||||||||
International | $ | 233 | 8 | 1 | (15) | 227 | (3)% | 4% | ||||||
North America | 35 | 7 | - | - | 41 | 19% | 19% | |||||||
Segment operating profit | 267 | 15 | 1 | (15) | 268 | - | 6% | |||||||
Non-segment (a) | (41) | (2) | - | - | (42) | 4% | 4% | |||||||
Total | $ | 227 | 13 | 1 | (15) | 226 | - | 6% | ||||||
Segment operating margin: | ||||||||||||||
International | 8.4% | 7.8% | ||||||||||||
North America | 3.6% | 4.4% | ||||||||||||
Segment operating margin | 7.1% | 7.0% | ||||||||||||
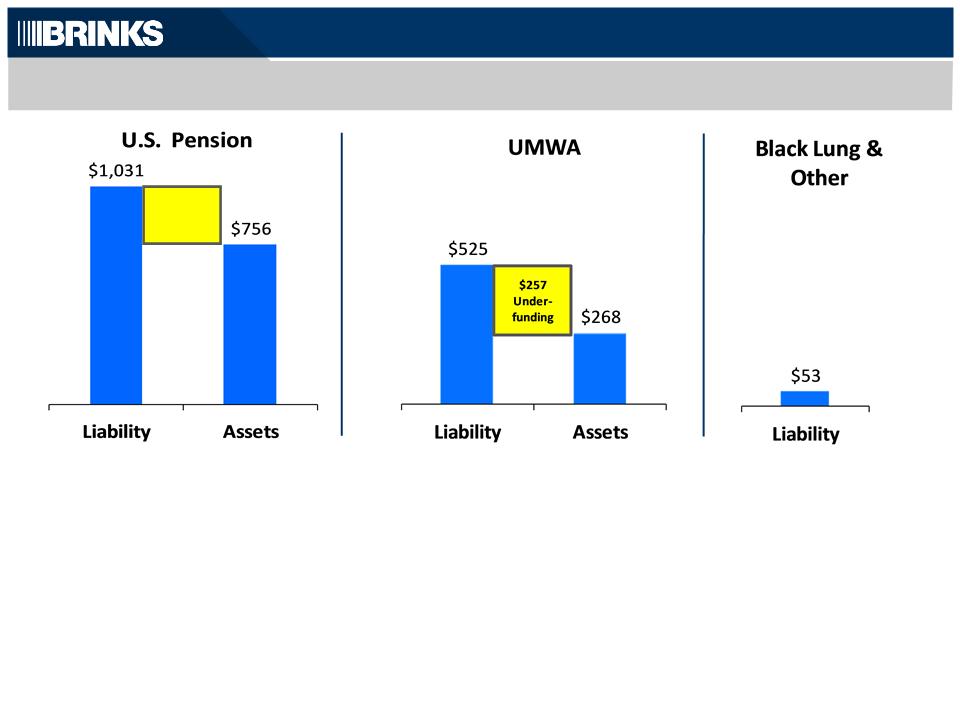
Estimated Contributions to U.S. Plans | ||||||||||||||
2012A | 2013 | 2014 | 2015 | 2016 | 2017 | |||||||||
US Pension | $ 37 | 14 | 29 | 42 | 44 | 38 | ||||||||
UMWA | 0 | 0 | 0 | 0 | 0 | 0 | ||||||||
Black Lung/Other | 7 | 5 | 5 | 5 | 4 | 4 | ||||||||
Total | $ 44 | 19 | 34 | 47 | 48 | 42 | ||||||||