(a) To eliminate:
• Gains related to the sale of investments in mutual fund securities ($1.9 million in the first quarter and $0.5 million in the third quarter). Proceeds from the sales
were used to fund the settlement of pension obligations related to our former chief executive officer, and former chief administrative officer.
• Gains and losses related to business acquisitions and dispositions. A $0.9 million gain was recognized in the second quarter and a $0.1 million loss was
recognized in the third quarter. In the fourth quarter of 2012, tax expense included a benefit of $7.5 million related to a reduction in an income tax accrual
established as part of the 2010 acquisition of subsidiaries in Mexico, and pretax income included a $2.1 million favorable adjustment to the local profit sharing
accrual as a result of the change in tax expectation.
• Third-quarter gain on the sale of real estate in Venezuela ($7.2 million).
(b) To eliminate employee benefit settlement and acquisition-related severance losses (Mexico and Argentina). Employee termination benefits in Mexico are accounted for
under FASB ASC Topic 715, Compensation - Retirement Benefits.
(c) To eliminate expenses related to U.S. retirement plans.
(d) To eliminate tax benefit related to change in retiree health care funding strategy.
(e) To adjust effective income tax rate in the interim period to be equal to the full-year non-GAAP effective income tax rate. The full-year non-GAAP effective tax rate for
2012 was 36.2%.
Non-GAAP Reconciliations - 3Q12
Amounts may not add due to rounding.
24
GAAP
Basis
Gains & Losses on
Acquisitions and
Dispositions (a)
Employee Benefit
Settlement and
Severance Losses (b)
U.S. Retirement
Plans (c)
Tax Benefit on
Change in Health
Care Funding
Strategy (d)
Adjust
Income Tax
Rate (e)
Non-
GAAP
Basis
Third Quarter 2012
Revenues:
Latin America
$
385.2
−
−
−
−
−
385.2
EMEA
286.0
−
−
−
−
−
286.0
Asia Pacific
39.1
−
−
−
−
−
39.1
International
710.3
−
−
−
−
−
710.3
North America
234.6
−
−
−
−
−
234.6
Revenues
$
944.9
−
−
−
−
−
944.9
Operating profit:
International
$
59.4
(7.2)
2.0
−
−
−
54.2
North America
8.3
−
−
2.2
−
−
10.5
Segment operating profit
67.7
(7.2)
2.0
2.2
−
−
64.7
Non-segment
(22.0)
0.1
−
11.5
−
−
(10.4)
Operating profit
$
45.7
(7.1)
2.0
13.7
−
−
54.3
Amounts attributable to Brink’s:
Income from continuing operations
$
21.3
(3.0)
1.4
8.2
−
0.3
28.2
Diluted EPS - continuing operations
0.44
(0.06)
0.03
0.17
−
0.01
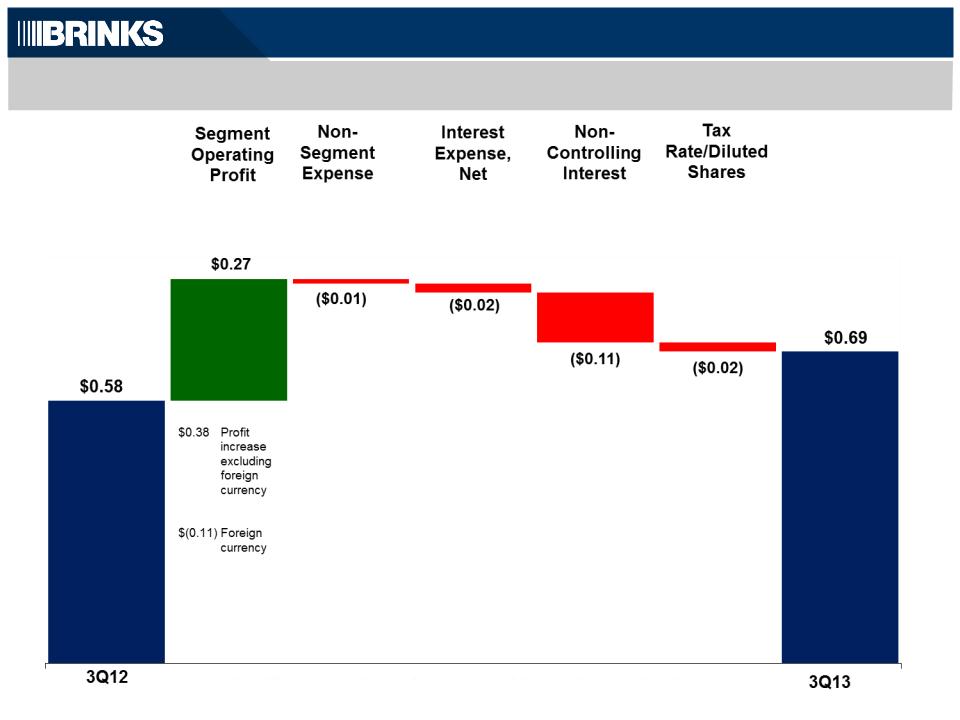
0.58