
The Brink’s Company
Fourth-Quarter 2013 Earnings
Conference Call
NYSE:BCO
January 30, 2014
Exhibit 99.2

Forward-Looking Statements
These materials contain forward-looking statements. Actual
results could differ materially from projected or estimated
results. Information regarding factors that could cause such
differences is available in today's release and in The Brink’s
Company’s most recent SEC filings.
results could differ materially from projected or estimated
results. Information regarding factors that could cause such
differences is available in today's release and in The Brink’s
Company’s most recent SEC filings.
Information discussed today is representative as of today
only and Brink's assumes no obligation to update any
forward-looking statements. These materials are
copyrighted and may not be used without written permission
from Brink's.
only and Brink's assumes no obligation to update any
forward-looking statements. These materials are
copyrighted and may not be used without written permission
from Brink's.
2

The Brink’s Company
Ed Cunningham
Director - Investor Relations

Fourth-Quarter Summary
• GAAP EPS $.53 vs $.70
• Non-GAAP Summary:
• EPS $.79 vs $.60
• Segment margin 8.8% vs 7.5%
• Revenue up 6% (11% organic growth)
Note: See reconciliation to GAAP results in Appendix
4

Full-Year Summary
• GAAP EPS $1.47 vs $2.29
• Non-GAAP Summary:
• EPS $2.37 vs $2.32
• Segment margin flat at 7.2%
• Revenue up 6% (8% organic growth)
Note: See reconciliation to GAAP results in Appendix
5

The Brink’s Company
Tom Schievelbein
Chairman, President and
Chief Executive Officer
CEO Overview
• Strong Fourth Quarter - International Operations
• 2014 Outlook
• Segment margin ~7%
7
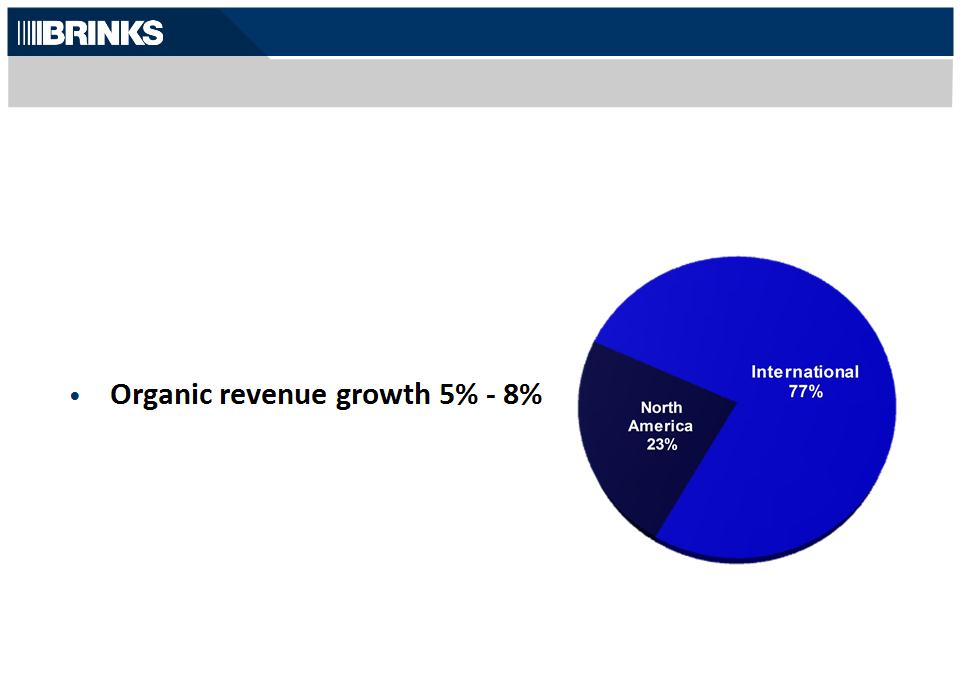
Fourth-Quarter 2013 Revenue
($1.0 billion)
International Operations
• Fourth Quarter 2013
• Latin America profit growth - Venezuela
and Brazil
and Brazil
• Europe profit growth - France
8
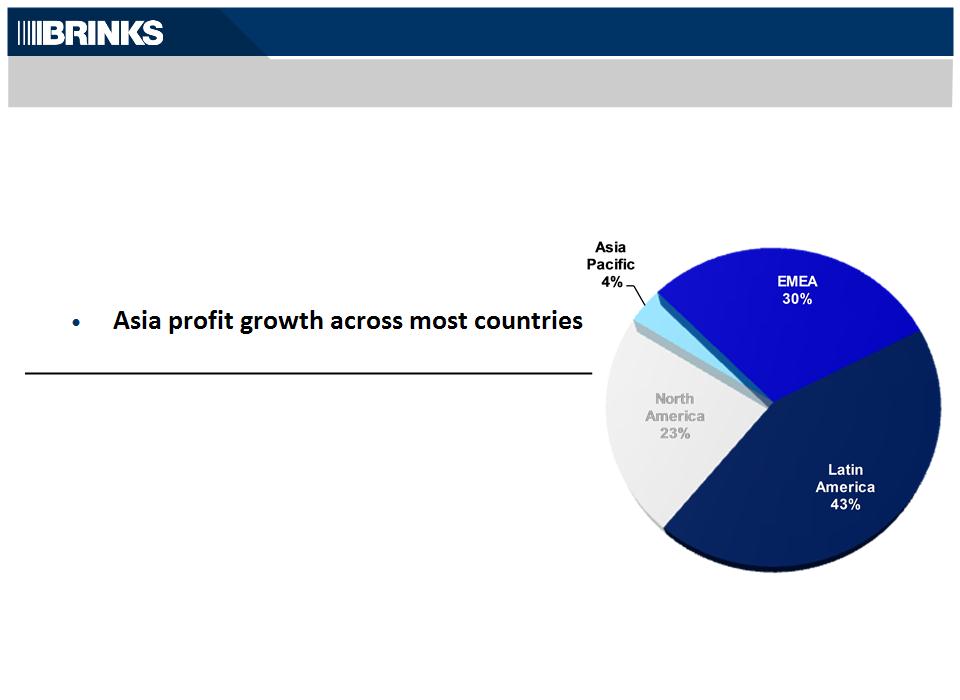
2013 Revenue
($3.9 billion)
• Full Year 2013
• Latin America profit growth - Venezuela
and Argentina
and Argentina
• Europe profit down - Belgium theft loss
• Asia profit growth - Hong Kong, Singapore
and regional cost reductions
and regional cost reductions
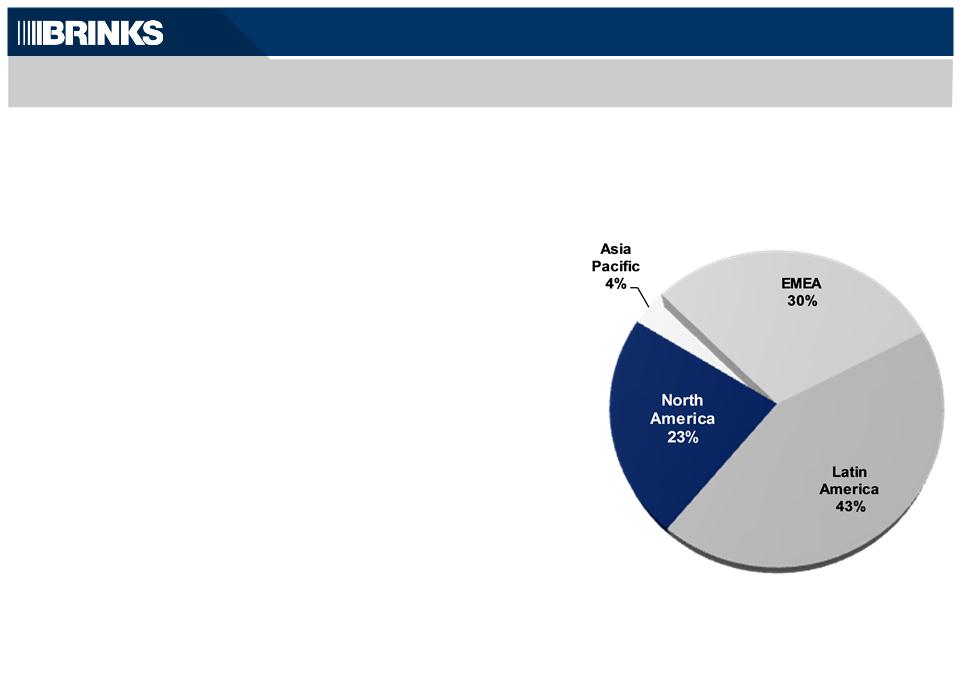
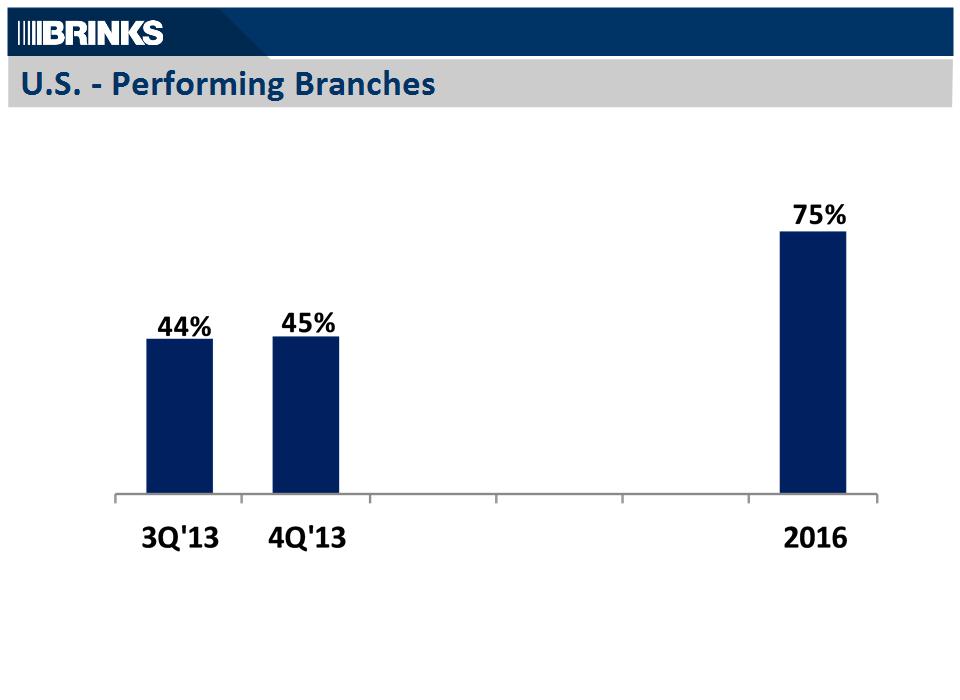
North America
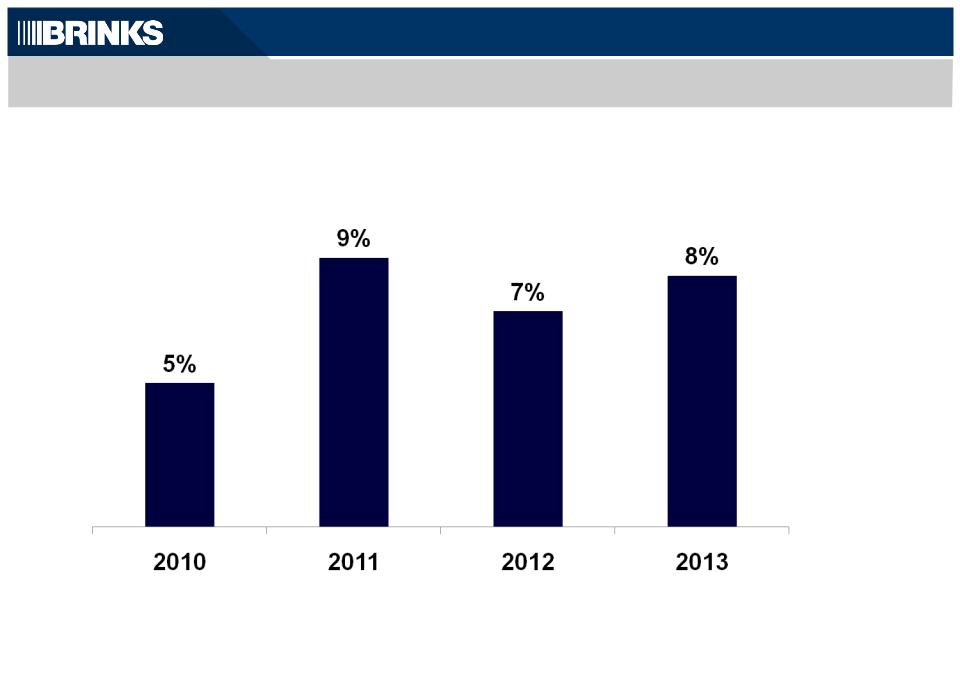
• 2013 Segment Margin
• Fourth-Quarter 1.4%
• Full-Year 1.8%
• 2016 Goal 7.0%*
• Increase “performing branches” in U.S.
• Aggressive cost reductions
• Productivity initiatives
• Change U.S. revenue mix
9
2013 Revenue
($3.9 billion)
* Excluding Global Payments
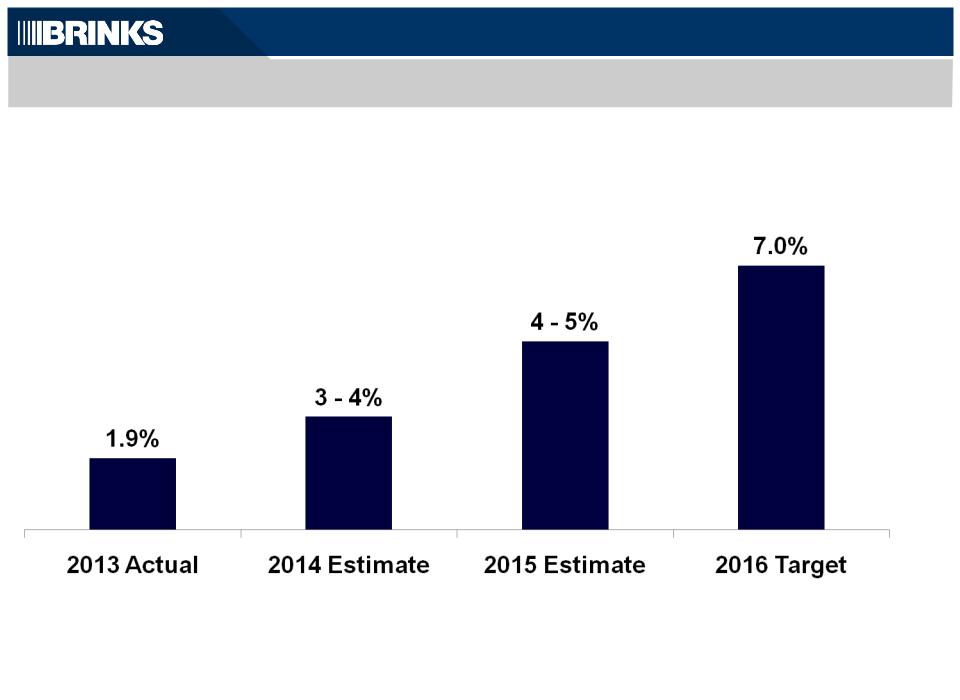
North America Segment Margin Rate - Excluding Global Payments
10
11
Goal
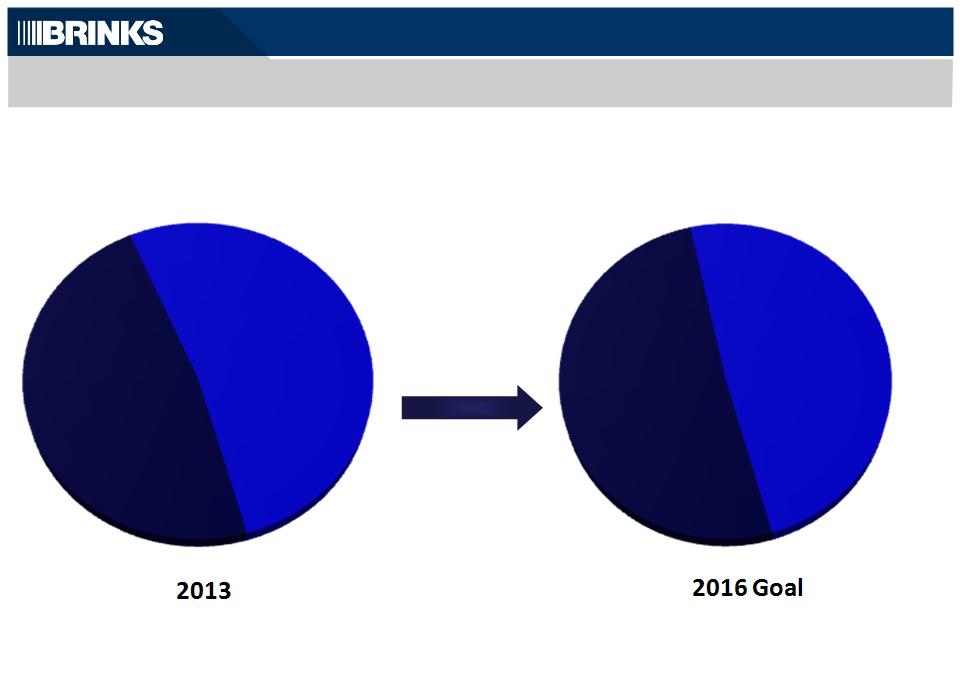
Shift U.S. Revenue Mix to High-Value Services
12
Note: High-Value Services includes Global Services and Cash Management Services. Cash Management Services includes money
processing, vaulting, ATM management and CompuSafe® Service.
processing, vaulting, ATM management and CompuSafe® Service.
CIT & ATM
52%
52%
High-Value
Services
48%
Services
48%
CIT & ATM
49%
49%
High-Value
Services
51%
Services
51%

U.S. Cost Actions
2013 Actions
• Overtime Pay Change
• SG&A Headcount Reduction
• IT Infrastructure Consolidation
In-Process
• Route Logistics
• Field Force Automation
• Centralized Billing
• CompuSafe Service Focus
• Overtime Management
Expected to improve 2014 profit
Expected to improve 2H14 profit,
but primarily after 2014
but primarily after 2014
13
Global Cost Strategy
• Global Procurement
• Vehicles, Travel
Management, IT Hardware,
Indirect
Management, IT Hardware,
Indirect
• Organizational Consolidation
• IT, Shared Services
• Organizational Structure
• Reviewing management
span of control & layers
span of control & layers
• U.S. Productivity Actions
14
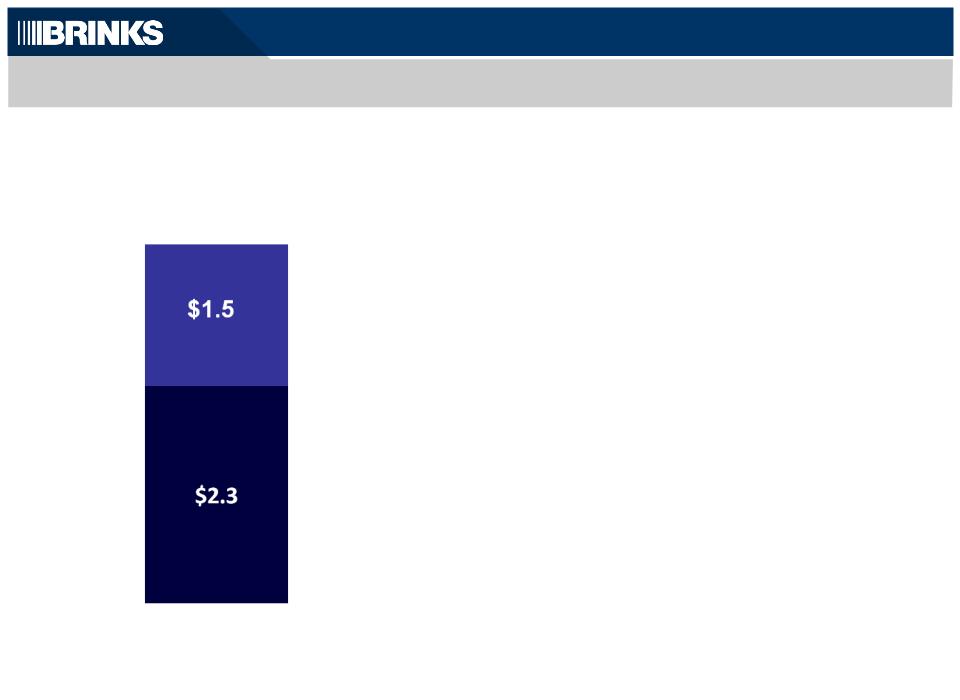
$3.8
($ billions)
2013 Costs
Non-Labor
Labor
Growth Strategy
• Latin America
• Global Services
• Integrated Managed Services /
ATMs
ATMs
• Global Payments
• Online Checkout
• Payroll and other reloadable cards
• Payment networks (ePago)
15
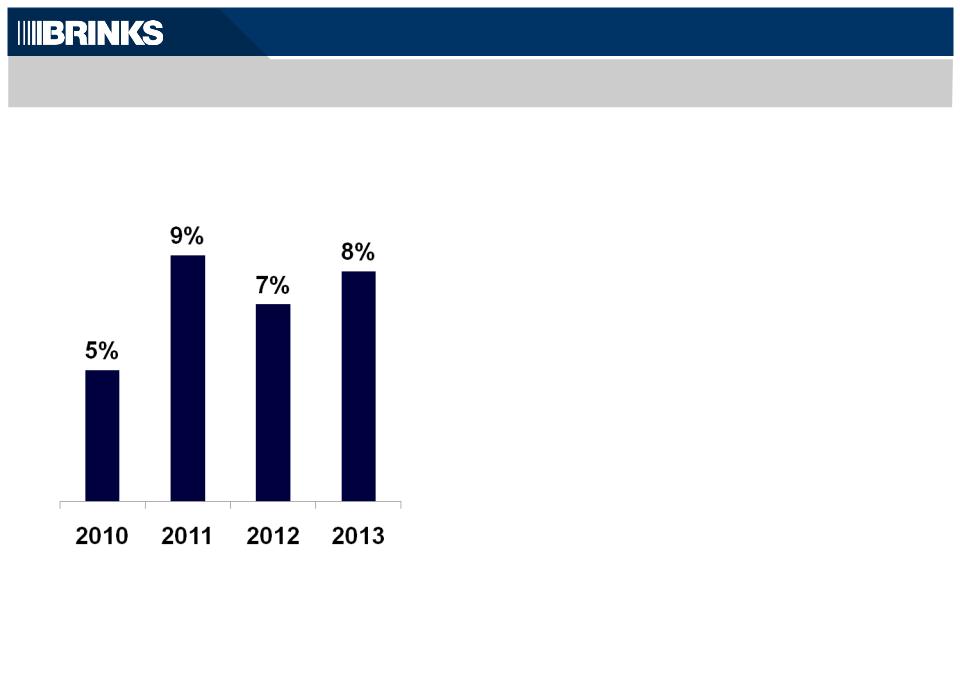
Organic Growth Rates

CEO Overview - 2014 Outlook
• Organic revenue growth 5 - 8 %
• Segment margin rate ~7%
• Cost and Productivity Improvements
• Investing in Global Payments, Brink’s IMS, Commercial
Strategy
Strategy
• Exploring U.S. Home Security Re-entry
16

The Brink’s Company
Joe Dziedzic
Vice President and Chief
Financial Officer
Financial Officer
Review and Outlook
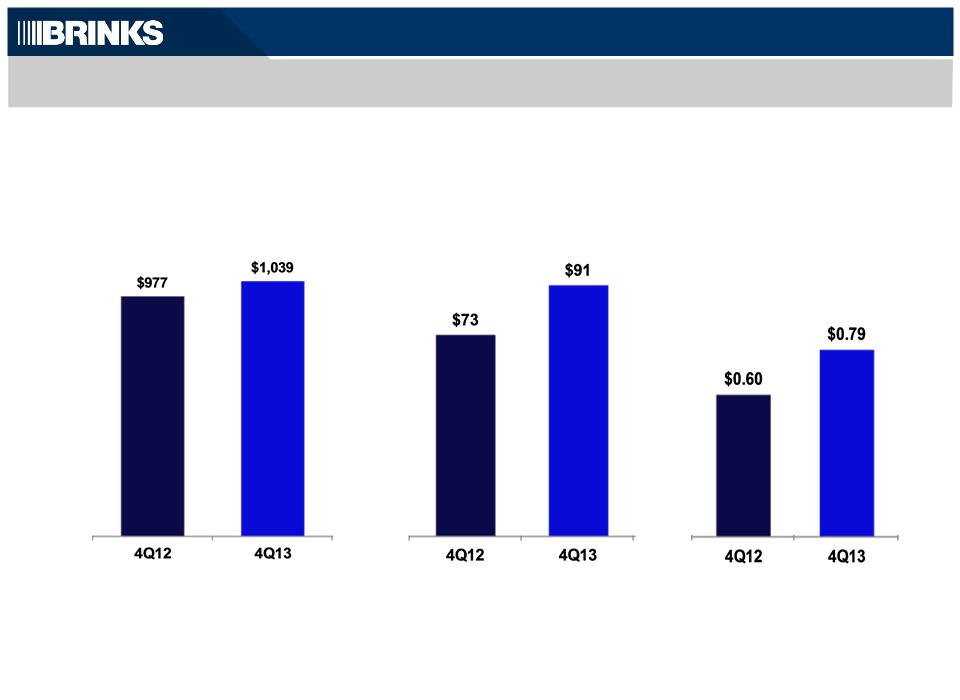
4Q13 Non-GAAP Results
($ millions, except EPS)
Note: See reconciliation to GAAP results in Appendix
18
Revenue
Segment
Operating Profit
Operating Profit
EPS
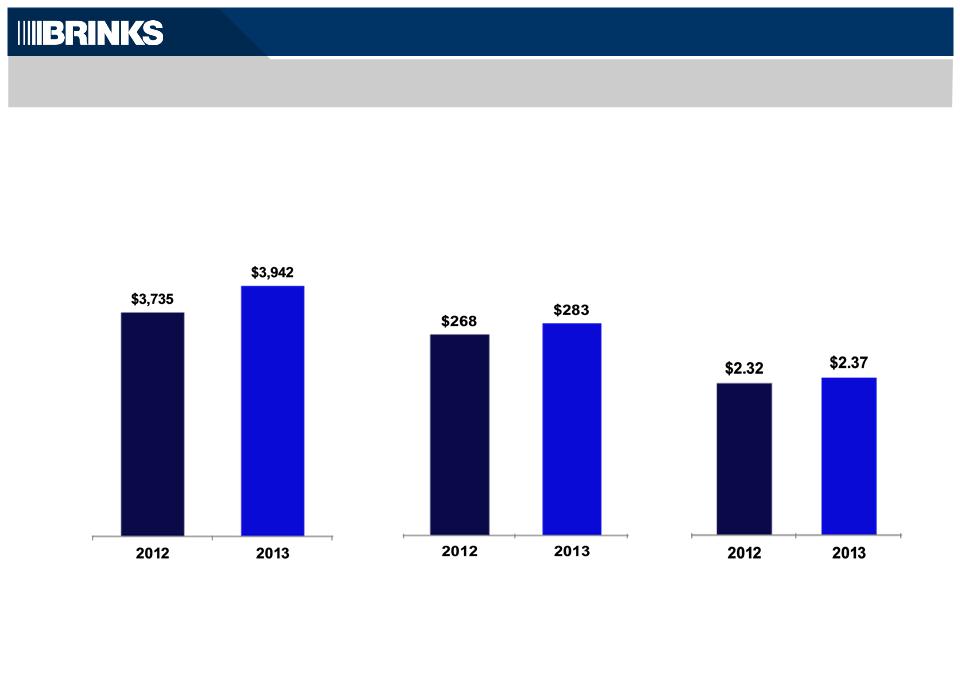
Full-Year 2013 Non-GAAP Results
($ millions, except EPS)
Note: See reconciliation to GAAP results in Appendix
19
Revenue
Segment Operating
Profit
Profit
EPS
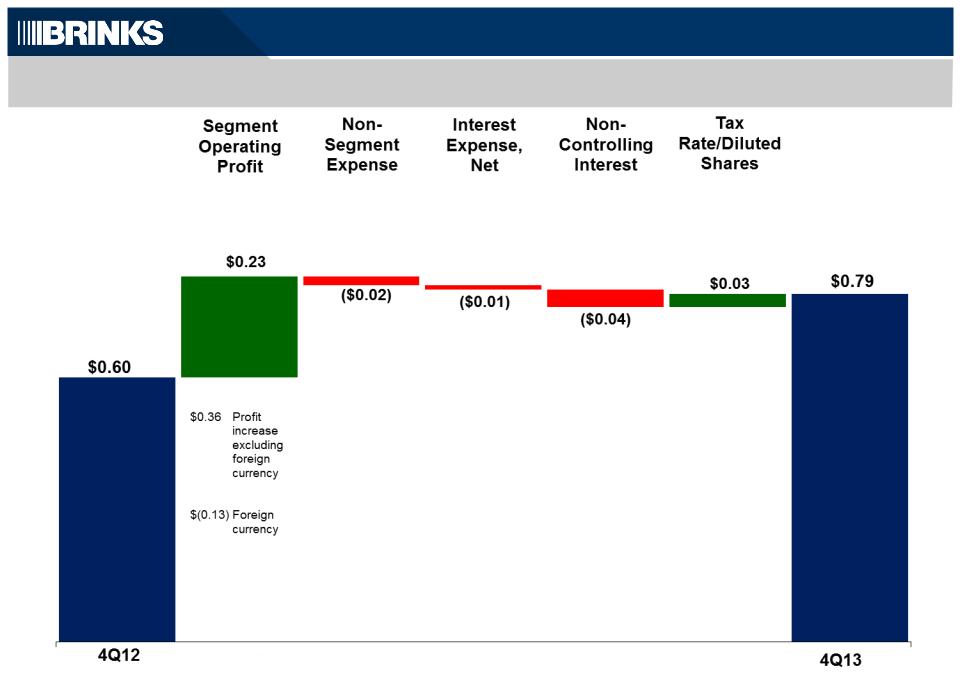
Non-GAAP EPS: 4Q12 Versus 4Q13
20
Note: See reconciliation to GAAP results in Appendix
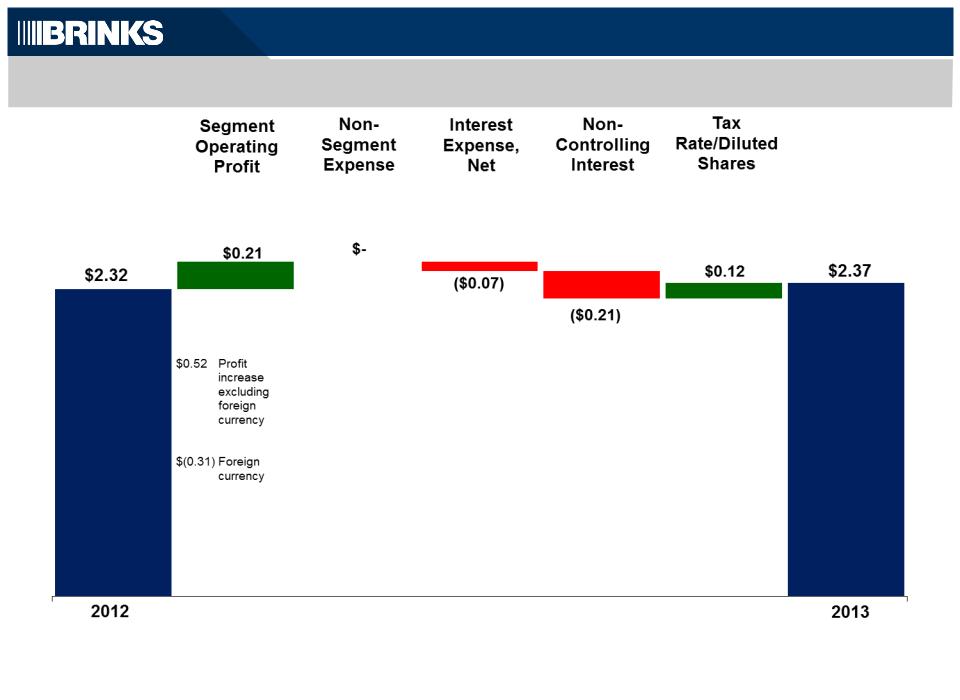
Non-GAAP EPS: Full Year 2012 Versus Full Year 2013
21
Note: See reconciliation to GAAP results in Appendix
Organic Growth Rate
2014
Guidance
Guidance
5 - 8%
22
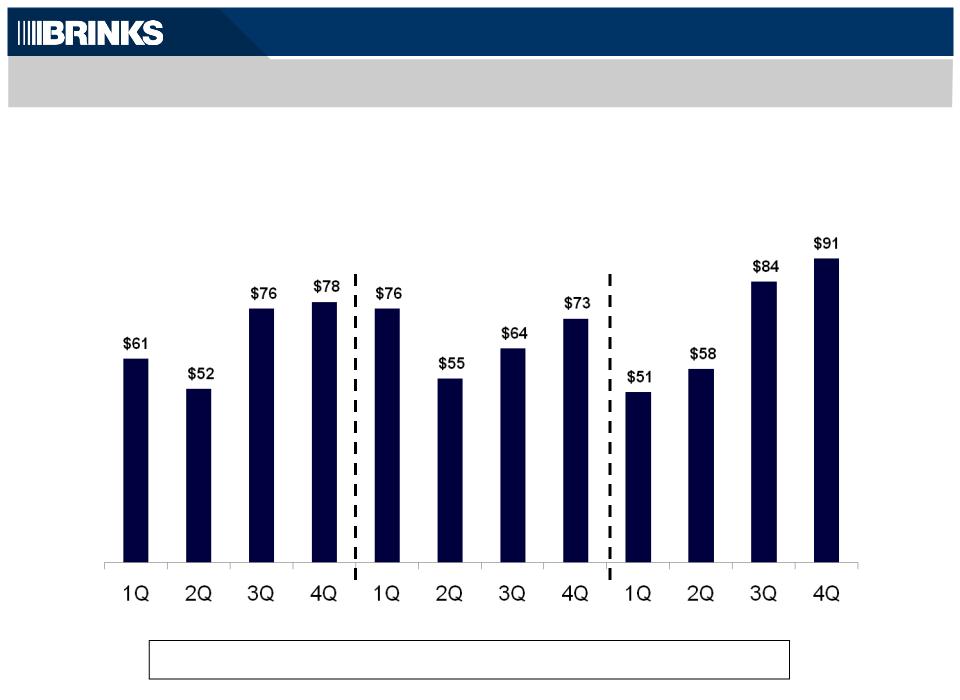
Non-GAAP Quarterly Segment Profit
23
2011
2012
2013
Second half typically stronger than first half
($ millions)
See reconciliation to GAAP results in Appendix
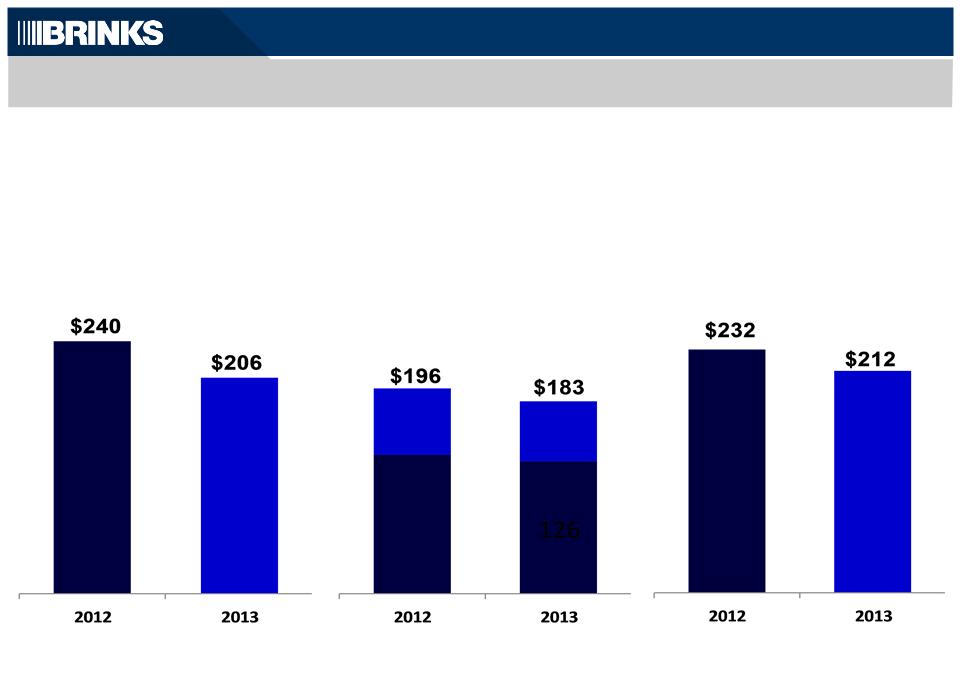
Non-GAAP Cash Flow, Capital Investment and Net Debt
24
($ millions)
(a) See reconciliation to GAAP results in Appendix
(b) From continuing operations
24
Capital
Expenditures
and Capital
Leases(b)
Expenditures
and Capital
Leases(b)
Non-GAAP
CFOA(a) (b)
CFOA(a) (b)
North
America
America
International
Net Debt (a)
$64
$57
$132
$126
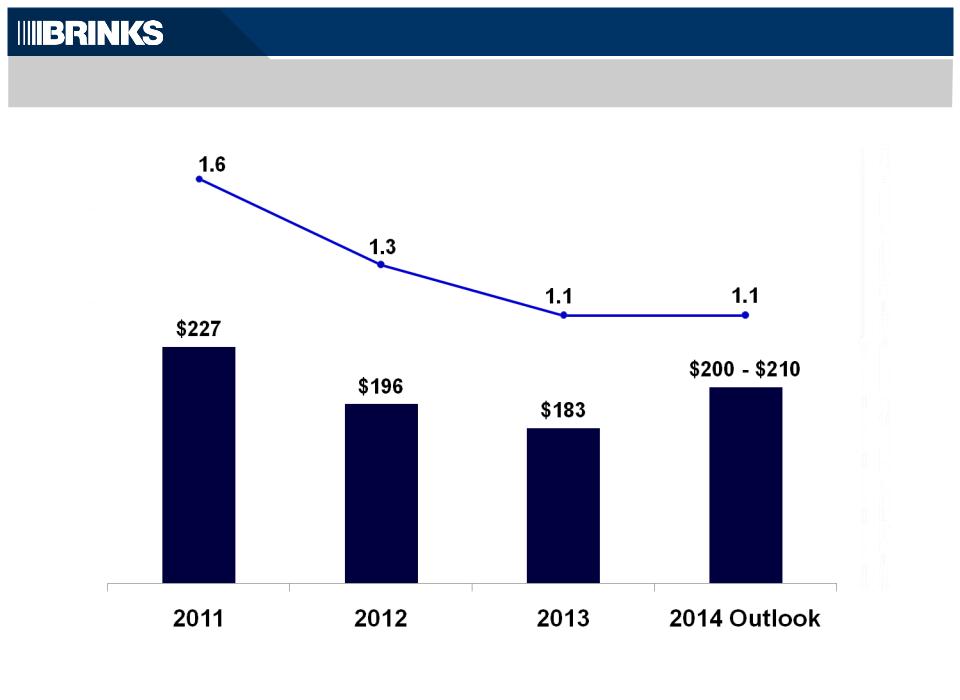
Capex Spend
Reinvestment
Ratio
Ratio
25
($ millions, except ratio)
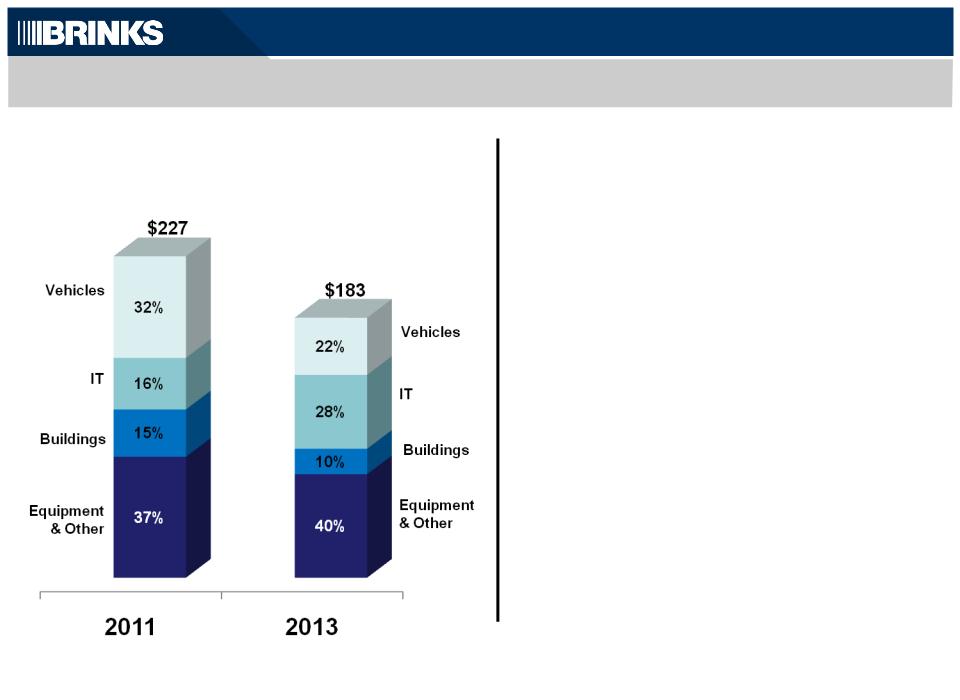
Capex Spend Mix Shift
Shifting Focus
•Shifting mix to lower maintenance
spend on vehicles and facilities
spend on vehicles and facilities
•Increased spend on IT to enable
business process productivity
business process productivity
•Continued focus on safety and
security
security
26
Legacy Liabilities - Underfunding - At December 31
27
($ millions)
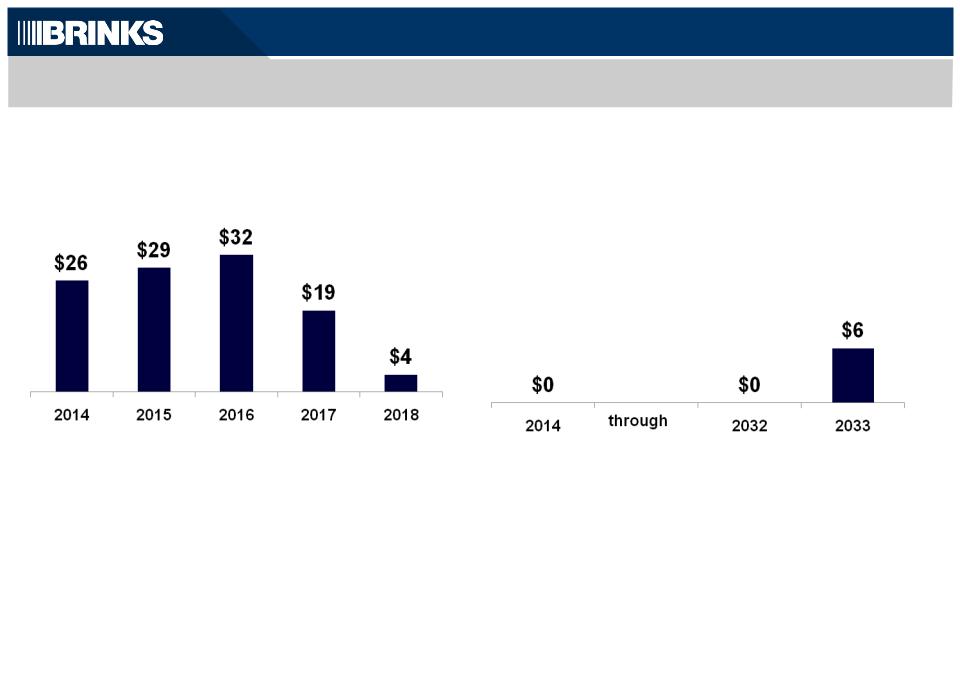
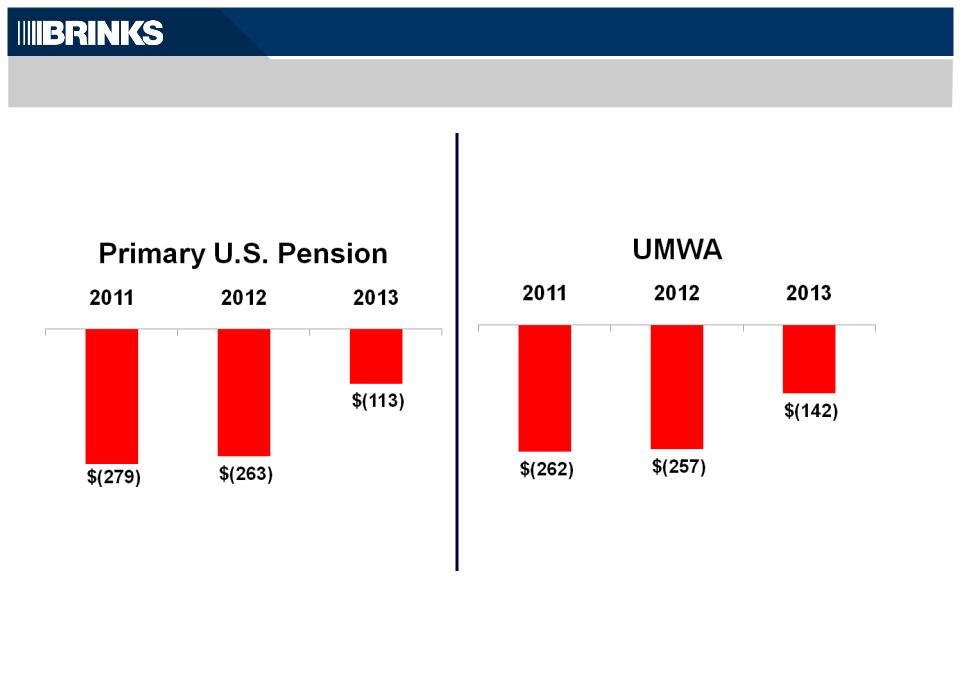
Cash Payments to Primary U.S. Pension and UMWA
• Actions in 2013 enable tax efficient use of foreign earnings in an amount
that is expected to be sufficient to fund U.S. pension payments and
certain other cash flow needs.
that is expected to be sufficient to fund U.S. pension payments and
certain other cash flow needs.
• Plan to fund future pension obligations with cash
• Cash payments to UMWA expected to resume in 2033
28
Payments to Primary U.S. Pension
Payments to UMWA

2014 Outlook
• Organic revenue growth 5 - 8 %
• Segment margin rate ~7%
• Investing in Global Payments, Brink’s IMS, Commercial
Strategy
Strategy
• Exploring U.S. Home Security Re-entry
• Assumes no Venezuela devaluation in 2014
29

The Brink’s Company
Fourth-Quarter 2013 Earnings
Conference Call
NYSE:BCO
January 30, 2014

Appendix
Non-GAAP Reconciliations
Non-GAAP Reconciliations

GAAP
Basis
Basis
Gains on Acquisitions
and Asset
Dispositions (a)
and Asset
Dispositions (a)
Net Monetary Asset
Remeasurement Losses
in Venezuela (b)
Remeasurement Losses
in Venezuela (b)
Employee Benefit
Settlement
Losses (c)
Settlement
Losses (c)
U.S. Retirement
Plans (d)
Plans (d)
Adjust
Income Tax
Rate (e)
Income Tax
Rate (e)
Non-
GAAP
Basis
GAAP
Basis
First Quarter 2013
Revenues:
Latin America
$
412.9
−
−
−
−
−
412.9
EMEA
277.8
−
−
−
−
−
277.8
Asia Pacific
36.6
−
−
−
−
−
36.6
International
727.3
−
−
−
−
−
727.3
North America
223.2
−
−
−
−
−
223.2
Revenues
$
950.5
−
−
−
−
−
950.5
Operating profit:
International
$
36.3
−
13.4
0.3
−
−
50.0
North America
(2.0)
−
−
−
2.9
−
0.9
Segment operating profit
34.3
−
13.4
0.3
2.9
−
50.9
Non-segment
(17.0)
(1.1)
−
−
10.5
−
(7.6)
Operating profit
$
17.3
(1.1)
13.4
0.3
13.4
−
43.3
Amounts attributable to Brink’s:
Income from continuing operations
$
2.9
(1.1)
8.4
0.2
8.2
0.1
18.7
Diluted EPS - continuing operations
0.06
(0.02)
0.17
−
0.17
−
0.38
Non-GAAP Reconciliations - 1Q13
Amounts may not add due to rounding. See page 36 for notes.
32

GAAP
Basis
Basis
Gains on Acquisitions
and Asset
Dispositions (a)
and Asset
Dispositions (a)
Net Monetary Asset
Remeasurement Losses
in Venezuela (b)
Remeasurement Losses
in Venezuela (b)
Employee Benefit
Settlement
Losses (c)
Settlement
Losses (c)
U.S. Retirement
Plans (d)
Plans (d)
Adjust
Income Tax
Rate (e)
Income Tax
Rate (e)
Non-
GAAP
Basis
GAAP
Basis
Second Quarter 2013
Revenues:
Latin America
$
413.6
−
−
−
−
−
413.6
EMEA
293.4
−
−
−
−
−
293.4
Asia Pacific
36.6
−
−
−
−
−
36.6
International
743.6
−
−
−
−
−
743.6
North America
226.3
−
−
−
−
−
226.3
Revenues
$
969.9
−
−
−
−
−
969.9
Operating profit:
International
$
48.1
−
−
0.5
−
−
48.6
North America
6.3
−
−
−
2.9
−
9.2
Segment operating profit
54.4
−
−
0.5
2.9
−
57.8
Non-segment
(21.6)
−
−
−
10.2
−
(11.4)
Operating profit
$
32.8
−
−
0.5
13.1
−
46.4
Amounts attributable to Brink’s:
Income from continuing operations
$
13.2
−
−
0.4
7.7
1.5
22.8
Diluted EPS - continuing operations
0.27
−
−
0.01
0.16
0.03
0.47
Non-GAAP Reconciliations - 2Q13
33
Amounts may not add due to rounding. See page 36 for notes.

GAAP
Basis
Basis
Gains on Acquisitions
and Asset
Dispositions (a)
and Asset
Dispositions (a)
Net Monetary Asset
Remeasurement Losses
in Venezuela (b)
Remeasurement Losses
in Venezuela (b)
Employee Benefit
Settlement
Losses (c)
Settlement
Losses (c)
U.S. Retirement
Plans (d)
Plans (d)
Adjust
Income Tax
Rate (e)
Income Tax
Rate (e)
Non-
GAAP
Basis
GAAP
Basis
Third Quarter 2013
Revenues:
Latin America
$
423.8
−
−
−
−
−
423.8
EMEA
301.2
−
−
−
−
−
301.2
Asia Pacific
34.9
−
−
−
−
−
34.9
International
759.9
−
−
−
−
−
759.9
North America
222.5
−
−
−
−
−
222.5
Revenues
$
982.4
−
−
−
−
−
982.4
Operating profit:
International
$
79.7
−
−
0.8
−
−
80.5
North America
0.2
−
−
−
2.9
−
3.1
Segment operating profit
79.9
−
−
0.8
2.9
−
83.6
Non-segment
(20.7)
(0.9)
−
−
10.3
−
(11.3)
Operating profit
$
59.2
(0.9)
−
0.8
13.2
−
72.3
Amounts attributable to Brink’s:
Income from continuing operations
$
29.8
(0.9)
−
0.6
7.7
(1.8)
35.4
Diluted EPS - continuing operations
0.61
(0.02)
−
0.01
0.16
(0.04)
0.72
Non-GAAP Reconciliations - 3Q13
34
Amounts may not add due to rounding. See page 36 for notes.

GAAP
Basis
Basis
Gains on Acquisitions
and Asset
Dispositions (a)
and Asset
Dispositions (a)
Net Monetary Asset
Remeasurement Losses
in Venezuela (b)
Remeasurement Losses
in Venezuela (b)
Employee Benefit
Settlement
Losses (c)
Settlement
Losses (c)
U.S. Retirement
Plans (d)
Plans (d)
Adjust
Income Tax
Rate (e)
Income Tax
Rate (e)
Non-
GAAP
Basis
GAAP
Basis
Fourth Quarter 2013
Revenues:
Latin America
$
470.4
−
−
−
−
−
470.4
EMEA
305.9
−
−
−
−
−
305.9
Asia Pacific
36.7
−
−
−
−
−
36.7
International
813.0
−
−
−
−
−
813.0
North America
226.4
−
−
−
−
−
226.4
Revenues
$
1,039.4
−
−
−
−
−
1,039.4
Operating profit:
International
$
84.0
3.1
−
0.9
−
−
88.0
North America
0.2
−
−
−
2.9
−
3.1
Segment operating profit
84.2
3.1
−
0.9
2.9
−
91.1
Non-segment
(21.8)
(0.8)
−
−
10.3
−
(12.3)
Operating profit
$
62.4
2.3
−
0.9
13.2
−
78.8
Amounts attributable to Brink’s:
Income from continuing operations
$
26.0
4.0
−
0.6
8.2
0.2
39.0
Diluted EPS - continuing operations
0.53
0.08
−
0.01
0.17
−
0.79
Non-GAAP Reconciliations - 4Q13
35
Amounts may not add due to rounding. See page 36 for notes.

GAAP
Basis
Basis
Gains on Acquisitions
and Asset
Dispositions (a)
and Asset
Dispositions (a)
Net Monetary Asset
Remeasurement Losses
in Venezuela (b)
Remeasurement Losses
in Venezuela (b)
Employee Benefit
Settlement
Losses (c)
Settlement
Losses (c)
U.S. Retirement
Plans (d)
Plans (d)
Adjust
Income Tax
Rate (e)
Income Tax
Rate (e)
Non-
GAAP
Basis
GAAP
Basis
Full Year 2013
Revenues:
Latin America
$
1,720.7
−
−
−
−
−
1,720.7
EMEA
1,178.3
−
−
−
−
−
1,178.3
Asia Pacific
144.8
−
−
−
−
−
144.8
International
3,043.8
−
−
−
−
3,043.8
North America
898.4
−
−
−
−
−
898.4
Revenues
$
3,942.2
−
−
−
−
−
3,942.2
Operating profit:
International
$
248.1
3.1
13.4
2.5
−
−
267.1
North America
4.7
−
−
−
11.6
−
16.3
Segment operating profit
252.8
3.1
13.4
2.5
11.6
−
283.4
Non-segment
(81.1)
(2.8)
−
−
41.3
−
(42.6)
Operating profit
$
171.7
0.3
13.4
2.5
52.9
−
240.8
Amounts attributable to Brink’s:
Income from continuing operations
$
71.9
2.0
8.4
1.8
31.8
−
115.9
Diluted EPS - continuing operations
1.47
0.04
0.17
0.04
0.65
−
2.37
Non-GAAP Reconciliations - Full Year 2013
36
Amounts may not add due to rounding.
(a) To eliminate:
• a $1.1 million adjustment in the first quarter of 2013 to the amount of gain recognized on a 2010 business acquisition in Mexico as a result of a favorable
adjustment to the purchase price received in the first quarter of 2013.
• $1.7 million of adjustments in the third and fourth quarters of 2013 primarily related to the January 2013 acquisition of Rede Trel in Brazil.
• $3.1 million in adjustments in the fourth quarter of 2013 primarily related to the increase in a loss contingency assumed in the 2010 Mexico acquisition and the
impairment of an intangible asset acquired in the 2009 India acquisition.
• $2.6 million tax adjustment related to the Belgium disposition.
(b) To eliminate currency exchange losses related to a 16% devaluation of the official exchange rate in Venezuela from 5.3 to 6.3 bolivar fuertes to the U.S. dollar in
February 2013.
(c) To eliminate employee benefit settlement losses in Mexico.
(d) To eliminate expenses related to U.S. retirement plans.
(e) To adjust effective income tax rate in the interim period to be equal to the full-year effective income tax rate. The full-year non-GAAP effective tax rate for 2013 is
33.3%.
33.3%.

Non-GAAP Reconciliations - 1Q12
Amounts may not add due to rounding. See page 41 for notes.
37
GAAP
Basis
Basis
Gains and Losses on
Acquisitions and
Dispositions (a)
Acquisitions and
Dispositions (a)
Employee Benefit
Settlement and
Severance Losses (b)
Settlement and
Severance Losses (b)
U.S. Retirement
Plans (c)
Plans (c)
Tax Benefit on
Change in Health
Care Funding
Strategy (d)
Change in Health
Care Funding
Strategy (d)
Adjust
Income Tax
Rate (e)
Income Tax
Rate (e)
Non-
GAAP
Basis
GAAP
Basis
First Quarter 2012
Revenues:
Latin America
$
386.3
−
−
−
−
−
386.3
EMEA
272.8
−
−
−
−
−
272.8
Asia Pacific
33.8
−
−
−
−
−
33.8
International
692.9
−
−
−
−
−
692.9
North America
224.2
−
−
−
−
−
224.2
Revenues
$
917.1
−
−
−
−
−
917.1
Operating profit:
International
$
67.1
−
0.8
−
−
−
67.9
North America
6.0
−
−
2.2
−
−
8.2
Segment operating profit
73.1
−
0.8
2.2
−
−
76.1
Non-segment
(24.3)
−
−
14.7
−
−
(9.6)
Operating profit
$
48.8
−
0.8
16.9
−
−
66.5
Amounts attributable to Brink’s:
Income from continuing operations
$
22.5
(1.2)
0.6
10.2
−
1.1
33.2
Diluted EPS - continuing operations
0.47
(0.02)
0.01
0.21
−
0.02
0.69

Non-GAAP Reconciliations - 2Q12
38
Amounts may not add due to rounding. See page 41 for notes.
GAAP
Basis
Basis
Gains and Losses on
Acquisitions and
Dispositions (a)
Acquisitions and
Dispositions (a)
Employee Benefit
Settlement and
Severance Losses (b)
Settlement and
Severance Losses (b)
U.S. Retirement
Plans (c)
Plans (c)
Tax Benefit on
Change in Health
Care Funding
Strategy (d)
Change in Health
Care Funding
Strategy (d)
Adjust
Income Tax
Rate (e)
Income Tax
Rate (e)
Non-
GAAP
Basis
GAAP
Basis
Second Quarter 2012
Revenues:
Latin America
$
375.9
−
−
−
−
−
375.9
EMEA
281.4
−
−
−
−
−
281.4
Asia Pacific
33.1
−
−
−
−
−
33.1
International
690.4
−
−
−
−
−
690.4
North America
224.2
−
−
−
−
−
224.2
Revenues
$
914.6
−
−
−
−
−
914.6
Operating profit:
International
$
41.5
−
0.3
−
−
−
41.8
North America
10.6
−
−
2.2
−
−
12.8
Segment operating profit
52.1
−
0.3
2.2
−
−
54.6
Non-segment
(21.3)
(0.9)
−
10.5
−
−
(11.7)
Operating profit
$
30.8
(0.9)
0.3
12.7
−
−
42.9
Amounts attributable to Brink’s:
Income from continuing operations
$
33.6
(0.9)
0.2
7.6
(20.9)
3.1
22.7
Diluted EPS - continuing operations
0.69
(0.02)
−
0.16
(0.43)
0.06
0.47

Non-GAAP Reconciliations - 3Q12
39
Amounts may not add due to rounding. See page 41 for notes.
GAAP
Basis
Basis
Gains and Losses on
Acquisitions and
Dispositions (a)
Acquisitions and
Dispositions (a)
Employee Benefit
Settlement and
Severance Losses (b)
Settlement and
Severance Losses (b)
U.S. Retirement
Plans (c)
Plans (c)
Tax Benefit on
Change in Health
Care Funding
Strategy (d)
Change in Health
Care Funding
Strategy (d)
Adjust
Income Tax
Rate (e)
Income Tax
Rate (e)
Non-
GAAP
Basis
GAAP
Basis
Third Quarter 2012
Revenues:
Latin America
$
385.2
−
−
−
−
−
385.2
EMEA
286.0
−
−
−
−
−
286.0
Asia Pacific
33.7
−
−
−
−
−
33.7
International
704.9
−
−
−
−
−
704.9
North America
221.3
−
−
−
−
−
221.3
Revenues
$
926.2
−
−
−
−
−
926.2
Operating profit:
International
$
59.0
(7.2)
2.0
−
−
−
53.8
North America
8.0
−
−
2.2
−
−
10.2
Segment operating profit
67.0
(7.2)
2.0
2.2
−
−
64.0
Non-segment
(22.0)
0.1
−
11.5
−
−
(10.4)
Operating profit
$
45.0
(7.1)
2.0
13.7
−
−
53.6
Amounts attributable to Brink’s:
Income from continuing operations
$
21.1
(3.0)
1.4
8.2
−
−
27.7
Diluted EPS - continuing operations
0.43
(0.06)
0.03
0.17
−
−
0.57

Non-GAAP Reconciliations - 4Q12
40
Amounts may not add due to rounding. See page 41 for notes.
GAAP
Basis
Basis
Gains and Losses on
Acquisitions and
Dispositions (a)
Acquisitions and
Dispositions (a)
Employee Benefit
Settlement and
Severance Losses (b)
Settlement and
Severance Losses (b)
U.S. Retirement
Plans (c)
Plans (c)
Tax Benefit on
Change in Health
Care Funding
Strategy (d)
Change in Health
Care Funding
Strategy (d)
Adjust
Income Tax
Rate (e)
Income Tax
Rate (e)
Non-
GAAP
Basis
GAAP
Basis
Fourth Quarter 2012
Revenues:
Latin America
$
432.0
−
−
−
−
−
432.0
EMEA
285.7
−
−
−
−
−
285.7
Asia Pacific
35.8
−
−
−
−
−
35.8
International
753.5
−
−
−
−
−
753.5
North America
223.6
−
−
−
−
−
223.6
Revenues
$
977.1
−
−
−
−
−
977.1
Operating profit:
International
$
64.4
(1.3)
0.8
−
−
−
63.9
North America
7.3
−
−
2.2
−
−
9.5
Segment operating profit
71.7
(1.3)
0.8
2.2
−
−
73.4
Non-segment
(21.3)
−
−
10.7
−
−
(10.6)
Operating profit
$
50.4
(1.3)
0.8
12.9
−
−
62.8
Amounts attributable to Brink’s:
Income from continuing operations
$
34.0
(8.9)
0.6
7.8
(0.2)
(4.2)
29.1
Diluted EPS - continuing operations
0.70
(0.18)
0.01
0.16
−
(0.09)
0.60

Non-GAAP Reconciliations - Full Year 2012
41
Amounts may not add due to rounding.
GAAP
Basis
Basis
Gains and Losses on
Acquisitions and
Dispositions (a)
Acquisitions and
Dispositions (a)
Employee Benefit
Settlement and
Severance Losses (b)
Settlement and
Severance Losses (b)
U.S. Retirement
Plans (c)
Plans (c)
Tax Benefit on
Change in Health
Care Funding
Strategy (d)
Change in Health
Care Funding
Strategy (d)
Adjust
Income Tax
Rate (e)
Income Tax
Rate (e)
Non-
GAAP
Basis
GAAP
Basis
Full Year 2012
Revenues:
Latin America
$
1,579.4
−
−
−
−
−
1,579.4
EMEA
1,125.9
−
−
−
−
−
1,125.9
Asia Pacific
136.4
−
−
−
−
−
136.4
International
2,841.7
−
−
−
−
−
2,841.7
North America
893.3
−
−
−
−
−
893.3
Revenues
$
3,735.0
−
−
−
−
−
3,735.0
Operating profit:
International
$
232.0
(8.5)
3.9
−
−
−
227.4
North America
31.9
−
−
8.8
−
−
40.7
Segment operating profit
263.9
(8.5)
3.9
8.8
−
−
268.1
Non-segment
(88.9)
(0.8)
−
47.4
−
−
(42.3)
Operating profit
$
175.0
(9.3)
3.9
56.2
−
−
225.8
Amounts attributable to Brink’s:
Income from continuing operations
$
111.2
(14.0)
2.8
33.8
(21.1)
−
112.7
Diluted EPS - continuing operations
2.29
(0.29)
0.06
0.70
(0.43)
−
2.32
(a) To eliminate:
• Gains related to the sale of investments in mutual fund securities ($1.9 million in the first quarter and $0.5 million in the third quarter). Proceeds from the sales were
used to fund the settlement of pension obligations related to our former chief executive officer, and former chief administrative officer.
• Gains and losses related to business acquisitions and dispositions. A $0.9 million gain was recognized in the second quarter and a $0.1 million loss was recognized in
the third quarter. In the fourth quarter of 2012, tax expense included a benefit of $7.5 million related to a reduction in an income tax accrual established as part of the
2010 acquisition of subsidiaries in Mexico, and pretax income included a $2.1 million favorable adjustment to the local profit sharing accrual as a result of the change in tax expectation.
• Third-quarter gain on the sale of real estate in Venezuela ($7.2 million).
(b) To eliminate employee benefit settlement and acquisition-related severance losses (Mexico and Argentina). Employee termination benefits in Mexico are accounted for
under FASB ASC Topic 715, Compensation - Retirement Benefits.
(c) To eliminate expenses related to U.S. retirement plans.
(d) To eliminate tax benefit related to change in retiree health care funding strategy.
(e) To adjust effective income tax rate in the interim period to be equal to the full-year non-GAAP effective income tax rate. The full-year non-GAAP effective tax rate for 2012
was 36.6%.
was 36.6%.

Non-GAAP Reconciliations - 1Q11
Amounts may not add due to rounding. See page 46 for notes.
42
GAAP Basis | Gains on Acquisitions and Asset Dispositions (a) | Mexico Employee Benefit Settlement Losses (b) | CEO Retirement Costs (c) | U.S. Retirement Plans (d) | Non-GAAP Basis | |||||||||||
First Quarter 2011 | ||||||||||||||||
Revenues: | ||||||||||||||||
Latin America | $ | 332.3 | − | − | − | − | 332.3 | |||||||||
EMEA | 270.2 | − | − | − | − | 270.2 | ||||||||||
Asia Pacific | 31.9 | − | − | − | − | 31.9 | ||||||||||
International | 634.4 | − | − | − | − | 634.4 | ||||||||||
North America | 226.9 | − | − | − | − | 226.9 | ||||||||||
Revenues | $ | 861.3 | − | − | − | − | 861.3 | |||||||||
Operating profit: | ||||||||||||||||
International | $ | 53.9 | − | − | − | − | 53.9 | |||||||||
North America | 6.8 | − | − | − | 0.7 | 7.5 | ||||||||||
Segment operating profit | 60.7 | − | − | − | 0.7 | 61.4 | ||||||||||
Non-segment | (15.0) | (0.4) | − | − | 6.2 | (9.2) | ||||||||||
Operating profit | $ | 45.7 | (0.4) | − | − | 6.9 | 52.2 | |||||||||

Non-GAAP Reconciliations - 2Q11
43
Amounts may not add due to rounding. See page 46 for notes.
GAAP Basis | Gains on Acquisitions and Asset Dispositions (a) | Mexico Employee Benefit Settlement Losses (b) | CEO Retirement Costs (c) | U.S. Retirement Plans (d) | Non-GAAP Basis | |||||||||||
Second Quarter 2011 | ||||||||||||||||
Revenues: | ||||||||||||||||
Latin America | $ | 360.5 | − | − | − | − | 360.5 | |||||||||
EMEA | 292.8 | − | − | − | − | 292.8 | ||||||||||
Asia Pacific | 34.1 | − | − | − | − | 34.1 | ||||||||||
International | 687.4 | − | − | − | − | 687.4 | ||||||||||
North America | 233.9 | − | − | − | − | 233.9 | ||||||||||
Revenues | $ | 921.3 | − | − | − | − | 921.3 | |||||||||
Operating profit: | ||||||||||||||||
International | $ | 40.5 | − | 1.0 | − | − | 41.5 | |||||||||
North America | 9.9 | − | − | − | 0.8 | 10.7 | ||||||||||
Segment operating profit | 50.4 | − | 1.0 | − | 0.8 | 52.2 | ||||||||||
Non-segment | (16.2) | − | − | − | 6.2 | (10.0) | ||||||||||
Operating profit | $ | 34.2 | − | 1.0 | − | 7.0 | 42.2 | |||||||||

Non-GAAP Reconciliations - 3Q11
44
Amounts may not add due to rounding. See page 46 for notes.
GAAP Basis | Gains on Acquisitions and Asset Dispositions (a) | Mexico Employee Benefit Settlement Losses (b) | CEO Retirement Costs (c) | U.S. Retirement Plans (d) | Non-GAAP Basis | |||||||||||
Third Quarter 2011 | ||||||||||||||||
Revenues: | ||||||||||||||||
Latin America | $ | 375.1 | − | − | − | − | 375.1 | |||||||||
EMEA | 296.5 | − | − | − | − | 296.5 | ||||||||||
Asia Pacific | 35.5 | − | − | − | − | 35.5 | ||||||||||
International | 707.1 | − | − | − | − | 707.1 | ||||||||||
North America | 231.5 | − | − | − | − | 231.5 | ||||||||||
Revenues | $ | 938.6 | − | − | − | − | 938.6 | |||||||||
Operating profit: | ||||||||||||||||
International | $ | 66.3 | − | 0.7 | − | − | 67.0 | |||||||||
North America | 8.1 | − | − | − | 0.8 | 8.9 | ||||||||||
Segment operating profit | 74.4 | − | 0.7 | − | 0.8 | 75.9 | ||||||||||
Non-segment | (7.6) | (9.3) | − | − | 6.2 | (10.7) | ||||||||||
Operating profit | $ | 66.8 | (9.3) | 0.7 | − | 7.0 | 65.2 | |||||||||

Non-GAAP Reconciliations - 4Q11
45
GAAP Basis | Gains on Acquisitions and Asset Dispositions (a) | Mexico Employee Benefit Settlement Losses (b) | CEO Retirement Costs (c) | U.S. Retirement Plans (d) | Non-GAAP Basis | |||||||||||
Fourth Quarter 2011 | ||||||||||||||||
Revenues: | ||||||||||||||||
Latin America | $ | 392.8 | − | − | − | − | 392.8 | |||||||||
EMEA | 283.5 | − | − | − | − | 283.5 | ||||||||||
Asia Pacific | 34.3 | − | − | − | − | 34.3 | ||||||||||
International | 710.6 | − | − | − | − | 710.6 | ||||||||||
North America | 231.1 | − | − | − | − | 231.1 | ||||||||||
Revenues | $ | 941.7 | − | − | − | − | 941.7 | |||||||||
Operating profit: | ||||||||||||||||
International | $ | 71.3 | − | 0.4 | − | − | 71.7 | |||||||||
North America | 5.5 | − | − | − | 0.9 | 6.4 | ||||||||||
Segment operating profit | 76.8 | − | 0.4 | − | 0.9 | 78.1 | ||||||||||
Non-segment | (21.0) | − | − | 4.1 | 6.2 | (10.7) | ||||||||||
Operating profit | $ | 55.8 | − | 0.4 | 4.1 | 7.1 | 67.4 | |||||||||
Amounts may not add due to rounding. See page 46 for notes.

Non-GAAP Reconciliations - Full Year 2011
46
(a) To eliminate gains as follows:
(b) To eliminate employee benefit settlement loss related to Mexico. Portions of Brink’s Mexican subsidiaries’ accrued employee termination benefit were paid in the
second and third quarters of 2011. The employee termination benefit is accounted for under FASB ASC Topic 715, Compensation - Retirement Benefits. Accordingly, the
severance payments resulted in settlement losses.
second and third quarters of 2011. The employee termination benefit is accounted for under FASB ASC Topic 715, Compensation - Retirement Benefits. Accordingly, the
severance payments resulted in settlement losses.
(c) To eliminate the costs related to the retirement of the former chief executive officer.
(d) To eliminate costs related to U.S. retirement liabilities.
First Quarter 2011 | Third Quarter 2011 | Full Year 2011 | ||||||||
Operating Profit | Operating Profit | Operating Profit | ||||||||
Sale of U.S. Document Destruction business | $ | - | (6.7) | (6.7) | ||||||
Acquisition of controlling interests | (0.4) | (2.1) | (2.5) | |||||||
Sale of former operating assets | - | (0.5) | (0.5) | |||||||
$ | (0.4) | (9.3) | (9.7) | |||||||
Amounts may not add due to rounding.
GAAP Basis | Gains on Acquisitions and Asset Dispositions (a) | Mexico Employee Benefit Settlement Losses (b) | CEO Retirement Costs (c) | U.S. Retirement Plans (d) | Non-GAAP Basis | |||||||||||
Full Year 2011 | ||||||||||||||||
Revenues: | ||||||||||||||||
Latin America | $ | 1,460.7 | − | − | − | − | 1,460.7 | |||||||||
EMEA | 1,143.0 | − | − | − | − | 1,143.0 | ||||||||||
Asia Pacific | 135.8 | − | − | − | − | 135.8 | ||||||||||
International | 2,739.5 | − | − | − | − | 2,739.5 | ||||||||||
North America | 923.4 | − | − | − | − | 923.4 | ||||||||||
Revenues | $ | 3,662.9 | − | − | − | − | 3,662.9 | |||||||||
Operating profit: | ||||||||||||||||
International | $ | 232.0 | − | 2.1 | − | − | 234.1 | |||||||||
North America | 30.3 | − | − | − | 3.2 | 33.5 | ||||||||||
Segment operating profit | 262.3 | − | 2.1 | − | 3.2 | 267.6 | ||||||||||
Non-segment | (59.8) | (9.7) | − | 4.1 | 24.8 | (40.6) | ||||||||||
Operating profit | $ | 202.5 | (9.7) | 2.1 | 4.1 | 28.0 | 227.0 | |||||||||
Non-GAAP Reconciliations - Cash Flows
(a) To eliminate the change in the balance of customer obligations related to cash received and processed in certain of our Cash Management
Services operations. The title to this cash transfers to us for a short period of time. The cash is generally credited to customers’ accounts the
following day and we do not consider it as available for general corporate purposes in the management of our liquidity and capital resources.
(b) To eliminate cash flows related to our discontinued operations.
Non-GAAP cash flows from operating activities is a supplemental financial measure that is not required by, or presented in accordance with
GAAP. The purpose of the non-GAAP cash flows from operating activities is to report financial information excluding the impact of cash received
and processed in certain of our secure Cash Management Service operations and without cash flows from discontinued operations. Brink’s
believes these measures are helpful in assessing cash flows from operations, enable period-to-period comparability and are useful in predicting
future operating cash flows. Non-GAAP cash flows from operating activities should not be considered as an alternative to cash flows from
operating activities determined in accordance with GAAP and should be read in conjunction with our consolidated statements of cash flows.
2013 | 2012 | |||||
Cash flows from operating activities - GAAP | $ | 201.5 | $ | 250.5 | ||
Decrease (increase) in certain customer obligations (a) | 9.8 | (15.7) | ||||
Cash outflows (inflows) related to discontinued operations (b) | (5.4) | 4.9 | ||||
Cash flows from operating activities - Non-GAAP | $ | 205.9 | $ | 239.7 | ||
47
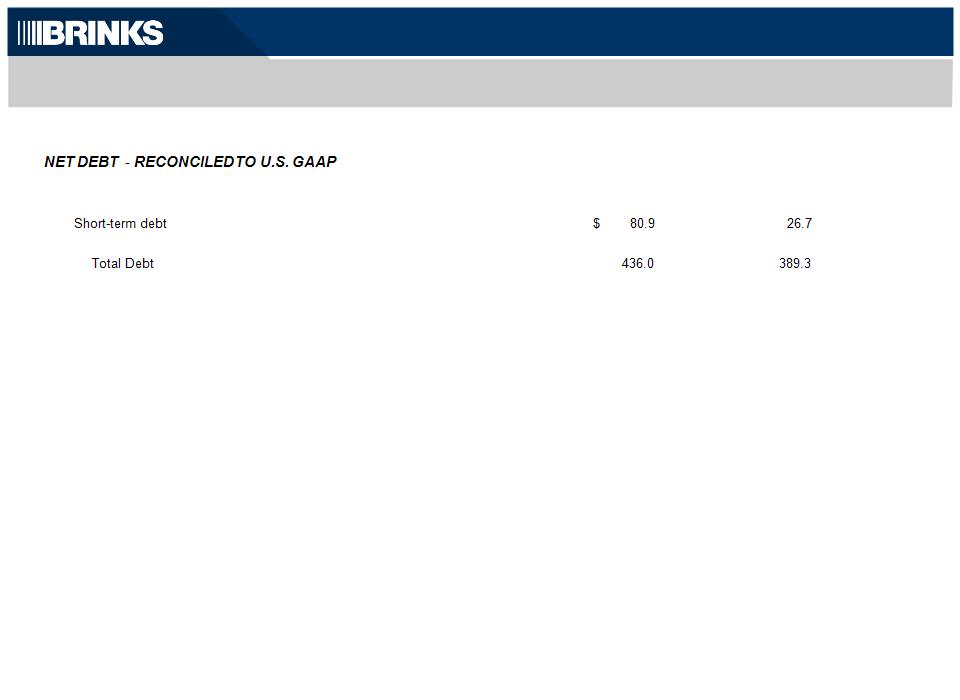
December 31, | December 31, | |||||||
2013 | 2012 | |||||||
Debt: | ||||||||
Long-term debt | 355.1 | 362.6 | ||||||
Less: | ||||||||
Cash and cash equivalents | 255.5 | 201.7 | ||||||
Amounts held by Cash Management Services operations (a) | (31.3) | (44.0) | ||||||
Cash and cash equivalents available for general corporate purposes | 224.2 | 157.7 | ||||||
Net Debt | $ | 211.8 | 231.6 | |||||
(a) Title to cash received and processed in certain of our Cash Management Services operations transfers to us for a short period of time.
The cash is generally credited to customers’ accounts the following day and we do not consider it as available for general corporate
purposes in the management of our liquidity and capital resources and in our computation of Net Debt.
purposes in the management of our liquidity and capital resources and in our computation of Net Debt.
Net Debt is a supplemental financial measure that is not required by, or presented in accordance with GAAP. We use Net Debt as a measure of
our financial leverage. We believe that investors also may find Net Debt to be helpful in evaluating our financial leverage. Net Debt should not
be considered as an alternative to Debt determined in accordance with GAAP and should be reviewed in conjunction with our consolidated
balance sheets. Set forth above is a reconciliation of Net Debt, a non-GAAP financial measure, to Debt, which is the most directly comparable
financial measure calculated and reported in accordance with GAAP. Net Debt excluding cash and debt in Venezuelan operations was $306
million at December 31, 2013, and $280 million at December 31, 2012.
Non-GAAP Reconciliations - Net Debt
48

The Brink’s Company
Fourth-Quarter 2013 Earnings
Conference Call
NYSE:BCO
January 30, 2014