February 23, 2006 Consumer Analyst Group of New York Conference Exhibit 99.1 |
Page 2 Please note that the information included in this presentation contains statements relating to future results, which are forward-looking statements as that term is defined in the Private Securities Litigation Reform Act of 1995. We caution you that these forward-looking statements speak only as of the date hereof and we have no obligation to update them. Actual results may differ materially from those projected as a result of certain risks and uncertainties, including the risks described in our securities filings. Fortune Brands does not endorse or adopt the analyst estimates in this presentation. This presentation includes certain non-GAAP measures, including Underlying Net Sales, Operating Margin Before Charges/Gains, EPS Before Charges/Gains, ROIC Before Charges/Gains and Free Cash Flow. These measures are reconciled to GAAP in the appendix, should not be considered as substitutes for GAAP measures and may be inconsistent with similar measures presented by other companies. |
Page 3 REINTRODUCING FORTUNE BRANDS • A more sharply-focused, high-performance consumer brands company • Stronger than a year ago • Committed to: • Creating value • Building brands • Delivering results |
Page 4 PORTFOLIO REALIGNMENT: 2 MAJOR MOVES MAJOR SPIRITS & WINE ACQUISITION • Strengthens and leverages highest return business • Global growth brands • International strength • Distribution efficiencies INNOVATIVE SPIN-OFF/MERGER OF OFFICE PRODUCTS UNIT • Exited least consumer-oriented business Creating Value |
Page 5 CREATING A NEW GLOBAL LEADER IN PREMIUM SPIRITS & WINE • Expanded breadth and quality of portfolio • Boosted international strength Spirits & Wine Acquisition Forecasting 35+ cents per share benefit in 2006. |
Page 6 • Successfully fixed/repositioned • Ready to pursue consolidation on own • Excellent fit with GBC Office Products Spin-Off/Merger $1.4 billion in value for Fortune Brands shareholders. STRUCTURED TO MAXIMIZE VALUE FOR SHAREHOLDERS |
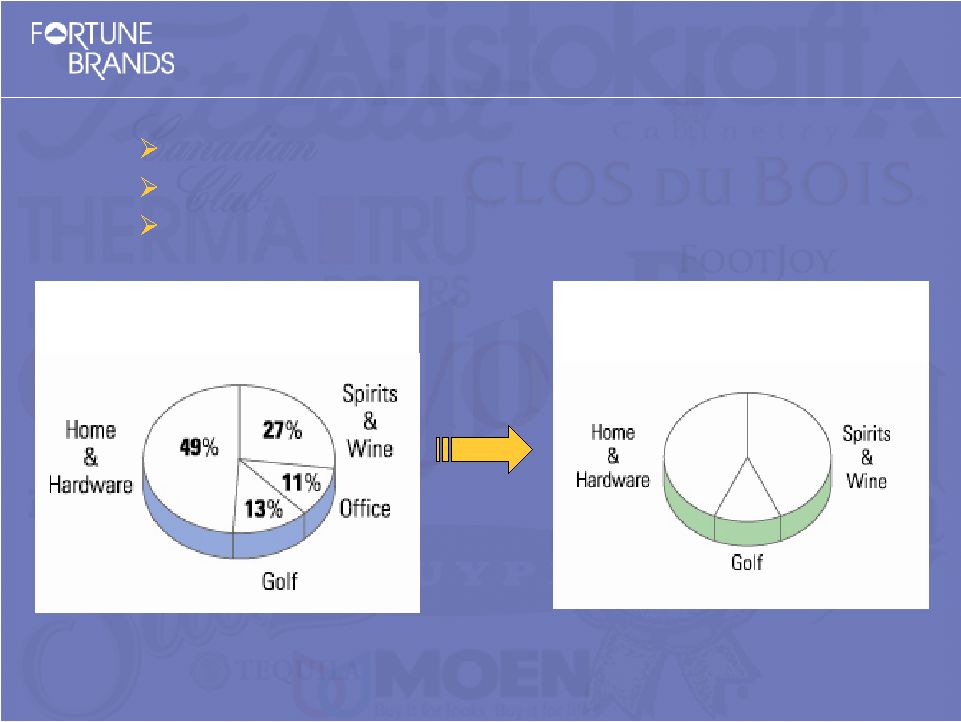
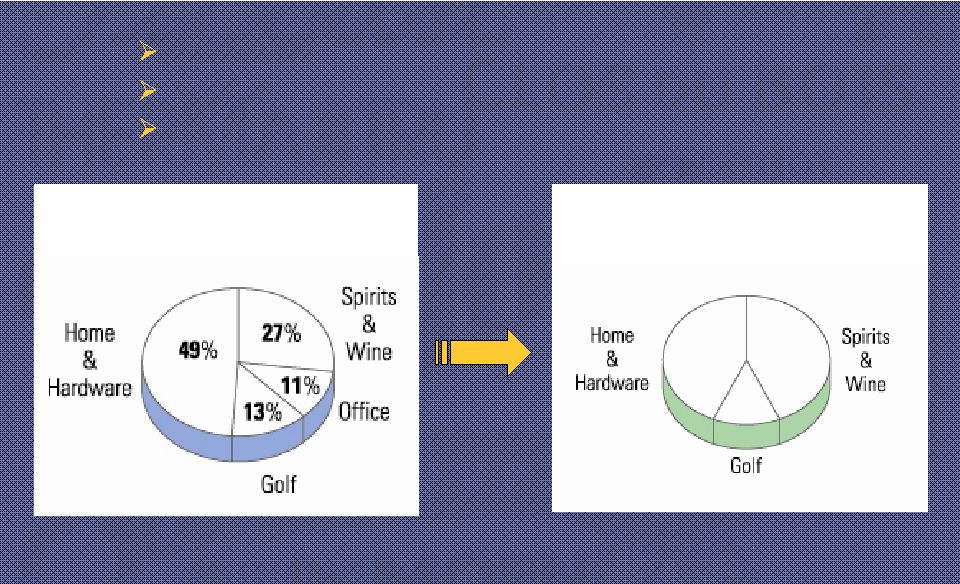
Page 7 Portfolio Realignment Creates Value SHARPENS FOCUS ON HIGHEST RETURN BUSINESSES CREATES MORE BALANCED PORTFOLIO CREATES MORE ATTRACTIVE GROWTH PROFILE % of Fortune Brands’ Operating Income Before Charges 2004 New Profit Mix |
Page 8 2000 2005 Adjusted Run Rate (1) Sales: $5.6 billion $8.3 billion • 7% CAGR internal sales (4% including Office) • $2.7 billion acquired sales • $1.5 billion divested sales OI (2) Margin: 13% ~18% Segment Sales Home & Hardware: $2.0 billion $4.7 billion Spirits & Wine: $1.0 billion $2.3 billion Golf: $1.0 billion $1.3 billion Stronger Growth Profile (1) Excluding Office and including recent acquisitions for full year 2005: S&W acquisition with $1.1 billion pro forma 2005 sales expected to add 35 cents or more EPS, and pending SBR/Simonton acquisition with $565 million sales expected to add 6-8 cents EPS. (2) Before charges. 2000 GAAP OI margin of 3% including total charges of $576 million ($550 million from Office). 2005 GAAP OI margin of 16% including total charges of $20 million. |
Page 9 LEADING CONSUMER BRANDS ATTRACTIVE CONSUMER CATEGORIES INTERNAL GROWTH REMAINS PRIORITY #1 What Drives Us |
Page 10 1. INVESTING TO GROW OUR LEADING CONSUMER BRANDS. 2. TRANSFORMING OPERATIONS TO IMPROVE PERFORMANCE AND COST STRUCTURES. 3. STRATEGICALLY POSITIONING BUSINESSES FOR STRONGER GROWTH AND HIGHER RETURNS. 4. LEVERAGING FINANCIAL STRENGTH TO DRIVE SHAREHOLDER VALUE HIGHER. How We Deliver: Consistent Growth Strategy Track record of consistently strong results. |
Page 11 2005 +7% 17% +12% (3) 11% (3) $407 (4) 2004 +11% 17% +23% 16% $393 2003 +8% 17% +18% 17% $442 2002 +8% 17% +18% 17% $447 2001 +1% 16% +5% 14% $287 2000 +7% 17% +18% 13% $113 1999 +7% 16% +19% 12% $122 1998 +5% 15% +13% 11% $ 11 1997 +4% 15% +16% 12% $ 96 (1) Before charges/gains. (2) Current FAS 142 amortization 1996-02. (3) Continuing Operations. (4) Before impact of S&W acquisition. Continuing Operations Underlying Operating Diluted Free Cash Sales Growth Margin (1,2) EPS Growth (1) ROIC (1) Flow (mm) (After Dividends) Delivering Consistently Strong Results |
Page 12 Meeting the Growth Challenge PRIORITIES: • Internal growth in all businesses • Targeted development in Home & Hardware, Spirits & Wine |
Page 13 Building Brands to Win in the Marketplace INVEST IN INNOVATION: • Based on consumer insights • Behavioral research • Technological research • Helps influence categories, pricing INVEST IN HIGH-IMPACT MARKETING & ADVERTISING: • Highly targeted TV, print, online, point-of-sale and promotions 20%+ SALES FROM NEW PRODUCTS |
Page 15 Creating Strategic Advantages to Win In the Marketplace PARTNER OF CHOICE: • Creativity forges unique alliances • Superior customer service creates valuable supplier relationships |
Page 16 • #1 and growing: Moen, Titleist, Jim Beam, Therma-Tru, Master Lock, FootJoy, Knob Creek, Maker’s Mark, Laphroaig • #2 and growing: Cabinets (including Aristokraft, Omega, Diamond, KitchenCraft), Sauza, Canadian Club, Clos du Bois Strategy Fueling Market Leadership 90% SALES FROM #1/#2 MARKET POSITIONS |
Page 17 • • Strong market positions: Strong market positions: • • Moen, #1 Moen, #1 • • Cabinetry, #2 Cabinetry, #2 • • Therma-Tru, #1 Therma-Tru, #1 • • Master Lock, #1 Master Lock, #1 • • Waterloo, #1 Waterloo, #1 Home & Hardware $4.15 billion $4.15 billion sales in 2005, +10% sales in 2005, +10% • • ~16% OI margin ~16% OI margin • • 30%+ RONTA 30%+ RONTA (1) (1) (after tax) (after tax) 2006 target: 2006 target: Mid-single-digit OI growth Mid-single-digit OI growth (1) After-tax OI return on net tangible assets. |
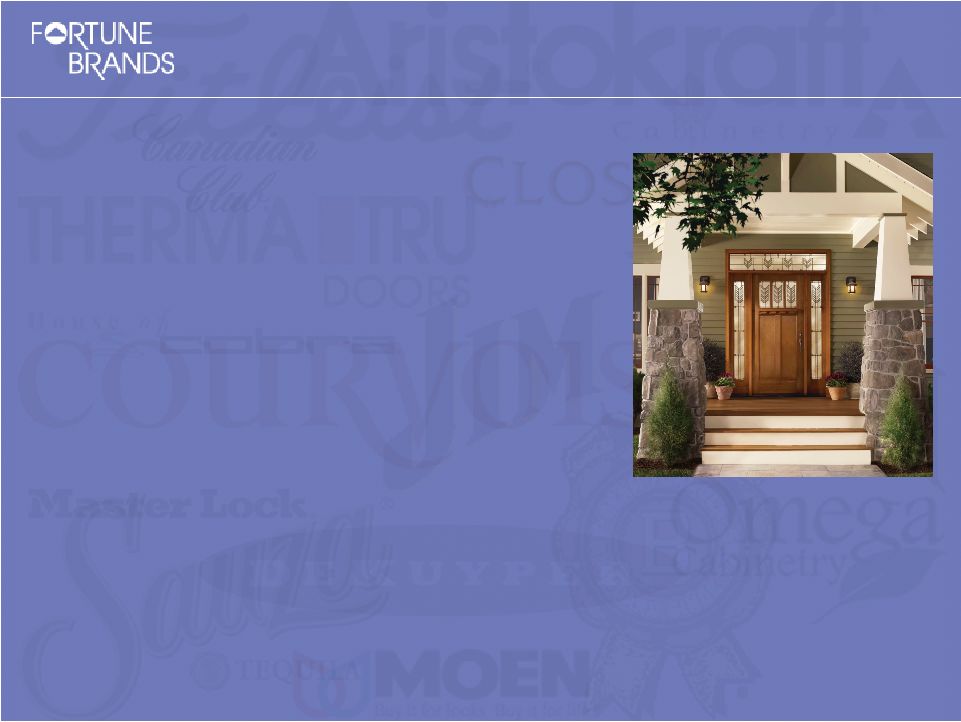
Page 18 Home Improvement Market Growing WE EXPECT ANOTHER GOOD YEAR IN 2006 GREAT DEMOGRAPHICS: • Growth in number of households • Rising household wealth • Aging of housing stock (avg. 30+ years) • Baby-boomers entering prime remodeling years • Kitchens & baths getting larger • Homeowners seeking energy efficiency (doors, windows) • Kitchens, baths, entry doors/windows provide excellent return on investment; add value to home • Replace & remodel 2/3 of market |
Page 19 • Announced February 10, 2006 – pending close • Materials conversion: vinyl more than half of fragmented market and growing • #3 vinyl-framed windows brand; leader in retrofit • Innovative: StormBreaker Plus • Nationwide distribution, 7-day delivery • Cost synergies across Home & Hardware • EPS benefit: 6-8 cents expected in first 12 months Acquisition of Simonton Windows |
Page 20 How We’re Sustaining Growth DRIVING INTERNAL GROWTH WITH INNOVATION AND SHARE-GAIN INITIATIVES: • Commitment to customers earns partner-of-choice status • Diamond & Therma-Tru at Lowe’s; Thomasville at Home Depot; Schrock at Menards; supplier to all top 10 builders • Knowledge of consumers drives new products • Innovative cabinet storage solutions; new finishes • Moen ChoiceFlo, ShowHouse luxury brand • New categories create growth • Therma-Tru – patio doors • Master Lock – towing and automotive |
Page 21 How We’re Sustaining Growth STRENGTH & BALANCE ACROSS CHANNELS OF DISTRIBUTION: • Kitchen & bath predominantly replace/remodel • New construction just 30-40% of segment sales (~20% total Fortune Brands) • No single customer more than 5% Fortune Brands’ sales CONTINUAL SUPPLY-CHAIN EXCELLENCE: • Contains costs, promotes efficiencies • Enhances customer service |
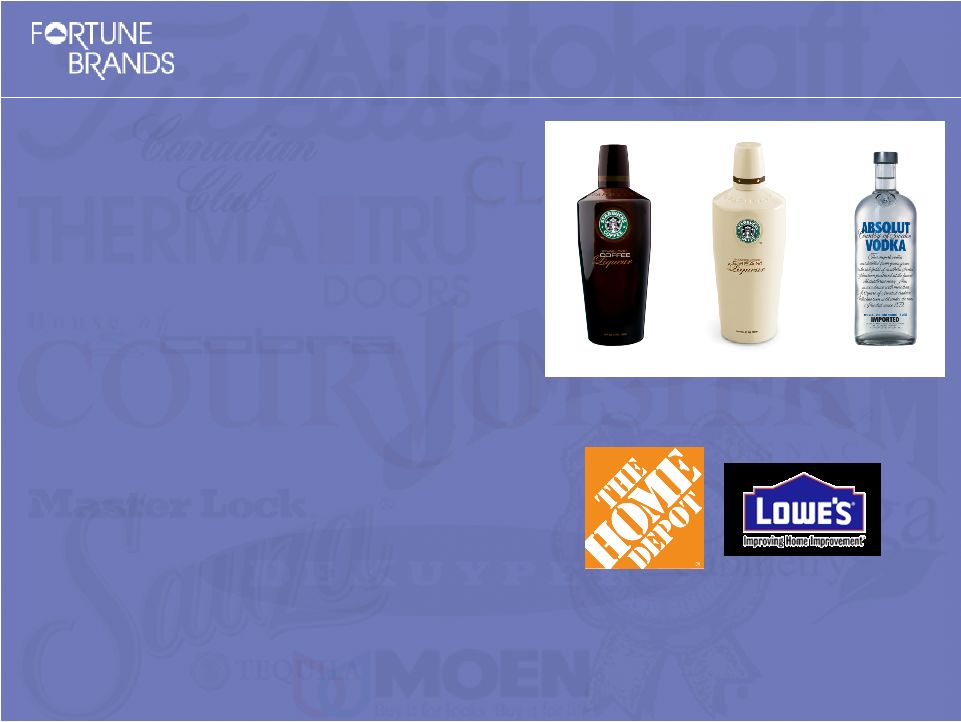
Page 22 • A New Global Leader: • Jim Beam, Maker’s Mark, Sauza, Courvoisier, Canadian Club, Starbucks Coffee Liqueur, DeKuyper, Clos du Bois • 9 Top 100 premium spirits brands Spirits & Wine 2006 target: OI before charges up ~70% ~$2.3 billion annual sales • Mid-20’s OI margin in 2005 • Very strong RONTA |
Page 23 Spirits & Wine gaining share vs. beer Trading up to high-end spirits Appeal of cocktails, mixability and multiple flavor profiles Legal drinking age adults Premium spirits growing internationally • 40% net sales now in international markets, up from 25% MARKET GROWING: 8 STRAIGHT YEARS IN U.S. Well Positioned to Capitalize on Favorable Market Dynamics |
Page 24 Creating a New Global Leader BEFORE $1.2 75/25 19 #7 3 Top 20 NOW ~$2.3 60/40 37 #4 9 #5 Annual Sales (in billions) % US/International Sales Worldwide Case Volume (in millions) Spirits Industry Rank Top 100 Premium Spirits Brands US Super-Premium Wine |
Page 25 Major Premium Brands Elevate U.S. Distribution BEFORE Jim Beam DeKuyper Starbucks Coffee Liqueur Geyser Peak Absolut (1) ADDED Maker’s Mark American Whiskey Cordials & Liqueurs Super Premium Wine Tequila Canadian Whisky Cognac Scotch Vodka Rum (1) Partner brand owned by V&S. (2) Acquisition by V&S pending. Clos du Bois Sauza Canadian Club Courvoisier Laphroaig Cruzan (2) |
Page 26 EXPANDING IN PRIORITY GLOBAL MARKETS: UK, SPAIN, GERMANY • Leading national brands • Teacher’s, Harveys, Cockburn’s, DYC, Larios, Fundador, Centenario, Castellana, Kuemmerling CREATING DISTRIBUTION EFFICIENCIES • Added scale supports growth of core brands • Leverage key distribution assets, reduce costs ADDED ALLIED DOMECQ TALENT TO ENHANCED ORGANIZATION Boosting International Strength |
Page 27 Stronger Position in Major Spirits Markets US Market Share (case volume) Diageo 26% Future Brands 16% Pernod Ricard 10% Bacardi 10% Constellation Brands 10% Brown-Forman 7% • #2 in Australia, Canada • #3 in UK, Spain • Growing presence in Germany, India, Brazil, Philippines #2 DISTRIBUTION NETWORK IN US ENHANCED INTERNATIONAL DISTRIBUTION |
Page 28 • Focus on growing global premium brands • Leverage powerful distribution alliances • Flavor innovation Spirits & Wine Growth Priorities |
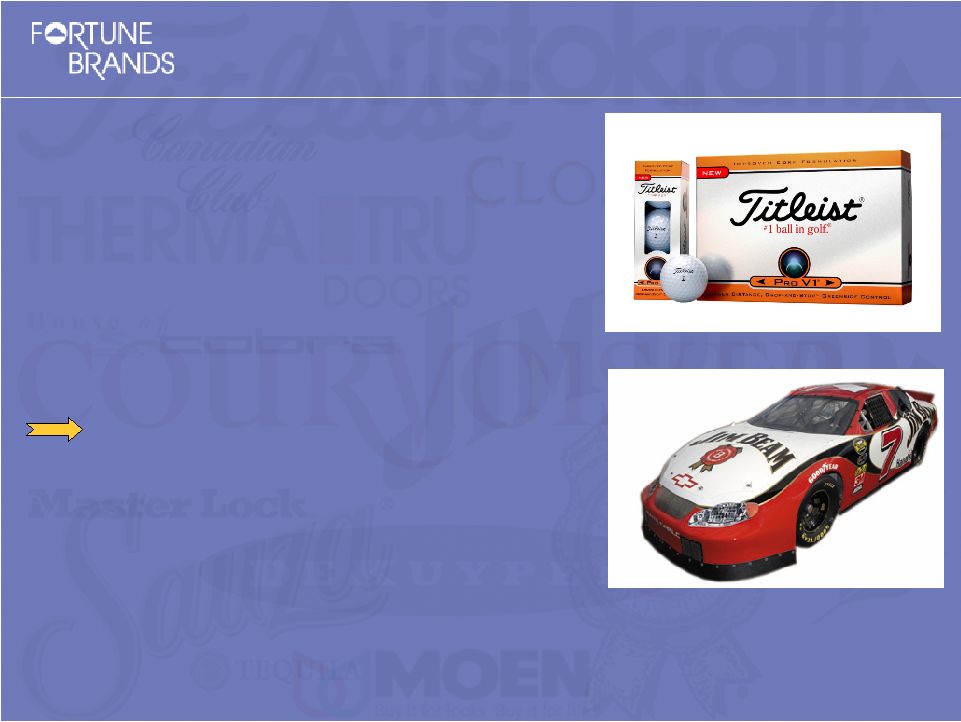
Page 29 Golf 2006 target: Low-to-mid single-digit OI growth • World’s #1 Golf Business: • Titleist, Cobra, FootJoy, Pinnacle $1.26 billion sales in 2005, +4% • 14% OI margin • 20% + RONTA (1) (after tax) (1) After-tax OI return on net tangible assets. |
Page 30 TECHNOLOGY AND PERFORMANCE LEADER • Powerful patent portfolio • Non-stop innovation: Titleist Pro V1, Titleist 905 drivers, Vokey Design spin-milled wedges, Scotty Cameron putters, Cobra Speed drivers, Cobra Inertia Series irons, FootJoy GF:II SIGNIFICANTLY OUTPERFORMING INDUSTRY • Constant innovation drives share gains: sales up in every category in 2005 • #1 golf balls • #1 golf shoes • #1 golf gloves • #2 golf clubs • #1 golf outerwear World’s #1 Golf Business |
Page 31 • Superior innovation • Industry-leading customer service • Pyramid of influence • International growth opportunities • New company-owned distribution in Korea and China • Favorable long-term demographics Sustaining Growth |
Page 32 We See Broad-Based Growth in 2006 |
Page 33 Q1 Full Year 2006 Mid-to-high single-digit EPS growth (before charges/gains, continuing operations) Double-digit EPS growth (before charges/gains, continuing operations) Outlook for 2006: Achieve Long-Term Goals Includes stock options expense of approximately 18 cents per share in 2006. |
Page 34 Growth Measure Long-Term Goal Diluted EPS Growth Double-digits (before charges/gains) Internal Sales Growth 4-6% (3-4% market growth) Internal Operating Income Growth 6-7% Free Cash Flow After Dividends $400 million and growing Achievable Long-Term Goals |
Page 35 EPS Growth Rate (1) (1996 – 2005) S&P 500 (3) 7% 17% (2) FO (1) Before charges/gains; GAAP EPS growth rates are same over period. (2) Consolidated 96-04 and continuing operations growth in ’05. (3) Source: First Call. Compelling Valuation • FO total shareholder return doubled since CAGNY ‘03 • Discount to S&P and other leading consumer companies • Positioned for multiple expansion |
Page 36 PORTFOLIO REALIGNMENT, SHARPER FOCUS BRAND STRENGTH AND SUSTAINED INVESTMENT INDUSTRY-LEADING INNOVATION BREADTH IN ATTRACTIVE MARKETS LOW-COST STATE-OF-THE-ART SUPPLY CHAINS EFFECTIVELY MANAGING COMMODITY COSTS STRONG STEWARDS OF CAPITAL Well Positioned to Continue Achieving Broad-Based Growth |
Page 37 Fortune Brands: A more sharply-focused, high-performance consumer brands company. • Creating Value • Building Brands • Delivering Results |
Page 38 Consumer Analyst Group of New York Conference |
Fortune Brands, Inc.
Reconciliation of Underlying Net Sales to GAAP Net Sales
| | | | | | | | | | | | | | | | | | | | | | | | | | | | | | | | | | | | | | | | | | | | | | | | | | | | | | | | | | | | | | | | | | | | | | | |
| | | 1996 | | 1997 | | | 1997 | | | 1998 | | | 1998 | | | 1999 | | | 1999 | | | 2000 | | | 2000 | | | 2001 | | | 2001 | | | 2002 | | | 2002 | | | 2003 | | | 2003 | | | 2004 | | | 2004 | | | 2005 | |
Underlying Net Sales | | $ | 3,016.1 | | $ | 3,129.4 | | | $ | 3,265.1 | | | $ | 3,434.5 | | | $ | 3,542.8 | | | $ | 3,772.2 | | | $ | 3,794.4 | | | $ | 4,052.3 | | | $ | 3,741.2 | | | $ | 3,767.4 | | | $ | 3,883.2 | | | $ | 4,199.9 | | | $ | 4,397.1 | | | $ | 4,728.8 | | | $ | 5,198.4 | | | $ | 5,762.4 | | | $ | 5,873.3 | | | $ | 6,302.6 | |
Net impact acqs. & divestitures | | | 28.4 | | | 4.9 | | | | (133.5 | ) | | | — | | | | (133.3 | ) | | | (59.9 | ) | | | (38.8 | ) | | | (52.0 | ) | | | 235.0 | | | | 150.1 | | | | (19.9 | ) | | | 53.4 | | | | (135.9 | ) | | | 0.6 | | | | (387.8 | ) | | | 1.4 | | | | (27.8 | ) | | | 444.4 | |
Impact of foreign exchange rates | | | — | | | (2.7 | ) | | | — | | | | (25.0 | ) | | | — | | | | (8.6 | ) | | | — | | | | (42.4 | ) | | | — | | | | (45.1 | ) | | | — | | | | 7.9 | | | | — | | | | 81.2 | | | | — | | | | 81.7 | | | | — | | | | 27.2 | |
Spirits & Wine excise taxes | | | 444.5 | | | 418.7 | | | | 418.7 | | | | 443.7 | | | | 443.7 | | | | 448.7 | | | | 401.8 | | | | 394.8 | | | | 340.4 | | | | 344.9 | | | | 314.7 | | | | 311.1 | | | | 311.1 | | | | 302.0 | | | | 302.0 | | | | 299.7 | | | | 299.7 | | | | 287.0 | |
Interim Absolut sales | | | — | | | — | | | | — | | | | — | | | | — | | | | — | | | | — | | | | — | | | | — | | | | 205.3 | | | | 205.3 | | | | — | | | | — | | | | — | | | | — | | | | — | | | | — | | | | — | |
EITF Restatements | | | — | | | — | | | | — | | | | 28.0 | | | | 28.0 | | | | (37.8 | ) | | | (37.8 | ) | | | (72.1 | ) | | | (36.0 | ) | | | (39.3 | ) | | | — | | | | — | | | | — | | | | — | | | | — | | | | — | | | | — | | | | — | |
| | | | | | | | | | | | | | | | | | | | | | | | | | | | | | | | | | | | | | | | | | | | | | | | | | | | | | | | | | | | | | | | | | | | | | | |
GAAP Net Sales | | $ | 3,489.0 | | $ | 3,550.3 | | | $ | 3,550.3 | | | $ | 3,881.2 | | | $ | 3,881.2 | | | $ | 4,119.6 | | | $ | 4,119.6 | | | $ | 4,280.6 | | | $ | 4,280.6 | | | $ | 4,383.3 | | | $ | 4,383.3 | | | $ | 4,572.3 | | | $ | 4,572.3 | | | $ | 5,112.6 | | | $ | 5,112.6 | | | $ | 6,145.2 | | | $ | 6,145.2 | | | $ | 7,061.2 | |
% Change Underlying Sales | | | | | | 3.8 | % | | | | | | | 5.2 | % | | | | | | | 6.6 | % | | | | | | | 6.8 | % | | | | | | | 0.7 | % | | | | | | | 8.2 | % | | | | | | | 7.5 | % | | | | | | | 10.8 | % | | | | | | | 7.3 | % |
% Change GAAP Net Sales | | | | | | 1.8 | % | | | | | | | 9.3 | % | | | | | | | 6.1 | % | | | | | | | 3.9 | % | | | | | | | 2.4 | % | | | | | | | 4.3 | % | | | | | | | 11.8 | % | | | | | | | 20.2 | % | | | | | | | 14.9 | % |
| (1) | Underlying Net Sales is a non-GAAP measure and reflects year to year performance of our current businesses. It is equal to net sales excluding changes in foreign currency exchange rates, spirits & wine excise taxes, interim Absolut sales, results from divestitures in both periods, and excludes the adoption of accounting standards (EITF) not effective when the period was publicly reported. With the exception of the Spirits & Wine acquired brands, Underlying Sales also includes net sales from acquisitions for the comparable prior-year period. The results of the Spirits & Wine acquired brands are excluded from Underlying Sales in both the current year and the prior year as the information is not available in the prior year. Management believes that this measure is useful in analyzing the Company’s performance from year to year. In assessing this measure, investors should note that the net impact of acquisitions and divestitures, the impact of foreign exchange as well as the impact of excise taxes and interim Absolut sales have been excluded in order to provide an additional measure to investors seeking to evaluate the Company’s underlying financial performance from year to year. Office products is excluded as a discontinued operation. |
Fortune Brands, Inc.
Reconciliation of Operating Margin Before Charges to GAAP Operating Income Margin from Continuing Operations
| | | | | | | | | | | | | | | | | | | | | | | | | | | | | | | | | | | | |
| | | 1997 | | | 1998 | | | 1999 | | | 2000 | | | 2001 | | | 2002 | | | 2003 | | | 2004 | | | 2005 | |
Operating Margin Before Charges | | | 15.1 | % | | | 15.0 | % | | | 16.2 | % | | | 17.3 | % | | | 16.1 | % | | | 17.1 | % | | | 17.1 | % | | | 17.0 | % | | | 16.8 | % |
Operating Income Before Charges | | $ | 534.5 | | | $ | 583.4 | | | $ | 667.3 | | | $ | 742.6 | | | $ | 704.5 | | | $ | 780.8 | | | $ | 874.2 | | | $ | 1,045.3 | | | $ | 1,183.5 | |
Net (Charges) / Gains | | | (210.9 | ) | | | — | | | | (1,192.8 | ) | | | (25.9 | ) | | | (37.5 | ) | | | (15.6 | ) | | | (5.9 | ) | | | (20.7 | ) | | | (19.6 | ) |
FAS 142 amortization benefit as of 1/1/96 | | | (72.2 | ) | | | (74.3 | ) | | | (52.9 | ) | | | (45.8 | ) | | | (45.2 | ) | | | — | | | | — | | | | — | | | | — | |
| | | | | | | | | | | | | | | | | | | | | | | | | | | | | | | | | | | | |
GAAP Operating Income | | $ | 251.4 | | | $ | 509.1 | | | | ($578.4 | ) | | | 670.9 | | | $ | 621.8 | | | $ | 765.2 | | | $ | 868.3 | | | $ | 1,024.6 | | | $ | 1,163.9 | |
GAAP Net Sales | | $ | 3,550.3 | | | $ | 3,881.2 | | | $ | 4,119.6 | | | $ | 4,280.6 | | | $ | 4,383.3 | | | $ | 4,572.3 | | | $ | 5,112.6 | | | $ | 6,145.2 | | | $ | 7,061.2 | |
GAAP Operating Income Margin | | | 7.1 | % | | | 13.1 | % | | | -14.0 | % | | | 15.7 | % | | | 14.2 | % | | | 16.7 | % | | | 17.0 | % | | | 16.7 | % | | | 16.5 | % |
Operating Margin Before Charges is a non-GAAP measure and reflects the year to year performance of our businesses. It is equal to operating income as a percentage of net sales excluding restructuring and restructuring-related items with the amortization of intangibles over the entire period 1996-2005 based on current intangible values and current FAS 142 goodwill accounting (adopted 1/1/02). Management believes that this measure is useful in analyzing the Company’s performance from year to year. In assessing this measure, investors should note that the net impact of restructuring and restructuring-related items and the writedown of intangibles have been excluded, as well as amortization expense has been restated, in order to provide an additional measure to investors seeking to evaluate the Company’s underlying performance from year to year. Office products is excluded as a discontinued operation.
38
Fortune Brands, Inc.
Reconciliation of EPS Before Charges/Gains to GAAP EPS
| | | | | | | | | | | | | | | | | | | | | | | | | | | | | | | | | | | | | | | | | | | | | | | | | | | | | | | | | | | | | | | | | | | | | | | |
| | | 1996 | | | 1997 | | | 1997 | | | 1998 | | | 1998 | | 1999 | | | 1999 | | | 2000 | | | 2000 | | | 2001 | | | 2001 | | | 2002 | | | 2002 | | | 2003 | | | 2003 | | | 2004 | | | 2004* | | | 2005* | |
Diluted EPS Before Charges/Gains | | $ | 1.28 | | | $ | 1.48 | | | $ | 1.48 | | | $ | 1.67 | | | $ | 1.67 | | $ | 1.99 | | | $ | 1.99 | | | $ | 2.34 | | | $ | 2.34 | | | $ | 2.45 | | | $ | 2.45 | | | $ | 2.90 | | | $ | 3.21 | | | $ | 3.79 | | | $ | 3.79 | | | $ | 4.68 | | | $ | 4.12 | | | $ | 4.62 | |
Tax-related special items | | | — | | | | — | | | | — | | | | — | | | | — | | | — | | | | — | | | | 0.19 | | | | 0.19 | | | | 0.78 | | | | 0.78 | | | | 0.68 | | | | 0.68 | | | | 0.28 | | | | .28 | | | | .71 | | | | 0.69 | | | | 0.05 | |
Restructuring-related items | | | — | | | | (1.16 | ) | | | (1.16 | ) | | | — | | | | — | | | (0.75 | ) | | | (0.75 | ) | | | (0.30 | ) | | | (0.30 | ) | | | (0.41 | ) | | | (0.41 | ) | | | (0.24 | ) | | | (0.24 | ) | | | (0.16 | ) | | | (0.16 | ) | | | (0.21 | ) | | | (0.08 | ) | | | (0.08 | ) |
Insurance gain | | | — | | | | — | | | | — | | | | — | | | | — | | | — | | | | — | | | | — | | | | — | | | | — | | | | — | | | | — | | | | — | | | | — | | | | — | | | | 0.05 | | | | 0.05 | | | | — | |
Gain/(loss) on divestitures | | | — | | | | — | | | | — | | | | — | | | | — | | | 0.13 | | | | 0.13 | | | | — | | | | — | | | | 0.03 | | | | 0.03 | | | | — | | | | — | | | | — | | | | — | | | | — | | | | — | | | | — | |
Net acquisition hedge costs | | | — | | | | — | | | | — | | | | — | | | | — | | | — | | | | — | | | | — | | | | — | | | | — | | | | — | | | | — | | | | — | | | | — | | | | — | | | | — | | | | — | | | | (0.72 | ) |
Writedown of intangibles | | | — | | | | — | | | | — | | | | — | | | | — | | | (6.76 | ) | | | (6.76 | ) | | | (3.06 | ) | | | (3.06 | ) | | | (0.30 | ) | | | (0.30 | ) | | | — | | | | — | | | | (0.05 | ) | | | (0.05 | ) | | | — | | | | — | | | | — | |
Benefit from FAS 142 (1/1/02) | | | — | | | | — | | | | — | | | | — | | | | — | | | — | | | | — | | | | — | | | | — | | | | — | | | | — | | | | 0.31 | | | | — | | | | — | | | | — | | | | — | | | | — | | | | — | |
Impact of dilutive shares | | | — | | | | — | | | | — | | | | — | | | | — | | | 0.04 | | | | 0.04 | | | | 0.03 | | | | 0.03 | | | | — | | | | — | | | | — | | | | — | | | | — | | | | — | | | | — | | | | — | | | | — | |
1/96 benefit Gallaher payment | | | (0.25 | ) | | | (0.09 | ) | | | (0.09 | ) | | | — | | | | — | | | — | | | | — | | | | — | | | | — | | | | — | | | | — | | | | — | | | | — | | | | — | | | | — | | | | — | | | | — | | | | — | |
| | | | | | | | | | | | | | | | | | | | | | | | | | | | | | | | | | | | | | | | | | | | | | | | | | | | | | | | | | | | | | | | | | | | | | | |
Diluted GAAP EPS | | $ | 1.03 | | | $ | 0.23 | | | $ | 0.23 | | | $ | 1.67 | | | $ | 1.67 | | | ($5.35 | ) | | | ($5.35 | ) | | | ($0.80 | ) | | | ($0.80 | ) | | $ | 2.55 | | | $ | 2.55 | | | $ | 3.65 | | | $ | 3.65 | | | $ | 3.86 | | | $ | 3.86 | | | $ | 5.23 | | | $ | 4.78 | | | $ | 3.87 | |
%Change EPS Before Charges/Gains | | | | | | | 15.6 | % | | | | | | | 12.8 | % | | | | | | 19.2 | % | | | | | | | 17.6 | % | | | | | | | 4.7 | % | | | | | | | 18.4 | % | | | | | | | 18.1 | % | | | | | | | 23.5 | % | | | | | | | 12.1 | % |
%Change GAAP Diluted EPS | | | | | | | -77.7 | % | | | | | | | 626.1 | % | | | | | | — | | | | | | | | — | | | | | | | | — | | | | | | | | 43.1 | % | | | | | | | 5.8 | % | | | | | | | 35.5 | % | | | | | | | -19.0 | % |
| (3) | Diluted EPS Before Charges and Gains is a non-GAAP measure and indicates the underlying performance of our businesses prior to costs associated with our restructuring initiatives, writedowns of intangibles or goodwill, tax credits or charges, gain recorded on insurance proceeds received for a warehouse fire, gains or losses on divestitures, and assuming a 1/1/96 benefit from the net cash payment Gallaher made to us in connection with its spin-off on 5/31/97. Management believes that this measure is useful in analyzing the Company’s performance from year to year. In assessing this measure, investors should note that the net impact of tax-related special items, restructuring and restructuring-related items, gains/losses on the sale of certain operations, writedowns of identifiable intangibles and goodwill, and the interim period benefit from the net cash payment received from Gallaher Group Plc have been excluded. Reflects financial restatement filed in February of 2006. |
| * | From continuing operations. |
Fortune Brands, Inc.
Reconciliation of Return On Invested Capital (ROIC) Before Charges/Gains to GAAP ROIC
| | | | | | | | | | | | | | | | | | | | | | | | | | | | | | | | | | | | |
| | | 1997 | | | 1998 | | | 1999 | | | 2000 | | | 2001 | | | 2002 | | | 2003 | | | 2004 | | | 2005* | |
ROIC Before Charges/Gains | | | 11.6 | % | | | 10.7 | % | | | 11.9 | % | | | 13.0 | % | | | 14.0 | % | | | 16.6 | % | | | 16.8 | % | | | 16.3 | % | | | 11.4 | % |
Adjusted Net Income before after-tax interest | | $ | 466.6 | | | $ | 424.8 | | | $ | 480.8 | | | $ | 526.7 | | | $ | 490.6 | | | $ | 540.5 | | | $ | 616.2 | | | $ | 757.8 | | | $ | 797.3 | |
Net (charge)/gain | | | (201.0 | ) | | | — | | | | (1,230.3 | ) | | | (502.8 | ) | | | 16.0 | | | | 68.8 | | | | 9.5 | | | | 82.4 | | | | (70.5 | ) |
FAS 142 amortization benefit as of 1/1/96 | | | (92.9 | ) | | | (96.4 | ) | | | (73.2 | ) | | | (66.5 | ) | | | (49.6 | ) | | | — | | | | — | | | | — | | | | — | |
| | | | | | | | | | | | | | | | | | | | | | | | | | | | | | | | | | | | |
GAAP Net Income before after-tax interest | | $ | 172.7 | | | $ | 328.4 | | | | ($822.7 | ) | | | ($42.6 | ) | | $ | 457.0 | | | $ | 609.3 | | | $ | 625.7 | | | $ | 840.2 | | | $ | 726.8 | |
Adjusted Invested Capital | | $ | 4,024.6 | | | $ | 3,965.1 | | | $ | 4,049.1 | | | $ | 4,059.1 | | | $ | 3,507.3 | | | $ | 3,252.6 | | | $ | 3,661.9 | | | $ | 4,638.1 | | | $ | 6,994.3 | |
Cumulative net (charge)/gain | | | 1,521.8 | | | | 1,450.6 | | | | 756.9 | | | | 380.4 | | | | 24.9 | | | | 105.0 | | | | 26.0 | | | | 11.1 | | | | 107.8 | |
| | | | | | | | | | | | | | | | | | | | | | | | | | | | | | | | | | | | |
GAAP Invested Capital | | $ | 5,546.4 | | | $ | 5,415.7 | | | $ | 4,806.0 | | | $ | 4,439.5 | | | $ | 3,532.2 | | | $ | 3,357.6 | | | $ | 3,687.9 | | | $ | 4,649.2 | | | $ | 7,102.1 | |
GAAP ROIC | | | 3.1 | % | | | 6.1 | % | | | -17.1 | % | | | -1.0 | % | | | 12.9 | % | | | 18.1 | % | | | 17.0 | % | | | 18.1 | % | | | 10.2 | % |
| (4) | Return On Invested Capital (ROIC) represents the rolling twelve months of net income before charges and gains plus after-tax interest divided by the 13-point average of the sum of total debt less cash plus total stockholders equity. The impact of improved returns attributable to current FAS 142 goodwill accounting and the writedowns of intangibles have been excluded by restating invested capital and net income as they would appear if current FAS 142 accounting had gone into effect and the writedowns had occurred on 1/1/96. Management believes that this measure is useful in analyzing the Company’s performance from year to year. In assessing this measure, investors should note that Net Income excludes after-tax interest, the net impact of tax-related special items, restructuring and restructuring-related items, gain recorded on insurance proceeds received for a warehouse fire, gains/losses on the sale of certain operations and writedowns of intangibles, and amortization expense has been restated to reflect current FAS 142 accounting (adopted 1/1/02) and intangible values. For further details on charges and gains, see the GAAP reconciliation of EPS Before Charges/Gains. Reflects financial restatement filed in February of 2006. |
| * | From continuing operations. |
39
Fortune Brands, Inc.
Reconciliation of Free Cash Flow to GAAP Cash Flow Provided By Operating Activities
| | | | | | | | | | | | | | | | | | | | | | | | | | | | | |
| | | 1997 | | | 1998 | | 1999 | | 2000 | | 2001 | | 2002 | | 2003 | | 2004 | | 2005 | |
Free Cash Flow (after dividends) | | $ | 95.8 | | | $ | 11.4 | | $ | 121.5 | | $ | 112.5 | | $ | 286.7 | | $ | 447.2 | | $ | 441.9 | | $ | 392.7 | | $ | 407.4 | |
Spirits & Wine acquisition related expenditures | | | — | | | | — | | | — | | | — | | | — | | | — | | | — | | | — | | | (22.1 | ) |
Net capital expenditures (net of proceeds) | | | 191.4 | | | | 245.4 | | | 217.3 | | | 212.2 | | | 204.0 | | | 186.4 | | | 181.9 | | | 215.6 | | | 215.6 | |
Dividends Paid to Stockholders | | | 139.1 | (1) | | | 147.4 | | | 149.6 | | | 147.7 | | | 148.0 | | | 153.4 | | | 166.9 | | | 183.6 | | | 201.6 | |
| | | | | | | | | | | | | | | | | | | | | | | | | | | | | |
GAAP Cash Flow Provided By Operating Activities | | $ | 426.3 | | | $ | 404.2 | | $ | 488.4 | | $ | 472.4 | | $ | 638.7 | | $ | 787.0 | | $ | 790.7 | | $ | 791.9 | | $ | 802.5 | |
Free cash flow is a non-GAAP measure and it indicates the resources of our current business to invest in internal growth, make acquisitions, repay debt and repurchase stock. Management believes that this measure is useful in analyzing the Company’s performance from year to year.
| (1) | Pro forma for interim period spin-off of Gallaher Group Plc (5/30/97), utilizing Fortune Brands’ 80¢ indicated annual rate for American Brands’ 1997 dividend payments (results in a $104.3mm deduction to the $243.4mm GAAP figure). |
Fortune Brands, Inc.
Reconciliation of Operating Income Before Charges to GAAP Operating Income Forecasted Full Year 2006
The table below lists the current growth rate targets for Operating Income Before Charges and Operating Income on a GAAP basis for the Company’s Spirits & Wine segment for 2006.
| | | | |
| | | Operating Income Before Charges | | Operating Income (GAAP basis) |
Spirits & Wine | | Approximately 70% | | Up strong double digits |
Operating Income Before Charges is Operating Income derived in accordance with GAAP excluding any non-recurring items.
Operating Income Before Charges is a measure not derived in accordance with GAAP. Management uses this measure to determine the returns generated by operating segments and to evaluate and identify cost-reduction initiatives. Management believes this measure provides investors with helpful supplemental information regarding the underlying performance of the Company from year-to-year. This measure may be inconsistent with similar measures presented by other companies.
40