UNITED STATES
SECURITIES AND EXCHANGE COMMISSION
Washington, D.C. 20549
FORM N-CSR
CERTIFIED SHAREHOLDER REPORT OF REGISTERED
MANAGEMENT INVESTMENT COMPANIES
Investment Company Act file number: 811-04581
CORNERCAP GROUP OF FUNDS
(Exact name of registrant as specified in charter)
The Peachtree, Suite 1700, 1355 Peachtree Street NE, Atlanta, Georgia 30309
(Address of principal executive offices) (Zip code)
Paul F. Leone, Esq.
ALPS Fund Services, Inc.
1290 Broadway, Suite 1100, Denver, Colorado 80203
(Name and address of agent for service)
Registrant’s telephone number, including area code: (404) 870-0700
Date of fiscal year end: March 31
Date of reporting period: April 1, 2013 – March 31, 2014
Item 1. Reports to Stockholders.
| | |
| Manager’s Report to Shareholders (Unaudited) | | |
| | March 31, 2014 |
Dear Shareholders:
CornerCap Investment Counsel recently celebrated our 25th year in business, following our departure from RJR Nabisco in March 1989. Over that period, we have grown the firm through reputation, returns and retention of clients.
A little bit of history … With modest assets under management, in September 1992 we decided to enter the mutual fund business. Managing, administering and serving mutual funds are exceptionally expensive. We also decided to only manage pure no-load funds. In other words, there would be no monies coming from fund shareholders to compensate anyone selling our funds, i.e. growth would be slow. We knew that CornerCap would be absorbing most of the mutual fund expenses for a number of years, and we did.
To finish the firm-fund-bio, to save costs we found and “acquired” one of the worst performing funds in the marketplace, the Sunshine Growth Trust (SGT) in California. The SGT evolved to become our CornerCap Small Cap Value fund. Since September 1992, this previously failed fund has realized a 10.13% before tax annualized return after all costs. It is interesting that of the 1,166 small cap value/blend mutual funds that are currently in the Morningstar Universe, we are one of only 45 funds with investment results over this 21.5 year period. Please see page 5 for the complete standardized performance.
As noted earlier, we grow by reputation and returns. Over the last fiscal year, the assets in our three mutual funds grew 47%, from $64 million to $94 million. Our investment advisory firm has over $900 million in client assets. We appreciate you and our other loyal clients for helping to make that happen.
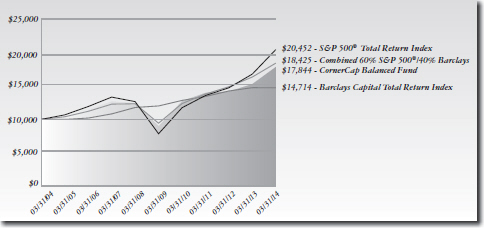
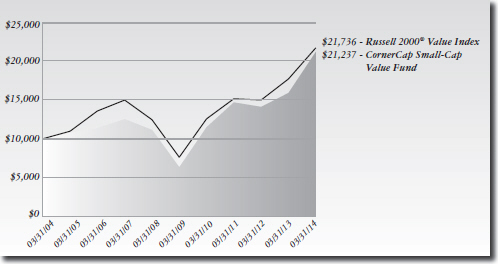
And the results were … Over that last fiscal year, all three of our mutual funds have realized much higher than normal absolute returns and have also outpaced their benchmarks. Our two all-equity funds, the Large/Mid Value and the Small Cap Value, have returned 28.42% and 33.09% while their benchmark returns were 21.86% for the S&P 500® Index and 22.65% for the Russell 2000® Value Index, respectively. Our more conservative Balanced fund realized a return of 16.76% versus 12.70% for the Combined 60% S&P 500® Index/40% Barclays Capital U.S. Government/Corporate Bond Index benchmark.
As noted above, this fiscal year reflected a significant outperformance of each funds’ benchmark return. The market is on a five year rebound following the extreme 2007-2009 market crash. However even as the market was recovering during the initial years, investors were fearfully tiptoeing through an imagined minefield. The biggest stock winners ignored valuations and simply reflected safety: Higher yield, low beta* (more market-like), low volatility and mega-cap stocks. However, earnings and cash flows did not support these investor preferences and the market has reversed – safety materially underperformed during this fiscal year.
We are confident that valuation wins over time. Everyone knows that price is important whether you’re in the stock market or the supermarket. The confusion comes with the opportunity for sellers to create much more excitement and fear with stocks than with groceries. Our disciplined, valuation-focused research has created average annual returns over the last five years of 21.98% for the Large/Mid Cap, 27.29% for the Small Cap, and 14.74% for the Balanced funds, all exceeding their benchmarks. Please see pages 3, 5 and 7 for complete standardized performance.
| | |
| | |
Annual Report | March 31, 2014 | | 1 |
| | |
Manager’s Report to Shareholders (Unaudited) | | |
| | March 31, 2014 |
And the problem was … For our taxable shareholders, the unfortunate byproduct of exceptional returns is higher taxes. For those who have read the most recent commentary on our website, 2013 represented “The Perfect Storm” for taxes. And, the conditions still exist for the continuation of that storm. For higher income taxpayers, in 2013 we had:
| | • | | High investment returns |
| | • | | The long term capital gains tax rate went up almost 60%, from 15% to 23.8% |
| | • | | The elimination of some tax deductions |
| | • | | Most tax loss carry forwards from the 2007-2009 market crash have been depleted |
At CornerCap, while we put investments first, we pay close attention to taxes. If we have a large gain in a security that needs to be trimmed or eliminated, we check the long term capital gain threshold (one year) and make a calculated decision about selling now or delaying the sale until it becomes long term. Throughout the taxable year we review holdings for any significant tax harvesting opportunities, potentially buying more of the underweighted holding and then selling the lots with tax losses after the wash sell rule is achieved (30 days). And of course, we only sell a holding when the fundamentals do not support retention or when the security’s weighting exceeds the fund’s portfolio management guidelines. We pay attention to taxes but eventually taxes have to be paid.
Thank you for being a shareholder in our CornerCap Group of Funds and please let us know if we can be of service to any of your family or friends.
CornerCap Investment Counsel
May 31, 2014
| *Beta | – A measure of the volatility, or systematic risk, of a security or a portfolio in comparison to the market as a whole. |
The Letter to Shareholders seeks to describe some of CornerCap Investment Counsel’s current opinions and views of the financial markets. Although CornerCap Investment Counsel believes it has a reasonable basis for any opinions or views expressed, actual results may differ, sometimes significantly so, from those expected or expressed.
Diversification does not eliminate the risk of experiencing investment loss.
| | |
Manager’s Report to Shareholders (Unaudited) | | |
| | March 31, 2014 |
CORNERCAP BALANCED FUND
Investment Performance through March 31, 2014 (In Thousands)
Total Return
for the period ended March 31, 2014
| | | | | | | | | | | | |
| | | 1 Year | | 5 Year | | 10 Year | | Since
Inception(b) | | Gross
Expense
Ratio | | Net Expense
Ratio(c) |
CornerCap Balanced Fund(a) | | 16.76% | | 14.74% | | 5.96% | | 5.97% | | 1.32% | | 1.12% |
Combined 60% S&P 500® Index/40% Barclays Capital
U.S. Government/ Corporate Bond Index(d) | | 12.70% | | 14.36% | | 6.30% | | 6.53% | | | | |
S&P 500® Index(e) | | 21.86% | | 21.16% | | 7.42% | | 6.75% | | | | |
Barclays Capital U.S. Government/Corporate Bond Index(f) | | (0.13%) | | 4.18% | | 3.94% | | 5.32% | | | | |
Past performance does not guarantee future results. The performance data quoted does not reflect the deduction of the 1% redemption fee imposed if shares are redeemed or exchanged within sixty days of purchase or the deduction of taxes that a shareholder would pay on Fund distributions or the redemption of Fund shares. Data quoted represents past performance.
Investment return and share price will fluctuate with market conditions, and investors may have a gain or loss when shares are sold. Mutual fund performance changes over time and currently may be significantly lower than stated above. Performance is updated and published monthly. Visit the Fund’s website at www.cornercapfunds.com or call 888-813-8637 for month-end performance figures.
| | |
| | |
Annual Report | March 31, 2014 | | 3 |
| | |
Manager’s Report to Shareholders (Unaudited) | | |
| | March 31, 2014 |
| (a) | The Fund’s total returns include the reinvestment of dividend and capital gain distributions but have not been adjusted for any income taxes payable by shareholders on these distributions. |
| (b) | The Balanced Fund began operations May 24, 1997. |
| (c) | CornerCap Investment Counsel, Inc. (the “Adviser”) has entered into a contractual agreement with the Balanced Fund under which it has agreed to waive or reduce its fees and to assume other expenses of the Balanced Fund, if necessary, in an amount that limits “Total Annual Fund Operating Expenses” (exclusive of interest, taxes, brokerage fees and commissions, Acquired Fund Fees and Expenses, and extraordinary expenses) to not more than 1.10%. To the extent the Balanced Fund incurs excluded expenses, the expense ratio will increase. The current contractual agreement cannot be terminated prior to August 1, 2014 without the Board of Trustees’ approval. |
| (d) | Effective August 17, 2006, the Balanced Fund has elected to use the comparative index 60% S&P 500® Index and 40% Barclays Capital U.S. Government/Corporate Bond Index. |
| (e) | The S&P 500® Index is an unmanaged index of 500 common stocks chosen for market size, liquidity, and industry group representation. It is a market-value weighted index (stock price times number of shares outstanding) with each stock’s weight in the Index proportionate to its market value. |
| (f) | The Barclays Capital U.S. Government/Corporate Bond Index measures the general performance of fixed-income securities by tracking publicly issued U.S. Treasury and debt obligations (excluding mortgage-backed securities), fixed-rate, non-convertible, investment-grade corporate debt securities, and U.S. dollar-denominated, SEC-registered non-convertible debt issued by foreign governmental entities or international agencies. |
The index figures do not reflect any deduction for fees, expenses or taxes. It is not possible to invest directly in an index.
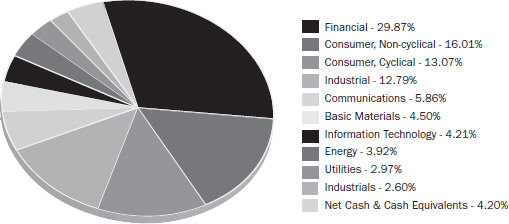
Sector Allocation as a Percentage of Total Investments at March 31, 2014*
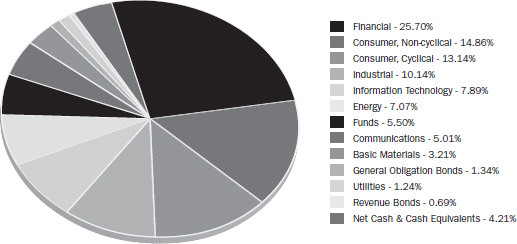
| * | These allocations may not reflect the current or future position of the portfolio. |
| | |
Manager’s Report to Shareholders (Unaudited) | | |
| | March 31, 2014 |
CORNERCAP SMALL-CAP VALUE FUND
Investment Performance through March 31, 2014 (In Thousands)
Total Return
for the period ended March 31, 2014
| | | | | | | | | | | | | | | | | | | | | | | | | | | | | | |
| | | 1 Year | | 5 Year | | 10 Year | | Since
Inception(b) | | Gross Expense Ratio | | Expense Ratio(c) |
CornerCap Small-Cap Value Fund(a) | | | | 33.09 | % | | | | 27.29 | % | | | | 7.82 | % | | | | 10.13 | % | | | | 1.51 | % | | | | 1.31 | % |
Russell 2000® Value Index(d) | | | | 22.65 | % | | | | 23.33 | % | | | | 8.07 | % | | | | 11.69 | % | | | | | | | | | | |
Russell 2000® Index(e) | | | | 24.90 | % | | | | 24.31 | % | | | | 8.53 | % | | | | 10.24 | % | | | | | | | | | | |
Past performance does not guarantee future results. The performance data quoted does not reflect the deduction of the 1% redemption fee imposed if shares are redeemed or exchanged within sixty days of purchase or the deduction of taxes that a shareholder would pay on Fund distributions or the redemption of Fund shares. Data quoted represents past performance.
Investment return and share price will fluctuate with market conditions, and investors may have a gain or loss when shares are sold. Mutual fund performance changes over time and currently may be significantly lower than stated above. Performance is updated and published monthly. Visit the Fund’s website at www.cornercapfunds.com or call 888-813-8637 for month-end performance figures.
| | |
| | |
Annual Report | March 31, 2014 | | 5 |
| | |
Manager’s Report to Shareholders (Unaudited) | | |
| | March 31, 2014 |
| (a) | The Fund’s total returns include the reinvestment of dividend and capital gain distributions, but have not been adjusted for any income taxes payable by shareholders on these distributions. |
| (b) | The Small-Cap Value Fund began operations on September 30, 1992. |
| (c) | CornerCap Investment Counsel, Inc. (the “Adviser”) has entered into a contractual agreement with the Small-Cap Value Fund under which it has agreed to waive or reduce its fees and to assume other expenses of the Small-Cap Value Fund, if necessary, in an amount that limits “Total Annual Fund Operating Expenses” (exclusive of interest, taxes, brokerage fees and commissions, Acquired Fund Fees and Expenses, and extraordinary expenses) to not more than 1.30%. To the extent the Small-Cap Value Fund incurs excluded expenses, the expense ratio will increase. The current contractual agreement cannot be terminated prior to August 1, 2014 without the Board of Trustees’ approval. |
| (d) | The Russell 2000® Value Index measures the 2,000 smallest of the 3,000 largest U.S. Companies (based on total market capitalization) that have lower price-to-book ratios and lower forecasted growth values. Index returns include dividends and/or interest income and, unlike Fund returns, do not reflect fees or expenses. |
| (e) | The Russell 2000® Index is an index that measures the performance of the 2,000 smallest companies in the Russell 3000® Index. |
The index figures do not reflect any deduction for fees, expenses or taxes. It is not possible to invest directly in an index.
Sector Allocation
as a Percentage of Total Investments at March 31, 2014*
| * | These allocations may not reflect the current or future position of the portfolio. |
| | |
Manager’s Report to Shareholders (Unaudited) | | |
| | March 31, 2014 |
| |
| CORNERCAP LARGE/MID-CAP VALUE FUND | | |
Investment Performance through March 31, 2014 (In Thousands)
Total Return
for the period ended March 31, 2014
| | | | | | | | | | | | |
| | 1 Year | | 5 Year | | 10 Year | | Since Inception(b) | | Gross Expense
Ratio | | Net Expense
Ratio(c) |
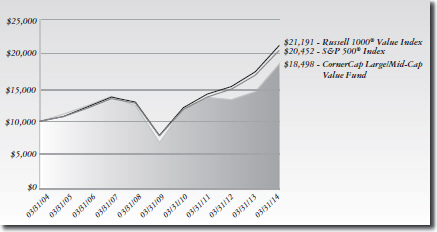
CornerCap Large/Mid-Cap Value Fund(a) | | 28.42% | | 21.98% | | 6.34% | | 2.80% | | 1.51% | | 1.21% |
S&P 500® Index(d) | | 21.86 | | 21.16% | | 7.42% | | 3.98% | | | | |
Russell 1000® Value Index(e) | | 21.57% | | 21.75% | | 7.58% | | 6.77% | | | | |
Past performance does not guarantee future results. The performance data quoted does not reflect the deduction of the 1% redemption fee imposed if shares are redeemed or exchanged within sixty days of purchase or the deduction of taxes that a shareholder would pay on Fund distributions or the redemption of Fund shares. Data quoted represents past performance.
Investment return and share price will fluctuate with market conditions, and investors may have a gain or loss when shares are sold. Mutual fund performance changes over time and currently may be significantly lower than stated above. Performance is updated and published monthly. Visit the Fund’s website at www.cornercapfunds.com or call 888-813-8637 for month-end performance figures.
| (a) | The Fund’s total returns include the reinvestment of dividend and capital gain distribution, but have not been adjusted for any income taxes payable by shareholders on these distributions. |
| (b) | Effective July 29, 2010, the CornerCap Contrarian Fund changed its name to the CornerCap Large/Mid-Cap Value Fund. The CornerCap Large/Mid-Cap Value Fund maintains the same |
| | |
| | |
Annual Report | March 31, 2014 | | 7 |
| | |
Manager’s Report to Shareholders (Unaudited) | | |
| | March 31, 2014 |
| | investment objective as the CornerCap Contrarian Fund: long-term capital appreciation. Prior to October 11, 2004, the CornerCap Contrarian Fund was known as the CornerCap Micro-Cap Fund. The performance figures include figures for the Cornerstone Micro-Cap Fund, L.P., which was a private, unregistered fund managed by CornerCap Investment Counsel, Inc. (the “Adviser”) that began operations in August 31, 1996 and transferred all its assets to the Micro-Cap Fund on July 27, 2000. The Cornerstone Micro-Cap Fund was managed by the same Adviser as the Micro-Cap Fund. It pursued the same objectives and employed the same strategies as the Micro-Cap Fund. As of December 11, 2004, the Fund’s strategy was changed to multi-cap contrarian. |
| (c) | The Adviser has entered into a contractual agreement with the Large/Mid-Cap Fund under which it has agreed to waive or reduce its fees and to assume other expenses of the Large/Mid- Cap Fund, if necessary, in an amount that limits “Total Annual Fund Operating Expenses” (exclusive of interest, taxes, brokerage fees and commissions, Acquired Fund Fees and Expenses, and extraordinary expenses) to not more than 1.20%. To the extent the Large/Mid- Cap Value Fund incurs excluded expenses, the expense ratio will increase. The contractual agreement cannot be terminated prior to August 1, 2014 without the Board of Trustees’ approval. |
| (d) | The S&P 500® Index is an unmanaged index of 500 common stocks chosen for market size, liquidity, and industry group representation. It is a market-value weighted index (stock price times number of shares outstanding) with each stock’s weight in the Index proportionate to its market value. |
| (e) | The Russell 1000® Value Index measures the performance of those companies out of the 1,000 largest U.S. companies (based on total market capitalization) that have lower price-to-book ratios and lower forecasted growth values. |
The index figures do not reflect any deduction for fees, expenses or taxes. It is not possible to invest directly in an index.
Sector Allocation
as a Percentage of Total Investments at March 31, 2014*
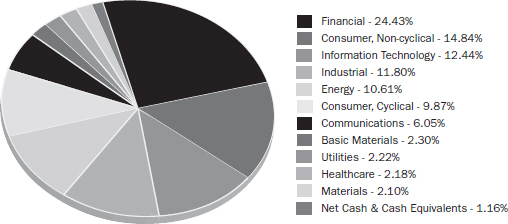
| * | These allocations may not reflect the current or future position of the portfolio. |
| | |
Fund Expenses (Unaudited) | | |
| | |
As a shareholder of a Fund, you incur two types of costs: transaction costs, such as wire fees, redemption fees, and low balance fees, and ongoing costs, including management fees, and other fund operating expenses. This example is intended to help you understand your indirect costs, also referred to as “ongoing costs” (in dollars), of investing in the Fund and to compare these costs with the ongoing costs of investing in other mutual funds.
This example is based on an investment of $1,000 invested at the beginning of the period and held for the entire six-month period of October 1, 2013 through March 31, 2014.
Actual Expenses The first line of the table below provides information about actual account values and actual expenses. You may use the information in this line, together with the amount you invested at the beginning of the period, to estimate the expenses that you paid over the period. Simply divide your account value by $1,000 (for example, an $8,600 account value divided by $1,000 = 8.6), then multiply the result by the number in the first line under the heading “Expenses Paid During Period” to estimate the expenses you paid on your account during this period.
Hypothetical Example for Comparison Purposes The second line of the table provides information about hypothetical account values and hypothetical expenses based on the Fund’s actual expense ratio and an assumed rate of return of 5% per year before expenses, which is not the Fund’s actual return. The hypothetical account values and expenses may not be used to estimate the actual ending account balance or expenses you paid for the period. You may use this information to compare ongoing costs of investing in the Fund and other funds. To do so, compare this 5% hypothetical example with the 5% hypothetical examples that appear in the shareholder reports of other funds.
Please note that the expenses shown in the table are meant to highlight your ongoing costs only and do not reflect any transaction costs, such as wire fees, redemption fees or low balance fees. Therefore, the second line of the table is useful in comparing ongoing costs only and will not help you determine the relative total costs of owning different funds. In addition, if these direct costs were included, your costs would be higher.
| | | | | | | | | | | | | | | |
| | | Beginning
Account Value
10/01/2013 | | Ending
Account Value
3/31/2014 | | Expense
Paid During
Period(a) |
CornerCap Balanced Fund | | | | | | | | | | | | | | | |
Actual Fund Return | | | $ | 1,000.00 | | | | $ | 1,100.20 | | | | $ | 5.76 | |
Hypothetical Fund Return (5% return before expenses) | | | $ | 1,000.00 | | | | $ | 1,019.45 | | | | $ | 5.54 | |
CornerCap Small-Cap Value Fund | | | | | | | | | | | | | | | |
Actual Fund Return | | | $ | 1,000.00 | | | | $ | 1,122.60 | | | | $ | 6.88 | |
Hypothetical Fund Return (5% return before expenses) | | | $ | 1,000.00 | | | | $ | 1,018.45 | | | | $ | 6.54 | |
CornerCap Large/Mid-Cap Value Fund | | | | | | | | | | | | | | | |
Actual Fund Return | | | $ | 1,000.00 | | | | $ | 1,151.90 | | | | $ | 6.44 | |
Hypothetical Fund Return (5% return before expenses) | | | $ | 1,000.00 | | | | $ | 1,018.95 | | | | $ | 6.04 | |
| | |
| | |
Annual Report | March 31, 2014 | | 9 |
| | |
Fund Expenses (Unaudited) | | |
| | |
| (a) | These calculations are based on the expenses incurred in the most recent fiscal half-year. The period’s annualized six-month expense ratio is 1.10% for Balanced Fund; 1.30% for Small-Cap Value Fund and 1.20% for Large/Mid-Cap Value Fund, respectively. The dollar amounts shown as “Expenses Paid During Period” are equal to the annualized expense ratio multiplied by the average account value over the period, multiplied by the number of days in the most recent half-year (182), then divided by 365. |
The expenses shown in the table are meant to highlight and help you compare ongoing costs only and do not reflect any transactional costs, account maintenance fees or charges by processing organizations. The Fund does not charge any account maintenance fee or sales load, but does charge a 1.00% redemption fee that is applicable to all redemptions (sales or exchanges) made within sixty (60) days of an initial purchase of shares; provided, however, that the redemption fee will not apply if the shares to be redeemed are held in a retirement account subject to the Employee Retirement Income Security Act.
| | |
| | |
10 | | www.cornercapfunds.com |
| | |
Schedule of Investments | | |
CornerCap Balanced Fund | | March 31, 2014 |
| | | | | | | | |
| | | Shares | | | Fair Value | |
| |
COMMON STOCKS (61.5%) | | | | | | | | |
Aerospace & Defense (1.4%) | | | | | | | | |
General Dynamics Corp. | | | 3,050 | | | $ | 332,206 | |
| | | | | | | | |
| | |
Agriculture (1.2%) | | | | | | | | |
Altria Group, Inc. | | | 7,770 | | | | 290,831 | |
| | | | | | | | |
| | |
Auto Manufacturers (1.2%) | | | | | | | | |
General Motors Co. | | | 8,290 | | | | 285,342 | |
| | | | | | | | |
| | |
Banks (10.5%) | | | | | | | | |
The Bank of New York Mellon Corp. | | | 8,155 | | | | 287,790 | |
BB&T Corp. | | | 8,120 | | | | 326,180 | |
Capital One Financial Corp. | | | 4,580 | | | | 353,393 | |
Citigroup, Inc. | | | 5,920 | | | | 281,792 | |
The Goldman Sachs Group, Inc. | | | 1,755 | | | | 287,557 | |
JPMorgan Chase & Co. | | | 5,110 | | | | 310,228 | |
The PNC Financial Services Group, Inc. | | | 3,495 | | | | 304,065 | |
Wells Fargo & Co. | | | 6,585 | | | | 327,538 | |
| | | | | | | | |
| | | | | | | 2,478,543 | |
| | | | | | | | |
| | |
Chemicals (1.3%) | | | | | | | | |
Eastman Chemical Co. | | | 3,530 | | | | 304,321 | |
| | | | | | | | |
| | |
Commercial Services (1.3%) | | | | | | | | |
The Western Union Co. | | | 18,180 | | | | 297,425 | |
| | | | | | | | |
| | |
Computers (3.9%) | | | | | | | | |
EMC Corp. | | | 10,670 | | | | 292,465 | |
Hewlett-Packard Co. | | | 10,160 | | | | 328,777 | |
Western Digital Corp. | | | 3,155 | | | | 289,692 | |
| | | | | | | | |
| | | | | | | 910,934 | |
| | | | | | | | |
| | |
Electric (1.2%) | | | | | | | | |
Pinnacle West Capital Corp. | | | 5,335 | | | | 291,611 | |
| | | | | | | | |
| | |
Electrical Components & Equipment (2.6%) | | | | | | | | |
Emerson Electric Co. | | | 4,360 | | | | 291,248 | |
Energizer Holdings, Inc. | | | 3,060 | | | | 308,264 | |
| | | | | | | | |
| | | | | | | 599,512 | |
| | | | | | | | |
| | |
Food (2.6%) | | | | | | | | |
ConAgra Foods, Inc. | | | 9,990 | | | | 309,990 | |
The Kroger Co. | | | 6,990 | | | | 305,113 | |
| | | | | | | | |
| | | | | | | 615,103 | |
| | | | | | | | |
| | |
Healthcare Products (1.2%) | | | | | | | | |
Medtronic, Inc. | | | 4,550 | | | | 280,007 | |
| | | | | | | | |
| | |
| | |
Annual Report | March 31, 2014 | | 11 |
| | |
Schedule of Investments | | |
CornerCap Balanced Fund | | March 31, 2014 |
| | | | | | | | |
| | | Shares | | | Fair Value | |
| |
Healthcare Services (2.6%) | | | | | | | | |
Laboratory Corp. of America Holdings(a) | | | 2,955 | | | $ | 290,211 | |
UnitedHealth Group, Inc. | | | 3,860 | | | | 316,481 | |
| | | | | | | | |
| | | | | | | 606,692 | |
| | | | | | | | |
| | |
Insurance (5.0%) | | | | | | | | |
The Allstate Corp. | | | 4,945 | | | | 279,788 | |
Everest Re Group Ltd. | | | 1,870 | | | | 286,203 | |
Lincoln National Corp. | | | 6,080 | | | | 308,074 | |
Reinsurance Group of America, Inc. | | | 3,675 | | | | 292,640 | |
| | | | | | | | |
| | | | | | | 1,166,705 | |
| | | | | | | | |
| | |
Machinery-Diversified (1.2%) | | | | | | | | |
Deere & Co. | | | 3,220 | | | | 292,376 | |
| | | | | | | | |
| | |
Media (1.2%) | | | | | | | | |
DIRECTV(a) | | | 3,645 | | | | 278,551 | |
| | | | | | | | |
| | |
Miscellaneous Manufacturing (1.2%) | | | | | | | | |
Dover Corp. | | | 3,565 | | | | 291,439 | |
| | | | | | | | |
| | |
Oil & Gas (5.0%) | | | | | | | | |
ConocoPhillips | | | 4,415 | | | | 310,595 | |
Devon Energy Corp. | | | 4,405 | | | | 294,827 | |
Ensco PLC, Class A | | | 5,405 | | | | 285,276 | |
Occidental Petroleum Corp. | | | 3,055 | | | | 291,111 | |
| | | | | | | | |
| | | | | | | 1,181,809 | |
| | | | | | | | |
| | |
Oil & Gas Services (1.3%) | | | | | | | | |
National Oilwell Varco, Inc. | | | 3,915 | | | | 304,861 | |
| | | | | | | | |
| | |
Packaging & Containers (1.2%) | | | | | | | | |
Rock-Tenn Co., Class A | | | 2,750 | | | | 290,318 | |
| | | | | | | | |
| | |
Pharmaceuticals (1.3%) | | | | | | | | |
Teva Pharmaceutical Industries Ltd., Sponsored ADR | | | 5,905 | | | | 312,020 | |
| | | | | | | | |
| | |
Retail (5.0%) | | | | | | | | |
Bed Bath & Beyond, Inc.(a) | | | 4,195 | | | | 288,616 | |
Coach, Inc. | | | 5,995 | | | | 297,712 | |
Kohl’s Corp. | | | 5,355 | | | | 304,164 | |
Nordstrom, Inc. | | | 4,405 | | | | 275,092 | |
| | | | | | | | |
| | | | | | | 1,165,584 | |
| | | | | | | | |
| | |
Semiconductors (1.3%) | | | | | | | | |
Intel Corp. | | | 11,800 | | | | 304,558 | |
| | | | | | | | |
| | |
Software (2.7%) | | | | | | | | |
Microsoft Corp. | | | 7,445 | | | | 305,171 | |
| | |
| | |
12 | | www.cornercapfunds.com |
| | |
| Schedule of Investments | | |
CornerCap Balanced Fund | | March 31, 2014 |
| | | | | | | | |
| | | Shares | | | Fair Value | |
Software (2.7%) (continued) | | | | | | | | |
Oracle Corp. | | | 8,220 | | | $ | 336,280 | |
| | | | | | | | |
| | | | | | | 641,451 | |
| | | | | | | | |
| | |
Telecommunications (2.7%) | | | | | | | | |
AT&T, Inc. | | | 9,010 | | | | 315,981 | |
CenturyLink, Inc. | | | 9,450 | | | | 310,338 | |
| | | | | | | | |
| | | | | | | 626,319 | |
| | | | | | | | |
| | |
Transportation (1.4%) | | | | | | | | |
Union Pacific Corp. | | | 1,735 | | | | 325,590 | |
| | | | | | | | |
| | |
TOTAL COMMON STOCKS (COST $11,614,369) | | | | | | | 14,474,108 | |
| | | | | | | | |
| | |
EXCHANGE TRADED FUNDS (3.7%) | | | | | | | | |
Guggenheim BulletShares® 2014 High Yield Corporate Bond ETF | | | 16,300 | | | | 432,863 | |
Guggenheim BulletShares® 2015 High Yield Corporate Bond ETF | | | 16,470 | | | | 445,184 | |
| | | | | | | | |
| | |
TOTAL EXCHANGE TRADED FUNDS (COST $879,509) | | | | | | | 878,047 | |
| | | | | | | | |
| | |
OPEN-END FUNDS (1.8%) | | | | | | | | |
Performance Trust Strategic Bond Fund | | | 18,485 | | | | 416,651 | |
| | | | | | | | |
| | |
TOTAL OPEN-END FUNDS (COST $412,855) | | | | | | | 416,651 | |
| | | | | | | | |
| | |
CLOSED-END FUNDS (3.0%) | | | | | | | | |
Nuveen Mortgage Opportunity Term Fund | | | 29,634 | | | | 695,510 | |
| | | | | | | | |
| | |
TOTAL CLOSED-END FUNDS (COST $767,495) | | | | | | | 695,510 | |
| | | | | | | | |
| | |
| | | Principal
Amount | | | Fair Value | |
CORPORATE BONDS (23.8%) | | | | | | | | |
Agriculture (1.0%) | | | | | | | | |
Reynolds American, Inc.,
6.750%, 06/15/2017 | | $ | 200,000 | | | | 230,620 | |
| | | | | | | | |
| | |
Auto Manufacturers (1.5%) | | | | | | | | |
Ford Motor Co.,
9.215%, 09/15/2021 | | | 275,000 | | | | 359,499 | |
| | | | | | | | |
| | |
| | |
Annual Report | March 31, 2014 | | 13 |
| | |
Schedule of Investments | | |
CornerCap Balanced Fund | | March 31, 2014 |
| | | | | | | | |
| | | Principal
Amount | | | Fair Value | |
Banks (1.9%) | | | | | | | | |
Citigroup, Inc.,
5.000%, 09/15/2014 | | $ | 150,000 | | | $ | 152,907 | |
The Goldman Sachs Group, Inc.,
4.000%, 03/18/2029(b) | | | 300,000 | | | | 295,651 | |
| | | | | | | | |
| | | | | | | 448,558 | |
| | | | | | | | |
| | |
Chemicals (1.9%) | | | | | | | | |
CF Industries, Inc.,
7.125%, 05/01/2020 | | | 250,000 | | | | 297,338 | |
The Dow Chemical Co.,
2.500%, 02/15/2016 | | | 150,000 | | | | 154,499 | |
| | | | | | | | |
| | | | | | | 451,837 | |
| | | | | | | | |
| | |
Cosmetics & Personal Care (1.6%) | | | | | | | | |
The Estee Lauder Co., Inc.,
5.550%, 05/15/2017 | | | 150,000 | | | | 168,070 | |
The Procter & Gamble Co.,
4.950%, 08/15/2014 | | | 200,000 | | | | 203,385 | |
| | | | | | | | |
| | | | | | | 371,455 | |
| | | | | | | | |
| | |
Diversified Financial Services (2.2%) | | | | | | | | |
Credit Suisse USA, Inc.,
5.375%, 03/02/2016 | | | 250,000 | | | | 270,949 | |
General Electric Capital Corp.,
4.750%, 09/15/2014 | | | 240,000 | | | | 244,789 | |
| | | | | | | | |
| | | | | | | 515,738 | |
| | | | | | | | |
| | |
Food (0.9%) | | | | | | | | |
Safeway, Inc.,
3.950%, 08/15/2020 | | | 200,000 | | | | 202,523 | |
| | | | | | | | |
| | |
Healthcare Services (1.2%) | | | | | | | | |
Humana, Inc.,
6.300%, 08/01/2018 | | | 250,000 | | | | 289,007 | |
| | | | | | | | |
| | |
Home Furnishings (0.7%) | | | | | | | | |
Whirlpool Corp.,
6.500%, 06/15/2016 | | | 150,000 | | | | 167,012 | |
| | | | | | | | |
| | |
Insurance (3.1%) | | | | | | | | |
Principal Life Income Funding Trusts, | | | | | | | | |
5.100%, 04/15/2014 | | | 150,000 | | | | 150,233 | |
The Travelers Cos., Inc., | | | | | | | | |
5.900%, 06/02/2019 | | | 150,000 | | | | 175,549 | |
| | |
| | |
14 | | www.cornercapfunds.com |
| | |
Schedule of Investments | | |
CornerCap Balanced Fund | | March 31, 2014 |
| | | | | | | | |
| | | Principal Amount | | | Fair Value | |
Insurance (3.1%) (continued) | | | | | | | | |
W.R. Berkley Corp., | | | | | | | | |
5.600%, 05/15/2015 | | $ | 150,000 | | | $ | 157,166 | |
5.375%, 09/15/2020 | | | 230,000 | | | | 252,961 | |
| | | | | | | | |
| | | | | | | 735,909 | |
| | | | | | | | |
| | |
Lodging (1.2%) | | | | | | | | |
Starwood Hotels & Resorts Worldwide, Inc., | | | | | | | | |
7.375%, 11/15/2015 | | | 250,000 | | | | 273,764 | |
| | | | | | | | |
| | |
Media (1.2%) | | | | | | | | |
DIRECTV Holdings LLC / DIRECTV Financing Co., Inc, | | | | | | | | |
5.000%, 03/01/2021 | | | 255,000 | | | | 274,199 | |
| | | | | | | | |
| | |
Metal Fabricate & Hardware (1.1%) | | | | | | | | |
The Timken Co., | | | | | | | | |
6.000%, 09/15/2014 | | | 250,000 | | | | 255,544 | |
| | | | | | | | |
| | |
Oil & Gas (0.7%) | | | | | | | | |
Statoil ASA, | | | | | | | | |
6.700%, 01/15/2018 | | | 150,000 | | | | 176,952 | |
| | | | | | | | |
| | |
Retail (3.6%) | | | | | | | | |
AutoZone, Inc., | | | | | | | | |
5.500%, 11/15/2015 | | | 150,000 | | | | 161,234 | |
Best Buy Co., Inc., | | | | | | | | |
3.750%, 03/15/2016 | | | 200,000 | | | | 206,000 | |
Dillard’s, Inc., | | | | | | | | |
6.625%, 01/15/2018 | | | 275,000 | | | | 309,375 | |
Foot Locker, Inc., | | | | | | | | |
8.500%, 01/15/2022 | | | 135,000 | | | | 160,650 | |
| | | | | | | | |
| | | | | | | 837,259 | |
| | | | | | | | |
| | |
TOTAL CORPORATE BONDS (COST $5,449,365) | | | | | | | 5,589,876 | |
| | | | | | | | |
| | |
MUNICIPAL BONDS (2.0%) | | | | | | | | |
Kansas (0.6%) | | | | | | | | |
Johnson County KS, Build America General | | | | | | | | |
Obligation Bonds, Unified School District No. | | | | | | | | |
232, 4.950%, 09/01/2019 | | | 150,000 | | | | 154,545 | |
| | | | | | | | |
| | |
North Dakota (0.7%) | | | | | | | | |
Grand Forks ND, Build America Revenue Bonds, | | | | | | | | |
Series A, 4.500%, 09/01/2019 | | | 150,000 | | | | 163,296 | |
| | | | | | | | |
| | |
| | |
Annual Report | March 31, 2014 | | 15 |
| | |
Schedule of Investments | | |
CornerCap Balanced Fund | | March 31, 2014 |
| | | | | | | | |
| | | Principal Amount | | | Fair Value | |
Texas (0.7%) | | | | | | | | |
County of Galveston TX, Build America General | | | | | | | | |
Obligation Bonds, Series B, 4.200%, | | | | | | | | |
02/01/2017 | | $ | 150,000 | | | $ | 160,179 | |
| | | | | | | | |
| | |
TOTAL MUNICIPAL BONDS (COST $453,451) | | | | | | | 478,020 | |
| | | | | | | | |
| | |
CERTIFICATES OF DEPOSIT (1.0%) | | | | | | | | |
Goldman Sachs Bank USA, Medium-Term | | | | | | | | |
Certificate of Deposit, 0.800%, 08/06/2015 | | | 250,000 | | | | 250,266 | |
| | | | | | | | |
| | |
TOTAL CERTIFICATES OF DEPOSIT (COST $250,000) | | | | | | | 250,266 | |
| | | | | | | | |
| | |
| | | Shares | | | Fair Value | |
SHORT TERM INVESTMENTS (2.9%) | | | | | | | | |
Federated Treasury Obligation Money Market | | | | | | | | |
Fund, 7 Day Yield 0.010% | | | 674,259 | | | | 674,259 | |
| | | | | | | | |
| | |
TOTAL SHORT TERM INVESTMENTS (COST $674,259) | | | | | | | 674,259 | |
| | | | | | | | |
| | |
TOTAL INVESTMENTS (COST $20,501,303) | | | 99.7% | | | | 23,456,737 | |
| | | | | | | | |
| | |
TOTAL ASSETS IN EXCESS OF OTHER LIABILITIES | | | 0.3% | | | | 63,765 | |
| | | | | | | | |
| | |
NET ASSETS | | | 100.0% | | | $ | 23,520,502 | |
| | | | | | | | |
| (a) | Non-Income Producing Security. |
| (b) | Represents a step bond. Rate disclosed is as of March 31, 2014. |
Common Abbreviations:
ADR - American Depositary Receipt.
ASA - Allmennaksjeselskap is the Norwegian term for a public limited company.
ETF - Exchange Traded Fund.
LLC - Limited Liability Company.
Ltd. - Limited.
PLC - Public Limited Company.
The accompanying notes to the financial statements are an integral part of these financial statements.
| | |
| | |
16 | | www.cornercapfunds.com |
| | |
Schedule of Investments | | |
CornerCap Small-Cap Value Fund | | March 31, 2014 |
| | | | | | | | |
| | | Shares | | | Fair Value | |
| |
COMMON STOCKS (95.8%) | | | | | | | | |
Aerospace & Defense (1.7%) | | | | | | | | |
AAR Corp. | | | 12,240 | | | $ | 317,628 | |
Kaman Corp. | | | 9,035 | | | | 367,544 | |
National Presto Industries, Inc. | | | 4,270 | | | | 333,231 | |
| | | | | | | | |
| | | | | | | 1,018,403 | |
| | | | | | | | |
Agriculture (0.6%) | | | | | | | | |
The Andersons, Inc. | | | 6,415 | | | | 380,025 | |
| | | | | | | | |
| | |
Apparel (0.6%) | | | | | | | | |
Steven Madden Ltd.(a) | | | 10,060 | | | | 361,959 | |
| | | | | | | | |
| | |
Auto Parts & Equipment (2.2%) | | | | | | | | |
Cooper Tire & Rubber Co. | | | 14,270 | | | | 346,761 | |
Standard Motor Products, Inc. | | | 10,750 | | | | 384,528 | |
Strattec Security Corp. | | | 7,715 | | | | 557,254 | |
| | | | | | | | |
| | | | | | | 1,288,543 | |
| | | | | | | | |
Banks (17.6%) | | | | | | | | |
Arrow Financial Corp. | | | 13,805 | | | | 365,004 | |
Bank of Kentucky Financial Corp. | | | 11,520 | | | | 432,461 | |
Community Trust Bancorp, Inc. | | | 6,760 | | | | 280,405 | |
Enterprise Financial Services Corp. | | | 17,685 | | | | 354,938 | |
Financial Institutions, Inc. | | | 15,535 | | | | 357,616 | |
First Business Financial Services, Inc. | | | 9,130 | | | | 430,753 | |
First Community Bancshares, Inc. | | | 22,725 | | | | 371,781 | |
First Interstate Bancsystem, Inc. | | | 11,520 | | | | 325,094 | |
First Merchants Corp. | | | 19,010 | | | | 411,376 | |
FirstMerit Corp. | | | 16,530 | | | | 344,320 | |
German American Bancorp, Inc. | | | 13,350 | | | | 385,681 | |
Great Southern Bancorp, Inc. | | | 12,220 | | | | 366,967 | |
Horizon Bancorp | | | 14,725 | | | | 328,073 | |
Lakeland Bancorp, Inc. | | | 30,935 | | | | 348,019 | |
Lakeland Financial Corp. | | | 8,685 | | | | 349,311 | |
MainSource Financial Group, Inc. | | | 23,020 | | | | 393,642 | |
Merchants Bancshares, Inc. | | | 10,035 | | | | 327,241 | |
Monarch Financial Holdings, Inc. | | | 23,195 | | | | 284,371 | |
NBT Bancorp, Inc. | | | 11,820 | | | | 289,117 | |
Old National Bancorp | | | 24,235 | | | | 361,344 | |
Peoples Bancorp, Inc. | | | 15,185 | | | | 375,525 | |
PrivateBancorp, Inc. | | | 15,095 | | | | 460,548 | |
S&T Bancorp, Inc. | | | 14,120 | | | | 334,644 | |
S.Y. Bancorp, Inc. | | | 10,325 | | | | 326,683 | |
Southside Bancshares, Inc. | | | 11,760 | | | | 369,029 | |
Tompkins Financial Corp. | | | 7,405 | | | | 362,549 | |
Trico Bancshares | | | 15,360 | | | | 398,285 | |
Walker & Dunlop, Inc.(a) | | | 26,625 | | | | 435,319 | |
| | |
| | |
Annual Report | March 31, 2014 | | 17 |
| | |
Schedule of Investments | | |
CornerCap Small-Cap Value Fund | | March 31, 2014 |
| | | | | | | | |
| | | Shares | | | Fair Value | |
| |
Banks (17.6%) (continued) | | | | | | | | |
WesBanco, Inc. | | | 10,540 | | | $ | 335,488 | |
| | | | | | | | |
| | | | | | | 10,505,584 | |
| | | | | | | | |
Building Materials (0.5%) | | | | | | | | |
Universal Forest Products, Inc. | | | 5,905 | | | | 326,783 | |
| | | | | | | | |
| | |
Chemicals (2.0%) | | | | | | | | |
A. Schulman, Inc. | | | 10,055 | | | | 364,594 | |
Aceto Corp. | | | 21,575 | | | | 433,442 | |
OMNOVA Solutions, Inc.(a) | | | 37,035 | | | | 384,423 | |
| | | | | | | | |
| | | | | | | 1,182,459 | |
| | | | | | | | |
Commercial Services (8.3%) | | | | | | | | |
ABM Industries, Inc. | | | 12,085 | | | | 347,323 | |
American Public Education, Inc.(a) | | | 7,915 | | | | 277,658 | |
The Brink’s Co. | | | 11,685 | | | | 333,607 | |
FTI Consulting, Inc.(a) | | | 11,740 | | | | 391,412 | |
Global Cash Access Holdings, Inc.(a) | | | 44,245 | | | | 303,521 | |
ICF International, Inc.(a) | | | 7,780 | | | | 309,722 | |
Korn/Ferry International(a) | | | 16,715 | | | | 497,605 | |
Matthews International Corp., Class A | | | 8,910 | | | | 363,617 | |
Medifast, Inc.(a) | | | 9,850 | | | | 286,536 | |
Navigant Consulting, Inc.(a) | | | 21,545 | | | | 402,030 | |
The Providence Service Corp.(a) | | | 11,815 | | | | 334,128 | |
RPX Corp.(a) | | | 22,245 | | | | 362,149 | |
Steiner Leisure Ltd.(a) | | | 7,570 | | | | 350,112 | |
TrueBlue, Inc.(a) | | | 12,910 | | | | 377,747 | |
| | | | | | | | |
| | | | | | | 4,937,167 | |
| | | | | | | | |
Computers (2.4%) | | | | | | | | |
Datalink Corp.(a) | | | 26,185 | | | | 364,757 | |
Insight Enterprises, Inc.(a) | | | 16,715 | | | | 419,714 | |
Mentor Graphics Corp. | | | 15,990 | | | | 352,100 | |
Sykes Enterprises, Inc.(a) | | | 16,265 | | | | 323,185 | |
| | | | | | | | |
| | | | | | | 1,459,756 | |
| | | | | | | | |
Diversified Financial Services (2.8%) | | | | | | | | |
Gain Capital Holdings, Inc. | | | 26,825 | | | | 289,978 | |
Higher One Holdings, Inc.(a) | | | 42,420 | | | | 306,697 | |
Investment Technology Group, Inc.(a) | | | 20,290 | | | | 409,858 | |
Regional Management Corp.(a) | | | 14,490 | | | | 357,323 | |
Walter Investment Management Corp.(a) | | | 11,130 | | | | 332,008 | |
| | | | | | | | |
| | | | | | | 1,695,864 | |
| | | | | | | | |
Electric (2.4%) | | | | | | | | |
Avista Corp. | | | 13,090 | | | | 401,208 | |
El Paso Electric Co. | | | 8,045 | | | | 287,448 | |
The Empire District Electric Co. | | | 14,575 | | | | 354,464 | |
UIL Holdings Corp. | | | 10,195 | | | | 375,278 | |
| | | | | | | | |
| | | | | | | 1,418,398 | |
| | | | | | | | |
| | |
| | |
18 | | www.cornercapfunds.com |
| | |
Schedule of Investments | | |
CornerCap Small-Cap Value Fund | | March 31, 2014 |
| | | | | | | | |
| | | Shares | | | Fair Value | |
| |
Electronics (1.6%) | | | | | | | | |
Plexus Corp.(a) | | | 8,985 | | | $ | 360,029 | |
Sanmina Corp.(a) | | | 17,825 | | | | 311,046 | |
Stoneridge, Inc.(a) | | | 27,130 | | | | 304,670 | |
| | | | | | | | |
| | | | | | | 975,745 | |
| | | | | | | | |
Energy-Alternate Sources (0.7%) | | | | | | | | |
FutureFuel Corp. | | | 19,480 | | | | 395,444 | |
| | | | | | | | |
| | |
Engineering & Construction (1.1%) | | | | | | | | |
AECOM Technology Corp.(a) | | | 11,415 | | | | 367,220 | |
MYR Group, Inc.(a) | | | 12,590 | | | | 318,779 | |
| | | | | | | | |
| | | | | | | 685,999 | |
| | | | | | | | |
Environmental Control (0.6%) | | | | | | | | |
Darling International, Inc.(a) | | | 17,145 | | | | 343,243 | |
| | | | | | | | |
| | |
Food (1.9%) | | | | | | | | |
Cal-Maine Foods, Inc. | | | 6,490 | | | | 407,442 | |
Ingles Markets, Inc., Class A | | | 14,755 | | | | 351,464 | |
Spartan Stores, Inc. | | | 15,462 | | | | 358,873 | |
| | | | | | | | |
| | | | | | | 1,117,779 | |
| | | | | | | | |
Forest Products & Paper (1.9%) | | | | | | | | |
Neenah Paper, Inc. | | | 8,285 | | | | 428,500 | |
Orchids Paper Products Co. | | | 12,780 | | | | 391,068 | |
Schweitzer-Mauduit International, Inc. | | | 8,055 | | | | 343,063 | |
| | | | | | | | |
| | | | | | | 1,162,631 | |
| | | | | | | | |
Gas (0.6%) | | | | | | | | |
Southwest Gas Corp. | | | 6,650 | | | | 355,443 | |
| | | | | | | | |
| | |
Healthcare Products (0.6%) | | | | | | | | |
Hanger, Inc.(a) | | | 10,395 | | | | 350,104 | |
| | | | | | | | |
| | |
Healthcare Services (3.1%) | | | | | | | | |
Amsurg Corp.(a) | | | 7,970 | | | | 375,228 | |
The Ensign Group, Inc. | | | 8,550 | | | | 373,122 | |
LHC Group, Inc.(a) | | | 14,140 | | | | 311,928 | |
Magellan Health Services, Inc.(a) | | | 5,650 | | | | 335,327 | |
Select Medical Holdings Corp. | | | 36,790 | | | | 458,036 | |
| | | | | | | | |
| | | | | | | 1,853,641 | |
| | | | | | | | |
Home Builders (0.5%) | | | | | | | | |
Meritage Homes Corp.(a) | | | 7,610 | | | | 318,707 | |
| | | | | | | | |
| | |
Home Furnishings (1.2%) | | | | | | | | |
Daktronics, Inc. | | | 25,265 | | | | 363,563 | |
VOXX International Corp.(a) | | | 25,300 | | | | 346,104 | |
| | | | | | | | |
| | | | | | | 709,667 | |
| | | | | | | | |
| | |
| | |
Annual Report | March 31, 2014 | | 19 |
| | |
Schedule of Investments | | |
CornerCap Small-Cap Value Fund | | March 31, 2014 |
| | | | | | | | |
| | | Shares | | | Fair Value | |
| |
Household Products (0.6%) | | | | | | | | |
Ennis, Inc. | | | 21,450 | | | $ | 355,426 | |
| | | | | | | | |
| | |
Housewares (0.6%) | | | | | | | | |
Lifetime Brands, Inc. | | | 19,665 | | | | 351,217 | |
| | | | | | | | |
| | |
Insurance (7.4%) | | | | | | | | |
AmTrust Financial Services, Inc. | | | 9,640 | | | | 362,560 | |
Crawford & Co., Class B | | | 42,055 | | | | 458,820 | |
EMC Insurance Group, Inc. | | | 9,775 | | | | 347,306 | |
Greenlight Capital Re Ltd., Class A(a) | | | 10,295 | | | | 337,676 | |
Horace Mann Educators Corp. | | | 10,540 | | | | 305,660 | |
Maiden Holdings Ltd. | | | 30,475 | | | | 380,328 | |
Montpelier Re Holdings Ltd. | | | 10,830 | | | | 322,301 | |
Primerica, Inc. | | | 6,930 | | | | 326,472 | |
Protective Life Corp. | | | 6,045 | | | | 317,907 | |
Selective Insurance Group, Inc. | | | 15,585 | | | | 363,442 | |
Symetra Financial Corp. | | | 16,960 | | | | 336,147 | |
United Insurance Holdings Corp. | | | 37,065 | | | | 541,520 | |
| | | | | | | | |
| | | | | | | 4,400,139 | |
| | | | | | | | |
Internet (1.7%) | | | | | | | | |
Conversant, Inc.(a) | | | 12,350 | | | | 347,653 | |
Dice Holdings, Inc.(a) | | | 39,705 | | | | 296,199 | |
ePlus, Inc.(a) | | | 6,270 | | | | 349,615 | |
| | | | | | | | |
| | | | | | | 993,467 | |
| | | | | | | | |
Iron & Steel (0.6%) | | | | | | | | |
Shiloh Industries, Inc.(a) | | | 19,425 | | | | 344,599 | |
| | | | | | | | |
| | |
Lodging (1.2%) | | | | | | | | |
The Marcus Corp. | | | 22,775 | | | | 380,343 | |
Monarch Casino & Resort, Inc.(a) | | | 18,840 | | | | 349,105 | |
| | | | | | | | |
| | | | | | | 729,448 | |
| | | | | | | | |
Machinery-Diversified (0.6%) | | | | | | | | |
Kadant, Inc. | | | 9,340 | | | | 340,630 | |
| | | | | | | | |
| | |
Media (1.8%) | | | | | | | | |
Courier Corp. | | | 19,220 | | | | 295,988 | |
Journal Communications, Inc., Class A(a) | | | 40,355 | | | | 357,545 | |
Starz, Class A(a) | | | 13,125 | | | | 423,675 | |
| | | | | | | | |
| | | | | | | 1,077,208 | |
| | | | | | | | |
Metal Fabricate & Hardware (1.2%) | | | | | | | | |
LB Foster Co., Class A | | | 7,720 | | | | 361,682 | |
Worthington Industries, Inc. | | | 8,935 | | | | 341,764 | |
| | | | | | | | |
| | | | | | | 703,446 | |
| | | | | | | | |
Miscellaneous Manufacturing (3.7%) | | | | | | | | |
Chase Corp. | | | 11,700 | | | | 368,901 | |
| | |
| | |
20 | | www.cornercapfunds.com |
| | |
Schedule of Investments | | |
CornerCap Small-Cap Value Fund | | March 31, 2014 |
| | | | | | | | |
| | | Shares | | | Fair Value | |
| |
Miscellaneous Manufacturing (3.7%) (continued) | | | | | | | | |
Federal Signal Corp. | | | 24,100 | | | $ | 359,090 | |
Koppers Holdings, Inc. | | | 7,780 | | | | 320,769 | |
Myers Industries, Inc. | | | 16,890 | | | | 336,449 | |
Park-Ohio Holdings Corp.(a) | | | 8,680 | | | | 487,382 | |
Standex International Corp. | | | 5,905 | | | | 316,390 | |
| | | | | | | | |
| | | | | | | 2,188,981 | |
| | | | | | | | |
Office Furnishings (0.6%) | | | | | | | | |
HNI Corp. | | | 10,235 | | | | 374,192 | |
| | | | | | | | |
| | |
Oil & Gas (2.0%) | | | | | | | | |
Panhandle Oil and Gas, Inc., Class A | | | 8,875 | | | | 387,039 | |
Stone Energy Corp.(a) | | | 11,240 | | | | 471,743 | |
Unit Corp.(a) | | | 5,580 | | | | 364,820 | |
| | | | | | | | |
| | | | | | | 1,223,602 | |
| | | | | | | | |
Oil & Gas Services (1.2%) | | | | | | | | |
Newpark Resources, Inc.(a) | | | 30,120 | | | | 344,874 | |
Tesco Corp.(a) | | | 20,570 | | | | 380,545 | |
| | | | | | | | |
| | | | | | | 725,419 | |
| | | | | | | | |
Packaging & Containers (1.1%) | | | | | | | | |
Silgan Holdings, Inc. | | | 7,115 | | | | 352,335 | |
UFP Technologies, Inc.(a) | | | 13,640 | | | | 332,270 | |
| | | | | | | | |
| | | | | | | 684,605 | |
| | | | | | | | |
Pharmaceuticals (2.4%) | | | | | | | | |
Nature’s Sunshine Products, Inc. | | | 19,805 | | | | 272,913 | |
Nutraceutical International Corp.(a) | | | 13,885 | | | | 360,871 | |
Omega Protein Corp.(a) | | | 33,855 | | | | 408,630 | |
PharMerica Corp.(a) | | | 13,490 | | | | 377,450 | |
| | | | | | | | |
| | | | | | | 1,419,864 | |
| | | | | | | | |
Retail (3.8%) | | | | | | | | |
Big 5 Sporting Goods Corp. | | | 20,755 | | | | 333,118 | |
The Cato Corp., Class A | | | 11,085 | | | | 299,738 | |
Destination Maternity Corp. | | | 11,100 | | | | 304,140 | |
Einstein Noah Restaurant Group, Inc. | | | 22,645 | | | | 372,737 | |
Express, Inc.(a) | | | 19,385 | | | | 307,834 | |
The Finish Line, Inc., Class A | | | 10,490 | | | | 284,174 | |
Genesco, Inc.(a) | | | 4,665 | | | | 347,869 | |
| | | | | | | | |
| | | | | | | 2,249,610 | |
| | | | | | | | |
Savings & Loans (2.1%) | | | | | | | | |
Berkshire Hills Bancorp, Inc. | | | 11,250 | | | | 291,150 | |
Dime Community Bancshares, Inc. | | | 15,570 | | | | 264,378 | |
First Defiance Financial Corp. | | | 12,015 | | | | 325,847 | |
WSFS Financial Corp. | | | 5,165 | | | | 368,936 | |
| | | | | | | | |
| | | | | | | 1,250,311 | |
| | | | | | | | |
| | |
| | |
Annual Report | March 31, 2014 | | 21 |
| | |
Schedule of Investments | | |
CornerCap Small-Cap Value Fund | | March 31, 2014 |
| | | | | | | | |
| | | Shares | | | Fair Value | |
| |
Semiconductors (0.6%) | | | | | | | | |
Ultra Clean Holdings, Inc.(a) | | | 28,540 | | | $ | 375,301 | |
| | | | | | | | |
| | |
Software (1.1%) | | | | | | | | |
CSG Systems International, Inc. | | | 13,050 | | | | 339,822 | |
PDF Solutions, Inc.(a) | | | 18,635 | | | | 338,598 | |
| | | | | | | | |
| | | | | | | 678,420 | |
| | | | | | | | |
Telecommunications (2.4%) | | | | | | | | |
Black Box Corp. | | | 15,480 | | | | 376,783 | |
Comverse, Inc.(a) | | | 9,865 | | | | 341,132 | |
Ixia(a) | | | 27,875 | | | | 348,437 | |
NETGEAR, Inc.(a) | | | 10,870 | | | | 366,645 | |
| | | | | | | | |
| | | | | | | 1,432,997 | |
| | | | | | | | |
Textiles (1.1%) | | | | | | | | |
Culp, Inc. | | | 16,215 | | | | 320,084 | |
UniFirst Corp. | | | 3,175 | | | | 349,060 | |
| | | | | | | | |
| | | | | | | 669,144 | |
| | | | | | | | |
Transportation (1.8%) | | | | | | | | |
Arkansas Best Corp. | | | 10,615 | | | | 392,224 | |
Matson, Inc. | | | 11,925 | | | | 294,428 | |
Universal Truckload Services, Inc. | | | 13,790 | | | | 398,531 | |
| | | | | | | | |
| | | | | | | 1,085,183 | |
| | | | | | | | |
Wholesale Distributors (1.3%) | | | | | | | | |
ScanSource, Inc.(a) | | | 9,585 | | | | 390,780 | |
United Stationers, Inc. | | | 8,885 | | | | 364,907 | |
| | | | | | | | |
| | | | | | | 755,687 | |
| | | | | | | | |
TOTAL COMMON STOCKS (COST $48,806,420) | | | | | | | 57,252,240 | |
| | | | | | | | |
| | |
SHORT TERM INVESTMENTS (4.1%) | | | | | | | | |
Federated Treasury Obligation Money Market Fund, 7 Day Yield 0.010% | | | 2,455,311 | | | | 2,455,311 | |
| | | | | | | | |
| | |
TOTAL SHORT TERM INVESTMENTS (COST $2,455,311) | | | | | | | 2,455,311 | |
| | | | | | | | |
| | |
TOTAL INVESTMENTS (COST $51,261,731) | | | 99.9% | | | | 59,707,551 | |
| | | | | | | | |
| | |
TOTAL ASSETS IN EXCESS OF OTHER LIABILITIES | | | 0.1% | | | | 52,193 | |
| | | | | | | | |
| | |
NET ASSETS | | | 100.0% | | | $ | 59,759,744 | |
| | | | | | | | |
| (a) | Non-Income Producing Security. |
Common Abbreviations:
Ltd. - Limited.
The accompanying notes to the financial statements are an integral part of these financial statements.
| | |
| | |
22 | | www.cornercapfunds.com |
| | |
Schedule of Investments | | |
CornerCap Large/Mid-Cap Value Fund | | March 31, 2014 |
| | | | | | | | |
| | | Shares | | | Fair Value | |
| |
COMMON STOCKS (98.8%) | | | | | | | | |
Aerospace & Defense (1.9%) | | | | | | | | |
General Dynamics Corp. | | | 1,875 | | | $ | 204,225 | |
| | | | | | | | |
| | |
Agriculture (2.0%) | | | | | | | | |
Altria Group, Inc. | | | 5,795 | | | | 216,907 | |
| | | | | | | | |
| | |
Auto Manufacturers (1.9%) | | | | | | | | |
General Motors Co. | | | 6,095 | | | | 209,790 | |
| | | | | | | | |
| | |
Banks (16.1%) | | | | | | | | |
The Bank of New York Mellon Corp. | | | 6,485 | | | | 228,856 | |
BB&T Corp. | | | 5,815 | | | | 233,588 | |
Capital One Financial Corp. | | | 2,760 | | | | 212,962 | |
Citigroup, Inc. | | | 4,360 | | | | 207,536 | |
The Goldman Sachs Group, Inc. | | | 1,210 | | | | 198,258 | |
JPMorgan Chase & Co. | | | 3,660 | | | | 222,199 | |
The PNC Financial Services Group, Inc. | | | 2,570 | | | | 223,590 | |
Wells Fargo & Co. | | | 4,460 | | | | 221,840 | |
| | | | | | | | |
| | | | | | | 1,748,829 | |
| | | | | | | | |
Chemicals (2.3%) | | | | | | | | |
Eastman Chemical Co. | | | 2,890 | | | | 249,147 | |
| | | | | | | | |
| | |
Commercial Services (2.1%) | | | | | | | | |
The Western Union Co. | | | 14,020 | | | | 229,367 | |
| | | | | | | | |
| | |
Computers (6.4%) | | | | | | | | |
EMC Corp. | | | 8,465 | | | | 232,026 | |
Hewlett-Packard Co. | | | 7,415 | | | | 239,949 | |
Western Digital Corp. | | | 2,433 | | | | 223,398 | |
| | | | | | | | |
| | | | | | | 695,373 | |
| | | | | | | | |
Electric (2.2%) | | | | | | | | |
Pinnacle West Capital Corp. | | | 4,405 | | | | 240,777 | |
| | | | | | | | |
| | |
Electrical Components & Equipment (4.0%) | | | | | | | | |
Emerson Electric Co. | | | 3,200 | | | | 213,760 | |
Energizer Holdings, Inc. | | | 2,240 | | | | 225,658 | |
| | | | | | | | |
| | | | | | | 439,418 | |
| | | | | | | | |
Food (4.0%) | | | | | | | | |
ConAgra Foods, Inc. | | | 7,180 | | | | 222,796 | |
The Kroger Co. | | | 4,885 | | | | 213,230 | |
| | | | | | | | |
| | | | | | | 436,026 | |
| | | | | | | | |
Healthcare Products (2.2%) | | | | | | | | |
Medtronic, Inc. | | | 3,850 | | | | 236,929 | |
| | | | | | | | |
| | |
| | |
Annual Report | March 31, 2014 | | 23 |
| | |
Schedule of Investments | | |
CornerCap Large/Mid-Cap Value Fund | | March 31, 2014 |
| | | | | | | | |
| | | Shares | | | Fair Value | |
| |
Healthcare Services (4.5%) | | | | | | | | |
Laboratory Corp. of America Holdings(a) | | | 2,515 | | | $ | 246,998 | |
UnitedHealth Group, Inc. | | | 2,880 | | | | 236,131 | |
| | | | | | | | |
| | | | | | | 483,129 | |
| | | | | | | | |
Insurance (8.3%) | | | | | | | | |
The Allstate Corp. | | | 4,220 | | | | 238,768 | |
Everest Re Group Ltd. | | | 1,410 | | | | 215,800 | |
Lincoln National Corp. | | | 4,440 | | | | 224,975 | |
Reinsurance Group of America, Inc. | | | 2,810 | | | | 223,760 | |
| | | | | | | | |
| | | | | | | 903,303 | |
| | | | | | | | |
Machinery-Diversified (2.1%) | | | | | | | | |
Deere & Co. | | | 2,500 | | | | 227,000 | |
| | | | | | | | |
| | |
Media (1.9%) | | | | | | | | |
DIRECTV(a) | | | 2,680 | | | | 204,806 | |
| | | | | | | | |
| | |
Miscellaneous Manufacturing (1.7%) | | | | | | | | |
Dover Corp. | | | 2,270 | | | | 185,573 | |
| | | | | | | | |
| | |
Oil & Gas (8.5%) | | | | | | | | |
ConocoPhillips | | | 3,455 | | | | 243,059 | |
Devon Energy Corp. | | | 3,755 | | | | 251,322 | |
Ensco PLC, Class A | | | 4,290 | | | | 226,426 | |
Occidental Petroleum Corp. | | | 2,170 | | | | 206,780 | |
| | | | | | | | |
| | | | | | | 927,587 | |
| | | | | | | | |
Oil & Gas Services (2.1%) | | | | | | | | |
National Oilwell Varco, Inc. | | | 2,875 | | | | 223,876 | |
| | | | | | | | |
| | |
Packaging & Containers (2.1%) | | | | | | | | |
Rock-Tenn Co., Class A | | | 2,160 | | | | 228,031 | |
| | | | | | | | |
| | |
Pharmaceuticals (2.3%) | | | | | | | | |
Teva Pharmaceutical Industries Ltd., Sponsored ADR | | | 4,630 | | | | 244,649 | |
| | | | | | | | |
| | |
Retail (7.9%) | | | | | | | | |
Bed Bath & Beyond, Inc.(a) | | | 3,075 | | | | 211,560 | |
Coach, Inc. | | | 3,930 | | | | 195,164 | |
Kohl’s Corp. | | | 4,250 | | | | 241,400 | |
Nordstrom, Inc. | | | 3,405 | | | | 212,642 | |
| | | | | | | | |
| | | | | | | 860,766 | |
| | | | | | | | |
Semiconductors (1.9%) | | | | | | | | |
Intel Corp. | | | 8,065 | | | | 208,158 | |
| | | | | | | | |
| | |
Software (4.1%) | | | | | | | | |
Microsoft Corp. | | | 5,300 | | | | 217,247 | |
| | |
| | |
24 | | www.cornercapfunds.com |
| | |
Schedule of Investments | | |
CornerCap Large/Mid-Cap Value Fund | | March 31, 2014 |
| | | | | | | | |
| �� | | Shares | | | Fair Value | |
Software (4.1%) (continued) | | | | | | | | |
Oracle Corp. | | | 5,595 | | | $ | 228,891 | |
| | | | | | | | |
| | | | | | | 446,138 | |
| | | | | | | | |
Telecommunications (4.2%) | | | | | | | | |
AT&T, Inc. | | | 6,510 | | | | 228,306 | |
CenturyLink, Inc. | | | 6,810 | | | | 223,640 | |
| | | | | | | | |
| | | | | | | 451,946 | |
| | | | | | | | |
Transportation (2.1%) | | | | | | | | |
Union Pacific Corp. | | | 1,195 | | | | 224,254 | |
| | | | | | | | |
| | |
TOTAL COMMON STOCKS (COST $8,754,101) | | | | | | | 10,726,004 | |
| | | | | | | | |
| | |
SHORT TERM INVESTMENTS (1.2%) | | | | | | | | |
Federated Treasury Obligation Money Market Fund, 7 Day Yield 0.010% | | | 125,984 | | | | 125,984 | |
| | | | | | | | |
| | |
TOTAL SHORT TERM INVESTMENTS (COST $125,984) | | | | | | | 125,984 | |
| | | | | | | | |
| | |
TOTAL INVESTMENTS (COST $8,880,085) | | | 100.0% | | | | 10,851,988 | |
| | | | | | | | |
| | |
TOTAL ASSETS IN EXCESS OF OTHER LIABILITIES | | | 0.0%(b) | | | | 68 | |
| | | | | | | | |
| | |
NET ASSETS | | | 100.0% | | | $ | 10,852,056 | |
| | | | | | | | |
| (a) | Non-Income Producing Security. |
Common Abbreviations:
ADR - American Depositary Receipt.
Ltd. - Limited.
PLC - Public Limited Company.
The accompanying notes to the financial statements are an integral part of these financial statements.
| | |
| | |
Annual Report | March 31, 2014 | | 25 |
| | |
Statements of Assets and Liabilities | | |
| | | | |
| | | CornerCap
Balanced
Fund | |
ASSETS: | | | | |
Investments, at value (Cost - see below) | | $ | 23,456,737 | |
Receivable for investments sold | | | 0 | |
Receivable for fund shares subscribed | | | 4,815 | |
Dividends and interest receivable | | | 80,396 | |
| |
Total assets | | | 23,541,948 | |
| |
| |
LIABILITIES: | | | | |
Payable for investments purchased | | | 0 | |
Payable for fund shares redeemed | | | 0 | |
Advisory fee payable | | | 15,597 | |
Operating services fee payable | | | 5,849 | |
| |
Total liabilities | | | 21,446 | |
| |
Net assets | | $ | 23,520,502 | |
| |
| |
PRICING OF SHARES (NOTE 2): | | | | |
Net Assets | | $ | 23,520,502 | |
Shares Outstanding | | | 1,516,112 | |
| |
Net asset value, offering and redemption price per share | | $ | 15.51 | |
| |
| |
NET ASSETS CONSISTS OF: | | | | |
Paid-in capital | | $ | 19,177,460 | |
Accumulated net investment income | | | 100,016 | |
Accumulated net realized gain on investments | | | 1,287,592 | |
Net unrealized appreciation in value of investments | | | 2,955,434 | |
| |
Net assets | | $ | 23,520,502 | |
| |
| |
Cost of Investments | | $ | 20,501,303 | |
The accompanying notes to the financial statements are an integral part of these financial statements.
| | |
| | |
26 | | www.cornercapfunds.com |
| | | | | | |
CornerCap Small-Cap Value Fund | | | CornerCap Large/Mid-Cap Value Fund | |
| | | | | | | |
| $ | 59,707,551 | | | $ | 10,851,988 | |
| | 1,696,111 | | | | 0 | |
| | 45,289 | | | | 0 | |
| | 37,058 | | | | 10,829 | |
| | 61,486,009 | | | | 10,862,817 | |
| |
| | | | | | | |
| | 1,565,901 | | | | 0 | |
| | 95,660 | | | | 0 | |
| | 39,818 | | | | 6,277 | |
| | 24,886 | | | | 4,484 | |
| | 1,726,265 | | | | 10,761 | |
| $ | 59,759,744 | | | $ | 10,852,056 | |
| | | |
| |
| | | | | | | |
| $ | 59,759,744 | | | $ | 10,852,056 | |
| | 3,676,526 | | | | 782,620 | |
| $ | 16.25 | | | $ | 13.87 | |
| | | |
| |
| | | | | | | |
| $ | 46,460,887 | | | $ | 8,772,726 | |
| | 0 | | | | 32,661 | |
| | 4,853,037 | | | | 74,766 | |
| | 8,445,820 | | | | 1,971,903 | |
| $ | 59,759,744 | | | $ | 10,852,056 | |
| | | |
| |
| $ | 51,261,731 | | | $ | 8,880,085 | |
| | |
| | |
Annual Report | March 31, 2014 | | 27 |
| | | | |
| | | CornerCap
Balanced
Fund | |
INVESTMENT INCOME: | | | | |
Dividends, (net of foreign withholding taxes of $731, $– and $522) | | $ | 367,119 | |
Interest | | | 180,961 | |
Total investment income | | | 548,080 | |
| |
EXPENSES: | | | | |
Advisory fees | | | 207,389 | |
Operating services fees | | | 62,217 | |
Total expenses | | | 269,606 | |
Less fees waived/reimbursed by investment advisor | | | (41,478) | |
Net expenses | | | 228,128 | |
Net investment income | | | 319,952 | |
| |
REALIZED AND UNREALIZED GAIN ON INVESTMENTS: | | | | |
Net realized gain on investments | | | 1,938,644 | |
Long-term capital gains distributions from other investment companies | | | 39,075 | |
Change in unrealized appreciation of investments | | | 932,941 | |
Net gain on investments | | | 2,910,660 | |
Net increase in net assets resulting from operations | | $ | 3,230,612 | |
| | | | | |
The accompanying notes to the financial statements are an integral part of these financial statements.
| | |
| | |
28 | | www.cornercapfunds.com |
| | |
| | |
| | For the Year Ended March 31, 2014 |
| | | | | | |
Corner Cap Small-Cap Value Fund | | | CornerCap Large/Mid-Cap Value Fund | |
| | | | | | |
| $ | 676,265 | | | $ | 214,296 | |
| | 0 | | | | 0 | |
| | 676,265 | | | | 214,296 | |
| |
| | | | | | | |
| | 512,056 | | | | 98,111 | |
| | 256,028 | | | | 49,056 | |
| | 768,084 | | | | 147,167 | |
| | (102,411) | | | | (29,433) | |
| | 665,673 | | | | 117,734 | |
| | 10,592 | | | | 96,562 | |
| |
| | | | | | | |
| | 8,729,108 | | | | 1,229,947 | |
| | – | | | | – | |
| | 5,903,304 | | | | 1,129,991 | |
| | 14,632,412 | | | | 2,359,938 | |
| $ | 14,643,004 | | | $ | 2,456,500 | |
| | | |
| | |
| | |
Annual Report | March 31, 2014 | | 29 |
| | |
Statements of Changes in Net Assets | | |
| | |
| | | | | | | | |
| | | Corner Cap Balanced Fund | |
| | | Year Ended
March 31, 2014 | | | Year Ended
March 31, 2013 | |
| | |
OPERATIONS: | | | | | | | | |
Net investment income | | $ | 319,952 | | | $ | 323,619 | |
Net realized gain on investments | | | 1,938,644 | | | | 293,341 | |
Long-term capital gains distributions from other investment companies | | | 39,075 | | | | – | |
Change in unrealized appreciation of investments | | | 932,941 | | | | 737,346 | |
Net increase in net assets resulting from operations | | | 3,230,612 | | | | 1,354,306 | |
| | |
DISTRIBUTIONS TO SHAREHOLDERS: | | | | | | | | |
From net investment income | | | (290,002 | ) | | | (318,111 | ) |
From net realized gain on investments | | | (830,002 | ) | | | (339,062 | ) |
Total distributions | | | (1,120,004 | ) | | | (657,173 | ) |
| | |
CAPITAL SHARE TRANSACTIONS: | | | | | | | | |
Increase in net assets resulting from capital share transactions (see Note 3) | | | 2,117,524 | | | | 55,176 | |
Redemption fees | | | 1,894 | | | | 6 | |
Net increase from capital shares transactions | | | 2,119,418 | | | | 55,182 | |
| | |
Total increase in net assets | | | 4,230,026 | | | | 752,315 | |
| | |
NET ASSETS: | | | | | | | | |
Beginning of year | | | 19,290,476 | | | | 18,538,161 | |
End of year* | | $ | 23,520,502 | | | $ | 19,290,476 | |
| | | | | | | | | |
| | |
*Including accumulated net investment income/(loss) of: | | $ | 100,016 | | | $ | 69,828 | |
The accompanying notes to the financial statements are an integral part of these financial statements.
| | |
| | |
30 | | www.cornercapfunds.com |
| | | | | | | | | | | | | | |
| CornerCap Small-Cap Value Fund | | | CornerCap Large/Mid-Cap Value Fund | |
Year Ended
March 31, 2014 | | | Year Ended
March 31, 2013 | | | Year Ended
March 31, 2014 | | | Year Ended
March 31, 2013 | |
| | | |
| | | | | | | | | | | | | | |
| $ | 10,592 | | | $ | 186,617 | | | $ | 96,562 | | | $ | 77,963 | |
| | 8,729,108 | | | | 3,287,284 | | | | 1,229,947 | | | | 124,696 | |
| | – | | | | – | | | | – | | | | – | |
| | 5,903,304 | | | | 110,675 | | | | 1,129,991 | | | | 590,686 | |
| | 14,643,004 | | | | 3,584,576 | | | | 2,456,500 | | | | 793,345 | |
| | | |
| | | | | | | | | | | | | | |
| | – | | | | (251,823) | | | | (80,252) | | | | (72,572) | |
| | (6,390,497) | | | | (1,311,701) | | | | – | | | | – | |
| | (6,390,497) | | | | (1,563,524) | | | | (80,252) | | | | (72,572) | |
| | | |
| | | | | | | | | | | | | | |
| | 14,905,290 | | | | 11,656,157 | | | | 311,915 | | | | 1,879,890 | |
| | 1,568 | | | | 708 | | | | 1,001 | | | | 2,447 | |
| | 14,906,858 | | | | 11,656,865 | | | | 312,916 | | | | 1,882,337 | |
| | | |
| | 23,159,365 | | | | 13,677,917 | | | | 2,689,164 | | | | 2,603,110 | |
| | | |
| | | | | | | | | | | | | | |
| | 36,600,379 | | | | 22,922,462 | | | | 8,162,892 | | | | 5,559,782 | |
| $ | 59,759,744 | | | $ | 36,600,379 | | | $ | 10,852,056 | | | $ | 8,162,892 | |
| | | | | | | | | | | | | | | |
| | | |
| $ | 0 | | | $ | (7,836) | | | $ | 32,661 | | | $ | 16,351 | |
| | |
| | |
Annual Report | March 31, 2014 | | 31 |
| | |
Financial Highlights | | |
CornerCap Balanced Fund | | |
| | |
| Selected data for each share of beneficial interest outstanding throughout the years indicated: | | Year Ended
March 31, 2014 |
PER SHARE OPERATING PERFORMANCE | | |
Net asset value, beginning of year | | $14.03 |
INCOME/(LOSS) FROM INVESTMENT OPERATIONS: | | |
Net investment income | | 0.23(a) |
Net realized and unrealized gain/(loss) on investments | | 2.09 |
| |
Total Income from Investment Operations | | 2.32 |
| |
DIVIDENDS AND DISTRIBUTIONS TO SHAREHOLDERS: | | |
Distributions from net investment income | | (0.22) |
Distributions from net realized gain on investments | | (0.62) |
| |
Total Dividends and Distributions to Shareholders | | (0.84) |
| |
Paid-in Capital from Redemption Fees | | 0.00(b) |
| |
Net asset value, end of year | | $15.51 |
| | | |
| |
Total return | | 16.76% |
| |
RATIOS AND SUPPLEMENTAL DATA: | | |
Net assets, end of year (in 000s) | | $23,521 |
| |
RATIOS TO AVERAGE NET ASSETS: | | |
Expenses without fees waived/reimbursed | | 1.30% |
Expenses | | 1.10% |
Net investment income | | 1.54% |
| |
Portfolio turnover rate | | 43% |
| (a) | Calculated using the average shares method. |
| (b) | Less than $0.005 per share. |
| (c) | Effective October 1, 2011, the Adviser agreed to limit expenses at 1.10%. Prior to October 1, 2011, no expense cap was in place. |
The accompanying notes to the financial statements are an integral part of these financial statements.
| | |
| | |
32 | | www.cornercapfunds.com |
| | | | | | |
Year Ended
March 31, 2013 | | Year Ended
March 31, 2012 | | Year Ended
March 31, 2011 | | Year Ended
March 31, 2010 |
| | | |
| $13.51 | | $13.65 | | $12.82 | | $9.26 |
| | | |
| 0.24 | | 0.24 | | 0.26 | | 0.28 |
| 0.78 | | (0.07) | | 0.97 | | 3.57 |
| | | |
| 1.02 | | 0.17 | | 1.23 | | 3.85 |
| | | |
| (0.24) | | (0.31) | | (0.40) | | (0.29) |
| (0.26) | | – | | – | | – |
| | | |
| (0.50) | | (0.31) | | (0.40) | | (0.29) |
| | | |
| 0.00(b) | | 0.00(b) | | 0.00(b) | | 0.00(b) |
| | | |
| $14.03 | | $13.51 | | $13.65 | | $12.82 |
| | | | | | | |
| | | |
| 7.85% | | 1.47% | | 9.78% | | 41.77% |
| | | |
| $19,290 | | $18,538 | | $18,427 | | $15,635 |
| | | |
| 1.30% | | 1.30% | | N/A | | N/A |
| 1.10% | | 1.20%(c) | | 1.30% | | 1.30% |
| 1.82% | | 1.64% | | 2.13% | | 2.45% |
| | | |
| 40% | | 38% | | 31% | | 32% |
| | |
| | |
Annual Report | March 31, 2014 | | 33 |
| | |
Financial Highlights | | |
CornerCap Small-Cap Value Fund | | |
| | |
| Selected data for each share of beneficial interest outstanding throughout the years indicated: | | Year Ended
March 31, 2014 |
PER SHARE OPERATING PERFORMANCE | | |
Net asset value, beginning of year | | $13.74 |
INCOME/(LOSS) FROM INVESTMENT OPERATIONS: | | |
Net investment income/(loss) | | 0.00(a)(b) |
Net realized and unrealized gain/(loss) on investments | | 4.51 |
| |
Total Income/(Loss) from Investment Operations | | 4.51 |
| |
DIVIDENDS AND DISTRIBUTIONS TO SHAREHOLDERS: | | |
Distributions from net investment income | | – |
Distributions from net realized gain on investments | | (2.00) |
| |
Total Dividends and Distributions to Shareholders | | (2.00) |
| |
Paid-in Capital from Redemption Fees | | 0.00(a) |
| |
Net asset value, end of year | | $16.25 |
| | | |
| |
Total return | | 33.09% |
| |
RATIOS AND SUPPLEMENTAL DATA: | | |
Net assets, end of year (in 000s) | | $59,760 |
| |
RATIOS TO AVERAGE NET ASSETS: | | |
Expenses without fees waived/reimbursed | | 1.50% |
Expenses | | 1.30% |
Net investment income/(loss) | | 0.02% |
| |
Portfolio turnover rate | | 109% |
| (a) | Less than $0.005 per share. |
| (b) | Calculated using the average shares method. |
| (c) | Effective October 1, 2011, the Adviser agreed to limit expenses at 1.30%. Prior to October 1, 2011, no expense cap was in place. |
The accompanying notes to the financial statements are an integral part of these financial statements.
| | |
| | |
34 | | www.cornercapfunds.com |
| | | | | | |
Year Ended
March 31, 2013 | | Year Ended
March 31, 2012 | | Year Ended
March 31, 2011 | | Year Ended
March 31, 2010 |
| | | | | | |
| $12.98 | | $13.51 | | $10.57 | | $5.83 |
| | | | | | |
| 0.10 | | 0.03 | | (0.07) | | (0.07) |
| 1.46 | | (0.56) | | 3.01 | | 4.81 |
| | | |
| 1.56 | | (0.53) | | 2.94 | | 4.74 |
| | | |
| | | | | | |
| (0.13) | | – | | – | | – |
| (0.67) | | – | | – | | – |
| | | |
| (0.80) | | – | | – | | – |
| | | |
| 0.00(a) | | 0.00(a) | | 0.00(a) | | 0.00(a) |
| | | |
| $13.74 | | $12.98 | | $13.51 | | $10.57 |
| | | | | | | |
| | | |
| 12.70% | | (3.92)% | | 27.81% | | 81.30% |
| | | |
| | | | | | |
| $36,600 | | $22,922 | | $22,872 | | $16,448 |
| | | |
| | | | | | |
| 1.50% | | 1.50% | | N/A | | N/A |
| 1.30% | | 1.40%(c) | | 1.50% | | 1.50% |
| 0.74% | | 0.30% | | (0.62)% | | (0.75)% |
| | | |
| 131% | | 56% | | 61% | | 52% |
| | |
| | |
Annual Report | March 31, 2014 | | 35 |
| | |
Financial Highlights | | |
CornerCap Large/Mid-Cap Value Fund | | |
| | | | | |
| Selected data for each share of beneficial interest outstanding throughout the years indicated: | | Year Ended
March 31, 2014 |
PER SHARE OPERATING PERFORMANCE | | |
Net asset value, beginning of year | | $10.88 |
INCOME/(LOSS) FROM INVESTMENT OPERATIONS: | | |
Net investment income/(loss) | | 0.12(b) |
Net realized and unrealized gain/(loss) on investments | | 2.97 |
| |
Total Income/(Loss) from Investment Operations | | 3.09 |
| |
DIVIDENDS AND DISTRIBUTIONS TO SHAREHOLDERS: | | |
Distributions from net investment income | | (0.10) |
Distributions from net realized gain on investments | | – |
| |
Total Dividends and Distributions to Shareholders | | (0.10) |
| |
Paid-in Capital from Redemption Fees | | 0.00(d) |
| |
Net asset value, end of year | | $13.87 |
| | | | |
| |
Total return | | 28.42% |
| |
RATIOS AND SUPPLEMENTAL DATA: | | |
Net assets, end of year (in 000s) | | $10,852 |
| |
RATIOS TO AVERAGE NET ASSETS: | | |
Expenses without fees waived/reimbursed | | 1.50% |
Expenses | | 1.20% |
Net investment income/(loss) | | 0.98% |
| |
Portfolio turnover rate | | 60% |
| (a) | Prior to July 29, 2010, the CornerCap Large/Mid-Cap Value Fund was known as the CornerCap Contrarian Fund. |
| (b) | Calculated using the average shares method. |
| (c) | Realized and unrealized gains and losses per share in this caption are balancing amounts necessary to reconcile the change in net asset value for the year, and may not reconcile with the aggregate gains and losses in the Statement of Operations due to share transactions for the year. |
| (d) | Less than $0.005 per share. |
| (e) | Effective October 1, 2011, the Adviser agreed to limit expenses at 1.20%. Prior to October 1, 2011, the expense cap in place was 1.30 %. |
The accompanying notes to the financial statements are an integral part of these financial statements.
| | |
| | |
36 | | www.cornercapfunds.com |
| | | | | | |
Year Ended March 31, 2013 | | Year Ended March 31, 2012 | | Year Ended March 31, 2011(a) | | Year Ended March 31, 2010 |
| | | | | | |
$10.07 | | $10.41 | | $9.16 | | $5.28 |
| | | | | | |
0.10 | | 0.08 | | 0.02 | | (0.02) |
0.81 | | (0.34)(c) | | 1.23 | | 3.91 |
| | | |
0.91 | | (0.26) | | 1.25 | | 3.89 |
| | | |
| | | | | | |
(0.10) | | (0.08) | | – | | (0.01) |
– | | – | | – | | – |
| | | |
(0.10) | | (0.08) | | – | | (0.01) |
| | | |
0.00(d) | | 0.00(d) | | 0.00(d) | | 0.00(d) |
| | | |
$10.88 | | $10.07 | | $10.41 | | $9.16 |
|
| | | |
9.16% | | (2.42)% | | 13.65% | | 73.72% |
| | | |
| | | | | | |
$8,163 | | $5,560 | | $3,955 | | $4,003 |
| | | |
| | | | | | |
1.50% | | 1.50% | | 1.50% | | N/A |
1.20% | | 1.25%(e) | | 1.38% | | 1.50% |
1.20% | | 0.98% | | 0.24% | | (0.25)% |
| | | |
43% | | 35% | | 136% | | 69% |
| | |
| | |
Annual Report | March 31, 2014 | | 37 |
| | |
Notes to Financial Statements | | |
| | March 31, 2014 |
1. ORGANIZATION
The CornerCap Group of Funds (the “Funds”) was organized on January 6, 1986 as a Massachusetts Business Trust and is registered under the Investment Company Act of 1940 as a diversified open-end management investment company.
The investment objective of the CornerCap Balanced Fund and CornerCap Small-Cap Value Fund is to obtain capital appreciation and current income, whereas the CornerCap Large/Mid-Cap Value Fund’s investment objective is to obtain capital appreciation.
2. SIGNIFICANT ACCOUNTING POLICIES
The following is a summary of significant accounting policies consistently followed by the Funds. These policies are in conformity with U.S. generally accepted accounting principles (“GAAP”).
Accounting Estimates – In preparing financial statements in conformity with GAAP, management makes estimates and assumptions that affect the reported amounts of assets and liabilities and disclosure for contingent assets and liabilities at the date of the financial statements, as well as the reported amounts of revenues and expenses during the reporting period. Actual results could differ from those estimates.
Security Valuation – Portfolio securities including common stocks, corporate bonds, municipal bonds, exchange traded funds (ETFs), open-end funds, closed-end funds, and U.S. Government and Agency obligations that are listed on national securities exchanges or the NASDAQ National Market System are valued at the last sale price as of 4:15 p.m. Eastern time or, in the absence of recorded sales, at the average of readily available closing bid and asked prices on such exchanges or such System. Based on obtaining active market quotes, common stocks and exchange traded funds are classified as Level 1 of the fair value hierarchy. Corporate bonds, municipal bonds, certificates of deposit and U.S. Government and Agency obligations are classified as Level 2 of the hierarchy, and are priced based upon valuations provided by a recognized independent, third-party pricing agent. Third-party pricing agents value these securities by employing methodologies that utilize actual market transactions, broker-supplied valuations, or other methodologies designed to identify the market value for such securities. Such methodologies generally consider such factors as security prices, yields, maturities, call features, ratings, and developments relating to specific securities in arriving at valuations. Unlisted securities that are not included on such exchanges or systems are valued at the mean of the quoted bid and asked prices on the over-the-counter market. Shares of a registered investment company, including money market funds, that are not traded on an exchange are valued at that investment company’s net asset value per share and are classified as Level 1 within the hierarchy. Securities and other assets for which market quotations are not readily available are valued at fair value as determined in good faith by the Adviser under procedures established by and under the general supervision and responsibility of the Funds’ Board of Trustees and will be classified as Level 2 or 3 within the hierarchy, depending on the inputs used. The ability of issuers of debt securities held by the Funds to meet their obligations may be affected by economic and political developments.
Security Transactions Investment Income and Other – Security transactions are recorded on the trade date. Realized gains and losses on sales of investments are calculated on the identified cost basis. Dividend income is recorded on the ex-dividend date and interest income is recorded on the accrual basis. Withholding taxes on foreign dividends have been provided in accordance with the
| | |
| | |
38 | | www.cornercapfunds.com |
| | |
Notes to Financial Statements | | |
| | March 31, 2014 |
Funds’ understanding of the applicable country’s tax rules and rates. Discounts and premiums on securities purchased are amortized over the lives of the respective securities, using the effective interest method. In the event of a security in default, a portion of interest receivable that was once recognized as interest income is written off and treated as a reduction of interest income.
Federal Income Taxes – For Federal income tax purposes, the Funds currently qualify, and intend to remain qualified, as regulated investment companies (“RICs”) under the provisions of Subchapter M of the Internal Revenue Code of 1986 (“Code”), as amended, by complying with the requirements applicable to RICs and by distributing their investment company taxable net income including any excess realized gain which has not been offset by capital loss carryforwards, if any, to their shareholders. Accordingly, no provision for federal income or excise taxes has been made.
As of and during the year ended March 31, 2014, the Funds did not have a liability for any unrecognized tax benefits. The Funds file U.S. federal, state, and local tax returns as required. The Funds’ tax returns are subject to examination by the relevant tax authorities until expiration of the applicable statute of limitations, which is generally three years after the filing of the tax return but which can be extended to six years in certain circumstances. Tax returns for open years of 2010-2013 and as of and during the year ended March 31, 2014, have incorporated no uncertain tax positions that require a provision for income taxes. The Funds recognize interest and penalties, if any, related to unrecognized tax benefits as income tax expense in the Statement of Operations. During the period, the Funds did not incur any interest or penalties.
Distributions to Shareholders – Distributions from net investment income and distributions of net realized capital gains, if any, will be declared and paid at least annually. Income and capital gains distributions are determined in accordance with income tax regulations, which may differ from U.S. generally accepted accounting principles. Distributions to shareholders are recorded on the ex-dividend date.
Fair Value Measurements – A three-tier hierarchy has been established to classify fair value measurements for disclosure purposes. Inputs refer broadly to the assumptions that market participants would use in pricing the asset or liability, including assumptions about risk. Inputs may be observable or unobservable. Observable inputs reflect the assumptions market participants would use in pricing the asset or liability that are developed based on market data obtained from sources independent of the reporting entity. Unobservable inputs reflect the reporting entity’s own assumptions about the assumptions market participants would use in pricing the asset or liability that are developed based on the best information available.
Various inputs are used in determining the value of each Fund’s investments as of the reporting period end. When inputs used fall into different levels of the fair value hierarchy, the level in the hierarchy within which the fair value measurement falls in its entirety, is determined based on the lowest level input that is significant to the fair value measurement in its entirety. The designated input levels are not necessarily an indication of the risk or liquidity associated with these investments. These inputs are categorized in the following hierarchy under applicable financial accounting standards:
| | |
Level 1 – | | Unadjusted quoted prices in active markets for identical investments, unrestricted assets or liabilities that a Fund has the ability to access at the measurement date; |
| | |
| | |
Annual Report | March 31, 2014 | | 39 |
| | |
Notes to Financial Statements | | |
| | March 31, 2014 |
| | |
Level 2 – | | Quoted prices which are not active, quoted prices for similar assets or liabilities in active markets or inputs other than quoted prices that are observable (either directly or indirectly) for substantially the full term of the asset or liability; and |
| |
Level 3 – | | Significant unobservable prices or inputs (including the Fund’s own assumptions in determining the fair value of investments) where there is little or no market activity for the asset or liability at the measurement date. |
The following is a summary of the inputs used to value the Funds’ investments as of March 31, 2014:
CornerCap Balanced Fund:
| | | | | | | | | | | | | | | | |
| | | Valuation Inputs | | | | |
| Investments in Securities at Value* | | Level 1 | | | Level 2 | | | Level 3 | | | Total | |
Common Stocks | | $ | 14,474,108 | | | $ | – | | | $ | – | | | $ | 14,474,108 | |
Exchange Traded Funds | | | 878,047 | | | | – | | | | – | | | | 878,047 | |
Open-End Funds | | | 416,651 | | | | – | | | | – | | | | 416,651 | |
Closed-End Funds | | | 695,510 | | | | – | | | | – | | | | 695,510 | |
Corporate Bonds | | | – | | | | 5,589,876 | | | | – | | | | 5,589,876 | |
Municipal Bonds | | | – | | | | 478,020 | | | | – | | | | 478,020 | |
Certificates of Deposit | | | – | | | | 250,266 | | | | – | | | | 250,266 | |
Short Term Investments | | | 674,259 | | | | – | | | | – | | | | 674,259 | |
Total | | $ | 17,138,575 | | | $ | 6,318,162 | | | $ | – | | | $ | 23,456,737 | |
CornerCap Small-Cap Value Fund:
| | | | | | | | | | | | | | | | |
| | | Valuation Inputs | | | | |
| Investments in Securities at Value* | | Level 1 | | | Level 2 | | | Level 3 | | | Total | |
Common Stocks | | $ | 57,252,240 | | | $ | – | | | $ | – | | | $ | 57,252,240 | |
Short Term Investments | | | 2,455,311 | | | | – | | | | – | | | | 2,455,311 | |
Total | | $ | 59,707,551 | | | $ | – | | | $ | – | | | $ | 59,707,551 | |
CornerCap Large/Mid-Cap Value Fund:
| | | | | | | | | | | | | | | | |
| | | Valuation Inputs | | | | |
| Investments in Securities at Value* | | Level 1 | | | Level 2 | | | Level 3 | | | Total | |
Common Stocks | | $ | 10,726,004 | | | $ | – | | | $ | – | | | $ | 10,726,004 | |
Short Term Investments | | | 125,984 | | | | – | | | | – | | | | 125,984 | |
Total | | $ | 10,851,988 | | | $ | – | | | $ | – | | | $ | 10,851,988 | |
* See Schedule of Investments for industry classification.
The Funds recognize transfers between levels as of the beginning of the annual period in which the transfer occurred. There were no transfers into or out of Levels 1 and 2 during the year ended March 31, 2014.
For the year ended March 31, 2014, the Funds did not have significant unobservable inputs (Level 3) used in determining fair value of any investments. Therefore, a reconciliation of assets in which significant unobservable inputs (Level 3) were used in determining fair value is not applicable. The Funds did not hold any derivative instruments at any time during the year.
| | |
| | |
40 | | www.cornercapfunds.com |
| | |
Notes to Financial Statements | | |
| | March 31, 2014 |
3. SHARES OF BENEFICIAL INTEREST
On March 31, 2014, there was an unlimited number of no par-value shares of beneficial interest authorized for each Fund. Subject to certain exceptions, each Fund charges a 1% redemption fee calculated as a percentage of the amount redeemed. This is applicable to all redemptions (sales or exchanges) made within sixty days of initial purchase of shares of the applicable Fund. The redemption fees charged during the year are disclosed on the Statements of Changes in Net Assets.
Transactions in shares of beneficial interest were as follows:
CornerCap Balanced Fund:
| | | | | | | | | | | | | | | | |
| | | Year Ended | | | Year Ended | | | Year Ended | | | Year Ended | |
| | | March 31, 2014 | | | March 31, 2014 | | | March 31, 2013 | | | March 31, 2013 | |
| | | Shares | | | Value | | | Shares | | | Value | |
Shares Sold | | | 202,958 | | | $ | 3,043,461 | | | | 161,004 | | | $ | 2,118,064 | |
Shares Issued in Reinvestment of Dividends | | | 75,175 | | | | 1,118,606 | | | | 50,608 | | | | 656,388 | |
Total | | | 278,133 | | | | 4,162,067 | | | | 211,612 | | | | 2,774,452 | |
Less Shares Redeemed | | | (137,286) | | | | (2,044,543) | | | | (208,194) | | | | (2,719,276) | |
Net Increase | | | 140,847 | | | $ | 2,117,524 | | | | 3,418 | | | $ | 55,176 | |
| | | | |
| CornerCap Small-Cap Value Fund: | | | | | | | | | | | | | | | | |
| | | | |
| | | Year Ended | | | Year Ended | | | Year Ended | | | Year Ended | |
| | | March 31, 2014 | | | March 31, 2014 | | | March 31, 2013 | | | March 31, 2013 | |
| | | Shares | | | Value | | | Shares | | | Value | |
Shares Sold | | | 1,292,968 | | | $ | 19,084,847 | | | | 973,662 | | | $ | 12,681,909 | |
Shares Issued in Reinvestment of Dividends | | | 399,869 | | | | 6,369,919 | | | | 125,800 | | | | 1,562,441 | |
Total | | | 1,692,837 | | | | 25,454,766 | | | | 1,099,462 | | | | 14,244,350 | |
Less Shares Redeemed | | | (680,126) | | | | (10,549,476) | | | | (201,842) | | | | (2,588,193) | |
Net Increase | | | 1,012,711 | | | $ | 14,905,290 | | | | 897,620 | | | $ | 11,656,157 | |
| | |
| | |
Annual Report | March 31, 2014 | | 41 |
| | |
Notes to Financial Statements | | |
| | March 31, 2014 |
CornerCap Large/Mid-Cap Value Fund:
| | | | | | | | | | | | | | | | |
| | | Year Ended
March 31, 2014 | | | Year Ended
March 31, 2014 | | | Year Ended
March 31, 2013 | | | Year Ended
March 31, 2013 | |
| | | Shares | | | Value | | | Shares | | | Value | |
Shares Sold | | | 270,147 | | | $ | 3,304,555 | | | | 220,410 | | | $ | 2,107,876 | |
Shares Issued in Reinvestment of Dividends | | | 6,038 | | | | 79,037 | | | | 7,466 | | | | 72,572 | |
Total | | | 276,185 | | | | 3,383,592 | | | | 227,876 | | | | 2,180,448 | |
Less Shares Redeemed | | | (243,894) | | | | (3,071,677) | | | | (29,408) | | | | (300,558) | |
Net Increase | | | 32,291 | | | $ | 311,915 | | | | 198,468 | | | $ | 1,879,890 | |
4. FEDERAL TAX INFORMATION
The character of distributions made during the year from net investment income or net realized gains may differ from its ultimate characterization for federal income tax purposes. Also, due to the timing of dividend distributions, the fiscal year in which amounts are distributed may differ from the fiscal year in which the income or realized gain was recorded by the Fund. Distributions from net investment income and distributions of net realized capital gains, if any, will be declared and paid at least annually.
The tax character of distributions paid for the years ended March 31, 2014 and March 31, 2013 were as follows:
| | | | | | | | |
| | | CornerCap Balanced Fund | |
| Distributions Paid From: | | 2014 | | | 2013 | |
Ordinary Income | | $ | 420,002 | | | $ | 386,549 | |
Long-term capital gains | | | 700,002 | | | | 270,624 | |
Total | | $ | 1,120,004 | | | $ | 657,173 | |
| |
| | | CornerCap Small-Cap Value Fund | |
| Distributions Paid From: | | 2014 | | | 2013 | |
Ordinary Income | | $ | 4,603,756 | | | $ | 498,868 | |
Long-term capital gains | | | 1,786,741 | | | | 1,064,656 | |
Total | | $ | 6,390,497 | | | $ | 1,563,524 | |
| |
| | | CornerCap Large/Mid-Cap Value Fund | |
| Distributions Paid From: | | 2014 | | | 2013 | |
Ordinary Income | | $ | 80,252 | | | $ | 72,572 | |
Total | | $ | 80,252 | | | $ | 72,572 | |
| | |
| | |
42 | | www.cornercapfunds.com |
| | |
Notes to Financial Statements | | |
| | March 31, 2014 |
For the year ended March 31, 2014, each Fund recorded the following reclassifications to the accounts listed below. The reclassifications were primarily as a result of the differing book/tax treatment of investments in partnerships and net operating losses.
| | | | | | | | | | | | |
| | | Paid-in Capital | | | Increase/(Decrease)
Net Investment
Income | | | Increase/(Decrease)
Accumulated Net
Realized Gain | |
CornerCap Balanced Fund | | $ | 0 | | | $ | 238 | | | $ | (238) | |
CornerCap Small-Cap Value Fund | | | 49 | | | | (2,756) | | | | 2,707 | |
CornerCap Large/Mid-Cap Value Fund | | | 0 | | | | 0 | | | | 0 | |
As of March 31, 2014, the components of distributable earnings on a tax basis were as follows:
| | | | | | | | | | | | |
| | | CornerCap
Balanced Fund | | | CornerCap
Small-Cap Value
Fund | | | CornerCap
Large/Mid-Cap
Value Fund | |
Undistributed ordinary income | | $ | 548,503 | | | $ | 2,910,874 | | | $ | 32,661 | |
Accumulated net realized gain on investments | | | 839,105 | | | | 1,942,163 | | | | 74,766 | |
Net unrealized appreciation on investments | | | 2,955,434 | | | | 8,445,820 | | | | 1,971,903 | |
Total | | $ | 4,343,042 | | | $ | 13,298,857 | | | $ | 2,079,330 | |
As of March 31, 2014, the Funds had no capital loss carryforwards to reduce the Funds’ taxable income arising from future net realized gains on investments.
During the year ended March 31, 2014, the following Fund utilized capital loss carryovers of:
| | | | |
CornerCap Large/Mid-Cap Value Fund | | $ | 1,155,181 | |
The amount of net unrealized appreciation/(depreciation) and the cost of investment securities for tax purposes, including short-term securities at March 31, 2014, were as follows:
| | | | | | | | | | | | |
| | | CornerCap
Balanced Fund | | | CornerCap Small- Cap Value Fund | | | CornerCap
Large/Mid-Cap
Value Fund | |
Gross unrealized appreciation (excess of value over tax cost) | | $ | 3,118,491 | | | $ | 9,079,524 | | | $ | 2,070,763 | |
Gross unrealized depreciation (excess of tax cost over value) | | | (163,057) | | | | (633,704) | | | | (98,860) | |
Net unrealized appreciation | | $ | 2,955,434 | | | $ | 8,445,820 | | | $ | 1,971,903�� | |
Cost of investments for income tax purposes | | $ | 20,501,303 | | | $ | 51,261,731 | | | $ | 8,880,085 | |
| | |
| | |
Annual Report | March 31, 2014 | | 43 |
| | |
Notes to Financial Statements | | |
| | March 31, 2014 |
5. INVESTMENT ADVISORY AND OTHER RELATED PARTY TRANSACTIONS
A. Each of the Funds has an Investment Advisory Agreement with CornerCap Investment Counsel (the “Adviser”), pursuant to which the Adviser receives an Advisory Fee from each Fund, computed daily and payable monthly, at an annual rate of 1.00% of the average daily net assets. Under the terms of each Advisory Agreement, the Adviser manages the Funds’ investments subject to the approval of the Board of Trustees. The amount of expenses paid to the Adviser are reflected in the Statement of Operations and the amount of current liability is reflected in the Statement of Assets and Liabilities.
In addition, each Fund and the Adviser have an Operating Services Agreement whereby the Adviser receives an Operating Services Fee, computed daily and payable monthly, at an annual rate of 0.30%, 0.50% and 0.50% of the average daily net assets of the CornerCap Balanced Fund, CornerCap Small-Cap Value Fund, and CornerCap Large/Mid-Cap Value Fund, respectively. The amounts of expenses paid to the Adviser as Operating Services Fees are reflected in the Statement of Operations and the amount of current liability is reflected in the Statement of Assets and Liabilities.
The Adviser has contractually agreed to waive fees and reimburse each of the Funds so as to limit each Fund’s “Total Annual Fund Operating Expenses” (exclusive of interest, taxes, brokerage fees and commissions, acquired fund fees and expenses, and extraordinary expenses) as reflected in the following table:
| | |
| Fund | | Total Annual Fund Operating Expense Limitation |
|
CornerCap Balanced Fund | | 1.10% |
CornerCap Small-Cap Value Fund | | 1.30% |
CornerCap Large/Mid-Cap Value Fund | | 1.20% |
The contractual agreements cannot be terminated prior to August 1, 2014 without the Board of Trustees’ approval.
B. The Funds and the Adviser have entered into the following agreements whereby the Adviser pays any associated fees from the Operating Services Fees it receives from the Funds to Fund operational service providers pursuant to the following agreements: 1) Fund Accounting and Administration Agreement with ALPS Fund Services, Inc. to provide day-to-day operational services to the Funds including, but not limited to, accounting, administrative, bookkeeping and pricing services; 2) Transfer Agency and Service Agreement with ALPS Fund Services, Inc. to provide day-to-day operational services to the Funds including, but not limited to, transfer agent, dividend distributing and bookkeeping services; and 3) Distribution Agreement with ALPS Distributors, Inc. to provide distribution services to the Funds. ALPS Distributors, Inc. serves as underwriter/distributor of the Funds.
Certain officers and directors of the Funds are also officers and directors of the Adviser.
| | |
| | |
44 | | www.cornercapfunds.com |
| | |
Notes to Financial Statements | | |
| | March 31, 2014 |
6. PURCHASES AND SALES OF SECURITIES
Investment transactions for the year ended March 31, 2014, excluding U.S. government and agency securities and short-term investments, were as follows:
| | | | |
| Fund | | Cost of Investments
Purchased | | Proceeds From
Investments Sold |
|
CornerCap Balanced Fund | | $ 10,205,905 | | $ 8,313,591 |
CornerCap Small-Cap Value Fund | | 61,605,052 | | 53,563,399 |
CornerCap Large/Mid-Cap Value Fund | | 6,297,957 | | 5,732,740 |
Investment Transactions in U.S. Government Obligations for the year ended March 31, 2014 were as follows: | | |
| Fund | | Purchases of
Securities | | Proceeds from Sales of
Securities |
|
CornerCap Balanced Fund | | $ 0 | | $ 250,000 |
7. BENEFICIAL OWNERSHIP
The beneficial ownership, either directly or indirectly, of more than 25% of the voting securities of a fund creates a presumption of control of the fund, under section 2(a)(9) of the Investment Company Act of 1940. As of March 31, 2014, Charles Schwab & Co. held approximately 53.41%, 70.61% and 68.04% of the CornerCap Balanced Fund, CornerCap Small-Cap Value Fund, and CornerCap Large/Mid-Cap Value Fund, respectively. The shares are held under omnibus accounts (whereby the transactions of two or more shareholders are combined and carried in the name of the originating broker rather than designated separately).
8. INDEMNIFICATIONS
Under the Trust’s organizational documents, its officers and Trustees are indemnified against certain liability arising out of the performance of their duties to the Trust. Additionally, in the normal course of business, the Trust enters into contracts with service providers that may contain general indemnification clauses which may permit indemnification to the extent permissible under applicable law. The Trust’s maximum exposure under these arrangements is unknown, as this would involve future claims that may be made against the Trust that have not yet occurred.
9. RECENT ACCOUNTING PRONOUNCEMENTS
In June 2013, the FASB issued ASU 2013-08, Amendments to the Scope, Measurement and Disclosure Requirements (“ASU 2013-08”), modifying Accounting Standards Codification (“ASC”) 946. The modifications were a result of a joint effort by the FASB and the International Accounting Standards Board to develop a consistent approach for determining whether an entity is an investment company for which fair value of investments is the most relevant measurement. ASU 2013-08 requires reporting entities to disclose that it is an investment company and is applying the guidance as set forth in ASC 946, to disclose any changes in, and the reasons for, its status as an investment company and to disclose information related to whether it has provided or is
| | |
| | |
Annual Report | March 31, 2014 | | 45 |
| | |
Notes to Financial Statements | | |
| | March 31, 2014 |
contractually required to provide financial support to any of its investees. The effective date of ASU 2013-08 is for interim and annual periods beginning after December 15, 2013. At this time, management is evaluating the implications of this requirement and the impact it will have to the financial statement amounts and footnote disclosures, if any.
| | |
| | |
46 | | www.cornercapfunds.com |
Report of Independent Registered Public Accounting Firm
To the Shareholders and Board of Trustees
CornerCap Group of Funds
We have audited the accompanying statements of assets and liabilities, including the schedules of investments, of CornerCap Group of Funds, comprising CornerCap Balanced Fund, CornerCap Small-Cap Value Fund, and CornerCap Large/Mid-Cap Value Fund (the “Funds”), as of March 31, 2014, and the related statements of operations for the year then ended, the statements of changes in net assets for each of the two years in the period then ended, and the financial highlights for each of the five years in the period then ended. These financial statements and financial highlights are the responsibility of the Funds’ management. Our responsibility is to express an opinion on these financial statements and financial highlights based on our audits.
We conducted our audits in accordance with the standards of the Public Company Accounting Oversight Board (United States). Those standards require that we plan and perform the audit to obtain reasonable assurance about whether the financial statements and financial highlights are free of material misstatement. An audit includes examining, on a test basis, evidence supporting the amounts and disclosures in the financial statements. Our procedures included confirmation of securities owned as of March 31, 2014, by correspondence with the Funds’ custodian and broker. An audit also includes assessing the accounting principles used and significant estimates made by management, as well as evaluating the overall financial statement presentation. We believe that our audits provide a reasonable basis for our opinion.
In our opinion, the financial statements and financial highlights referred to above present fairly, in all material respects, the financial position of each of the Funds constituting CornerCap Group of Funds as of March 31, 2014, the results of their operations for the year then ended, the changes in their net assets for each of the two years in the period then ended, and their financial highlights for each of the five years in the period then ended, in conformity with accounting principles generally accepted in the United States of America.

Cohen Fund Audit Services, LTD.
Cleveland, Ohio
May 27, 2014
| | |
| | |
Annual Report | March 31, 2014 | | 47 |
| | |
Additional Information (Unaudited) | | |
| | March 31, 2014 |
1. PROXY VOTING POLICY
A copy of the policies and procedures the Funds use to determine how to vote proxies relating to portfolio securities is available without charge, upon request, by calling the Funds toll-free at (888) 813-8637 or on the Securities and Exchange Commission’s (SEC) website at http://www.sec.gov. Information regarding how the Funds voted proxies relating to portfolio securities during the most recent 12-month period ended June 30 is also available without charge, upon request, by calling the Funds toll-free at (888) 813-8637 and on the SEC’s website at http://www.sec.gov.
2. AVAILABILITY OF QUARTERLY PORTFOLIO SCHEDULE
Each of the Funds files its complete schedule of positions with the SEC for the first and third quarters of each fiscal year on Form N-Q. The Funds’ Form N-Q is available on the SEC website at http://www.sec.gov. The Funds’ Form N-Q may be reviewed and copied at the SEC’s Public Reference Room in Washington, D.C., and information on the operation of the Public Reference Room may be obtained by calling 1-800-SEC-0330. If any of the Funds make the information on Form N-Q available to shareholders on its website or upon request, the information may be obtained by calling the Funds toll-free at (888) 813-8637.
3. COMPENSATION OF TRUSTEES
No interested Trustee, officer, or employee of the Funds receives any compensation from the Funds for serving as an officer or Trustee of the Funds. Effective November 14, 2013, each Independent Trustee receives $3,000 for each Trustees meeting attended in-person and $2,000 for each Trustees meeting attended by telephone. Members of the Audit Committee are paid $1,000 per Audit Committee meeting, and the Audit Committee Chairman is paid $2,000 per Audit Committee meeting. The Audit Committee will normally meet twice a year.
4. TAX DESIGNATIONS
Of the ordinary income (including short-term capital gain) distributions made by the Funds during the year ended December 31, 2013, the percentages qualifying for the dividend received deduction available to corporate shareholders are as follows:
| | | | | | |
| Fund Name | | Percentage | | | |
|
CornerCap Balanced Fund | | | 65.09% | | | |
CornerCap Small-Cap Value Fund | | | 12.28% | | | |
CornerCap Large/Mid Cap Fund | | | 100.00% | | | |
| | |
| | |
48 | | www.cornercapfunds.com |
| | |
Additional Information (Unaudited) | | |
| | March 31, 2014 |
For the year ended December 31, 2013, the following percentages of total ordinary dividends paid by the Funds are qualifying dividends which may be subject to a maximum tax rate of 15%, as provided for by the Jobs and Growth Tax Relief Act of 2003. Complete information should have already been reported in conjunction with the reporting of your distributions on Form 1099-DIV. The percentages were as follows:
| | | | | | |
| Fund Name | | Percentage | | | |
|
CornerCap Balanced Fund | | | 64.71% | | | |
CornerCap Small-Cap Value Fund | | | 12.20% | | | |
CornerCap Large/Mid Cap Fund | | | 100.00% | | | |
Pursuant to Section 852(b)(3) of the Internal Revenue Code, CornerCap Balanced Fund and CornerCap Small-Cap Value Fund designated $700,002 and $1,786,741 respectively, as long-term capital gain dividends.
5. TRUSTEES AND OFFICERS
The business affairs of the Funds are managed under the direction of the Funds’ Board of Trustees in accordance with the laws of the State of Massachusetts. Information pertaining to the Trustees and Officers of the Funds are set forth below. Trustees who are not deemed to be “interested persons” of the trust as defined in the Investment Company Act of 1940, as amended (the “1940 Act”), are referred to as “Independent Trustees.” Trustees who are deemed to be interested persons of Funds as defined in the 1940 Act are referred to as “Interested Trustees”. The Funds’ Statement of Additional Information includes additional information about the trustees and is available upon request by calling toll-free 1-888-813-8637.
INTERESTED TRUSTEES
| | | | | | | | |
Name, Age and
Address | | Position with Trust,
Term of Office and Tenure | | Number of Funds in Complex
Overseen by
Trustee | | Principal Occupation(s) during past 5 years | | Other Trusteeships/
Directorships by
Trustee |
|
Thomas E. Quinn Age: 68 The Peachtree, Suite 1700 1355 Peachtree St. NE Atlanta, GA 30309 | | Trustee, President, Chief Financial Officer, and Treasurer since 1992 | | 3 | | Chief Executive Officer, CornerCap Investment Counsel. | | None |
|
| | |
| | |
Annual Report | March 31, 2014 | | 49 |
| | |
Additional Information (Unaudited) | | |
| | March 31, 2014 |
INDEPENDENT TRUSTEES
| | | | | | | | |
Name, Age and
Address* | | Position with Trust,
Term of Office and Tenure | | Number of Funds in Complex
Overseen by
Trustee | | Principal Occupation(s) during past 5 years | | Other Trusteeships/
Directorships by
Trustee |
|
Richard L. Boger Age: 67 | | Trustee since 1992 | | 3 | | President & CEO, Lex-Tek International, Inc. (a financial services and software consulting company), (1991- present); Managing Trustee, Boger-Owen FNON (2012-present); Business Manager, Owen Holdings, LLLP (2003-2013), Heathland Holdings, LLLP (2004-Present), and General Partner, Shawnee Meadow Holdings, LLLP (2004-Present) (real estate and related companies). | | Director, Gray Television, Inc., since 1991 |
|
Laurin M. McSwain Age: 63 | | Trustee since 1994 | | 3 | | Attorney, Letkoff, Duncan, Grimes, McSwain & Hass, (2003- present). | | None |
|
Leslie W. Gates Age: 58 | | Trustee since 2006 | | 3 | | Retired, 2005. | | None |
|
G. Harry Durity Age: 66 | | Trustee (1992- 2004, since 2010) | | 3 | | Director, Overland Solutions, Inc. (Private Company) since January 2009; Senior Advisor, Consultant, New Mountain Capital, LLC since May 2005; Director, Alexander Mann Solutions (Private Company). | | Director, WebSite Pros, Inc. |
|
| * | All Independent Trustees can be contacted via the Funds at: |
| | 1290 Broadway, Suite 1100, Denver, CO 80203. |
| | |
| | |
50 | | www.cornercapfunds.com |
| | |
Additional Information (Unaudited) | | |
| | March 31, 2014 |
OFFICERS
| | | | | | | | |
Name, Age and
Address | | Position with
Trust, Term of Office
and Tenure | | Number of Funds in Complex
Overseen by
Trustee | | Principal Occupation(s) during past 5 years | | Other Trusteeships/
Directorships by
Trustee |
|
Richard T. Bean Age: 51 The Peachtree, Suite 1700 1355 Peachtree St. NE Atlanta, GA 30309 | | Vice President of the Funds since 1996 | | N/A | | Vice President of the Funds, Portfolio Manager, CornerCap Investment Counsel. | | N/A |
|
John A. Hackney Age: 47 The Peachtree, Suite 1700 1355 Peachtree St. NE Atlanta, GA 30309 | | Chief Compliance Officer since 2004 and Secretary of the Funds since 1999 | | N/A | | Chief Compliance Officer, CornerCap Investment Counsel. | | N/A |
|
Gene A. Hoots Age: 74 The Peachtree, Suite 1700 1355 Peachtree St. NE Atlanta, GA 30309 | | Vice President of the Funds since 1992 | | N/A | | Vice President of the Funds and Chairman Emeritus of CornerCap Investment Counsel. | | N/A |
|
| | |
| | |
Annual Report | March 31, 2014 | | 51 |
Notes
| | |
| | |
52 | | www.cornercapfunds.com |
Notes
| | |
| | |
Annual Report | March 31, 2014 | | 53 |
Item 2. Code of Ethics.
The registrant, as of the end of the period covered by this report, has adopted a code of ethics that applies to the registrant’s principal executive officer, principal financial officer, principal accounting officer or controller or any persons performing similar functions on behalf of the registrant. The registrant’s Code of Ethics was filed as an Exhibit hereto under Item 12(a)(1) of this Form N-CSR on June 6, 2008. There have been no amendments to the Code of Ethics since it was last filed.
Item 3. Audit Committee Financial Expert.
The Board of Trustees of the registrant has determined that there is no “audit committee financial expert” serving on its audit committee. In this regard, the Board also determined that having such a person serve on its audit committee was unnecessary in light of the structure of the registrant’s operations and the broad range of experience and expertise in financial matters possessed by the members of the audit committee, even though no such member was considered to have been an audit committee financial expert under the relatively narrow definition of such term.
Item 4. Principal Accountant Fees and Services.
| | (a) | Audit Fees: For the registrant’s fiscal years ended March 31, 2013 and March 31, 2014, the aggregate fees billed to the registrant for professional services rendered by the principal accountant for the audit of the registrant’s annual financial statements were $24,500 and $25,600, respectively. |
| | (b) | Audit-Related Fees: In registrant’s fiscal years ended March 31, 2013 and March 31, 2014, the aggregate fees billed to the registrant for assurance and related services by the principal accountant that are reasonably related to the performance of the audit of the registrant’s financial statements and are not reported under paragraph (a) of this Item were $0 and $0, respectively. For the registrant’s fiscal years ended March 31, 2013 and March 31, 2014, the aggregate fees billed to the registrant’s investment adviser, and any entity controlling, controlled by, or under common control with the investment adviser that provides ongoing services for the registrant for assurance and related services by the principal accountant that are reasonably related to the performance of the audit of the registrant’s financial statements and are not reported under paragraph (a) of this Item were $0 and $0, respectively. |
| | (c) | Tax Fees: For the registrant’s fiscal years ended March 31, 2013 and March 31, 2014, the aggregate fees billed to the registrant for professional services rendered by the principal accountant for tax services were $5,250 and $5,250, respectively. For the registrant’s fiscal years ended March 31, 2013 and March 31, 2014, the aggregate fees billed to the registrant’s investment adviser and any entity controlling, controlled by, or under common control with the investment adviser that provides ongoing services to the registrant were $0 and $0, respectively. |
2
| | (d) | All Other Fees: For the registrant’s fiscal years ended March 31, 2013 and March 31, 2014, the aggregate fees billed to the registrant by the principal accountant for services other than the services reported in paragraphs (a) through (c) of this Item were $0 and $0, respectively. For the registrant’s fiscal years ended March 31, 2013 and March 31, 2014, the aggregate fees billed to the registrant’s investment adviser and any entity controlling, controlled by, or under common control with the investment adviser that provides ongoing services to the registrant for services other than the services reported in paragraphs (a) through (c) of this Item were $0 and $0 respectively. |
(e)(1) Audit Committee Pre-Approval Policies and Procedures: The registrant’s Audit Committee has not adopted pre-approval policies and procedures. Instead, the Audit Committee approves each audit and non-audit service before the accountant is engaged to provide such service.
(e)(2) No services described in paragraphs (b) through (d) of this Item were approved pursuant to paragraph (c)(7)(i)(C) of Rule 2-01 of Regulation S-X.
(f) Not applicable.
(g) Aggregate Non-Audit Fees: For the registrant’s fiscal years ended March 31, 2013 and March 31, 2014, the aggregate non-audit fees billed to the registrant by the registrant’s accountant for services rendered to the registrant were $0 and $0, respectively. For the registrant’s fiscal years ended March 31, 2013 and March 31, 2014, the aggregate non-audit fees billed to the registrant’s investment adviser and any entity controlling, controlled by, or under common control with the investment adviser that provides ongoing services to the registrant were $0 and $0, respectively.
(h) Not applicable.
Item 5. Audit Committee of Listed Registrants.
Not applicable to registrant.
Item 6. Investments.
| | (a) | The Schedule of Investments is included as part of the report to shareholders filed under Item 1 of this Form N-CSR. |
Item 7. Disclosure of Proxy Voting Policies and Procedures for Closed-End Management Investment Companies.
Not applicable to registrant.
3
Item 8. Portfolio Managers of Closed-End Management Investment Companies.
Not applicable to registrant.
Item 9. Purchases of Equity Securities by Closed-End Management Investment Company and Affiliated Purchasers.
Not applicable to registrant.
Item 10. Submission of Matters to Vote of Security Holders.
Not applicable.
Item 11. Controls and Procedures.
| | (a) | The registrant’s principal executive officer and principal financial officer have concluded that the registrant’s disclosure controls and procedures (as defined in Rule 30a-3(c) under the Investment Company Act of 1940, as amended) are effective based on their evaluation of these controls and procedures as of a date within 90 days of the filing date of this report. |
| | (b) | There was no change in the registrant’s internal control over financial reporting (as defined in Rule 30a-3(d) under the Investment Company Act of 1940, as amended) during the second fiscal quarter of the period covered by this report that has materially affected, or is reasonably likely to materially affect, the registrant’s internal control over financial reporting. |
Item 12. Exhibits.
| | (a)(1) | The registrant’s Code of Ethics for Principal Executive and Senior Financial Officers that applies to the registrant’s principal executive officer and principal financial officer and as described in Item 2 hereof is incorporated by reference to Exhibit 99.12(a)(1) to the registrant’s Form N-CSR for its fiscal year ended March 31, 2011, filed electronically with the Securities and Exchange Commission on June 6, 2008. |
| | (a)(2) | The certifications required by Rule 30a-2(a) of the Investment Company Act of 1940, as amended, and Section 302 of the Sarbanes-Oxley Act of 2002 are attached hereto as Ex.99.Cert. |
| | (b) | A certification of the registrant’s principal executive officer and principal financial officer, as required by Rule 30a-2(b) under the Investment Company Act of 1940, as amended, is attached as Ex.99.906.Cert. |
4
SIGNATURES
Pursuant to the requirements of the Securities Exchange Act of 1934 and the Investment Company Act of 1940, the registrant has duly caused this report to be signed on its behalf by the undersigned, thereunto duly authorized.
| | |
CornerCap Group of Funds |
| |
By: | | /s/ Thomas E. Quinn |
| | Thomas E. Quinn |
| | President |
| |
Date: | | May 30, 2014 |
Pursuant to the requirements of the Securities Exchange Act of 1934 and the Investment Company Act of 1940, this report has been signed below by the following persons on behalf of the registrant and in the capacities and on the dates indicated.
| | |
By: | | /s/ Thomas E. Quinn |
| | Thomas E. Quinn |
| | President (Principal Executive Officer) and Treasurer (Principal Financial Officer) |
| |
Date: | | May 30, 2014 |
5