United States
Securities and Exchange Commission
Washington, D.C. 20549
Form N-CSR
Certified Shareholder Report of Registered Management Investment Companies
811-4577
(Investment Company Act File Number)
Federated Income Securities Trust
_______________________________________________________________
(Exact Name of Registrant as Specified in Charter)
Federated Investors Funds
4000 Ericsson Drive
Warrendale, Pennsylvania 15086-7561
(Address of Principal Executive Offices)
(412) 288-1900
(Registrant's Telephone Number)
John W. McGonigle, Esquire
Federated Investors Tower
1001 Liberty Avenue
Pittsburgh, Pennsylvania 15222-3779
(Name and Address of Agent for Service)
(Notices should be sent to the Agent for Service)
Date of Fiscal Year End: 04/30/2011
Date of Reporting Period: 04/30/2011
Item 1. Reports to Stockholders
Federated Intermediate Corporate Bond Fund
A Portfolio of Federated Income Securities Trust
ANNUAL SHAREHOLDER REPORTApril 30, 2011
Institutional Shares
Institutional Service Shares
(Effective September 30, 2011, the Fund's Institutional Service Shares will be redesignated as Service Shares)
FINANCIAL HIGHLIGHTS
SHAREHOLDER EXPENSE EXAMPLE
MANAGEMENT'S DISCUSSION OF FUND PERFORMANCE
PORTFOLIO OF INVESTMENTS SUMMARY TABLE
PORTFOLIO OF INVESTMENTS
STATEMENT OF ASSETS AND LIABILITIES
STATEMENT OF OPERATIONS
STATEMENT OF CHANGES IN NET ASSETS
NOTES TO FINANCIAL STATEMENTS
REPORT OF INDEPENDENT REGISTERED PUBLIC ACCOUNTING FIRM
BOARD OF TRUSTEES AND TRUST OFFICERS
EVALUATION AND APPROVAL OF ADVISORY CONTRACT
VOTING PROXIES ON FUND PORTFOLIO SECURITIES
QUARTERLY PORTFOLIO SCHEDULE
Financial Highlights – Institutional Shares
(For a Share Outstanding Throughout Each Period)
| Year Ended April 30 | 2011 | 2010 | 2009 | 2008 | 2007 |
| Net Asset Value, Beginning of Period | $10.06 | $8.93 | $10.01 | $10.02 | $9.81 |
| Income From Investment Operations: | | | | | |
| Net investment income | 0.49 | 0.47 | 0.50 | 0.51 | 0.49 |
| Net realized and unrealized gain (loss) on investments and futures contracts | 0.16 | 1.13 | (1.08) | (0.01) | 0.21 |
| TOTAL FROM INVESTMENT OPERATIONS | 0.65 | 1.60 | (0.58) | 0.50 | 0.70 |
| Less Distributions: | | | | | |
| Distributions from net investment income | (0.49) | (0.47) | (0.50) | (0.51) | (0.49) |
| Net Asset Value, End of Period | $10.22 | $10.06 | $8.93 | $10.01 | $10.02 |
| Total Return1 | 6.59% | 18.18% | (5.72)% | 5.08% | 7.33% |
| Ratios to Average Net Assets: | | | | | |
| Net expenses | 0.56% | 0.56% | 0.56% | 0.56% | 0.56% |
| Net investment income | 4.83% | 4.81% | 5.45% | 5.07% | 4.97% |
| Expense waiver/reimbursement2 | 0.23% | 0.25% | 0.21% | 0.20% | 0.19% |
| Supplemental Data: | | | | | |
| Net assets, end of period (000 omitted) | $302,135 | $335,767 | $186,136 | $176,944 | $192,561 |
| Portfolio turnover | 22% | 70% | 28% | 34% | 37% |
| 1 | Based on net asset value. |
| 2 | This expense decrease is reflected in both the net expense and the net investment income ratios shown above. |
See Notes which are an integral part of the Financial Statements
Annual Shareholder Report1
Financial Highlights – Institutional Service Shares
(For a Share Outstanding Throughout Each Period)
| Year Ended April 30 | 2011 | 2010 | 2009 | 2008 | 2007 |
| Net Asset Value, Beginning of Period | $10.06 | $8.93 | $10.01 | $10.02 | $9.81 |
| Income From Investment Operations: | | | | | |
| Net investment income | 0.46 | 0.44 | 0.48 | 0.48 | 0.47 |
| Net realized and unrealized gain (loss) on investments and futures contracts | 0.16 | 1.13 | (1.08) | (0.01) | 0.21 |
| TOTAL FROM INVESTMENT OPERATIONS | 0.62 | 1.57 | (0.60) | 0.47 | 0.68 |
| Less Distributions: | | | | | |
| Distributions from net investment income | (0.46) | (0.44) | (0.48) | (0.48) | (0.47) |
| Net Asset Value, End of Period | $10.22 | $10.06 | $8.93 | $10.01 | $10.02 |
| Total Return1 | 6.33% | 17.89% | (5.95)% | 4.83% | 7.07% |
| Ratios to Average Net Assets: | | | | | |
| Net expenses | 0.81% | 0.81% | 0.80% | 0.80% | 0.80% |
| Net investment income | 4.55% | 4.55% | 5.20% | 4.83% | 4.72% |
| Expense waiver/reimbursement2 | 0.44% | 0.45% | 0.41% | 0.41% | 0.39% |
| Supplemental Data: | | | | | |
| Net assets, end of period (000 omitted) | $70,365 | $168,592 | $128,292 | $28,097 | $34,222 |
| Portfolio turnover | 22% | 70% | 28% | 34% | 37% |
| 1 | Based on net asset value. |
| 2 | This expense decrease is reflected in both the net expense and the net investment income ratios shown above. |
See Notes which are an integral part of the Financial Statements
Annual Shareholder Report2
Shareholder Expense Example (unaudited)
As a shareholder of the Fund, you incur ongoing costs, including management fees and to the extent applicable, distribution (12b-1) fees and/or shareholder services fees and other Fund expenses. This Example is intended to help you to understand your ongoing costs (in dollars) of investing in the Fund and to compare these costs with the ongoing costs of investing in other mutual funds. It is based on an investment of $1,000 invested at the beginning of the period and held for the entire period from November 1, 2010 to April 30, 2011.
ACTUAL EXPENSES
The first section of the table below provides information about actual account values and actual expenses. You may use the information in this section, together with the amount you invested, to estimate the expenses that you incurred over the period. Simply divide your account value by $1,000 (for example, an $8,600 account value divided by $1,000 = 8.6), then multiply the result by the number in the first section under the heading entitled “Expenses Paid During Period” to estimate the expenses attributable to your investment during this period.
HYPOTHETICAL EXAMPLE FOR COMPARISON PURPOSES
The second section of the table below provides information about hypothetical account values and hypothetical expenses based on the Fund's actual expense ratio and an assumed rate of return of 5% per year before expenses, which is not the Fund's actual return. Thus, you should not use the hypothetical account values and expenses to estimate the actual ending account balance or your expenses for the period. Rather, these figures are required to be provided to enable you to compare the ongoing costs of investing in the Fund with other funds. To do so, compare this 5% hypothetical example with the 5% hypothetical examples that appear in the shareholder reports of the other funds.
Annual Shareholder Report
3
Please note that the expenses shown in the table are meant to highlight your ongoing costs only. Therefore, the second section of the table is useful in comparing ongoing costs only, and will not help you determine the relative total costs of owning different funds. | Beginning
Account Value
11/1/2010 | Ending
Account Value
4/30/2011 | Expenses Paid
During Period1 |
| Actual: | | | |
| Institutional Shares | $1,000 | $1,018.50 | $2.80 |
| Institutional Service Shares | $1,000 | $1,017.20 | $4.05 |
Hypothetical (assuming a 5% return
before expenses): | | | |
| Institutional Shares | $1,000 | $1,022.02 | $2.81 |
| Institutional Service Shares | $1,000 | $1,020.78 | $4.06 |
| 1 | Expenses are equal to the Fund's annualized net expense ratios, multiplied by the average account value over the period, multiplied by 181/365 (to reflect the one-half-year period). The annualized net expense ratios are as follows: |
| Institutional Shares | 0.56% |
| Institutional Service Shares | 0.81% |
Annual Shareholder Report4
Performance data quoted represents past performance which is no guarantee of future results. Investment return and principal value will fluctuate so that an investor's shares, when redeemed, may be worth more or less than their original cost. Mutual fund performance changes over time and current performance may be lower or higher than what is stated. For current to the most recent month-end performance and after-tax returns, visit FederatedInvestors.com or call 1-800-341-7400.
Management's Discussion of Fund Performance (unaudited)
The Fund's total return, based on net asset value, for the 12-month reporting period ended April 30, 2011, was 6.59% for Institutional Shares and 6.33% for Institutional Service Shares. The total return of the Barclays Capital U.S. Intermediate Credit Index,1 a broad-based securities market index (BCICI), was 6.58% during the same period. The Fund's total return for the most recently completed fiscal year reflected actual cash flows, transaction costs and other expenses, which were not reflected in the total return of the BCICI.
During the reporting period, the most significant factors affecting the Fund's performance relative to the BCICI were: (1) sector/industry selection; (2) the effect of changing interest rates, referred to as duration; (3) the selection of securities with different maturities (expressed by a “yield curve” showing the relative yield of similar securities with different maturities); and (4) the selection of individual securities.
For purposes of the following, the discussion will focus on the performance of the Fund's Institutional Shares. The 6.59% total return of the Institutional Shares for the reporting period consisted of 5.00% of dividends, and 1.59% appreciation in the net asset value of the shares.
MARKET OVERVIEW
In the early weeks and months of the reporting period, the economy exhibited characteristics of a growth slowdown. Coupled with escalating anxiety over a building debt crisis in Greece, investors temporarily reduced their risk appetite, causing stock markets to fall and corporate bonds to underperform higher quality U.S. government debt securities. By the end of summer 2010, the Federal Reserve (the “Fed”) began communicating the possibility of needing to again step up its effort to help maintain the economic expansion. During the fourth quarter, the Fed began a second round of quantitative easing by announcing its intent to purchase an additional $600 billion in Treasury securities. This announcement and eventual action served to reinvigorate the higher risk asset classes, causing both stocks and corporate bonds to outperform the safe haven U.S. government securities. By the end of the reporting period, the Fed indicated that it would complete its asset purchase program by June 30, 2011.
| 1 | Barclays Capital U.S. Intermediate Credit Index is an unmanaged index that consists of dollar-denominated, investment-grade, publicly-issued securities with a maturity of between one and ten years, a minimum amount outstanding of $250 million and that are issued by both corporate issuers and non-corporate issuers (supranationals, sovereigns, foreign agencies and foreign local governments). Investments cannot be made in an index. |
Annual Shareholder Report5
The constant was that not only did the economy continue to grow but corporate earnings exceeded expectations. Over the entire reporting period, Fund shareholders benefited from lower interest rates (which typically cause bond prices to rise) along with corporate bonds delivering a higher return than comparable maturity U.S. government bonds. As points of reference, the BCICI returned 6.58% relative to 4.12% for the respective intermediate government index, Barclays Capital U.S. Intermediate Government Bond Index.2
sector/industry selection
The decision to overweight or underweight various corporate industries significantly benefited Fund performance relative to the BCICI. Specifically, the Fund was overweight in the financial area including large banks and broker/dealers, as well as non-bank financials such as insurance companies, real estate investment trusts and asset management firms. The financial area was the strongest performing portion of the benchmark components. Additionally, the Fund had less exposure to the non-corporate positions in the BCICI, including sovereign, supranational and foreign agency issues, all of which collectively generated a return of 5.74% relative to the 6.94% for the corporate positions in the BCICI.
Duration3
The effect of changing interest rates had a negative impact on Fund performance. With a combination of positive economic growth and strong corporate earnings expansion, two factors typically associated with rising interest rates, the Fund was generally positioned with a shorter average maturity than the BCICI. In reality, interest rates declined over the course of the reporting period, generating price appreciation in the BCICI due to the rate decline that was in excess of the portfolio. The use of derivatives, primarily U.S. Treasury futures positions used to adjust both duration and interest rate targets, had a negative impact on Fund performance.
| 2 | Barclays Capital U.S. Intermediate Government Bond Index is an unmanaged index that measures intermediate-term bonds issued by the U.S. Treasury, government agencies and quasi-federal corporations with maturities ranging from one to 9.99 years. Investments cannot be made in an index. |
| 3 | Duration is a measure of a security's price sensitivity to changes in interest rates. Securities with longer durations are more sensitive to changes in interest rates than securities of shorter durations. |
Annual Shareholder Report
6
Yield Curve strategyThe yield curve strategy also detracted from Fund performance relative to the BCICI. Not only was the Fund managed with a shorter duration, but also had its largest underweight position on the portion of the yield curve with securities having maturity dates between three and seven years. It was this specific portion of the yield curve (three to seven years maturity bonds) which experienced the largest decline in market interest rates.4
Security Selection
While individual securities both added to and detracted from performance, the overall selection of securities outperformed that of the total BCICI. Individual issuer names which provided the largest positive relative performance were: Regional Diversified Funding (a collection of subordinated bank debt securities), Zurich Financial, Government of Sweden and Citigroup. Those individual issuer names which detracted from relative performance included: Capital One Capital, City National Corp., Crowne Castle Towers and Nasdaq OMX Group.
| 4 | Bond prices are sensitive to changes in interest rates and a rise in interest rates can cause a decline in their prices. |
Annual Shareholder Report7
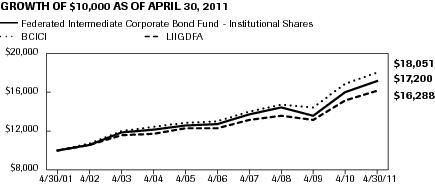
GROWTH OF A $10,000 INVESTMENT – INSTITUTIONAL SHARES
The graph below illustrates the hypothetical investment of $10,0001 in Federated Intermediate Corporate Bond Fund (Institutional Shares) (the “Fund”) from April 30, 2001 to April 30, 2011, compared to the Barclays Capital U.S. Intermediate Credit Index (BCICI)2 and the Lipper Intermediate Term Investment Grade Debt Funds Average (LIIGDFA).3
| Average Annual Total Returns for the Period Ended 4/30/2011 | |
| 1 Year | 6.59% |
| 5 Years | 6.02% |
| 10 Years | 5.57% |
| Federated Intermediate Corporate Bond Fund - Institutional Shares | C000024655 | BCICI | LIIGDFA |
| 4/30/2001 | 10,000 | 10,000 | 10,000 |
| 4/30/2002 | 10,655 | 10,707 | 10,652 |
| 4/30/2003 | 11,836 | 12,077 | 11,638 |
| 4/30/2004 | 12,224 | 12,480 | 11,776 |
| 4/30/2005 | 12,679 | 12,954 | 12,307 |
| 4/30/2006 | 12,842 | 13,077 | 12,376 |
| 4/30/2007 | 13,783 | 14,048 | 13,217 |
| 4/30/2008 | 14,484 | 14,725 | 13,665 |
| 4/30/2009 | 13,655 | 14,476 | 13,238 |
| 4/30/2010 | 16,137 | 16,936 | 15,254 |
| 4/30/2011 | 17,200 | 18,051 | 16,288 |
41 graphic description end -->
Performance data quoted represents past performance which is no guarantee of future results. Investment return and principal value will fluctuate so that an investor's shares, when redeemed, may be worth more or less than their original cost. Mutual fund performance changes over time and current performance may be lower or higher than what is stated. For current to the most recent month-end performance and after-tax returns, visit FederatedInvestors.com or call 1-800-341-7400. Returns shown do not reflect the deduction of taxes that a shareholder would pay on Fund distributions or the redemption of Fund shares. Mutual funds are not obligations of or guaranteed by any bank and are not federally insured.
| 1 | The Fund's performance assumes the reinvestment of all dividends and distributions. The BCICI and LIIGDFA have been adjusted to reflect reinvestment of dividends on securities in the index and the average. |
| 2 | The BCICI is not adjusted to reflect sales charges, expenses or other fees that the Securities and Exchange Commission (SEC) requires to be reflected in the Fund's performance. The index is unmanaged and, unlike the Fund, is not affected by cash flows. It is not possible to invest directly in an index. |
| 3 | The LIIGDFA represents the average of the total returns reported by all of the mutual funds designated by Lipper, Inc. as falling in the respective category, and is not adjusted to reflect any sales charges. However, these total returns are reported net of expenses or other fees that the SEC requires to be reflected in a fund's performance. |
Annual Shareholder Report8
GROWTH OF A $10,000 INVESTMENT – INSTITUTIONAL SERVICE SHARES
The graph below illustrates the hypothetical investment of $10,0001 in Federated Intermediate Corporate Bond Fund (Institutional Service Shares) (the “Fund”) from April 30, 2001 to April 30, 2011, compared to the Barclays Capital U.S. Intermediate Credit Index (BCICI)2 and the Lipper Intermediate Term Investment Grade Debt Funds Average (LIIGDFA).3
| Average Annual Total Returns for the Period Ended 4/30/2011 | |
| 1 Year | 6.33% |
| 5 Years | 5.76% |
| 10 Years | 5.32% |
| Federated Intermediate Corporate Bond Fund - Institutional Service Shares | C000024656 | BCICI | LIIGDFA |
| 4/30/2001 | 10,000 | 10,000 | 10,000 |
| 4/30/2002 | 10,629 | 10,707 | 10,652 |
| 4/30/2003 | 11,777 | 12,077 | 11,638 |
| 4/30/2004 | 12,133 | 12,480 | 11,776 |
| 4/30/2005 | 12,555 | 12,954 | 12,307 |
| 4/30/2006 | 12,688 | 13,077 | 12,376 |
| 4/30/2007 | 13,586 | 14,048 | 13,217 |
| 4/30/2008 | 14,243 | 14,725 | 13,665 |
| 4/30/2009 | 13,395 | 14,476 | 13,238 |
| 4/30/2010 | 15,791 | 16,936 | 15,254 |
| 4/30/2011 | 16,790 | 18,051 | 16,288 |
41 graphic description end -->
Performance data quoted represents past performance which is no guarantee of future results. Investment return and principal value will fluctuate so that an investor's shares, when redeemed, may be worth more or less than their original cost. Mutual fund performance changes over time and current performance may be lower or higher than what is stated. For current to the most recent month-end performance and after-tax returns, visit FederatedInvestors.com or call 1-800-341-7400. Returns shown do not reflect the deduction of taxes that a shareholder would pay on Fund distributions or the redemption of Fund shares. Mutual funds are not obligations of or guaranteed by any bank and are not federally insured.
| 1 | The Fund's performance assumes the reinvestment of all dividends and distributions. The BCICI and LIIGDFA have been adjusted to reflect reinvestment of dividends on securities in the index and the average. |
| 2 | The BCICI is not adjusted to reflect sales charges, expenses or other fees that the SEC requires to be reflected in the Fund's performance. The index is unmanaged and, unlike the Fund, is not affected by cash flows. It is not possible to invest directly in an index. |
| 3 | The LIIGDFA represents the average of the total returns reported by all of the mutual funds designated by Lipper, Inc. as falling in the respective category, and is not adjusted to reflect any sales charges. However, these total returns are reported net of expenses or other fees that the SEC requires to be reflected in a fund's performance. |
Annual Shareholder Report9
Portfolio of Investments Summary Table (unaudited)
At April 30, 2011, the Fund's portfolio composition1 was as follows:
| Security Type | Percentage of
Total Net Assets |
| Corporate Debt Securities | 95.3% |
| Foreign Government Debt Securities | 1.0% |
| Asset-Backed Security2 | 0.0% |
| Derivative Contracts3 | (0.4)% |
| Cash Equivalents4 | 0.2% |
| Other Assets and Liabilities — Net5 | 3.9% |
| TOTAL | 100.0% |
| 1 | See the Fund's Prospectus and Statement of Additional Information for a description of these security types. |
| 2 | Represents less than 0.1%. |
| 3 | Based upon net unrealized appreciation (depreciation) or value of the derivative contracts as applicable. Derivative contracts may consist of futures, forwards, options and swaps. The impact of a derivative contract on the Fund's performance may be larger than its unrealized appreciation (depreciation) or value may indicate. In many cases, the notional value or amount of a derivative contract may provide a better indication of the contract's significance to the portfolio. More complete information regarding the Fund's direct investments in derivative contracts, including unrealized appreciation (depreciation), value and notional values or amounts of such contracts, can be found in the table at the end of the Portfolio of Investments included in this Report. |
| 4 | Cash Equivalents include any investments in money market mutual funds and/or overnight repurchase agreements. |
| 5 | Assets, other than investments in securities and derivative contracts, less liabilities. See Statement of Assets and Liabilities. |
Annual Shareholder Report10
Portfolio of Investments
April 30, 2011
Principal
Amount
or Shares | | | Value |
| | Asset-Backed SecuritY – 0.0% | |
| | Home Equity Loan – 0.0% | |
| $13,119 | 1,2 | 125 Home Loan Owner Trust 1998-1A, Class M2, 8.25%, 2/15/2029
(IDENTIFIED COST $13,113) | 10,971 |
| | Corporate Bonds – 95.3% | |
| | Basic Industry - Chemicals – 1.8% | |
| 1,140,000 | | Albemarle Corp., Sr. Note, 5.10%, 2/1/2015 | 1,225,305 |
| 1,030,000 | | Dow Chemical Co., Note, 8.55%, 5/15/2019 | 1,323,381 |
| 450,000 | | Eastman Chemical Co., Sr. Unsecd. Note, 5.50%, 11/15/2019 | 480,098 |
| 500,000 | 1,2 | Incitec Pivot Finance LLC, Company Guarantee, 4.00%, 12/7/2015 | 507,006 |
| 1,200,000 | 1,2 | Incitec Pivot Finance LLC, Company Guarantee, (Series 144A), 6.00%, 12/10/2019 | 1,274,848 |
| 640,000 | | RPM International, Inc., 6.50%, 2/15/2018 | 691,927 |
| 510,000 | | RPM International, Inc., Sr. Unsecd. Note, 6.125%, 10/15/2019 | 542,440 |
| 450,000 | | Rohm & Haas Co., 6.00%, 9/15/2017 | 505,716 |
| | TOTAL | 6,550,721 |
| | Basic Industry - Metals & Mining – 4.0% | |
| 500,000 | | Alcoa, Inc., Note, 5.55%, 2/1/2017 | 541,373 |
| 1,000,000 | | Alcoa, Inc., Sr. Unsecd. Note, 6.75%, 7/15/2018 | 1,132,874 |
| 1,110,000 | | Allegheny Technologies, Inc., Sr. Note, 9.375%, 6/1/2019 | 1,423,782 |
| 300,000 | 1,2 | Anglo American Capital PLC, Company Guarantee, (Series 144A), 4.45%, 9/27/2020 | 304,837 |
| 500,000 | | Anglogold Ashanti Holdings PLC, Sr. Note, 6.50%, 4/15/2040 | 514,500 |
| 400,000 | | ArcelorMittal, 6.125%, 6/1/2018 | 433,629 |
| 2,500,000 | | ArcelorMittal, Sr. Unsecd. Note, 5.25%, 8/5/2020 | 2,519,293 |
| 150,000 | | ArcelorMittal, Sr. Unsecd. Note, 6.75%, 3/1/2041 | 154,272 |
| 1,430,000 | 1,2 | Gerdau S.A., Company Guarantee, (Series 144A), 5.75%, 1/30/2021 | 1,451,450 |
| 1,000,000 | 1,2 | Gold Fields Orogen Holding BVI Ltd., Company Guarantee, (Series 144A), 4.875%, 10/7/2020 | 967,812 |
| 1,040,000 | 1,2 | Hyundai Steel Co., Sr. Unsecd. Note, (Series 144A), 4.625%, 4/21/2016 | 1,061,669 |
| 630,000 | | Southern Copper Corp., Note, 6.75%, 4/16/2040 | 621,808 |
| 2,350,000 | | Worthington Industries, Inc., Sr. Unsecd. Note, 6.50%, 4/15/2020 | 2,558,192 |
| 500,000 | | Xstrata Canada Corp., 6.00%, 10/15/2015 | 555,433 |
| 650,000 | 1,2 | Xstrata Finance Canada Ltd., Unsecd. Note, 5.50%, 11/16/2011 | 661,523 |
| | TOTAL | 14,902,447 |
| | Basic Industry - Paper – 1.4% | |
| 500,000 | | International Paper Co., Bond, 7.30%, 11/15/2039 | 571,473 |
Annual Shareholder Report11
Principal
Amount
or Shares | | | Value |
| $1,600,000 | | International Paper Co., Sr. Unsecd. Note, 7.50%, 8/15/2021 | 1,914,620 |
| 650,000 | | Plum Creek Timberlands LP, Sr. Unsecd. Note, 4.70%, 3/15/2021 | 639,641 |
| 750,000 | | Westvaco Corp., Sr. Deb., 7.50%, 6/15/2027 | 797,507 |
| 1,000,000 | | Weyerhaeuser Co., Sr. Unsecd. Note, 7.375%, 10/1/2019 | 1,151,026 |
| | TOTAL | 5,074,267 |
| | Capital Goods - Aerospace & Defense – 1.1% | |
| 750,000 | | Boeing Capital Corp., Sr. Note, 3.25%, 10/27/2014 | 791,091 |
| 675,000 | | Embraer Overseas Ltd., Sr. Unsecd. Note, 6.375%, 1/15/2020 | 727,313 |
| 300,000 | | Embraer Overseas Ltd., Sr. Unsecd. Note, 6.375%, 1/24/2017 | 327,000 |
| 1,140,000 | | Goodrich Corp., 4.875%, 3/1/2020 | 1,200,775 |
| 430,000 | | L-3 Communications Corp., Sr. Unsecd. Note, 4.95%, 2/15/2021 | 441,274 |
| 630,000 | 1,2 | Meccanica Holdings USA, Inc., Company Guarantee, (Series 144A), 6.25%, 1/15/2040 | 608,222 |
| | TOTAL | 4,095,675 |
| | Capital Goods - Building Materials – 0.6% | |
| 1,025,000 | | Masco Corp., Sr. Unsecd. Note, 7.125%, 3/15/2020 | 1,068,562 |
| 1,180,000 | | Valmont Industries, Inc., Sr. Unsecd. Note, 6.625%, 4/20/2020 | 1,271,600 |
| | TOTAL | 2,340,162 |
| | Capital Goods - Diversified Manufacturing – 1.5% | |
| 560,000 | | Dover Corp., Note, 5.45%, 3/15/2018 | 627,749 |
| 510,000 | | Harsco Corp., 5.75%, 5/15/2018 | 563,259 |
| 544,000 | 1,2 | Hutchison Whampoa International Ltd., 6.50%, 2/13/2013 | 592,020 |
| 550,000 | 1,2 | Hutchison Whampoa International Ltd., 7.625%, 4/9/2019 | 661,344 |
| 2,000,000 | | Roper Industries, Inc., Sr. Unsecd. Note, 6.25%, 9/1/2019 | 2,238,426 |
| 950,000 | 1,2 | Textron Financial Corp., Jr. Sub. Note, 6.00%, 2/15/2067 | 831,250 |
| | TOTAL | 5,514,048 |
| | Communications - Media & Cable – 1.7% | |
| 770,000 | | Comcast Corp., Company Guarantee, 6.50%, 1/15/2017 | 892,716 |
| 500,000 | | Comcast Corp., Sr. Sub. Deb., 10.625%, 7/15/2012 | 556,289 |
| 3,080,000 | | Cox Communications, Inc., 7.125%, 10/1/2012 | 3,333,481 |
| 1,520,000 | | DIRECTV Holdings LLC, Company Guarantee, 5.00%, 3/1/2021 | 1,562,612 |
| | TOTAL | 6,345,098 |
| | Communications - Media Noncable – 1.0% | |
| 1,200,000 | | Discovery Communications LLC, Company Guarantee, 5.05%, 6/1/2020 | 1,267,982 |
| 775,000 | | Moody's Corp., Sr. Unsecd. Note, 5.50%, 9/1/2020 | 801,314 |
Annual Shareholder Report12
Principal
Amount
or Shares | | | Value |
| $1,800,000 | 1,2 | Pearson Funding Two PLC, Sr. Unsecd. Note, (Series 144A), 4.00%, 5/17/2016 | 1,842,772 |
| | TOTAL | 3,912,068 |
| | Communications - Telecom Wireless – 2.1% | |
| 750,000 | | American Tower Corp., Sr. Unsecd. Note, 4.50%, 1/15/2018 | 742,606 |
| 4,400,000 | 1,2 | Crown Castle Towers LLC, Sr. Secd. Note, (Series 144A), 5.495%, 1/15/2017 | 4,700,956 |
| 1,180,000 | 1,2 | SBA Tower Trust, (Series 144A), 5.101%, 4/15/2017 | 1,241,332 |
| 870,000 | | Vodafone Group PLC, Note, 5.625%, 2/27/2017 | 977,718 |
| | TOTAL | 7,662,612 |
| | Communications - Telecom Wirelines – 2.0% | |
| 1,290,000 | | Alltel Corp., Deb., 6.50%, 11/1/2013 | 1,437,786 |
| 1,560,000 | | CenturyLink, Inc., Sr. Note, 6.15%, 9/15/2019 | 1,641,753 |
| 1,500,000 | 1,2 | KT Corp., Note, 5.875%, 6/24/2014 | 1,639,509 |
| 910,000 | | Rogers Communications, Inc., 5.50%, 3/15/2014 | 1,003,275 |
| 900,000 | | Rogers Communications, Inc., Company Guarantee, 6.80%, 8/15/2018 | 1,061,973 |
| 410,000 | | Telefonica Emisiones S.A.U., Company Guarantee, 5.462%, 2/16/2021 | 426,401 |
| 270,000 | | Telefonica SA, Company Guarantee, 7.045%, 6/20/2036 | 303,653 |
| | TOTAL | 7,514,350 |
| | Consumer Cyclical - Automotive – 2.0% | |
| 910,000 | 1,2 | American Honda Finance Corp., 4.625%, 4/2/2013 | 965,227 |
| 575,000 | 1,2 | Harley-Davidson Financial Services, Inc., Company Guarantee, (Series 144A), 3.875%, 3/15/2016 | 581,470 |
| 1,490,000 | 1,2 | Hyundai Capital Services, Inc., Note, (Series 144A), 6.00%, 5/5/2015 | 1,623,160 |
| 3,400,000 | 1,2 | Nissan Motor Acceptance Corp., Note, 4.50%, 1/30/2015 | 3,586,329 |
| 590,000 | 1,2 | RCI Banque SA, Sr. Unsecd. Note, (Series 144A), 4.60%, 4/12/2016 | 599,373 |
| | TOTAL | 7,355,559 |
| | Consumer Cyclical - Entertainment – 1.6% | |
| 1,600,000 | 1 | Football Trust V, Pass Thru Cert., 5.35%, 10/5/2020 | 1,668,081 |
| 3,150,000 | 1,2 | NBC Universal, Inc., Sr. Unsecd. Note, (Series 144A), 5.15%, 4/30/2020 | 3,298,046 |
| 500,000 | | Time Warner, Inc., Company Guarantee, 6.20%, 3/15/2040 | 519,116 |
| 220,000 | | Time Warner, Inc., Company Guarantee, 6.25%, 3/29/2041 | 230,042 |
| 290,000 | | Viacom, Inc., Sr. Unsecd. Note, 3.50%, 4/1/2017 | 292,206 |
| | TOTAL | 6,007,491 |
| | Consumer Cyclical - Lodging – 0.6% | |
| 1,400,000 | | Choice Hotels International, Inc., Company Guarantee, 5.70%, 8/28/2020 | 1,408,761 |
Annual Shareholder Report13
Principal
Amount
or Shares | | | Value |
| $420,000 | | Wyndham Worldwide Corp., Sr. Unsecd. Note, 5.625%, 3/1/2021 | 421,851 |
| 450,000 | | Wyndham Worldwide Corp., Sr. Unsecd. Note, 6.00%, 12/1/2016 | 482,468 |
| | TOTAL | 2,313,080 |
| | Consumer Cyclical - Retailers – 1.0% | |
| 560,000 | | Best Buy Co., Inc., Sr. Unsecd. Note, 6.75%, 7/15/2013 | 613,633 |
| 335,354 | 1,2 | CVS Caremark Corp., Pass Thru Cert., 5.298%, 1/11/2027 | 331,862 |
| 670,000 | | Home Depot, Inc., Sr. Unsecd. Note, 5.95%, 4/1/2041 | 692,642 |
| 250,000 | | JC Penney Corp., Inc., Sr. Unsecd. Note, 5.75%, 2/15/2018 | 253,125 |
| 250,000 | | JC Penney Corp., Inc., Sr. Unsecd. Note, 7.40%, 4/1/2037 | 239,375 |
| 600,000 | | JC Penney Corp., Inc., Sr. Unsecd. Note, 7.65%, 8/15/2016 | 666,000 |
| 540,000 | | O'Reilly Automotive, Inc., Company Guarantee, 4.875%, 1/14/2021 | 544,666 |
| 495,000 | | Wal-Mart Stores, Inc., Sr. Unsecd. Note, 5.625%, 4/15/2041 | 510,416 |
| | TOTAL | 3,851,719 |
| | Consumer Cyclical - Services – 0.8% | |
| 2,025,000 | | Boston University, 7.625%, 7/15/2097 | 2,225,120 |
| 480,000 | | eBay, Inc., Sr. Unsecd. Note, 3.25%, 10/15/2020 | 446,246 |
| 500,000 | | Expedia, Inc., Company Guarantee, 5.95%, 8/15/2020 | 495,000 |
| | TOTAL | 3,166,366 |
| | Consumer Non-Cyclical - Food/Beverage – 1.2% | |
| 800,000 | 1,2 | Bacardi Ltd., Sr. Note, 7.45%, 4/1/2014 | 928,529 |
| 2,500,000 | | Coca-Cola Femsa S.A.B de C.V., Sr. Unsecd. Note, 4.625%, 2/15/2020 | 2,607,730 |
| 5,000 | | Grand Metropolitan Investment Corp., Company Guarantee, 9.00%, 8/15/2011 | 5,118 |
| 750,000 | | Ralcorp Holdings, Inc., Sr. Secd. Note, 6.625%, 8/15/2039 | 808,514 |
| | TOTAL | 4,349,891 |
| | Consumer Non-Cyclical - Health Care – 1.1% | |
| 1,250,000 | | Boston Scientific Corp., 7.375%, 1/15/2040 | 1,452,214 |
| 100,000 | | Express Scripts, Inc., Company Guarantee, 5.25%, 6/15/2012 | 104,806 |
| 160,000 | | Express Scripts, Inc., Sr. Unsecd. Note, 7.25%, 6/15/2019 | 193,897 |
| 1,700,000 | | Life Technologies Corp., Sr. Note, 3.375%, 3/1/2013 | 1,751,147 |
| 550,000 | | Quest Diagnostics, Inc., Sr. Unsecd. Note, 5.75%, 1/30/2040 | 552,170 |
| | TOTAL | 4,054,234 |
| | Consumer Non-Cyclical - Pharmaceuticals – 0.7% | |
| 1,260,000 | | Bio-Rad Laboratories, Inc., Sr. Unsecd. Note, 4.875%, 12/15/2020 | 1,252,125 |
| 1,270,000 | | Gilead Sciences, Inc., Sr. Unsecd. Note, 4.50%, 4/1/2021 | 1,279,947 |
| | TOTAL | 2,532,072 |
Annual Shareholder Report14
Principal
Amount
or Shares | | | Value |
| | Consumer Non-Cyclical - Products – 0.9% | |
| $500,000 | | Clorox Co., Sr. Unsecd. Note, 3.55%, 11/1/2015 | 517,053 |
| 800,000 | | Whirlpool Corp., 5.50%, 3/1/2013 | 851,680 |
| 2,010,000 | | Whirlpool Corp., Note, 8.00%, 5/1/2012 | 2,136,511 |
| | TOTAL | 3,505,244 |
| | Energy - Independent – 2.3% | |
| 1,500,000 | | Canadian Natural Resources Ltd., 4.90%, 12/1/2014 | 1,644,434 |
| 170,000 | | Pemex Project Funding Master, 5.75%, 12/15/2015 | 187,317 |
| 5,000,000 | | Petroleos Mexicanos, Company Guarantee, (Series WI), 4.875%, 3/15/2015 | 5,350,486 |
| 660,000 | | Petroleos Mexicanos, Company Guarantee, (Series WI), 6.00%, 3/5/2020 | 707,827 |
| 270,000 | | Talisman Energy, Inc., Sr. Unsecd. Note, 3.75%, 2/1/2021 | 255,591 |
| 343,091 | 1,2 | Tengizchevroil LLP, (Series 144A), 6.124%, 11/15/2014 | 363,676 |
| | TOTAL | 8,509,331 |
| | Energy - Integrated – 1.6% | |
| 990,000 | | BP Capital Markets America, Inc., Company Guarantee, 4.20%, 6/15/2018 | 999,216 |
| 680,000 | | BP Capital Markets PLC, Company Guarantee, 3.125%, 10/1/2015 | 692,302 |
| 1,910,000 | | BP Capital Markets PLC, Company Guarantee, 4.742%, 3/11/2021 | 1,959,915 |
| 740,000 | 1,2 | CNPC Hong Kong Overseas Capital Ltd., Company Guarantee, (Series 144A), 5.95%, 4/28/2041 | 737,876 |
| 1,200,000 | | Petrobras International Finance Co., Company Guarantee, 6.75%, 1/27/2041 | 1,257,117 |
| 145,672 | 1,2 | Qatar Petroleum, 5.579%, 5/30/2011 | 146,068 |
| | TOTAL | 5,792,494 |
| | Energy - Oil Field Services – 0.8% | |
| 350,000 | | Nabors Industries, Inc., Company Guarantee, 5.00%, 9/15/2020 | 356,836 |
| 600,000 | | Nabors Industries, Inc., Company Guarantee, 9.25%, 1/15/2019 | 768,974 |
| 490,000 | | Noble Holding International Ltd., Company Guarantee, 4.90%, 8/1/2020 | 506,935 |
| 700,000 | | Weatherford International Ltd., 6.00%, 3/15/2018 | 773,402 |
| 500,000 | | Weatherford International Ltd., 9.875%, 3/1/2039 | 686,382 |
| | TOTAL | 3,092,529 |
| | Energy - Refining – 0.7% | |
| 410,000 | 1,2 | Marathon Petroleum Corp., Sr. Unsecd. Note, (Series 144A), 6.50%, 3/1/2041 | 431,069 |
| 1,400,000 | | Valero Energy Corp., 9.375%, 3/15/2019 | 1,820,061 |
| 500,000 | | Valero Energy Corp., Note, 4.75%, 4/1/2014 | 532,741 |
| | TOTAL | 2,783,871 |
Annual Shareholder Report15
Principal
Amount
or Shares | | | Value |
| | Financial Institution - Banking – 23.3% | |
| $720,000 | | Associated Banc-Corp., Sr. Unsecd. Note, 5.125%, 3/28/2016 | 734,761 |
| 1,200,000 | | Astoria Financial Corp., Note, 5.75%, 10/15/2012 | 1,229,291 |
| 8,000,000 | | Bank of America Corp., Sr. Note, 5.375%, 6/15/2014 | 8,687,261 |
| 1,900,000 | | Bank of America Corp., Sr. Unsecd. Note, 5.75%, 12/1/2017 | 2,059,103 |
| 3,550,000 | | Bank of America Corp., Sr. Unsecd. Note, 6.50%, 8/1/2016 | 4,007,763 |
| 1,000,000 | | Bank of America Corp., Sub. Note, 4.75%, 8/15/2013 | 1,060,453 |
| 1,700,000 | 1,2 | Barclays Bank PLC, 5.926%, 9/29/2049 | 1,625,980 |
| 1,180,000 | 3 | Bear Stearns Cos., Inc., Sr. Unsecd. Note, 5.70%, 11/15/2014 | 1,307,016 |
| 250,000 | | Capital One Bank, Sub., 8.80%, 7/15/2019 | 319,854 |
| 1,180,000 | | Capital One Capital IV, 6.745%, 2/17/2037 | 1,209,500 |
| 680,000 | | Capital One Capital V, 10.25%, 8/15/2039 | 738,650 |
| 3,500,000 | | Capital One Capital VI, 8.875%, 5/15/2040 | 3,723,125 |
| 1,450,000 | | Capital One Financial Corp., Sr. Note, 7.375%, 5/23/2014 | 1,686,639 |
| 1,000,000 | | Citigroup, Inc., Note, 4.75%, 5/19/2015 | 1,064,415 |
| 3,000,000 | | Citigroup, Inc., Sr. Note, 5.375%, 8/9/2020 | 3,143,794 |
| 400,000 | | Citigroup, Inc., Sr. Unsecd. Note, 4.587%, 12/15/2015 | 422,749 |
| 3,080,000 | | Citigroup, Inc., Sr. Unsecd. Note, 6.00%, 12/13/2013 | 3,373,322 |
| 1,740,000 | | Citigroup, Inc., Sr. Unsecd. Note, 6.875%, 3/5/2038 | 1,968,811 |
| 675,000 | | City National Corp., Note, 5.25%, 9/15/2020 | 683,045 |
| 1,750,000 | | Deutsche Bank AG London, Sr. Unsecd. Note, 3.25%, 1/11/2016 | 1,789,111 |
| 830,000 | | Fifth Third Bancorp, Sr. Unsecd. Note, 3.625%, 1/25/2016 | 843,905 |
| 2,510,000 | | Goldman Sachs Group, Inc., Bond, 5.15%, 1/15/2014 | 2,715,008 |
| 1,250,000 | | Goldman Sachs Group, Inc., Sr. Unsecd. Note, 3.625%, 2/7/2016 | 1,263,918 |
| 1,000,000 | | Goldman Sachs Group, Inc., Sr. Unsecd. Note, 5.45%, 11/1/2012 | 1,062,391 |
| 1,600,000 | | Goldman Sachs Group, Inc., Sr. Unsecd. Note, 6.25%, 2/1/2041 | 1,647,944 |
| 4,000,000 | | HSBC Bank USA, Sr. Sub. Note, 4.625%, 4/1/2014 | 4,296,917 |
| 2,000,000 | | HSBC Holdings PLC, Sub. Note, 5.25%, 12/12/2012 | 2,114,474 |
| 1,200,000 | | Hudson United Bancorp, 7.00%, 5/15/2012 | 1,275,680 |
| 360,000 | | Huntington Bancshares, Inc., Sub. Note, 7.00%, 12/15/2020 | 404,113 |
| 1,510,000 | | J.P. Morgan Chase & Co., Sr. Note, 6.00%, 1/15/2018 | 1,683,649 |
| 1,500,000 | | J.P. Morgan Chase & Co., Sr. Unsecd. Note, 6.30%, 4/23/2019 | 1,691,620 |
| 1,165,000 | | Manufacturers & Traders Trust Co., Sub. Note, 5.629%, 12/1/2021 | 1,159,835 |
| 1,000,000 | | Merrill Lynch & Co., Inc., Unsecd. Note, 5.45%, 7/15/2014 | 1,084,588 |
| 1,440,000 | | Morgan Stanley, Sr. Unsecd. Note, 3.45%, 11/2/2015 | 1,440,816 |
| 3,360,000 | | Morgan Stanley, Sr. Unsecd. Note, 3.80%, 4/29/2016 | 3,379,683 |
| 1,680,000 | | Morgan Stanley, Sr. Unsecd. Note, 4.20%, 11/20/2014 | 1,750,519 |
| 600,000 | | Morgan Stanley, Sr. Unsecd. Note, 5.50%, 7/24/2020 | 617,989 |
Annual Shareholder Report16
Principal
Amount
or Shares | | | Value |
| $1,500,000 | | Morgan Stanley, Sr. Unsecd. Note, 5.625%, 9/23/2019 | 1,561,090 |
| 1,000,000 | | Morgan Stanley, Sr. Unsecd. Note, 5.75%, 1/25/2021 | 1,041,506 |
| 1,400,000 | | Morgan Stanley, Sr. Unsecd. Note, 5.95%, 12/28/2017 | 1,524,248 |
| 610,000 | | Morgan Stanley, Sr. Unsecd. Note, 6.00%, 4/28/2015 | 671,399 |
| 2,810,000 | | Morgan Stanley, Sr. Unsecd. Note, 6.625%, 4/1/2018 | 3,132,273 |
| 1,000,000 | | PNC Funding Corp., Sr. Unsecd. Note, 4.25%, 9/21/2015 | 1,062,862 |
| 960,000 | | PNC Funding Corp., Sr. Unsecd. Note, 5.125%, 2/8/2020 | 1,028,330 |
| 160,000 | | PNC Funding Corp., Sub. Note, 5.625%, 2/1/2017 | 175,817 |
| 2,973,265 | 1,2 | Regional Diversified Funding, 9.25%, 3/15/2030 | 2,238,868 |
| 1,900,000 | 1,2 | Santander US Debt SA Unipersonal, Bank Guarantee, (Series 144A), 3.781%, 10/7/2015 | 1,892,222 |
| 770,000 | | SunTrust Banks, Inc., Sr. Unsecd. Note, 3.60%, 4/15/2016 | 781,465 |
| 795,000 | | Suntrust Capital VIII, Jr. Sub. Note, 6.10%, 12/15/2036 | 781,588 |
| 1,220,000 | | Wilmington Trust Corp., Sub. Note, 8.50%, 4/2/2018 | 1,431,748 |
| 243,988 | 1,2 | World Financial, Pass Thru Cert., (Series 96 WFP), 6.91%, 9/1/2013 | 258,227 |
| | TOTAL | 86,849,335 |
| | Financial Institution - Brokerage – 5.9% | |
| 1,210,000 | | BlackRock, Inc., 6.25%, 9/15/2017 | 1,417,362 |
| 1,490,000 | 1,2 | Cantor Fitzgerald LP, Bond, (Series 144A), 7.875%, 10/15/2019 | 1,617,282 |
| 1,000,000 | | Charles Schwab Corp., Sr. Unsecd. Note, 4.95%, 6/1/2014 | 1,098,530 |
| 550,000 | | Eaton Vance Corp., 6.50%, 10/2/2017 | 633,905 |
| 3,000,000 | 1,2 | FMR LLC, 4.75%, 3/1/2013 | 3,147,419 |
| 900,000 | 1,2 | FMR LLC, Bond, 7.57%, 6/15/2029 | 1,020,879 |
| 760,000 | 1,2 | FMR LLC, Note, (Series 144A), 7.49%, 6/15/2019 | 885,172 |
| 2,000,000 | 1,2 | FMR LLC, Sr. Unsecd. Note, (Series 144A), 5.35%, 11/15/2021 | 2,049,756 |
| 885,000 | | Janus Capital Group, Inc., Sr. Note, 6.95%, 6/15/2017 | 970,425 |
| 490,000 | | Jefferies Group, Inc., Sr. Unsecd. Note, 6.875%, 4/15/2021 | 534,370 |
| 2,140,000 | | Jefferies Group, Inc., Sr. Unsecd. Note, 8.50%, 7/15/2019 | 2,570,457 |
| 1,370,000 | | NASDAQ OMX Group, Inc., Sr. Unsecd. Note, 5.55%, 1/15/2020 | 1,352,104 |
| 390,000 | | Nuveen Investments, 5.50%, 9/15/2015 | 348,075 |
| 1,790,000 | | Raymond James Financial, Inc., 8.60%, 8/15/2019 | 2,191,438 |
| 70,000 | | Raymond James Financial, Inc., Sr. Unsecd. Note, 4.25%, 4/15/2016 | 71,755 |
| 1,830,000 | | TD Ameritrade Holding Corp., Company Guarantee, 4.15%, 12/1/2014 | 1,951,664 |
| | TOTAL | 21,860,593 |
| | Financial Institution - Finance Noncaptive – 5.7% | |
| 1,250,000 | | American Express Co., Note, 2.75%, 9/15/2015 | 1,248,157 |
| 800,000 | | American Express Co., Sr. Unsecd. Note, 8.125%, 5/20/2019 | 1,018,834 |
Annual Shareholder Report17
Principal
Amount
or Shares | | | Value |
| $2,000,000 | | American Express Credit Corp., 5.875%, 5/2/2013 | 2,168,554 |
| 1,840,000 | | Discover Bank, Sub., 8.70%, 11/18/2019 | 2,267,603 |
| 3,000,000 | | General Electric Capital Corp., 4.80%, 5/1/2013 | 3,203,573 |
| 1,800,000 | | General Electric Capital Corp., 5.30%, 2/11/2021 | 1,870,730 |
| 1,700,000 | | General Electric Capital Corp., Sr. Unsecd. Note, 4.625%, 1/7/2021 | 1,711,131 |
| 2,100,000 | | HSBC Finance Capital Trust IX, Note, 5.911%, 11/30/2035 | 2,065,875 |
| 1,220,000 | 1,2 | HSBC Finance Corp., Sr. Sub., (Series 144A), 6.676%, 1/15/2021 | 1,299,209 |
| 500,000 | 1,2 | ILFC E-Capital Trust I, Floating Rate Note — Sr. Sub Note, 5.97%, 12/21/2065 | 419,845 |
| 500,000 | 1,2 | Lukoil International Finance BV, 6.356%, 6/7/2017 | 539,400 |
| 3,300,000 | 1,2 | Macquarie Group Ltd., Sr. Unsecd. Note, (Series 144A), 6.00%, 1/14/2020 | 3,368,495 |
| | TOTAL | 21,181,406 |
| | Financial Institution - Insurance - Health – 0.3% | |
| 1,000,000 | | Wellpoint, Inc., Sr. Unsecd. Note, 7.00%, 2/15/2019 | 1,194,812 |
| | Financial Institution - Insurance - Life – 6.3% | |
| 1,360,000 | 1,2 | AXA Equitable Life Insurance Co., Sub., 7.70%, 12/1/2015 | 1,559,860 |
| 1,000,000 | | Aflac, Inc., Sr. Unsecd. Note, 6.90%, 12/17/2039 | 1,083,048 |
| 780,000 | | Aflac, Inc., Sr. Unsecd. Note, 8.50%, 5/15/2019 | 957,225 |
| 2,000,000 | | American International Group, Inc., Sr. Unsecd. Note, 6.40%, 12/15/2020 | 2,188,995 |
| 600,000 | | Lincoln National Corp., Sr. Note, 7.00%, 6/15/2040 | 702,945 |
| 1,790,000 | 1,2 | Massachusetts Mutual Life Insurance Co., Sub. Note, 8.875%, 6/1/2039 | 2,506,947 |
| 1,640,000 | | MetLife, Inc., 6.75%, 6/1/2016 | 1,923,667 |
| 280,000 | | MetLife, Inc., Jr. Sub. Note, 10.75%, 8/1/2069 | 397,600 |
| 600,000 | 1,2 | Penn Mutual Life Insurance Co., Sr. Note, (Series 144A), 7.625%, 6/15/2040 | 648,761 |
| 1,140,000 | | Prudential Financial, Inc., 5.15%, 1/15/2013 | 1,206,105 |
| 400,000 | | Prudential Financial, Inc., 6.625%, 12/1/2037 | 451,906 |
| 380,000 | | Prudential Financial, Inc., Sr. Note, 7.375%, 6/15/2019 | 452,235 |
| 3,000,000 | | Prudential Financial, Inc., Sr. Unsecd. Note, 4.75%, 9/17/2015 | 3,237,938 |
| 2,700,000 | | Prudential Financial, Inc., Sr. Unsecd. Note, 5.80%, 6/15/2012 | 2,840,606 |
| 2,000,000 | | Prudential Financial, Inc., Sr. Unsecd. Note, (Series MTN), 2.75%, 1/14/2013 | 2,042,309 |
| 1,150,000 | 1 | Union Central Life Insurance Co., Note, 8.20%, 11/1/2026 | 1,211,845 |
| | TOTAL | 23,411,992 |
Annual Shareholder Report18
Principal
Amount
or Shares | | | Value |
| | Financial Institution - Insurance - P&C – 2.8% | |
| $630,000 | | ACE INA Holdings, Inc., 5.60%, 5/15/2015 | 699,701 |
| 940,000 | | ACE INA Holdings, Inc., Sr. Note, 5.70%, 2/15/2017 | 1,052,649 |
| 690,000 | | CNA Financial Corp., 6.50%, 8/15/2016 | 773,872 |
| 770,000 | | CNA Financial Corp., Sr. Unsecd. Note, 5.75%, 8/15/2021 | 809,550 |
| 130,000 | | CNA Financial Corp., Sr. Unsecd. Note, 5.875%, 8/15/2020 | 137,799 |
| 590,000 | | CNA Financial Corp., Sr. Unsecd. Note, 7.35%, 11/15/2019 | 684,684 |
| 630,000 | | Horace Mann Educators Corp., Sr. Note, 6.85%, 4/15/2016 | 664,729 |
| 1,400,000 | 1,2 | Liberty Mutual Group, Inc., Unsecd. Note, 5.75%, 3/15/2014 | 1,486,191 |
| 1,700,000 | 1,2 | Nationwide Mutual Insurance Co., Sub. Note, (Series 144A), 9.375%, 8/15/2039 | 2,150,539 |
| 200,000 | | The Travelers Cos., Inc., Sr. Unsecd. Note, 5.50%, 12/1/2015 | 224,487 |
| 1,500,000 | 1,2 | ZFS Finance USA Trust II, Jr. Sub. Note, 6.45%, 12/15/2065 | 1,575,000 |
| | TOTAL | 10,259,201 |
| | Financial Institution - REITs – 3.6% | |
| 300,000 | | AMB Property LP, 6.30%, 6/1/2013 | 327,631 |
| 640,000 | | AMB Property LP, Company Guarantee, 6.125%, 12/1/2016 | 708,572 |
| 2,000,000 | | Boston Properties LP, Sr. Unsecd. Note, 5.875%, 10/15/2019 | 2,206,802 |
| 430,000 | | Equity One, Inc., Bond, 6.00%, 9/15/2017 | 447,041 |
| 1,000,000 | | Equity One, Inc., Sr. Unsecd. Note, 6.25%, 12/15/2014 | 1,085,880 |
| 1,570,000 | | Health Care REIT, Inc., Sr. Unsecd. Note, 6.125%, 4/15/2020 | 1,691,000 |
| 425,000 | | Liberty Property LP, 6.625%, 10/1/2017 | 488,218 |
| 1,220,000 | | Prologis, Conv. Bond, 2.25%, 4/1/2037 | 1,214,730 |
| 660,000 | | Prologis, Sr. Note, 5.50%, 4/1/2012 | 673,753 |
| 1,120,000 | | Prologis, Sr. Note, 6.875%, 3/15/2020 | 1,258,520 |
| 1,310,000 | | Prologis, Sr. Note, 7.625%, 8/15/2014 | 1,503,814 |
| 670,000 | | Regency Centers LP, Company Guarantee, 4.80%, 4/15/2021 | 673,119 |
| 1,180,000 | | Tanger Properties LP, Sr. Unsecd. Note, 6.125%, 6/1/2020 | 1,311,292 |
| | TOTAL | 13,590,372 |
| | Municipal Services – 0.4% | |
| 560,000 | 1,2 | Army Hawaii Family Housing, 5.524%, 6/15/2050 | 496,418 |
| 970,000 | 1,2 | Camp Pendleton & Quantico Housing LLC, 5.572%, 10/1/2050 | 887,453 |
| | TOTAL | 1,383,871 |
| | Sovereign – 0.4% | |
| 1,630,000 | | Corp Andina De Fomento, Sr. Unsecd. Note, 3.75%, 1/15/2016 | 1,619,236 |
| | Technology – 2.0% | |
| 350,000 | | BMC Software, Inc., 7.25%, 6/1/2018 | 401,827 |
| 780,000 | | Cisco Systems, Inc., Sr. Unsecd. Note, 3.15%, 3/14/2017 | 792,239 |
Annual Shareholder Report19
Principal
Amount
or Shares | | | Value |
| $1,650,000 | | Fiserv, Inc., Sr. Note, 6.80%, 11/20/2017 | 1,881,003 |
| 1,600,000 | | Harris Corp., 5.95%, 12/1/2017 | 1,808,704 |
| 520,000 | | Intuit, Inc., Sr. Note, 5.40%, 3/15/2012 | 539,874 |
| 250,000 | | Juniper Networks, Inc., Sr. Unsecd. Note, 5.95%, 3/15/2041 | 255,197 |
| 580,000 | | KLA-Tencor Corp., 6.90%, 5/1/2018 | 657,177 |
| 755,000 | | Maxim Integrated Products, Inc., Note, 3.45%, 6/14/2013 | 785,501 |
| 455,000 | 1,2 | SAIC, Inc., Company Guarantee, (Series 144A), 5.95%, 12/1/2040 | 478,326 |
| | TOTAL | 7,599,848 |
| | Transportation - Airlines – 0.6% | |
| 500,000 | | Southwest Airlines Co., 6.50%, 3/1/2012 | 522,581 |
| 425,000 | | Southwest Airlines Co., Deb., 7.375%, 3/1/2027 | 446,037 |
| 1,100,000 | | Southwest Airlines Co., Sr. Unsecd. Note, 5.125%, 3/1/2017 | 1,154,574 |
| | TOTAL | 2,123,192 |
| | Transportation - Railroads – 0.2% | |
| 572,955 | | Burlington Northern Santa Fe Corp., Pass Thru Cert., 7.57%, 1/2/2021 | 679,261 |
| | Transportation - Services – 0.7% | |
| 835,000 | 1,2 | Enterprise Rent-A-Car USA Finance Co., 6.375%, 10/15/2017 | 957,108 |
| 945,000 | 1,2 | Enterprise Rent-A-Car USA Finance Co., Sr. Note, (Series 144A), 5.25%, 10/1/2020 | 988,524 |
| 515,000 | | Ryder System, Inc., Sr. Unsecd. Note, 3.15%, 3/2/2015 | 525,526 |
| | TOTAL | 2,471,158 |
| | Utility - Electric – 6.2% | |
| 450,000 | | Cleveland Electric Illuminating Co., Sr. Unsecd. Note, 5.95%, 12/15/2036 | 439,508 |
| 1,090,000 | | Commonwealth Edison Co., 1st Mtg. Bond, 5.80%, 3/15/2018 | 1,222,386 |
| 3,000,000 | | Dominion Resources, Inc., Sr. Unsecd. Note, 8.875%, 1/15/2019 | 3,871,597 |
| 770,000 | 1,2 | Electricite De France SA, 5.50%, 1/26/2014 | 847,361 |
| 1,050,000 | 1,2 | Enel Finance International SA, Company Guarantee, (Series 144A), 3.875%, 10/7/2014 | 1,096,496 |
| 1,500,000 | | Enersis S.A., Note, 7.40%, 12/1/2016 | 1,745,697 |
| 510,000 | | Exelon Generation Co. LLC, Sr. Unsecd. Note, 5.75%, 10/1/2041 | 485,486 |
| 390,000 | | FPL Group Capital, Inc., 7.875%, 12/15/2015 | 467,353 |
| 280,000 | | FirstEnergy Solutions Corp., Company Guarantee, 4.80%, 2/15/2015 | 297,308 |
| 2,050,000 | | FirstEnergy Solutions Corp., Company Guarantee, 6.05%, 8/15/2021 | 2,188,398 |
| 850,367 | 1,2 | Great River Energy, 1st Mtg. Note, 5.829%, 7/1/2017 | 937,218 |
| 640,000 | | KCP&L Greater Missouri Operations Co., Sr. Unsecd. Note, 11.875%, 7/1/2012 | 714,209 |
Annual Shareholder Report20
Principal
Amount
or Shares | | | Value |
| $665,000 | 1,2 | Korea Hydro & Nuclear Power Co. Ltd., Sr. Unsecd. Note, 6.25%, 6/17/2014 | 733,887 |
| 1,630,000 | | MidAmerican Energy Holdings Co., Sr. Unsecd. Note, 5.95%, 5/15/2037 | 1,709,648 |
| 1,830,000 | | National Rural Utilities Cooperative Finance Corp., Sr. Unsecd. Note, 10.375%, 11/1/2018 | 2,520,613 |
| 535,000 | | PPL Energy Supply LLC, Sr. Unsecd. Note, 6.00%, 12/15/2036 | 534,391 |
| 800,000 | 1,2 | PPL WEM Holdings PLC, Sr. Unsecd. Note, 5.375%, 5/1/2021 | 825,715 |
| 380,000 | | TECO Finance, Inc., Company Guarantee, 5.15%, 3/15/2020 | 401,769 |
| 1,140,000 | | UIL Holdings Corp., Sr. Unsecd. Note, 4.625%, 10/1/2020 | 1,102,777 |
| 740,000 | | Union Electric Co., 6.00%, 4/1/2018 | 821,298 |
| 130,000 | | Virginia Electric & Power Co., Sr. Unsecd. Note, 5.10%, 11/30/2012 | 138,569 |
| | TOTAL | 23,101,684 |
| | Utility - Natural Gas Distributor – 1.0% | |
| 510,000 | | Atmos Energy Corp., 5.125%, 1/15/2013 | 537,053 |
| 250,000 | | Atmos Energy Corp., 8.50%, 3/15/2019 | 315,498 |
| 410,000 | 1,2 | Florida Gas Transmission Co. LLC, Sr. Unsecd. Note, (Series 144A), 5.45%, 7/15/2020 | 437,780 |
| 2,000,000 | | Sempra Energy, Sr. Unsecd. Note, 6.50%, 6/1/2016 | 2,304,180 |
| | TOTAL | 3,594,511 |
| | Utility - Natural Gas Pipelines – 3.4% | |
| 740,000 | | Consolidated Natural Gas Co., 5.00%, 12/1/2014 | 818,580 |
| 965,000 | | Duke Capital Corp., Sr. Note, 6.25%, 2/15/2013 | 1,039,647 |
| 800,000 | | Enbridge Energy Partners LP, Sr. Unsecd. Note, 5.50%, 9/15/2040 | 773,895 |
| 890,000 | | Enbridge, Inc., Sr. Note, 5.60%, 4/1/2017 | 1,004,603 |
| 250,000 | | Enterprise Products Operating LLC, 4.60%, 8/1/2012 | 260,337 |
| 2,050,000 | | Enterprise Products Operating LLC, Company Guarantee, (Series O), 9.75%, 1/31/2014 | 2,467,376 |
| 1,860,000 | | Kinder Morgan Energy Partners LP, Note, 6.55%, 9/15/2040 | 2,007,731 |
| 1,400,000 | | Kinder Morgan Energy Partners LP, Sr. Unsecd. Note, 5.80%, 3/15/2035 | 1,379,107 |
| 730,000 | | Kinder Morgan Energy Partners LP, Sr. Unsecd. Note, 6.85%, 2/15/2020 | 848,732 |
| 2,060,000 | | Williams Partners LP, 5.25%, 3/15/2020 | 2,196,139 |
| | TOTAL | 12,796,147 |
| | TOTAL CORPORATE BONDS
(IDENTIFIED COST $330,795,748) | 354,941,948 |
Annual Shareholder Report21
Principal
Amount
or Shares | | | Value |
| | Governments/Agencies – 1.0% | |
| | Sovereign – 1.0% | |
| 1,340,000 | 1,2 | State of Qatar, 5.25%, 1/20/2020 | 1,417,887 |
| 1,000,000 | | Sweden, Government of, 10.25%, 11/1/2015 | 1,043,846 |
| 1,000,000 | | United Mexican States, Note, 5.625%, 1/15/2017 | 1,122,889 |
| | TOTAL GOVERNMENTS/AGENCIES
(IDENTIFIED COST $3,296,301) | 3,584,622 |
| | MUTUAL FUND – 0.2% | |
| 761,891 | 4,5 | Federated Prime Value Obligations Fund, Institutional Shares, 0.18%
(AT NET ASSET VALUE) | 761,891 |
| | TOTAL INVESTMENTS — 96.5%
(IDENTIFIED COST $334,867,053)6 | 359,299,432 |
| | OTHER ASSETS AND LIABILITIES – NET — 3.5%7 | 13,200,105 |
| | TOTAL NET ASSETS — 100% | $372,499,537 |
At April 30, 2011, the Fund had the following outstanding futures contracts:
| Description | Number of
Contracts | Notional
Value | Expiration
Date | Unrealized
Depreciation |
| 8 U.S. Treasury Note 5-Year Short Futures | 140 | $16,585,625 | June 2011 | $(235,460) |
| 8 U.S. Treasury Note 10-Year Short Futures | 320 | $38,765,000 | June 2011 | $(765,694) |
| 8 U. S. Treasury Bond 30-Year Short Futures | 200 | $24,475,000 | June 2011 | $(363,403) |
| UNREALIZED DEPRECIATION ON FUTURES CONTRACTS | $(1,364,557) |
Unrealized Depreciation on Futures Contracts is included in “Other Assets and Liabilities — Net.”
| 1 | Denotes a restricted security that either: (a) cannot be offered for public sale without first being registered, or being able to take advantage of an exemption from registration, under the Securities Act of 1933; or (b) is subject to a contractual restriction on public sales. At April 30, 2011, these restricted securities amounted to $75,224,357, which represented 20.2% of total net assets. |
| 2 | Denotes a restricted security that may be resold without restriction to “qualified institutional buyers” as defined in Rule 144A under the Securities Act of 1933 and that the Fund has determined to be liquid under criteria established by the Fund's Board of Trustees (the “Trustees”). At April 30, 2011, these liquid restricted securities amounted to $72,344,431, which represented 19.4% of total net assets. |
| 3 | JPMorgan Chase & Co. has fully and unconditionally guaranteed Bear Stearns' outstanding registered debt securities. |
| 4 | Affiliated holding. |
| 5 | 7-Day net yield. |
| 6 | Also represents cost for federal tax purposes. |
| 7 | Assets, other than investments in securities, less liabilities. See Statement of Assets and Liabilities. |
| 8 | Non-income producing security. |
Note: The categories of investments are shown as a percentage of total net assets at April 30, 2011.
Annual Shareholder Report22
Various inputs are used in determining the value of the Fund's investments. These inputs are summarized in the three broad levels listed below:
Level 1 — quoted prices in active markets for identical securities, including investment companies with daily net asset values, if applicable.
Level 2 — other significant observable inputs (including quoted prices for similar securities, interest rates, prepayment speeds, credit risk, etc.). Also includes securities valued at amortized cost.
Level 3 — significant unobservable inputs (including the Fund's own assumptions in determining the fair value of investments).
The inputs or methodology used for valuing securities are not an indication of the risk associated with investing in those securities.
The following is a summary of the inputs used, as of April 30, 2011, in valuing the Fund's assets carried at fair value:
| Valuation Inputs | | | | |
| Level 1 —
Quoted
Prices and
Investments in
Mutual Funds | Level 2 —
Other
Significant
Observable
Inputs | Level 3 —
Significant
Unobservable
Inputs | Total |
| Debt Securities: | | | | |
| Asset-Backed Security | $ — | $10,971 | $ — | $10,971 |
| Corporate Bonds | — | 354,941,948 | — | 354,941,948 |
| Governments/Agencies | — | 3,584,622 | — | 3,584,622 |
| Mutual Fund | 761,891 | — | — | 761,891 |
| TOTAL SECURITIES | $761,891 | $358,537,541 | $ — | $359,299,432 |
| OTHER FINANCIAL INSTRUMENTS* | $(1,364,557) | $ — | $ — | $(1,364,557) |
| * | Other financial instruments include futures contracts. |
The following acronyms are used throughout this portfolio:
| MTN | — Medium Term Note |
| REIT(s) | — Real Estate Investment Trust(s) |
See Notes which are an integral part of the Financial Statements
Annual Shareholder Report23
Statement of Assets and Liabilities
April 30, 2011
| Assets: | | |
| Total investments in securities, at value including $761,891 of investments in an affiliated holding (Note 5) (identified cost $334,867,053) | | $359,299,432 |
| Restricted cash (Note 2) | | 1,504,000 |
| Income receivable | | 5,301,171 |
| Receivable for investments sold | | 8,582,775 |
| Receivable for shares sold | | 423,467 |
| TOTAL ASSETS | | 375,110,845 |
| Liabilities: | | |
| Payable for investments purchased | $1,266,650 | |
| Payable for shares redeemed | 643,031 | |
| Bank overdraft | 13,500 | |
| Payable for daily variation margin | 126,406 | |
| Income distribution payable | 398,844 | |
| Payable for transfer and dividend disbursing agent fees and expenses | 80,070 | |
| Payable for shareholder services fee (Note 5) | 25,102 | |
| Accrued expenses | 57,705 | |
| TOTAL LIABILITIES | | 2,611,308 |
| Net assets for 36,430,971 shares outstanding | | $372,499,537 |
| Net Assets Consist of: | | |
| Paid-in capital | | $343,617,487 |
| Net unrealized appreciation of investments and futures contracts | | 23,067,822 |
| Accumulated net realized gain on investments and futures contracts | | 5,785,098 |
| Undistributed net investment income | | 29,130 |
| TOTAL NET ASSETS | | $372,499,537 |
| Net Asset Value, Offering Price and Redemption Proceeds Per Share | | |
| Institutional Shares: | | |
| $302,134,866 ÷ 29,549,061 shares outstanding, no par value, unlimited shares authorized | | $10.22 |
| Institutional Service Shares: | | |
| $70,364,671 ÷ 6,881,910 shares outstanding, no par value, unlimited shares authorized | | $10.22 |
See Notes which are an integral part of the Financial Statements
Annual Shareholder Report24
Statement of Operations
Year Ended April 30, 2011
| Investment Income: | | | |
| Interest | | | $22,371,409 |
| Dividends received from an affiliated holding (Note 5) | | | 6,558 |
| TOTAL INCOME | | | 22,377,967 |
| Expenses: | | | |
| Investment adviser fee (Note 5) | | $2,076,699 | |
| Administrative fee (Note 5) | | 324,781 | |
| Custodian fees | | 20,265 | |
| Transfer and dividend disbursing agent fees and expenses | | 425,224 | |
| Directors'/Trustees' fees | | 5,392 | |
| Auditing fees | | 23,524 | |
| Legal fees | | 6,317 | |
| Portfolio accounting fees | | 142,880 | |
| Distribution services fee — Institutional Service Shares (Note 5) | | 245,149 | |
| Shareholder services fee — Institutional Shares (Note 5) | | 128,892 | |
| Shareholder services fee — Institutional Service Shares (Note 5) | | 240,696 | |
| Account administration fee — Institutional Shares | | 3,612 | |
| Account administration fee — Institutional Service Shares | | 3,407 | |
| Share registration costs | | 51,093 | |
| Printing and postage | | 37,016 | |
| Insurance premiums | | 5,015 | |
| Miscellaneous | | 5,982 | |
| TOTAL EXPENSES | | 3,745,944 | |
Annual Shareholder Report25
Statement of Operations — continued| Waivers and Reimbursements (Note 5): | | | |
| Waiver/reimbursement of investment adviser fee | $(769,227) | | |
| Waiver of administrative fee | (8,707) | | |
| Waiver of distribution services fee — Institutional Service Shares | (245,149) | | |
Reimbursement of shareholder services fee —
Institutional Shares | (128,892) | | |
| Reimbursement of account administration fee — Institutional Shares | (3,612) | | |
| TOTAL WAIVERS AND REIMBURSEMENTS | | $(1,155,587) | |
| Net expenses | | | $2,590,357 |
| Net investment income | | | 19,787,610 |
| Realized and Unrealized Gain (Loss) on Investments and Futures Contracts: | | | |
| Net realized gain on investments | | | 13,058,632 |
| Net realized loss on futures contracts | | | (5,755,823) |
| Net change in unrealized appreciation of investments | | | (1,459,466) |
| Net change in unrealized depreciation of futures contracts | | | (102,034) |
| Net realized and unrealized gain on investments and futures contracts | | | 5,741,309 |
| Change in net assets resulting from operations | | | $25,528,919 |
See Notes which are an integral part of the Financial Statements
Annual Shareholder Report26
Statement of Changes in Net Assets
| Year Ended April 30 | 2011 | 2010 |
| Increase (Decrease) in Net Assets | | |
| Operations: | | |
| Net investment income | $19,787,610 | $20,906,404 |
| Net realized gain on investments and futures contracts | 7,302,809 | 4,222,198 |
| Net change in unrealized appreciation/depreciation of investments and futures contracts | (1,561,500) | 42,695,681 |
| CHANGE IN NET ASSETS RESULTING FROM OPERATIONS | 25,528,919 | 67,824,283 |
| Distributions to Shareholders: | | |
| Distributions from net investment income | | |
| Institutional Shares | (15,303,601) | (12,906,657) |
| Institutional Service Shares | (4,457,946) | (8,030,913) |
| CHANGE IN NET ASSETS RESULTING FROM DISTRIBUTIONS TO SHAREHOLDERS | (19,761,547) | (20,937,570) |
| Share Transactions: | | |
| Proceeds from sale of shares | 144,116,882 | 344,736,442 |
| Net asset value of shares issued to shareholders in payment of distributions declared | 14,937,358 | 16,663,288 |
| Cost of shares redeemed | (296,680,666) | (218,356,056) |
| CHANGE IN NET ASSETS RESULTING FROM SHARE TRANSACTIONS | (137,626,426) | 143,043,674 |
| Change in net assets | (131,859,054) | 189,930,387 |
| Net Assets: | | |
| Beginning of period | 504,358,591 | 314,428,204 |
| End of period (including undistributed net investment income of $29,130 and $3,067, respectively) | $372,499,537 | $504,358,591 |
See Notes which are an integral part of the Financial Statements
Annual Shareholder Report27
Notes to Financial Statements
April 30, 2011
1. ORGANIZATION
Federated Income Securities Trust (the “Trust”) is registered under the Investment Company Act of 1940, as amended (the “Act”), as an open-end management investment company. The Trust consists of nine portfolios. The financial statements included herein are only those of Federated Intermediate Corporate Bond Fund (the “Fund”), a diversified portfolio. The financial statements of the other Trust's portfolios are presented separately. The assets of each portfolio are segregated and a shareholder's interest is limited to the portfolio in which shares are held. Each portfolio pays its own expenses. The Fund offers two classes of shares: Institutional Shares and Institutional Service Shares. All shares of the Fund have equal rights with respect to voting, except on class-specific matters. The investment objective of the Fund is to provide current income.
2. SIGNIFICANT ACCOUNTING POLICIES
The following is a summary of significant accounting policies consistently followed by the Fund in the preparation of its financial statements. These policies are in conformity with U.S. generally accepted accounting principles (GAAP).
Investment Valuation
In calculating its net asset value (NAV), the Fund generally values investments as follows:
- Fixed-income securities acquired with remaining maturities greater than 60 days are fair valued using price evaluations provided by a pricing service approved by the Trustees.
- Fixed-income securities acquired with remaining maturities of 60 days or less are valued at their cost (adjusted for the accretion of any discount or amortization of any premium), which approximates market value.
- Shares of other mutual funds are valued based upon their reported NAVs.
- Derivative contracts listed on exchanges are valued at their reported settlement or closing price.
- Over-the-counter (OTC) derivative contracts are fair valued using price evaluations provided by a pricing service approved by the Trustees.
- For securities that are fair valued in accordance with procedures established by and under the general supervision of the Trustees, certain factors may be considered such as: the purchase price of the security, information obtained by contacting the issuer, analysis of the issuer's financial statements or other available documents, fundamental analytical data, the nature and duration of restrictions on disposition, the movement of the market in which the security is normally traded and public trading in similar securities of the issuer or comparable issuers.
If the Fund cannot obtain a price or price evaluation from a pricing service for an investment, the Fund may attempt to value the investment based upon the mean of bid and asked quotations or fair value the investment based on price evaluations, from one or more dealers. If any price, quotation, price evaluation or other pricing source is not readily available when the NAV is calculated, the Fund uses the fair value of the investment determined in accordance with the procedures described below. There can be no assurance that the Fund could purchase or sell an investment at the price used to calculate the Fund's NAV.
Annual Shareholder Report
28
Fair Valuation and Significant Events ProceduresThe Trustees have authorized the use of pricing services to provide evaluations of the current fair value of certain investments for purposes of calculating the NAV. Factors considered by pricing services in evaluating an investment include the yields or prices of investments of comparable quality, coupon, maturity, call rights and other potential prepayments, terms and type, reported transactions, indications as to values from dealers and general market conditions. Some pricing services provide a single price evaluation reflecting the bid-side of the market for an investment (a “bid” evaluation). Other pricing services offer both bid evaluations and price evaluations indicative of a price between the prices bid and asked for the investment (a “mid” evaluation). The Fund normally uses bid evaluations for U.S. Treasury and Agency securities, mortgage-backed securities and municipal securities. The Fund normally uses mid evaluations for other types of fixed-income securities and OTC derivative contracts. In the event that market quotations and price evaluations are not available for an investment, the fair value of the investment is determined in accordance with procedures adopted by the Trustees.
The Trustees also have adopted procedures requiring an investment to be priced at its fair value whenever the Adviser determines that a significant event affecting the value of the investment has occurred between the time as of which the price of the investment would otherwise be determined and the time as of which the NAV is computed. An event is considered significant if there is both an affirmative expectation that the investment's value will change in response to the event and a reasonable basis for quantifying the resulting change in value. Examples of significant events that may occur after the close of the principal market on which a security is traded, or after the time of a price evaluation provided by a pricing service or a dealer, include:
- With respect to securities traded in foreign markets, significant trends in U.S. equity markets or in the trading of foreign securities index futures or options contracts;
- With respect to price evaluations of fixed-income securities determined before the close of regular trading on the NYSE, actions by the Federal Reserve Open Market Committee and other significant trends in U.S. fixed-income markets;
- Political or other developments affecting the economy or markets in which an issuer conducts its operations or its securities are traded; and
- Announcements concerning matters such as acquisitions, recapitalizations, litigation developments, a natural disaster affecting the issuer's operations or regulatory changes or market developments affecting the issuer's industry.
The Trustees have approved the use of a pricing service to determine the fair value of equity securities traded principally in foreign markets when the Adviser determines that there has been a significant trend in the U.S. equity markets or in index futures trading. For other significant events, the Fund may seek to obtain more current quotations or price evaluations from alternative pricing sources. If a reliable alternative pricing source is not available, the Fund will determine the fair value of the investment using another method approved by the Trustees.
Repurchase Agreements
The Fund may invest in repurchase agreements for short-term liquidity purposes. It is the policy of the Fund to require the other party to a repurchase agreement to transfer to the Fund's custodian or sub-custodian eligible securities or cash with a market value (after transaction costs) at least equal to the repurchase price to be paid under the repurchase agreement. The eligible securities are transferred to accounts with the custodian or sub-custodian in which the Fund holds a “securities entitlement” and exercises “control” as those Annual Shareholder Report
29
terms are defined in the Uniform Commercial Code. The Fund has established procedures for monitoring the market value of the transferred securities and requiring the transfer of additional eligible securities if necessary to equal at least the repurchase price. These procedures also allow the other party to require securities to be transferred from the account to the extent that their market value exceeds the repurchase price or in exchange for other eligible securities of equivalent market value.The insolvency of the other party or other failure to repurchase the securities may delay the disposition of the underlying securities or cause the Fund to receive less than the full repurchase price. Under the terms of the repurchase agreement, any amounts received by the Fund in excess of the repurchase price and related transaction costs must be remitted to the other party.
The Fund may enter into repurchase agreements in which eligible securities are transferred into joint trading accounts maintained by the custodian or sub-custodian for investment companies and other clients advised by the Fund's Adviser and its affiliates. The Fund will participate on a pro rata basis with the other investment companies and clients in its share of the securities transferred under such repurchase agreements and in its share of proceeds from any repurchase or other disposition of such securities.
Investment Income, Gains and Losses, Expenses and Distributions
Investment transactions are accounted for on a trade-date basis. Realized gains and losses from investment transactions are recorded on an identified-cost basis. Interest income and expenses are accrued daily. Dividend income and distributions to shareholders are recorded on the ex-dividend date. Foreign dividends are recorded on the ex-dividend date or when the Fund is informed of the ex-dividend date. Distributions of net investment income are declared daily and paid monthly. Non-cash dividends included in dividend income, if any, are recorded at fair value. Investment income, realized and unrealized gains and losses and certain fund-level expenses are allocated to each class based on relative average daily net assets, except that each class may bear certain expenses unique to that class such as account administration, distribution services and shareholder services fees. Dividends are declared separately for each class. No class has preferential dividend rights; differences in per share dividend rates are generally due to differences in separate class expenses.
Premium and Discount Amortization/Paydown Gains and Losses
All premiums and discounts on fixed-income securities are amortized/accreted using the effective interest rate method. Gains and losses realized on principal payment of mortgage-backed securities (paydown gains and losses) are classified as part of investment income.
Federal Taxes
It is the Fund's policy to comply with the Subchapter M provision of the Internal Revenue Code and to distribute to shareholders each year substantially all of its income. Accordingly, no provision for federal income tax is necessary. As of and during the year ended April 30, 2011, the Fund did not have a liability for any uncertain tax positions. The Fund recognizes interest and penalties, if any, related to tax liabilities as income tax expense in the Statement of Operations. As of April 30, 2011, tax years 2008 through 2011 remain subject to examination by the Fund's major tax jurisdictions, which include the United States of America and the Commonwealth of Massachusetts.
Annual Shareholder Report
30
When-Issued and Delayed Delivery TransactionsThe Fund may engage in when-issued or delayed delivery transactions. The Fund records when-issued securities on the trade date and maintains security positions such that sufficient liquid assets will be available to make payment for the securities purchased. Securities purchased on a when-issued or delayed delivery basis are marked to market daily and begin earning interest on the settlement date. Losses may occur on these transactions due to changes in market conditions or the failure of counterparties to perform under the contract.
Futures Contracts
The Fund purchases and sells financial futures contracts to manage duration and cash flows, enhance yield and to potentially reduce transaction costs. Upon entering into a financial futures contract with a broker, the Fund is required to deposit in a segregated account a specified amount of cash or U.S. government securities which is shown as Restricted Cash in the Statement of Assets and Liabilities. Futures contracts are valued daily and unrealized gains or losses are recorded in a “variation margin” account. Daily, the Fund receives from or pays to the broker a specified amount of cash based upon changes in the variation margin account. When a contract is closed, the Fund recognizes a realized gain or loss. Futures contracts have market risks, including the risk that the change in the value of the contract may not correlate with the changes in the value of the underlying securities. There is minimal counterparty risk to the Fund since futures are exchange traded and the exchange's clearinghouse, as counterparty to all exchange traded futures, guarantees the futures against default.
Futures contracts outstanding at period end are listed after the Fund's Portfolio of Investments.
Additional Disclosure Related to Derivative Instruments
| Fair Value of Derivative Instruments | |
| Liability |
| Statement of
Assets and
Liabilities
Location | Fair
Value |
Derivatives not accounted for as hedging instruments
under ASC Topic 815 | | |
| Interest rate contracts | Payable for daily
variation margin | $1,364,557* |
| * | Includes cumulative appreciation/depreciation of futures contracts as reported in the footnotes to the Portfolio of Investments. Only the current day's variation margin is reported within the Statement of Assets and Liabilities. |
Annual Shareholder Report
31
The Effect of Derivative Instruments on the Statement of Operations for the Year Ended April 30, 2011| Amount of Realized Gain or (Loss) on Derivatives Recognized in Income |
| Futures |
| Interest rate contracts | $(5,755,823) |
| Change in Unrealized Appreciation or (Depreciation) on Derivatives Recognized in Income |
| Futures |
| Interest rate contracts | $(102,034) |
Restricted Securities
The Fund may purchase securities which are considered restricted. Restricted securities are securities that either: (a) cannot be offered for public sale without first being registered, or being able to take advantage of an exemption from registration, under the Securities Act of 1933; or (b) are subject to contractual restrictions on public sales. In some cases, when a security cannot be offered for public sale without first being registered, the issuer of the restricted security has agreed to register such securities for resale, at the issuer's expense, either upon demand by the Fund or in connection with another registered offering of the securities. Many such restricted securities may be resold in the secondary market in transactions exempt from registration. Restricted securities may be determined to be liquid under criteria established by the Trustees. The Fund will not incur any registration costs upon such resales. The Fund's restricted securities are valued at the price provided by dealers in the secondary market or, if no market prices are available, at the fair value as determined in accordance with procedures established by and under the general supervision of the Trustees.
Additional information on restricted securities, excluding securities purchased under Rule 144A, if applicable, that have been deemed liquid by the Trustees, held at April 30, 2011, is as follows:
| Security | Acquisition Date | Cost | Market Value |
Football Trust V, Pass Thru Cert.,
5.35%, 10/5/2020 | 3/24/2010 | $1,600,000 | $1,668,081 |
Union Central Life Insurance Co.,
Note, 8.20%, 11/1/2026 | 3/31/1999-9/29/1999 | $1,138,408 | $1,211,845 |
Other
The preparation of financial statements in conformity with GAAP requires management to make estimates and assumptions that affect the amounts of assets, liabilities, expenses and revenues reported in the financial statements. Actual results could differ from those estimated.
Annual Shareholder Report
32
3. SHARES OF BENEFICIAL INTERESTThe following tables summarize share activity:
| Year Ended April 30 | 2011 | 2010 |
| Institutional Shares: | Shares | Amount | Shares | Amount |
| Shares sold | 11,155,347 | $112,754,571 | 21,901,282 | $212,919,459 |
| Shares issued to shareholders in payment of distributions declared | 1,084,061 | 10,992,759 | 926,567 | 9,064,806 |
| Shares redeemed | (16,076,448) | (162,828,285) | (10,288,440) | (100,484,802) |
NET CHANGE RESULTING
FROM INSTITUTIONAL SHARE TRANSACTIONS | (3,837,040) | $(39,080,955) | 12,539,409 | $121,499,463 |
| Year Ended April 30 | 2011 | 2010 |
| Institutional Service Shares: | Shares | Amount | Shares | Amount |
| Shares sold | 3,104,195 | $31,362,311 | 13,618,450 | $131,816,983 |
| Shares issued to shareholders in payment of distributions declared | 389,626 | 3,944,599 | 778,450 | 7,598,482 |
| Shares redeemed | (13,375,507) | (133,852,381) | (12,001,538) | (117,871,254) |
NET CHANGE RESULTING
FROM INSTITUTIONAL SERVICE SHARE TRANSACTIONS | (9,881,686) | $(98,545,471) | 2,395,362 | $21,544,211 |
NET CHANGE RESULTING
FROM TOTAL FUND SHARE TRANSACTIONS | (13,718,726) | $(137,626,426) | 14,934,771 | $143,043,674 |
4. FEDERAL TAX INFORMATION
The tax character of distributions as reported on the Statement of Changes in Net Assets for the years ended April 30, 2011 and 2010, was as follows:
| 2011 | 2010 |
| Ordinary income | $19,761,547 | $20,937,570 |
As of April 30, 2011, the components of distributable earnings on a tax basis were as follows:
| Undistributed ordinary income | $29,130 |
| Net unrealized appreciation | $24,432,379 |
| Undistributed long-term capital gains | $4,420,541 |
At April 30, 2011, the cost of investments for federal tax purposes was $334,867,053. The net unrealized appreciation of investments for federal tax purposes excluding any unrealized depreciation resulting from futures contracts was $24,432,379. This consists of net unrealized appreciation from investments for those securities having an excess of value over cost of $25,938,165 and net unrealized depreciation from investments for those securities having an excess of cost over value of $1,505,786.
Annual Shareholder Report
33
Under the recently enacted Regulated Investment Company Modernization Act of 2010, the Fund will be permitted to carry forward capital losses incurred in taxable years beginning after December 22, 2010 for an unlimited period. However, any losses incurred during those future years will be required to be utilized prior to the losses incurred in pre-enactment tax years. As a result of this ordering rule, pre-enactment capital loss carryforwards may be more likely to expire unused. Additionally, post-enactment capital losses that are carried forward will retain their character as either short-term or long-term capital losses rather than being considered all short-term as under previous law.The Fund used capital loss carryforwards of $2,760,346 to offset taxable capital gains realized during the year ended April 30, 2011.
5. INVESTMENT ADVISER FEE AND OTHER TRANSACTIONS WITH AFFILIATES
Investment Adviser Fee
Federated Investment Management Company is the Fund's investment adviser (the “Adviser”). The advisory agreement between the Fund and the Adviser provides for an annual fee equal to 0.50% of the Fund's average daily net assets. Subject to the terms described in the Expense Limitation note, the Adviser may voluntarily choose to waive any portion of its fee. For the year ended April 30, 2011, the Adviser voluntarily waived $765,984 of its fee.
Administrative Fee
Federated Administrative Services (FAS), under the Administrative Services Agreement, provides the Fund with administrative personnel and services. The fee paid to FAS is based on the average aggregate daily net assets of certain Federated funds as specified below:
| Administrative Fee | Average Aggregate Daily Net Assets
of the Federated Funds |
| 0.150% | on the first $5 billion |
| 0.125% | on the next $5 billion |
| 0.100% | on the next $10 billion |
| 0.075% | on assets in excess of $20 billion |
The administrative fee received during any fiscal year shall be at least $150,000 per portfolio and $40,000 per each additional class of Shares. Subject to the terms described in the Expense Limitation note, FAS may voluntarily choose to waive any portion of its fee. For the year ended April 30, 2011, the net fee paid to FAS was 0.076% of average daily net assets of the Fund. FAS waived $8,707 of its fee.
Distribution Services Fee
The Fund has adopted a Distribution Plan (the “Plan”) pursuant to Rule 12b-1 under the Act. Under the terms of the Plan, the Fund will compensate Federated Securities Corp. (FSC), the principal distributor, from the daily net assets of the Fund's Institutional Service Shares to finance activities intended to result in the sale of these shares. The Plan provides that the Fund may incur distribution expenses at 0.25% of average daily net assets, annually, to compensate FSC. Subject to the terms described in the Expense Limitation note, FSC may voluntarily choose to waive any portion of its fee. For the year ended April 30, 2011, FSC voluntarily waived its entire fee. When FSC receives fees, it may pay some or all of them to financial intermediaries whose customers purchase shares.
Annual Shareholder Report
34
Shareholder Services FeeThe Fund may pay fees (“Service Fees”) up to 0.25% of the average daily net assets of the Fund's Institutional Shares and Institutional Service Shares to financial intermediaries or to Federated Shareholder Services Company (FSSC) for providing services to shareholders and maintaining shareholder accounts. Subject to the terms described in the Expense Limitation note, FSSC may voluntarily reimburse the Fund for Service Fees. For the year ended April 30, 2011, FSSC voluntarily reimbursed $128,892 of shareholder services fees and $3,612 of account administration fees. For the year ended April 30, 2011, FSSC did not receive any fees paid by the Fund.
Expense Limitation
The Adviser and its affiliates (which may include FSC, FAS and FSSC) have voluntarily agreed to waive their fees and/or reimburse expenses so that the total annual fund operating expenses (as shown in the financial highlights) paid by the Fund's Institutional Shares and Institutional Service Shares (after the voluntary waivers and/or reimbursements) will not exceed 0.56% and 0.81% (the “Fee Limit”), respectively, up to but not including the later of (the “Termination Date”): (a) July 1, 2012; or (b) the date of the Fund's next effective Prospectus. While the Adviser and its affiliates currently do not anticipate terminating or increasing these arrangements prior to the Termination Date, these arrangements may only be terminated or the Fee Limit increased prior to the Termination Date with the agreement of the Trustees.
General
Certain Officers and Trustees of the Fund are Officers and Directors or Trustees of the above companies.
Transactions Involving Affiliated Holdings
Affiliated holdings are mutual funds which are managed by the Adviser or an affiliate of the Adviser. The Adviser has agreed to reimburse the Fund for certain investment adviser fees as a result of transactions in other affiliated mutual funds. For the year ended April 30, 2011, the Adviser reimbursed $3,243. Transactions involving the affiliated holding during the year ended April 30, 2011, were as follows:
| Affiliate | Balance of
Shares Held
4/30/2010 | Purchases/
Additions | Sales/
Reductions | Balance of
Shares Held
4/30/2011 | Value | Dividend
Income |
Federated Prime Value Obligations Fund,
Institutional Shares | 3,246,005 | 115,691,775 | 118,175,889 | 761,891 | $761,891 | $6,558 |
6. Investment TRANSACTIONS
Purchases and sales of investments, excluding long-term U.S. government securities and short-term obligations, for the year ended April 30, 2011, were as follows:
| Purchases | $91,518,412 |
| Sales | $237,870,406 |
Annual Shareholder Report35
7. LINE OF CREDIT
The Fund participates in a $100,000,000 unsecured, uncommitted revolving line of credit (LOC) agreement with PNC Bank. The LOC was made available for extraordinary or emergency purposes, primarily for financing redemption payments. Borrowings are charged interest at a rate offered to the Fund by PNC Bank at the time of the borrowing. As of April 30, 2011, there were no outstanding loans. During the year ended April 30, 2011, the Fund did not utilize the LOC.
8. INTERFUND LENDING
Pursuant to an Exemptive Order issued by the Securities and Exchange Commission, the Fund, along with other funds advised by subsidiaries of Federated Investors, Inc., may participate in an interfund lending program. This program provides an alternative credit facility allowing the Fund to borrow from other participating affiliated funds. As of April 30, 2011, there were no outstanding loans. During the year ended April 30, 2011, the program was not utilized.
9. SUBSEQUENT EVENT
On June 1, 2011, a supplement to the Fund's Prospectus and Statement of Additional Information was filed to indicate that the word “Institutional” will be removed from the Fund's Institutional Service Shares effective September 30, 2011.
Management has evaluated subsequent events through the date the financial statements were issued, and determined that no additional events have occurred that require disclosure.
Annual Shareholder Report36
Report of Independent Registered Public Accounting Firm
TO THE BOARD OF TRUSTEES OF FEDERATED INCOME SECURITIES TRUST AND SHAREHOLDERS OF FEDERATED INTERMEDIATE CORPORATE BOND FUND:
We have audited the accompanying statement of assets and liabilities of Federated Intermediate Corporate Bond Fund (the “Fund”) (one of the portfolios constituting Federated Income Securities Trust), including the portfolio of investments, as of April 30, 2011, and the related statement of operations for the year then ended, the statement of changes in net assets for each of the two years in the period then ended, and the financial highlights for each of the five years in the period then ended. These financial statements and financial highlights are the responsibility of the Fund's management. Our responsibility is to express an opinion on these financial statements and financial highlights based on our audits.
We conducted our audits in accordance with standards of the Public Company Accounting Oversight Board (United States). Those standards require that we plan and perform the audit to obtain reasonable assurance about whether the financial statements and financial highlights are free of material misstatement. We were not engaged to perform an audit of the Fund's internal control over financial reporting. Our audits included consideration of internal control over financial reporting as a basis for designing audit procedures that are appropriate in the circumstances, but not for the purpose of expressing an opinion on the effectiveness of the Fund's internal control over financial reporting. Accordingly, we express no such opinion. An audit also includes examining, on a test basis, evidence supporting the amounts and disclosures in the financial statements and financial highlights, assessing the accounting principles used and significant estimates made by management, and evaluating the overall financial statement presentation. Our procedures included confirmation of securities owned as of April 30, 2011, by correspondence with the custodian and others or by other appropriate auditing procedures where replies from others were not received. We believe that our audits provide a reasonable basis for our opinion.
In our opinion, the financial statements and financial highlights referred to above present fairly, in all material respects, the financial position of Federated Intermediate Corporate Bond Fund, a portfolio of Federated Income Securities Trust, at April 30, 2011, the results of its operations for the year then ended, the changes in its net assets for each of the two years in the period then ended, and the financial highlights for each of the five years in the period then ended, in conformity with U.S. generally accepted accounting principles.
Boston, Massachusetts
June 23, 2011
Annual Shareholder Report37
Board of Trustees and Trust Officers
The Board of Trustees is responsible for managing the Trust's business affairs and for exercising all the Trust's powers except those reserved for the shareholders. The following tables give information about each Trustee and the senior officers of the Fund. Where required, the tables separately list Trustees who are “interested persons” of the Fund (i.e., “Interested” Trustees) and those who are not (i.e., “Independent” Trustees). Unless otherwise noted, the address of each person listed is Federated Investors Tower, 1001 Liberty Avenue, Pittsburgh, PA 15222. The address of all Independent Trustees listed is 4000 Ericsson Drive, Warrendale, PA 15086-7561; Attention: Mutual Fund Board. As of December 31, 2010, the Trust comprised nine portfolio(s), and the Federated Fund Family consisted of 43 investment companies (comprising 136 portfolios). Unless otherwise noted, each Officer is elected annually. Unless otherwise noted, each Trustee oversees all portfolios in the Federated Fund Family and serves for an indefinite term. The Fund's Statement of Additional Information includes additional information about Trust Trustees and is available, without charge and upon request, by calling 1-800-341-7400.
Interested TRUSTEES Background
Name
Birth Date
Positions Held with Trust
Date Service Began | Principal Occupation(s) for Past Five Years,
Other Directorships Held and Previous Position(s) |
John F. Donahue*
Birth Date: July 28, 1924
Trustee
Began serving: January 1986 | Principal Occupations: Director or Trustee of the Federated Fund Family; Chairman and Director, Federated Investors, Inc.; Chairman of the Federated Fund Family's Executive Committee.
Previous Positions: Chairman of the Federated Fund Family; Trustee, Federated Investment Management Company; Chairman and Director, Federated Investment Counseling. |
J. Christopher Donahue*
Birth Date: April 11, 1949
President and Trustee
Began serving: January 2000 | Principal Occupations: Principal Executive Officer and President of the Federated Fund Family; Director or Trustee of some of the Funds in the Federated Fund Family; President, Chief Executive Officer and Director, Federated Investors, Inc.; Chairman and Trustee, Federated Investment Management Company; Trustee, Federated Investment Counseling; Chairman and Director, Federated Global Investment Management Corp.; Chairman, Federated Equity Management Company of Pennsylvania and Passport Research, Ltd. (investment advisory subsidiary of Federated); Trustee, Federated Shareholder Services Company; Director, Federated Services Company.
Previous Positions: President, Federated Investment Counseling; President and Chief Executive Officer, Federated Investment Management Company, Federated Global Investment Management Corp. and Passport Research, Ltd. |
| * | Family relationships and reasons for “interested” status: John F. Donahue is the father of J. Christopher Donahue; both are “interested” due to their beneficial ownership of shares of Federated Investors, Inc. and the positions they hold with Federated and its subsidiaries. |
Annual Shareholder Report38
INDEPENDENT TRUSTEES Background
Name
Birth Date
Positions Held with Trust
Date Service Began | Principal Occupation(s) for Past Five Years,
Other Directorships Held, Previous Position(s) and Qualifications |
Nicholas P. Constantakis, CPA
Birth Date: September 3, 1939
Trustee
Began serving: February 1998 | Principal Occupation: Director or Trustee of the Federated Fund Family.
Other Directorship Held: Director and Chairman of the Audit Committee, Michael Baker Corporation (architecture, engineering and construction services).
Previous Position: Partner, Andersen Worldwide SC.
Qualifications: Public accounting and director experience. |
John F. Cunningham
Birth Date: March 5, 1943
Trustee
Began serving: January 1999 | Principal Occupation: Director or Trustee of the Federated Fund Family.
Other Directorships Held: Chairman, President and Chief Executive Officer, Cunningham & Co., Inc. (strategic business consulting); Trustee Associate, Boston College.
Previous Positions: Director, Redgate Communications and EMC Corporation (computer storage systems); Chairman of the Board and Chief Executive Officer, Computer Consoles, Inc.; President and Chief Operating Officer, Wang Laboratories; Director, First National Bank of Boston; Director, Apollo Computer, Inc.
Qualifications: Business management and director experience. |
Maureen Lally-Green
Birth Date: July 5, 1949
Trustee
Began serving: August 2009 | Principal Occupations: Director or Trustee of the Federated Fund Family; Director, Office of Church Relations, Diocese of Pittsburgh; Adjunct Professor of Law, Duquesne University School of Law.
Other Directorships Held: Director, Auberle; Trustee, St. Francis University; Director, Ireland Institute of Pittsburgh; Director, UPMC Mercy Hospital; Regent, St. Vincent Seminary; Director, Epilepsy Foundation of Western and Central Pennsylvania; Director, Saint Thomas More Society, Allegheny County; Director, Carlow University.
Previous Position: Pennsylvania Superior Court Judge.
Qualifications: Legal and director experience. |
Peter E. Madden
Birth Date: March 16, 1942
Trustee
Began serving: November 1991 | Principal Occupation: Director or Trustee, and Chairman of the Board of Directors or Trustees, of the Federated Fund Family.
Previous Positions: Representative, Commonwealth of Massachusetts General Court; President, Chief Operating Officer and Director, State Street Bank and Trust Company and State Street Corporation (retired); Director, VISA USA and VISA International; Chairman and Director, Massachusetts Bankers Association; Director, Depository Trust Corporation; Director, The Boston Stock Exchange.
Qualifications: Business management, mutual fund services and director experience. |
Annual Shareholder Report39
Name
Birth Date
Positions Held with Trust
Date Service Began | Principal Occupation(s) for Past Five Years,
Other Directorships Held, Previous Position(s) and Qualifications |
Charles F. Mansfield, Jr.
Birth Date: April 10, 1945
Trustee
Began serving: January 2000 | Principal Occupations: Director or Trustee and Chairman of the Audit Committee of the Federated Fund Family; Management Consultant.
Previous Positions: Chief Executive Officer, PBTC International Bank; Partner, Arthur Young & Company (now Ernst & Young LLP); Chief Financial Officer of Retail Banking Sector, Chase Manhattan Bank; Senior Vice President, HSBC Bank USA (formerly, Marine Midland Bank); Vice President, Citibank; Assistant Professor of Banking and Finance, Frank G. Zarb School of Business, Hofstra University; Executive Vice President, DVC Group, Inc. (marketing, communications and technology).
Qualifications: Banking, business management, education and director experience. |
R. James Nicholson
Birth Date: February 4, 1938
Trustee
Began serving: January 2008 | Principal Occupations: Director or Trustee of the Federated Fund Family; Senior Counsel, Brownstein Hyatt Farber Schrek, P.C.; Former Secretary of the U.S. Dept. of Veterans Affairs; Former U.S. Ambassador to the Holy See; Former Chairman of the Republican National Committee.
Other Directorships Held: Director, Horatio Alger Association; Director, The Daniels Fund.
Previous Positions: Colonel, U.S. Army Reserve; Partner, Calkins, Kramer, Grimshaw and Harring, P.C.; General Counsel, Colorado Association of Housing and Building; Chairman and CEO, Nicholson Enterprises, Inc. (real estate holding company); Chairman and CEO, Renaissance Homes of Colorado.
Qualifications: Legal, government, business management and director experience. |
Thomas M. O'Neill
Birth Date: June 14, 1951
Trustee
Began serving: October 2006 | Principal Occupations: Director or Trustee of the Federated Fund Family; Sole Proprietor, Navigator Management Company (investment and strategic consulting).
Other Directorships Held: Board of Overseers, Children's Hospital of Boston; Visiting Committee on Athletics, Harvard College.
Previous Positions: Chief Executive Officer and President, Managing Director and Chief Investment Officer, Fleet Investment Advisors; President and Chief Executive Officer, Aeltus Investment Management, Inc.; General Partner, Hellman, Jordan Management Co., Boston, MA; Chief Investment Officer, The Putnam Companies, Boston, MA; Credit Analyst and Lending Officer, Fleet Bank; Director and Consultant, EZE Castle Software (investment order management software); Director, Midway Pacific (lumber).
Qualifications: Business management, mutual fund, director and investment experience. |
Annual Shareholder Report40
Name
Birth Date
Positions Held with Trust
Date Service Began | Principal Occupation(s) for Past Five Years,
Other Directorships Held, Previous Position(s) and Qualifications |
John S. Walsh
Birth Date: November 28, 1957
Trustee
Began serving: January 2000 | Principal Occupations: Director or Trustee of the Federated Fund Family; President and Director, Heat Wagon, Inc. (manufacturer of construction temporary heaters); President and Director, Manufacturers Products, Inc. (distributor of portable construction heaters); President, Portable Heater Parts, a division of Manufacturers Products, Inc.
Previous Position: Vice President, Walsh & Kelly, Inc.
Qualifications: Business management and director experience. |
James F. Will
Birth Date: October 12, 1938
Trustee
Began serving: April 2006 | Principal Occupations: Director or Trustee of the Federated Fund Family; formerly, Vice Chancellor and President, Saint Vincent College.
Other Directorships Held: Trustee, Saint Vincent College; Director, Alleghany Corporation; Trustee, Wheeling Jesuit University; Director, Liberty Tire Recycling.
Previous Positions: Chairman, President and Chief Executive Officer, Armco, Inc.; President and Chief Executive Officer, Cyclops Industries; President and Chief Operating Officer, Kaiser Steel Corporation.
Qualifications: Business management, education and director experience. |
OFFICERS
Name
Birth Date
Address
Positions Held with Trust
Date Service Began | Principal Occupation(s) for Past Five Years
and Previous Position(s) |
John W. McGonigle
Birth Date: October 26, 1938
EXECUTIVE VICE PRESIDENT AND SECRETARY
Began serving: January 1986 | Principal Occupations: Executive Vice President and Secretary of the Federated Fund Family; Vice Chairman, Executive Vice President, Secretary and Director, Federated Investors, Inc.
Previous Positions: Trustee, Federated Investment Management Company and Federated Investment Counseling; Director, Federated Global Investment Management Corp., Federated Services Company and Federated Securities Corp. |
Richard A. Novak
Birth Date: December 25, 1963
Treasurer
Began serving: January 2006 | Principal Occupations: Principal Financial Officer and Treasurer of the Federated Fund Family; Senior Vice President, Federated Administrative Services; Financial and Operations Principal for Federated Securities Corp., Edgewood Services, Inc. and Southpointe Distribution Services, Inc.
Previous Positions: Controller of Federated Investors, Inc.; Vice President, Finance of Federated Services Company; held various financial management positions within The Mercy Hospital of Pittsburgh; Auditor, Arthur Andersen & Co. |
Annual Shareholder Report41
Name
Birth Date
Address
Positions Held with Trust
Date Service Began | Principal Occupation(s) for Past Five Years
and Previous Position(s) |
Richard B. Fisher
Birth Date: May 17, 1923
Vice President
Began serving: January 1986 | Principal Occupations: Vice Chairman or Vice President of some of the Funds in the Federated Fund Family; Vice Chairman, Federated Investors, Inc.; Chairman, Federated Securities Corp.
Previous Positions: President and Director or Trustee of some of the Funds in the Federated Fund Family; Executive Vice President, Federated Investors, Inc.; Director and Chief Executive Officer, Federated Securities Corp. |
Brian P. Bouda
Birth Date: February 28, 1947
CHIEF COMPLIANCE OFFICER AND SENIOR VICE PRESIDENT
Began serving: August 2004 | Principal Occupations: Senior Vice President and Chief Compliance Officer of the Federated Fund Family; Vice President and Chief Compliance Officer of Federated Investors, Inc. and Chief Compliance Officer of its subsidiaries. Mr. Bouda joined Federated in 1999 and is a member of the American Bar Association and the State Bar Association of Wisconsin. |
Stephen F. Auth
Birth Date: September 3, 1956
450 Lexington Avenue
Suite 3700
New York, NY 10017-3943
CHIEF INVESTMENT OFFICER
Began serving: May 2004 | Principal Occupations: Mr. Auth is Chief Investment Officer of this Fund and various other Funds in the Federated Fund Family; Executive Vice President, Federated Investment Counseling, Federated Global Investment Management Corp. and Federated Equity Management Company of Pennsylvania.
Previous Positions: Executive Vice President, Federated Investment Management Company, and Passport Research, Ltd. (investment advisory subsidiary of Federated); Senior Vice President, Global Portfolio Management Services Division; Senior Vice President, Federated Investment Management Company and Passport Research, Ltd.; Senior Managing Director and Portfolio Manager, Prudential Investments. |
Robert J. Ostrowski
Birth Date: April 26, 1963
Chief Investment Officer
Began serving: May 2004 | Principal Occupations: Robert J. Ostrowski joined Federated in 1987 as an Investment Analyst and became a Portfolio Manager in 1990. He was named Chief Investment Officer of taxable fixed-income products in 2004 and also serves as a Senior Portfolio Manager. He has been a Senior Vice President of the Fund's Adviser since 1997. Mr. Ostrowski has received the Chartered Financial Analyst designation. He received his M.S. in Industrial Administration from Carnegie Mellon University. |
Randall S. Bauer
Birth Date: November 16, 1957
Vice President
Began serving: November 1998 | Principal Occupations: Randall S. Bauer is Vice President of the Trust. Mr. Bauer joined Federated in 1989 and has been a Portfolio Manager and a Vice President of the Fund's Adviser since 1994 and a Senior Vice President of the Fund's Adviser beginning 2007. Mr. Bauer has received the Chartered Financial Analyst designation and holds an M.B.A. in Finance from the Pennsylvania State University. |
Joseph M. Balestrino
Birth Date: November 3, 1954
VICE PRESIDENT
Began serving: November 1998 | Principal Occupations: Joseph M. Balestrino has been the Fund's Portfolio Manager since January 1994. He is Vice President of the Trust. Mr. Balestrino joined Federated in 1986 and has been a Senior Portfolio Manager and Senior Vice President of the Fund's Sub-Adviser since 1998. He was a Portfolio Manager and a Vice President of the Fund's Sub-Adviser from 1995 to 1998. Mr. Balestrino served as a Portfolio Manager and an Assistant Vice President of the Fund's Sub-Adviser from 1993 to 1995. Mr. Balestrino has received the Chartered Financial Analyst designation and holds a Master's Degree in Urban and Regional Planning from the University of Pittsburgh. |
Annual Shareholder Report42
Name
Birth Date
Address
Positions Held with Trust
Date Service Began | Principal Occupation(s) for Past Five Years
and Previous Position(s) |
John L. Nichol
Birth Date: May 21, 1963
Vice President
Began serving: May 2004 | Principal Occupations: John L. Nichol is Vice President of the Trust. Mr. Nichol joined Federated in September 2000 as an Assistant Vice President/Senior Investment Analyst. He has been a Portfolio Manager since December 2000, and was named a Vice President of the Fund's Adviser in July 2001. Mr. Nichol served as a portfolio manager and analyst for the Public Employees Retirement System of Ohio from 1992 through August 2000. Mr. Nichol has received the Chartered Financial Analyst designation. He received his M.B.A. with an emphasis in Finance and Management and Information Science from the Ohio State University. |
Annual Shareholder Report43
Evaluation and Approval of Advisory Contract – May 2010
Federated Intermediate Corporate Bond Fund (the “Fund”)
The Fund's Board reviewed the Fund's investment advisory contract at meetings held in May 2010. The Board's decision regarding the contract reflects the exercise of its business judgment on whether to continue the existing arrangements.
In this connection, the Federated funds' Board had previously appointed a Senior Officer, whose duties include specified responsibilities relating to the process by which advisory fees are to be charged to a Federated fund. The Senior Officer has the authority to retain consultants, experts, or staff as may be reasonably necessary to assist in the performance of his duties, reports directly to the Board, and may be terminated only with the approval of a majority of the independent members of the Board. The Senior Officer prepared and furnished to the Board an independent, written evaluation that covered topics discussed below. The Board considered that evaluation, along with other information, in deciding to approve the advisory contract.
During its review of the contract, the Board considered compensation and benefits received by the Adviser. This included the fees received for services provided to the Fund by other entities in the Federated organization and research services (if any) received by the Adviser from brokers that execute Federated fund trades, as well as advisory fees. The Board is also familiar with and considered judicial decisions concerning allegedly excessive investment advisory fees, which have indicated that the following factors may be relevant to an Adviser's fiduciary duty with respect to its receipt of compensation from a fund: the nature and quality of the services provided by the Adviser, including the performance of the fund; the Adviser's cost of providing the services; the extent to which the Adviser may realize “economies of scale” as a fund grows larger; any indirect benefits that may accrue to the Adviser and its affiliates as a result of the Adviser's relationship with a fund; performance and expenses of comparable funds; and the extent to which the independent Board members are fully informed about all facts the Board deems relevant bearing on the Adviser's services and fees. The Board further considered management fees (including any components thereof) charged to institutional and other clients of the Adviser for what might be viewed as like services, and the cost to the Adviser and its affiliates of supplying services pursuant to the management fee agreements, excluding any intra-corporate profit and profit margins of the Adviser and its affiliates for supplying such services. The Board was aware of these factors and was guided by them in its review of the Fund's advisory contract to the extent it considered them to be appropriate and relevant, as discussed further below.
Annual Shareholder Report
44
The Board considered and weighed these circumstances in light of its substantial accumulated experience in governing the Fund and working with Federated on matters relating to the Federated funds, and was assisted in its deliberations by independent legal counsel. Throughout the year, the Board has requested and received substantial and detailed information about the Fund and the Federated organization that was in addition to the extensive materials that comprise and accompany the Senior Officer's evaluation. Federated provided much of this information at each regular meeting of the Board, and furnished additional reports in connection with the particular meeting at which the Board's formal review of the advisory contract occurred. Between regularly scheduled meetings, the Board also received information on particular matters as the need arose. Thus, the Board's consideration of the advisory contract included review of the Senior Officer's evaluation, accompanying data and additional reports covering such matters as: the Adviser's investment philosophy, revenue, profitability, personnel and processes; investment and operating strategies; the Fund's short- and long-term performance (in absolute terms, both on a gross basis and net of expenses, as well as in relationship to its particular investment program and certain competitor or “peer group” funds and/or other benchmarks, as appropriate), and comments on the reasons for performance; the Fund's investment objectives; the Fund's expenses (including the advisory fee itself and the overall expense structure of the Fund, both in absolute terms and relative to similar and/or competing funds, with due regard for contractual or voluntary expense limitations); the use and allocation of brokerage commissions derived from trading the Fund's portfolio securities (if any); and the nature, quality and extent of the advisory and other services provided to the Fund by the Adviser and its affiliates. The Board also considered the preferences and expectations of Fund shareholders and their relative sophistication; the continuing state of competition in the mutual fund industry and market practices; the range of comparable fees for similar funds in the mutual fund industry; the Fund's relationship to the Federated family of funds which include a comprehensive array of funds with different investment objectives, policies and strategies which are available for exchange without the incurrence of additional sales charges; compliance and audit reports concerning the Federated funds and the Federated companies that service them (including communications from regulatory agencies), as well as Federated's responses to any issues raised therein; and relevant developments in the mutual fund industry and how the Federated funds and/or Federated are responding to them. The Board's evaluation process is evolutionary. The criteria considered and the emphasis placed on relevant criteria change in recognition of changing circumstances in the mutual fund marketplace.With respect to the Fund's performance and expenses in particular, the Board has found the use of comparisons to other mutual funds with comparable investment programs to be relevant, given the high degree of competition in the mutual fund business. The Board focused on comparisons with other similar Annual Shareholder Report
45
mutual funds more heavily than non-mutual fund products or services because it is believed that they are more relevant. For example, other mutual funds are the products most like the Fund, they are readily available to Fund shareholders as alternative investment vehicles, and they are the type of investment vehicle in fact chosen and maintained by the Fund's investors. The range of their fees and expenses therefore appears to be a generally reliable indication of what consumers have found to be reasonable in the precise marketplace in which the Fund competes. The Fund's ability to deliver competitive performance when compared to its peer group was a useful indicator of how the Adviser is executing the Fund's investment program, which in turn assisted the Board in reaching a conclusion that the nature, extent, and quality of the Adviser's investment management services were such as to warrant continuation of the advisory contract. In this regard, the Senior Officer has reviewed Federated's fees for providing advisory services to products outside the Federated family of funds (e.g., institutional and separate accounts). He concluded that mutual funds and institutional accounts are inherently different products. Those differences include, but are not limited to, different types of targeted investors; being subject to different laws and regulations; different legal structures; different average account sizes; different associated costs; different portfolio management techniques made necessary by different cash flows; and portfolio manager time spent in review of securities pricing. The Senior Officer did not consider these fee schedules to be determinative in judging the appropriateness of mutual fund advisory contracts.The Senior Officer reviewed reports compiled by Federated, using data supplied by independent fund ranking organizations, regarding the performance of, and fees charged by, other mutual funds, noting his view that comparisons to fund peer groups are relevant in judging the reasonableness of proposed fees.
For the periods covered by the report, the Fund's performance for the one-year period was above the median of the relevant peer group, and the Fund's performance fell below the median of the relevant peer group for the three and five-year periods. The Board discussed the Fund's performance with the Adviser and recognized the efforts being undertaken by the Adviser. The Board will continue to monitor these efforts and the performance of the Fund.
The Board also received financial information about Federated, including reports on the compensation and benefits Federated derived from its relationships with the Federated funds. These reports covered not only the fees under the advisory contracts, but also fees received by Federated's subsidiaries for providing other services to the Federated funds under separate contracts (e.g., for serving as the Federated funds' administrator). The reports also discussed any indirect benefit Federated may derive from its receipt of research services from brokers who execute Federated fund trades. In addition, the Board considered the fact that, in order for a fund to be competitive in the marketplace, Federated and its affiliates frequently waived fees and/or Annual Shareholder Report
46
reimbursed expenses and have disclosed to fund investors and/or indicated to the Board their intention to do so in the future, where appropriate. Moreover, the Board receives regular reports regarding the institution or elimination of these voluntary waivers.Federated furnished reports, requested by the Senior Officer, that reported revenues on a fund-by-fund basis and made estimates of the allocation of expenses on a fund-by-fund basis, using allocation methodologies specified by the Senior Officer. The Senior Officer noted that, although they may apply consistent allocation processes, the inherent difficulties in allocating costs (and the unavoidable arbitrary aspects of that exercise) and the lack of consensus on how to allocate those costs may render such allocation reports unreliable. The allocation reports were considered in the analysis by the Board but were determined to be of limited use.
The Board and the Senior Officer also reviewed a report compiled by Federated comparing profitability information for Federated to other publicly held fund management companies. In this regard, the Senior Officer noted the limited availability of such information, but nonetheless concluded that Federated's profit margins did not appear to be excessive and the Board agreed.
The Senior Officer's evaluation also discussed the notion of possible realization of “economies of scale” as a fund grows larger. The Board considered in this regard that the Adviser has made significant and long-term investments in areas that support all of the Federated funds, such as personnel and processes for the portfolio management, compliance, and risk management functions; and systems technology; and that the benefits of these efforts (as well as any economies, should they exist) were likely to be enjoyed by the fund complex as a whole. Finally, the Board also noted the absence of any applicable regulatory or industry guidelines on this subject, which (as discussed in the Senior Officer's evaluation) is compounded by the lack of any common industry practice or general pattern with respect to structuring fund advisory fees with “breakpoints” that serve to reduce the fee as the fund attains a certain size. The Senior Officer did not recommend institution of breakpoints in pricing Federated's fund advisory services at this time.
It was noted in the materials for the Board meeting that for the period covered by the report, the Fund's investment advisory fee, after waivers and expense reimbursements, if any, was below the median of the relevant peer group. The Board reviewed the fees and other expenses of the Fund with the Adviser and was satisfied that the overall expense structure of the Fund remained competitive.
The Senior Officer's evaluation noted his belief that the information and observations contained in his evaluation supported a finding that the proposed management fees are reasonable, and that Federated appeared to provide appropriate administrative services to the Fund for the fees paid. Under these Annual Shareholder Report
47
circumstances, no changes were recommended to, and no objection was raised to, the continuation of the Fund's advisory contract. The Board concluded that the nature, quality and scope of services provided the Fund by the Adviser and its affiliates were satisfactory.In its decision to continue an existing investment advisory contract, the Board was mindful of the potential disruptions of the Fund's operations and various risks, uncertainties and other effects that could occur as a result of a decision to terminate or not renew an advisory contract. In particular, the Board recognized that many shareholders have invested in the Fund on the strength of the Adviser's industry standing and reputation and with the expectation that the Adviser will have a continuing role in providing advisory services to the Fund. Thus, the Board's approval of the advisory contract reflected the fact that it is the shareholders who have effectively selected the Adviser by virtue of having invested in the Fund.
The Board based its decision to approve the advisory contract on the totality of the circumstances and relevant factors and with a view to past and future long-term considerations. Not all of the factors and considerations identified above were necessarily relevant to the Fund, nor did the Board consider any one of them to be determinative. With respect to the factors that were relevant, the Board's decision to approve the contract reflects its determination that Federated's performance and actions provided a satisfactory basis to support the decision to continue the existing arrangements.
Annual Shareholder Report48
Voting Proxies on Fund Portfolio Securities
A description of the policies and procedures that the Fund uses to determine how to vote proxies, if any, relating to securities held in the Fund's portfolio is available, without charge and upon request, by calling 1-800-341-7400. A report on “Form N-PX” of how the Fund voted any such proxies during the most recent 12-month period ended June 30 is available from Federated's website at FederatedInvestors.com. To access this information from the home page, select “View All” next to “Find Products.” Select a fund name and share class, if applicable, to go to the Fund Overview page. On the Fund Overview page, select the “Documents” tab. At the bottom of that page, select “Proxy Voting Record Report (Form N-PX).” Form N-PX filings are also available at the SEC's website at www.sec.gov.
Quarterly Portfolio Schedule
The Fund files with the SEC a complete schedule of its portfolio holdings, as of the close of the first and third quarters of its fiscal year, on “Form N-Q.” These filings are available on the SEC's website at www.sec.gov and may be reviewed and copied at the SEC's Public Reference Room in Washington, DC. (Call 1-800-SEC-0330 for information on the operation of the Public Reference Room.) You may also access this information from the “Products” section of Federated's website at FederatedInvestors.com. From the home page, select “View All” next to “Find Products.” Select a fund name and share class, if applicable, to go to the Fund Overview page. On the Fund Overview page, select the “Documents” tab. At the bottom of that page, select “Form N-Q.”
Annual Shareholder Report49
Mutual funds are not bank deposits or obligations, are not guaranteed by any bank and are not insured or guaranteed by the U.S. government, the Federal Deposit Insurance Corporation, the Federal Reserve Board or any other government agency. Investment in mutual funds involves investment risk, including the possible loss of principal.
This Report is authorized for distribution to prospective investors only when preceded or accompanied by the Fund's Prospectus, which contains facts concerning its objective and policies, management fees, expenses and other information.
Federated Intermediate Corporate Bond Fund
Federated Investors Funds
4000 Ericsson Drive
Warrendale, PA 15086-7561
Contact us at FederatedInvestors.com
or call 1-800-341-7400.
Federated Securities Corp., Distributor
Cusip 31420C407
Cusip 31420C506
G00715-02 (6/11)
Federated is a registered trademark of Federated Investors, Inc.
2011 © Federated Investors, Inc.
Federated Short-Term Income FundFund Established 1986
A Portfolio of Federated Income Securities Trust
ANNUAL SHAREHOLDER REPORTApril 30, 2011
Class A Shares
Institutional Shares
Institutional Service Shares
(Effective September 30, 2011, the Fund's Institutional Service Shares will be redesignated as Service Shares)
Class Y Shares
FINANCIAL HIGHLIGHTS
SHAREHOLDER EXPENSE EXAMPLE
MANAGEMENT'S DISCUSSION OF FUND PERFORMANCE
PORTFOLIO OF INVESTMENTS SUMMARY TABLE
PORTFOLIO OF INVESTMENTS
STATEMENT OF ASSETS AND LIABILITIES
STATEMENT OF OPERATIONS
STATEMENT OF CHANGES IN NET ASSETS
NOTES TO FINANCIAL STATEMENTS
REPORT OF INDEPENDENT REGISTERED PUBLIC ACCOUNTING FIRM
BOARD OF TRUSTEES AND TRUST OFFICERS
EVALUATION AND APPROVAL OF ADVISORY CONTRACT
VOTING PROXIES ON FUND PORTFOLIO SECURITIES
QUARTERLY PORTFOLIO SCHEDULE
Financial Highlights – Class A Shares
(For a Share Outstanding Throughout Each Period)
| Year Ended April 30 | 2011 | 2010 | 2009 | 2008 | 2007 |
| Net Asset Value, Beginning of Period | $8.56 | $8.11 | $8.29 | $8.41 | $8.32 |
| Income From Investment Operations: | | | | | |
| Net investment income | 0.15 | 0.20 | 0.28 | 0.33 | 0.32 |
Net realized and unrealized gain
(loss) on investments, futures
contracts, swap contracts and
foreign currency transactions | 0.07 | 0.45 | (0.17) | (0.12) | 0.09 |
| TOTAL FROM INVESTMENT OPERATIONS | 0.22 | 0.65 | 0.11 | 0.21 | 0.41 |
| Less Distributions: | | | | | |
| Distributions from net investment income | (0.14) | (0.20) | (0.29) | (0.33) | (0.32) |
| Net Asset Value, End of Period | $8.64 | $8.56 | $8.11 | $8.29 | $8.41 |
| Total Return1 | 2.61% | 8.04% | 1.40% | 2.53% | 5.06% |
| Ratios to Average Net Assets: | | | | | |
| Net expenses | 1.09% | 1.09% | 1.09% | 1.09% | 1.09% |
| Net investment income | 1.75% | 2.36% | 3.50% | 3.94% | 3.82% |
| Expense waiver/reimbursement2 | 0.25% | 0.26% | 0.34% | 0.35% | 0.33% |
| Supplemental Data: | | | | | |
| Net assets, end of period (000 omitted) | $100,026 | $94,070 | $45,999 | $45,005 | $52,511 |
| Portfolio turnover | 30% | 38% | 53% | 45% | 28% |
| 1 | Based on net asset value, which does not reflect the sales charge, redemption fee or contingent deferred sales charge, if applicable. |
| 2 | This expense decrease is reflected in both the net expense and the net investment income ratios shown above. |
See Notes which are an integral part of the Financial Statements
Annual Shareholder Report1
Financial Highlights – Institutional Shares
(For a Share Outstanding Throughout Each Period)
| Year Ended April 30 | 2011 | 2010 | 2009 | 2008 | 2007 |
| Net Asset Value, Beginning of Period | $8.56 | $8.11 | $8.29 | $8.41 | $8.32 |
| Income From Investment Operations: | | | | | |
| Net investment income | 0.20 | 0.25 | 0.33 | 0.38 | 0.37 |
Net realized and unrealized gain
(loss) on investments, futures
contracts, swap contracts and
foreign currency transactions | 0.07 | 0.45 | (0.17) | (0.12) | 0.09 |
| TOTAL FROM INVESTMENT OPERATIONS | 0.27 | 0.70 | 0.16 | 0.26 | 0.46 |
| Less Distributions: | | | | | |
| Distributions from net investment income | (0.19) | (0.25) | (0.34) | (0.38) | (0.37) |
| Net Asset Value, End of Period | $8.64 | $8.56 | $8.11 | $8.29 | $8.41 |
| Total Return1 | 3.20% | 8.67% | 1.99% | 3.12%2 | 5.67% |
| Ratios to Average Net Assets: | | | | | |
| Net expenses | 0.52% | 0.51% | 0.52% | 0.52% | 0.51% |
| Net investment income | 2.33% | 2.94% | 4.09% | 4.51% | 4.42% |
| Expense waiver/reimbursement3 | 0.24% | 0.25% | 0.33% | 0.35% | 0.33% |
| Supplemental Data: | | | | | |
| Net assets, end of period (000 omitted) | $474,795 | $402,259 | $176,546 | $175,985 | $151,537 |
| Portfolio turnover | 30% | 38% | 53% | 45% | 28% |
| 1 | Based on net asset value. |
| 2 | During the period, the Fund was reimbursed by an affiliated shareholder services provider which had an impact of 0.12% on the total return. |
| 3 | This expense decrease is reflected in both the net expense and the net investment income ratios shown above. |
See Notes which are an integral part of the Financial Statements
Annual Shareholder Report2
Financial Highlights – Institutional Service Shares
(For a Share Outstanding Throughout Each Period)
| Year Ended April 30 | 2011 | 2010 | 2009 | 2008 | 2007 |
| Net Asset Value, Beginning of Period | $8.56 | $8.11 | $8.29 | $8.41 | $8.32 |
| Income From Investment Operations: | | | | | |
| Net investment income | 0.18 | 0.23 | 0.32 | 0.36 | 0.35 |
Net realized and unrealized gain
(loss) on investments, futures
contracts, swap contracts and
foreign currency transactions | 0.08 | 0.45 | (0.18) | (0.12) | 0.10 |
| TOTAL FROM INVESTMENT OPERATIONS | 0.26 | 0.68 | 0.14 | 0.24 | 0.45 |
| Less Distributions: | | | | | |
| Distributions from net investment income | (0.18) | (0.23) | (0.32) | (0.36) | (0.36) |
| Net Asset Value, End of Period | $8.64 | $8.56 | $8.11 | $8.29 | $8.41 |
| Total Return1 | 3.01% | 8.46% | 1.80% | 2.92% | 5.47% |
| Ratios to Average Net Assets: | | | | | |
| Net expenses | 0.70% | 0.70% | 0.70% | 0.70% | 0.70% |
| Net investment income | 2.14% | 2.75% | 3.88% | 4.32% | 4.22% |
| Expense waiver/reimbursement2 | 0.29% | 0.30% | 0.38% | 0.38% | 0.34% |
| Supplemental Data: | | | | | |
| Net assets, end of period (000 omitted) | $314,236 | $266,638 | $63,342 | $23,430 | $16,304 |
| Portfolio turnover | 30% | 38% | 53% | 45% | 28% |
| 1 | Based on net asset value. |
| 2 | This expense decrease is reflected in both the net expense and the net investment income ratios shown above. |
See Notes which are an integral part of the Financial Statements
Annual Shareholder Report3
Financial Highlights – Class Y Shares
(For a Share Outstanding Throughout Each Period)
| Year Ended April 30 | 2011 | 2010 | 2009 | 2008 | 2007 |
| Net Asset Value, Beginning of Period | $8.56 | $8.11 | $8.29 | $8.41 | $8.32 |
| Income From Investment Operations: | | | | | |
| Net investment income | 0.21 | 0.26 | 0.34 | 0.39 | 0.38 |
Net realized and unrealized gain
(loss) on investments, futures
contracts, swap contracts and
foreign currency transactions | 0.08 | 0.45 | (0.17) | (0.12) | 0.10 |
| TOTAL FROM INVESTMENT OPERATIONS | 0.29 | 0.71 | 0.17 | 0.27 | 0.48 |
| Less Distributions: | | | | | |
| Distributions from net investment income | (0.21) | (0.26) | (0.35) | (0.39) | (0.39) |
| Net Asset Value, End of Period | $8.64 | $8.56 | $8.11 | $8.29 | $8.41 |
| Total Return1 | 3.37% | 8.84% | 2.16% | 3.28% | 5.83% |
| Ratios to Average Net Assets: | | | | | |
| Net expenses | 0.35% | 0.35% | 0.35% | 0.35% | 0.35% |
| Net investment income | 2.50% | 3.04% | 4.26% | 4.67% | 4.57% |
| Expense waiver/reimbursement2 | 0.24% | 0.25% | 0.33% | 0.34% | 0.33% |
| Supplemental Data: | | | | | |
| Net assets, end of period (000 omitted) | $263,115 | $114,145 | $12,062 | $12,772 | $53,417 |
| Portfolio turnover | 30% | 38% | 53% | 45% | 28% |
| 1 | Based on net asset value. |
| 2 | This expense decrease is reflected in both the net expense and the net investment income ratios shown above. |
See Notes which are an integral part of the Financial Statements
Annual Shareholder Report4
Shareholder Expense Example (unaudited)
As a shareholder of the Fund, you incur two types of costs: (1) transaction costs, including sales charges (loads) on purchase or redemption payments; and (2) ongoing costs, including management fees and to the extent applicable, distribution (12b-1) fees and/or shareholder services fees and other Fund expenses. This Example is intended to help you to understand your ongoing costs (in dollars) of investing in the Fund and to compare these costs with the ongoing costs of investing in other mutual funds. It is based on an investment of $1,000 invested at the beginning of the period and held for the entire period from November 1, 2010 to April 30, 2011.
ACTUAL EXPENSES
The first section of the table below provides information about actual account values and actual expenses. You may use the information in this section, together with the amount you invested, to estimate the expenses that you incurred over the period. Simply divide your account value by $1,000 (for example, an $8,600 account value divided by $1,000 = 8.6), then multiply the result by the number in the first section under the heading entitled “Expenses Paid During Period” to estimate the expenses attributable to your investment during this period.
HYPOTHETICAL EXAMPLE FOR COMPARISON PURPOSES
The second section of the table below provides information about hypothetical account values and hypothetical expenses based on the Fund's actual expense ratio and an assumed rate of return of 5% per year before expenses, which is not the Fund's actual return. Thus, you should not use the hypothetical account values and expenses to estimate the actual ending account balance or your expenses for the period. Rather, these figures are required to be provided to enable you to compare the ongoing costs of investing in the Fund with other funds. To do so, compare this 5% hypothetical example with the 5% hypothetical examples that appear in the shareholder reports of the other funds.
Annual Shareholder Report
5
Please note that the expenses shown in the table are meant to highlight your ongoing costs only and do not reflect any transaction costs, such as sales charges (loads) on purchase or redemption payments. Therefore, the second section of the table is useful in comparing ongoing costs only, and will not help you determine the relative total costs of owning different funds. In addition, if these transaction costs were included, your costs would have been higher. | Beginning
Account Value
11/1/2010 | Ending
Account Value
4/30/2011 | Expenses Paid
During Period1 |
| Actual: | | | |
| Class A Shares | $1,000 | $1,005.50 | $5.42 |
| Institutional Shares | $1,000 | $1,008.30 | $2.59 |
| Institutional Service Shares | $1,000 | $1,007.40 | $3.48 |
| Class Y Shares | $1,000 | $1,009.20 | $1.74 |
Hypothetical (assuming a 5% return
before expenses): | | | |
| Class A Shares | $1,000 | $1,019.39 | $5.46 |
| Institutional Shares | $1,000 | $1,022.22 | $2.61 |
| Institutional Service Shares | $1,000 | $1,021.32 | $3.51 |
| Class Y Shares | $1,000 | $1,023.06 | $1.76 |
| 1 | Expenses are equal to the Fund's annualized net expense ratios, multiplied by the average account value over the period, multiplied by 181/365) (to reflect the one-half-year period). The annualized net expense ratios are as follows: |
| Class A Shares | 1.09% |
| Institutional Shares | 0.52% |
| Institutional Service Shares | 0.70% |
| Class Y Shares | 0.35% |
Annual Shareholder Report6
Performance data quoted represents past performance which is no guarantee of future results. Investment return and principal value will fluctuate so that an investor's shares, when redeemed, may be worth more or less than their original cost. Mutual fund performance changes over time and current performance may be lower or higher than what is stated. For current to the most recent month-end performance and after-tax returns, visit FederatedInvestors.com or call 1-800-341-7400.
Management's Discussion of Fund Performance (unaudited)
The Fund's total return, based on net asset value, for the 12-month reporting period was 3.37% for Class Y Shares, 3.20% for Institutional Shares, 3.01% for Institutional Service Shares and 2.61% for Class A Shares. The total return of the Fund's blended benchmark, the 0-3 Year Composite Index (0-3C),1 was 3.35% for the same period. The Fund's total return for the fiscal year reflected actual cash flows, transaction costs and other expenses which were not reflected in the total return of the 0-3C.
For purposes of the following, the discussion will focus on the performance of the Fund's Class Y shares. The 3.37% return consisted of 2.44% of taxable dividends, and 0.93% appreciation in the net asset value of the shares.
During the reporting period, the most significant factors affecting the Fund's performance relative to the 0-3C were: (1) a general overweight to credit-sensitive securities; (2) allocations to “higher-beta, out of index” sectors like high yield, emerging markets and leveraged loans; and (3) exposures to a handful of specific securities noted below.
MARKET OVERVIEW
The Fund's fiscal year performance reflected a continued healing of the U.S. credit markets, along with a benign interest rate environment at the short end of the U.S. yield curve. The Fund's return reflected a modest increment over cash alternatives and reasonable performance relative to benchmarks and peers, generally resulting from a natural slope of the yield curve and still attractive credit spreads.
| 1 | The 0-3C is a composite index of four separate indices which track various security types. The four component indices, which are produced by Bank of America Merrill Lynch, Pierce, Fenner & Smith, Inc., consist of the Bank of America Merrill Lynch 1-3 Year Corporate Index (30% weighting in the composite index), the Bank of America Merrill Lynch 0-3 Year Fixed Rate Asset-Backed Securities Index (30%), the Bank of America Merrill Lynch 1-3 Year Treasury/Agency Index (20%) and the Bank of America Merrill Lynch 0-3 Year Mortgage-Backed Securities Index (20%). The weightings assigned to each component index of the 0-3C are fixed, but do not necessarily reflect the Fund's allocation to the type of fixed-income securities represented by the component indexes, which will vary. The four component indexes (and, by extension the 0-3C), are not adjusted to reflect sales charges, expenses or other fees that the SEC requires to be reflected in the Fund's performance. The four component indexes are unmanaged and, unlike the Fund, are not affected by cash flows. It is not possible to invest directly in an index. |
Annual Shareholder Report
7
While short-term interest rates were already low, the Federal Reserve Board (the “Fed”), in its policy, appeared intent on maintaining that low level for an extended period.2 A resurgence in inflation might have forced the Fed to change its thinking, which would have been recognized by the marketplace well in advance of any actual change in policy, causing a quick spike in short-term rates. Thus, management chose to keep the Fund's duration either close to or below the nine-month midpoint of its typical 0.5 – 1.0 year duration range.3sector
The Fund made no wholesale changes in sector allocation over the reporting period. Both “credit sensitive” sectors of the Fund, i.e., the corporate debt and structured credit allocations were maintained in an overweight position, and positions in Treasury securities were underweighted, with the allocation reduced further very late in the period. The underweight to mortgage securities was also maintained, but the allocation was gradually increased over the course of the reporting period, particularly in “credit” mortgage positions like commercial mortgage-backed securities (MBS) and prime U.K. residential MBS.4 The underweight in Treasuries helped performance, especially considering the Fund's material allocation to inflation indexed Treasuries, which are not included in the Treasury sub-component of the 0-3C, and added nine basis points of return relative to the sub-component. The underweight in MBS hurt performance as agency MBS were the best absolute performers of the 0-3C's four sub-components. The underperformance was offset somewhat, however, by the inclusion of credit mortgages in the Fund's overall mortgage allocation, as only agency mortgages are contained in the 0-3C's mortgage sub-component.
| 2 | Bond prices are sensitive to changes in interest rates and a rise in interest rates can cause a decline in their prices. |
| 3 | Duration is a measure of a security's price sensitivity to changes in interest rates. Securities with longer durations are more sensitive to changes in interest rates than securities of shorter durations. |
| 4 | The value of some mortgage-backed securities may be particularly sensitive to changes in prevailing interest rates, and although the securities are generally supported by some form of government or private insurance, there is no assurance that private guarantors or insurers will meet their obligations. |
Annual Shareholder Report
8
The Fund's investments in the high yield, emerging market and bank loan sectors, which are not included in the 0-3C, enhanced the Fund's performance.5 These investments were accomplished through purchases of the High Yield Bond Portfolio, the Emerging Markets Fixed Income Core Fund and the Federated Bank Loan Core Fund.SECURITY SELECTION
Continued price recoveries in credit segments of the market, particularly in asset-backed securities (ABS), helped the Fund's absolute return. However, with the exception of four ABS securities, (which contributed nine, four (two securities) and three basis points of return relative to the ABS sub-component, respectively), no credit security contributed more than two basis points of excess return to the Fund's performance relative to the 0-3C.
| 5 | High-yield, lower-rated securities generally entail greater market, credit/default and liquidity risks, and may be more volatile than investment-grade securities. International investing involves special risks including currency risk, increased volatility, political risks, and differences in auditing and other financial standards. Prices of emerging markets securities can be significantly more volatile than the prices of securities in developed countries and currency risk and political risks are accentuated in emerging markets. |
Annual Shareholder Report9
GROWTH OF A $10,000 INVESTMENT – CLASS A SHARES
The graph below illustrates the hypothetical investment of $10,0001 in Federated Short-Term Income Fund (Class A Shares) (the “Fund”) from August 26, 2004 (start of performance) to April 30, 2011, compared to the Bank of America Merrill Lynch 1-3 Year Short-Term Corporate Index (BAML1-3STC),2 the 0-3 Year Composite Index (0-3C)3 and the Lipper Short Investment Grade Debt Funds Average (LSIGDFA).4
| Average Annual Total Returns5 for the Period Ended 4/30/2011 | |
| 1 Year | 1.55% |
| 5 Years | 3.71% |
| Start of Performance (8/26/2004) | 3.21% |
| Federated Short-Term Income Fund - Class A Shares | C000024660 | BAML1-3STC | 0-3C | LSIGDFA |
| 8/26/2004 | 9,900 | 10,000 | 10,000 | 10,000 |
| 4/30/2005 | 9,983 | 10,062 | 10,102 | 10,104 |
| 4/30/2006 | 10,198 | 10,323 | 10,364 | 10,203 |
| 4/30/2007 | 10,713 | 10,924 | 10,948 | 10,772 |
| 4/30/2008 | 10,981 | 11,499 | 11,536 | 10,950 |
| 4/30/2009 | 11,136 | 11,463 | 11,836 | 10,560 |
| 4/30/2010 | 12,031 | 12,931 | 12,851 | 11,550 |
| 4/30/2011 | 12,346 | 13,430 | 13,277 | 11,930 |
41 graphic description end -->
Performance data quoted represents past performance which is no guarantee of future results. Investment return and principal value will fluctuate so that an investor's shares, when redeemed, may be worth more or less than their original cost. Mutual fund performance changes over time and current performance may be lower or higher than what is stated. For current to the most recent month-end performance and after-tax returns, visit FederatedInvestors.com or call 1-800-341-7400. Returns shown do not reflect the deduction of taxes that a shareholder would pay on Fund distributions or the redemption of Fund shares. Mutual funds are not obligations of or guaranteed by any bank and are not federally insured. Total returns shown include the maximum sales charge of 1.00%.
Annual Shareholder Report
10
| 1 | Represents a hypothetical investment of $10,000 in the Fund after deducting the maximum sales charge of 1.00% ($10,000 investment minus $100 sales charge = $9,900). The Fund's performance assumes the reinvestment of all dividends and distributions. The BAML1-3STC, 0-3C and the LSIGDFA have been adjusted to reflect reinvestment of dividends on securities in the indexes and the average. |
| 2 | The BAML1-3STC is not adjusted to reflect sales charges, expenses or other fees that the Securities and Exchange Commission (SEC) requires to be reflected in the Fund's performance. The index is unmanaged and, unlike the Fund, is not affected by cash flows. It is not possible to invest directly in an index. |
| 3 | The 0-3C is a composite index of four separate indexes which track various security types. The four component indexes, which are produced by Bank of America Merrill Lynch, Pierce, Fenner & Smith, Inc., consist of the Bank of America Merrill Lynch 1-3 Year Corporate Index (30% weighting in the Composite Index), the Bank of America Merrill Lynch 0-3 Year Fixed Rate Asset-Backed Securities Index (30%), the Bank of America Merrill Lynch 1-3 Year Treasury/Agency Index (20%) and the Bank of America Merrill Lynch 0-3 Year Mortgage-Backed Securities Index (20%). The weightings assigned to each component index of the 0-3C are fixed, but do not necessarily reflect the Fund's allocation to the type of fixed-income securities represented by the component indexes, which will vary. The four component indexes (and, by extension the 0-3C), are not adjusted to reflect sales charges, expenses or other fees that the SEC requires to be reflected in the Fund's performance. The four component indexes are unmanaged and, unlike the Fund, are not affected by cash flows. It is not possible to invest directly in an index. |
| 4 | The LSIGDFA represents the average of the total returns reported by all of the mutual funds designated by Lipper, Inc. as falling in the category indicated, and is not adjusted to reflect any sales charges. However, these total returns are reported net of expenses or other fees that the SEC requires to be reflected in a fund's performance. |
| 5 | Total returns quoted reflect all applicable sales charges. |
Annual Shareholder Report11
GROWTH OF A $10,000 INVESTMENT – INSTITUTIONAL SHARES
The graph below illustrates the hypothetical investment of $10,0001 in Federated Short-Term Income Fund (Institutional Shares) (the “Fund”) from April 30, 2001 to April 30, 2011, compared to the Bank of America Merrill Lynch 1-3 Year Short-Term Corporate Index (BAML1-3STC),2 the 0-3 Year Composite Index (0-3C)3 and the Lipper Short Investment Grade Debt Funds Average (LSIGDFA).4
| Average Annual Total Returns for the Period Ended 4/30/2011 | |
| 1 Year | 3.20% |
| 5 Years | 4.50% |
| 10 Years | 3.65% |
| Federated Short-Term Income Fund - Institutional Shares | C000024662 | BAML1-3STC | 0-3C | LSIGDFA |
| 4/30/2001 | 10,000 | 10,000 | 10,000 | 10,000 |
| 4/30/2002 | 10,490 | 10,645 | 10,643 | 10,504 |
| 4/30/2003 | 10,748 | 11,552 | 11,359 | 11,123 |
| 4/30/2004 | 10,943 | 11,907 | 11,593 | 11,204 |
| 4/30/2005 | 11,177 | 12,100 | 11,827 | 11,382 |
| 4/30/2006 | 11,484 | 12,413 | 12,135 | 11,494 |
| 4/30/2007 | 12,135 | 13,137 | 12,818 | 12,135 |
| 4/30/2008 | 12,513 | 13,828 | 13,507 | 12,335 |
| 4/30/2009 | 12,762 | 13,785 | 13,859 | 11,896 |
| 4/30/2010 | 13,869 | 15,550 | 15,047 | 13,011 |
| 4/30/2011 | 14,313 | 16,149 | 15,545 | 13,439 |
41 graphic description end -->
Performance data quoted represents past performance which is no guarantee of future results. Investment return and principal value will fluctuate so that an investor's shares, when redeemed, may be worth more or less than their original cost. Mutual fund performance changes over time and current performance may be lower or higher than what is stated. For current to the most recent month-end performance and after-tax returns, visit FederatedInvestors.com or call 1-800-341-7400. Returns shown do not reflect the deduction of taxes that a shareholder would pay on Fund distributions or the redemption of Fund shares. Mutual funds are not obligations of or guaranteed by any bank and are not federally insured.
Annual Shareholder Report
12
| 1 | The Fund's performance assumes the reinvestment of all dividends and distributions. The BAML1-3STC, 0-3C and the LSIGDFA have been adjusted to reflect reinvestment of dividends on securities in the indexes and the average. |
| 2 | The BAML1-3STC is not adjusted to reflect sales charges, expenses or other fees that the SEC requires to be reflected in the Fund's performance. The index is unmanaged and, unlike the Fund, is not affected by cash flows. It is not possible to invest directly in an index. |
| 3 | The 0-3C is a composite index of four separate indexes which track various security types. The four component indexes, which are produced by Bank of America Merrill Lynch, Pierce, Fenner & Smith, Inc., consist of the Bank of America Merrill Lynch 1-3 Year Corporate Index (30% weighting in the Composite Index), the Bank of America Merrill Lynch 0-3 Year Fixed Rate Asset-Backed Securities Index (30%), the Bank of America Merrill Lynch 1-3 Year Treasury/Agency Index (20%) and the Bank of America Merrill Lynch 0-3 Year Mortgage-Backed Securities Index (20%). The weightings assigned to each component index of the 0-3C are fixed, but do not necessarily reflect the Fund's allocation to the type of fixed-income securities represented by the component indexes, which will vary. The four component indexes (and, by extension the 0-3C), are not adjusted to reflect sales charges, expenses or other fees that the SEC requires to be reflected in the Fund's performance. The four component indexes are unmanaged and, unlike the Fund, are not affected by cash flows. It is not possible to invest directly in an index. |
| 4 | The LSIGDFA represents the average of the total returns reported by all of the mutual funds designated by Lipper, Inc. as falling in the category indicated, and is not adjusted to reflect any sales charges. However, these total returns are reported net of expenses or other fees that the SEC requires to be reflected in a fund's performance. |
Annual Shareholder Report13
GROWTH OF A $10,000 INVESTMENT – INSTITUTIONAL SERVICE SHARES
The graph below illustrates the hypothetical investment of $10,0001 in Federated Short-Term Income Fund (Institutional Service Shares) (the “Fund”) from April 30, 2001 to April 30, 2011, compared to the Bank of America Merrill Lynch 1-3 Year Short-Term Corporate Index (BAML1-3STC),2 the 0-3 Year Composite Index (0-3C)3 and the Lipper Short Investment Grade Debt Funds Average (LSIGDFA).4
| Average Annual Total Returns for the Period Ended 4/30/2011 | |
| 1 Year | 3.01% |
| 5 Years | 4.31% |
| 10 Years | 3.45% |
| Federated Short-Term Income Fund - Institutional Service Shares | C000024663 | BAML1-3STC | 0-3C | LSIGDFA |
| 4/30/2001 | 10,000 | 10,000 | 10,000 | 10,000 |
| 4/30/2002 | 10,464 | 10,645 | 10,643 | 10,504 |
| 4/30/2003 | 10,695 | 11,552 | 11,359 | 11,123 |
| 4/30/2004 | 10,861 | 11,907 | 11,593 | 11,204 |
| 4/30/2005 | 11,074 | 12,100 | 11,827 | 11,382 |
| 4/30/2006 | 11,367 | 12,413 | 12,135 | 11,494 |
| 4/30/2007 | 11,988 | 13,137 | 12,818 | 12,135 |
| 4/30/2008 | 12,338 | 13,828 | 13,507 | 12,335 |
| 4/30/2009 | 12,561 | 13,785 | 13,859 | 11,896 |
| 4/30/2010 | 13,624 | 15,550 | 15,047 | 13,011 |
| 4/30/2011 | 14,034 | 16,149 | 15,545 | 13,439 |
41 graphic description end -->
Performance data quoted represents past performance which is no guarantee of future results. Investment return and principal value will fluctuate so that an investor's shares, when redeemed, may be worth more or less than their original cost. Mutual fund performance changes over time and current performance may be lower or higher than what is stated. For current to the most recent month-end performance and after-tax returns, visit FederatedInvestors.com or call 1-800-341-7400. Returns shown do not reflect the deduction of taxes that a shareholder would pay on Fund distributions or the redemption of Fund shares. Mutual funds are not obligations of or guaranteed by any bank and are not federally insured.
Annual Shareholder Report
14
| 1 | The Fund's performance assumes the reinvestment of all dividends and distributions. The BAML1-3STC, 0-3C and the LSIGDFA have been adjusted to reflect reinvestment of dividends on securities in the indexes and the average. |
| 2 | The BAML1-3STC is not adjusted to reflect sales charges, expenses or other fees that the SEC requires to be reflected in the Fund's performance. The index is unmanaged and, unlike the Fund, is not affected by cash flows. It is not possible to invest directly in an index. |
| 3 | The 0-3C is a composite index of four separate indexes which track various security types. The four component indexes, which are produced by Bank of America Merrill Lynch, Pierce, Fenner & Smith, Inc., consist of the Bank of America Merrill Lynch 1-3 Year Corporate Index (30% weighting in the Composite Index), the Bank of America Merrill Lynch 0-3 Year Fixed Rate Asset-Backed Securities Index (30%), the Bank of America Merrill Lynch 1-3 Year Treasury/Agency Index (20%) and the Bank of America Merrill Lynch 0-3 Year Mortgage-Backed Securities Index (20%). The weightings assigned to each component index of the 0-3C are fixed, but do not necessarily reflect the Fund's allocation to the type of fixed-income securities represented by the component indexes, which will vary. The four component indexes (and, by extension the 0-3C), are not adjusted to reflect sales charges, expenses or other fees that the SEC requires to be reflected in the Fund's performance. The four component indexes are unmanaged and, unlike the Fund, are not affected by cash flows. It is not possible to invest directly in an index. |
| 4 | The LSIGDFA represents the average of the total returns reported by all of the mutual funds designated by Lipper, Inc. as falling in the category indicated, and is not adjusted to reflect any sales charges. However, these total returns are reported net of expenses or other fees that the SEC requires to be reflected in a fund's performance. |
Annual Shareholder Report15
GROWTH OF A $100,000 INVESTMENT – CLASS Y SHARES
The graph below illustrates the hypothetical investment of $100,0001 in Federated Short-Term Income Fund (Class Y Shares) (the “Fund”) from August 26, 2004 (start of performance) to April 30, 2011, compared to the Bank of America Merrill Lynch 1-3 Year Short-Term Corporate Index (BAML1-3STC),2 the 0-3 Year Composite Index (0-3C)3 and the Lipper Short Investment Grade Debt Funds Average (LSIGDFA).4
| Average Annual Total Returns for the Period Ended 4/30/2011 | |
| 1 Year | 3.37% |
| 5 Years | 4.67% |
| Start of Performance (8/26/2004) | 4.13% |
| Federated Short-Term Income Fund - Class Y Shares | C000024661 | BAML1-3STC | 0-3C | LSIGDFA |
| 8/26/2004 | 100,000 | 100,000 | 100,000 | 100,000 |
| 4/30/2005 | 101,340 | 100,620 | 101,020 | 101,040 |
| 4/30/2006 | 104,285 | 103,226 | 103,647 | 102,030 |
| 4/30/2007 | 110,369 | 109,244 | 109,482 | 107,723 |
| 4/30/2008 | 113,990 | 114,990 | 115,361 | 109,501 |
| 4/30/2009 | 116,452 | 114,630 | 118,368 | 105,603 |
| 4/30/2010 | 126,750 | 129,312 | 128,518 | 115,498 |
| 4/30/2011 | 131,033 | 134,290 | 132,772 | 119,298 |
41 graphic description end -->
Performance data quoted represents past performance which is no guarantee of future results. Investment return and principal value will fluctuate so that an investor's shares, when redeemed, may be worth more or less than their original cost. Mutual fund performance changes over time and current performance may be lower or higher than what is stated. For current to the most recent month-end performance and after-tax returns, visit FederatedInvestors.com or call 1-800-341-7400. Returns shown do not reflect the deduction of taxes that a shareholder would pay on Fund distributions or the redemption of Fund shares. Mutual funds are not obligations of or guaranteed by any bank and are not federally insured.
Annual Shareholder Report
16
| 1 | The Fund's performance assumes the reinvestment of all dividends and distributions. The BAML1-3STC, 0-3C and the LSIGDFA have been adjusted to reflect reinvestment of dividends on securities in the indexes and the average. |
| 2 | The BAML1-3STC is not adjusted to reflect sales charges, expenses or other fees that the SEC requires to be reflected in the Fund's performance. The index is unmanaged and, unlike the Fund, is not affected by cash flows. It is not possible to invest directly in an index. |
| 3 | The 0-3C is a composite index of four separate indexes which track various security types. The four component indexes, which are produced by Bank of America Merrill Lynch, Pierce, Fenner & Smith, Inc., consist of the Bank of America Merrill Lynch 1-3 Year Corporate Index (30% weighting in the Composite Index), the Bank of America Merrill Lynch 0-3 Year Fixed Rate Asset-Backed Securities Index (30%), the Bank of America Merrill Lynch 1-3 Year Treasury/Agency Index (20%) and the Bank of America Merrill Lynch 0-3 Year Mortgage-Backed Securities Index (20%). The weightings assigned to each component index of the 0-3C are fixed, but do not necessarily reflect the Fund's allocation to the type of fixed-income securities represented by the component indexes, which will vary. The four component indexes (and, by extension the 0-3C), are not adjusted to reflect sales charges, expenses or other fees that the SEC requires to be reflected in the Fund's performance. The four component indexes are unmanaged and, unlike the Fund, are not affected by cash flows. It is not possible to invest directly in an index. |
| 4 | The LSIGDFA represents the average of the total returns reported by all of the mutual funds designated by Lipper, Inc. as falling in the category indicated, and is not adjusted to reflect any sales charges. However, these total returns are reported net of expenses or other fees that the SEC requires to be reflected in a fund's performance. |
Annual Shareholder Report17
Portfolio of Investments Summary Table (unaudited)
At April 30, 2011, the Fund's portfolio composition1 was as follows:
| Security Type | Percentage of
Total Net Assets2 |
| Asset-Backed Securities | 32.6% |
| Corporate Debt Securities | 31.5% |
| Mortgage-Backed Securities3 | 14.9% |
| U.S. Treasury and Agency Securities4 | 9.3% |
| Floating Rate Loans | 1.7% |
| Foreign Debt Securities | 1.4% |
| Trade Finance Agreements | 0.8% |
| Securities Lending Collateral5 | 1.9% |
| Cash Equivalents6 | 8.1% |
| Other Assets and Liabilities — Net7 | (2.2)% |
| TOTAL | 100.0% |
| 1 | See the Fund's Prospectus and Statement of Additional Information for a description of these security types. |
| 2 | As of the date specified above, the Fund owned shares of one or more affiliated holdings. For purposes of this table, the affiliated holding (other than an affiliated money market mutual fund) is not treated as a single portfolio security, but rather the Fund is treated as owning a pro rata portion of each security and each other asset and liability owned by the affiliated holding. Accordingly, the percentages of total net assets shown in the table will differ from those presented on the Portfolio of Investments. |
| 3 | For purposes of this table, Mortgage-Backed Securities include mortgage-backed securities guaranteed by Government Sponsored Entities (GSEs) and adjustable rate mortgage-backed securities. |
| 4 | For purposes of this table, U.S. Treasury and Agency Securities does not include mortgage-backed securities guaranteed by GSEs. |
| 5 | Represents cash collateral received from portfolio securities on loan which is invested in short-term investments such as repurchase agreements or money market mutual funds. |
| 6 | Cash Equivalents include any investments in money market mutual funds and/or overnight repurchase agreements other than those representing securities lending collateral. |
| 7 | Assets, other than investments in securities and derivative contracts, less liabilities. See Statement of Assets and Liabilities. |
Annual Shareholder Report18
Portfolio of Investments
April 30, 2011
Principal
Amount
or Shares | | | Value |
| | Adjustable Rate Mortgages – 0.6% | |
| | Federal Home Loan Mortgage Corporation – 0.1% | |
| $24,310 | 1 | FHLMC ARM 390260, 2.887%, 10/01/2030 | 25,042 |
| 85,521 | 1 | FHLMC ARM 420173, 5.750%, 4/01/2030 | 92,630 |
| 11,130 | 1 | FHLMC ARM 420196, 5.313%, 11/01/2030 | 12,055 |
| 37,417 | 1 | FHLMC ARM 606116, 2.295%, 30 Year, 9/1/2019 | 38,340 |
| 958,987 | 1 | FHLMC ARM 780443, 2.285%, 3/01/2033 | 999,647 |
| 43,711 | 1 | FHLMC ARM 785167, 2.364%, 12/01/2018 | 44,737 |
| | TOTAL | 1,212,451 |
| | Federal National Mortgage Association – 0.5% | |
| 49,835 | 1 | FNMA ARM 316302, 6.825%, 11/01/2018 | 53,978 |
| 745,878 | 1 | FNMA ARM 544843, 3.277%, 10/01/2027 | 788,884 |
| 599,692 | 1 | FNMA ARM 544852, 3.307%, 4/01/2028 | 635,020 |
| 727,706 | 1 | FNMA ARM 544884, 3.288%, 5/01/2034 | 773,307 |
| 1,087,162 | 1 | FNMA ARM 556379, 1.707%, 5/01/2040 | 1,091,688 |
| 293,418 | 1 | FNMA ARM 556388, 1.707%, 5/01/2040 | 294,643 |
| 1,893,277 | 1 | FNMA ARM 618128, 2.734%, 8/01/2033 | 1,967,984 |
| | TOTAL | 5,605,504 |
| | Government National Mortgage Association – 0.0% | |
| 20,621 | 1 | GNMA ARM 8902, 2.375%, 30 Year, 1/20/2022 | 21,219 |
| | TOTAL ADJUSTABLE RATE MORTGAGES
(IDENTIFIED COST $6,654,212) | 6,839,174 |
| | Asset-Backed Securities – 32.6% | |
| | Auto Receivables – 16.7% | |
| 5,000,000 | 1,2,3 | Ally Master Owner Trust 2010-1, Class A, 1.969%, 1/15/2015 | 5,085,861 |
| 6,147,926 | 1 | Americredit Automobile Receivables Trust 2007-AX, Class A4, 0.280%, 10/6/2013 | 6,115,834 |
| 1,473,827 | | Americredit Automobile Receivables Trust 2007-CM, Class A4A, 5.55%, 4/7/2014 | 1,520,694 |
| 2,583,019 | 1 | Americredit Automobile Receivables Trust 2007-CM, Class A4B, 0.320%, 4/7/2014 | 2,564,941 |
| 1,779,000 | 1 | Americredit Automobile Receivables Trust 2009-1, Class C, 4.99%, 7/17/2017 | 1,865,064 |
| 5,000,000 | | Americredit Automobile Receivables Trust 2010-2, Class B, 2.73%, 3/9/2015 | 5,091,308 |
| 2,500,000 | | Americredit Automobile Receivables Trust 2010-3, Class C, 3.34%, 4/8/2016 | 2,529,115 |
Annual Shareholder Report19
Principal
Amount
or Shares | | | Value |
| $2,338,368 | | Americredit Automobile Receivables Trust 2010-A, Class A2, 1.46%, 11/6/2013 | 2,352,691 |
| 1,250,000 | | Americredit Automobile Receivables Trust 2011-2, Class A2, 0.90%, 9/8/2014 | 1,250,695 |
| 2,065,000 | | Americredit Prime Automobile Receivables Trust 2007-1, Class B, 5.35%, 9/9/2013 | 2,084,510 |
| 2,000,000 | 1,2,3 | BMW Floorplan Master Owner Trust 2009-1, Class A, 1.369%, 9/15/2014 | 2,020,701 |
| 1,189,301 | | BMW Vehicle Lease Trust 2009-1, Class A3, 2.91%, 3/15/2012 | 1,193,731 |
| 10,000,000 | | BMW Vehicle Lease Trust 2010-1, Class A3, 0.82%, 9/17/2012 | 10,016,932 |
| 3,086,138 | | BMW Vehicle Owner Trust 2010-A, Class A2, 0.68%, 9/25/2012 | 3,089,207 |
| 3,332,012 | 2,3 | Bank of America Auto Trust 2009-3, Class A3, 1.67%, 12/15/2013 | 3,354,351 |
| 4,381,994 | 1 | Capital One Auto Finance Trust 2007-B, Class A4, 0.249%, 4/15/2014 | 4,358,490 |
| 3,294,908 | | Capital One Auto Finance Trust 2007-C, Class A4, 5.23%, 7/15/2014 | 3,359,438 |
| 7,500,000 | 1 | Chrysler Financial Auto Securitization Trust 2010-A, Class C, 2.00%, 1/8/2014 | 7,562,221 |
| 3,750,000 | 2,3 | CitiFinancial Auto Issuance Trust 2009-1, Class A3, 2.59%, 10/15/2013 | 3,809,589 |
| 3,500,000 | 2,3 | Ford Credit Auto Lease Trust 2010-A, Class A3, 1.62%, 11/15/2013 | 3,509,044 |
| 2,406,149 | 1 | Ford Credit Auto Owner Trust 2010-A, Class A2, 0.72%, 9/15/2012 | 2,408,649 |
| 5,000,000 | 1 | Ford Credit FloorPlan Master Owner 2006-4, Class B, 0.769%, 6/15/2013 | 4,999,526 |
| 10,000,000 | 1 | Ford Credit Floorplan Master Owner Trust 2011-1 , Class C, 2.61%, 2/15/2016 | 10,093,446 |
| 5,000,000 | 1 | Ford Credit Floorplan Master Owner Trust 2011-1 , Class D, 2.96%, 1/15/2018 | 5,046,987 |
| 840,476 | | Harley-Davidson Motorcycle Trust 2006-3, Class A4, 5.22%, 6/15/2013 | 844,848 |
| 5,938,000 | | Harley-Davidson Motorcycle Trust 2006-3, Class B, 5.43%, 11/15/2014 | 6,048,729 |
| 2,048,779 | 1 | Harley-Davidson Motorcycle Trust 2009-2, Class A3, 2.62%, 3/15/2014 | 2,069,834 |
| 5,000,000 | 1 | Harley-Davidson Motorcycle Trust 2009-4, Class B, 3.19%, 9/15/2014 | 5,069,948 |
| 2,985,489 | 2,3 | Huntington Auto Trust 2009-1, Class A3, 3.94%, 6/17/2013 | 3,018,859 |
| 6,000,000 | 1,2,3 | Hyundai Capital Auto Funding, Ltd. 2010-8A, Class A, 1.214%, 9/20/2016 | 5,959,560 |
| 842,209 | 2,3 | MMCA Automobile Trust 2010-A, Class A2, 0.75%, 4/16/2012 | 842,374 |
| 2,000,000 | 2,3 | MMCA Automobile Trust 2010-A, Class B, 3.96%, 10/15/2015 | 2,055,903 |
| 9,000,000 | 1,2,3 | Mercedes-Benz Auto Lease Trust 2011-A, Class A4, 1.45%, 10/17/2016 | 9,064,336 |
| 1,116,632 | | Mercedes-Benz Auto Receivables Trust 2009-1, Class A3, 1.67%, 1/15/2014 | 1,126,787 |
| 3,518,615 | | Mercedes-Benz Auto Receivables Trust 2010-1, Class A2, 0.70%, 8/15/2012 | 3,522,717 |
Annual Shareholder Report20
Principal
Amount
or Shares | | | Value |
| $3,500,000 | 1,2,3 | Morgan Stanley Resecuritization Trust 2010-F, Class A, 0.466%, 6/17/2013 | 3,497,314 |
| 5,750,000 | 1,2,3 | Morgan Stanley Resecuritization Trust 2010-F, Class B, 0.466%, 6/17/2013 | 5,736,279 |
| 8,000,000 | 2,3 | Navistar Financial Corp. Owner Trust 2010-A, Class C, 6.16%, 5/18/2018 | 8,387,130 |
| 3,500,000 | 2,3 | Navistar Financial Corp. Owner Trust 2010-B, Class B, 2.60%, 4/20/2015 | 3,534,526 |
| 5,000,000 | 1 | Navistar Financial Dealer Note Master Trust 2009-1, Class C, 6.213%, 10/26/2015 | 5,307,914 |
| 3,750,000 | 1,2,3 | Navistar Financial Dealer Note Master Trust 2010-1, Class B, 2.713%, 1/26/2015 | 3,775,946 |
| 462,763 | | Nissan Auto Lease Trust 2009-A, Class A3, 2.92%, 12/15/2011 | 464,255 |
| 2,250,000 | 1 | Nissan Master Owner Trust Receivables 2010-AA, Class A, 1.369%, 1/15/2015 | 2,274,669 |
| 500,000 | 1 | Rental Car Finance Corp. 2006-1A, Class A, 0.393%, 5/25/2012 | 500,001 |
| 6,000,000 | 1,2,3 | SMART Series 2011-1US Trust, Class A2B, 0.971%, 4/14/2013 | 6,001,381 |
| 187,742 | | USAA Auto Owner Trust 2008-2, Class A3, 4.64%, 10/15/2012 | 188,337 |
| 366,709 | | USAA Auto Owner Trust 2009-1, Class A3, 3.02%, 6/17/2013 | 369,349 |
| 2,000,000 | | USAA Auto Owner Trust 2009-1, Class A4, 4.77%, 9/15/2014 | 2,079,594 |
| 1,530,455 | | USAA Auto Owner Trust 2009-2, Class A3, 1.54%, 2/18/2014 | 1,538,855 |
| 3,000,000 | | Volkswagen Auto Lease Trust 2010-A, Class A2, 0.69%, 11/22/2013 | 3,006,255 |
| 3,000,000 | | World Omni Automobile Lease Securitization Trust 2009-A, Class A4, 2.09%, 4/15/2015 | 3,028,668 |
| 4,000,000 | | World Omni Automobile Lease Securitization Trust 2011-A, Class A4, 1.78%, 9/15/2016 | 3,999,600 |
| 4,000,000 | | World Omni Automobile Lease Securitization Trust 2011-A, Class B, 2.10%, 12/15/2016 | 3,999,600 |
| 103,862 | 1 | World Omni Automobile Receivables Trust 2008-A, Class A3B, 1.519%, 10/15/2012 | 103,968 |
| | TOTAL | 192,700,561 |
| | Credit Card – 7.9% | |
| 6,000,000 | 1 | American Express Issuance Trust 2005-2, Class B, 0.499%, 8/15/2013 | 5,970,879 |
| 2,000,000 | | Bank of America Credit Card Trust 2007-A8, Class A8, 5.59%, 11/17/2014 | 2,104,999 |
| 8,000,000 | 1 | Bank of America Credit Card Trust 2007-C1, Class C1, 0.509%, 6/15/2014 | 7,973,427 |
| 2,224,000 | | Bank One Issuance Trust 2003-C3, Class C3, 4.77%, 2/16/2016 | 2,364,772 |
| 4,250,000 | 1 | Capital One Multi-Asset Execution Trust 2006-C1, Class C, 0.509%, 3/17/2014 | 4,251,578 |
Annual Shareholder Report21
Principal
Amount
or Shares | | | Value |
| $5,000,000 | 1 | Citibank Credit Card Issuance Trust 2004-B2, Class B2, 0.556%, 10/7/2013 | 4,997,526 |
| 5,500,000 | 1 | Citibank Credit Card Issuance Trust 2004-C1, Class C1, 0.869%, 7/15/2013 | 5,500,816 |
| 10,000,000 | 1 | Citibank Credit Card Issuance Trust 2005-C3, Class C3, 0.629%, 7/15/2014 | 9,929,756 |
| 7,875,000 | | Citibank Credit Card Issuance Trust 2006-C2, Class C2, 5.70%, 5/15/2013 | 8,003,039 |
| 2,600,000 | 1 | Citibank Credit Card Issuance Trust 2007-B5, Class B5, 0.856%, 11/7/2014 | 2,595,543 |
| 7,000,000 | | Citibank Credit Card Issuance Trust 2008-C6, Class C6, 6.30%, 6/20/2014 | 7,358,121 |
| 10,000,000 | 1,2,3 | Citibank Omni Master Trust 2009-A8, Class A8, 2.319%, 5/16/2016 | 10,146,151 |
| 7,000,000 | | MBNA Credit Card Master Note Trust 2002-C1, Class C1, 6.80%, 7/15/2014 | 7,258,394 |
| 6,000,000 | 1 | MBNA Credit Card Master Note Trust 2002-C3, Class C3, 1.569%, 10/15/2014 | 6,030,932 |
| 3,500,000 | 1 | MBNA Credit Card Master Note Trust 2004-B2, Class B2, 0.609%, 12/16/2013 | 3,500,449 |
| 2,000,000 | 1 | MBNA Credit Card Master Note Trust 2006-C1, Class C1, 0.639%, 7/15/2015 | 1,978,026 |
| 1,500,000 | 1 | National City Credit Card Master Trust 2008-3, Class A, 2.019%, 5/15/2013 | 1,501,521 |
| | TOTAL | 91,465,929 |
| | Equipment Lease – 2.8% | |
| 4,500,000 | | CIT Equipment Collateral 2010-VT1, Class A3, 2.41%, 5/15/2013 | 4,561,312 |
| 1,452,154 | 1,2,3 | CLI Funding LLC. 2006-1A A, Class A, 0.396%, 8/18/2021 | 1,362,913 |
| 614,603 | 1 | CNH Equipment Trust 2008-B, Class A4B, 2.119%, 12/15/2014 | 619,207 |
| 3,000,000 | | CNH Equipment Trust 2010-A, Class B, 4.04%, 3/25/2014 | 3,090,556 |
| 5,000,000 | 2,3 | GE Equipment Midticket LLC Series 2010-1, Class A3, 0.94%, 7/14/2014 | 4,978,125 |
| 3,334,242 | 2,3 | Great America Leasing Receivables 2009-1, Class A3, 2.54%, 3/15/2013 | 3,368,485 |
| 5,000,000 | 2,3 | Great America Leasing Receivables 2009-1, Class A4, 3.19%, 12/15/2013 | 5,150,348 |
| 1,500,000 | 2,3 | Great America Leasing Receivables 2009-1, Class B, 4.52%, 11/15/2014 | 1,575,863 |
| 3,100,000 | | Great America Leasing Receivables 2011-1, Class C, 3.38%, 2/15/2018 | 3,125,607 |
| 2,230,961 | | John Deere Owner Trust 2010-A, Class A2, 0.72%, 7/16/2012 | 2,231,820 |
| 2,500,000 | 2,3 | Volvo Financial Equipment LLC 2010-1A, Class B, 2.99%, 5/15/2017 | 2,531,062 |
| | TOTAL | 32,595,298 |
Annual Shareholder Report22
Principal
Amount
or Shares | | | Value |
| | Home Equity Loan – 1.8% | |
| $13,119 | 1,2,3,4 | 125 Home Loan Owner Trust 1998-1A, Class M2, 8.25%, 2/15/2029 | 10,971 |
| 1,148,881 | 1 | Asset Backed Funding Certificate 2005-OPT1, Class A2C, 0.573%, 7/25/2035 | 1,110,877 |
| 1,717,271 | 1 | Carrington Mortgage Loan Trust, Class A2, 0.313%, 5/25/2036 | 1,685,280 |
| 18,397 | 1 | ContiMortgage Home Equity Loan Trust 1996-4, Class A10, 0.699%, 1/15/2028 | 12,566 |
| 594,751 | 1 | Fifth Third Home Equity Loan Trust 2003-1, Class A, 0.463%, 9/20/2023 | 553,490 |
| 92,158 | 1 | First Franklin Mortgage Loan Asset Backed Certificates 2005-FF12, Class A2B, 0.473%, 11/25/2036 | 79,279 |
| 943,235 | 1 | GSAMP Trust 2004-SEA2, Class A1, 0.583%, 3/25/2034 | 920,274 |
| 2,469,944 | | Green Tree Home Improvement Loan Trust 1997-C, Class HEB2, 7.59%, 8/15/2028 | 1,589,697 |
| 1,000,000 | 1 | Morgan Stanley ABS Capital I 2004-OP1, Class M3, 0.893%, 11/25/2034 | 754,532 |
| 328,248 | 1,2,4,5 | NC Finance Trust 1999-1, Class D, 8.75%, 1/25/2029 | 43,027 |
| 126,692 | | New Century Home Equity Loan Trust 2003-5, Class AI4, 4.76%, 11/25/2033 | 124,506 |
| 999,991 | 1 | Opteum Mortgage Acceptance Corp. 2005-5, Class 2A1B, 5.64%, 12/25/2035 | 965,864 |
| 85,770 | 1 | Popular ABS Mortgage Pass-Through Trust 2005-3, Class AF3, 4.437%, 7/25/2035 | 86,363 |
| 169,164 | 1,2,3 | Quest Trust 2004 — X1, Class A, 0.543%, 3/25/2034 | 150,369 |
| 3,792,144 | 1 | Renaissance Home Equity Loan Trust 2005-3, Class AF3, 4.814%, 11/25/2035 | 3,806,625 |
| 2,520,748 | | Residential Asset Mortgage Products 2004-RS12, Class AI4, 4.62%, 3/25/2033 | 2,561,273 |
| 2,707,608 | 1 | Soundview Home Equity Loan Trust 2007-NS1, Class A1, 0.333%, 1/25/2037 | 2,682,775 |
| 144,800 | 1 | Structured Asset Securities Corp. 2005-4XS, Class 1A2B, 4.67%, 3/25/2035 | 144,031 |
| 1,105,610 | 1 | Structured Asset Securities Corp. 2006-WF1, Class A4, 0.383%, 2/25/2036 | 1,070,892 |
| 1,519,279 | 2,5,6 | Washington Mutual Asset-Backed Certificates NIM Notes 2007-WM1, Class N1, 6.75%, 1/25/2047 | 0 |
| 2,526,508 | 1 | Wells Fargo Home Equity Trust, 2006-1, Class A3, 0.363%, 5/25/2036 | 2,495,656 |
| | TOTAL | 20,848,347 |
| | Manufactured Housing – 0.1% | |
| 447,139 | | Green Tree Financial Corp. 1997-1, Class A5, 6.86%, 3/15/2028 | 449,543 |
| | Other – 3.3% | |
| 5,466,642 | 1,2,3 | Aircraft Lease Securitization Ltd. 2007-1A, Class G3, 0.496%, 5/10/2032 | 5,138,643 |
Annual Shareholder Report23
Principal
Amount
or Shares | | | Value |
| $5,486,624 | 2,3 | Bank of America Student Loan Trust 2010-1A, Class A, 1.074%, 4/25/2020 | 5,495,211 |
| 2,000,000 | 1 | CNH Wholesale Master Note Trust, Class 1A, 1.019%, 9/26/2016 | 2,001,756 |
| 1,500,000 | 1 | CNH Wholesale Master Note Trust, Class 1B, 1.869%, 9/26/2016 | 1,500,429 |
| 2,245,006 | 1 | Keycorp Student Loan Trust, Series 2005-A, Class 2A2, 0.439%, 3/27/2024 | 2,176,965 |
| 5,000,000 | 1 | PFS Financing Corp. 2010-CA, Class A, 1.619%, 2/15/2014 | 5,034,047 |
| 2,215,669 | 1 | SLM Student Loan Trust 2006-C, Class A2, 0.360%, 9/15/2020 | 2,206,551 |
| 3,059,422 | 1 | SLM Student Loan Trust 2010-C, Class A1, 1.869%, 12/15/2017 | 3,082,645 |
| 5,000,000 | 1 | SLM Student Loan Trust 2011-A, Class A1, 1.213%, 4/15/2015 | 5,000,000 |
| 1,617,716 | 2,3 | Sierra Receivables Funding Co. 2010-1A, Class A1, 4.48%, 7/20/2026 | 1,655,324 |
| 1,874,922 | 2,3 | Sierra Receivables Funding Co. 2010-2A, Class A, 3.84%, 11/20/2025 | 1,892,094 |
| 2,508,494 | 2,3 | Sierra Receivables Funding Co. 2010-3A, Class A, 3.51%, 11/20/2025 | 2,512,051 |
| | TOTAL | 37,695,716 |
| | TOTAL ASSET-BACKED SECURITIES
(IDENTIFIED COST $375,042,964) | 375,755,394 |
| | Collateralized Mortgage Obligations – 11.1% | |
| | Commercial Mortgage – 2.9% | |
| 705,142 | | Banc of America Commercial Mortgage, Inc. 2004-6, Class A2, 4.161%, 1/1/2041 | 707,931 |
| 6,035,000 | | Bank of America Commercial Mortgage, Inc. 2007-1, Class A3, 5.449%, 1/15/2049 | 6,316,458 |
| 2,750,000 | | Citigroup/Deutsche Bank Commercial Mortgage 2007-CD4, Class A2B, 5.205%, 12/11/2049 | 2,798,456 |
| 3,964,135 | 2,3 | Commercial Mortgage Pass-Through Certificates 2010-C1, Class A1, 3.156%, 7/10/2046 | 4,004,986 |
| 4,483,139 | 2,3 | DBUBS Mortgage Trust 2011-LC1A, Class A1, 3.742%, 11/10/2046 | 4,606,755 |
| 984,470 | | First Union Lehman Brothers Commercial Mortgage Trust 1997-C1, Class IO, 0.99%, 4/18/2029 | 34,216 |
| 4,339,549 | 2,3 | GS Mortgage Securities Corp. 2010-C1, Class A1, 3.679%, 8/3/2015 | 4,429,560 |
| 5,402,897 | 2,3 | JP Morgan Chase Commercial Mortgage Securities 2010-C1, Class A1, 3.853%, 6/15/2043 | 5,614,202 |
| 2,907,700 | 2,3 | Morgan Stanley Capital I 2011-C1, Class A1, 2.602%, 9/15/2047 | 2,961,613 |
| 2,500,000 | 1 | Morgan Stanley Capital, Inc. 2007-T27, Class A2, 5.795%, 6/13/2042 | 2,563,369 |
| | TOTAL | 34,037,546 |
| | Federal Home Loan Mortgage Corporation – 1.9% | |
| 2,970 | | Federal Home Loan Mortgage Corp. REMIC 141 D, 5.00%, 5/15/2021 | 3,157 |
| 38,185 | | Federal Home Loan Mortgage Corp. REMIC 1595 D, 7.00%, 10/15/2013 | 39,862 |
| 68,381 | | Federal Home Loan Mortgage Corp. REMIC 1686 PJ, 5.00%, 2/15/2024 | 72,288 |
Annual Shareholder Report24
Principal
Amount
or Shares | | | Value |
| $84,165 | | Federal Home Loan Mortgage Corp. REMIC 2091 PG, 6.00%, 11/15/2028 | 93,032 |
| 79,283 | | Federal Home Loan Mortgage Corp. REMIC 2345 PQ, 6.50%, 8/15/2016 | 85,812 |
| 752,105 | 1 | Federal Home Loan Mortgage Corp. REMIC 2571 FB, 0.569%, 2/15/2018 | 756,785 |
| 143,637 | | Federal Home Loan Mortgage Corp. REMIC 2632 A, 4.00%, 1/15/2018 | 149,303 |
| 211,821 | | Federal Home Loan Mortgage Corp. REMIC 2647 A, 3.25%, 4/15/2032 | 218,609 |
| 209,159 | | Federal Home Loan Mortgage Corp. REMIC 2694 BA, 4.00%, 6/15/2031 | 219,043 |
| 284,622 | | Federal Home Loan Mortgage Corp. REMIC 2756 NA, 5.00%, 2/15/2024 | 307,946 |
| 759,546 | 1 | Federal Home Loan Mortgage Corp. REMIC 3152 WF, 0.679%, 2/15/2034 | 759,275 |
| 4,014,961 | 1 | Federal Home Loan Mortgage Corp. REMIC 3317 F, 0.619%, 7/15/2036 | 3,999,490 |
| 1,866,649 | 1 | Federal Home Loan Mortgage Corp. REMIC 3542 NF, 0.969%, 7/15/2036 | 1,885,271 |
| 9,949,205 | | Federal Home Loan Mortgage Corp. REMIC K701 A1, 2.776%, 6/25/2017 | 10,191,720 |
| 2,508,103 | 1 | Federal Home Loan Mortgage Corp. REMIC MS 1128 F, 1.129%, 7/15/2037 | 2,551,672 |
| 230,260 | 1 | Federal Home Loan Mortgage Corp. REMIC T-51 1A, 6.50%, 9/25/2043 | 252,319 |
| | TOTAL | 21,585,584 |
| | Federal National Mortgage Association – 1.8% | |
| 151,033 | | Federal National Mortgage Association REMIC 1990-28 X, 9.00%, 3/25/2020 | 177,633 |
| 4,027 | | Federal National Mortgage Association REMIC 1991-141 PZ, 8.00%, 10/25/2021 | 4,581 |
| 90,059 | | Federal National Mortgage Association REMIC 1992-162 D, 7.00%, 9/25/2022 | 100,303 |
| 84,963 | 1 | Federal National Mortgage Association REMIC 1993-113 SB, 9.749%, 7/25/2023 | 97,144 |
| 5,849 | 1 | Federal National Mortgage Association REMIC 1993-179 FO, 4.000%, 10/25/2023 | 6,030 |
| 22,918 | | Federal National Mortgage Association REMIC 1993-32 H, 6.00%, 3/25/2023 | 25,151 |
| 45,574 | | Federal National Mortgage Association REMIC 1993-49 H, 7.00%, 4/25/2013 | 46,841 |
| 555,471 | | Federal National Mortgage Association REMIC 1997-81 PD, 6.35%, 12/18/2027 | 625,312 |
| 56,605 | | Federal National Mortgage Association REMIC 2002-43 B, 6.00%, 7/25/2017 | 61,036 |
Annual Shareholder Report25
Principal
Amount
or Shares | | | Value |
| $275,587 | 1 | Federal National Mortgage Association REMIC 2002-52 FG, 0.713%, 9/25/2032 | 278,132 |
| 83,350 | | Federal National Mortgage Association REMIC 2003-35 UC, 3.75%, 5/25/2033 | 86,183 |
| 50,077 | 1 | Federal National Mortgage Association REMIC 2003-47 FP, 0.563%, 9/25/2032 | 50,265 |
| 144,215 | | Federal National Mortgage Association REMIC 2003-49 JE, 3.00%, 4/25/2033 | 146,929 |
| 2,053,392 | 1 | Federal National Mortgage Association REMIC 2006-44 FK, 0.643%, 6/25/2036 | 2,050,467 |
| 8,891,675 | 1 | Federal National Mortgage Association REMIC 2007-97 FE, 0.663%, 7/25/2037 | 8,909,285 |
| 1,896,371 | 1 | Federal National Mortgage Association REMIC 2008-69 FB, 1.213%, 6/25/2037 | 1,935,387 |
| 2,320,816 | 1 | Federal National Mortgage Association REMIC 2009-42 FG, 1.013%, 5/25/2039 | 2,339,738 |
| 658,871 | 1 | Federal National Mortgage Association REMIC 2009-63 FB, 0.713%, 8/25/2039 | 661,734 |
| 2,304,464 | 1 | Federal National Mortgage Association REMIC 2009-69 F, 1.063%, 4/25/2037 | 2,340,213 |
| 58,007 | | Federal National Mortgage Association REMIC G-41 PT, 7.50%, 10/25/2021 | 59,140 |
| 171,345 | | Federal National Mortgage Association REMIC G92-44 ZQ, 8.00%, 7/25/2022 | 191,142 |
| 130,746 | | Federal National Mortgage Association REMIC G92-54 ZQ, 7.50%, 9/25/2022 | 148,753 |
| | TOTAL | 20,341,399 |
| | Government Agency – 0.5% | |
| 3,445,092 | | National Credit Union Administration Guaranteed Notes 2010-C1, Class A1, 1.60%, 10/29/2020 | 3,398,799 |
| 1,944,763 | 1 | National Credit Union Administration Guaranteed Notes 2011-R1, Class 1A, 0.690%, 1/8/2020 | 1,947,193 |
| | TOTAL | 5,345,992 |
| | Non-Agency Mortgage – 4.0% | |
| 445,327 | 1 | American Home Mortgage Investment Trust 2004-3, Class 6A4, 5.01%, 10/25/2034 | 454,638 |
| 5,000,000 | 1,2,3 | Arran Residential Mortgages Funding Series 2011-1A, Class A1C, 2.624%, 11/19/2047 | 4,997,569 |
| 33,889 | 1 | Banc of America Mortgage Securities 2003-B, Class 2A2, 2.897%, 3/25/2033 | 31,790 |
| 169,810 | 1,2 | C-BASS ABS LLC Series 1999-3, Class B1, 6.629%, 2/3/2029 | 59,593 |
| 752,002 | 1 | Chaseflex Trust 2006-1, Class A2A, 5.935%, 6/25/2036 | 729,223 |
Annual Shareholder Report26
Principal
Amount
or Shares | | | Value |
| $85,939 | | Citicorp Mortgage Securities, Inc. 2004-5, Class 4A1, 5.25%, 8/25/2034 | 86,418 |
| 92,536 | | Countrywide Alternative Loan Trust 2003-J3, Class 2A1, 6.25%, 12/25/2033 | 97,058 |
| 116,907 | 1,2 | Greenwich Capital Acceptance 1991-4, Class B1A, 6.245%, 7/1/2019 | 75,990 |
| 6,000,000 | 1,2,3 | Holmes Master Issuer PLC 2010-1A, Class A2, 1.678%, 10/15/2054 | 6,013,871 |
| 4,000,000 | 1,2,3 | Holmes Master Issuer PLC 2011-1A, Class A2, 1.641%, 10/15/2054 | 4,004,278 |
| 2,000,000 | 1 | Indymac Index Mortgage Loan Trust 2007-FLX1, Class A4, 0.483%, 2/25/2037 | 274,385 |
| 22,858 | | Master Asset Securitization Trust 2003-6, Class 9A1, 4.25%, 7/25/2033 | 22,769 |
| 4,000,000 | 1,2,3 | Permanent Master Issuer PLC 2011-1A, Class 1A1, 1.000%, 7/15/2042 | 4,005,338 |
| 4,750,000 | 1,2,3 | Permanent Master Issuer Trust 2010-1, Class 1A, 1.428%, 7/15/2042 | 4,727,470 |
| 404,426 | 1 | Residential Accredit Loans, Inc. 2004-QA4, Class NB1, 7.387%, 9/25/2034 | 342,179 |
| 187,374 | | Ryland Mortgage Securities Corp. Four, Class E, 8.95%, 6/1/2017 | 208,756 |
| 24,380 | 2 | SMFC Trust Asset-Backed Certificates, 1997-A, Class 4, 3.004%, 1/28/2027 | 20,388 |
| 2,189,922 | 1 | Sequoia Mortgage Trust 2010-H1, Class A1, 3.75%, 2/25/2040 | 2,221,031 |
| 6,805,449 | 1 | Sequoia Mortgage Trust 2011-1, Class A1, 4.125%, 2/25/2041 | 6,840,252 |
| 9,000,000 | 1,2,3 | Silverstone Master Issuer 2010-1A, Class A1, 1.674%, 1/21/2055 | 9,022,051 |
| 445,514 | | Vendee Mortgage Trust 1994-3A, Class 1ZB, 6.50%, 9/15/2024 | 506,999 |
| 1,129,526 | 1 | Washington Mutual 2006-AR15, Class 1A, 1.146%, 11/25/2046 | 759,999 |
| 1,179,566 | 1 | Washington Mutual 2006-AR17, Class 1A, 1.126%, 12/25/2046 | 791,936 |
| 108,586 | 1 | Wells Fargo Mortgage Backed Securities Trust 2004-I, Class 1A1, 2.880%, 7/25/2034 | 108,333 |
| | TOTAL | 46,402,314 |
| | TOTAL COLLATERALIZED MORTGAGE OBLIGATIONS
(IDENTIFIED COST $129,416,067) | 127,712,835 |
| | Corporate Bonds – 29.2% | |
| | Basic Industry - Chemicals – 0.6% | |
| 1,000,000 | | Dow Chemical Co., Sr. Unsecd. Note, 4.85%, 8/15/2012 | 1,046,846 |
| 417,000 | | Du Pont (E.I.) de Nemours & Co., 5.00%, 1/15/2013 | 445,642 |
| 3,500,000 | 2,3 | Incitec Pivot Finance LLC, Company Guarantee, 4.00%, 12/7/2015 | 3,549,042 |
| 1,000,000 | | Praxair, Inc., Note, 4.375%, 3/31/2014 | 1,079,784 |
| 1,000,000 | | Rohm & Haas Co., 5.60%, 3/15/2013 | 1,075,903 |
| | TOTAL | 7,197,217 |
| | Basic Industry - Metals & Mining – 1.2% | |
| 4,000,000 | 2,3 | Anglo American Capital PLC, Company Guarantee, 2.15%, 9/27/2013 | 4,034,926 |
| 2,000,000 | | ArcelorMittal USA, Inc., Company Guarantee, 6.50%, 4/15/2014 | 2,225,488 |
Annual Shareholder Report27
Principal
Amount
or Shares | | | Value |
| $1,000,000 | | ArcelorMittal, Sr. Unsecd. Note, 5.375%, 6/1/2013 | 1,069,979 |
| 2,000,000 | | Barrick Gold Financeco LLC, Company Guarantee, 6.125%, 9/15/2013 | 2,228,493 |
| 4,000,000 | 2,3 | Hyundai Steel Co., Sr. Unsecd. Note, Series 144A, 4.625%, 4/21/2016 | 4,083,344 |
| | TOTAL | 13,642,230 |
| | Capital Goods - Aerospace & Defense – 0.4% | |
| 3,585,000 | | Boeing Co., Sr. Unsecd. Note, 1.875%, 11/20/2012 | 3,655,327 |
| 375,000 | | Lockheed Martin Corp., Sr. Note, 4.121%, 3/14/2013 | 397,279 |
| | TOTAL | 4,052,606 |
| | Capital Goods - Diversified Manufacturing – 0.5% | |
| 2,500,000 | 1 | General Electric Capital Corp., Floating Rate Note, 0.434%, 11/1/2012 | 2,495,331 |
| 1,000,000 | | Ingersoll-Rand Global Holding Co. Ltd., 9.50%, 4/15/2014 | 1,207,245 |
| 2,000,000 | | Textron Financial Corp., 5.40%, 4/28/2013 | 2,110,544 |
| | TOTAL | 5,813,120 |
| | Communications - Media & Cable – 0.7% | |
| 1,000,000 | | Comcast Corp., Company Guarantee, 5.85%, 11/15/2015 | 1,127,094 |
| 4,530,000 | | DIRECTV Holdings LLC, Company Guarantee, 3.50%, 3/1/2016 | 4,608,515 |
| 2,000,000 | | Time Warner Cable, Inc., Sr. Unsecd. Note, 5.40%, 7/2/2012 | 2,105,493 |
| | TOTAL | 7,841,102 |
| | Communications - Media Noncable – 0.1% | |
| 1,500,000 | | News America Holdings, Inc., Sr. Deb., 9.25%, 2/1/2013 | 1,704,821 |
| | Communications - Telecom Wireless – 0.6% | |
| 500,000 | | Cellco Partnership/Verizon Wireless Capital LLC, Sr. Unsecd. Note, 3.75%, 5/20/2011 | 500,767 |
| 1,250,000 | | Cellco Partnership/Verizon Wireless Capital LLC, Sr. Unsecd. Note, 5.55%, 2/1/2014 | 1,379,858 |
| 3,000,000 | 2,3 | SBA Tower Trust, Series 144A, 4.254%, 4/15/2015 | 3,097,540 |
| 930,000 | | Vodafone Group PLC, 5.35%, 2/27/2012 | 966,463 |
| 1,000,000 | | Vodafone Group PLC, Note, 5.375%, 1/30/2015 | 1,111,342 |
| | TOTAL | 7,055,970 |
| | Communications - Telecom Wirelines – 1.2% | |
| 1,000,000 | | AT&T Corp., Sr. Note, 7.30%, 11/15/2011 | 1,035,971 |
| 5,500,000 | | AT&T, Inc., Sr. Unsecd. Note, 2.95%, 5/15/2016 | 5,535,424 |
| 2,000,000 | | Deutsche Telekom International Finance BV, 5.25%, 7/22/2013 | 2,171,422 |
| 1,500,000 | | Rogers Communications, Inc., 5.50%, 3/15/2014 | 1,653,750 |
| 2,000,000 | | Telecom Italia Capital SA, Company Guarantee, 5.25%, 11/15/2013 | 2,135,645 |
| 1,000,000 | | Telefonica SA, Sr. Note, 5.855%, 2/4/2013 | 1,070,551 |
| | TOTAL | 13,602,763 |
Annual Shareholder Report28
Principal
Amount
or Shares | | | Value |
| | Consumer Cyclical - Automotive – 1.5% | |
| $6,000,000 | 1,2,3 | Daimler Finance NA LLC, Floating Rate Note — Sr. Note, Series 144A, 0.919%, 3/28/2014 | 6,000,951 |
| 1,250,000 | | DaimlerChrysler North America Holding Corp., 6.50%, 11/15/2013 | 1,399,960 |
| 3,000,000 | | Johnson Controls, Inc., Sr. Unsecd. Note, 4.875%, 9/15/2013 | 3,243,983 |
| 2,000,000 | 2,3 | Nissan Motor Acceptance Corp., Note, Series 144A, 3.25%, 1/30/2013 | 2,047,969 |
| 5,000,000 | 2,3 | Volkswagen International Finance NV, Sr. Unsecd. Note, 1.625%, 8/12/2013 | 5,037,198 |
| | TOTAL | 17,730,061 |
| | Consumer Cyclical - Entertainment – 0.1% | |
| 500,000 | | Walt Disney Co., Note, 6.375%, 3/1/2012 | 525,357 |
| 1,000,000 | | Walt Disney Co., Sr. Unsecd. Note, 5.70%, 7/15/2011 | 1,010,877 |
| | TOTAL | 1,536,234 |
| | Consumer Cyclical - Retailers – 0.4% | |
| 2,260,000 | | CVS Caremark Corp., Sr. Note, 5.75%, 8/15/2011 | 2,294,620 |
| 1,000,000 | | Costco Wholesale Corp., 5.30%, 3/15/2012 | 1,043,580 |
| 665,000 | | Wal-Mart Stores, Inc., 4.25%, 4/15/2013 | 709,958 |
| 1,000,000 | | Wal-Mart Stores, Inc., Note, 4.55%, 5/1/2013 | 1,075,050 |
| | TOTAL | 5,123,208 |
| | Consumer Cyclical - Services – 0.7% | |
| 2,000,000 | | eBay, Inc., Sr. Unsecd. Note, 0.875%, 10/15/2013 | 1,995,619 |
| 5,000,000 | | Expedia, Inc., Company Guarantee, 8.50%, 7/1/2016 | 5,575,000 |
| | TOTAL | 7,570,619 |
| | Consumer Non-Cyclical - Food/Beverage – 1.7% | |
| 1,000,000 | 2,3 | Bacardi Ltd., Sr. Note, 7.45%, 4/1/2014 | 1,160,661 |
| 2,500,000 | | Bottling Group LLC, Company Guarantee, 4.625%, 11/15/2012 | 2,648,423 |
| 1,000,000 | | Bottling Group LLC, Company Guarantee, 6.95%, 3/15/2014 | 1,158,097 |
| 2,800,000 | | Dr. Pepper Snapple Group, Inc., Company Guarantee, 1.70%, 12/21/2011 | 2,820,749 |
| 700,000 | | Dr. Pepper Snapple Group, Inc., Company Guarantee, 2.35%, 12/21/2012 | 715,025 |
| 1,500,000 | | General Mills, Inc., 5.65%, 9/10/2012 | 1,596,788 |
| 1,500,000 | | Kellogg Co., 4.25%, 3/6/2013 | 1,573,854 |
| 1,000,000 | | Kraft Foods, Inc., 5.625%, 11/1/2011 | 1,024,172 |
| 2,300,000 | | Kraft Foods, Inc., Note, 6.25%, 6/1/2012 | 2,434,582 |
| 1,425,000 | 2,3 | Miller Brewing Co., Note, 5.50%, 8/15/2013 | 1,556,840 |
| 1,000,000 | 2,3 | SABMiller PLC, Note, 6.20%, 7/1/2011 | 1,008,558 |
| 1,250,000 | | The Coca-Cola Co., Sr. Unsecd. Note, 3.625%, 3/15/2014 | 1,333,439 |
| | TOTAL | 19,031,188 |
Annual Shareholder Report29
Principal
Amount
or Shares | | | Value |
| | Consumer Non-Cyclical - Health Care – 0.2% | |
| $500,000 | | Boston Scientific Corp., 4.50%, 1/15/2015 | 524,957 |
| 725,000 | | Covidien International Finance SA, 5.45%, 10/15/2012 | 772,044 |
| 1,000,000 | | Life Technologies Corp., Sr. Note, 3.375%, 3/1/2013 | 1,030,087 |
| | TOTAL | 2,327,088 |
| | Consumer Non-Cyclical - Pharmaceuticals – 0.6% | |
| 1,500,000 | | Eli Lilly & Co., 4.20%, 3/6/2014 | 1,618,884 |
| 1,250,000 | | Pfizer, Inc., Sr. Unsecd. Note, 4.45%, 3/15/2012 | 1,293,655 |
| 4,000,000 | | Teva Pharmaceutical Finance III LLC, Company Guarantee, 1.50%, 6/15/2012 | 4,038,952 |
| | TOTAL | 6,951,491 |
| | Consumer Non-Cyclical - Products – 0.3% | |
| 1,250,000 | | Philips Electronics NV, 4.625%, 3/11/2013 | 1,327,145 |
| 900,000 | | Philips Electronics NV, Sr. Unsecd. Note, 7.25%, 8/15/2013 | 1,012,629 |
| 1,000,000 | | Whirlpool Corp., Note, 8.00%, 5/1/2012 | 1,062,941 |
| | TOTAL | 3,402,715 |
| | Consumer Non-Cyclical - Supermarkets – 0.2% | |
| 1,170,000 | | Kroger Co., 5.00%, 4/15/2013 | 1,254,228 |
| 700,000 | | Kroger Co., Company Guarantee, 6.20%, 6/15/2012 | 741,640 |
| | TOTAL | 1,995,868 |
| | Consumer Non-Cyclical - Tobacco – 0.3% | |
| 1,250,000 | | Altria Group, Inc., Company Guarantee, 7.75%, 2/6/2014 | 1,447,004 |
| 2,000,000 | | Altria Group, Inc., Company Guarantee, 8.50%, 11/10/2013 | 2,340,606 |
| | TOTAL | 3,787,610 |
| | Energy - Independent – 0.6% | |
| 3,500,000 | | Canadian Natural Resources Ltd., Sr. Unsecd. Note, 5.15%, 2/1/2013 | 3,739,250 |
| 1,250,000 | | Devon Financing Corp., Company Guarantee, 6.875%, 9/30/2011 | 1,282,186 |
| 2,134,000 | | XTO Energy, Inc., 7.50%, 4/15/2012 | 2,278,790 |
| | TOTAL | 7,300,226 |
| | Energy - Integrated – 1.6% | |
| 5,000,000 | | BP Capital Markets PLC, Company Guarantee, 3.20%, 3/11/2016 | 5,051,065 |
| 3,800,000 | 2,3 | CNPC Hong Kong Overseas Capital Ltd., Company Guarantee, Series 144A, 3.125%, 4/28/2016 | 3,817,827 |
| 2,000,000 | | Husky Energy, Inc., Sr. Unsecd. Note, 6.25%, 6/15/2012 | 2,117,770 |
| 166,800 | 2,3 | Qatar Petroleum, 5.579%, 5/30/2011 | 167,253 |
| 2,500,000 | 1 | Shell International Finance B.V., Company Guarantee, 0.659%, 6/22/2012 | 2,513,194 |
| 3,000,000 | | Shell International Finance B.V., Company Guarantee, 3.10%, 6/28/2015 | 3,115,526 |
Annual Shareholder Report30
Principal
Amount
or Shares | | | Value |
| $2,000,000 | | Statoil ASA, 2.90%, 10/15/2014 | 2,087,959 |
| | TOTAL | 18,870,594 |
| | Energy - Oil Field Services – 0.3% | |
| 1,250,000 | | ConocoPhillips, Mtg. Note, 4.75%, 2/1/2014 | 1,365,280 |
| 2,000,000 | | Weatherford International, Inc., Company Guarantee, 5.95%, 6/15/2012 | 2,100,822 |
| | TOTAL | 3,466,102 |
| | Energy - Refining – 0.1% | |
| 1,500,000 | | Valero Energy Corp., 6.875%, 4/15/2012 | 1,584,933 |
| | Financial Institution - Banking – 4.7% | |
| 1,200,000 | | Associated Banc-Corp., Sr. Unsecd. Note, 5.125%, 3/28/2016 | 1,224,601 |
| 1,000,000 | 1,2,3 | Barclays Bank PLC, 7.375%, 6/15/2049 | 1,014,954 |
| 4,250,000 | 1,2,3 | Barclays Bank PLC, Bond, 8.55%, 9/29/2049 | 4,271,282 |
| 1,500,000 | | Capital One Financial Corp., Sr. Note, 5.70%, 9/15/2011 | 1,527,353 |
| 1,000,000 | | Citigroup, Inc., 5.50%, 4/11/2013 | 1,071,353 |
| 2,000,000 | | Citigroup, Inc., Sr. Unsecd. Note, 5.30%, 10/17/2012 | 2,111,616 |
| 2,000,000 | | Citigroup, Inc., Sr. Unsecd. Note, 6.00%, 12/13/2013 | 2,190,469 |
| 2,500,000 | 2,3 | Commonwealth Bank of Australia, Sr. Unsecd. Note, Series 144A, 2.75%, 10/15/2012 | 2,552,371 |
| 2,000,000 | | Goldman Sachs Group, Inc., Sr. Unsecd. Note, 5.25%, 10/15/2013 | 2,160,591 |
| 1,000,000 | | Goldman Sachs Group, Inc., Sr. Unsecd. Note, 5.30%, 2/14/2012 | 1,038,014 |
| 2,000,000 | | Goldman Sachs Group, Inc., Sr. Unsecd. Note, 5.45%, 11/1/2012 | 2,124,783 |
| 2,000,000 | | J.P. Morgan Chase & Co., 5.375%, 10/1/2012 | 2,122,502 |
| 3,000,000 | 1 | J.P. Morgan Chase & Co., Floating Rate Note — Sr. Note, 1.023%, 5/2/2014 | 3,004,500 |
| 1,000,000 | | J.P. Morgan Chase & Co., Sr. Unsecd. Note, 5.60%, 6/1/2011 | 1,003,706 |
| 3,000,000 | 1 | Morgan Stanley, Floating Rate Note — Sr. Note, 1.874%, 1/24/2014 | 3,039,736 |
| 2,500,000 | | Morgan Stanley, Note, 5.625%, 1/9/2012 | 2,587,130 |
| 2,625,000 | 2,3 | Nordea Bank AB, Sr. Unsecd. Note, 2.50%, 11/13/2012 | 2,679,903 |
| 2,000,000 | 2,3 | Nordea Bank Sweden AB, Sub. Note, 5.25%, 11/30/2012 | 2,110,041 |
| 1,000,000 | | Northern Trust Corp., 4.625%, 5/1/2014 | 1,090,512 |
| 1,000,000 | | PNC Funding Corp., Sr. Unsecd. Note, 5.40%, 6/10/2014 | 1,107,075 |
| 2,000,000 | | State Street Corp., Sr. Note, 4.30%, 5/30/2014 | 2,153,778 |
| 1,400,000 | | U.S. Bank, N.A., 6.375%, 8/1/2011 | 1,420,107 |
| 2,000,000 | | US Bancorp, 4.20%, 5/15/2014 | 2,147,762 |
| 1,000,000 | | US Bancorp, Sr. Note, 2.125%, 2/15/2013 | 1,020,295 |
| 1,350,000 | | Wells Fargo & Co., Sr. Unsecd. Note, 5.30%, 8/26/2011 | 1,370,426 |
| 3,000,000 | | Wells Fargo & Co., Sub. Note, 4.95%, 10/16/2013 | 3,223,449 |
Annual Shareholder Report31
Principal
Amount
or Shares | | | Value |
| $2,500,000 | 2,3 | Westpac Securities NZ Ltd., Company Guarantee, 2.625%, 1/28/2013 | 2,550,461 |
| | TOTAL | 53,918,770 |
| | Financial Institution - Brokerage – 0.2% | |
| 2,750,000 | | BlackRock, Inc., Sr. Unsecd. Note, 2.25%, 12/10/2012 | 2,811,559 |
| | Financial Institution - Finance Noncaptive – 1.9% | |
| 1,250,000 | | American Express Credit Corp., 5.875%, 5/2/2013 | 1,355,346 |
| 1,000,000 | | American Express Credit Corp., 7.30%, 8/20/2013 | 1,123,867 |
| 2,000,000 | | Berkshire Hathaway, Inc., Sr. Unsecd. Note, 2.125%, 2/11/2013 | 2,048,519 |
| 4,000,000 | | General Electric Capital Corp., 6.00%, 6/15/2012 | 4,240,186 |
| 3,000,000 | 1 | General Electric Capital Corp., Floating Rate Note — Sr. Note, 1.144%, 1/7/2014 | 3,024,101 |
| 1,250,000 | | General Electric Capital Corp., Sr. Unsecd. Note, 5.45%, 1/15/2013 | 1,338,054 |
| 3,000,000 | | HSBC Finance Corp., Sr. Unsecd. Note, 6.75%, 5/15/2011 | 3,005,757 |
| 1,000,000 | | HSBC Finance Corp., Sr. Unsecd. Note, 7.00%, 5/15/2012 | 1,062,763 |
| 4,000,000 | | MBNA Corp., Note, 6.125%, 3/1/2013 | 4,288,609 |
| | TOTAL | 21,487,202 |
| | Financial Institution - Insurance - Health – 0.3% | |
| 500,000 | | Aetna US Healthcare, 5.75%, 6/15/2011 | 503,123 |
| 1,750,000 | | Anthem, Inc., 6.80%, 8/1/2012 | 1,875,381 |
| 1,000,000 | 1 | HSB Group, Inc., Company Guarantee, 1.188%, 7/15/2027 | 806,250 |
| | TOTAL | 3,184,754 |
| | Financial Institution - Insurance - Life – 1.0% | |
| 3,580,000 | | American International Group, Inc., Sr. Unsecd. Note, 3.65%, 1/15/2014 | 3,674,292 |
| 4,000,000 | 1 | MetLife, Inc., Floating Rate Note - Sr. Note, 1.561%, 8/6/2013 | 4,054,806 |
| 2,000,000 | 1,2,3 | New York Life Global Funding, Floating Rate Note — Sr. Secured Note, Series 144A, 0.563%, 4/4/2014 | 2,001,428 |
| 1,000,000 | | Prudential Financial, Inc., 5.15%, 1/15/2013 | 1,057,987 |
| 800,000 | | Prudential Financial, Inc., Sr. Unsecd. Note, 3.625%, 9/17/2012 | 825,908 |
| | TOTAL | 11,614,421 |
| | Financial Institution - Insurance - P&C – 0.1% | |
| 1,100,000 | | The Travelers Cos. Inc., Sr. Unsecd. Note, 5.375%, 6/15/2012 | 1,154,768 |
| | Financial Institution - REITs – 1.0% | |
| 1,750,000 | | Avalonbay Communities, Inc., Sr. Unsecd. Note, 5.375%, 4/15/2014 | 1,911,578 |
| 5,000,000 | | Health Care REIT, Inc., Sr. Unsecd. Note, 6.00%, 11/15/2013 | 5,473,815 |
| 1,300,000 | | Simon Property Group LP, 6.75%, 5/15/2014 | 1,472,077 |
| 2,000,000 | | Simon Property Group LP, Sr. Unsecd. Note, 5.30%, 5/30/2013 | 2,160,060 |
| | TOTAL | 11,017,530 |
Annual Shareholder Report32
Principal
Amount
or Shares | | | Value |
| | Technology – 1.5% | |
| $7,850,000 | 1 | Cisco Systems, Inc., Floating Rate Note — Sr. Note, 0.559%, 3/14/2014 | 7,885,034 |
| 1,250,000 | | Dell, Inc., 4.70%, 4/15/2013 | 1,332,798 |
| 1,000,000 | | Hewlett-Packard Co., 4.25%, 2/24/2012 | 1,032,968 |
| 1,000,000 | | Hewlett-Packard Co., Note, 5.25%, 3/1/2012 | 1,041,027 |
| 2,000,000 | | Hewlett-Packard Co., Sr. Unsecd. Note, 1.25%, 9/13/2013 | 2,010,033 |
| 2,000,000 | | Microsoft Corp., Sr. Note, 0.875%, 9/27/2013 | 2,000,479 |
| 1,000,000 | | Microsoft Corp., Sr. Note, 1.625%, 9/25/2015 | 987,769 |
| 1,250,000 | | Oracle Corp., 4.95%, 4/15/2013 | 1,348,853 |
| | TOTAL | 17,638,961 |
| | Transportation - Services – 0.8% | |
| 3,500,000 | 2,3 | Enterprise Rent-A-Car USA Finance Co., Company Guarantee, Series 144A, 5.80%, 10/15/2012 | 3,717,482 |
| 5,000,000 | | Ryder System, Inc., Sr. Unsecd. Note, (Series MTN), 3.60%, 3/1/2016 | 5,106,584 |
| | TOTAL | 8,824,066 |
| | Utility - Diversified – 0.2% | |
| 2,000,000 | | P G & E Corp., 5.75%, 4/1/2014 | 2,200,965 |
| | Utility - Electric – 2.0% | |
| 2,000,000 | | Dominion Resources, Inc., Sr. Unsecd. Note, 1.80%, 3/15/2014 | 2,008,736 |
| 1,000,000 | | Duke Energy Corp., Sr. Unsecd. Note, 3.95%, 9/15/2014 | 1,056,475 |
| 500,000 | | Duke Energy Ohio, Inc., 1st Mtg. Bond, 2.10%, 6/15/2013 | 511,596 |
| 1,000,000 | 2,3 | Electricite De France SA, 5.50%, 1/26/2014 | 1,100,469 |
| 1,000,000 | 2,3 | Enel Finance International SA, Company Guarantee, 3.875%, 10/7/2014 | 1,044,282 |
| 2,000,000 | | FirstEnergy Solutions Corp., Company Guarantee, 4.80%, 2/15/2015 | 2,123,628 |
| 1,500,000 | | MidAmerican Energy Holdings Co., Sr. Unsecd. Note, 3.15%, 7/15/2012 | 1,541,796 |
| 1,250,000 | | National Rural Utilities Cooperative Finance Corp., Collateral Trust, 2.625%, 9/16/2012 | 1,281,941 |
| 2,000,000 | | National Rural Utilities Cooperative Finance Corp., Collateral Trust, 5.50%, 7/1/2013 | 2,186,632 |
| 2,280,000 | | PPL Energy Supply LLC, Sr. Unsecd. Note, 6.30%, 7/15/2013 | 2,494,678 |
| 4,000,000 | 2,3 | PPL WEM Holdings PLC, Sr. Unsecd. Note, Series 144A, 3.90%, 5/1/2016 | 4,068,100 |
| 1,500,000 | | PSEG Power LLC, Company Guarantee, 2.50%, 4/15/2013 | 1,531,425 |
| 1,839,000 | | Southern Power Co., Sr. Unsecd. Note, 6.25%, 7/15/2012 | 1,946,818 |
| | TOTAL | 22,896,576 |
| | Utility - Natural Gas Distributor – 1.1% | |
| 2,800,000 | | Atmos Energy Corp., 5.125%, 1/15/2013 | 2,948,528 |
Annual Shareholder Report33
Principal
Amount
or Shares | | | Value |
| $9,500,000 | 1 | Sempra Energy, Floating Rate Note — Sr. Note, 1.069%, 3/15/2014 | 9,547,705 |
| | TOTAL | 12,496,233 |
| | Utility - Natural Gas Pipelines – 0.5% | |
| 4,000,000 | | Consolidated Natural Gas Co., 6.25%, 11/1/2011 | 4,115,599 |
| 1,000,000 | | Spectra Energy Capital LLC, Sr. Unsecd. Note, 5.668%, 8/15/2014 | 1,106,182 |
| | TOTAL | 5,221,781 |
| | TOTAL CORPORATE BONDS
(IDENTIFIED COST $327,875,845) | 336,055,352 |
| | GOVERNMENT AGENCIES – 0.9% | |
| | Federal Home Loan Mortgage Corporation – 0.9% | |
| 10,000,000 | | Federal Home Loan Mortgage Corp., 3.875%, 6/29/2011
(IDENTIFIED COST $10,002,187) | 10,063,086 |
| | Mortgage-Backed Securities – 0.0% | |
| | Federal Home Loan Mortgage Corporation – 0.0% | |
| 27,512 | | Federal Home Loan Mortgage Corp., Pool A01858, 8.50%, 7/1/2021 | 30,837 |
| 31,428 | | Federal Home Loan Mortgage Corp., Pool C90493, 6.50%, 11/1/2021 | 35,586 |
| 131,788 | | Federal Home Loan Mortgage Corp., Pool E01538, 5.00%, 12/1/2018 | 141,186 |
| 5,991 | | Federal Home Loan Mortgage Corp., Pool E99748, 8.00%, 11/1/2015 | 6,187 |
| 25,587 | | Federal Home Loan Mortgage Corp., Pool G30067, 7.50%, 3/1/2017 | 28,080 |
| | TOTAL | 241,876 |
| | Federal National Mortgage Association – 0.0% | |
| 85,423 | | Federal National Mortgage Association, Pool 254863, 4.00%, 8/1/2013 | 88,674 |
| 16,007 | | Federal National Mortgage Association, Pool 512255, 7.50%, 9/1/2014 | 17,221 |
| 17,840 | | Federal National Mortgage Association, Pool 609554, 7.50%, 10/1/2016 | 19,701 |
| 101,329 | | Federal National Mortgage Association, Pool 728568, 6.50%, 10/1/2033 | 114,505 |
| | TOTAL | 240,101 |
| | Government National Mortgage Association – 0.0% | |
| 59,928 | | Government National Mortgage Association, Pool 354754, 7.50%, 2/15/2024 | 68,386 |
| 10,222 | | Government National Mortgage Association, Pool 423843, 8.50%, 8/15/2026 | 11,798 |
| 595 | | Government National Mortgage Association, Pool 780360, 11.00%, 9/15/2015 | 595 |
| | TOTAL | 80,779 |
| | TOTAL MORTGAGE-BACKED SECURITIES
(IDENTIFIED COST $528,100) | 562,756 |
Annual Shareholder Report34
Principal
Amount
or Shares | | | Value |
| | U.S. Treasury – 8.4% | |
| $22,297,000 | | U.S. Treasury Inflation-Protected Note, 2.00%, 1/15/2016 | 25,067,402 |
| 30,000,000 | | United States Treasury Note, 1.00%, 3/31/2012 | 30,209,766 |
| 10,000,000 | | United States Treasury Note, 1.75%, 7/31/2015 | 10,050,519 |
| 10,000,000 | | United States Treasury Note, 2.50%, 3/31/2015 | 10,397,301 |
| 20,000,000 | 7 | United States Treasury Note, 2.50%, 4/30/2015 | 20,776,694 |
| | TOTAL U.S. TREASURY
(IDENTIFIED COST $93,834,024) | 96,501,682 |
| | MUTUAL FUNDS – 16.6%8 | |
| 863,317 | | Emerging Markets Fixed Income Core Fund | 24,249,694 |
| 1,844,026 | | Federated Bank Loan Core Fund | 18,772,186 |
| 3,568,723 | | Federated Mortgage Core Portfolio | 35,972,729 |
| 83,273,221 | 9 | Federated Prime Value Obligations Fund, Institutional Shares, 0.18% | 83,273,221 |
| 1,065,807 | | Federated Project and Trade Finance Core Fund | 10,604,781 |
| 2,830,423 | | High Yield Bond Portfolio | 18,907,225 |
| | TOTAL MUTUAL FUNDS
(IDENTIFIED COST $190,351,792) | 191,779,836 |
| | REPURCHASE AGREEMENT – 1.9% | |
| $21,426,000 | | Interest in $5,935,000,000 joint repurchase agreement 0.05%, dated 4/29/2011 under which Bank of America, N.A. will repurchase securities provided as collateral for $5,935,024,729 on 5/2/2011. The securities provided as collateral at the end of the period were U.S. Government Agency securities with various maturities to 4/15/2040 and the market value of those underlying securities was $6,055,753,170 (purchased with proceeds from securities lending collateral). (AT COST) | 21,426,000 |
| | TOTAL INVESTMENTS — 101.3%
(IDENTIFIED COST $1,155,131,191)10 | 1,166,696,115 |
| | OTHER ASSETS AND LIABILITIES - NET — (1.3)%11 | (14,524,973) |
| | TOTAL NET ASSETS — 100% | $1,152,171,142 |
Annual Shareholder Report
35
| 1 | Denotes variable rate and floating rate obligations for which the current rate is shown. |
| 2 | Denotes a restricted security that either: (a) cannot be offered for public sale without first being registered, or being able to take advantage of an exemption from registration, under the Securities Act of 1933; or (b) is subject to a contractual restriction on public sales. At April 30, 2011, these restricted securities amounted to $232,880,337, which represented 20.2% of total net assets. |
| 3 | Denotes a restricted security that may be resold without restriction to “qualified institutional buyers” as defined in Rule 144A under the Securities Act of 1933 and that the Fund has determined to be liquid under criteria established by the Fund's Board of Trustees (the “Trustees”). At April 30, 2011, these liquid restricted securities amounted to $232,681,339, which represented 20.2% of total net assets. |
| 4 | Denotes available rate and weighted-average coupon obligations for which the current rate is shown. |
| 5 | Market quotations and price evaluations are not available. Fair value determined in accordance with procedures established by and under the general supervision of the Trustees. |
| 6 | Non-income producing security. |
| 7 | All or a portion of this security is temporarily on loan to unaffiliated broker/dealers. |
| 8 | Affiliated holdings. |
| 9 | 7-Day net yield. |
| 10 | The cost of investments for federal tax purposes amounts to $1,154,265,622. |
| 11 | Assets, other than investments in securities, less liabilities. See Statement of Assets and Liabilities. |
Note: The categories of investments are shown as a percentage of total net assets at April 30, 2011.
Various inputs are used in determining the value of the Fund's investments. These inputs are summarized in the three broad levels listed below:
Level 1 — quoted prices in active markets for identical securities, including investment companies with daily net asset values, if applicable.
Level 2 — other significant observable inputs (including quoted prices for similar securities, interest rates, prepayment speeds, credit risk, etc.). Also includes securities valued at amortized cost.
Level 3 — significant unobservable inputs (including the Fund's own assumptions in determining the fair value of investments).
The inputs or methodology used for valuing securities are not an indication of the risk associated with investing in those securities.
Annual Shareholder Report
36
The following is a summary of the inputs used, as of April 30, 2011, in valuing the Fund's assets carried at fair value:| Valuation Inputs | | | | |
| Level 1 —
Quoted
Prices and
Investments in
Mutual Funds1 | Level 2 —
Other
Significant
Observable
Inputs | Level 3 —
Significant
Unobservable
Inputs | Total |
| Debt Securities: | | | | |
| Adjustable-Rate Mortgages | $ — | $6,839,174 | $ — | $6,839,174 |
| Asset-Backed Securities | — | 375,712,367 | 43,027 | 375,755,394 |
| Collateralized Mortgage Obligations | — | 127,712,835 | — | 127,712,835 |
| Corporate Bonds | — | 336,055,352 | — | 336,055,352 |
| Government Agencies | — | 10,063,086 | — | 10,063,086 |
| Mortgage-Backed Securities | — | 562,756 | — | 562,756 |
| U.S. Treasury | — | 96,501,682 | — | 96,501,682 |
| Mutual Funds | 181,175,055 | 10,604,7812 | — | 191,779,836 |
| Repurchase Agreement | — | 21,426,000 | — | 21,426,000 |
| TOTAL SECURITIES | $181,175,055 | $985,478,033 | $43,027 | $1,166,696,115 |
| 1 | Emerging Markets Fixed Income Core Fund, Federated Bank Loan Core Fund, Federated Mortgage Core Portfolio and High Yield Bond Portfolio are affiliated holdings offered only to registered investment companies and other accredited investors. |
| 2 | Includes $10,079,144 of securities transferred from Level 1 to Level 2 because the adviser determined that these securities more appropriately meet the definition of Level 2. Transfers shown represent the value of the securities at the beginning of the period. |
Following is a reconciliation of assets in which significant unobservable inputs (Level 3) were used in determining fair value:
| Investments in
Asset-Backed
Securities |
| Balance as of May 1, 2010 | $33,583 |
| Change in unrealized depreciation | 9,444 |
| Balance as of April 30, 2011 | $43,027 |
| The total change in unrealized appreciation (depreciation) included in the Statement of Operations attributable to investments still held at April 30, 2011. | $9,444 |
The following acronyms are used throughout this portfolio:
| ARM | — Adjustable Rate Mortgage |
| FHLMC | — Federal Home Loan Mortgage Corporation |
| FNMA | — Federal National Mortgage Association |
| GNMA | — Government National Mortgage Association |
| MTN | — Medium Term Note |
| NIM | — Net Interest Margin |
| REITs | — Real Estate Investment Trusts |
| REMIC | — Real Estate Mortgage Investment Conduit |
See Notes which are an integral part of the Financial Statements
Annual Shareholder Report37
Statement of Assets and Liabilities
April 30, 2011
| Assets: | | |
| Total investments in securities, at value including $191,779,836 of investments in affiliated holdings (Note 5) and $20,776,694 of securities loaned (identified cost $1,155,131,191) | | $1,166,696,115 |
| Cash | | 1,519 |
| Cash denominated in foreign currencies (identified cost $150,077) | | 151,835 |
| Income receivable | | 5,590,326 |
| Receivable for shares sold | | 15,750,007 |
| TOTAL ASSETS | | 1,188,189,802 |
| Liabilities: | | |
| Payable for investments purchased | $10,999,146 | |
| Payable for shares redeemed | 2,821,629 | |
| Payable for collateral due to broker for securities lending | 21,426,000 | |
| Income distribution payable | 338,171 | |
| Payable for Directors'/Trustees' fees | 2,748 | |
| Payable for distribution services fee (Note 5) | 65,345 | |
| Payable for shareholder services fee (Note 5) | 173,741 | |
| Accrued expenses | 191,880 | |
| TOTAL LIABILITIES | | 36,018,660 |
| Net assets for 133,366,285 shares outstanding | | $1,152,171,142 |
| Net Assets Consist of: | | |
| Paid-in capital | | $1,161,754,235 |
| Net unrealized appreciation of investments and translation of assets and liabilities in foreign currency | | 11,566,682 |
| Accumulated net realized loss on investments, futures contracts, swap contracts and foreign currency transactions | | (21,807,159) |
| Undistributed net investment income | | 657,384 |
| TOTAL NET ASSETS | | $1,152,171,142 |
Annual Shareholder Report38
Statement of Assets and Liabilities — continued| Net Asset Value, Offering Price and Redemption Proceeds Per Share | | |
| Class A Shares: | | |
| Net asset value per share ($100,025,669 ÷ 11,578,212 shares outstanding), no par value, unlimited shares authorized | | $8.64 |
| Offering price per share (100/99.00 of $8.64) | | $8.73 |
| Redemption proceeds per share | | $8.64 |
| Institutional Shares: | | |
| Net asset value per share ($474,794,744 ÷ 54,958,760 shares outstanding), no par value, unlimited shares authorized | | $8.64 |
| Institutional Service Shares: | | |
| Net asset value per share ($314,235,981 ÷ 36,370,810 shares outstanding), no par value, unlimited shares authorized | | $8.64 |
| Class Y Shares: | | |
| Net asset value per share ($263,114,748 ÷ 30,458,503 shares outstanding), no par value, unlimited shares authorized | | $8.64 |
See Notes which are an integral part of the Financial Statements
Annual Shareholder Report39
Statement of Operations
Year Ended April 30, 2011
| Investment Income: | | | |
| Interest (including income on securities loaned of $10,174) | | | $22,837,377 |
| Dividends received from affiliated holdings (Note 5) | | | 4,684,627 |
Investment income allocated from affiliated
partnership (Note 5) | | | 1,432,827 |
| TOTAL INCOME | | | 28,954,831 |
| Expenses: | | | |
| Investment adviser fee (Note 5) | | $4,064,482 | |
| Administrative fee (Note 5) | | 794,483 | |
| Custodian fees | | 51,382 | |
| Transfer and dividend disbursing agent fees and expenses | | 620,304 | |
| Directors'/Trustees' fees | | 9,383 | |
| Auditing fees | | 23,524 | |
| Legal fees | | 6,726 | |
| Portfolio accounting fees | | 200,784 | |
| Distribution services fee — Class A Shares (Note 5) | | 526,455 | |
Distribution services fee — Institutional Service
Shares (Note 5) | | 469,975 | |
| Shareholder services fee — Class A Shares (Note 5) | | 263,228 | |
| Shareholder services fee — Institutional Shares (Note 5) | | 725,996 | |
Shareholder services fee — Institutional Service
Shares (Note 5) | | 779,144 | |
| Account administration fee — Institutional Shares | | 3,617 | |
| Account administration fee — Institutional Service Shares | | 3,422 | |
| Share registration costs | | 138,772 | |
| Printing and postage | | 101,655 | |
| Insurance premiums | | 6,204 | |
| Miscellaneous | | 8,029 | |
| TOTAL EXPENSES | | 8,797,565 | |
Annual Shareholder Report40
Statement of Operations — continued| Waivers and Reimbursements (Note 5): | | | |
| Waiver/reimbursement of investment adviser fee | $(2,398,300) | | |
| Waiver of administrative fee | (21,215) | | |
| Waiver of distribution services fee — Class A Shares | (10,529) | | |
| Waiver of distribution services fee — Institutional Service Shares | (156,132) | | |
Reimbursement of shareholder services fee —
Institutional Shares | (559) | | |
| TOTAL WAIVERS AND REIMBURSEMENTS | | $(2,586,735) | |
| Net expenses | | | $6,210,830 |
| Net investment income | | | 22,744,001 |
| Realized and Unrealized Gain on Investments and Foreign Currency Transactions: | | | |
Net realized gain on investments (including realized gain of $3,132,356 on sales of investments in affiliated
issuers (Note 5)) | | | 4,884,039 |
| Realized gain distribution from affiliated investment company shares (Note 5) | | | 11,540 |
Net realized gain on investments and foreign currency transactions allocated from affiliated
partnership (Note 5) | | | 379,735 |
| Net change in unrealized appreciation of investments and translation of assets and liabilities in foreign currency | | | 3,161,256 |
| Net realized and unrealized gain on investments and foreign currency transactions | | | 8,436,570 |
| Change in net assets resulting from operations | | | $31,180,571 |
See Notes which are an integral part of the Financial Statements
Annual Shareholder Report41
Statement of Changes in Net Assets
| Year Ended April 30 | 2011 | 2010 |
| Increase (Decrease) in Net Assets | | |
| Operations: | | |
| Net investment income | $22,744,001 | $13,175,122 |
| Net realized gain on investments including allocation from partnership and foreign currency transactions | 5,275,314 | 1,818,112 |
| Net change in unrealized appreciation/depreciation of investments and translation of assets and liabilities in foreign currency | 3,161,256 | 19,394,824 |
| CHANGE IN NET ASSETS RESULTING FROM OPERATIONS | 31,180,571 | 34,388,058 |
| Distributions to Shareholders: | | |
| Distributions from net investment income | | |
| Class A Shares | (1,739,248) | (1,296,319) |
| Institutional Shares | (9,546,999) | (8,148,310) |
| Institutional Service Shares | (6,382,969) | (1,576,239) |
| Class Y Shares | (3,993,104) | (1,796,329) |
| CHANGE IN NET ASSETS RESULTING FROM DISTRIBUTIONS TO SHAREHOLDERS | (21,662,320) | (12,817,197) |
| Share Transactions: | | |
| Proceeds from sale of shares | 679,141,295 | 703,567,313 |
| Net asset value of shares issued to shareholders in payment of distributions declared | 17,778,596 | 10,251,000 |
| Cost of shares redeemed | (431,378,190) | (156,226,950) |
| CHANGE IN NET ASSETS RESULTING FROM SHARE TRANSACTIONS | 265,541,701 | 557,591,363 |
| Change in net assets | 275,059,952 | 579,162,224 |
| Net Assets: | | |
| Beginning of period | 877,111,190 | 297,948,966 |
| End of period (including undistributed (distributions in excess of) net investment income of $657,384 and $(68,198), respectively) | $1,152,171,142 | $877,111,190 |
See Notes which are an integral part of the Financial Statements
Annual Shareholder Report42
Notes to Financial Statements
April 30, 2011
1. ORGANIZATION
Federated Income Securities Trust (the “Trust”) is registered under the Investment Company Act of 1940, as amended (the “Act”), as an open-end management investment company. The Trust consists of nine portfolios. The financial statements included herein are only those of Federated Short-Term Income Fund (the “Fund”), a diversified portfolio. The financial statements of the Trust's other portfolios are presented separately. The assets of each portfolio are segregated and a shareholder's interest is limited to the portfolio in which shares are held. Each portfolio pays its own expenses. The Fund offers four classes of shares: Class A Shares, Institutional Shares, Institutional Service Shares and Class Y Shares. All shares of the Fund have equal rights with respect to voting, except on class-specific matters. The investment objective of the Fund is to seek to provide current income.
2. SIGNIFICANT ACCOUNTING POLICIES
The following is a summary of significant accounting policies consistently followed by the Fund in the preparation of its financial statements. These policies are in conformity with U.S. generally accepted accounting principles (GAAP).
Investment Valuation
In calculating its net asset value (NAV), the Fund generally values investments as follows:
- Fixed-income securities acquired with remaining maturities greater than 60 days are fair valued using price evaluations provided by a pricing service approved by the Trustees.
- Fixed-income securities acquired with remaining maturities of 60 days or less are valued at their cost (adjusted for the accretion of any discount or amortization of any premium), which approximates market value.
- Shares of other mutual funds are valued based upon their reported NAVs.
- Derivative contracts listed on exchanges are valued at their reported settlement or closing price.
- Over-the-counter (OTC) derivative contracts are fair valued using price evaluations provided by a pricing service approved by the Trustees.
- Equity securities listed on an exchange or traded through a regulated market system are valued at their last reported sale price or official closing price in their principal exchange or market.
- For securities that are fair valued in accordance with procedures established by and under the general supervision of the Trustees, certain factors may be considered such as: the purchase price of the security, information obtained by contacting the issuer, analysis of the issuer's financial statements or other available documents, fundamental analytical data, the nature and duration of restrictions on disposition, the movement of the market in which the security is normally traded and public trading in similar securities of the issuer or comparable issuers.
If the Fund cannot obtain a price or price evaluation from a pricing service for an investment, the Fund may attempt to value the investment based upon the mean of bid and asked quotations or fair value the investment based on price evaluations, from one or more dealers. If any price, quotation, price evaluation or other pricing source is not readily available when the NAV is calculated, the Fund uses the fair value of the investment determined in accordance with the procedures described below. There can be no assurance that the Fund could purchase or sell an investment at the price used to calculate the Fund's NAV.
Annual Shareholder Report
43
Fair Valuation and Significant Events ProceduresThe Trustees have authorized the use of pricing services to provide evaluations of the current fair value of certain investments for purposes of calculating the NAV. Factors considered by pricing services in evaluating an investment include the yields or prices of investments of comparable quality, coupon, maturity, call rights and other potential prepayments, terms and type, reported transactions, indications as to values from dealers and general market conditions. Some pricing services provide a single price evaluation reflecting the bid-side of the market for an investment (a “bid” evaluation). Other pricing services offer both bid evaluations and price evaluations indicative of a price between the prices bid and asked for the investment (a “mid” evaluation). The Fund normally uses bid evaluations for U.S. Treasury and Agency securities, mortgage-backed securities and municipal securities. The Fund normally uses mid evaluations for other types of fixed-income securities and OTC derivative contracts. In the event that market quotations and price evaluations are not available for an investment, the fair value of the investment is determined in accordance with procedures adopted by the Trustees.
The Trustees also have adopted procedures requiring an investment to be priced at its fair value whenever the Adviser determines that a significant event affecting the value of the investment has occurred between the time as of which the price of the investment would otherwise be determined and the time as of which the NAV is computed. An event is considered significant if there is both an affirmative expectation that the investment's value will change in response to the event and a reasonable basis for quantifying the resulting change in value. Examples of significant events that may occur after the close of the principal market on which a security is traded, or after the time of a price evaluation provided by a pricing service or a dealer, include:
- With respect to securities traded in foreign markets, significant trends in U.S. equity markets or in the trading of foreign securities index futures or options contracts;
- With respect to price evaluations of fixed-income securities determined before the close of regular trading on the NYSE, actions by the Federal Reserve Open Market Committee and other significant trends in U.S. fixed-income markets;
- Political or other developments affecting the economy or markets in which an issuer conducts its operations or its securities are traded; and
- Announcements concerning matters such as acquisitions, recapitalizations, litigation developments, a natural disaster affecting the issuer's operations or regulatory changes or market developments affecting the issuer's industry.
The Trustees have approved the use of a pricing service to determine the fair value of equity securities traded principally in foreign markets when the Adviser determines that there has been a significant trend in the U.S. equity markets or in index futures trading. For other significant events, the Fund may seek to obtain more current quotations or price evaluations from alternative pricing sources. If a reliable alternative pricing source is not available, the Fund will determine the fair value of the investment using another method approved by the Trustees.
Repurchase Agreements
The Fund may invest in repurchase agreements for short-term liquidity purposes. It is the policy of the Fund to require the other party to a repurchase agreement to transfer to the Fund's custodian or sub-custodian eligible securities or cash with a market value (after transaction costs) at least equal to the repurchase price to be paid under the repurchase agreement. The eligible securities are transferred to accounts with the custodian or sub-custodian in which the Fund holds a “securities entitlement” and exercises “control” as those Annual Shareholder Report
44
terms are defined in the Uniform Commercial Code. The Fund has established procedures for monitoring the market value of the transferred securities and requiring the transfer of additional eligible securities if necessary to equal at least the repurchase price. These procedures also allow the other party to require securities to be transferred from the account to the extent that their market value exceeds the repurchase price or in exchange for other eligible securities of equivalent market value.The insolvency of the other party or other failure to repurchase the securities may delay the disposition of the underlying securities or cause the Fund to receive less than the full repurchase price. Under the terms of the repurchase agreement, any amounts received by the Fund in excess of the repurchase price and related transaction costs must be remitted to the other party.
The Fund may enter into repurchase agreements in which eligible securities are transferred into joint trading accounts maintained by the custodian or sub-custodian for investment companies and other clients advised by the Fund's Adviser and its affiliates. The Fund will participate on a pro rata basis with the other investment companies and clients in its share of the securities transferred under such repurchase agreements and in its share of proceeds from any repurchase or other disposition of such securities.
Investment Income, Gains and Losses, Expenses and Distributions
Investment transactions are accounted for on a trade-date basis. Realized gains and losses from investment transactions are recorded on an identified-cost basis. Interest income and expenses are accrued daily. Dividend income and distributions to shareholders are recorded on the ex-dividend date. Foreign dividends are recorded on the ex-dividend date or when the Fund is informed of the ex-dividend date. Positive or negative inflation adjustments on Treasury Inflation-Protected Securities (TIPS) are included in interest income. Distributions of net investment income are declared daily and paid monthly. Non-cash dividends included in dividend income, if any, are recorded at fair value. Investment income, realized and unrealized gains and losses, and certain fund-level expenses are allocated to each class based on relative average daily net assets, except that each class may bear certain expenses unique to that class such as account administration, distribution services and shareholder services fees. Dividends are declared separately for each class. No class has preferential dividend rights; differences in per share dividend rates are generally due to differences in separate class expenses.
Premium and Discount Amortization/Paydown Gains and Losses
All premiums and discounts on fixed-income securities, other than mortgage-backed securities, are amortized/accreted using the effective interest rate method. Gains and losses realized on principal payment of mortgage-backed securities (paydown gains and losses) are classified as part of investment income.
Federal Taxes
It is the Fund's policy to comply with the Subchapter M provision of the Internal Revenue Code (the “Code”) and to distribute to shareholders each year substantially all of its income. Accordingly, no provision for federal income tax is necessary. As of and during the year ended April 30, 2011, the Fund did not have a liability for any uncertain tax positions. The Fund recognizes interest and penalties, if any, related to tax liabilities as income tax expense in the Statement of Operations. As of April 30, 2011, tax years 2008 through 2011 remain subject to examination by the Fund's major tax jurisdictions, which include the United States of America and the Commonwealth of Massachusetts.
Annual Shareholder Report
45
When-Issued and Delayed Delivery TransactionsThe Fund may engage in when-issued or delayed delivery transactions. The Fund records when-issued securities on the trade date and maintains security positions such that sufficient liquid assets will be available to make payment for the securities purchased. Securities purchased on a when-issued or delayed delivery basis are marked to market daily and begin earning interest on the settlement date. Losses may occur on these transactions due to changes in market conditions or the failure of counterparties to perform under the contract.
Foreign Exchange Contracts
The Fund enters into foreign exchange contracts for the delayed delivery of securities or foreign currency exchange transactions. The Fund also enters into foreign exchange contracts to protect assets against adverse changes in foreign currency exchange rates or exchange control regulations. Purchased contracts are used to acquire exposure to foreign currencies, whereas, contracts to sell are used to hedge the Fund's securities against currency fluctuations. Risks may arise upon entering into these transactions from the potential inability of counterparties to meet the terms of their commitments and from unanticipated movements in security prices or foreign exchange rates. The foreign exchange contracts are adjusted by the daily exchange rate of the underlying currency and any gains or losses are recorded for financial statement purposes as unrealized until the settlement date.
At April 30, 2011, the Fund had no outstanding foreign exchange contracts.
Foreign Currency Translation
The accounting records of the Fund are maintained in U.S. dollars. All assets and liabilities denominated in foreign currencies (FCs) are translated into U.S. dollars based on the rates of exchange of such currencies against U.S. dollars on the date of valuation. Purchases and sales of securities, income and expenses are translated at the rate of exchange quoted on the respective date that such transactions are recorded. The Fund does not isolate that portion of the results of operations resulting from changes in foreign exchange rates on investments from the fluctuations arising from changes in market prices of securities held. Such fluctuations are included with the net realized and unrealized gain or loss from investments.
Reported net realized foreign exchange gains or losses arise from sales of portfolio securities, sales and maturities of short-term securities, sales of FCs, currency gains or losses realized between the trade and settlement dates on securities transactions, the difference between the amounts of dividends, interest and foreign withholding taxes recorded on the Fund's books, and the U.S. dollar equivalent of the amounts actually received or paid. Net unrealized foreign exchange gains and losses arise from changes in the value of assets and liabilities other than investments in securities at fiscal year end, resulting from changes in the exchange rate.
Securities Lending
The Fund participates in a securities lending program providing for the lending of corporate bonds and government securities to qualified brokers. The Fund normally receives cash collateral for securities loaned that is invested in an affiliated money market fund or in short-term securities including repurchase agreements. Collateral is maintained at a minimum level of 100% of the market value of investments loaned, plus interest, if applicable. Earnings on collateral are allocated between the securities lending agent, as a fee for its services under the program, and the Fund, according to agreed-upon rates.
Annual Shareholder Report
46
As of April 30, 2011, securities subject to this type of arrangement and related collateral were as follows:Market Value of
Securities Loaned | Market Value
of Collateral |
| $20,776,694 | $21,426,000 |
Restricted Securities
The Fund may purchase securities which are considered restricted. Restricted securities are securities that either: (a) cannot be offered for public sale without first being registered, or being able to take advantage of an exemption from registration, under the Securities Act of 1933; or (b) are subject to contractual restrictions on public sales. In some cases, when a security cannot be offered for public sale without first being registered, the issuer of the restricted security has agreed to register such securities for resale, at the issuer's expense, either upon demand by the Fund or in connection with another registered offering of the securities. Many such restricted securities may be resold in the secondary market in transactions exempt from registration. Restricted securities may be determined to be liquid under criteria established by the Trustees. The Fund will not incur any registration costs upon such resales. The Fund's restricted securities are valued at the price provided by dealers in the secondary market or, if no market prices are available, at the fair value as determined in accordance with procedures established by and under the general supervision of the Trustees.
Additional information on restricted securities, excluding securities purchased under Rule 144A, if applicable, that have been deemed liquid by the Trustees, held at April 30, 2011, is as follows:
| Security | Acquisition Date | Cost | Market Value |
| C-BASS ABS LLC 1999-3, Class B1, 6.629%, 2/3/2029 | 7/9/1999 | $139,006 | $59,593 |
| Greenwich Capital Acceptance 1991-4, Class B1A, 6.245%, 7/1/2019 | 1/7/1993 | $117,675 | $75,990 |
| NC Finance Trust 1999-1, Class D, 8.75%, 1/25/2029 | 2/23/1999 | $326,662 | $43,027 |
| SMFC Trust Asset-Backed Certificates, 1997-A, Class 4, 3.004%, 1/28/2027 | 2/4/1998-2/5/1998 | $58,844 | $20,388 |
| Washington Mutual Asset-Backed Certificates NIM Notes 2007-WM1, Class N1, 6.75%, 1/25/2047 | 1/26/2007 | $1,516,099 | $0 |
Annual Shareholder Report
47
Additional Disclosure Related to Derivative InstrumentsThe Effect of Derivative Instruments on the Statement of Operations for the Year Ended April 30, 2011
| Amount of Realized Gain or (Loss) on Derivatives Recognized in Income |
| Forward
Currency
Contracts |
| Foreign exchange contracts | $(75,425) |
| Change in Unrealized Appreciation or (Depreciation) on Derivatives Recognized in Income |
| Forward
Currency
Contracts |
| Foreign exchange contracts | $(175,079) |
Other
The preparation of financial statements in conformity with GAAP requires management to make estimates and assumptions that affect the amounts of assets, liabilities, expenses and revenues reported in the financial statements. Actual results could differ from those estimated.
3. SHARES OF BENEFICIAL INTEREST
The following tables summarize share activity:
| Year Ended April 30 | 2011 | 2010 |
| Class A Shares: | Shares | Amount | Shares | Amount |
| Shares sold | 7,691,519 | $66,207,695 | 8,099,543 | $68,586,035 |
| Shares issued to shareholders in payment of distributions declared | 187,319 | 1,612,859 | 139,160 | 1,175,034 |
| Shares redeemed | (7,294,314) | (62,771,178) | (2,916,728) | (24,399,017) |
NET CHANGE RESULTING
FROM CLASS A
SHARE TRANSACTIONS | 584,524 | $5,049,376 | 5,321,975 | $45,362,052 |
| Year Ended April 30 | 2011 | 2010 |
| Institutional Shares: | Shares | Amount | Shares | Amount |
| Shares sold | 23,955,298 | $206,042,343 | 30,931,659 | $260,834,394 |
| Shares issued to shareholders in payment of distributions declared | 910,833 | 7,842,181 | 759,823 | 6,423,019 |
| Shares redeemed | (16,920,853) | (145,431,798) | (6,446,614) | (54,383,750) |
NET CHANGE RESULTING
FROM INSTITUTIONAL
SHARE TRANSACTIONS | 7,945,278 | $68,452,726 | 25,244,868 | $212,873,663 |
Annual Shareholder Report48
| Year Ended April 30 | 2011 | 2010 |
| Institutional Service Shares: | Shares | Amount | Shares | Amount |
| Shares sold | 22,688,317 | $195,222,430 | 28,712,920 | $244,528,439 |
| Shares issued to shareholders in payment of distributions declared | 719,717 | 6,197,214 | 169,809 | 1,431,945 |
| Shares redeemed | (18,198,669) | (156,577,893) | (5,531,900) | (46,367,909) |
NET CHANGE RESULTING
FROM INSTITUTIONAL SERVICE
SHARE TRANSACTIONS | 5,209,365 | $44,841,751 | 23,350,829 | $199,592,475 |
| Year Ended April 30 | 2011 | 2010 |
| Class Y Shares: | Shares | Amount | Shares | Amount |
| Shares sold | 24,614,819 | $211,668,827 | 15,376,398 | $129,618,445 |
| Shares issued to shareholders in payment of distributions declared | 246,847 | 2,126,342 | 144,307 | 1,221,002 |
| Shares redeemed | (7,743,260) | (66,597,321) | (3,667,919) | (31,076,274) |
NET CHANGE RESULTING
FROM CLASS Y
SHARE TRANSACTIONS | 17,118,406 | $147,197,848 | 11,852,786 | $99,763,173 |
NET CHANGE RESULTING
FROM TOTAL FUND
SHARE TRANSACTIONS | 30,857,573 | $265,541,701 | 65,770,458 | $557,591,363 |
4. FEDERAL TAX INFORMATION
The timing and character of income and capital gain distributions are determined in accordance with income tax regulations, which may differ from GAAP. These differences are due in part to expiration of capital loss carryforwards and differing treatments for foreign currency transactions, allocated investment income from partnerships and discount accretion/premium amortization on debt securities.
For the year ended April 30, 2011, permanent differences identified and reclassified among the components of net assets were as follows:
| Increase (Decrease) |
| Paid-In Capital | Undistributed
Net Investment
Income (Loss) | Accumulated
Net Realized
Gain (Loss) |
| $(6,871,897) | $(356,099) | $7,227,996 |
Net investment income (loss), net realized gains (losses), and net assets were not affected by this reclassification.
The tax character of distributions as reported on the Statement of Changes in Net Assets for the years ended April 30, 2011 and 2010, was as follows:
| 2011 | 2010 |
| Ordinary income | $21,662,320 | $12,817,197 |
Annual Shareholder Report
49
As of April 30, 2011, the components of distributable earnings on a tax basis were as follows:| Undistributed ordinary income | $660,763 |
| Net unrealized appreciation | $12,432,251 |
| Capital loss carryforwards and deferrals | $(22,676,107) |
The difference between book-basis and tax-basis net unrealized appreciation/depreciation is attributable to differing treatments for paydowns, the deferral of losses on wash sales, discount accretion/premium amortization on debt securities and partnership basis adjustments.
At April 30, 2011, the cost of investments for federal tax purposes was $1,154,265,622. The net unrealized appreciation of investments for federal tax purposes excluding any unrealized appreciation/depreciation resulting from changes in foreign currency exchange rates was $12,430,493. This consists of net unrealized appreciation from investments for those securities having an excess of value over cost of $21,845,887 and net unrealized depreciation from investments for those securities having an excess of cost over value of $9,415,394.
At April 30, 2011, the Fund had a capital loss carryforward of $22,672,728 which will reduce the Fund's taxable income arising from future net realized gains on investments, if any, to the extent permitted by the Code and thus will reduce the amount of distributions to shareholders which would otherwise be necessary to relieve the Fund of any liability for federal income tax. Pursuant to the Code, such capital loss carryforward will expire as follows:
| Expiration Year | Expiration Amount |
| 2012 | $12,381,100 |
| 2013 | $5,495,264 |
| 2014 | $2,592,863 |
| 2015 | $801,392 |
| 2016 | $1,402,109 |
Under the recently enacted Regulated Investment Company Modernization Act of 2010, the Fund will be permitted to carry forward capital losses incurred in taxable years beginning after December 22, 2010, for an unlimited period. However, any losses incurred during those future years will be required to be utilized prior to the losses incurred in pre-enactment tax years. As a result of this ordering rule, pre-enactment capital loss carryforwards may be more likely to expire unused. Additionally, post-enactment capital losses that are carried forward will retain their character as either short-term or long-term capital losses rather than being considered all short-term as under previous law.
The Fund used capital loss carryforwards of $4,586,628 to offset taxable capital gains realized during the year ended April 30, 2011. Additionally, capital loss carryforwards of $6,871,897 expired during the year ended April 30, 2011.
Under current tax regulations, capital losses on securities transactions and foreign currency losses realized after October 31 may be deferred and treated as occurring on the first day of the following fiscal year. As of April 30, 2011, for federal income tax purposes, post October losses of $3,379 were deferred to May 1, 2011.
Annual Shareholder Report
50
5. INVESTMENT ADVISER FEE AND OTHER TRANSACTIONS WITH AFFILIATESInvestment Adviser Fee
Federated Investment Management Company is the Fund's investment adviser (the “Adviser”). The advisory agreement between the Fund and the Adviser provides for an annual fee equal to 0.40% of the Fund's average daily net assets. Subject to the terms described in the Expense Limitation note, the Adviser may voluntarily choose to waive any portion of its fee. For the year ended April 30, 2011, the Adviser voluntarily waived $2,307,267 of its fee.
Administrative Fee
Federated Administrative Services (FAS), under the Administrative Services Agreement, provides the Fund with administrative personnel and services. The fee paid to FAS is based on the average aggregate daily net assets of certain Federated funds as specified below:
| Administrative Fee | Average Aggregate Daily Net Assets
of the Federated Funds |
| 0.150% | on the first $5 billion |
| 0.125% | on the next $5 billion |
| 0.100% | on the next $10 billion |
| 0.075% | on assets in excess of $20 billion |
The administrative fee received during any fiscal year shall be at least $150,000 per portfolio and $40,000 per each additional class of Shares. Subject to the terms described in the Expense Limitation note, FAS may voluntarily choose to waive any portion of its fee. For the year ended April 30, 2011, the net fee paid to FAS was 0.076% of average daily net assets of the Fund. FAS waived $21,215 of its fee.
Distribution Services Fee
The Fund has adopted a Distribution Plan (the “Plan”) pursuant to Rule 12b-1 under the Act. Under the terms of the Plan, the Fund will compensate Federated Securities Corp. (FSC), the principal distributor, from the daily net assets of the Fund's Institutional Service Shares and Class A Shares to finance activities intended to result in the sale of these shares. The Plan provides that the Fund may incur distribution expenses at the following percentages of average daily net assets annually, to compensate FSC:
| Share Class Name | Percentage of Average Daily
Net Assets of Class |
| Class A Shares | 0.50% |
| Institutional Service Shares | 0.15% |
Subject to the terms described in the Expense Limitation note, FSC may voluntarily choose to waive any portion of its fee. For the year ended April 30, 2011, FSC voluntarily waived $166,661 of its fee. When FSC receives fees, it may pay some or all of them to financial intermediaries whose customers purchase shares. For the year ended April 30, 2011, FSC retained $566,241 of fees paid by the Fund.
Annual Shareholder Report
51
Sales ChargesFront-end sales charges and contingent deferred sales charges (CDSC) do not represent expenses of the Fund. They are deducted from the proceeds of sales of Fund shares prior to investment or from redemption proceeds prior to remittance, as applicable. For the year ended April 30, 2011, FSC retained $1,376 in sales charges from the sale of Class A Shares. FSC also retained $12,637 of CDSC relating to redemptions of Class A Shares.
Shareholder Services Fee
The Fund may pay fees (“Service Fees”) up to 0.25% of the average daily net assets of the Fund's Class A Shares, Institutional Shares and Institutional Service Shares to financial intermediaries or to Federated Shareholder Services Company (FSSC) for providing services to shareholders and maintaining shareholder accounts. Subject to the terms described in the Expense Limitation note, FSSC may voluntarily reimburse the Fund for Service Fees. For the year ended April 30, 2011, FSSC voluntarily reimbursed $559 of Service Fees. For the year ended April 30, 2011, FSSC received $74,197 of fees paid by the Fund.
Expense Limitation
The Adviser and its affiliates (which may include FSC, FAS and FSSC) have voluntarily agreed to waive their fees and/or reimburse expenses so that the total annual fund operating expenses (as shown in the financial highlights, but excluding expenses allocated from partnerships) paid by the Fund's Class A Shares, Institutional Shares, Institutional Service Shares and Class Y Shares (after the voluntary waivers and reimbursements) will not exceed 1.09%, 0.52%, 0.70% and 0.35% (the “Fee Limit”), respectively, up to but not including the later of (the “Termination Date”): (a) July 1, 2012; or (b) the date of the Fund's next effective Prospectus. While the Adviser and its affiliates currently do not anticipate terminating or increasing these arrangements prior to the Termination Date, these arrangements may only be terminated or the Fee Limit increased prior to the Termination Date with the agreement of the Trustees.
General
Certain Officers and Trustees of the Fund are Officers and Directors or Trustees of the above companies.
Annual Shareholder Report
52
Transactions Involving Affiliated HoldingsAffiliated holdings are mutual funds which are managed by the Adviser or an affiliate of the Adviser. The Adviser has agreed to reimburse the Fund for certain investment adviser fees as a result of transactions in other affiliated mutual funds. For the year ended April 30, 2011, the Adviser reimbursed $91,033. Transactions involving the affiliated holdings during the year ended April 30, 2011, were as follows:
| Affiliates | Balance
of
Shares
Held
4/30/2010 | Purchases/
Additions | Sales/
Reduc-
tions | Balance
of
Shares
Held
4/30/2011 | Value | Dividend
Income/
Allocated
Invest-
ment
Income | Capital
Gain
Distri-
butions/
Allo-
cation |
Emerging Markets
Fixed Income
Core Fund | 682,527 | 180,790 | — | 863,317 | $24,249,694 | $1,432,827 | $379,735 |
Federated Bank
Loan Core
Fund | — | 1,844,026 | — | 1,844,026 | 18,772,186 | 446,681 | — |
Federated
Mortgage Core
Portfolio | 3,411,824 | 156,899 | — | 3,568,723 | 35,972,729 | 1,589,825 | — |
Federated Prime
Value Obligations
Fund, Institutional
Shares | 77,974,554 | 482,748,210 | 477,449,543 | 83,273,221 | 83,273,221 | 182,584 | — |
Federated Project and Trade Finance
Core Fund | 1,015,020 | 50,787 | — | 1,065,807 | 10,604,781 | 494,078 | 11,540 |
| High Yield Bond Portfolio | 4,102,574 | 1,069,914 | 2,342,065 | 2,830,423 | 18,907,225 | 1,971,459 | — |
TOTAL OF
AFFILIATED
TRANS-
ACTIONS | 87,186,499 | 486,050,626 | 479,791,608 | 93,445,517 | $191,779,836 | 6,117,454 | $391,275 |
Annual Shareholder Report
53
6. Investment TRANSACTIONSPurchases and sales of investments, excluding long-term U.S. government securities and short-term obligations for the year ended April 30, 2011, were as follows:
| Purchases | $466,589,693 |
| Sales | $218,622,101 |
7. LINE OF CREDIT
The Fund participates in a $100,000,000 unsecured, uncommitted revolving line of credit (LOC) agreement with PNC Bank. The LOC was made available for extraordinary or emergency purposes, primarily for financing redemption payments. Borrowings are charged interest at a rate offered to the Fund by PNC Bank at the time of the borrowing. As of April 30, 2011, there were no outstanding loans. During the year ended April 30, 2011, the Fund did not utilize the LOC.
8. INTERFUND LENDING
Pursuant to an Exemptive Order issued by the Securities and Exchange Commission, the Fund, along with other funds advised by subsidiaries of Federated Investors, Inc., may participate in an interfund lending program. This program provides an alternative credit facility allowing the Fund to borrow from other participating affiliated funds. As of April 30, 2011, there were no outstanding loans. During the year ended April 30, 2011, the program was not utilized.
9. Subsequent events
On June 1, 2011, a supplement to the Fund's Prospectus and Statement of Additional Information was filed to indicate that the word “Institutional” will be removed from the Fund's Institutional Service Shares effective September 30, 2011.
Management has evaluated subsequent events through the date the financial statements were issued, and determined that no additional events have occurred that require disclosure.
Annual Shareholder Report54
Report of Independent Registered Public Accounting Firm
TO THE BOARD OF trustees OF federated income securities trust AND SHAREHOLDERS OF federated short-term income fund:
We have audited the accompanying statement of assets and liabilities of Federated Short-Term Income Fund (the “Fund”) (one of the portfolios constituting Federated Income Securities Trust), including the portfolio of investments, as of April 30, 2011, and the related statement of operations for the year then ended, the statement of changes in net assets for each of the two years in the period then ended, and the financial highlights for each of the five years in the period then ended. These financial statements and financial highlights are the responsibility of the Fund's management. Our responsibility is to express an opinion on these financial statements and financial highlights based on our audits.
We conducted our audits in accordance with standards of the Public Company Accounting Oversight Board (United States). Those standards require that we plan and perform the audit to obtain reasonable assurance about whether the financial statements and financial highlights are free of material misstatement. We were not engaged to perform an audit of the Fund's internal control over financial reporting. Our audits included consideration of internal control over financial reporting as a basis for designing audit procedures that are appropriate in the circumstances, but not for the purpose of expressing an opinion on the effectiveness of the Fund's internal control over financial reporting. Accordingly, we express no such opinion. An audit also includes examining, on a test basis, evidence supporting the amounts and disclosures in the financial statements and financial highlights, assessing the accounting principles used and significant estimates made by management, and evaluating the overall financial statement presentation. Our procedures included confirmation of securities owned as of April 30, 2011, by correspondence with the custodian and others or by other appropriate auditing procedures where replies from others were not received. We believe that our audits provide a reasonable basis for our opinion.
In our opinion, the financial statements and financial highlights referred to above present fairly, in all material respects, the financial position of Federated Short-Term Income Fund, a portfolio of Federated Income Securities Trust, at April 30, 2011, the results of its operations for the year then ended, the changes in its net assets for each of the two years in the period then ended, and the financial highlights for each of the five years in the period then ended, in conformity with U.S. generally accepted accounting principles.
Boston, Massachusetts
June 23, 2011
Annual Shareholder Report55
Board of Trustees and Trust Officers
The Board of Trustees is responsible for managing the Trust's business affairs and for exercising all the Trust's powers except those reserved for the shareholders. The following tables give information about each Trustee and the senior officers of the Fund. Where required, the tables separately list Trustees who are “interested persons” of the Fund (i.e., “Interested” Trustees) and those who are not (i.e., “Independent” Trustees). Unless otherwise noted, the address of each person listed is Federated Investors Tower, 1001 Liberty Avenue, Pittsburgh, PA 15222. The address of all Independent Trustees listed is 4000 Ericsson Drive, Warrendale, PA 15086-7561; Attention: Mutual Fund Board. As of December 31, 2010, the Trust comprised nine portfolio(s), and the Federated Fund Family consisted of 43 investment companies (comprising 136 portfolios). Unless otherwise noted, each Officer is elected annually. Unless otherwise noted, each Trustee oversees all portfolios in the Federated Fund Family and serves for an indefinite term. The Fund's Statement of Additional Information includes additional information about Trust Trustees and is available, without charge and upon request, by calling 1-800-341-7400.
Interested TRUSTEES Background
Name
Birth Date
Positions Held with Trust
Date Service Began | Principal Occupation(s) for Past Five Years,
Other Directorships Held and Previous Position(s) |
John F. Donahue*
Birth Date: July 28, 1924
Trustee
Began serving: January 1986 | Principal Occupations: Director or Trustee of the Federated Fund Family; Chairman and Director, Federated Investors, Inc.; Chairman of the Federated Fund Family's Executive Committee.
Previous Positions: Chairman of the Federated Fund Family; Trustee, Federated Investment Management Company; Chairman and Director, Federated Investment Counseling. |
J. Christopher Donahue*
Birth Date: April 11, 1949
President and Trustee
Began serving: January 2000 | Principal Occupations: Principal Executive Officer and President of the Federated Fund Family; Director or Trustee of some of the Funds in the Federated Fund Family; President, Chief Executive Officer and Director, Federated Investors, Inc.; Chairman and Trustee, Federated Investment Management Company; Trustee, Federated Investment Counseling; Chairman and Director, Federated Global Investment Management Corp.; Chairman, Federated Equity Management Company of Pennsylvania and Passport Research, Ltd. (investment advisory subsidiary of Federated); Trustee, Federated Shareholder Services Company; Director, Federated Services Company.
Previous Positions: President, Federated Investment Counseling; President and Chief Executive Officer, Federated Investment Management Company, Federated Global Investment Management Corp. and Passport Research, Ltd. |
| * | Family relationships and reasons for “interested” status: John F. Donahue is the father of J. Christopher Donahue; both are “interested” due to their beneficial ownership of shares of Federated Investors, Inc. and the positions they hold with Federated and its subsidiaries. |
Annual Shareholder Report56
INDEPENDENT TRUSTEES Background
Name
Birth Date
Positions Held with Trust
Date Service Began | Principal Occupation(s) for Past Five Years,
Other Directorships Held, Previous Position(s) and Qualifications |
Nicholas P. Constantakis, CPA
Birth Date: September 3, 1939
Trustee
Began serving: February 1998 | Principal Occupation: Director or Trustee of the Federated Fund Family.
Other Directorship Held: Director and Chairman of the Audit Committee, Michael Baker Corporation (architecture, engineering and construction services).
Previous Position: Partner, Andersen Worldwide SC.
Qualifications: Public accounting and director experience. |
John F. Cunningham
Birth Date: March 5, 1943
Trustee
Began serving: January 1999 | Principal Occupation: Director or Trustee of the Federated Fund Family.
Other Directorships Held: Chairman, President and Chief Executive Officer, Cunningham & Co., Inc. (strategic business consulting); Trustee Associate, Boston College.
Previous Positions: Director, Redgate Communications and EMC Corporation (computer storage systems); Chairman of the Board and Chief Executive Officer, Computer Consoles, Inc.; President and Chief Operating Officer, Wang Laboratories; Director, First National Bank of Boston; Director, Apollo Computer, Inc.
Qualifications: Business management and director experience. |
Maureen Lally-Green
Birth Date: July 5, 1949
Trustee
Began serving: August 2009 | Principal Occupations: Director or Trustee of the Federated Fund Family; Director, Office of Church Relations, Diocese of Pittsburgh; Adjunct Professor of Law, Duquesne University School of Law.
Other Directorships Held: Director, Auberle; Trustee, St. Francis University; Director, Ireland Institute of Pittsburgh; Director, UPMC Mercy Hospital; Regent, St. Vincent Seminary; Director, Epilepsy Foundation of Western and Central Pennsylvania; Director, Saint Thomas More Society, Allegheny County; Director, Carlow University.
Previous Position: Pennsylvania Superior Court Judge.
Qualifications: Legal and director experience. |
Peter E. Madden
Birth Date: March 16, 1942
Trustee
Began serving: November 1991 | Principal Occupation: Director or Trustee, and Chairman of the Board of Directors or Trustees, of the Federated Fund Family.
Previous Positions: Representative, Commonwealth of Massachusetts General Court; President, Chief Operating Officer and Director, State Street Bank and Trust Company and State Street Corporation (retired); Director, VISA USA and VISA International; Chairman and Director, Massachusetts Bankers Association; Director, Depository Trust Corporation; Director, The Boston Stock Exchange.
Qualifications: Business management, mutual fund services and director experience. |
Annual Shareholder Report57
Name
Birth Date
Positions Held with Trust
Date Service Began | Principal Occupation(s) for Past Five Years,
Other Directorships Held, Previous Position(s) and Qualifications |
Charles F. Mansfield, Jr.
Birth Date: April 10, 1945
Trustee
Began serving: January 2000 | Principal Occupations: Director or Trustee and Chairman of the Audit Committee of the Federated Fund Family; Management Consultant.
Previous Positions: Chief Executive Officer, PBTC International Bank; Partner, Arthur Young & Company (now Ernst & Young LLP); Chief Financial Officer of Retail Banking Sector, Chase Manhattan Bank; Senior Vice President, HSBC Bank USA (formerly, Marine Midland Bank); Vice President, Citibank; Assistant Professor of Banking and Finance, Frank G. Zarb School of Business, Hofstra University; Executive Vice President, DVC Group, Inc. (marketing, communications and technology).
Qualifications: Banking, business management, education and director experience. |
R. James Nicholson
Birth Date: February 4, 1938
Trustee
Began serving: January 2008 | Principal Occupations: Director or Trustee of the Federated Fund Family; Senior Counsel, Brownstein Hyatt Farber Schrek, P.C.; Former Secretary of the U.S. Dept. of Veterans Affairs; Former U.S. Ambassador to the Holy See; Former Chairman of the Republican National Committee.
Other Directorships Held: Director, Horatio Alger Association; Director, The Daniels Fund.
Previous Positions: Colonel, U.S. Army Reserve; Partner, Calkins, Kramer, Grimshaw and Harring, P.C.; General Counsel, Colorado Association of Housing and Building; Chairman and CEO, Nicholson Enterprises, Inc. (real estate holding company); Chairman and CEO, Renaissance Homes of Colorado.
Qualifications: Legal, government, business management and director experience. |
Thomas M. O'Neill
Birth Date: June 14, 1951
Trustee
Began serving: October 2006 | Principal Occupations: Director or Trustee of the Federated Fund Family; Sole Proprietor, Navigator Management Company (investment and strategic consulting).
Other Directorships Held: Board of Overseers, Children's Hospital of Boston; Visiting Committee on Athletics, Harvard College.
Previous Positions: Chief Executive Officer and President, Managing Director and Chief Investment Officer, Fleet Investment Advisors; President and Chief Executive Officer, Aeltus Investment Management, Inc.; General Partner, Hellman, Jordan Management Co., Boston, MA; Chief Investment Officer, The Putnam Companies, Boston, MA; Credit Analyst and Lending Officer, Fleet Bank; Director and Consultant, EZE Castle Software (investment order management software); Director, Midway Pacific (lumber).
Qualifications: Business management, mutual fund, director and investment experience. |
Annual Shareholder Report58
Name
Birth Date
Positions Held with Trust
Date Service Began | Principal Occupation(s) for Past Five Years,
Other Directorships Held, Previous Position(s) and Qualifications |
John S. Walsh
Birth Date: November 28, 1957
Trustee
Began serving: January 2000 | Principal Occupations: Director or Trustee of the Federated Fund Family; President and Director, Heat Wagon, Inc. (manufacturer of construction temporary heaters); President and Director, Manufacturers Products, Inc. (distributor of portable construction heaters); President, Portable Heater Parts, a division of Manufacturers Products, Inc.
Previous Position: Vice President, Walsh & Kelly, Inc.
Qualifications: Business management and director experience. |
James F. Will
Birth Date: October 12, 1938
Trustee
Began serving: April 2006 | Principal Occupations: Director or Trustee of the Federated Fund Family; formerly, Vice Chancellor and President, Saint Vincent College.
Other Directorships Held: Trustee, Saint Vincent College; Director, Alleghany Corporation; Trustee, Wheeling Jesuit University; Director, Liberty Tire Recycling.
Previous Positions: Chairman, President and Chief Executive Officer, Armco, Inc.; President and Chief Executive Officer, Cyclops Industries; President and Chief Operating Officer, Kaiser Steel Corporation.
Qualifications: Business management, education and director experience. |
OFFICERS
Name
Birth Date
Address
Positions Held with Trust
Date Service Began | Principal Occupation(s) for Past Five Years
and Previous Position(s) |
John W. McGonigle
Birth Date: October 26, 1938
EXECUTIVE VICE PRESIDENT AND SECRETARY
Began serving: January 1986 | Principal Occupations: Executive Vice President and Secretary of the Federated Fund Family; Vice Chairman, Executive Vice President, Secretary and Director, Federated Investors, Inc.
Previous Positions: Trustee, Federated Investment Management Company and Federated Investment Counseling; Director, Federated Global Investment Management Corp., Federated Services Company and Federated Securities Corp. |
Richard A. Novak
Birth Date: December 25, 1963
TREASURER
Began serving: January 2006 | Principal Occupations: Principal Financial Officer and Treasurer of the Federated Fund Family; Senior Vice President, Federated Administrative Services; Financial and Operations Principal for Federated Securities Corp., Edgewood Services, Inc. and Southpointe Distribution Services, Inc.
Previous Positions: Controller of Federated Investors, Inc.; Vice President, Finance of Federated Services Company; held various financial management positions within The Mercy Hospital of Pittsburgh; Auditor, Arthur Andersen & Co. |
Annual Shareholder Report59
Name
Birth Date
Address
Positions Held with Trust
Date Service Began | Principal Occupation(s) for Past Five Years
and Previous Position(s) |
Richard B. Fisher
Birth Date: May 17, 1923
VICE PRESIDENT
Began serving: January 1986 | Principal Occupations: Vice Chairman or Vice President of some of the Funds in the Federated Fund Family; Vice Chairman, Federated Investors, Inc.; Chairman, Federated Securities Corp.
Previous Positions: President and Director or Trustee of some of the Funds in the Federated Fund Family; Executive Vice President, Federated Investors, Inc.; Director and Chief Executive Officer, Federated Securities Corp. |
Brian P. Bouda
Birth Date: February 28, 1947
CHIEF COMPLIANCE OFFICER AND SENIOR VICE PRESIDENT
Began serving: August 2004 | Principal Occupations: Senior Vice President and Chief Compliance Officer of the Federated Fund Family; Vice President and Chief Compliance Officer of Federated Investors, Inc. and Chief Compliance Officer of its subsidiaries. Mr. Bouda joined Federated in 1999 and is a member of the American Bar Association and the State Bar Association of Wisconsin. |
Stephen F. Auth
Birth Date: September 3, 1956
450 Lexington Avenue
Suite 3700
New York, NY 10017-3943
CHIEF INVESTMENT OFFICER
Began serving: May 2004 | Principal Occupations: Mr. Auth is Chief Investment Officer of this Fund and various other Funds in the Federated Fund Family; Executive Vice President, Federated Investment Counseling, Federated Global Investment Management Corp. and Federated Equity Management Company of Pennsylvania.
Previous Positions: Executive Vice President, Federated Investment Management Company, and Passport Research, Ltd. (investment advisory subsidiary of Federated); Senior Vice President, Global Portfolio Management Services Division; Senior Vice President, Federated Investment Management Company and Passport Research, Ltd.; Senior Managing Director and Portfolio Manager, Prudential Investments. |
Robert J. Ostrowski
Birth Date: April 26, 1963
CHIEF INVESTMENT OFFICER
Began serving: May 2004 | Principal Occupations: Robert J. Ostrowski joined Federated in 1987 as an Investment Analyst and became a Portfolio Manager in 1990. He was named Chief Investment Officer of taxable fixed-income products in 2004 and also serves as a Senior Portfolio Manager. He has been a Senior Vice President of the Fund's Adviser since 1997. Mr. Ostrowski has received the Chartered Financial Analyst designation. He received his M.S. in Industrial Administration from Carnegie Mellon University. |
Joseph M. Balestrino
Birth Date: November 3, 1954
VICE PRESIDENT
Began serving: November 1998 | Principal Occupations: Joseph M. Balestrino is Vice President of the Trust. Mr. Balestrino joined Federated in 1986 and has been a Senior Portfolio Manager and Senior Vice President of the Fund's Adviser since 1998. He was a Portfolio Manager and a Vice President of the Fund's Adviser from 1995 to 1998. Mr. Balestrino served as a Portfolio Manager and an Assistant Vice President of the Adviser from 1993 to 1995. Mr. Balestrino has received the Chartered Financial Analyst designation and holds a Master's Degree in Urban and Regional Planning from the University of Pittsburgh. |
Randall S. Bauer
Birth Date: November 16, 1957
VICE PRESIDENT
Began serving: November 1998 | Principal Occupations: Randall S. Bauer has been the Fund's Portfolio Manager since October 1995. He is Vice President of the Trust. Mr. Bauer joined Federated in 1989 and has been a Portfolio Manager and a Vice President of the Fund's Adviser since 1994, and a Senior Vice President of the Fund's Adviser beginning 2007. Mr. Bauer has received the Chartered Financial Analyst designation and an M.B.A. in Finance from the Pennsylvania State University. |
Annual Shareholder Report60
Name
Birth Date
Address
Positions Held with Trust
Date Service Began | Principal Occupation(s) for Past Five Years
and Previous Position(s) |
John L. Nichol
Birth Date: May 21, 1963
VICE PRESIDENT
Began serving: May 2004 | Principal Occupations: John L. Nichol is Vice President of the Trust. Mr. Nichol joined Federated in September 2000 as an Assistant Vice President/Senior Investment Analyst. He has been a Portfolio Manager since December 2000, and was named a Vice President of the Fund's Adviser in July 2001. Mr. Nichol served as a portfolio manager and analyst for the Public Employees Retirement System of Ohio from 1992 through August 2000. Mr. Nichol has received the Chartered Financial Analyst designation. He received his M.B.A. with an emphasis in Finance and Management and Information Science from the Ohio State University. |
Annual Shareholder Report61
Evaluation and Approval of Advisory Contract – May 2010
Federated Short-Term Income Fund (the “Fund”)
The Fund's Board reviewed the Fund's investment advisory contract at meetings held in May 2010. The Board's decision regarding the contract reflects the exercise of its business judgment on whether to continue the existing arrangements.
In this connection, the Federated funds' Board had previously appointed a Senior Officer, whose duties include specified responsibilities relating to the process by which advisory fees are to be charged to a Federated fund. The Senior Officer has the authority to retain consultants, experts, or staff as may be reasonably necessary to assist in the performance of his duties, reports directly to the Board, and may be terminated only with the approval of a majority of the independent members of the Board. The Senior Officer prepared and furnished to the Board an independent, written evaluation that covered topics discussed below. The Board considered that evaluation, along with other information, in deciding to approve the advisory contract.
During its review of the contract, the Board considered compensation and benefits received by the Adviser. This included the fees received for services provided to the Fund by other entities in the Federated organization and research services (if any) received by the Adviser from brokers that execute Federated fund trades, as well as advisory fees. The Board is also familiar with and considered judicial decisions concerning allegedly excessive investment advisory fees, which have indicated that the following factors may be relevant to an Adviser's fiduciary duty with respect to its receipt of compensation from a fund: the nature and quality of the services provided by the Adviser, including the performance of the fund; the Adviser's cost of providing the services; the extent to which the Adviser may realize “economies of scale” as a fund grows larger; any indirect benefits that may accrue to the Adviser and its affiliates as a result of the Adviser's relationship with a fund; performance and expenses of comparable funds; and the extent to which the independent Board members are fully informed about all facts the Board deems relevant bearing on the Adviser's services and fees. The Board further considered management fees (including any components thereof) charged to institutional and other clients of the Adviser for what might be viewed as like services, and the cost to the Adviser and its affiliates of supplying services pursuant to the management fee agreements, excluding any intra-corporate profit and profit margins of the Adviser and its affiliates for supplying such services. The Board was aware of these factors and was guided by them in its review of the Fund's advisory contract to the extent it considered them to be appropriate and relevant, as discussed further below.
Annual Shareholder Report
62
The Board considered and weighed these circumstances in light of its substantial accumulated experience in governing the Fund and working with Federated on matters relating to the Federated funds, and was assisted in its deliberations by independent legal counsel. Throughout the year, the Board has requested and received substantial and detailed information about the Fund and the Federated organization that was in addition to the extensive materials that comprise and accompany the Senior Officer's evaluation. Federated provided much of this information at each regular meeting of the Board, and furnished additional reports in connection with the particular meeting at which the Board's formal review of the advisory contract occurred. Between regularly scheduled meetings, the Board also received information on particular matters as the need arose. Thus, the Board's consideration of the advisory contract included review of the Senior Officer's evaluation, accompanying data and additional reports covering such matters as: the Adviser's investment philosophy, revenue, profitability, personnel and processes; investment and operating strategies; the Fund's short- and long-term performance (in absolute terms, both on a gross basis and net of expenses, as well as in relationship to its particular investment program and certain competitor or “peer group” funds and/or other benchmarks, as appropriate), and comments on the reasons for performance; the Fund's investment objectives; the Fund's expenses (including the advisory fee itself and the overall expense structure of the Fund, both in absolute terms and relative to similar and/or competing funds, with due regard for contractual or voluntary expense limitations); the use and allocation of brokerage commissions derived from trading the Fund's portfolio securities (if any); and the nature, quality and extent of the advisory and other services provided to the Fund by the Adviser and its affiliates. The Board also considered the preferences and expectations of Fund shareholders and their relative sophistication; the continuing state of competition in the mutual fund industry and market practices; the range of comparable fees for similar funds in the mutual fund industry; the Fund's relationship to the Federated family of funds which include a comprehensive array of funds with different investment objectives, policies and strategies which are available for exchange without the incurrence of additional sales charges; compliance and audit reports concerning the Federated funds and the Federated companies that service them (including communications from regulatory agencies), as well as Federated's responses to any issues raised therein; and relevant developments in the mutual fund industry and how the Federated funds and/or Federated are responding to them. The Board's evaluation process is evolutionary. The criteria considered and the emphasis placed on relevant criteria change in recognition of changing circumstances in the mutual fund marketplace.With respect to the Fund's performance and expenses in particular, the Board has found the use of comparisons to other mutual funds with comparable investment programs to be relevant, given the high degree of competition in the mutual fund business. The Board focused on comparisons with other similar Annual Shareholder Report
63
mutual funds more heavily than non-mutual fund products or services because it is believed that they are more relevant. For example, other mutual funds are the products most like the Fund, they are readily available to Fund shareholders as alternative investment vehicles, and they are the type of investment vehicle in fact chosen and maintained by the Fund's investors. The range of their fees and expenses therefore appears to be a generally reliable indication of what consumers have found to be reasonable in the precise marketplace in which the Fund competes. The Fund's ability to deliver competitive performance when compared to its peer group was a useful indicator of how the Adviser is executing the Fund's investment program, which in turn assisted the Board in reaching a conclusion that the nature, extent, and quality of the Adviser's investment management services were such as to warrant continuation of the advisory contract. In this regard, the Senior Officer has reviewed Federated's fees for providing advisory services to products outside the Federated family of funds (e.g., institutional and separate accounts). He concluded that mutual funds and institutional accounts are inherently different products. Those differences include, but are not limited to, different types of targeted investors; being subject to different laws and regulations; different legal structures; different average account sizes; different associated costs; different portfolio management techniques made necessary by different cash flows; and portfolio manager time spent in review of securities pricing. The Senior Officer did not consider these fee schedules to be determinative in judging the appropriateness of mutual fund advisory contracts.The Senior Officer reviewed reports compiled by Federated, using data supplied by independent fund ranking organizations, regarding the performance of, and fees charged by, other mutual funds, noting his view that comparisons to fund peer groups are relevant in judging the reasonableness of proposed fees.
For the periods covered by the report, the Fund's performance for the one-year and five-year periods was above the median of the relevant peer group, and the Fund's performance fell below the median of the relevant peer group for the three-year period. The Board discussed the Fund's performance with the Adviser and recognized the efforts being undertaken by the Adviser. The Board will continue to monitor these efforts and the performance of the Fund.
The Board also received financial information about Federated, including reports on the compensation and benefits Federated derived from its relationships with the Federated funds. These reports covered not only the fees under the advisory contracts, but also fees received by Federated's subsidiaries for providing other services to the Federated funds under separate contracts (e.g., for serving as the Federated funds' administrator). The reports also discussed any indirect benefit Federated may derive from its receipt of research services from brokers who execute Federated fund trades. In addition, the Board considered the fact that, in order for a fund to be competitive in the marketplace, Federated and its affiliates frequently waived fees and/or Annual Shareholder Report
64
reimbursed expenses and have disclosed to fund investors and/or indicated to the Board their intention to do so in the future, where appropriate. Moreover, the Board receives regular reports regarding the institution or elimination of these voluntary waivers.Federated furnished reports, requested by the Senior Officer, that reported revenues on a fund-by-fund basis and made estimates of the allocation of expenses on a fund-by-fund basis, using allocation methodologies specified by the Senior Officer. The Senior Officer noted that, although they may apply consistent allocation processes, the inherent difficulties in allocating costs (and the unavoidable arbitrary aspects of that exercise) and the lack of consensus on how to allocate those costs may render such allocation reports unreliable. The allocation reports were considered in the analysis by the Board but were determined to be of limited use.
The Board and the Senior Officer also reviewed a report compiled by Federated comparing profitability information for Federated to other publicly held fund management companies. In this regard, the Senior Officer noted the limited availability of such information, but nonetheless concluded that Federated's profit margins did not appear to be excessive and the Board agreed.
The Senior Officer's evaluation also discussed the notion of possible realization of “economies of scale” as a fund grows larger. The Board considered in this regard that the Adviser has made significant and long-term investments in areas that support all of the Federated funds, such as personnel and processes for the portfolio management, compliance, and risk management functions; and systems technology; and that the benefits of these efforts (as well as any economies, should they exist) were likely to be enjoyed by the fund complex as a whole. Finally, the Board also noted the absence of any applicable regulatory or industry guidelines on this subject, which (as discussed in the Senior Officer's evaluation) is compounded by the lack of any common industry practice or general pattern with respect to structuring fund advisory fees with “breakpoints” that serve to reduce the fee as the fund attains a certain size. The Senior Officer did not recommend institution of breakpoints in pricing Federated's fund advisory services at this time.
It was noted in the materials for the Board meeting that for the period covered by the report, the Fund's investment advisory fee, after waivers and expense reimbursements, if any, was below the median of the relevant peer group. The Board reviewed the fees and other expenses of the Fund with the Adviser and was satisfied that the overall expense structure of the Fund remained competitive.
The Senior Officer's evaluation noted his belief that the information and observations contained in his evaluation supported a finding that the proposed management fees are reasonable, and that Federated appeared to provide appropriate administrative services to the Fund for the fees paid. Under these Annual Shareholder Report
65
circumstances, no changes were recommended to, and no objection was raised to, the continuation of the Fund's advisory contract. The Board concluded that the nature, quality and scope of services provided the Fund by the Adviser and its affiliates were satisfactory.In its decision to continue an existing investment advisory contract, the Board was mindful of the potential disruptions of the Fund's operations and various risks, uncertainties and other effects that could occur as a result of a decision to terminate or not renew an advisory contract. In particular, the Board recognized that many shareholders have invested in the Fund on the strength of the Adviser's industry standing and reputation and with the expectation that the Adviser will have a continuing role in providing advisory services to the Fund. Thus, the Board's approval of the advisory contract reflected the fact that it is the shareholders who have effectively selected the Adviser by virtue of having invested in the Fund.
The Board based its decision to approve the advisory contract on the totality of the circumstances and relevant factors and with a view to past and future long-term considerations. Not all of the factors and considerations identified above were necessarily relevant to the Fund, nor did the Board consider any one of them to be determinative. With respect to the factors that were relevant, the Board's decision to approve the contract reflects its determination that Federated's performance and actions provided a satisfactory basis to support the decision to continue the existing arrangements.
Annual Shareholder Report66
Voting Proxies on Fund Portfolio Securities
A description of the policies and procedures that the Fund uses to determine how to vote proxies, if any, relating to securities held in the Fund's portfolio is available, without charge and upon request, by calling 1-800-341-7400. A report on “Form N-PX” of how the Fund voted any such proxies during the most recent 12-month period ended June 30 is available from Federated's website at FederatedInvestors.com. To access this information from the home page, select “View All” next to “Find Products.” Select a fund name and share class, if applicable, to go to the Fund Overview page. On the Fund Overview page, select the “Documents” tab. At the bottom of that page, select “Proxy Voting Record Report (Form N-PX).” Form N-PX filings are also available at the SEC's website at www.sec.gov.
Quarterly Portfolio Schedule
The Fund files with the SEC a complete schedule of its portfolio holdings, as of the close of the first and third quarters of its fiscal year, on “Form N-Q.” These filings are available on the SEC's website at www.sec.gov and may be reviewed and copied at the SEC's Public Reference Room in Washington, DC. (Call 1-800-SEC-0330 for information on the operation of the Public Reference Room.) You may also access this information from the “Products” section of Federated's website at FederatedInvestors.com. From the home page, select “View All” next to “Find Products.” Select a fund name and share class, if applicable, to go to the Fund Overview page. On the Fund Overview page, select the “Documents” tab. At the bottom of that page, select “Form N-Q.”
Annual Shareholder Report67
Mutual funds are not bank deposits or obligations, are not guaranteed by any bank and are not insured or guaranteed by the U.S. government, the Federal Deposit Insurance Corporation, the Federal Reserve Board or any other government agency. Investment in mutual funds involves investment risk, including the possible loss of principal.
This Report is authorized for distribution to prospective investors only when preceded or accompanied by the Fund's Prospectus, which contains facts concerning its objective and policies, management fees, expenses and other information.
Federated Short-Term Income Fund
Federated Investors Funds
4000 Ericsson Drive
Warrendale, PA 15086-7561
Contact us at FederatedInvestors.com
or call 1-800-341-7400.
Federated Securities Corp., Distributor
Cusip 31420C795
Cusip 31420C209
Cusip 31420C308
Cusip 31420C787
32957 (6/11)
Federated is a registered trademark of Federated Investors, Inc.
2011 © Federated Investors, Inc.
Item 2. Code of Ethics
(a) As of the end of the period covered by this report, the registrant has adopted a code of ethics (the "Section 406 Standards for Investment Companies - Ethical Standards for Principal Executive and Financial Officers") that applies to the registrant's Principal Executive Officer and Principal Financial Officer; the registrant's Principal Financial Officer also serves as the Principal Accounting Officer.
(c) Not Applicable
(d) Not Applicable
(e) Not Applicable
(f)(3) The registrant hereby undertakes to provide any person, without charge, upon request, a copy of the code of ethics. To request a copy of the code of ethics, contact the registrant at 1-800-341-7400, and ask for a copy of the Section 406 Standards for Investment Companies - Ethical Standards for Principal Executive and Financial Officers.
Item 3. Audit Committee Financial Expert
The registrant's Board has determined that each of the following members of the Board's Audit Committee is an “audit committee financial expert,” and is "independent," for purposes of this Item: Nicholas P. Constantakis, Charles F. Mansfield, Jr., Thomas M. O'Neill and John S. Walsh.
Item 4. Principal Accountant Fees and Services
(a) Audit Fees billed to the registrant for the two most recent fiscal years:
Fiscal year ended 2011 - $208,600
Fiscal year ended 2010 - $187,500
(b) Audit-Related Fees billed to the registrant for the two most recent fiscal years:
Fiscal year ended 2011 - $218
Fiscal year ended 2010 - $156
Travel to Audit Committee Meetings.
Amount requiring approval of the registrant’s audit committee pursuant to paragraph (c)(7)(ii) of Rule 2-01 of Regulation S-X, $0 and $0 respectively
(c) Tax Fees billed to the registrant for the two most recent fiscal years:
Fiscal year ended 2011 - $0
Fiscal year ended 2010 - $0
Amount requiring approval of the registrant’s audit committee pursuant to paragraph (c)(7)(ii) of Rule 2-01 of Regulation S-X, $2,387 and $0 respectively. Fiscal year ended 2011 – Tax preparation fees for fiscal year end 2010.
(d) All Other Fees billed to the registrant for the two most recent fiscal years:
Fiscal year ended 2011 - $0
Fiscal year ended 2010 - $0
Amount requiring approval of the registrant’s audit committee pursuant to paragraph (c)(7)(ii) of Rule 2-01 of Regulation S-X, $36,504 and $54,143 respectively. Fiscal year ended 2011- Service fee for analysis of potential Passive Foreign Investment Company holdings. Fiscal year ended 2010- Fees related to technical assistance and valuation matters for fund acquisitions and service fee for analysis of potential Passive Foreign Investment Company holdings.
(e)(1) Audit Committee Policies regarding Pre-approval of Services.
The Audit Committee is required to pre-approve audit and non-audit services performed by the independent auditor in order to assure that the provision of such services do not impair the auditor’s independence. Unless a type of service to be provided by the independent auditor has received general pre-approval, it will require specific pre-approval by the Audit Committee. Any proposed services exceeding pre-approved cost levels will require specific pre-approval by the Audit Committee.
Certain services have the general pre-approval of the Audit Committee. The term of the general pre-approval is 12 months from the date of pre-approval, unless the Audit Committee specifically provides for a different period. The Audit Committee will annually review the services that may be provided by the independent auditor without obtaining specific pre-approval from the Audit Committee and may grant general pre-approval for such services. The Audit Committee will revise the list of general pre-approved services from time to time, based on subsequent determinations. The Audit Committee will not delegate its responsibilities to pre-approve services performed by the independent auditor to management.
The Audit Committee has delegated pre-approval authority to its Chairman. The Chairman will report any pre-approval decisions to the Audit Committee at its next scheduled meeting. The Committee will designate another member with such pre-approval authority when the Chairman is unavailable.
AUDIT SERVICES
The annual Audit services engagement terms and fees will be subject to the specific pre-approval of the Audit Committee. The Audit Committee must approve any changes in terms, conditions and fees resulting from changes in audit scope, registered investment company (RIC) structure or other matters.
In addition to the annual Audit services engagement specifically approved by the Audit Committee, the Audit Committee may grant general pre-approval for other Audit Services, which are those services that only the independent auditor reasonably can provide. The Audit Committee has pre-approved certain Audit services, all other Audit services must be specifically pre-approved by the Audit Committee.
AUDIT-RELATED SERVICES
Audit-related services are assurance and related services that are reasonably related to the performance of the audit or review of the Company’s financial statements or that are traditionally performed by the independent auditor. The Audit Committee believes that the provision of Audit-related services does not impair the independence of the auditor, and has pre-approved certain Audit-related services, all other Audit-related services must be specifically pre-approved by the Audit Committee.
TAX SERVICES
The Audit Committee believes that the independent auditor can provide Tax services to the Company such as tax compliance, tax planning and tax advice without impairing the auditor’s independence. However, the Audit Committee will not permit the retention of the independent auditor in connection with a transaction initially recommended by the independent auditor, the purpose of which may be tax avoidance and the tax treatment of which may not be supported in the Internal Revenue Code and related regulations. The Audit Committee has pre-approved certain Tax services, all Tax services involving large and complex transactions must be specifically pre-approved by the Audit Committee.
ALL OTHER SERVICES
With respect to the provision of services other than audit, review or attest services the pre-approval requirement is waived if:
| (1) | The aggregate amount of all such services provided constitutes no more than five percent of the total amount of revenues paid by the registrant, the registrant’s adviser (not including any sub-adviser whose role is primarily portfolio management and is subcontracted with or overseen by another investment adviser), and any entity controlling, controlled by, or under common control with the investment adviser that provides ongoing services to the registrant to its accountant during the fiscal year in which the services are provided; |
| (2) | Such services were not recognized by the registrant, the registrant’s adviser (not including any sub-adviser whose role is primarily portfolio management and is subcontracted with or overseen by another investment adviser), and any entity controlling, controlled by, or under common control with the investment adviser that provides ongoing services to the registrant at the time of the engagement to be non-audit services; and |
| (3) | Such services are promptly brought to the attention of the Audit Committee of the issuer and approved prior to the completion of the audit by the Audit Committee or by one or more members of the Audit Committee who are members of the board of directors to whom authority to grant such approvals has been delegated by the Audit Committee. |
The Audit Committee may grant general pre-approval to those permissible non-audit services classified as All Other services that it believes are routine and recurring services, and would not impair the independence of the auditor.
The SEC’s rules and relevant guidance should be consulted to determine the precise definitions of prohibited non-audit services and the applicability of exceptions to certain of the prohibitions.
PRE-APPROVAL FEE LEVELS
Pre-approval fee levels for all services to be provided by the independent auditor will be established annually by the Audit Committee. Any proposed services exceeding these levels will require specific pre-approval by the Audit Committee.
PROCEDURES
Requests or applications to provide services that require specific approval by the Audit Committee will be submitted to the Audit Committee by both the independent auditor and the Principal Accounting Officer and/or Internal Auditor, and must include a joint statement as to whether, in their view, the request or application is consistent with the SEC’s rules on auditor independence.
(e)(2) Percentage of services identified in items 4(b) through 4(d) that were approved by the registrants audit committee pursuant to paragraph (c)(7)(i)(C) of Rule 2-01 of Regulation S-X:
4(b)
Fiscal year ended 2011 – 0%
Fiscal year ended 2010 - 0%
Percentage of services provided to the registrants investment adviser and any entity controlling, controlled by, or under common control with the investment adviser that provides ongoing services to the registrant that were approved by the registrants audit committee pursuant to paragraph (c)(7)(i)(C) of Rule 2-01 of Regulation S-X, 0% and 0% respectively.
4(c)
Fiscal year ended 2011 – 0%
Fiscal year ended 2010 – 0%
Percentage of services provided to the registrants investment adviser and any entity controlling, controlled by, or under common control with the investment adviser that provides ongoing services to the registrant that were approved by the registrants audit committee pursuant to paragraph (c)(7)(i)(C) of Rule 2-01 of Regulation S-X, 0% and 0% respectively.
4(d)
Fiscal year ended 2011 – 0%
Fiscal year ended 2010 – 0%
Percentage of services provided to the registrants investment adviser and any entity controlling, controlled by, or under common control with the investment adviser that provides ongoing services to the registrant that were approved by the registrants audit committee pursuant to paragraph (c)(7)(i)(C) of Rule 2-01 of Regulation S-X, 0% and 0% respectively.
| (g) | Non-Audit Fees billed to the registrant, the registrant’s investment adviser, and certain entities controlling, controlled by or under common control with the investment adviser: |
Fiscal year ended 2011 - $345,930
Fiscal year ended 2010 - $481,731
(h) The registrant’s Audit Committee has considered that the provision of non-audit services that were rendered to the registrant’s adviser (not including any sub-adviser whose role is primarily portfolio management and is subcontracted with or overseen by another investment adviser), and any entity controlling, controlled by, or under common control with the investment adviser that provides ongoing services to the registrant that were not pre-approved pursuant to paragraph (c)(7)(ii) of Rule 2-01 of Regulation S-X is compatible with maintaining the principal accountant’s independence.
Item 5. Audit Committee of Listed Registrants
Not Applicable
Item 6. Schedule of Investments
Not Applicable
| Item 7. | Disclosure of Proxy Voting Policies and Procedures for Closed-End Management Investment Companies |
| Item 8. | Portfolio Managers of Closed-End Management Investment Companies |
| Item 9. | Purchases of Equity Securities by Closed-End Management Investment Company and Affiliated Purchasers |
Item 10. Submission of Matters to a Vote of Security Holders
Not Applicable
Item 11. Controls and Procedures
(a) The registrant’s President and Treasurer have concluded that the
registrant’s disclosure controls and procedures (as defined in rule 30a-3(c) under the Act) are effective in design and operation and are sufficient to form the basis of the certifications required by Rule 30a-(2) under the Act, based on their evaluation of these disclosure controls and procedures within 90 days of the filing date of this report on Form N-CSR.
(b) There were no changes in the registrant’s internal control over financial reporting (as defined in rule 30a-3(d) under the Act) during the second fiscal quarter of the period covered by this report that have materially affected, or are reasonably likely to materially affect, the registrant’s internal control over financial reporting.
Item 12. Exhibits
SIGNATURES
Pursuant to the requirements of the Securities Exchange Act of 1934 and the Investment Company Act of 1940, the registrant has duly caused this report to be signed on its behalf by the undersigned, thereunto duly authorized.
Registrant Federated Income Securities Trust
| By | /S/Richard A. Novak |
| | Richard A. Novak, Principal Financial Officer |
| | |
| Date | _June 22, 2011 |
Pursuant to the requirements of the Securities Exchange Act of 1934 and the Investment Company Act of 1940, this report has been signed below by the following persons on behalf of the registrant and in the capacities and on the dates indicated.
| By | /S/J. Christopher Donahue |
| | J. Christopher Donahue, Principal Executive Officer |
| | |
| Date | _June 22, 2011 |
| | |
| | |
| By | /S/Richard A. Novak |
| | Richard A. Novak, Principal Financial Officer |
| | |
| Date | _June 22, 2011 |