United States
Securities and Exchange Commission
Washington, D.C. 20549
Form N-CSR
Certified Shareholder Report of Registered Management Investment Companies
811-4577
(Investment Company Act File Number)
Federated Income Securities Trust
_______________________________________________________________
(Exact Name of Registrant as Specified in Charter)
Federated Investors Funds
4000 Ericsson Drive
Warrendale, Pennsylvania 15086-7561
(Address of Principal Executive Offices)
(412) 288-1900
(Registrant's Telephone Number)
John W. McGonigle, Esquire
Federated Investors Tower
1001 Liberty Avenue
Pittsburgh, Pennsylvania 15222-3779
(Name and Address of Agent for Service)
(Notices should be sent to the Agent for Service)
Date of Fiscal Year End: 03/31/15
Date of Reporting Period: 03/31/15
Item 1. Reports to Stockholders

Annual Shareholder Report
March 31, 2015
| Share Class | Ticker |
| A | RRFAX |
| C | RRFCX |
| Institutional | RRFIX |
Federated Real Return Bond Fund
Fund Established 2006
A Portfolio of Federated Income Securities Trust
Dear Valued Shareholder,
I am pleased to present the Annual Shareholder Report for your fund covering the period from April 1, 2014 through March 31, 2015. This report includes Management's Discussion of Fund Performance, a complete listing of your fund's holdings, performance information and financial statements along with other important fund information.
In addition, our website, FederatedInvestors.com, offers easy access to Federated resources that include timely fund updates, economic and market insights from our investment strategists, and financial planning tools. We invite you to register to take full advantage of its capabilities.
Thank you for investing with Federated. I hope you find this information useful and look forward to keeping you informed.
Sincerely,
J. Christopher Donahue, President
Not FDIC Insured • May Lose Value • No Bank Guarantee
Management's Discussion of Fund Performance (unaudited)
The total return of Federated Real Return Bond Fund (the “Fund”), based on net asset value for the 12-month reporting period ended March 31, 2015, was -1.05% for the Class A Shares, -1.82% for the Class C Shares and -0.85% for the Institutional Shares. The Barclays U.S. TIPS Index (BTIPS),1 the Fund's broad-based securities market index, returned 3.11% for the same period. The total return of the Morningstar Inflation-Protected Bond Funds Average (MIPBFA),2 a peer group average for the Fund, was 1.30% for the same period. The Fund's and the MIPBFA's total returns for the most recently completed fiscal year reflected actual cash flows, transaction costs and other expenses, which were not reflected in the total return of the BTIPS.
During the reporting period, the Fund's investment strategy focused on: (a) duration;3 (b) yield curve; and (c) sector allocation. These were the most significant factors affecting the Fund's performance relative to the BTIPS.
The following discussion will focus on the performance of the Fund's Institutional Shares.
MARKET OVERVIEW
During the 12-month reporting period, domestic economic growth accelerated, labor market conditions improved and inflation readings were tepid. The Federal Reserve (the Fed) stopped its purchases of U.S. Treasury bonds and intimated that increases in the overnight lending rate would become necessary as the domestic economy continued to grow. However, global central banks continued to be accommodative in their respective monetary policies. The divergent paths of monetary policies strengthened the U.S. dollar versus other currencies. Commodity prices, specifically oil, sold off due to the strengthening dollar and tepid demand from international economies due to their slow growth. Inflation compensation and expectations fell dramatically. Breakeven inflation rates on the 10-year part of the curve declined from 230 basis points to 150 basis points. Real interest rates fell from 50 basis points at the start of the reporting period to under 10 basis points at the end of the reporting period. Inflation readings finished the reporting period with core measures (i.e., food and energy) at +1.7% and headline inflation declining from 2.1% to 0.0%.
DURATION
During the reporting period, the primary reason for the Fund's underperformance relative to the BTIPS was that the Fund had significantly less interest rate sensitivity than the BTIPS. Because higher interest rates can result in lower Treasury Inflation-Protected Securities (TIPS) prices, the Fund was managed with significantly less interest rate sensitivity than the BTIPS in order to protect shareholder value when interest rates rose. Since real yields fell during
Annual Shareholder Report
the reporting period, the Fund underperformed the BTIPS, which had much greater interest rate sensitivity due to a duration of close to six years. The Fund's duration risk was reduced by selling Treasury note futures contracts.4
YIELD CURVE
During the reporting period, the Fund's positioning of securities across the maturity spectrum reduced Fund performance relative to the BTIPS. The inflation portfolio had an overweight to the longer maturity inflation bonds.5 However, to achieve duration targets, longer maturity Treasury futures were sold. This short exposure to the long end of the nominal Treasury curve hurt Fund performance relative to the BTIPS.
SECTOR ALLOCATION
The Fund maintained a position in both investment-grade6 and high-yield7 corporates for the reporting period. These two sectors were not represented in the BTIPS. The Fund's allocation to these two sectors through investments in both derivatives and a core fund,8 subtracted from the Fund's performance relative to BTIPS. The derivative exposure was achieved via credit default index swaps, which enabled the Fund to “own” a basket of corporate securities on an essentially cashless basis. This enabled the Fund to have exposure to the credit markets and invest in TIPS at the same time, thereby maintaining shareholder protection from rising inflation.
| 1 | Please see the footnotes to the line graph under “Fund Performance and Growth of a $10,000 Investment” below for the definition of, and more information about, the BTIPS. |
| 2 | Please see the footnotes to the line graph under “Fund Performance and Growth of a $10,000 Investment” below for the definition of, and more information about, the MIPBFA. |
| 3 | Duration is a measure of a security's price sensitivity to changes in interest rates. Securities with longer durations are more sensitive to changes in interest rates than securities of shorter durations. |
| 4 | The Fund's use of derivative instruments involves risks different from, or possibly greater than, the risks associated with investing directly in securities and other traditional instruments. |
| 5 | Bond prices are sensitive to changes in interest rates, and a rise in interest rates may cause a decline in their prices. |
| 6 | Investment-grade securities are securities that are rated at least “BBB” or unrated securities of a comparable quality. Noninvestment-grade securities are securities that are not rated at least “BBB” or unrated securities of a comparable quality. Credit ratings are an indication of the risk that a security will default. They do not protect a security from credit risk. Lower-rated bonds typically offer higher yields to help compensate investors for the increased risk associated with them. Among these risks are lower creditworthiness, greater price volatility, more risk to principal and income than with higher-rated securities and increased possibilities of default. |
| 7 | High-yield, lower-rated securities generally entail greater market, credit/default and liquidity risks, and may be more volatile than investment-grade securities. |
| 8 | The Fund invests in high-yield fixed-income securities by investing in High Yield Bond Portfolio (HYCORE). HYCORE is an affiliated investment company that is registered under the Investment Company Act of 1940, but not the Securities Act of 1933. HYCORE is available for sale only to Federated Investment Counseling through a discretionary advisory relationship. HYCORE will not be offered or sold to any other person or entity. |
Annual Shareholder Report
FUND PERFORMANCE AND GROWTH OF A $10,000 INVESTMENT
The graph below illustrates the hypothetical investment of $10,0001 in the Federated Real Return Bond Fund (the “Fund”) from October 18, 2006 (start of performance) to March 31, 2015, compared to the Barclays U.S. TIPS Index (BTIPS)2 and the Morningstar Inflation-Protected Bond Funds Average (MIPBFA).3 The Average Annual Total Return table below shows returns for each class averaged over the stated periods.
Growth of a $10,000 Investment
Growth of $10,000 as of March 31, 2015

| Federated Real Return Bond Fund - | Class A Shares | Institutional Shares | BTIPS | MIPBFA |
| F | F | I | I |
| 10/18/2006 | 9,550 | 10,000 | 10,000 | 10,000 |
| 3/31/2007 | 9,797 | 10,262 | 10,265 | 10,238 |
| 3/31/2008 | 11,118 | 11,673 | 11,757 | 11,526 |
| 3/31/2009 | 10,914 | 11,475 | 11,518 | 10,944 |
| 3/31/2010 | 11,713 | 12,334 | 12,230 | 11,753 |
| 3/31/2011 | 12,206 | 12,884 | 13,197 | 12,608 |
| 3/31/2012 | 12,889 | 13,651 | 14,808 | 13,837 |
| 3/31/2013 | 13,292 | 14,107 | 15,649 | 14,498 |
| 3/31/2014 | 12,788 | 13,614 | 14,634 | 13,608 |
| 3/31/2015 | 12,654 | 13,498 | 15,088 | 13,782 |
41 graphic description end -->
| ■ | Total returns shown for the Class A Shares include the maximum sales charge of 4.50% ($10,000 investment minus $450 sales charge = $9,550). |
The Fund offers multiple share classes whose performance may be greater than or less than its other share class(es) due to differences in sales charges and expenses. See the Average Annual Total Return table below for the returns of additional classes not shown in the line graph above.
Average Annual Total Returns for the Period Ended March 31, 2015
(returns reflect all applicable sales charges and contingent deferred sales charges as specified below in footnote #1)
| | 1 Year | 5 Years | Start of
Performance* |
| Class A Shares | -5.49% | 0.62% | 2.82% |
| Class C Shares | -2.79% | 0.79% | 2.71% |
| Institutional Shares | -0.85% | 1.82% | 3.61% |
| BTIPS | 3.11% | 4.29% | 4.99% |
| MIPBFA | 1.30% | 3.23% | 3.90% |
| * | The Fund's Class A Shares, Class C Shares and Institutional Shares start of performance date was October 18, 2006. |
Annual Shareholder Report
Performance data quoted represents past performance which is no guarantee of future results. Investment return and principal value will fluctuate so that an investor's shares, when redeemed, may be worth more or less than their original cost. Mutual fund performance changes over time and current performance may be lower or higher than what is stated. For current to the most recent month-end performance and after-tax returns, visit FederatedInvestors.com or call 1-800-341-7400. Returns shown do not reflect the deduction of taxes that a shareholder would pay on Fund distributions or the redemption of Fund shares. Mutual funds are not obligations of or guaranteed by any bank and are not federally insured.
| 1 | Represents a hypothetical investment of $10,000 in the Fund after deducting the applicable sales charge: for Class A Shares, the maximum sales charge of 4.50% ($10,000 investment minus $450 sales charge = $9,550); for Class C Shares, a 1.00% contingent deferred sales charge would be applied to any redemption less than one year from the purchase date. The Fund's performance assumes the reinvestment of all dividends and distributions. The BTIPS and the MIPBFA have been adjusted to reflect reinvestment of dividends on securities in the index and average. |
| 2 | The BTIPS is a market value-weighted index that tracks inflation-protected securities issued by the U.S. Treasury. The BTIPS is not adjusted to reflect sales charges, expenses or other fees that the Securities and Exchange Commission requires to be reflected in the Fund's performance. The index is unmanaged and, unlike the Fund, is not affected by cash flows. It is not possible to invest directly in an index. |
| 3 | Morningstar figures represent the average of the total returns reported by all the mutual funds designated by Morningstar as falling into the respective category indicated. They do not reflect sales charges. |
Annual Shareholder Report
Portfolio of Investments Summary Table (unaudited)
At March 31, 2015, the Fund's portfolio composition1 was as follows:
| | Percentage of
Total Net Assets2 |
| U.S. Treasury Inflation-Protected Securities | 85.1% |
| Corporate Debt Securities | 8.8% |
| Other Security Types3,4 | 0.0% |
| Derivative Contracts5 | (0.7)% |
| Cash Equivalents6 | 5.3% |
| Other Assets and Liabilities—Net7 | 1.5% |
| TOTAL | 100.0% |
| 1 | See the Fund's Prospectus and Statement of Additional Information for a description of these security types. |
| 2 | As of the date specified above, the Fund owned shares of one or more affiliated investment companies. For purposes of this table, the affiliated investment company (other than an affiliated money market mutual fund) is not treated as a single portfolio security, but rather the Fund is treated as owning a pro rata portion of each security and each other asset and liability owned by the affiliated investment company. Accordingly, the percentages of total net assets shown in the table will differ from those presented on the Portfolio of Investments. |
| 3 | Other Security Types consist of common stocks. |
| 4 | Represents less than 0.1%. |
| 5 | Based upon net unrealized appreciation (depreciation) or value of the derivative contracts as applicable. Derivative contracts may consist of futures, forwards, options and swaps. The impact of a derivative contract on the Fund's performance may be larger than its unrealized appreciation (depreciation) or value may indicate. In many cases, the notional value or amount of a derivative contract may provide a better indication of the contract's significance to the portfolio. |
| 6 | Cash Equivalents include any investments in money market mutual funds and/or overnight repurchase agreements. |
| 7 | Assets, other than investments in securities and derivatives, less liabilities. See Statement of Assets and Liabilities. Also includes a pro rata share of net assets owned by affiliated investment companies. |
Annual Shareholder Report
Portfolio of Investments
March 31, 2015
| Principal Amount or Shares | | | Value |
| | | U.S. TREASURY—85.1% | |
| | | U.S. Treasury Bonds—37.2% | |
| $2,033,340 | | U.S. Treasury Inflation-Protected Bond, 0.625%, 2/15/2043 | $1,994,520 |
| 744,465 | | U.S. Treasury Inflation-Protected Bond, 0.750%, 2/15/2045 | 757,733 |
| 2,507,325 | | U.S. Treasury Inflation-Protected Bond, 1.375%, 2/15/2044 | 2,951,249 |
| 5,578,700 | | U.S. Treasury Inflation-Protected Bond, 1.750%, 1/15/2028 | 6,534,052 |
| 816,525 | | U.S. Treasury Inflation-Protected Bond, 2.500%, 1/15/2029 | 1,044,092 |
| | | TOTAL | 13,281,646 |
| | | U.S. Treasury Notes—47.9% | |
| 592,116 | | U.S. Treasury Inflation-Protected Note, 0.250%, 1/15/2025 | 597,153 |
| 2,025,300 | | U.S. Treasury Inflation-Protected Note, 0.125%, 1/15/2023 | 2,034,833 |
| 3,005,310 | | U.S. Treasury Inflation-Protected Note, 0.625%, 1/15/2024 | 3,134,063 |
| 4,877,775 | | U.S. Treasury Inflation-Protected Note, 1.375%, 7/15/2018 | 5,218,457 |
| 1,506,600 | | U.S. Treasury Inflation-Protected Note, 0.375%, 7/15/2023 | 1,546,295 |
| 4,488,930 | | U.S. Treasury Inflation-Protected Note, 0.125%, 4/15/2019 | 4,576,210 |
| | | TOTAL | 17,107,011 |
| | | TOTAL U.S. TREASURY
(IDENTIFIED COST $29,289,840) | 30,388,657 |
| | | INVESTMENT COMPANIES—14.1%1 | |
| 1,801,699 | 2 | Federated Prime Value Obligations Fund, Institutional Shares, 0.09% | 1,801,699 |
| 500,203 | | High Yield Bond Portfolio | 3,211,303 |
| | | TOTAL INVESTMENT COMPANIES
(IDENTIFIED COST $5,022,441) | 5,013,002 |
| | | TOTAL INVESTMENTS—99.2%
(IDENTIFIED COST $34,312,281)3 | 35,401,659 |
| | | OTHER ASSETS AND LIABILITIES - NET—0.8%4 | 300,759 |
| | | TOTAL NET ASSETS—100% | $35,702,418 |
Annual Shareholder Report
At March 31, 2015, the Fund had the following outstanding futures contracts:
| Description | Number of
Contracts | Notional
Value | Expiration
Date | Unrealized
Depreciation |
| 5United States Treasury Notes 10-Year Short Futures | 65 | $8,378,906 | June 2015 | $(134,515) |
| 5United States Ultra Bond Short Futures | 38 | $6,455,250 | June 2015 | $(211,461) |
| UNREALIZED DEPRECIATION ON FUTURES CONTRACTS | $(345,976) |
At March 31, 2015, the Fund had the following open swap contracts:
Credit Default Swap
Counterparty | Citigroup, Inc. |
| Reference Entity | Series 20
Investment
Grade CDX Index |
| Buy/Sell | Sell |
| Pay/Receive Fixed Rate | 1.00% |
| Expiration Date | 6/20/2018 |
| Implied Credit Spread at 3/31/20156 | 0.75% |
| Notional Amount | $12,000,000 |
| Market Value | $230,324 |
| Upfront Premiums Paid | $136,185 |
| Unrealized Appreciation | $94,139 |
Net Unrealized Appreciation/Depreciation on Futures Contracts and Swap Contract is included in “Other Assets and Liabilities—Net.”
| 1 | Affiliated holdings. |
| 2 | 7-day net yield. |
| 3 | The cost of investments for federal tax purposes amounts to $34,400,394. |
| 4 | Assets, other than investments in securities, less liabilities. See Statement of Assets and Liabilities. |
| 5 | Non-income-producing security. |
| 6 | Implied credit spreads, represented in absolute terms, utilized in determining the market value of credit default swap agreements serve as an indicator of the current status of the payment/performance risk and represent the likelihood or risk of default for the credit derivative. The implied credit spread of a particular referenced entity reflects the cost of buying/selling protection and may include upfront payments required to be made to enter into the agreement. Wider credit spreads represent a deterioration of the referenced entity's credit soundness and a greater likelihood or risk of default or other credit event occurring as defined under the terms of the agreement. A credit spread identified as “Defaulted” indicates a credit event has occurred for the referenced entity or obligation. |
Note: The categories of investments are shown as a percentage of total net assets at March 31, 2015.
Annual Shareholder Report
Various inputs are used in determining the value of the Fund's investments. These inputs are summarized in the three broad levels listed below:
Level 1—quoted prices in active markets for identical securities.
Level 2—other significant observable inputs (including quoted prices for similar securities, interest rates, prepayment speeds, credit risk, etc.). Also includes securities valued at amortized cost.
Level 3—significant unobservable inputs (including the Fund's own assumptions in determining the fair value of investments).
The inputs or methodology used for valuing securities are not an indication of the risk associated with investing in those securities.
The following is a summary of the inputs used, as of March 31, 2015, in valuing the Fund's assets carried at fair value:
| Valuation Inputs |
| | Level 1—
Quoted
Prices | Level 2—
Other
Significant
Observable
Inputs | Level 3—
Significant
Unobservable
Inputs | Total |
| Debt Securities: | | | | |
| U.S. Treasury | $— | $30,388,657 | $— | $30,388,657 |
| Investment Companies1 | 1,801,699 | 3,211,3032 | — | 5,013,002 |
| TOTAL SECURITIES | $1,801,699 | $33,599,960 | $— | $35,401,659 |
| OTHER FINANCIAL INSTRUMENTS3 | $(345,976) | $230,324 | $— | $(115,652) |
| 1 | High Yield Bond Portfolio is an affiliated holding offered only to registered investment companies and other accredited investors. Investment in this fund is deemed Level 2 due to the fact that the net asset value is not publicly available. |
| 2 | Includes $3,351,360 of an affiliated investment company holding transferred from Level 1 to Level 2 because the Adviser determined that this investment more appropriately meets the definition of Level 2. Transfer shown represents the value of the investment at the beginning of the period. |
| 3 | Other financial instruments include futures contracts and swap contracts. |
See Notes which are an integral part of the Financial Statements
Annual Shareholder Report
Financial Highlights–Class A Shares
(For a Share Outstanding Throughout Each Period)
| Year Ended March 31 | 2015 | 2014 | 2013 | 2012 | 2011 |
| Net Asset Value, Beginning of Period | $10.65 | $11.25 | $11.17 | $10.94 | $10.80 |
| Income From Investment Operations: | | | | | |
| Net investment income | 0.021 | 0.141 | 0.181 | 0.341 | 0.251 |
| Net realized and unrealized gain (loss) on investments, futures contracts and swap contracts | (0.13) | (0.57) | 0.17 | 0.26 | 0.20 |
| TOTAL FROM INVESTMENT OPERATIONS | (0.11) | (0.43) | 0.35 | 0.60 | 0.45 |
| Less Distributions: | | | | | |
| Distributions from net investment income | (0.22) | (0.17) | (0.27) | (0.37) | (0.31) |
| Net Asset Value, End of Period | $10.32 | $10.65 | $11.25 | $11.17 | $10.94 |
| Total Return2 | (1.05)% | (3.79)% | 3.12% | 5.60% | 4.21% |
| Ratios to Average Net Assets: | | | | | |
| Net expenses | 0.74% | 0.70% | 0.70% | 0.70% | 0.70% |
| Net investment income | 0.18% | 1.29% | 1.57% | 3.09% | 2.31% |
| Expense waiver/reimbursement3 | 0.86% | 0.63% | 0.46% | 0.64% | 0.98% |
| Supplemental Data: | | | | | |
| Net assets, end of period (000 omitted) | $15,673 | $20,217 | $35,140 | $33,588 | $30,011 |
| Portfolio turnover | 36% | 5% | 10% | 22% | 2% |
| 1 | Per share numbers have been calculated using the average shares method. |
| 2 | Based on net asset value, which does not reflect the sales charge, redemption fee or contingent deferred sales charge, if applicable. |
| 3 | This expense decrease is reflected in both the net expense and the net investment income ratios shown above. |
See Notes which are an integral part of the Financial Statements
Annual Shareholder Report
Financial Highlights–Class C Shares
(For a Share Outstanding Throughout Each Period)
| Year Ended March 31 | 2015 | 2014 | 2013 | 2012 | 2011 |
| Net Asset Value, Beginning of Period | $10.59 | $11.20 | $11.17 | $10.94 | $10.80 |
| Income From Investment Operations: | | | | | |
| Net investment income (loss) | (0.07)1 | 0.061 | 0.091 | 0.251 | 0.161 |
| Net realized and unrealized gain (loss) on investments, futures contracts and swap contracts | (0.12) | (0.56) | 0.16 | 0.27 | 0.20 |
| TOTAL FROM INVESTMENT OPERATIONS | (0.19) | (0.50) | 0.25 | 0.52 | 0.36 |
| Less Distributions: | | | | | |
| Distributions from net investment income | (0.16) | (0.11) | (0.22) | (0.29) | (0.22) |
| Net Asset Value, End of Period | $10.24 | $10.59 | $11.20 | $11.17 | $10.94 |
| Total Return2 | (1.82)% | (4.47)% | 2.28% | 4.85% | 3.41% |
| Ratios to Average Net Assets: | | | | | |
| Net expenses | 1.49% | 1.45% | 1.45% | 1.45% | 1.45% |
| Net investment income (loss) | (0.69)% | 0.54% | 0.82% | 2.29% | 1.47% |
| Expense waiver/reimbursement3 | 0.86% | 0.63% | 0.46% | 0.64% | 1.00% |
| Supplemental Data: | | | | | |
| Net assets, end of period (000 omitted) | $7,167 | $9,232 | $14,848 | $14,981 | $14,932 |
| Portfolio turnover | 36% | 5% | 10% | 22% | 2% |
| 1 | Per share numbers have been calculated using the average shares method. |
| 2 | Based on net asset value, which does not reflect the sales charge, redemption fee or contingent deferred sales charge, if applicable. |
| 3 | This expense decrease is reflected in both the net expense and the net investment income (loss) ratios shown above. |
See Notes which are an integral part of the Financial Statements
Annual Shareholder Report
Financial Highlights–Institutional Shares
(For a Share Outstanding Throughout Each Period)
| Year Ended March 31 | 2015 | 2014 | 2013 | 2012 | 2011 |
| Net Asset Value, Beginning of Period | $10.68 | $11.27 | $11.18 | $10.94 | $10.80 |
| Income From Investment Operations: | | | | | |
| Net investment income | 0.031 | 0.171 | 0.211 | 0.371 | 0.321 |
| Net realized and unrealized gain (loss) on investments, futures contracts and swap contracts | (0.12) | (0.57) | 0.16 | 0.27 | 0.15 |
| TOTAL FROM INVESTMENT OPERATIONS | (0.09) | (0.40) | 0.37 | 0.64 | 0.47 |
| Less Distributions: | | | | | |
| Distributions from net investment income | (0.24) | (0.19) | (0.28) | (0.40) | (0.33) |
| Net Asset Value, End of Period | $10.35 | $10.68 | $11.27 | $11.18 | $10.94 |
| Total Return2 | (0.85)% | (3.50)% | 3.34% | 5.95% | 4.46% |
| Ratios to Average Net Assets: | | | | | |
| Net expenses | 0.49% | 0.45% | 0.45% | 0.45% | 0.45% |
| Net investment income | 0.29% | 1.56% | 1.84% | 3.33% | 2.95% |
| Expense waiver/reimbursement3 | 0.86% | 0.63% | 0.46% | 0.64% | 0.94% |
| Supplemental Data: | | | | | |
| Net assets, end of period (000 omitted) | $12,863 | $14,902 | $27,082 | $23,409 | $20,162 |
| Portfolio turnover | 36% | 5% | 10% | 22% | 2% |
| 1 | Per share numbers have been calculated using the average shares method. |
| 2 | Based on net asset value. |
| 3 | This expense decrease is reflected in both the net expense and the net investment income ratios shown above. |
See Notes which are an integral part of the Financial Statements
Annual Shareholder Report
Statement of Assets and Liabilities
March 31, 2015
| Assets: | | |
| Total investment in securities, at value including $5,013,002 of investment in affiliated holdings (Note 5) (identified cost $34,312,281) | | $35,401,659 |
| Cash | | 3,511 |
| Restricted cash (Note 2) | | 232,150 |
| Income receivable | | 54,085 |
| Swaps, at value (premium paid $136,185) | | 230,324 |
| Receivable for shares sold | | 66,411 |
| Receivable for periodic payments from swap contracts | | 4,000 |
| TOTAL ASSETS | | 35,992,140 |
| Liabilities: | | |
| Payable for shares redeemed | $93,999 | |
| Due to broker | 86,355 | |
| Payable for daily variation margin | 31,000 | |
| Payable to adviser (Note 5) | 1,434 | |
| Payable for auditing fees | 31,200 | |
| Payable for portfolio accounting fees | 11,270 | |
| Payable for distribution services fee (Note 5) | 4,715 | |
| Payable for other service fees (Notes 2 and 5) | 8,145 | |
| Payable for share registration costs | 10,194 | |
| Accrued expenses (Note 5) | 11,410 | |
| TOTAL LIABILITIES | | 289,722 |
| Net assets for 3,460,800 shares outstanding | | $35,702,418 |
| Net Assets Consist of: | | |
| Paid-in capital | | $37,402,358 |
| Net unrealized appreciation of investments, futures contracts and swap contracts | | 837,541 |
| Accumulated net realized loss on investments, futures contracts and swap contracts | | (2,049,694) |
| Distributions in excess of net investment income | | (487,787) |
| TOTAL NET ASSETS | | $35,702,418 |
Annual Shareholder Report
Statement of Assets and Liabilities–continued
| Net Asset Value, Offering Price and Redemption Proceeds Per Share | | |
| Class A Shares: | | |
Net asset value per share ($15,672,928 ÷ 1,518,338 shares outstanding),
no par value, unlimited shares authorized | | $10.32 |
| Offering price per share (100/95.50 of $10.32) | | $10.81 |
| Redemption proceeds per share | | $10.32 |
| Class C Shares: | | |
Net asset value per share ($7,166,713 ÷ 699,719 shares outstanding),
no par value, unlimited shares authorized | | $10.24 |
| Offering price per share | | $10.24 |
| Redemption proceeds per share (99.00/100 of $10.24) | | $10.14 |
| Institutional Shares: | | |
Net asset value per share ($12,862,777 ÷ 1,242,743 shares outstanding),
no par value, unlimited shares authorized | | $10.35 |
| Offering price per share | | $10.35 |
| Redemption proceeds per share | | $10.35 |
See Notes which are an integral part of the Financial Statements
Annual Shareholder Report
Statement of Operations
Year Ended March 31, 2015
| Investment Income: | | | |
| Dividends received from affiliated holdings (Note 5) | | | $224,996 |
| Interest | | | 121,311 |
| TOTAL INCOME | | | 346,307 |
| Expenses: | | | |
| Investment adviser fee (Note 5) | | $164,022 | |
| Administrative fee (Note 5) | | 157,075 | |
| Custodian fees | | 7,023 | |
| Transfer agent fee | | 37,706 | |
| Directors'/Trustees' fees (Note 5) | | 1,150 | |
| Auditing fees | | 31,200 | |
| Legal fees | | 13,644 | |
| Portfolio accounting fees | | 67,223 | |
| Distribution services fee (Note 5) | | 62,559 | |
| Other service fees (Notes 2 and 5) | | 65,792 | |
| Share registration costs | | 43,851 | |
| Printing and postage | �� | 25,177 | |
| Miscellaneous (Note 5) | | 6,330 | |
| TOTAL EXPENSES | | 682,752 | |
| Waiver and Reimbursements (Note 5): | | | |
| Waiver/reimbursement of investment adviser fee | $(164,022) | | |
| Reimbursement of other operating expenses | (190,379) | | |
| TOTAL WAIVER AND REIMBURSEMENTS | | (354,401) | |
| Net expenses | | | 328,351 |
| Net investment income | | | 17,956 |
| Realized and Unrealized Loss on Investments, Futures Contracts and Swap Contracts: | | | |
| Net realized gain on investments (including realized gain of $921,810 on sales of investments in affiliated holdings (Note 5)) | | | 918,708 |
| Net realized loss on futures contracts | | | (1,654,634) |
| Net realized gain on swap contracts | | | 251,896 |
| Realized gain distribution from affiliated investment company shares (Note 5) | | | 21,190 |
| Net change in unrealized appreciation of investments | | | 459,813 |
| Net change in unrealized appreciation of futures contracts | | | (371,253) |
| Net change in unrealized appreciation of swap contracts | | | (91,861) |
| Net realized and unrealized loss on investments, futures contracts and swap contracts | | | (466,141) |
| Change in net assets resulting from operations | | | $(448,185) |
See Notes which are an integral part of the Financial Statements
Annual Shareholder Report
Statement of Changes in Net Assets
| Year Ended March 31 | 2015 | 2014 |
| Increase (Decrease) in Net Assets | | |
| Operations: | | |
| Net investment income | $17,956 | $759,086 |
| Net realized loss on investments, futures contracts and swap contracts | (462,840) | (538,623) |
| Net change in unrealized appreciation/depreciation of investments, futures contracts and swap contracts | (3,301) | (3,376,413) |
| CHANGE IN NET ASSETS RESULTING FROM OPERATIONS | (448,185) | (3,155,950) |
| Distributions to Shareholders: | | |
| Distributions from net investment income | | |
| Class A Shares | (384,331) | (407,612) |
| Class C Shares | (127,288) | (119,992) |
| Institutional Shares | (334,989) | (375,021) |
| CHANGE IN NET ASSETS RESULTING FROM DISTRIBUTIONS TO SHAREHOLDERS | (846,608) | (902,625) |
| Share Transactions: | | |
| Proceeds from sale of shares | 8,058,052 | 8,457,504 |
| Net asset value of shares issued to shareholders in payment of distributions declared | 715,962 | 714,327 |
| Cost of shares redeemed | (16,127,162) | (37,833,465) |
| CHANGE IN NET ASSETS RESULTING FROM SHARE TRANSACTIONS | (7,353,148) | (28,661,634) |
| Change in net assets | (8,647,941) | (32,720,209) |
| Net Assets: | | |
| Beginning of period | 44,350,359 | 77,070,568 |
| End of period (including undistributed (distributions in excess of) net investment income of $(487,787) and $68,789, respectively) | $35,702,418 | $44,350,359 |
See Notes which are an integral part of the Financial Statements
Annual Shareholder Report
Notes to Financial Statements
March 31, 2015
1. ORGANIZATION
Federated Income Securities Trust (the “Trust”) is registered under the Investment Company Act of 1940, as amended (the “Act”), as a diversified, open-end management investment company. Federated Investment Management Company (“Adviser”) is registered as a “commodity pool operator” with respect to operation of the Fund. The Trust consists of nine portfolios, including the Fund. The financial statements included herein are only those of the Fund. The financial statements of the other portfolios are presented separately. The assets of each portfolio are segregated and a shareholder's interest is limited to the portfolio in which shares are held. Each portfolio pays its own expenses. The Fund offers three classes of shares: Class A Shares, Class C Shares and Institutional Shares. All shares of the Fund have equal rights with respect to voting, except on class-specific matters. The investment objective of the Fund is to provide current income and real total returns.
2. SIGNIFICANT ACCOUNTING POLICIES
The following is a summary of significant accounting policies consistently followed by the Fund in the preparation of its financial statements. These policies are in conformity with U.S. generally accepted accounting principles (GAAP).
Investment Valuation
In calculating its net asset value (NAV), the Fund generally values investments as follows:
| ■ | Shares of other mutual funds or non-exchange-traded investment companies are valued based upon their reported NAVs. |
| ■ | Fixed-income securities acquired with remaining maturities greater than 60 days are fair valued using price evaluations provided by a pricing service approved by the Fund's Board of Trustees (the “Trustees”). |
| ■ | Fixed-income securities and repurchase agreements acquired with remaining maturities of 60 days or less are valued at their cost (adjusted for the accretion of any discount or amortization of any premium), unless the issuer's creditworthiness is impaired or other factors indicate that amortized cost is not an accurate estimate of the investment's fair value, in which case it would be valued in the same manner as a longer-term security. |
| ■ | Derivative contracts listed on exchanges are valued at their reported settlement or closing price, except that options are valued at the mean of closing bid and asked quotations. |
| ■ | Over-the-counter (OTC) derivative contracts are fair valued using price evaluations provided by a pricing service approved by the Trustees. |
| ■ | For securities that are fair valued in accordance with procedures established by and under the general supervision of the Trustees, certain factors may be considered such as: the last traded or purchase price of the security, information obtained by contacting the issuer or dealers, analysis of the issuer's financial statements or other available documents, fundamental analytical data, the nature and duration of restrictions on disposition, the movement of the market in which the security is normally traded, public trading in similar securities or derivative contracts of the issuer or comparable issuers, movement of a relevant index, or other factors including but not limited to industry changes and relevant government actions. |
Annual Shareholder Report
If any price, quotation, price evaluation or other pricing source is not readily available when the NAV is calculated, or if the Fund cannot obtain price evaluations from a pricing service or from more than one dealer for an investment within a reasonable period of time as set forth in the Fund's valuation policies and procedures, the Fund uses the fair value of the investment determined in accordance with the procedures described below. There can be no assurance that the Fund could obtain the fair value assigned to an investment if it sold the investment at approximately the time at which the Fund determines its NAV per share.
Fair Valuation and Significant Events Procedures
The Trustees have ultimate responsibility for determining the fair value of investments for which market quotations are not readily available. The Trustees have appointed a valuation committee (“Valuation Committee”) comprised of officers of the Fund, the Adviser and certain of the Adviser's affiliated companies to assist in determining fair value and in overseeing the calculation of the NAV. The Trustees have also authorized the use of pricing services recommended by the Valuation Committee to provide fair value evaluations of the current value of certain investments for purposes of calculating the NAV. The Valuation Committee employs various methods for reviewing third-party pricing-service evaluations including periodic reviews of third-party pricing services' policies, procedures and valuation methods (including key inputs, methods, models and assumptions), transactional back-testing, comparisons of evaluations of different pricing services, and review of price challenges by the Adviser based on recent market activity. In the event that market quotations and price evaluations are not available for an investment, the Valuation Committee determines the fair value of the investment in accordance with procedures adopted by the Trustees. The Trustees periodically review and approve the fair valuations made by the Valuation Committee and any changes made to the procedures.
Factors considered by pricing services in evaluating an investment include the yields or prices of investments of comparable quality, coupon, maturity, call rights and other potential prepayments, terms and type, reported transactions, indications as to values from dealers and general market conditions. Some pricing services provide a single price evaluation reflecting the bid-side of the market for an investment (a “bid” evaluation). Other pricing services offer both bid evaluations and price evaluations indicative of a price between the prices bid and asked for the investment (a “mid” evaluation). The Fund normally uses bid evaluations for any U.S. Treasury and Agency securities, mortgage-backed securities and municipal securities. The Fund normally uses mid evaluations for any other types of fixed-income securities and any OTC derivative contracts. In the event that market quotations and price evaluations are not available for an investment, the fair value of the investment is determined in accordance with procedures adopted by the Trustees.
The Trustees also have adopted procedures requiring an investment to be priced at its fair value whenever the Adviser determines that a significant event affecting the value of the investment has occurred between the time as of which the price of the investment would otherwise be determined and the time as of which the NAV is computed. An event is considered significant if there is both an affirmative expectation that the investment's value will change in response to the event and a reasonable basis for quantifying the resulting change in value. Examples of significant events that may occur after the close of the principal market on which a security is traded, or after the time of a price evaluation provided by a pricing service or a dealer, include:
| ■ | With respect to securities traded principally in foreign markets, significant trends in U.S. equity markets or in the trading of foreign securities index futures contracts; |
Annual Shareholder Report
| ■ | Political or other developments affecting the economy or markets in which an issuer conducts its operations or its securities are traded; |
| ■ | Announcements concerning matters such as acquisitions, recapitalizations, litigation developments, or a natural disaster affecting the issuer's operations or regulatory changes or market developments affecting the issuer's industry. |
The Trustees have adopted procedures whereby the Valuation Committee uses a pricing service to determine the fair value of equity securities traded principally in foreign markets when the Adviser determines that there has been a significant trend in the U.S. equity markets or in index futures trading. For other significant events, the Fund may seek to obtain more current quotations or price evaluations from alternative pricing sources. If a reliable alternative pricing source is not available, the Fund will determine the fair value of the investment in accordance with the fair valuation procedures approved by the Trustees. The Trustees have ultimate responsibility for any fair valuations made in response to a significant event.
Repurchase Agreements
The Fund may invest in repurchase agreements for short-term liquidity purposes. It is the policy of the Fund to require the other party to a repurchase agreement to transfer to the Fund's custodian or sub-custodian eligible securities or cash with a market value (after transaction costs) at least equal to the repurchase price to be paid under the repurchase agreement. The eligible securities are transferred to accounts with the custodian or sub-custodian in which the Fund holds a “securities entitlement” and exercises “control” as those terms are defined in the Uniform Commercial Code. The Fund has established procedures for monitoring the market value of the transferred securities and requiring the transfer of additional eligible securities if necessary to equal at least the repurchase price. These procedures also allow the other party to require securities to be transferred from the account to the extent that their market value exceeds the repurchase price or in exchange for other eligible securities of equivalent market value.
The insolvency of the other party or other failure to repurchase the securities may delay the disposition of the underlying securities or cause the Fund to receive less than the full repurchase price. Under the terms of the repurchase agreement, any amounts received by the Fund in excess of the repurchase price and related transaction costs must be remitted to the other party.
The Fund may enter into repurchase agreements in which eligible securities are transferred into joint trading accounts maintained by the custodian or sub-custodian for investment companies and other clients advised by the Fund's Adviser and its affiliates. The Fund will participate on a pro rata basis with the other investment companies and clients in its share of the securities transferred under such repurchase agreements and in its share of proceeds from any repurchase or other disposition of such securities.
Investment Income, Gains and Losses, Expenses and Distributions
Investment transactions are accounted for on a trade-date basis. Realized gains and losses from investment transactions are recorded on an identified-cost basis. Interest income and expenses are accrued daily. Dividend income and distributions to shareholders are recorded on the ex-dividend date. Positive or negative inflation adjustments on Treasury Inflation-Protected Securities (TIPS) are included in interest income. Foreign dividends are recorded on the ex-dividend date or when the Fund is informed of the ex-dividend date. Distributions of net
Annual Shareholder Report
investment income are declared and paid quarterly. Investment income, realized and unrealized gains and losses and certain fund-level expenses are allocated to each class based on relative average daily net assets, except that Class A Shares, Class C Shares and Institutional Shares may bear distribution services fees and other service fees unique to those classes.
Dividends are declared separately for each class. No class has preferential dividend rights; differences in per share dividend rates are generally due to differences in separate class expenses.
Other Service Fees
The Fund may pay other service fees up to 0.25% of the average daily net assets of the Fund's Class A Shares, Class C Shares and Institutional Shares to unaffiliated financial intermediaries or to Federated Shareholder Services Company (FSSC) for providing services to shareholders and maintaining shareholder accounts. Subject to the terms described in the Expense Limitation note, FSSC may voluntarily reimburse the Fund for other service fees. For the year ended March 31, 2015, other service fees for the Fund were as follows:
| | Other Service
Fees
Incurred |
| Class A Shares | $44,938 |
| Class C Shares | 20,854 |
| TOTAL | $65,792 |
For the year ended March 31, 2015, the Fund's Institutional Shares did not incur other service fees.
Premium and Discount Amortization
All premiums and discounts on fixed-income securities are amortized/accreted using the effective-interest-rate method.
Federal Taxes
It is the Fund's policy to comply with the Subchapter M provision of the Internal Revenue Code (the “Code”) and to distribute to shareholders each year substantially all of its income. Accordingly, no provision for federal income tax is necessary. As of and during the year ended March 31, 2015, the Fund did not have a liability for any uncertain tax positions. The Fund recognizes interest and penalties, if any, related to tax liabilities as income tax expense in the Statement of Operations. As of March 31, 2015, tax years 2012 through 2015 remain subject to examination by the Fund's major tax jurisdictions, which include the United States of America and the Commonwealth of Massachusetts.
When-Issued and Delayed-Delivery Transactions
The Fund may engage in when-issued or delayed-delivery transactions. The Fund records when-issued securities on the trade date and maintains security positions such that sufficient liquid assets will be available to make payment for the securities purchased. Securities purchased on a when-issued or delayed-delivery basis are marked to market daily and begin earning interest on the settlement date. Losses may occur on these transactions due to changes in market conditions or the failure of counterparties to perform under the contract.
Annual Shareholder Report
Futures Contracts
The Fund purchases and sells financial futures contracts to manage yield curve exposure, duration and cash flows. Additionally, the Fund purchases and sells futures contracts to enhance yield and reduce transaction costs. Upon entering into a financial futures contract with a broker, the Fund is required to deposit in a segregated account a specified amount of cash or U.S. government securities which is shown as Restricted cash. Futures contracts are valued daily and unrealized gains or losses are recorded in a “variation margin” account. Daily, the Fund receives from or pays to the broker a specified amount of cash based upon changes in the variation margin account. When a contract is closed, the Fund recognizes a realized gain or loss. Futures contracts have market risks, including the risk that the change in the value of the contract may not correlate with the changes in the value of the underlying securities. There is minimal counterparty risk to the Fund since futures are exchange traded and the exchange's clearinghouse, as counterparty to all exchange traded futures, guarantees the futures against default.
Futures contracts outstanding at period end are listed after the Fund's Portfolio of Investments.
The average notional value of long and short futures contracts held by the Fund throughout the period was $93,341 and $13,452,964, respectively. This is based on amounts held as of each month-end throughout the fiscal period.
Swap Contracts
Swap contracts involve two parties that agree to exchange the returns (or the differential in rates of return) earned or realized on particular predetermined investments, instruments, indices or other measures. The gross returns to be exchanged or “swapped” between parties are generally calculated with respect to a “notional amount” for a predetermined period of time. The Fund enters into interest rate, total return, credit default, and other swap agreements. Risks may arise upon entering into swap agreements from the potential inability of the counterparties to meet the terms of their contract from unanticipated changes in the value of the swap agreement.
The Fund uses credit default swaps to manage exposure to a given issuer or sector by either selling protection to increase exposure, or buying protection to reduce exposure. The “buyer” in a credit default swap is obligated to pay the “seller” a periodic stream of payments over the term of the contract provided that no event of default on an underlying reference obligation has occurred. If an event of default occurs, the seller must pay the buyer the full notional value, or the “par value”, of the reference obligation in exchange for the reference obligation. In connection with these agreements, securities may be identified as collateral in accordance with the terms of the respective swap agreements to provide assets of value and recourse in the event of default or bankruptcy/insolvency. Recovery values are assumed by market makers considering either industry standard recovery rates or entity specific factors and considerations until a credit event occurs. If a credit event has occurred, the recovery value is typically determined by a facilitated auction whereby a minimum number of allowable broker bids, together with a specific valuation method, are used to calculate the settlement value. The maximum amount of the payment that may occur, as a result of a credit event payable by the protection seller, is equal to the notional amount of the underlying index or security. The Fund's maximum exposure to loss of the notional value of credit default swaps outstanding at March 31, 2015 is $12,000,000. The Fund's maximum risk of loss from
Annual Shareholder Report
counterparty credit risk, either as the protection buyer or as the protection seller, is the fair value of the contract. This risk is mitigated by having a master netting arrangement between the Fund and the counterparty and by the posting of collateral by the counterparty to the Fund to cover the Fund's exposure to the counterparty.
Upfront payments received or paid by the Fund will be reflected as an asset or liability on the Statement of Assets and Liabilities. Changes in the value of swap contracts are included in Swaps, at value on the Statement of Assets and Liabilities and periodic payments are reported as Net realized gain (loss) on swap contracts in the Statement of Operations.
Swap contracts outstanding at period end are listed after the Fund's Portfolio of Investments.
The average notional amount of swap contracts held by the Fund throughout the period was $17,230,769. This is based on amounts held as of each month-end throughout the fiscal period.
Additional Disclosure Related to Derivative Instruments
| Fair Value of Derivative Instruments |
| | Asset | Liability |
| | Statement of
Assets and
Liabilities
Location | Fair
Value | Statement of
Assets and
Liabilities
Location | Fair
Value |
Derivatives not accounted for as
hedging instruments
under ASC Topic 815 | | | | |
| Interest rate contracts | | $— | Payable for daily
variation margin | $345,976* |
| Credit contracts | Swaps, at value | 230,324 | | — |
| Credit contracts | Receivable for
periodic payments
from swap contracts | 4,000 | | — |
Total derivatives not accounted
for as hedging instruments
under ASC Topic 815 | | $234,324 | | $345,976 |
| * | Includes cumulative depreciation of futures contracts as reported in the footnotes to the Portfolio of Investments. Only the current day's variation margin is reported within the Statement of Assets and Liabilities. |
The Effect of Derivative Instruments on the Statement of Operations for the Year Ended March 31, 2015
| Amount of Realized Gain or (Loss) on Derivatives Recognized in Income |
| | Credit
Default
Swaps | Futures | Total |
| Interest rate contracts | $— | $(1,654,634) | $(1,654,634) |
| Credit contracts | 251,896 | — | 251,896 |
| TOTAL | $251,896 | $(1,654,634) | $(1,402,738) |
Annual Shareholder Report
| Change in Unrealized Appreciation or (Depreciation) on Derivatives Recognized in Income |
| | Credit
Default
Swaps | Futures | Total |
| Interest rate contracts | $— | $(371,253) | $(371,253) |
| Credit contracts | (91,861) | — | (91,861) |
| TOTAL | $(91,861) | $(371,253) | $(463,114) |
Other
The preparation of financial statements in conformity with GAAP requires management to make estimates and assumptions that affect the amounts of assets, liabilities, expenses and revenues reported in the financial statements. Actual results could differ from those estimated. The Fund applies Investment Company accounting and reporting guidance.
3. SHARES OF BENEFICIAL INTEREST
The following tables summarize share activity:
| Year Ended March 31 | 2015 | 2014 |
| Class A Shares: | Shares | Amount | Shares | Amount |
| Shares sold | 316,972 | $3,397,752 | 486,082 | $5,251,532 |
| Shares issued to shareholders in payment of distributions declared | 33,969 | 360,028 | 36,299 | 384,574 |
| Shares redeemed | (730,075) | (7,762,665) | (1,748,332) | (18,734,200) |
NET CHANGE RESULTING FROM
CLASS A SHARE TRANSACTIONS | (379,134) | $(4,004,885) | (1,225,951) | $(13,098,094) |
| Year Ended March 31 | 2015 | 2014 |
| Class C Shares: | Shares | Amount | Shares | Amount |
| Shares sold | 52,772 | $555,783 | 44,550 | $479,953 |
| Shares issued to shareholders in payment of distributions declared | 10,852 | 114,349 | 10,146 | 107,028 |
| Shares redeemed | (235,642) | (2,468,809) | (508,398) | (5,403,236) |
NET CHANGE RESULTING FROM
CLASS C SHARE TRANSACTIONS | (172,018) | $(1,798,677) | (453,702) | $(4,816,255) |
| Year Ended March 31 | 2015 | 2014 |
| Institutional Shares: | Shares | Amount | Shares | Amount |
| Shares sold | 388,083 | $4,104,517 | 250,475 | $2,726,019 |
| Shares issued to shareholders in payment of distributions declared | 22,817 | 241,585 | 20,981 | 222,725 |
| Shares redeemed | (563,824) | (5,895,688) | (1,278,864) | (13,696,029) |
NET CHANGE RESULTING FROM
INSTITUTIONAL SHARE TRANSACTIONS | (152,924) | $(1,549,586) | (1,007,408) | $(10,747,285) |
NET CHANGE RESULTING FROM
TOTAL FUND SHARE TRANSACTIONS | (704,076) | $(7,353,148) | (2,687,061) | $(28,661,634) |
Annual Shareholder Report
4. FEDERAL TAX INFORMATION
The timing and character of income and capital gain distributions are determined in accordance with income tax regulations, which may differ from GAAP. These differences are due to differing treatments for swap income, swap gain/loss reclassifications, sale of TIPS and short-term capital gain reclasses.
For the year ended March 31, 2015, permanent differences identified and reclassified among the components of net assets were as follows:
| Increase (Decrease) |
Undistributed
Net Investment
Income (Loss) | Accumulated
Net Realized
Gain (Loss) |
| $272,076 | $(272,076) |
Net investment income (loss), net realized gains (losses), and net assets were not affected by this reclassification.
The tax character of distributions as reported on the Statement of Changes in Net Assets for the years ended March 31, 2015 and 2014, was as follows:
| | 2015 | 2014 |
| Ordinary income | $846,608 | $902,625 |
As of March 31, 2015, the components of distributable earnings on a tax basis were as follows:
| Net unrealized appreciation | $1,001,265 |
| Capital loss carryforwards | $(2,701,205) |
The difference between book-basis and tax-basis net unrealized appreciation/depreciation is attributable to differing treatments for deflation of TIPS.
At March 31, 2015, the cost of investments for federal tax purposes was $34,400,394. The net unrealized appreciation of investments for federal tax purposes excluding any unrealized appreciation/depreciation resulting from: (a) futures contracts; and (b) swap contracts was $1,001,265. This consists of net unrealized appreciation from investments for those securities having an excess of value over cost of $1,010,816 and net unrealized depreciation from investments for those securities having an excess of cost over value of $9,551.
At March 31, 2015, the Fund had a capital loss carryforward of $2,395,670 which will reduce the Fund's taxable income arising from future net realized gains on investments, if any, to the extent permitted by the Code, thereby reducing the amount of distributions to shareholders which would otherwise be necessary to relieve the Fund of any liability for federal income tax. Pursuant to the Code, a net capital loss incurred in taxable years beginning on or before December 22, 2010, is characterized as short-term and may be carried forward for a maximum of eight tax years (“Carryforward Limit”), whereas a net capital loss incurred in taxable years beginning after December 22, 2010, retains its character as either short-term or long-term, does not expire and is required to be utilized prior to the losses which have a Carryforward Limit.
Annual Shareholder Report
The following schedule summarizes the Fund's capital loss carryforwards and expiration years:
| Expiration Year | Short-Term | Long-Term | Total |
| No Expiration | $930,412 | $1,270,978 | $2,201,390 |
| 2019 | $194,280 | NA | $194,280 |
Under current tax rules, a late-year ordinary loss may be deferred, in whole or in part, and treated as occurring on the first day of the following fiscal year. As of March 31, 2015, for federal income tax purposes, a late year ordinary loss of $305,535 was deferred to April 1, 2015.
5. INVESTMENT ADVISER FEE AND OTHER TRANSACTIONS WITH AFFILIATES
Investment Adviser Fee
The advisory agreement between the Fund and the Adviser provides for an annual fee equal to 0.40% of the Fund's average daily net assets. Subject to the terms described in the Expense Limitation note, the Adviser may voluntarily choose to waive any portion of its fee and/or reimburse certain operating expenses of the Fund. For the year ended March 31, 2015, the Adviser voluntarily waived $163,376 of its fee and voluntarily reimbursed $190,379 of other operating expenses.
Administrative Fee
Federated Administrative Services (FAS), under the Administrative Services Agreement, provides the Fund with administrative personnel and services. For purposes of determining the appropriate rate breakpoint, “Investment Complex” is defined as all of the Federated Funds subject to a fee under the Administrative Services Agreement. The fee paid to FAS is based on the average daily net assets of the Investment Complex as specified below, plus certain out-of-pocket expenses:
| Administrative Fee | Average Daily Net Assets
of the Investment Complex |
| 0.150% | on the first $5 billion |
| 0.125% | on the next $5 billion |
| 0.100% | on the next $10 billion |
| 0.075% | on assets in excess of $20 billion |
Subject to the terms described in the Expense Limitation note, FAS may voluntarily choose to waive any portion of its fee. For the year ended March 31, 2015, the annualized fee paid to FAS was 0.383% of average daily net assets of the Fund.
Annual Shareholder Report
Distribution Services Fee
The Fund has adopted a Distribution Plan (the “Plan”) pursuant to Rule 12b-1 under the Act. Under the terms of the Plan, the Fund will compensate Federated Securities Corp. (FSC), the principal distributor, from the daily net assets of the Fund's Class A Shares and Class C Shares to finance activities intended to result in the sale of these shares. The Plan provides that the Fund may incur distribution expenses at the following percentages of average daily net assets annually, to compensate FSC:
| Share Class Name | Percentage of Average Daily
Net Assets of Class |
| Class A Shares | 0.05% |
| Class C Shares | 0.75% |
Subject to the terms described in the Expense Limitation note, FSC may voluntarily choose to waive any portion of its fee. For the year ended March 31, 2015, distribution services fees for the Fund were as follows:
| | Distribution Services
Fees Incurred |
| Class C Shares | $62,559 |
When FSC receives fees, it may pay some or all of them to financial intermediaries whose customers purchase shares. For the year ended March 31, 2015, FSC retained $3,891 of fees paid by the Fund. For the year ended March 31, 2015, the Fund's Class A Shares did not incur a distribution services fee; however, it may begin to incur this fee upon approval of the Trustees.
Sales Charges
Front-end sales charges and contingent deferred sales charges (CDSC) do not represent expenses of the Fund. They are deducted from the proceeds of sales of Fund shares prior to investment or from redemption proceeds prior to remittance, as applicable. For the year ended March 31, 2015, FSC retained $2,120 in sales charges from the sale of Class A Shares. FSC also retained $132 of CDSC relating to redemptions of Class C Shares.
Other Service Fees
For the year ended March 31, 2015, FSSC received $256 of the other service fees disclosed in Note 2.
Expense Limitation
The Adviser and certain of its affiliates (which may include FSC, FAS and FSSC) on their own initiative have agreed to waive certain of their respective fees and/or reimburse expenses. Total annual fund operating expenses (as shown in the financial highlights, excluding expenses allocated from affiliated partnerships, extraordinary expenses and proxy-related expenses paid by the Fund, if any) paid by the Fund's Class A Shares, Class C Shares and Institutional Shares (after the voluntary waivers and/or reimbursements) will not exceed 0.74%, 1.49% and 0.49% (the “Fee Limit”), respectively, up to but not including the later of (the
Annual Shareholder Report
“Termination Date”): (a) June 1, 2016; or (b) the date of the Fund's next effective Prospectus. While the Adviser and its applicable affiliates currently do not anticipate terminating or increasing these arrangements prior to the Termination Date, these arrangements may only be terminated or the Fee Limit increased prior to the Termination Date with the agreement of the Trustees.
General
Certain Officers and Trustees of the Fund are Officers and Directors or Trustees of certain of the above companies. To efficiently facilitate payment, Directors'/Trustees' fees and certain expenses related to conducting meetings of the Directors/Trustees and other miscellaneous expenses are paid by an affiliate of the Adviser which in due course are reimbursed by the Fund. Such expenses may be included in Accrued and Miscellaneous Expenses on the Statement of Assets and Liabilities and Statement of Operations, respectively.
Transactions Involving Affiliated Holdings
Affiliated holdings are investment companies which are managed by the Adviser or an affiliate of the Adviser. The Adviser has agreed to reimburse the Fund for certain investment adviser fees as a result of transactions in other affiliated investment companies. For the year ended March 31, 2015, the Adviser reimbursed $646. Transactions involving the affiliated holdings during the year ended March 31, 2015, were as follows:
| | Federated
Inflation-
Protected
Securities
Core Fund | Federated
Prime Value
Obligations
Fund,
Institutional
Shares | High
Yield
Bond
Portfolio | Total of
Affiliated
Transactions |
| Balance of Shares Held 3/31/2014 | 3,834,326 | 1,079,126 | 307,569 | 5,221,021 |
| Purchases/Additions | — | 19,986,521 | 385,955 | 20,372,476 |
| Sales/Reductions | (3,834,326) | (19,263,948) | (193,321) | (23,291,595) |
| Balance of Shares Held 3/31/2015 | — | 1,801,699 | 500,203 | 2,301,902 |
| Value | $— | $1,801,699 | $3,211,303 | $5,013,002 |
| Dividend Income | $98,926 | $421 | $125,649 | $224,996 |
| Realized Gain Distribution | $— | $— | $21,190 | $21,190 |
6. Investment TRANSACTIONS
Purchases and sales of investments, excluding long-term U.S. government securities and short-term obligations, for the year ended March 31, 2015, were as follows:
| Purchases | $2,471,738 |
| Sales | $1,300,000 |
7. risk of investing in underlying funds
Each of the underlying funds in which the Fund invests has its own investment risks, and these risks can affect the value of the Fund's investments and therefore the value of the Fund's shares. To the extent that the Fund invests more of its assets in one underlying fund than in another, the Fund will have greater exposure to the risks of that underlying fund.
Annual Shareholder Report
8. LINE OF CREDIT
The Fund participates in a $100,000,000 unsecured, uncommitted revolving line of credit (LOC) agreement with PNC Bank. The LOC was made available for extraordinary or emergency purposes, primarily for financing redemption payments. Borrowings are charged interest at a rate offered to the Fund by PNC Bank at the time of the borrowing. As of March 31, 2015, there were no outstanding loans. During the year ended March 31, 2015, the Fund did not utilize the LOC.
9. INTERFUND LENDING
Pursuant to an Exemptive Order issued by the Securities and Exchange Commission, the Fund, along with other funds advised by subsidiaries of Federated Investors, Inc., may participate in an interfund lending program. This program provides an alternative credit facility allowing the Fund to borrow from other participating affiliated funds. As of March 31, 2015, there were no outstanding loans. During the year ended March 31, 2015, the program was not utilized.
Annual Shareholder Report
Report of Independent Registered Public Accounting Firm
TO THE board of trustees of federated income securities trust and SHAREHOLDERS OF Federated Real Return Bond Fund:
We have audited the accompanying statement of assets and liabilities of Federated Real Return Bond Fund (the “Fund”) (one of the portfolios constituting Federated Income Securities Trust), including the portfolio of investments, as of March 31, 2015, and the related statement of operations for the year then ended, the statement of changes in net assets for each of the two years in the period then ended, and the financial highlights for each of the five years in the period then ended. These financial statements and financial highlights are the responsibility of the Fund's management. Our responsibility is to express an opinion on these financial statements and financial highlights based on our audits.
We conducted our audits in accordance with standards of the Public Company Accounting Oversight Board (United States). Those standards require that we plan and perform the audit to obtain reasonable assurance about whether the financial statements and financial highlights are free of material misstatement. We were not engaged to perform an audit of the Fund's internal control over financial reporting. Our audits included consideration of internal control over financial reporting as a basis for designing audit procedures that are appropriate in the circumstances, but not for the purpose of expressing an opinion on the effectiveness of the Fund's internal control over financial reporting. Accordingly, we express no such opinion. An audit also includes examining, on a test basis, evidence supporting the amounts and disclosures in the financial statements and financial highlights, assessing the accounting principles used and significant estimates made by management, and evaluating the overall financial statement presentation. Our procedures included confirmation of securities owned as of March 31, 2015, by correspondence with the custodian and others.
In our opinion, the financial statements and financial highlights referred to above present fairly, in all material respects, the financial position of Federated Real Return Bond Fund, a portfolio of Federated Income Securities Trust, at March 31, 2015, the results of its operations for the year then ended, the changes in its net assets for each of the two years in the period then ended, and the financial highlights for each of the five years in the period then ended, in conformity with U.S. generally accepted accounting principles.
Boston, Massachusetts
May 21, 2015
Annual Shareholder Report
Shareholder Expense Example (unaudited)
As a shareholder of the Fund, you incur two types of costs: (1) transaction costs, including sales charges (loads) on purchase or redemption payments; and (2) ongoing costs, including management fees and to the extent applicable, distribution (12b-1) fees and/or other service fees and other Fund expenses. This Example is intended to help you to understand your ongoing costs (in dollars) of investing in the Fund and to compare these costs with the ongoing costs of investing in other mutual funds. It is based on an investment of $1,000 invested at the beginning of the period and held for the entire period from October 1, 2014 to March 31, 2015.
ACTUAL EXPENSES
The first section of the table below provides information about actual account values and actual expenses. You may use the information in this section, together with the amount you invested, to estimate the expenses that you incurred over the period. Simply divide your account value by $1,000 (for example, an $8,600 account value divided by $1,000 = 8.6), then multiply the result by the number in the first section under the heading entitled “Expenses Paid During Period” to estimate the expenses attributable to your investment during this period.
HYPOTHETICAL EXAMPLE FOR COMPARISON PURPOSES
The second section of the table below provides information about hypothetical account values and hypothetical expenses based on the Fund's actual expense ratio and an assumed rate of return of 5% per year before expenses, which is not the Fund's actual return. Thus, you should not use the hypothetical account values and expenses to estimate the actual ending account balance or your expenses for the period. Rather, these figures are required to be provided to enable you to compare the ongoing costs of investing in the Fund with other funds. To do so, compare this 5% hypothetical example with the 5% hypothetical examples that appear in the shareholder reports of the other funds.
Annual Shareholder Report
Please note that the expenses shown in the table are meant to highlight your ongoing costs only and do not reflect any transaction costs, such as sales charges (loads) on purchase or redemption payments. Therefore, the second section of the table is useful in comparing ongoing costs only, and will not help you determine the relative total costs of owning different funds. In addition, if these transaction costs were included, your costs would have been higher.
| | Beginning
Account Value
10/1/2014 | Ending
Account Value
3/31/2015 | Expenses Paid
During Period1 |
| Actual: | | | |
| Class A Shares | $1,000 | $988.00 | $3.67 |
| Class C Shares | $1,000 | $984.10 | $7.37 |
| Institutional Shares | $1,000 | $989.70 | $2.43 |
Hypothetical (assuming a 5% return
before expenses): | | | |
| Class A Shares | $1,000 | $1,021.24 | $3.73 |
| Class C Shares | $1,000 | $1,017.50 | $7.49 |
| Institutional Shares | $1,000 | $1,022.49 | $2.47 |
| 1 | Expenses are equal to the Fund's annualized net expense ratios, multiplied by the average account value over the period, multiplied by 182/365 (to reflect the one-half-year period). The annualized net expense ratios are as follows: |
| | |
| Class A Shares | 0.74% |
| Class C Shares | 1.49% |
| Institutional Shares | 0.49% |
Annual Shareholder Report
Board of Trustees and Trust Officers
The Board of Trustees is responsible for managing the Trust's business affairs and for exercising all the Trust's powers except those reserved for the shareholders. The following tables give information about each Trustee and the senior officers of the Fund. Where required, the tables separately list Trustees who are “interested persons” of the Fund (i.e., “Interested” Trustees) and those who are not (i.e., “Independent” Trustees). Unless otherwise noted, the address of each person listed is Federated Investors Tower, 1001 Liberty Avenue, Pittsburgh, PA 15222. The address of all Independent Trustees listed is 4000 Ericsson Drive, Warrendale, PA 15086-7561; Attention: Mutual Fund Board. As of December 31, 2014, the Trust comprised nine portfolio(s), and the Federated Fund Family consisted of 40 investment companies (comprising 131 portfolios). Unless otherwise noted, each Officer is elected annually. Unless otherwise noted, each Trustee oversees all portfolios in the Federated Fund Family and serves for an indefinite term. The Fund's Statement of Additional Information includes additional information about Trust Trustees and is available, without charge and upon request, by calling 1-800-341-7400.
Interested TRUSTEES Background
Name
Birth Date
Positions Held with Trust
Date Service Began | Principal Occupation(s) for Past Five Years,
Other Directorships Held and Previous Position(s) |
John F. Donahue*
Birth Date: July 28, 1924
Trustee
Indefinite Term
Began serving: January 1986 | Principal Occupations: Director or Trustee of the Federated Fund Family; Chairman and Director, Federated Investors, Inc.; Chairman of the Federated Fund Family's Executive Committee.
Previous Positions: Chairman of the Federated Fund Family; Trustee, Federated Investment Management Company; Chairman and Director, Federated Investment Counseling. |
J. Christopher Donahue*
Birth Date: April 11, 1949
President and Trustee
Indefinite Term
Began serving: January 2000 | Principal Occupations: Principal Executive Officer and President of certain of the Funds in the Federated Fund Family; Director or Trustee of the Funds in the Federated Fund Family; President, Chief Executive Officer and Director, Federated Investors, Inc.; Chairman and Trustee, Federated Investment Management Company; Trustee, Federated Investment Counseling; Chairman and Director, Federated Global Investment Management Corp.; Chairman, Federated Equity Management Company of Pennsylvania and Passport Research, Ltd. (investment advisory subsidiary of Federated); Trustee, Federated Shareholder Services Company; Director, Federated Services Company.
Previous Positions: President, Federated Investment Counseling; President and Chief Executive Officer, Federated Investment Management Company, Federated Global Investment Management Corp. and Passport Research, Ltd. |
| * | Family relationships and reasons for “interested” status: John F. Donahue is the father of J. Christopher Donahue; both are “interested” due to their beneficial ownership of shares of Federated Investors, Inc. and the positions they hold with Federated and its subsidiaries. |
Annual Shareholder Report
INDEPENDENT TRUSTEES Background
Name
Birth Date
Positions Held with Trust
Date Service Began | Principal Occupation(s) for Past Five Years,
Other Directorships Held, Previous Position(s) and Qualifications |
John T. Collins
Birth Date: January 24, 1947
Trustee
Indefinite Term
Began serving: October 2013 | Principal Occupations: Director or Trustee of the Federated Fund Family; Chairman and CEO, The Collins Group, Inc. (a private equity firm).
Other Directorships Held: Director, KLX Corp.
Qualifications: Mr. Collins has served in several business and financial management roles and directorship positions throughout his career. Mr. Collins serves as Chairman Emeriti, Bentley University. Mr. Collins previously served as Director, FleetBoston Financial Corp.; Director and Audit Committee Member, Bank of America Corp. and Director, Beth Israel Deaconess Medical Center (Harvard University Affiliate Hospital). |
Maureen Lally-Green
Birth Date: July 5, 1949
Trustee
Indefinite Term
Began serving: August 2009 | Principal Occupations: Director or Trustee of the Federated Fund Family; Associate General Secretary, Diocese of Pittsburgh; Adjunct Professor of Law, Duquesne University School of Law.
Other Directorships Held: Director, CONSOL Energy Inc.
Qualifications: Judge Lally-Green has served in various legal and business roles and directorship positions throughout her career. Judge Lally-Green previously served as Professor of Law, Duquesne University School of Law and was a member of the Superior Court of Pennsylvania. Judge Lally-Green also holds the positions of: Member, Pennsylvania State Board of Education; Director, Saint Vincent College; Director and Chair, UPMC Mercy Hospital; Regent, St. Vincent Seminary; Director, Epilepsy Foundation of Western and Central Pennsylvania; Director, Our Campaign for the Church Alive!, Inc.; Director, Pennsylvania Bar Institute; and Director, Catholic High Schools of the Diocese of Pittsburgh, Inc. Judge Lally-Green has held the positions of: Director, Auberle; Director, Ireland Institute of Pittsburgh; Director, Saint Thomas More Society; and Director Cardinal Wuerl Catholic High School. |
Peter E. Madden
Birth Date: March 16, 1942
Trustee
Indefinite Term
Began serving: November 1991 | Principal Occupation: Director or Trustee, and Chair of the Board of Directors or Trustees, of the Federated Fund Family; Retired.
Other Directorships Held: None.
Qualifications: Mr. Madden has served in several business management, mutual fund services and directorship positions throughout his career. Mr. Madden previously served as President, Chief Operating Officer and Director, State Street Bank and Trust Company (custodian bank) and State Street Corporation (financial services). He was Director, VISA USA and VISA International and Chairman and Director, Massachusetts Bankers Association. Mr. Madden served as Director, Depository Trust Corporation and Director, The Boston Stock Exchange. Mr. Madden also served as a Representative to the Commonwealth of Massachusetts General Court. |
Annual Shareholder Report
Name
Birth Date
Positions Held with Trust
Date Service Began | Principal Occupation(s) for Past Five Years,
Other Directorships Held, Previous Position(s) and Qualifications |
Charles F. Mansfield, Jr.
Birth Date: April 10, 1945
Trustee
Indefinite Term
Began serving: January 2000 | Principal Occupations: Director or Trustee of the Federated Fund Family; Management Consultant.
Other Directorships Held: None.
Qualifications: Mr. Mansfield has served in several banking, business management and educational roles and directorship positions throughout his career. Mr. Mansfield previously served as Chief Executive Officer, PBTC International Bank; Partner, Arthur Young & Company (now Ernst & Young LLP); Chief Financial Officer of Retail Banking Sector, Chase Manhattan Bank; Senior Vice President, HSBC Bank USA (formerly, Marine Midland Bank); Vice President, Citibank; Assistant Professor of Banking and Finance, Frank G. Zarb School of Business, Hofstra University; Executive Vice President DVC Group, Inc. (marketing, communications and technology). |
Thomas M. O'Neill
Birth Date: June 14, 1951
Trustee
Indefinite Term
Began serving: October 2006 | Principal Occupations: Director or Trustee, Vice Chair of the Audit Committee of the Federated Fund Family; Sole Proprietor, Navigator Management Company (investment and strategic consulting).
Other Directorships Held: None.
Qualifications: Mr. O'Neill has served in several business, mutual fund and financial management roles and directorship positions throughout his career. Mr. O'Neill serves as Director, Medicines for Humanity and Director, The Golisano Children's Museum of Naples, Florida. Mr. O'Neill previously served as Chief Executive Officer and President, Managing Director and Chief Investment Officer, Fleet Investment Advisors; President and Chief Executive Officer, Aeltus Investment Management, Inc.; General Partner, Hellman, Jordan Management Co., Boston, MA; Chief Investment Officer, The Putnam Companies, Boston, MA; Credit Analyst and Lending Officer, Fleet Bank; Director and Consultant, EZE Castle Software (investment order management software); and Director, Midway Pacific (lumber). |
P. Jerome Richey
Birth Date: February 23, 1949
Trustee
Indefinite Term
Began serving: October 2013 | Principal Occupations: Director or Trustee of the Federated Fund Family; General Counsel, University of Pittsburgh.
Other Directorships Held: None.
Qualifications: Mr. Richey has served in several business and legal management roles and directorship positions throughout his career. Mr. Richey serves as Board Member, Epilepsy Foundation of Western Pennsylvania and Board member, World Affairs Council of Pittsburgh. Mr. Richey previously served as Chief Legal Officer and Executive Vice President, CONSOL Energy Inc. and Shareholder, Buchanan Ingersoll & Rooney PC (a law firm). |
Annual Shareholder Report
Name
Birth Date
Positions Held with Trust
Date Service Began | Principal Occupation(s) for Past Five Years,
Other Directorships Held, Previous Position(s) and Qualifications |
John S. Walsh
Birth Date: November 28, 1957
Trustee
Indefinite Term
Began serving: January 2000 | Principal Occupations: Director or Trustee, Chair of the Audit Committee of the Federated Fund Family; President and Director, Heat Wagon, Inc. (manufacturer of construction temporary heaters); President and Director, Manufacturers Products, Inc. (distributor of portable construction heaters); President, Portable Heater Parts, a division of Manufacturers Products, Inc.
Other Directorships Held: None.
Qualifications: Mr. Walsh has served in several business management roles and directorship positions throughout his career. Mr. Walsh previously served as Vice President, Walsh & Kelly, Inc. (paving contractors). |
OFFICERS
Name
Birth Date
Address
Positions Held with Trust
Date Service Began | Principal Occupation(s) for Past Five Years
and Previous Position(s) |
John W. McGonigle
Birth Date: October 26, 1938
EXECUTIVE VICE PRESIDENT AND SECRETARY
Officer since: January 1986 | Principal Occupations: Executive Vice President and Secretary of the Federated Fund Family; Vice Chairman, Executive Vice President, Secretary and Director, Federated Investors, Inc.
Previous Positions: Trustee, Federated Investment Management Company and Federated Investment Counseling; Director, Federated Global Investment Management Corp., Federated Services Company and Federated Securities Corp. |
Lori A. Hensler
Birth Date: January 6, 1967
TREASURER
Officer since: April 2013 | Principal Occupations: Principal Financial Officer and Treasurer of the Federated Fund Family; Senior Vice President, Federated Administrative Services; Financial and Operations Principal for Federated Securities Corp. and Edgewood Services, Inc.; and Assistant Treasurer, Federated Investors Trust Company. Ms. Hensler has received the Certified Public Accountant designation.
Previous Positions: Controller of Federated Investors, Inc.; Senior Vice President and Assistant Treasurer, Federated Investors Management Company; Treasurer, Federated Investors Trust Company; Assistant Treasurer, Federated Administrative Services, Federated Administrative Services, Inc., Federated Securities Corp., Edgewood Services, Inc., Federated Advisory Services Company, Federated Equity Management Company of Pennsylvania, Federated Global Investment Management Corp., Federated Investment Counseling, Federated Investment Management Company, Passport Research, Ltd., and Federated MDTA, LLC; Financial and Operations Principal for Federated Securities Corp., Edgewood Services, Inc. and Southpointe Distribution Services, Inc. |
Annual Shareholder Report
Name
Birth Date
Address
Positions Held with Trust
Date Service Began | Principal Occupation(s) for Past Five Years
and Previous Position(s) |
Richard B. Fisher
Birth Date: May 17, 1923
VICE PRESIDENT
Officer since: January 1986 | Principal Occupations: Vice Chairman or Vice President of some of the Funds in the Federated Fund Family; Vice Chairman, Federated Investors, Inc.; Chairman, Federated Securities Corp.
Previous Positions: President and Director or Trustee of some of the Funds in the Federated Fund Family; Executive Vice President, Federated Investors, Inc.; Director and Chief Executive Officer, Federated Securities Corp. |
Brian P. Bouda
Birth Date: February 28, 1947
CHIEF COMPLIANCE OFFICER AND SENIOR VICE PRESIDENT
Officer since: August 2004 | Principal Occupations: Senior Vice President and Chief Compliance Officer of the Federated Fund Family; Vice President and Chief Compliance Officer of Federated Investors, Inc. and Chief Compliance Officer of certain of its subsidiaries. Mr. Bouda joined Federated in 1999 and is a member of the American Bar Association and the State Bar Association of Wisconsin.
Previous Positions: Served in Senior Management positions with a large regional banking organization. |
Robert J. Ostrowski
Birth Date: April 26, 1963
Chief Investment Officer
Officer since: May 2004 | Principal Occupations: Robert J. Ostrowski joined Federated in 1987 as an Investment Analyst and became a Portfolio Manager in 1990. He was named Chief Investment Officer of Federated's taxable fixed-income products in 2004 and also serves as a Senior Portfolio Manager. Mr. Ostrowski became an Executive Vice President of the Fund's Adviser in 2009 and served as a Senior Vice President of the Fund's Adviser from 1997 to 2009. Mr. Ostrowski has received the Chartered Financial Analyst designation. He received his M.S. in Industrial Administration from Carnegie Mellon University. |
Peter J. Germain
Birth Date: September 3, 1959
CHIEF LEGAL OFFICER
Officer since: January 2005 | Principal Occupations: Mr. Germain is Chief Legal Officer of the Federated Fund Family. He is General Counsel and Vice President, Federated Investors, Inc.; President, Federated Administrative Services and Federated Administrative Services, Inc.; Vice President, Federated Securities Corp.; Secretary, Federated Private Asset Management, Inc.; and Secretary, Retirement Plan Service Company of America. Mr. Germain joined Federated in 1984 and is a member of the Pennsylvania Bar Association.
Previous Positions: Deputy General Counsel, Special Counsel, Managing Director of Mutual Fund Services, Federated Investors, Inc.; Senior Vice President, Federated Services Company; and Senior Corporate Counsel, Federated Investors, Inc. |
J. Andrew Kirschler
Birth Date: May 23, 1968
Vice President
Officer since: August 2013
Portfolio Manager since:
July 2013 | Principal Occupations: J. Andrew Kirschler has been the Fund's Portfolio Manager since July 2013, responsible for the day to day management focusing on asset allocation and government securities. He is Vice President of the Trust with repsect to the Fund. Mr. Kirschler joined Federated in 1990 in the Internal Sales department. In 1994 he was an Assistant Trader, in 1996 a Trader and in 2003 a Senior Trader on the fixed income desk concentrating on government securities. Mr. Kirschler became a Senior Investment Analyst in 2013. In 2000 he was appointed Asst. Vice President and in 2003 appointed Vice President of a Federated advisory subsidiary. Mr. Kirschler received his M.B.A from the University of Pittsburgh. |
Annual Shareholder Report
Evaluation and Approval of Advisory Contract–May 2014
Federated Real Return Bond Fund (the “Fund”)
Following a review and recommendation of approval by the Fund's independent trustees, the Fund's Board reviewed and approved at its May 2014 meetings the Fund's investment advisory contract for an additional one-year term. The Board's decision regarding the contract reflects the exercise of its business judgment on whether to continue the existing arrangements.
In this connection, the Federated Funds' Board had previously appointed a Senior Officer, whose duties include specified responsibilities relating to the process by which advisory fees are to be charged to a Federated fund. The Senior Officer has the authority to retain consultants, experts, or staff as may be reasonably necessary to assist in the performance of his duties, reports directly to the Board, and may be terminated only with the approval of a majority of the independent members of the Board. The Senior Officer prepared and furnished to the Board an independent, written evaluation that covered topics discussed below (the “Evaluation”). The Board considered that Evaluation, along with other information, in deciding to approve the advisory contract.
The Board is also familiar with and considered judicial decisions concerning allegedly excessive investment advisory fees, which have indicated that the following factors may be relevant to an Adviser's fiduciary duty with respect to its receipt of compensation from a fund: the nature and quality of the services provided by the Adviser to a fund and its shareholders, including the performance and expenses of the fund and of comparable funds; the Adviser's cost of providing the services, including the profitability to the Adviser of providing advisory services to a fund; the extent to which the Adviser may realize “economies of scale” as a fund grows larger and, if such economies exist, whether they have been shared with a fund and its shareholders or the family of funds; any “fall-out financial benefits” that accrue to the Adviser because of its relationship with a fund (including research services received from brokers that execute fund trades and any fees paid to affiliates of the Adviser for services rendered to a fund); comparative fee structures, including a comparison of fees paid to the Adviser with those paid by similar funds; and the extent of care, conscientiousness and independence with which the Board members perform their duties and their expertise, including whether they are fully informed about all facts the Board deems relevant to its consideration of the Adviser's services and fees. The Board noted that SEC disclosure requirements regarding the basis for the Board's approval of the Fund's advisory contract generally track the factors listed above. Consistent with these judicial decisions and SEC disclosure requirements, the Board also considered management fees charged to
Annual Shareholder Report
institutional and other clients of the Adviser for what might be viewed as like services. The Board was aware of these factors and was guided by them in its review of the Fund's advisory contract to the extent it considered them to be appropriate and relevant, as discussed further below.
The Board considered and weighed these circumstances in light of its substantial accumulated experience in governing the Fund and working with Federated on matters relating to the Federated funds, and was assisted in its deliberations by independent legal counsel. Throughout the year, and in connection with its May meetings, the Board requested and received substantial and detailed information about the Fund and the Federated organization that was in addition to the extensive materials that comprise and accompany the Senior Officer's Evaluation. Federated provided much of this information at each regular meeting of the Board, and furnished additional substantial information in connection with the May meeting at which the Board's formal review of the advisory contract occurred. At this May meeting, senior management of the Adviser also met with the independent trustees and their counsel to discuss the materials presented and any other matters thought relevant by the Adviser or the trustees. Between regularly scheduled meetings, the Board also received information on particular matters as the need arose. Thus, the Board's consideration of the advisory contract included review of the Senior Officer's Evaluation, accompanying data and additional information covering such matters as: the Adviser's investment philosophy, revenue, profitability, personnel and processes; investment and operating strategies; the Fund's short- and long-term performance (in absolute terms, both on a gross basis and net of expenses, as well as in relationship to its particular investment program and certain competitor or “peer group” funds and/or other benchmarks, as appropriate), and comments on the reasons for performance; the Fund's investment objectives; the Fund's expenses (including the advisory fee itself and the overall expense structure of the Fund, both in absolute terms and relative to similar and/or competing funds, with due regard for contractual or voluntary expense limitations); the use and allocation of brokerage commissions derived from trading the Fund's portfolio securities (if any); and the nature, quality and extent of the advisory and other services provided to the Fund by the Adviser and its affiliates. The Board also considered the preferences and expectations of Fund shareholders; the entrepreneurial risk assumed by the Adviser in sponsoring the funds; the continuing state of competition in the mutual fund industry and market practices; the range of comparable fees for similar funds in the mutual fund industry; the Fund's relationship to the Federated family of funds which include a comprehensive array of funds with different investment objectives, policies and strategies which are available for exchange without the incurrence of additional sales charges; compliance and audit reports concerning the Federated funds and the Federated companies that service them (including communications from regulatory agencies), as well as Federated's responses to any issues raised therein; and relevant developments in
Annual Shareholder Report
the mutual fund industry and how the Federated funds and/or Federated are responding to them. The Board's evaluation process is evolutionary. The criteria considered and the emphasis placed on relevant criteria change in recognition of changing circumstances in the mutual fund marketplace.
While mindful that courts have cautioned against giving such comparisons too much weight, the Board has found the use of comparisons of the Fund's fees and expenses to other mutual funds with comparable investment programs to be relevant. In this regard, the Board was presented with, and considered, information regarding the contractual advisory fee rates, net advisory fee rates and total expense ratios relative to a fund's peers. The Board focused on comparisons with other similar mutual funds more heavily than non-mutual fund products or services because it is believed that they are more relevant. For example, other mutual funds are the products most like the Fund, they are readily available to Fund shareholders as alternative investment vehicles, and they are the type of investment vehicle in fact chosen and maintained by the Fund's investors. The range of their fees and expenses therefore appears to be a relevant indicator of what consumers have found to be reasonable in the precise marketplace in which the Fund competes.
It was noted in the materials for the Board meeting that for the period covered by the Evaluation, the Fund's investment advisory fee was waived in its entirety. The Board reviewed the contractual advisory fee rate, net advisory fee rate and other expenses of the Fund with the Adviser and noted the position of the Fund's fee rates relative to its peers. In this regard, the Board noted that the contractual advisory fee rate was above the median of the relevant peer group, but the Board noted that the investment advisory fee was waived in its entirety and that the overall expense structure of the Fund remained competitive.
By contrast, the Senior Officer has reviewed Federated's fees for providing advisory services to products outside the Federated family of funds (e.g., institutional and separate accounts and sub-adviser services). He concluded that mutual funds and institutional accounts are inherently different products. Those differences include, but are not limited to, different types of targeted investors; being subject to different laws and regulations; different legal structures; different average account sizes and portfolio management techniques made necessary by different cash flows and different associated costs; and the time spent by portfolio managers and their teams, funds financial services, legal, compliance and risk management in reviewing securities pricing, addressing different administrative responsibilities, addressing different degrees of risk associated with management and a variety of different costs. The Senior Officer did not consider these fee schedules to be determinative in judging the appropriateness of mutual fund advisory fees.
Annual Shareholder Report
The Fund's ability to deliver competitive performance when compared to its peer group was also deemed to be relevant by the Board as a useful indicator of how the Adviser is executing the Fund's investment program, which in turn was one of the Board's considerations in reaching a conclusion that the nature, extent, and quality of the Adviser's investment management services were such as to warrant continuation of the advisory contract.
The Senior Officer reviewed information compiled by Federated, using data supplied by independent fund ranking organizations, regarding the performance of, and fees charged by, other mutual funds, noting his view that comparisons to fund peer groups may be helpful, though not conclusive, in judging the reasonableness of proposed fees. The Board considered, in evaluating such comparisons, that in some cases individual funds may exhibit significant and unique differences in their objectives and management techniques when compared to other funds within an industry peer group.
For the periods covered by the Evaluation, the Fund's performance for the one-year period was above the median of the relevant peer group, and the Fund's performance fell below the median of the relevant peer group for the three-year and five-year periods. The Board discussed the Fund's performance with the Adviser and recognized the efforts being undertaken by the Adviser. The Board will continue to monitor these efforts and the performance of the Fund in the context of the other factors considered relevant by the Board.
The Board also received financial information about Federated, including information regarding the compensation and benefits Federated derived from its relationships with the Federated funds. This information covered not only the fees under the advisory contracts, but also fees received by Federated's subsidiaries for providing other services to the Federated funds under separate contracts (e.g., for serving as the Federated funds' administrator). The information also detailed any indirect benefit Federated may derive from its receipt of research services from brokers who execute Federated fund trades. In addition, the Board considered the fact that, in order for a fund to be competitive in the marketplace, Federated and its affiliates frequently waived fees and/or reimbursed expenses and have disclosed to fund investors and/or indicated to the Board their intention to do so in the future, where appropriate. Moreover, the Board receives regular reporting as to the institution, adjustment or elimination of these voluntary waivers. In addition, following discussions regarding the Senior Officer's May 2013 recommendations, Federated made meaningful reductions to gross advisory fees for several funds. At the Board meeting in May 2014, the Senior Officer proposed, and the Board approved, reductions in the contractual advisory fees of certain other funds.
Federated furnished information, requested by the Senior Officer, that reported revenues on a fund-by-fund basis and made estimates of the allocation of expenses on a fund-by-fund basis, using allocation methodologies specified by the Senior Officer. The Senior Officer noted that, while these cost allocation reports apply consistent allocation processes, the inherent difficulties in
Annual Shareholder Report
allocating costs continues to cause the Senior Officer to question the precision of the process and to conclude that such reports may be unreliable, since a single change in an allocation estimate may dramatically alter the resulting estimate of cost and/or profitability of a fund and may produce unintended consequences. The allocation information, including the Senior Officer's view that fund-by-fund estimations may be unreliable, was considered in the analysis by the Board.
The Board and the Senior Officer also reviewed information compiled by Federated comparing profitability information for Federated to other publicly held fund management companies. In this regard, the Senior Officer concluded that Federated's profit margins did not appear to be excessive.
The Senior Officer's Evaluation also discussed the notion of possible realization of “economies of scale” as a fund grows larger. The Board considered in this regard that the Adviser has made significant and long-term investments in areas that support all of the Federated family of funds, such as personnel and processes for the portfolio management, shareholder services, compliance, internal audit, and risk management functions; and systems technology; and that the benefits of these efforts (as well as any economies, should they exist) were likely to be enjoyed by the fund family as a whole. Finally, the Board also noted the absence of any applicable regulatory or industry guidelines on this subject, which (as discussed in the Senior Officer's Evaluation) is compounded by the lack of any common industry practice or general pattern with respect to structuring fund advisory fees with “breakpoints” that serve to reduce the fee as the fund attains a certain size.
The Senior Officer noted that, subject to the comments and recommendations made within his Evaluation, his observations and the information accompanying the Evaluation supported a finding by the Board that the management fees for each of the funds were reasonable. Under these circumstances, no changes were recommended to, and no objection was raised to, the continuation of the Fund's advisory contract.
In its decision to continue an existing investment advisory contract, the Board was mindful of the potential disruptions of the Fund's operations and various risks, uncertainties and other effects that could occur as a result of a decision to terminate or not renew an advisory contract. In particular, the Board recognized that many shareholders have invested in the Fund on the strength of the Adviser's industry standing and reputation and with the expectation that the Adviser will have a continuing role in providing advisory services to the Fund. Thus, the Board's approval of the advisory contract reflected the fact that it is the shareholders who have effectively selected the Adviser by virtue of having invested in the Fund. The Board concluded that, in light of the factors discussed above, including the nature, quality and scope of the services provided to the Fund by the Adviser and its affiliates, continuation of the advisory contract was appropriate.
Annual Shareholder Report
The Board based its decision to approve the advisory contract on the totality of the circumstances and relevant factors and with a view to past and future long-term considerations. Not all of the factors and considerations identified above were necessarily relevant to the Fund, nor did the Board consider any one of them to be determinative. With respect to the factors that were relevant, the Board's decision to approve the contract reflects its determination that Federated's performance and actions provided a satisfactory basis to support the decision to continue the existing arrangements.
Annual Shareholder Report
Voting Proxies on Fund Portfolio Securities
A description of the policies and procedures that the Fund uses to determine how to vote proxies, if any, relating to securities held in the Fund's portfolio is available, without charge and upon request, by calling 1-800-341-7400. A report on “Form N-PX” of how the Fund voted any such proxies during the most recent 12-month period ended June 30 is available via the Proxy Voting Record (Form N-PX) link associated with the Fund and share class name at www.FederatedInvestors.com/FundInformation. Form N-PX filings are also available at the SEC's website at www.sec.gov.
Quarterly Portfolio Schedule
The Fund files with the SEC a complete schedule of its portfolio holdings, as of the close of the first and third quarters of its fiscal year, on “Form N-Q.” These filings are available on the SEC's website at www.sec.gov and may be reviewed and copied at the SEC's Public Reference Room in Washington, DC. (Call 1-800-SEC-0330 for information on the operation of the Public Reference Room.) You may also access this information via the link to the Fund and share class name at www.FederatedInvestors.com/FundInformation.
Annual Shareholder Report
[PAGE INTENTIONALLY LEFT BLANK]
[PAGE INTENTIONALLY LEFT BLANK]
[PAGE INTENTIONALLY LEFT BLANK]
Mutual funds are not bank deposits or obligations, are not guaranteed by any bank and are not insured or guaranteed by the U.S. government, the Federal Deposit Insurance Corporation, the Federal Reserve Board or any other government agency. Investment in mutual funds involves investment risk, including the possible loss of principal.
This Report is authorized for distribution to prospective investors only when preceded or accompanied by the Fund's Prospectus, which contains facts concerning its objective and policies, management fees, expenses and other information.
Federated Real Return Bond Fund
Federated Investors Funds
4000 Ericsson Drive
Warrendale, PA 15086-7561
Contact us at FederatedInvestors.com
or call 1-800-341-7400.
Federated Securities Corp., Distributor
CUSIP 31420C779
CUSIP 31420C761
CUSIP 31420C753
36727 (5/15)
Federated is a registered trademark of Federated Investors, Inc.
2015 ©Federated Investors, Inc.
Annual Shareholder Report
March 31, 2015
| Share Class | Ticker |
| A | FRSAX |
| C | FRICX |
| Institutional | FFRSX |
Federated Floating Rate Strategic Income Fund
Fund Established 2010
A Portfolio of Federated Income Securities Trust
Dear Valued Shareholder,
I am pleased to present the Annual Shareholder Report for your fund covering the period from April 1, 2014 through March 31, 2015. This report includes Management's Discussion of Fund Performance, a complete listing of your fund's holdings, performance information and financial statements along with other important fund information.
In addition, our website, FederatedInvestors.com, offers easy access to Federated resources that include timely fund updates, economic and market insights from our investment strategists, and financial planning tools. We invite you to register to take full advantage of its capabilities.
Thank you for investing with Federated. I hope you find this information useful and look forward to keeping you informed.
Sincerely,
J. Christopher Donahue, President
Not FDIC Insured • May Lose Value • No Bank Guarantee
CONTENTS
| 1 |
| 7 |
| 8 |
| 15 |
| 18 |
| 20 |
| 21 |
| 22 |
| 33 |
| 34 |
| 36 |
| 42 |
| 47 |
| 47 |
Management's Discussion of Fund Performance (unaudited)
The total return of Federated Floating Rate Strategic Income Fund (the “Fund”), based on net asset value for the 12-month reporting period ended March 31, 2015, was 2.06% for the Class A Shares, 1.41% for the Class C Shares and 2.42% for the Institutional Shares. The 2.42% total return for the Institutional Shares for the reporting period consisted of 3.61% of dividends and reinvestments and -1.19% of depreciation in the net asset value of the shares. The Bank of America Merrill Lynch 3-Month U.S. Treasury Bill Index (BAML3MT),1 the Fund's broad-based securities market index, had a total return of 0.03%, and the Fund's custom blended index (“Blended Benchmark”)2 (55% Credit Suisse Leveraged Loan Index (CSLLI)/30% Bank of America Merrill Lynch 1-Year Treasury Index (BAML1YT)/15% 1-Month London InterBank Offered Rate (LIBOR)) had a total return of 1.65% for the same reporting period. The Fund's total return during the reporting period reflected actual cash flows, transaction costs and other expenses which were not reflected in the total return of the BAML3MT or the Blended Benchmark.
During the 12-month reporting period, the primary components of the Fund's investment strategy which affected performance relative to the Blended Benchmark were: (a) allocation of fund assets among the following three broad sectors: domestic noninvestment-grade,3 domestic investment-grade and foreign;4 (b) the selection of securities within each of the Fund's sectors; and (c) duration5 management utilizing derivatives in conjunction with anticipated interest rate changes.
The following discussion will focus on the performance of the Fund's Institutional Shares.
MARKET OVERVIEW
During the 12-month reporting period, domestic leveraged finance asset classes generated positive absolute total returns despite incurring bouts of volatility. This included the United States leveraged loan market, the asset class in which the Fund maintained its highest concentration throughout the reporting period. While overall absolute returns were positive, asset volatility caused credit risk spreads to increase in the loan market. In fact, the spread between the CSLLI and three-month LIBOR (as measured by a three-year discount margin) increased from 473 basis points at the beginning of the period to 518 basis points by the end of the reporting period.6
The bulk of the negative volatility was experienced by leveraged finance assets during the middle stretches of the reporting period. There were several factors that contributed to heightened investor risk aversion. Within leveraged finance, relative valuation in high yield and a perceived decline in new issuance credit standards were noteworthy topics of focus, raising questions about the durability of the current credit cycle. Riskier assets also grappled with the
Annual Shareholder Report
potential impact from the gradual shift away from extraordinary monetary stimulus measures in the United States. In addition, investor focus on the spillover effect from weaker economic readings out of China and the euro zone had a dampening effect on risk assets. Finally, the precipitous decline in crude oil prices toward the end of 2014 created concern about the viability of energy-related companies within that industry sector of leveraged finance markets.
Despite the aforementioned concerns, there were several mitigating factors that contributed to positive performance of leveraged finance assets in the final quarter of the reporting period. First, the U.S. economy continued to display signs of relative stability versus other regions around the globe, benefiting from steady employment data. In addition, leveraged finance credit fundamentals remained solid. Overall positive corporate credit quality continued to benefit from favorable balance sheet, liquidity and cash flow characteristics of borrowers throughout the reporting period. This led to an environment where overall corporate default levels were relatively contained in the leveraged finance markets.
Overall, the aforementioned cross-currents led to pockets of volatility and spread widening, but overall performance of leveraged finance assets finished the reporting period on a strong note.
SECTOR ALLOCATION
The primary contributor to the Fund's outperformance relative to the Blended Benchmark was sector allocation among its three broad sectors: domestic noninvestment-grade, domestic investment-grade and foreign. Fund performance benefited from an overweight allocation to the domestic noninvestment-grade sector and underweight allocation to the domestic investment-grade sector during the reporting period. Riskier domestic leveraged finance asset classes outperformed the higher quality portions of the Blended Benchmark during the reporting period.
SECURITY SELECTION
Overall positive security selection within each of the Fund's sectors contributed to the Fund's outperformance relative to the Blended Benchmark during the reporting period. Within the domestic noninvestment-grade sector, security selection was enhanced by an overweight allocation to loans from the middle tier of the credit spectrum relative to the CSLLI. In addition, positive contributions from holdings in short duration high-yield7 corporate bonds enhanced performance. Within the domestic investment-grade sector, Fund holdings in various higher quality floating rate asset classes,8 including bank loans,9 produced returns which exceeded that portion of the Blended Benchmark. Within the foreign sector, Fund exposure to trade finance instruments, loans and corporate bonds generated returns which exceeded that portion of the Blended Benchmark.
Annual Shareholder Report
DURATION MANAGEMENT
The Fund's position in Treasury futures contracts10 was a negative contributor to performance, relative to the Blended Benchmark during the 12-month reporting period given the downward movement in longer term treasury yields during the reporting period.
| 1 | Please see the footnotes to the line graphs below for definitions of, and further information about, the BAML3MT. |
| 2 | Please see the footnotes to the line graphs below for definitions of, and further information about, the Blended Benchmark. |
| 3 | Noninvestment-grade securities are securities that are not rated at least “BBB” or unrated securities of a comparable quality. Investment-grade securities are securities that are rated at least “BBB” or unrated securities of a comparable quality. Credit ratings are an indication of the risk that a security will default. They do not protect a security from credit risk. Lower-rated bonds typically offer higher yields to help compensate investors for the increased risk associated with them. Among these risks are lower creditworthiness, greater price volatility, more risk to principal and income than with higher-rated securities and increased possibilities of default. |
| 4 | International investing involves special risks including currency risks, increased volatility, political risks and differences in auditing and other financial standards. |
| 5 | Duration is a measure of a security's price sensitivity to changes in interest rates. Securities with longer duration are more sensitive to changes in interest rates than securities of shorter durations. |
| 6 | Bond prices are sensitive to changes in interest rates, and a rise in interest rates can cause a decline in their prices. |
| 7 | High-yield, lower-rated securities generally entail greater market, credit and liquidity risks than investment-grade securities and may include higher volatility and a higher risk of default. |
| 8 | Variable and floating rate loans and securities generally are less sensitive to interest rate changes, but may decline in value if their interest rates do not rise as much or as quickly as interest rates in general. Conversely, variable and floating-rate loans and securities generally will not increase in value as much as fixed-rate debt instruments if interest rates decline. |
| 9 | In addition to the risks generally associated with debt instruments such as credit, market, interest rate, liquidity and derivatives risk, leveraged loans are also subject to the risk that the value of the collateral securing a loan may decline, be insufficient to meet the obligations of the borrower, or be difficult to liquidate. |
| 10 | The Fund's use of derivative instruments involves risks different from, or possibly greater than, the risks associated with investing directly in securities and other traditional instruments. |
Annual Shareholder Report
FUND PERFORMANCE AND GROWTH OF A $10,000 INVESTMENT
The graphs below illustrate the hypothetical investment of $10,0001 in the Federated Floating Rate Strategic Income Fund (the “Fund”) from February 23, 2011 to March 31, 2015 for Class A Shares, December 3, 2010 to March 31, 2015 for Class C Shares and from December 3, 2010 to March 31, 2015 for Institutional Shares, compared to the Bank of America Merrill Lynch 3-Month U.S. Treasury Bill Index (BAML3MT),2,3 the Fund's broad-based securities market index, and a blend of indexes comprised of 55% Credit Suisse Leveraged Loan Index (CSLLI)/30% Bank of America Merrill Lynch 1-Year Treasury Index (BAML1YT)/15% 1-Month London Interbank Offered Rate (LIBOR) (the “Blended Benchmark”).2,3 The Average Annual Total Return table below shows returns for each class averaged over the stated periods.
Growth of a $10,000 Investment–Class A Shares
Growth of $10,000 as of March 31, 2015

| Federated Floating Rate Strategic Income Fund - | Class A Shares | NA | BAML3MT | Blended Benchmark |
| F | NA | I | I |
| 2/23/2011 | 9,800 | | 10,000 | 10,000 |
| 3/31/2011 | 9,802 | | 10,002 | 10,038 |
| 3/31/2012 | 10,139 | | 10,009 | 10,202 |
| 3/31/2013 | 10,647 | | 10,020 | 10,671 |
| 3/31/2014 | 10,984 | | 10,027 | 10,976 |
| 3/31/2015 | 11,210 | | 10,030 | 11,157 |
41 graphic description end -->
| ■ | Total returns shown include the maximum sales charge of 2.00% ($10,000 investment minus $200 sales charge = $9,800). |
Annual Shareholder Report
Growth of a $10,000 Investment4
Growth of $10,000 as of March 31, 2015
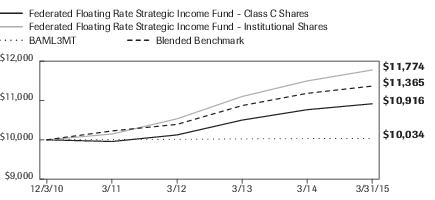
| Federated Floating Rate Strategic Income Fund - | Class C Shares | Institutional Shares | BAML3MT | Blended Benchmark |
| F | F | I | I |
| 12/3/2010 | 10,000 | 10,000 | 10,000 | 10,000 |
| 3/31/2011 | 9,957 | 10,147 | 10,006 | 10,226 |
| 3/31/2012 | 10,124 | 10,533 | 10,013 | 10,392 |
| 3/31/2013 | 10,501 | 11,100 | 10,024 | 10,870 |
| 3/31/2014 | 10,765 | 11,496 | 10,031 | 11,181 |
| 3/31/2015 | 10,916 | 11,774 | 10,034 | 11,365 |
41 graphic description end -->
■ | Total returns shown include the maximum contingent deferred sales charge of 1.00% as applicable. |
Average Annual Total Returns Table for the Period Ended 3/31/2015
(returns reflect all applicable sales charges and contingent deferred sales charges as specified below in footnote #1)
| | 1 Year | Start of
Performance* |
| Class A Shares | -0.02% | 2.82% |
| Class C Shares4 | 0.42% | 2.05% |
| Institutional Shares | 2.42% | 3.85% |
| BAML3MT | 0.03% | 0.08% |
| Blended Benchmark | 1.65% | 3.01% |
| * | The Fund's Class A Shares start of performance date was February 23, 2011. The Fund's Class C Shares start of performance date was December 3, 2010. The Fund's Institutional Shares start of performance date was December 3, 2010. The returns of the BAML3MT and Blended Benchmark are from the Institutional Shares start of performance date. |
| | |
Performance data quoted represents past performance which is no guarantee of future results. Investment return and principal value will fluctuate so that an investor's shares, when redeemed, may be worth more or less than their original cost. Mutual fund performance changes over time and current performance may be lower or higher than what is stated. For current to the most recent month-end performance and after-tax returns, visit FederatedInvestors.com or call 1-800-341-7400. Returns shown do not reflect the deduction of taxes that a shareholder would pay on Fund distributions or the redemption of Fund shares. Mutual funds are not obligations of or guaranteed by any bank and are not federally insured.
Annual Shareholder Report
| 1 | Represents a hypothetical investment of $10,000 in the Fund's Class A Shares after deducting the maximum sales charge of 2.00% ($10,000 investment minus $200 sales charge = $9,800); for Class C Shares, a 1.00% contingent deferred sales charge would be applied to any redemption less than one year from purchase date. The Fund's performance assumes the reinvestment of all dividends and distributions. The BAML3MT and the Blended Benchmark have been adjusted to reflect reinvestment of dividends on securities in the indexes. |
| 2 | The BAML3MT and the Blended Benchmark are not adjusted to reflect sales charges, expenses or other fees that the Securities and Exchange Commission requires to be reflected in the Fund's performance. The indexes are unmanaged and, unlike the Fund, are not affected by cash flows. It is not possible to invest directly in an index. |
| 3 | The BAML3MT is an index tracking short-term U.S. government securities. The CSLLI is designed to mirror the investable universe of the U.S. dollar-denominated leveraged loan market. Average values are computed over the Index for coupon, current yield, initial spread and price. The average coupon, current yield and initial spread are weighted by market value (amount outstanding multiplied by the price) at the end of the measurement period for each loan currently paying interest in the Index. Total return is computed for each loan, which is the percent change in the value of each loan during the measurement period. Total return is the sum of three components: principal, interest and reinvestment return. BAML1YT is an unmanaged index tracking U.S. government securities. The index is produced by Bank of America Merrill Lynch, Pierce, Fenner & Smith, Inc. LIBOR is a daily reference rate based on the interest rates at which banks borrow unsecured Funds from other banks in the London wholesale money market (or interbank market). |
| 4 | The Fund's Class C Shares commenced operations on September 6, 2013. For the period prior to the commencement of operations of Class C Shares, the performance information shown is for the Fund's Institutional Shares performance adjusted to reflect the expenses of Class C Shares for each year for which the expenses of Class C Shares would have exceeded the actual expenses paid by Institutional Shares. The performance shown in the table above also has been adjusted to reflect differences between the sales loads and charges imposed on the purchase and redemption of the Institutional Shares and Class C Shares. |
Annual Shareholder Report
Portfolio of Investments Summary Table (unaudited)
At March 31, 2015, the Fund's portfolio composition1 was as follows:
| Security Type | Percentage of
Total Net Assets2 |
| Floating Rate Loans | 70.6% |
| Corporate Debt Securities | 11.6% |
| Trade Finance Agreements | 9.0% |
| Collateralized Mortgage Obligations | 3.0% |
| Asset-Backed Securities | 0.7% |
| U.S. Government Agency Adjustable Rate Mortgage Securities | 0.3% |
| Governments/Agencies | 0.3% |
| Derivative Contracts3 | (0.1)% |
| Cash Equivalents4 | 2.6% |
| Other Assets and Liabilities—Net5 | 2.0% |
| TOTAL | 100.0% |
| 1 | See the Fund's Prospectus and Statement of Additional Information for a description of these security types. |
| 2 | As of the date specified above, the Fund owned shares of one or more affiliated investment companies. For purposes of this table, the affiliated investment company (other than an affiliated money market mutual fund) is not treated as a single portfolio security, but rather the Fund is treated as owning a pro rata portion of each security and each other asset and liability owned by the affiliated investment company. Accordingly, the percentages of total net assets shown in the table will differ from those presented on the Portfolio of Investments. |
| 3 | Based upon net unrealized appreciation (depreciation) or value of the derivative contracts as applicable. Derivative contracts may consist of futures, forwards, options and swaps. The impact of a derivative contract on the Fund's performance may be larger than its unrealized appreciation (depreciation) or value may indicate. In many cases, the notional value or amount of a derivative contract may provide a better indication of the contract's significance to the portfolio. More complete information regarding the Fund's direct investments in derivative contracts, including unrealized appreciation (depreciation), value and notional values or amounts of such contracts, can be found in the table at the end of the Portfolio of Investments included in this Report. |
| 4 | Cash Equivalents include any investments in money market mutual funds and/or overnight repurchase agreements. |
| 5 | Assets, other than investments in securities and derivative contracts, less liabilities. See Statement of Assets and Liabilities. |
Annual Shareholder Report
Portfolio of Investments
March 31, 2015
Principal
Amount
or Shares | | | Value |
| | | ADJUSTABLE RATE MORTGAGES—0.3% | |
| | | Federal Home Loan Mortgage Corporation ARM—0.2% | |
| $281,154 | | FHLMC ARM 781523, 2.354%, 5/01/2034 | $300,703 |
| 357,916 | | FHLMC ARM 1H2662, 2.578%, 5/01/2036 | 382,803 |
| 398,196 | | FHLMC ARM 848194, 2.385%, 8/01/2035 | 424,354 |
| 276,317 | | FHLMC ARM 848746, 2.431%, 7/01/2034 | 294,765 |
| | | TOTAL | 1,402,625 |
| | | Federal National Mortgage Association ARM—0.1% | |
| 240,031 | | FNMA ARM 881959, 2.210%, 2/01/2036 | 254,370 |
| 131,700 | | FNMA ARM 745059, 1.987%, 9/01/2035 | 139,715 |
| 107,195 | | FNMA ARM 810320, 2.500%, 4/01/2034 | 114,648 |
| | | TOTAL | 508,733 |
| | | TOTAL ADJUSTABLE RATE MORTGAGES
(IDENTIFIED COST $1,888,845) | 1,911,358 |
| | | CORPORATE BONDS—11.0% | |
| | | Automotive—0.7% | |
| 2,000,000 | | Ford Motor Credit Co., Floating Rate Note—Sr. Note, 0.834%, 12/6/2017 | 1,987,514 |
| 750,000 | 1,2 | Nissan Motor Acceptance Corp., Sr. Unsecd. Note, Series 144A, 0.969%, 9/26/2016 | 754,598 |
| 1,000,000 | 1,2 | Schaeffler AG, Series 144A, 6.875%, 8/15/2018 | 1,048,750 |
| | | TOTAL | 3,790,862 |
| | | Building Materials—0.5% | |
| 2,850,000 | 1,2 | Rexel, Inc., Series 144A, 6.125%, 12/15/2019 | 2,999,625 |
| | | Consumer Cyclical Services—0.5% | |
| 1,000,000 | 1,2 | Garda World Security Corp., Series 144A, 7.25%, 11/15/2021 | 987,500 |
| 2,000,000 | 1,2 | Garda World Security Corp., Series 144A, 7.25%, 11/15/2021 | 1,975,000 |
| | | TOTAL | 2,962,500 |
| | | Consumer Products—0.8% | |
| 3,450,000 | | Party City Holdings, Inc., Sr. Unsecd. Note, 8.75%, 8/15/2019 | 3,527,625 |
| 1,000,000 | | Spectrum Brands, Inc., Sr. Unsecd. Note, 6.75%, 3/15/2020 | 1,057,500 |
| | | TOTAL | 4,585,125 |
| | | Financial Institutions—0.8% | |
| 1,000,000 | | Bank of America Corp., Floating Rate Note—Sr. Note, 1.293%, 1/15/2019 | 1,014,624 |
| 950,000 | | Bank of America Corp., Sr. Unsecd. Note, Series MTN, 1.144%, 4/1/2019 | 956,493 |
Annual Shareholder Report
Principal
Amount
or Shares | | | Value |
| | | CORPORATE BONDS—continued | |
| | | Financial Institutions—continued | |
| $1,000,000 | | Goldman Sachs Group, Inc., Floating Rate Note—Sr. Note, Series MTN, 1.357%, 11/15/2018 | $1,011,811 |
| 1,550,000 | 1,2 | Hub Holdings LLC/Hub Hol, Sr. Unsecd. Note, Series 144A, 8.125%, 7/15/2019 | 1,546,125 |
| 300,000 | | MUFG Union Bank, N.A., Floating Rate Note—Sr. Note, 1.019%, 9/26/2016 | 301,675 |
| | | TOTAL | 4,830,728 |
| | | Food & Beverage—0.5% | |
| 1,000,000 | | Mondelez International, Inc., Floating Rate Note—Sr. Note, 0.775%, 2/1/2019 | 991,930 |
| 2,000,000 | | U.S. Foodservice, Inc., Sr. Unsecd. Note, 8.50%, 6/30/2019 | 2,105,000 |
| | | TOTAL | 3,096,930 |
| | | Health Care—1.2% | |
| 2,000,000 | | Biomet, Inc., Sr. Sub., 6.50%, 10/1/2020 | 2,105,000 |
| 2,975,000 | | Iasis Healthcare, Sr. Unsecd. Note, 8.375%, 5/15/2019 | 3,101,437 |
| 1,900,000 | | VWR Funding, Inc., Sr. Unsecd. Note, 7.25%, 9/15/2017 | 1,990,250 |
| | | TOTAL | 7,196,687 |
| | | Independent Energy—0.6% | |
| 1,000,000 | | BP Capital Markets PLC, Floating Rate Note—Sr. Note, 0.899%, 9/26/2018 | 1,000,801 |
| 1,000,000 | | Carrizo Oil & Gas, Inc., Sr. Unsecd. Note, 8.625%, 10/15/2018 | 1,047,500 |
| 1,200,000 | | Chesapeake Energy Corp., 3.503%, 4/15/2019 | 1,158,000 |
| | | TOTAL | 3,206,301 |
| | | Leisure—0.1% | |
| 825,000 | 1,2 | NCL Corp. Ltd., Series 144A, 5.25%, 11/15/2019 | 849,750 |
| | | Media Entertainment—0.3% | |
| 1,650,000 | 1,2 | Townsquare Radio LLC, Series 144A, 9.00%, 4/1/2019 | 1,760,732 |
| | | Midstream—0.1% | |
| 450,000 | 1,2 | Tesoro Logistics LP, Sr. Unsecd. Note, Series 144A, 5.50%, 10/15/2019 | 465,750 |
| | | Oil Field Services—0.1% | |
| 494,000 | | Compagnie Generale de Geophysique Veritas, Sr. Unsecd. Note, 7.75%, 5/15/2017 | 471,770 |
| | | Packaging—0.7% | |
| 2,000,000 | 1,2 | Ardagh Packaging Finance PLC, Series 144A, 3.271%, 12/15/2019 | 1,960,000 |
| 2,000,000 | 1,2 | Ardagh Packaging Finance PLC, Series 144A, 6.25%, 1/31/2019 | 2,015,000 |
| | | TOTAL | 3,975,000 |
| | | Pharmaceuticals—1.2% | |
| 1,000,000 | | Actavis Funding SCS, Sr. Unsecd. Note, 1.348%, 3/12/2018 | 1,007,035 |
Annual Shareholder Report
Principal
Amount
or Shares | | | Value |
| | | CORPORATE BONDS—continued | |
| | | Pharmaceuticals—continued | |
| $3,000,000 | 1,2 | Jaguar Holding Co., Series 144A, 9.375%, 10/15/2017 | $3,075,000 |
| 3,000,000 | 1,2 | Vrx Escrow Corp., Series 144A, 5.375%, 3/15/2020 | 3,037,500 |
| | | TOTAL | 7,119,535 |
| | | Retailers—1.1% | |
| 3,000,000 | 1,2 | Academy Finance Corp., Series 144A, 8.00%, 6/15/2018 | 3,007,500 |
| 395,000 | 1,2 | Michaels Stores, Inc., Series 144A, 7.50%, 8/1/2018 | 404,875 |
| 2,500,000 | 1,2 | PETCO Animal Supplies, Inc., Series 144A, 8.50%, 10/15/2017 | 2,575,000 |
| 335,000 | | Wolverine World Wide, Inc., Sr. Unsecd. Note, 6.125%, 10/15/2020 | 359,287 |
| | | TOTAL | 6,346,662 |
| | | Technology—1.4% | |
| 1,000,000 | 1,2 | Epicor Software Corp., Series 144A, 9.00%, 6/15/2018 | 1,022,500 |
| 4,400,000 | 1,2 | Igloo Holdings Corp., Sr. Note, Series 144A, 8.25%, 12/15/2017 | 4,449,500 |
| 1,500,000 | | TransUnion Holding Co., Inc., 8.125%, 6/15/2018 | 1,543,125 |
| 1,000,000 | | TransUnion Holding Co., Inc., Sr. Unsecd. Note, 9.625%, 6/15/2018 | 1,011,875 |
| | | TOTAL | 8,027,000 |
| | | Wireless Communications—0.4% | |
| 2,000,000 | | Verizon Communications, Inc., Floating Rate Note—Sr. Note, 1.041%, 6/17/2019 | 2,017,546 |
| 410,000 | | Verizon Communications, Inc., Floating Rate Note—Sr. Note, 2.021%, 9/14/2018 | 427,997 |
| | | TOTAL | 2,445,543 |
| | | TOTAL CORPORATE BONDS
(IDENTIFIED COST $64,133,247) | 64,130,500 |
| | | ASSET-BACKED SECURITIES—0.7% | |
| | | Auto Receivables—0.1% | |
| 300,000 | 1,2 | Chesapeake Funding LLC 2013-1A, Class D, 1.975%, 1/7/2025 | 300,783 |
| 125,000 | 1,2 | Hyundai Floorplan Master Owner Trust 2013-1A, Class B, 0.825%, 5/15/2018 | 124,894 |
| 300,000 | | Smart Trust 2013-2US, Class A4B, 0.725%, 2/14/2019 | 300,261 |
| | | TOTAL | 725,938 |
| | | Credit Card—0.3% | |
| 1,500,000 | | American Express Credit Account Master 2013-1, Class B, 0.875%, 2/16/2021 | 1,507,933 |
| | | Student Loans—0.3% | |
| 1,900,000 | 1,2 | SLM Student Loan Trust 2013-C, Class A2B, 1.575%, 10/15/2031 | 1,925,768 |
| | | TOTAL ASSET-BACKED SECURITIES
(IDENTIFIED COST $4,125,000) | 4,159,639 |
Annual Shareholder Report
Principal
Amount
or Shares | | | Value |
| | | COLLATERALIZED MORTGAGE OBLIGATIONS—3.0% | |
| | | Commercial Mortgage—0.1% | |
| $600,000 | 1,2 | Wells Fargo Commercial Mortgage Trust 2013-LC12, Class A3FL, 1.225%, 7/15/2046 | $604,253 |
| | | Federal Home Loan Mortgage Corporation—2.2% | |
| 1,860,497 | | REMIC 3241 FM, 0.555%, 11/15/2036 | 1,867,313 |
| 3,280,724 | | REMIC 3922 CF, 0.575%, 4/15/2041 | 3,287,055 |
| 7,814,616 | | REMIC 4097 KF, 0.475%, 9/15/2031 | 7,830,477 |
| | | TOTAL | 12,984,845 |
| | | Federal National Mortgage Association—0.7% | |
| 1,043,803 | | REMIC 2006-111 FA, 0.554%, 11/25/2036 | 1,049,100 |
| 410,851 | | REMIC 2010-134 BF, 0.604%, 10/25/2040 | 412,840 |
| 718,148 | | REMIC 2010-135 FP, 0.574%, 12/25/2040 | 719,937 |
| 1,700,346 | | REMIC 2012-135 FA, 0.474%, 11/25/2039 | 1,703,067 |
| | | TOTAL | 3,884,944 |
| | | TOTAL COLLATERALIZED MORTGAGE OBLIGATIONS
(IDENTIFIED COST $17,457,668) | 17,474,042 |
| | | FLOATING RATE LOANS—9.9% | |
| 2,990,000 | | Activision Blizzard, Inc., Term Loan—1st Lien, 3.25%, 10/11/2020 | 3,006,819 |
| 2,500,000 | | Altice Financing SA, Term Loan—1st Lien, 5.25%, 1/29/2022 | 2,527,350 |
| 6,180,095 | | Aramark Corp., Term Loan—1st Lien, 3.25%, 2/24/2021 | 6,180,744 |
| 1,940,000 | | Aramark Corp., Term Loan—1st Lien, 3.25%, 9/7/2019 | 1,947,071 |
| 2,022,309 | | Avago Technologies Ltd., Term Loan—1st Lien, 3.75%, 5/6/2021 | 2,029,205 |
| 1,812,222 | | Berry Plastics Group, Inc., Term Loan—1st Lien, 3.75%, 1/6/2021 | 1,814,904 |
| 6,406,011 | | Charter Communications Operating LLC, Term Loan—1st Lien, 3.00%, 1/3/2021 | 6,394,993 |
| 990,000 | | Chrysler Group LLC, Term Loan—1st Lien, 3.25%, 12/31/2018 | 990,619 |
| 2,992,500 | | Crown Americas LLC, Term Loan—1st Lien, 4.00%, 2/18/2022 | 3,024,295 |
| 568,572 | | Custom Sensors & Technologies, Inc., Term Loan—1st Lien, 4.50%, 9/3/2021 | 569,282 |
| 1,408,219 | | Darling Ingredients, Inc., Term Loan—1st Lien, 3.25%, 1/8/2021 | 1,403,593 |
| 2,000,000 | | Delos Finance Sarl, Term Loan—1st Lien, 1.00%, 3/6/2021 | 2,005,500 |
| 1,336,782 | | Garda World Security Corp., Term Loan—1st Lien, 4.00%, 11/8/2020 | 1,332,886 |
| 341,968 | | Garda World Security Corp., Term Loan—1st Lien, 4.00%, 11/8/2020 | 340,971 |
| 283,571 | | Hillman Group, Inc., Term Loan—1st Lien, 4.50%, 6/30/2021 | 286,288 |
| 2,750,681 | | Hilton Worldwide Finance LLC, Term Loan—1st Lien, 3.50%, 10/25/2020 | 2,757,557 |
| 2,180,043 | | Hologic, Inc., Term Loan—1st Lien, 3.25%, 8/1/2019 | 2,186,703 |
| 2,000,000 | | INA Beteiligungsgesellschaft mbH, Term Loan—1st Lien, 4.25%, 5/15/2020 | 2,017,220 |
Annual Shareholder Report
Principal
Amount
or Shares | | | Value |
| | | FLOATING RATE LOANS—continued | |
| $935,101 | | Las Vegas Sands Corp., Term Loan—1st Lien, 3.25%, 12/19/2020 | $935,583 |
| 713,566 | | Nielsen Finance LLC/Nielsen Finance Co., Term Loan—1st Lien, 3.175%, 4/15/2021 | 714,904 |
| 3,000,000 | | Onex Corp., Term Loan—1st Lien, 5.25%, 3/13/2022 | 3,031,680 |
| 246,875 | | Oxea SARL, Term Loan—1st Lien, 4.25%, 1/15/2020 | 240,472 |
| 1,225,485 | | PVH Corp., Term Loan—1st Lien, 3.25%, 2/13/2020 | 1,234,578 |
| 491,250 | | Seminole Hard Rock Entertainment, Inc./Seminole Hard Rock International LLC, Term Loan—1st Lien, 3.50%, 5/14/2020 | 489,715 |
| 1,571,795 | | Seminole Tribe of Florida, Term Loan—1st Lien, 2.256%, 10/11/2017 | 1,575,724 |
| 2,985,000 | | Sensata Technologies B.V., Term Loan—1st Lien, 3.50%, 10/14/2021 | 3,005,746 |
| 397,500 | | Tesoro Corp., Term Loan—1st Lien, 2.508%, 5/30/2016 | 397,997 |
| 4,556,261 | | Virgin Media Investment Holdings, Term Loan—1st Lien, 3.50%, 6/7/2020 | 4,556,284 |
| 415,790 | | Water PIK, Inc., Term Loan—2nd Lien, 9.75%, 1/9/2021 | 415,270 |
| | | TOTAL FLOATING RATE LOANS
(IDENTIFIED COST $57,005,272) | 57,413,953 |
| | | INVESTMENT COMPANIES—74.0%3 | |
| 36,360,697 | | Federated Bank Loan Core Fund | 368,333,863 |
| 6,636,178 | | Federated Project and Trade Finance Core Fund | 62,247,351 |
| | | TOTAL INVESTMENT COMPANIES
(IDENTIFIED COST $435,794,751) | 430,581,214 |
| | | TOTAL INVESTMENTS—98.9%
(IDENTIFIED COST $580,404,783)4 | 575,670,706 |
| | | OTHER ASSETS AND LIABILITIES - NET—1.1%5 | 6,306,824 |
| | | TOTAL NET ASSETS—100% | $581,977,530 |
At March 31, 2015, the Fund had the following outstanding futures contracts:
| Description | Number of
Contracts | Notional
Value | Expiration
Date | Unrealized
Depreciation |
| 6United States Treasury Notes 5-Year Short Futures | 160 | $19,233,750 | June 2015 | $(240,366) |
| 6United States Treasury Notes 10-Year Short Futures | 100 | $12,890,625 | June 2015 | $(219,408) |
| UNREALIZED DEPRECIATION ON FUTURES CONTRACTS | $(459,774) |
Unrealized Depreciation on Futures Contracts is included in “Other Assets and
Liabilities—Net.”
Annual Shareholder Report
| 1 | Denotes a restricted security that either: (a) cannot be offered for public sale without first being registered, or being able to take advantage of an exemption from registration, under the Securities Act of 1933; or (b) is subject to a contractual restriction on public sales. At March 31, 2015, these restricted securities amounted to $36,890,403, which represented 6.3% of total net assets. |
| 2 | Denotes a restricted security that may be resold without restriction to “qualified institutional buyers” as defined in Rule 144A under the Securities Act of 1933 and that the Fund has determined to be liquid under criteria established by the Fund's Board of Trustees (the “Trustees”). At March 31, 2015, these liquid restricted securities amounted to $36,890,403, which represented 6.3% of total net assets. |
| 3 | Affiliated holdings. |
| 4 | The cost of investments for federal tax purposes amounts to $581,380,988. |
| 5 | Assets, other than investments in securities, less liabilities. See Statement of Assets and Liabilities. |
| 6 | Non-income-producing security. |
Note: The categories of investments are shown as a percentage of total net assets at March 31, 2015.
Various inputs are used in determining the value of the Fund's investments. These inputs are summarized in the three broad levels listed below:
Level 1—quoted prices in active markets for identical securities.
Level 2—other significant observable inputs (including quoted prices for similar securities, interest rates, prepayment speeds, credit risk, etc.). Also includes securities valued at amortized cost.
Level 3—significant unobservable inputs (including the Fund's own assumptions in determining the fair value of investments).
The inputs or methodology used for valuing securities are not an indication of the risk associated with investing in those securities.
The following is a summary of the inputs used, as of March 31, 2015, in valuing the Fund's assets carried at fair value:
| Valuation Inputs |
| | Level 1—
Quoted
Prices | Level 2—
Other
Significant
Observable
Inputs | Level 3—
Significant
Unobservable
Inputs | Total |
| Debt Securities: | | | | |
| Adjustable Rate Mortgages | $— | $1,911,358 | $— | $1,911,358 |
| Corporate Bonds | — | 64,130,500 | — | 64,130,500 |
| Asset-Backed Securities | — | 4,159,639 | — | 4,159,639 |
| Collateralized Mortgage Obligations | — | 17,474,042 | — | 17,474,042 |
| Floating Rate Loans | — | 57,413,953 | — | 57,413,953 |
| Investment Companies1 | — | 430,581,2142 | — | 430,581,214 |
| TOTAL SECURITIES | $— | $575,670,706 | $— | $575,670,706 |
OTHER FINANCIAL
INSTRUMENTS3 | $(459,774) | $— | $— | $(459,774) |
Annual Shareholder Report
| 1 | Federated Bank Loan Core Fund and Federated Project and Trade Finance Core Fund are affiliated holdings offered only to registered investment companies and other accredited investors. Investments in these funds are deemed Level 2 due to the fact that the net asset value (the NAV) is not publicly available and, with respect to Federated Project and Trade Finance Core Fund, due to fact that the price of shares redeemed may be determined as of the closing NAV of the fund up to twenty-four days after receipt of a shareholder redemption request. |
| 2 | Includes $371,606,323 of an affiliated investment company holding transferred from Level 1 to Level 2 because the Adviser determined that this investment more appropriately meets the definition of Level 2. Transfer shown represents the value of the investment at the beginning of the period. |
| 3 | Other financial instruments include futures contracts. |
The following acronyms are used throughout this portfolio:
| ARM | —Adjustable Rate Mortgage |
| FHLMC | —Federal Home Loan Mortgage Corporation |
| FNMA | —Federal National Mortgage Association |
| MTN | —Medium Term Note |
| REMIC | —Real Estate Mortgage Investment Conduit |
See Notes which are an integral part of the Financial Statements
Annual Shareholder Report
Financial Highlights–Class A Shares
(For a Share Outstanding Throughout Each Period)
| | Year Ended March 31, | Period
Ended
3/31/20112 |
| 2015 | 2014 | 20131 | 2012 |
| Net Asset Value, Beginning of Period | $10.06 | $10.08 | $9.96 | $10.04 | $10.07 |
| Income From Investment Operations: | | | | | |
| Net investment income | 0.313 | 0.33 | 0.37 | 0.373 | 0.03 |
| Net realized and unrealized gain (loss) on investments and futures contracts | (0.11) | (0.01) | 0.12 | (0.04) | (0.03) |
| TOTAL FROM INVESTMENT OPERATIONS | 0.20 | 0.32 | 0.49 | 0.33 | 0.004 |
| Less Distributions: | | | | | |
| Distributions from net investment income | (0.32) | (0.34) | (0.37) | (0.41) | (0.03) |
| Distributions from net realized gain on investments | (0.00)4 | — | — | — | — |
| TOTAL DISTRIBUTIONS | (0.32) | (0.34) | (0.37) | (0.41) | (0.03) |
| Net Asset Value, End of Period | $9.94 | $10.06 | $10.08 | $9.96 | $10.04 |
| Total Return5 | 2.06% | 3.21% | 5.02% | 3.44% | 0.02% |
| Ratios to Average Net Assets: | | | | | |
| Net expenses | 1.04% | 1.00% | 1.00% | 1.00% | 1.10%6 |
| Net investment income | 3.13% | 3.21% | 3.54% | 3.77% | 3.74%6 |
| Expense waiver/reimbursement7 | 0.11% | 0.19% | 0.47% | 0.96% | 1.66%6 |
| Supplemental Data: | | | | | |
| Net assets, end of period (000 omitted) | $308,242 | $326,289 | $71,544 | $22,244 | $6,231 |
| Portfolio turnover | 26% | 8% | 17% | 39% | 8%8 |
| 1 | Beginning with the year ended March 31, 2013, the Fund was audited by Ernst & Young LLP. The previous year and period ended March 31, 2011 were audited by another independent registered public accounting firm. |
| 2 | Reflects operations for the period from February 23, 2011 (date of initial investment) to March 31, 2011. |
| 3 | Per share numbers have been calculated using the average shares method. |
| 4 | Represents less than $0.01. |
| 5 | Based on net asset value, which does not reflect the sales charge, redemption fee or contingent deferred sales charge, if applicable. Total returns for periods of less than one year are not annualized. |
| 6 | Computed on an annualized basis. |
| 7 | This expense decrease is reflected in both the net expense and the net investment income ratios shown above. |
| 8 | Portfolio turnover is calculated at the Fund level. Percentage indicated was calculated for the period ended December 3, 2010 to March 31, 2011. |
See Notes which are an integral part of the Financial Statements
Annual Shareholder Report
Financial Highlights–Class C Shares
(For a Share Outstanding Throughout Each Period)
| | Year Ended
3/31/2015 | Period
Ended
3/31/20141 |
| Net Asset Value, Beginning of Period | $10.07 | $10.05 |
| Income From Investment Operations: | | |
| Net investment income | 0.252 | 0.16 |
| Net realized and unrealized gain (loss) on investments and futures contracts | (0.11) | 0.02 |
| TOTAL FROM INVESTMENT OPERATIONS | 0.14 | 0.18 |
| Less Distributions: | | |
| Distributions from net investment income | (0.26) | (0.16) |
| Distributions from net realized gain on investments | (0.00)3 | — |
| TOTAL DISTRIBUTIONS | (0.26) | (0.16) |
| Net Asset Value, End of Period | $9.95 | $10.07 |
| Total Return4 | 1.41% | 1.81% |
| Ratios to Average Net Assets: | | |
| Net expenses | 1.69% | 1.65%5 |
| Net investment income | 2.51% | 2.49%5 |
| Expense waiver/reimbursement6 | 0.11% | 0.24%5 |
| Supplemental Data: | | |
| Net assets, end of period (000 omitted) | $24,105 | $15,826 |
| Portfolio turnover | 26% | 8%7 |
| 1 | Reflects operations for the period from September 6, 2013 (date of initial investment) to March 31, 2014. |
| 2 | Per share number has been calculated using the average shares method. |
| 3 | Represents less than $0.01. |
| 4 | Based on net asset value, which does not reflect the sales charge, redemption fee or contingent deferred sales charge, if applicable. Total returns for periods of less than one year are not annualized. |
| 5 | Computed on an annualized basis. |
| 6 | This expense decrease is reflected in both the net expense and the net investment income ratios shown above. |
| 7 | Portfolio turnover is calculated at the Fund level. Percentage indicated was calculated for the period ended March 31, 2014. |
See Notes which are an integral part of the Financial Statements
Annual Shareholder Report
Financial Highlights–Institutional Shares
(For a Share Outstanding Throughout Each Period)
| | Year Ended March 31, | Period
Ended
3/31/20112 |
| 2015 | 2014 | 20131 | 2012 |
| Net Asset Value, Beginning of Period | $10.06 | $10.08 | $9.96 | $10.04 | $10.00 |
| Income From Investment Operations: | | | | | |
| Net investment income | 0.353 | 0.36 | 0.40 | 0.413 | 0.11 |
| Net realized and unrealized gain (loss) on investments and futures contracts | (0.11) | (0.01) | 0.13 | (0.04) | 0.04 |
| TOTAL FROM INVESTMENT OPERATIONS | 0.24 | 0.35 | 0.53 | 0.37 | 0.15 |
| Less Distributions: | | | | | |
| Distributions from net investment income | (0.36) | (0.37) | (0.41) | (0.45) | (0.11) |
| Distributions from net realized gain on investments | (0.00)4 | — | — | — | — |
| TOTAL DISTRIBUTIONS | (0.36) | (0.37) | (0.41) | (0.45) | (0.11) |
| Net Asset Value, End of Period | $9.94 | $10.06 | $10.08 | $9.96 | $10.04 |
| Total Return5 | 2.42% | 3.57% | 5.38% | 3.80% | 1.47% |
| Ratios to Average Net Assets: | | | | | |
| Net expenses | 0.69% | 0.65% | 0.65% | 0.65% | 0.75%6 |
| Net investment income | 3.48% | 3.57% | 3.91% | 4.15% | 3.38%6 |
| Expense waiver/reimbursement7 | 0.11% | 0.19% | 0.49% | 0.97% | 4.70%6 |
| Supplemental Data: | | | | | |
| Net assets, end of period (000 omitted) | $249,630 | $273,826 | $40,211 | $23,622 | $13,236 |
| Portfolio turnover | 26% | 8% | 17% | 39% | 8% |
| 1 | Beginning with the year ended March 31, 2013, the Fund was audited by Ernst & Young LLP. The previous year and period ended March 31, 2011, were audited by another independent registered public accounting firm. |
| 2 | Reflects operations for the period from December 3, 2010 (date of initial investment) to March 31, 2011. |
| 3 | Per share numbers have been calculated using the average shares method. |
| 4 | Represents less than $0.01. |
| 5 | Based on net asset value. Total returns for periods of less than one year are not annualized. |
| 6 | Computed on an annualized basis. |
| 7 | This expense decrease is reflected in both the net expense and the net investment income ratios shown above. |
See Notes which are an integral part of the Financial Statements
Annual Shareholder Report
Statement of Assets and Liabilities
March 31, 2015
| Assets: | | |
| Total investment in securities, at value including $430,581,214 of investment in affiliated holdings (Note 5) (identified cost $580,404,783) | | $575,670,706 |
| Cash | | 676,637 |
| Restricted cash (Note 2) | | 279,000 |
| Income receivable | | 1,403,166 |
| Income receivable from affiliated holdings (Note 5) | | 1,623,094 |
| Receivable for investments sold | | 5,411,830 |
| Receivable for shares sold | | 608,532 |
| TOTAL ASSETS | | 585,672,965 |
| Liabilities: | | |
| Payable for shares redeemed | $3,162,011 | |
| Payable for daily variation margin | 63,750 | |
| Income distribution payable | 196,152 | |
| Payable for distribution services fee (Note 5) | 42,197 | |
| Payable for other service fees (Notes 2 and 5) | 77,938 | |
| Accrued expenses (Note 5) | 153,387 | |
| TOTAL LIABILITIES | | 3,695,435 |
| Net assets for 58,558,287 shares outstanding | | $581,977,530 |
| Net Assets Consist of: | | |
| Paid-in capital | | $590,913,437 |
| Net unrealized depreciation of investments and futures contracts | | (5,193,851) |
| Accumulated net realized loss on investments and futures contracts | | (3,750,831) |
| Undistributed net investment income | | 8,775 |
| TOTAL NET ASSETS | | $581,977,530 |
Annual Shareholder Report
Statement of Assets and Liabilities–continued
| Net Asset Value, Offering Price and Redemption Proceeds Per Share | | |
| Class A Shares: | | |
| Net asset value per share ($308,242,242 ÷ 31,016,139 shares outstanding), no par value, unlimited shares authorized | | $9.94 |
| Offering price per share (100/98.00 of $9.94) | | $10.14 |
| Redemption proceeds per share | | $9.94 |
| Class C Shares: | | |
| Net asset value per share ($24,105,284 ÷ 2,422,927 shares outstanding), no par value, unlimited shares authorized | | $9.95 |
| Offering price per share | | $9.95 |
| Redemption proceeds per share (99/100 of $9.95) | | $9.85 |
| Institutional Shares: | | |
| Net asset value per share ($249,630,004 ÷ 25,119,221 shares outstanding), no par value, unlimited shares authorized | | $9.94 |
| Offering price per share | | $9.94 |
| Redemption proceeds per share | | $9.94 |
See Notes which are an integral part of the Financial Statements
Annual Shareholder Report
Statement of Operations
Year Ended March 31, 2015
| Investment Income: | | |
| Dividends received from affiliated holdings (Note 5) | | $19,008,010 |
| Interest | | 7,587,130 |
| TOTAL INCOME | | 26,595,140 |
| Expenses: | | |
| Investment adviser fee (Note 5) | $3,828,668 | |
| Administrative fee (Note 5) | 499,120 | |
| Custodian fees | 29,497 | |
| Transfer agent fee | 379,839 | |
| Directors'/Trustees' fees (Note 5) | 4,979 | |
| Auditing fees | 16,650 | |
| Legal fees | 13,881 | |
| Portfolio accounting fees | 177,900 | |
| Distribution services fee (Note 5) | 506,204 | |
| Other service fees (Notes 2 and 5) | 898,858 | |
| Share registration costs | 85,664 | |
| Printing and postage | 45,013 | |
| Miscellaneous (Note 5) | 10,006 | |
| TOTAL EXPENSES | 6,496,279 | |
| Waiver/reimbursement of investment adviser fee (Note 5) | (709,427) | |
| Net expenses | | 5,786,852 |
| Net investment income | | 20,808,288 |
| Realized and Unrealized Loss on Investments and Futures Contracts: | | |
| Net realized loss on investments | | (1,115,216) |
| Net realized loss on futures contracts | | (1,382,423) |
| Net change in unrealized appreciation of investments | | (5,238,575) |
| Net change in unrealized appreciation of futures contracts | | (586,522) |
| Net realized and unrealized loss on investments and futures contracts | | (8,322,736) |
| Change in net assets resulting from operations | | $12,485,552 |
See Notes which are an integral part of the Financial Statements
Annual Shareholder Report
Statement of Changes in Net Assets
| Year Ended March 31 | 2015 | 2014 |
| Increase (Decrease) in Net Assets | | |
| Operations: | | |
| Net investment income | $20,808,288 | $11,920,109 |
| Net realized gain (loss) on investments and futures contracts | (2,497,639) | 530,369 |
| Net change in unrealized appreciation/depreciation of investments and futures contracts | (5,825,097) | (265,601) |
| CHANGE IN NET ASSETS RESULTING FROM OPERATIONS | 12,485,552 | 12,184,877 |
| Distributions to Shareholders: | | |
| Distributions from net investment income | | |
| Class A Shares | (10,862,185) | (6,204,469) |
| Class C Shares | (581,682) | (109,503) |
| Institutional Shares | (9,911,892) | (6,158,020) |
| Distributions from net realized gain on investments | | |
| Class A Shares | (84,440) | — |
| Class C Shares | (6,065) | — |
| Institutional Shares | (66,037) | — |
| CHANGE IN NET ASSETS RESULTING FROM DISTRIBUTIONS TO SHAREHOLDERS | (21,512,301) | (12,471,992) |
| Share Transactions: | | |
| Proceeds from sale of shares | 411,413,364 | 632,967,491 |
| Net asset value of shares issued to shareholders in payment of distributions declared | 19,065,306 | 11,001,235 |
| Cost of shares redeemed | (455,415,821) | (139,495,286) |
| CHANGE IN NET ASSETS RESULTING FROM SHARE TRANSACTIONS | (24,937,151) | 504,473,440 |
| Change in net assets | (33,963,900) | 504,186,325 |
| Net Assets: | | |
| Beginning of period | 615,941,430 | 111,755,105 |
| End of period (including undistributed net investment income of $8,775 and $31,732, respectively) | $581,977,530 | $615,941,430 |
See Notes which are an integral part of the Financial Statements
Annual Shareholder Report
Notes to Financial Statements
March 31, 2015
1. ORGANIZATION
Federated Income Securities Trust (the “Trust”) is registered under the Investment Company Act of 1940, as amended (the “Act”), as a diversified, open-end management investment company. The Trust consists of nine portfolios, including the Fund. The financial statements included herein are only those of Federated Floating Rate Strategic Income Fund (the “Fund”). The financial statements of the other portfolios are presented separately. The assets of each portfolio are segregated and a shareholder's interest is limited to the portfolio in which shares are held. Each portfolio pays its own expenses. The Fund offers three classes of shares: Class A Shares, Class C Shares and Institutional Shares. All shares of the Fund have equal rights with respect to voting, except on class-specific matters. The investment objective of the Fund is to provide total return consistent with current income and low interest rate volatility.
2. SIGNIFICANT ACCOUNTING POLICIES
The following is a summary of significant accounting policies consistently followed by the Fund in the preparation of its financial statements. These policies are in conformity with U.S. generally accepted accounting principles (GAAP).
Investment Valuation
In calculating its net asset value (NAV), the Fund generally values investments as follows:
| ■ | Fixed-income securities and floating rate loans acquired with remaining maturities greater than 60 days are fair valued using price evaluations provided by a pricing service approved by the Trustees. |
| ■ | Fixed-income securities and repurchase agreements acquired with remaining maturities of 60 days or less are valued at their cost (adjusted for the accretion of any discount or amortization of any premium), unless the issuer's creditworthiness is impaired or other factors indicate that amortized cost is not an accurate estimate of the investment's fair value, in which case it would be valued in the same manner as a longer-term security. |
| ■ | Shares of other mutual funds or non-exchange-traded investment companies are valued based upon their reported NAVs. |
| ■ | Derivative contracts listed on exchanges are valued at their reported settlement or closing price, except that options are valued at the mean of closing bid and asked quotations. |
| ■ | Over-the-counter (OTC) derivative contracts are fair valued using price evaluations provided by a pricing service approved by the Trustees. |
| ■ | For securities that are fair valued in accordance with procedures established by and under the general supervision of the Trustees, certain factors may be considered such as: the last traded or purchase price of the security, information obtained by contacting the issuer or dealers, analysis of the issuer's financial statements or other available documents, fundamental analytical data, the nature and duration of restrictions on disposition, the movement of the market in which the security is normally traded, public trading in similar securities or derivative contracts of the issuer or comparable issuers, movement of a relevant index or other factors including, but not limited to, industry changes and relevant government actions. |
Annual Shareholder Report
If any price, quotation, price evaluation or other pricing source is not readily available when the NAV is calculated, or if the Fund cannot obtain price evaluations from a pricing service or from more than one dealer for an investment within a reasonable period of time as set forth in the Fund's valuation policies and procedures, the Fund uses the fair value of the investment determined in accordance with the procedures described below. There can be no assurance that the Fund could obtain the fair value assigned to an investment if it sold the investment at approximately the time at which the Fund determines its NAV per share.
Fair Valuation and Significant Events Procedures
The Trustees have ultimate responsibility for determining the fair value of investments for which market quotations are not readily available. The Trustees have appointed a valuation committee (“Valuation Committee”) comprised of officers of the Fund, Federated Investment Management Company (“Adviser”) and certain of the Adviser's affiliated companies to assist in determining fair value and in overseeing the calculation of the NAV. The Trustees have also authorized the use of pricing services recommended by the Valuation Committee to provide fair value evaluations of the current value of certain investments for purposes of calculating the NAV. The Valuation Committee employs various methods for reviewing third-party pricing-service evaluations including periodic reviews of third-party pricing services' policies, procedures and valuation methods (including key inputs, methods, models and assumptions), transactional back-testing, comparisons of evaluations of different pricing services and review of price challenges by the Adviser based on recent market activity. In the event that market quotations and price evaluations are not available for an investment, the Valuation Committee determines the fair value of the investment in accordance with procedures adopted by the Trustees. The Trustees periodically review and approve the fair valuations made by the Valuation Committee and any changes made to the procedures.
Factors considered by pricing services in evaluating an investment include the yields or prices of investments of comparable quality, coupon, maturity, call rights and other potential prepayments, terms and type, reported transactions, indications as to values from dealers and general market conditions. Some pricing services provide a single price evaluation reflecting the bid-side of the market for an investment (a “bid” evaluation). Other pricing services offer both bid evaluations and price evaluations indicative of a price between the prices bid and asked for the investment (a “mid” evaluation). The Fund normally uses bid evaluations for any U.S. Treasury and Agency securities, mortgage-backed securities and municipal securities. The Fund normally uses mid evaluations for any other types of fixed-income securities and any OTC derivative contracts. In the event that market quotations and price evaluations are not available for an investment, the fair value of the investment is determined in accordance with procedures adopted by the Trustees.
The Trustees also have adopted procedures requiring an investment to be priced at its fair value whenever the Adviser determines that a significant event affecting the value of the investment has occurred between the time as of which the price of the investment would otherwise be determined and the time as of which the NAV is computed. An event is considered significant if there is both an affirmative expectation that the investment's value will change in response to the event and a reasonable basis for quantifying the resulting change in value. Examples of significant events that may occur after the close of the principal market on which a security is traded, or after the time of a price evaluation provided by a pricing service or a dealer, include:
| ■ | With respect to securities traded principally in foreign markets, significant trends in U.S. equity markets or in the trading of foreign securities index futures contracts; |
Annual Shareholder Report
| ■ | Political or other developments affecting the economy or markets in which an issuer conducts its operations or its securities are traded; |
| ■ | Announcements concerning matters such as acquisitions, recapitalizations, litigation developments, or a natural disaster affecting the issuer's operations, or regulatory changes or market developments affecting the issuer's industry. |
The Trustees have adopted procedures whereby the Valuation Committee uses a pricing service to determine the fair value of equity securities traded principally in foreign markets when the Adviser determines that there has been a significant trend in the U.S. equity markets or in index futures trading. For other significant events, the Fund may seek to obtain more current quotations or price evaluations from alternative pricing sources. If a reliable alternative pricing source is not available, the Fund will determine the fair value of the investment in accordance with the fair valuation procedures approved by the Trustees. The Trustees have ultimate responsibility for any fair valuations made in response to a significant event.
Repurchase Agreements
The Fund may invest in repurchase agreements for short-term liquidity purposes. It is the policy of the Fund to require the other party to a repurchase agreement to transfer to the Fund's custodian or sub-custodian eligible securities or cash with a market value (after transaction costs) at least equal to the repurchase price to be paid under the repurchase agreement. The eligible securities are transferred to accounts with the custodian or sub-custodian in which the Fund holds a “securities entitlement” and exercises “control” as those terms are defined in the Uniform Commercial Code. The Fund has established procedures for monitoring the market value of the transferred securities and requiring the transfer of additional eligible securities if necessary to equal at least the repurchase price. These procedures also allow the other party to require securities to be transferred from the account to the extent that their market value exceeds the repurchase price or in exchange for other eligible securities of equivalent market value.
The insolvency of the other party or other failure to repurchase the securities may delay the disposition of the underlying securities or cause the Fund to receive less than the full repurchase price. Under the terms of the repurchase agreement, any amounts received by the Fund in excess of the repurchase price and related transaction costs must be remitted to the other party.
The Fund may enter into repurchase agreements in which eligible securities are transferred into joint trading accounts maintained by the custodian or sub-custodian for investment companies and other clients advised by the Fund's Adviser and its affiliates. The Fund will participate on a pro rata basis with the other investment companies and clients in its share of the securities transferred under such repurchase agreements and in its share of proceeds from any repurchase or other disposition of such securities.
Investment Income, Gains and Losses, Expenses and Distributions
Investment transactions are accounted for on a trade-date basis. Realized gains and losses from investment transactions are recorded on an identified-cost basis. Interest income and expenses are accrued daily. Dividend income and distributions to shareholders are recorded on the ex-dividend date. Foreign dividends are recorded on the ex-dividend date or when the Fund is informed of the ex-dividend date. Distributions of net investment income are declared daily and paid monthly. Non-cash dividends included in dividend income, if any, are recorded
Annual Shareholder Report
at fair value. Investment income, realized and unrealized gains and losses, and certain fund-level expenses are allocated to each class based on relative average daily net assets, except that Class A Shares and Class C Shares may bear distribution services fees and other service fees unique to those classes.
Dividends are declared separately for each class. No class has preferential dividend rights; differences in per share dividend rates are generally due to differences in separate class expenses.
Other Service Fees
The Fund may pay other service fees up to 0.25% of the average daily net assets of the Fund's Class A Shares and Class C Shares to unaffiliated financial intermediaries or to Federated Shareholder Services Company (FSSC) for providing services to shareholders and maintaining shareholder accounts. Subject to the terms described in the Expense Limitation note, FSSC may voluntarily reimburse the Fund for other service fees. For the year ended March 31, 2015, other service fees for the Fund were as follows:
| | Other Service
Fees Incurred |
| Class A Shares | $843,580 |
| Class C Shares | 55,278 |
| TOTAL | $898,858 |
Premium and Discount Amortization/Paydown Gains and Losses
All premiums and discounts on fixed-income securities, other than mortgage-backed securities, are amortized/accreted using the effective-interest-rate method. Gains and losses realized on principal payment of mortgage-backed securities (paydown gains and losses) are classified as part of investment income.
Federal Taxes
It is the Fund's policy to comply with the Subchapter M provision of the Internal Revenue Code (the “Code”) and to distribute to shareholders each year substantially all of its income. Accordingly, no provision for federal income tax is necessary. As of and during the year ended March 31, 2015, the Fund did not have a liability for any uncertain tax positions. The Fund recognizes interest and penalties, if any, related to tax liabilities as income tax expense in the Statement of Operations. As of March 31, 2015, tax years 2012 through 2015 remain subject to examination by the Fund's major tax jurisdictions, which include the United States of America and the Commonwealth of Massachusetts.
When-Issued and Delayed-Delivery Transactions
The Fund may engage in when-issued or delayed-delivery transactions. The Fund records when-issued securities on the trade date and maintains security positions such that sufficient liquid assets will be available to make payment for the securities purchased. Securities purchased on a when-issued or delayed-delivery basis are marked to market daily and begin earning interest on the settlement date. Losses may occur on these transactions due to changes in market conditions or the failure of counterparties to perform under the contract.
Annual Shareholder Report
Futures Contracts
The Fund purchases and sells financial futures contracts to increase income and to manage duration risk of the portfolio. Upon entering into a financial futures contract with a broker, the Fund is required to deposit in a segregated account a specified amount of cash which is shown as Restricted Cash in the Statement of Assets and Liabilities. Futures contracts are valued daily and unrealized gains or losses are recorded in a “variation margin” account. Daily, the Fund receives from or pays to the broker a specified amount of cash based upon changes in the variation margin account. When a contract is closed, the Fund recognizes a realized gain or loss. Futures contracts have market risks, including the risk that the change in the value of the contract may not correlate with the changes in the value of the underlying securities. There is minimal counterparty risk to the Fund since futures are exchange traded and the exchange's clearinghouse, as counterparty to all exchange traded futures, guarantees the futures against default.
Futures contracts outstanding at period end are listed after the Fund's Portfolio of Investments.
The average notional value of short futures contracts held by the Fund throughout the period was $38,251,436. This is based on amounts held as of each month-end throughout the fiscal period.
Restricted Securities
The Fund may purchase securities which are considered restricted. Restricted securities are securities that either: (a) cannot be offered for public sale without first being registered, or being able to take advantage of an exemption from registration, under the Securities Act of 1933; or (b) are subject to contractual restrictions on public sales. In some cases, when a security cannot be offered for public sale without first being registered, the issuer of the restricted security has agreed to register such securities for resale, at the issuer's expense, either upon demand by the Fund or in connection with another registered offering of the securities. Many such restricted securities may be resold in the secondary market in transactions exempt from registration. Restricted securities may be determined to be liquid under criteria established by the Trustees. The Fund will not incur any registration costs upon such resales. The Fund's restricted securities, like other securities, are priced in accordance with procedures established by and under the general supervision of the Trustees.
Additional Disclosure Related to Derivative Instruments
| Fair Value of Derivative Instruments |
| | Liability |
| | Statement of
Assets and
Liabilities
Location | Fair
Value |
| Derivatives not accounted for as hedging instruments under ASC Topic 815 | | |
| Interest rate contracts | Payable for daily variation margin | $459,774* |
| * | Includes cumulative depreciation of futures contracts as reported in the footnotes to the Portfolio of Investments. Only the current day's variation margin is reported within the Statement of Assets and Liabilities. |
Annual Shareholder Report
The Effect of Derivative Instruments on the Statement of Operations for the Year Ended March 31, 2015
| Amount of Realized Gain or (Loss) on Derivatives Recognized in Income |
| | Futures |
| Interest rate contracts | $(1,382,423) |
| Change in Unrealized Appreciation or (Depreciation) on Derivatives Recognized in Income |
| | Futures |
| Interest rate contracts | $(586,522) |
Other
The preparation of financial statements in conformity with GAAP requires management to make estimates and assumptions that affect the amounts of assets, liabilities, expenses and revenues reported in the financial statements. Actual results could differ from those estimated. The Fund applies Investment Company accounting and reporting guidance.
3. SHARES OF BENEFICIAL INTEREST
The following tables summarize share activity:
| Year Ended March 31 | 2015 | 2014 |
| Class A Shares: | Shares | Amount | Shares | Amount |
| Shares sold | 23,492,872 | $234,842,145 | 32,762,473 | $329,859,900 |
| Shares issued to shareholders in payment of distributions declared | 1,077,917 | 10,738,705 | 611,195 | 6,152,157 |
| Shares redeemed | (25,974,989) | (258,952,938) | (8,048,994) | (81,031,710) |
NET CHANGE RESULTING FROM
CLASS A SHARE TRANSACTIONS | (1,404,200) | $(13,372,088) | 25,324,674 | $254,980,347 |
| | Year Ended
3/31/2015 | Period Ended
3/31/20141 |
| Class C Shares: | Shares | Amount | Shares | Amount |
| Shares sold | 1,595,304 | $15,956,381 | 1,617,617 | $16,313,037 |
| Shares issued to shareholders in payment of distributions declared | 53,124 | 529,355 | 10,669 | 107,580 |
| Shares redeemed | (796,456) | (7,923,961) | (57,331) | (578,326) |
NET CHANGE RESULTING FROM
CLASS C SHARE TRANSACTIONS | 851,972 | $8,561,775 | 1,570,955 | $15,842,291 |
Annual Shareholder Report
| Year Ended March 31 | 2015 | 2014 |
| Institutional Shares: | Shares | Amount | Shares | Amount |
| Shares sold | 16,083,089 | $160,614,838 | 28,496,822 | $286,794,554 |
| Shares issued to shareholders in payment of distributions declared | 782,374 | 7,797,246 | 470,997 | 4,741,498 |
| Shares redeemed | (18,954,840) | (188,538,922) | (5,747,660) | (57,885,250) |
| NET CHANGE RESULTING FROM INSTITUTIONAL SHARE TRANSACTIONS | (2,089,377) | $(20,126,838) | 23,220,159 | $233,650,802 |
NET CHANGE RESULTING FROM
TOTAL FUND SHARE TRANSACTIONS | (2,641,605) | $(24,937,151) | 50,115,788 | $504,473,440 |
| 1 | Reflects operations for the period from September 6, 2013 (date of initial investment) to March 31, 2014. |
4. FEDERAL TAX INFORMATION
The timing and character of income and capital gain distributions are determined in accordance with income tax regulations, which may differ from GAAP. These differences are due to differing treatments for discount accretion/premium amortization on debt securities.
For the year ended March 31, 2015, permanent differences identified and reclassified among the components of net assets were as follows:
| Increase (Decrease) |
Undistributed
Net Investment
Income (Loss) | Accumulated
Net Realized
Gain (Loss) |
| $524,514 | $(524,514) |
Net investment income (loss), net realized gains (losses), and net assets were not affected by this reclassification.
The tax character of distributions as reported on the Statement of Changes in Net Assets for the years ended March 31, 2015 and 2014 was as follows:
| | 2015 | 2014 |
| Ordinary income | $21,355,759 | $12,471,992 |
| Long-term capitals gains | $156,542 | $— |
As of March 31, 2015, the components of distributable earnings on a tax basis were as follows:
| Undistributed ordinary income | $8,775 |
| Net unrealized depreciation | $(5,710,282) |
| Capital loss carryforwards | $(3,234,400) |
The difference between book-basis and tax-basis net unrealized appreciation/depreciation is attributable to differing treatments for discount accretion/premium amortization on debt securities and deferral of losses on wash sales.
Annual Shareholder Report
At March 31, 2015, the cost of investments for federal tax purposes was $581,380,988. The net unrealized depreciation of investments for federal tax purposes excluding any unrealized depreciation resulting from futures contracts was $5,710,282. This consists of net unrealized appreciation from investments for those securities having an excess of value over cost of $951,676 and net unrealized depreciation from investments for those securities having an excess of cost over value of $6,661,958.
At March 31, 2015, the Fund had a capital loss carryforward of $3,234,400 which will reduce the Fund's taxable income arising from future net realized gains on investments, if any, to the extent permitted by the Code, thereby reducing the amount of distributions to shareholders which would otherwise be necessary to relieve the Fund of any liability for federal income tax. Pursuant to the Code, a net capital loss incurred in taxable years beginning after December 22, 2010, retains its character as either short-term or long-term and does not expire. All of the Fund's capital loss carryforwards were incurred in taxable years beginning after December 22, 2010.
The following schedule summarizes the Fund's capital loss carryforwards:
| Short-Term | Long-Term | Total |
| $889,587 | $2,344,813 | $3,234,400 |
5. INVESTMENT ADVISER FEE AND OTHER TRANSACTIONS WITH AFFILIATES
Investment Adviser Fee
The advisory agreement between the Fund and the Adviser provides for an annual fee equal to 0.60% of the Fund's average daily net assets. Subject to the terms described in the Expense Limitation note, the Adviser may voluntarily choose to waive any portion of its fee. For the year ended March 31, 2015, the Adviser voluntarily waived $703,570 of its fee.
Administrative Fee
Federated Administrative Services (FAS), under the Administrative Services Agreement, provides the Fund with administrative personnel and services. For purposes of determining the appropriate rate breakpoint, “Investment Complex” is defined as all of the Federated Funds subject to a fee under the Administrative Services Agreement. The fee paid to FAS is based on the average daily net assets of the Investment Complex as specified below, plus certain out-of-pocket expenses:
| Administrative Fee | Average Daily Net Assets
of the Investment Complex |
| 0.150% | on the first $5 billion |
| 0.125% | on the next $5 billion |
| 0.100% | on the next $10 billion |
| 0.075% | on assets in excess of $20 billion |
Subject to the terms described in the Expense Limitation note, FAS may voluntarily choose to waive any portion of its fee. For the year ended March 31, 2015, the annualized fee paid to FAS was 0.078% of average daily net assets of the Fund.
Annual Shareholder Report
Distribution Services Fee
The Fund has adopted a Distribution Plan (the “Plan”) pursuant to Rule 12b-1 under the Act. Under the terms of the Plan, the Fund will compensate Federated Securities Corp. (FSC), the principal distributor, from the daily net assets of the Fund's Class A Shares and Class C Shares to finance activities intended to result in the sale of these shares. The Plan provides that the Fund may incur distribution expenses at the following percentages of average daily net assets annually, to compensate FSC:
| Share Class Name | Percentage of Average Daily
Net Assets of Class |
| Class A Shares | 0.10% |
| Class C Shares | 0.75% |
Subject to the terms described in the Expense Limitation note, FSC may voluntarily choose to waive any portion of its fee. For the year ended March 31, 2015, distribution services fees for the Fund were as follows:
| | Distribution
Services Fees
Incurred |
| Class A Shares | $337,432 |
| Class C Shares | 168,772 |
| TOTAL | $506,204 |
When FSC receives fees, it may pay some or all of them to financial intermediaries whose customers purchase shares. For the year ended March 31, 2015, FSC retained $106,582 of fees paid by the Fund.
Sales Charges
Front-end sales charges and contingent deferred sales charges (CDSC) do not represent expenses of the Fund. They are deducted from the proceeds of sales of Fund shares prior to investment or from redemption proceeds prior to remittance, as applicable. For the year ended March 31, 2015, FSC did not retain any sales charges from the sale of Class A Shares. For the year ended March 31, 2015, FSC retained $16,357 of CDSC relating to redemptions of Class C Shares.
Other Service Fees
For the year ended March 31, 2015, FSSC received $1,735 of the other service fees disclosed in Note 2.
Expense Limitation
The Adviser and certain of its affiliates (which may include FSC, FAS and FSSC) on their own initiative have agreed to waive certain amounts of their respective fees and/or reimburse expenses. Effective June 1, 2015, total annual fund operating expenses (as shown in the financial highlights, excluding acquired fund fees and expenses, expenses allocated from affiliated partnerships, extraordinary expenses and proxy-related expenses paid by the Fund, if any) paid by the Fund's Class A Shares, Class C Shares and Institutional Shares (after the voluntary waivers and/or reimbursements) will not exceed 1.03%, 1.68% and 0.68% (the “Fee Limit”), respectively, up to but not including the later of (the “Termination Date”): (a) June 1,
Annual Shareholder Report
2016; or (b) the date of the Fund's next effective Prospectus. While the Adviser and its applicable affiliates currently do not anticipate terminating or increasing these arrangements prior to the Termination Date, these arrangements may only be terminated or the Fee Limit increased prior to the Termination Date with the agreement of the Trustees.
Interfund Transactions
During the year ended March 31, 2015, the Fund engaged in purchase transactions with funds that have a common investment adviser (or affiliated investment advisers), common Directors/Trustees, and/or common Officers. These purchase transactions complied with Rule 17a-7 under the Act and amounted to $1,037,156.
General
Certain Officers and Trustees of the Fund are Officers and Directors or Trustees of certain of the above companies. To efficiently facilitate payment, Directors'/Trustees' fees and certain expenses related to conducting meetings of the Directors/Trustees and other miscellaneous expenses are paid by an affiliate of the Adviser which in due course are reimbursed by the Fund. Such expenses may be included in Accrued and Miscellaneous Expenses on the Statement of Assets and Liabilities, and Statement of Operations, respectively.
Transactions Involving Affiliated Holdings
Affiliated holdings are investment companies which are managed by the Adviser or an affiliate of the Adviser. The Adviser has agreed to reimburse the Fund for certain investment adviser fees as a result of transactions in other affiliated investment companies. For the year ended March 31, 2015, the Adviser reimbursed $5,857. Transactions involving affiliated holdings during the year ended March 31, 2015, were as follows:
| | Federated
Bank Loan
Core Fund | Federated
Prime Value
Obligations Fund,
Institutional
Shares | Federated
Project
and Trade
Finance
Core Fund | Total of
Affiliated
Transactions |
| Balance of Shares Held 3/31/2014 | 31,549,675 | 9,196,077 | 8,249,244 | 48,994,996 |
| Purchases/Additions | 7,723,422 | 214,755,209 | 728,625 | 223,207,256 |
| Sales/Reductions | (2,912,400) | (223,951,286) | (2,341,691) | (229,205,377) |
| Balance of Shares Held 3/31/2015 | 36,360,697 | — | 6,636,178 | 42,996,875 |
| Value | $368,333,863 | $— | $62,247,351 | $430,581,214 |
| Dividend Income | $15,829,125 | $3,410 | $3,175,475 | $19,008,010 |
Pursuant to an Exemptive Order issued by the Securities and Exchange Commission (SEC), the Fund may invest in a portfolio of Federated Core Trust (“Core Trust”), which is managed by Federated Investment Management Company, the Adviser. Core Trust is an open-end management company, registered under the Act, available only to registered investment companies and other institutional investors. The investment objective of Federated Bank Loan Core Fund (BLCORE), a portfolio of Core Trust, is to provide current income. It pursues its objective by investing primarily in a portfolio of U.S. dollar-denominated floating-rate term loans, loan-related derivatives and loan index products. Federated Investors, Inc. receives no advisory or administrative fees from the funds within the Core Trust. Income distributions from BLCORE are declared daily and paid monthly, and are recorded by the Fund as dividend income. Capital gain distributions, if any, from BLCORE are declared and paid annually, and
Annual Shareholder Report
are recorded by the Fund as capital gains. The performance of the Fund is directly affected by the performance of BLCORE in which the Fund invested 63.3% of its net assets at March 31, 2015. A copy of BLCORE's financial statements is available on the EDGAR Database on the SEC's website or upon request from the Fund.
6. Investment TRANSACTIONS
Purchases and sales of investments, excluding long-term U.S. government securities and short-term obligations, for the year ended March 31, 2015, were as follows:
| Purchases | $163,085,347 |
| Sales | $196,386,465 |
7. LINE OF CREDIT
The Fund participates in a $100,000,000 unsecured, uncommitted revolving line of credit (LOC) agreement with PNC Bank. The LOC was made available for extraordinary or emergency purposes, primarily for financing redemption payments. Borrowings are charged interest at a rate offered to the Fund by PNC Bank at the time of the borrowing. As of March 31, 2015, there were no outstanding loans. During the year ended March 31, 2015, the Fund did not utilize the LOC.
8. INTERFUND LENDING
Pursuant to an Exemptive Order issued by the SEC, the Fund, along with other funds advised by subsidiaries of Federated Investors, Inc., may participate in an interfund lending program. This program provides an alternative credit facility allowing the Fund to borrow from other participating affiliated funds. As of March 31, 2015, there were no outstanding loans. During the year ended March 31, 2015, the program was not utilized.
9. FEDERAL TAX INFORMATION (UNAUDITED)
For the year ended March 31, 2015, the amount of long-term capital gains designated by the Fund was $156,542.
Annual Shareholder Report
Report of Independent Registered Public Accounting Firm
TO THE board of trustees OF federated income securities trust and shareholders of Federated Floating Rate Strategic Income Fund:
We have audited the accompanying statement of assets and liabilities of Federated Floating Rate Strategic Income Fund (the “Fund”) (one of the portfolios constituting Federated Income Securities Trust), including the portfolio of investments, as of March 31, 2015, and the related statement of operations for the year then ended, the statement of changes in net assets for each of the two years in the period then ended, and the financial highlights for each of the years or periods indicated therein subsequent to April 1, 2012. These financial statements and financial highlights are the responsibility of the Fund's management. Our responsibility is to express an opinion on these financial statements and financial highlights based on our audits. The financial highlights for the year ended March 31, 2012 and the period ended March 31, 2011 were audited by another independent registered public accounting firm whose report, dated May 23, 2012, expressed an unqualified opinion on those financial highlights.
We conducted our audits in accordance with standards of the Public Company Accounting Oversight Board (United States). Those standards require that we plan and perform the audit to obtain reasonable assurance about whether the financial statements and financial highlights are free of material misstatement. We were not engaged to perform an audit of the Fund's internal control over financial reporting. Our audits included consideration of internal control over financial reporting as a basis for designing audit procedures that are appropriate in the circumstances, but not for the purpose of expressing an opinion on the effectiveness of the Fund's internal control over financial reporting. Accordingly, we express no such opinion. An audit also includes examining, on a test basis, evidence supporting the amounts and disclosures in the financial statements and financial highlights, assessing the accounting principles used and significant estimates made by management, and evaluating the overall financial statement presentation. Our procedures included confirmation of securities owned as of March 31, 2015, by correspondence with the custodian and others. We believe that our audits provide a reasonable basis for our opinion.
In our opinion, the financial statements and financial highlights referred to above present fairly, in all material respects, the financial position of Federated Floating Rate Strategic Income Fund, a portfolio of Federated Income Securities Trust, at March 31, 2015, the results of its operations for the year then ended, the changes in its net assets for each of the two years in the period then ended, and the financial highlights for each of the years or periods indicated therein subsequent to April 1, 2012, in conformity with U.S. generally accepted accounting principles.
Boston, Massachusetts
May 21, 2015
Annual Shareholder Report
Shareholder Expense Example (unaudited)
As a shareholder of the Fund, you incur two types of costs: (1) transaction costs, including sales charges (loads) on purchase or redemption payments; and (2) ongoing costs, including management fees and to the extent applicable, distribution (12b-1) fees and/or other service fees and other Fund expenses. This Example is intended to help you to understand your ongoing costs (in dollars) of investing in the Fund and to compare these costs with the ongoing costs of investing in other mutual funds. It is based on an investment of $1,000 invested at the beginning of the period and held for the entire period from October 1, 2014 to March 31, 2015.
ACTUAL EXPENSES
The first section of the table below provides information about actual account values and actual expenses. You may use the information in this section, together with the amount you invested, to estimate the expenses that you incurred over the period. Simply divide your account value by $1,000 (for example, an $8,600 account value divided by $1,000 = 8.6), then multiply the result by the number in the first section under the heading entitled “Expenses Paid During Period” to estimate the expenses attributable to your investment during this period.
HYPOTHETICAL EXAMPLE FOR COMPARISON PURPOSES
The second section of the table below provides information about hypothetical account values and hypothetical expenses based on the Fund's actual expense ratio and an assumed rate of return of 5% per year before expenses, which is not the Fund's actual return. Thus, you should not use the hypothetical account values and expenses to estimate the actual ending account balance or your expenses for the period. Rather, these figures are required to be provided to enable you to compare the ongoing costs of investing in the Fund with other funds. To do so, compare this 5% hypothetical example with the 5% hypothetical examples that appear in the shareholder reports of the other funds.
Annual Shareholder Report
Please note that the expenses shown in the table are meant to highlight your ongoing costs only and do not reflect any transaction costs, such as sales charges (loads) on purchase or redemption payments. Therefore, the second section of the table is useful in comparing ongoing costs only, and will not help you determine the relative total costs of owning different funds. In addition, if these transaction costs were included, your costs would have been higher.
| | Beginning
Account Value
10/1/2014 | Ending
Account Value
3/31/2015 | Expenses Paid
During Period1 |
| Actual: | | | |
| Class A Shares | $1,000 | $1,017.20 | $5.23 |
| Class C Shares | $1,000 | $1,013.90 | $8.49 |
| Institutional Shares | $1,000 | $1,018.90 | $3.47 |
Hypothetical (assuming a 5% return
before expenses): | | | |
| Class A Shares | $1,000 | $1,019.75 | $5.24 |
| Class C Shares | $1,000 | $1,016.50 | $8.50 |
| Institutional Shares | $1,000 | $1,021.49 | $3.48 |
| 1 | Expenses are equal to the Fund's annualized net expense ratios, multiplied by the average account value over the period, multiplied by 182/365 (to reflect the one-half-year period). The annualized net expense ratios are as follows: |
| | |
| Class A Shares | 1.04% |
| Class C Shares | 1.69% |
| Institutional Shares | 0.69% |
Annual Shareholder Report
Board of Trustees and Trust Officers
The Board of Trustees is responsible for managing the Trust's business affairs and for exercising all the Trust's powers except those reserved for the shareholders. The following tables give information about each Trustee and the senior officers of the Fund. Where required, the tables separately list Trustees who are “interested persons” of the Fund (i.e., “Interested” Trustees) and those who are not (i.e., “Independent” Trustees). Unless otherwise noted, the address of each person listed is Federated Investors Tower, 1001 Liberty Avenue, Pittsburgh, PA 15222. The address of all Independent Trustees listed is 4000 Ericsson Drive, Warrendale, PA 15086-7561; Attention: Mutual Fund Board. As of December 31, 2014, the Trust comprised nine portfolio(s), and the Federated Fund Family consisted of 40 investment companies (comprising 131 portfolios). Unless otherwise noted, each Officer is elected annually. Unless otherwise noted, each Trustee oversees all portfolios in the Federated Fund Family and serves for an indefinite term. The Fund's Statement of Additional Information includes additional information about Trust Trustees and is available, without charge and upon request, by calling 1-800-341-7400.
Interested TRUSTEES Background
Name
Birth Date
Positions Held with Trust
Date Service Began | Principal Occupation(s) for Past Five Years,
Other Directorships Held and Previous Position(s) |
John F. Donahue*
Birth Date: July 28, 1924
Trustee
Indefinite Term
Began serving: January 1986 | Principal Occupations: Director or Trustee of the Federated Fund Family; Chairman and Director, Federated Investors, Inc.; Chairman of the Federated Fund Family's Executive Committee.
Previous Positions: Chairman of the Federated Fund Family; Trustee, Federated Investment Management Company; Chairman and Director, Federated Investment Counseling. |
J. Christopher Donahue*
Birth Date: April 11, 1949
President and Trustee
Indefinite Term
Began serving: January 2000 | Principal Occupations: Principal Executive Officer and President of certain of the Funds in the Federated Fund Family; Director or Trustee of the Funds in the Federated Fund Family; President, Chief Executive Officer and Director, Federated Investors, Inc.; Chairman and Trustee, Federated Investment Management Company; Trustee, Federated Investment Counseling; Chairman and Director, Federated Global Investment Management Corp.; Chairman, Federated Equity Management Company of Pennsylvania and Passport Research, Ltd. (investment advisory subsidiary of Federated); Trustee, Federated Shareholder Services Company; Director, Federated Services Company.
Previous Positions: President, Federated Investment Counseling; President and Chief Executive Officer, Federated Investment Management Company, Federated Global Investment Management Corp. and Passport Research, Ltd. |
| * | Family relationships and reasons for “interested” status: John F. Donahue is the father of J. Christopher Donahue; both are “interested” due to their beneficial ownership of shares of Federated Investors, Inc. and the positions they hold with Federated and its subsidiaries. |
Annual Shareholder Report
INDEPENDENT TRUSTEES Background
Name
Birth Date
Positions Held with Trust
Date Service Began | Principal Occupation(s) for Past Five Years,
Other Directorships Held, Previous Position(s) and Qualifications |
John T. Collins
Birth Date: January 24, 1947
Trustee
Indefinite Term
Began serving: October 2013 | Principal Occupations: Director or Trustee of the Federated Fund Family; Chairman and CEO, The Collins Group, Inc. (a private equity firm).
Other Directorships Held: Director, KLX Corp.
Qualifications: Mr. Collins has served in several business and financial management roles and directorship positions throughout his career. Mr. Collins serves as Chairman Emeriti, Bentley University. Mr. Collins previously served as Director, FleetBoston Financial Corp.; Director and Audit Committee Member, Bank of America Corp. and Director, Beth Israel Deaconess Medical Center (Harvard University Affiliate Hospital). |
Maureen Lally-Green
Birth Date: July 5, 1949
Trustee
Indefinite Term
Began serving: August 2009 | Principal Occupations: Director or Trustee of the Federated Fund Family; Associate General Secretary, Diocese of Pittsburgh; Adjunct Professor of Law, Duquesne University School of Law.
Other Directorships Held: Director, CONSOL Energy Inc.
Qualifications: Judge Lally-Green has served in various legal and business roles and directorship positions throughout her career. Judge Lally-Green previously served as Professor of Law, Duquesne University School of Law and was a member of the Superior Court of Pennsylvania. Judge Lally-Green also holds the positions of: Member, Pennsylvania State Board of Education; Director, Saint Vincent College; Director and Chair, UPMC Mercy Hospital; Regent, St. Vincent Seminary; Director, Epilepsy Foundation of Western and Central Pennsylvania; Director, Our Campaign for the Church Alive!, Inc.; Director, Pennsylvania Bar Institute; and Director, Catholic High Schools of the Diocese of Pittsburgh, Inc. Judge Lally-Green has held the positions of: Director, Auberle; Director, Ireland Institute of Pittsburgh; Director, Saint Thomas More Society; and Director Cardinal Wuerl Catholic High School. |
Peter E. Madden
Birth Date: March 16, 1942
Trustee
Indefinite Term
Began serving: November 1991 | Principal Occupation: Director or Trustee, and Chair of the Board of Directors or Trustees, of the Federated Fund Family; Retired.
Other Directorships Held: None.
Qualifications: Mr. Madden has served in several business management, mutual fund services and directorship positions throughout his career. Mr. Madden previously served as President, Chief Operating Officer and Director, State Street Bank and Trust Company (custodian bank) and State Street Corporation (financial services). He was Director, VISA USA and VISA International and Chairman and Director, Massachusetts Bankers Association. Mr. Madden served as Director, Depository Trust Corporation and Director, The Boston Stock Exchange. Mr. Madden also served as a Representative to the Commonwealth of Massachusetts General Court. |
Annual Shareholder Report
Name
Birth Date
Positions Held with Trust
Date Service Began | Principal Occupation(s) for Past Five Years,
Other Directorships Held, Previous Position(s) and Qualifications |
Charles F. Mansfield, Jr.
Birth Date: April 10, 1945
Trustee
Indefinite Term
Began serving: January 2000 | Principal Occupations: Director or Trustee of the Federated Fund Family; Management Consultant.
Other Directorships Held: None.
Qualifications: Mr. Mansfield has served in several banking, business management and educational roles and directorship positions throughout his career. Mr. Mansfield previously served as Chief Executive Officer, PBTC International Bank; Partner, Arthur Young & Company (now Ernst & Young LLP); Chief Financial Officer of Retail Banking Sector, Chase Manhattan Bank; Senior Vice President, HSBC Bank USA (formerly, Marine Midland Bank); Vice President, Citibank; Assistant Professor of Banking and Finance, Frank G. Zarb School of Business, Hofstra University; Executive Vice President DVC Group, Inc. (marketing, communications and technology). |
Thomas M. O'Neill
Birth Date: June 14, 1951
Trustee
Indefinite Term
Began serving: October 2006 | Principal Occupations: Director or Trustee, Vice Chair of the Audit Committee of the Federated Fund Family; Sole Proprietor, Navigator Management Company (investment and strategic consulting).
Other Directorships Held: None.
Qualifications: Mr. O'Neill has served in several business, mutual fund and financial management roles and directorship positions throughout his career. Mr. O'Neill serves as Director, Medicines for Humanity and Director, The Golisano Children's Museum of Naples, Florida. Mr. O'Neill previously served as Chief Executive Officer and President, Managing Director and Chief Investment Officer, Fleet Investment Advisors; President and Chief Executive Officer, Aeltus Investment Management, Inc.; General Partner, Hellman, Jordan Management Co., Boston, MA; Chief Investment Officer, The Putnam Companies, Boston, MA; Credit Analyst and Lending Officer, Fleet Bank; Director and Consultant, EZE Castle Software (investment order management software); and Director, Midway Pacific (lumber). |
P. Jerome Richey
Birth Date: February 23, 1949
Trustee
Indefinite Term
Began serving: October 2013 | Principal Occupations: Director or Trustee of the Federated Fund Family; General Counsel, University of Pittsburgh.
Other Directorships Held: None.
Qualifications: Mr. Richey has served in several business and legal management roles and directorship positions throughout his career. Mr. Richey serves as Board Member, Epilepsy Foundation of Western Pennsylvania and Board member, World Affairs Council of Pittsburgh. Mr. Richey previously served as Chief Legal Officer and Executive Vice President, CONSOL Energy Inc. and Shareholder, Buchanan Ingersoll & Rooney PC (a law firm). |
Annual Shareholder Report
Name
Birth Date
Positions Held with Trust
Date Service Began | Principal Occupation(s) for Past Five Years,
Other Directorships Held, Previous Position(s) and Qualifications |
John S. Walsh
Birth Date: November 28, 1957
Trustee
Indefinite Term
Began serving: January 2000 | Principal Occupations: Director or Trustee, Chair of the Audit Committee of the Federated Fund Family; President and Director, Heat Wagon, Inc. (manufacturer of construction temporary heaters); President and Director, Manufacturers Products, Inc. (distributor of portable construction heaters); President, Portable Heater Parts, a division of Manufacturers Products, Inc.
Other Directorships Held: None.
Qualifications: Mr. Walsh has served in several business management roles and directorship positions throughout his career. Mr. Walsh previously served as Vice President, Walsh & Kelly, Inc. (paving contractors). |
OFFICERS
Name
Birth Date
Address
Positions Held with Trust
Date Service Began | Principal Occupation(s) for Past Five Years
and Previous Position(s) |
John W. McGonigle
Birth Date: October 26, 1938
EXECUTIVE VICE PRESIDENT AND SECRETARY
Officer since: January 1986 | Principal Occupations: Executive Vice President and Secretary of the Federated Fund Family; Vice Chairman, Executive Vice President, Secretary and Director, Federated Investors, Inc.
Previous Positions: Trustee, Federated Investment Management Company and Federated Investment Counseling; Director, Federated Global Investment Management Corp., Federated Services Company and Federated Securities Corp. |
Lori A. Hensler
Birth Date: January 6, 1967
TREASURER
Officer since: April 2013 | Principal Occupations: Principal Financial Officer and Treasurer of the Federated Fund Family; Senior Vice President, Federated Administrative Services; Financial and Operations Principal for Federated Securities Corp. and Edgewood Services, Inc.; and Assistant Treasurer, Federated Investors Trust Company. Ms. Hensler has received the Certified Public Accountant designation.
Previous Positions: Controller of Federated Investors, Inc.; Senior Vice President and Assistant Treasurer, Federated Investors Management Company; Treasurer, Federated Investors Trust Company; Assistant Treasurer, Federated Administrative Services, Federated Administrative Services, Inc., Federated Securities Corp., Edgewood Services, Inc., Federated Advisory Services Company, Federated Equity Management Company of Pennsylvania, Federated Global Investment Management Corp., Federated Investment Counseling, Federated Investment Management Company, Passport Research, Ltd., and Federated MDTA, LLC; Financial and Operations Principal for Federated Securities Corp., Edgewood Services, Inc. and Southpointe Distribution Services, Inc. |
Annual Shareholder Report
Name
Birth Date
Address
Positions Held with Trust
Date Service Began | Principal Occupation(s) for Past Five Years
and Previous Position(s) |
Peter J. Germain
Birth Date: September 3, 1959
CHIEF LEGAL OFFICER
Officer since: January 2005 | Principal Occupations: Mr. Germain is Chief Legal Officer of the Federated Fund Family. He is General Counsel and Vice President, Federated Investors, Inc.; President, Federated Administrative Services and Federated Administrative Services, Inc.; Vice President, Federated Securities Corp.; Secretary, Federated Private Asset Management, Inc.; and Secretary, Retirement Plan Service Company of America. Mr. Germain joined Federated in 1984 and is a member of the Pennsylvania Bar Association.
Previous Positions: Deputy General Counsel, Special Counsel, Managing Director of Mutual Fund Services, Federated Investors, Inc.; Senior Vice President, Federated Services Company; and Senior Corporate Counsel, Federated Investors, Inc. |
Richard B. Fisher
Birth Date: May 17, 1923
VICE PRESIDENT
Officer since: January 1986 | Principal Occupations: Vice Chairman or Vice President of some of the Funds in the Federated Fund Family; Vice Chairman, Federated Investors, Inc.; Chairman, Federated Securities Corp.
Previous Positions: President and Director or Trustee of some of the Funds in the Federated Fund Family; Executive Vice President, Federated Investors, Inc.; Director and Chief Executive Officer, Federated Securities Corp. |
Brian P. Bouda
Birth Date: February 28, 1947
CHIEF COMPLIANCE OFFICER AND SENIOR VICE PRESIDENT
Officer since: August 2004 | Principal Occupations: Senior Vice President and Chief Compliance Officer of the Federated Fund Family; Vice President and Chief Compliance Officer of Federated Investors, Inc. and Chief Compliance Officer of certain of its subsidiaries. Mr. Bouda joined Federated in 1999 and is a member of the American Bar Association and the State Bar Association of Wisconsin.
Previous Positions: Served in Senior Management positions with a large regional banking organization. |
Robert J. Ostrowski
Birth Date: April 26, 1963
Chief Investment Officer
Officer since: May 2004 | Principal Occupations: Robert J. Ostrowski joined Federated in 1987 as an Investment Analyst and became a Portfolio Manager in 1990. He was named Chief Investment Officer of Federated's taxable fixed-income products in 2004 and also serves as a Senior Portfolio Manager. Mr. Ostrowski became an Executive Vice President of the Fund's Adviser in 2009 and served as a Senior Vice President of the Fund's Adviser from 1997 to 2009. Mr. Ostrowski has received the Chartered Financial Analyst designation. He received his M.S. in Industrial Administration from Carnegie Mellon University. |
Mark E. Durbiano
Birth Date: September 21, 1959
VICE PRESIDENT
Officer since: June 2012
Portfolio Manager since: November 2010 | Principal Occupations: Mark E. Durbiano has been the Fund's Portfolio Manager since November 2010. He is Vice President of the Trust with respect to the Fund. Mr. Durbiano joined Federated in 1982 and has been a Senior Portfolio Manager and a Senior Vice President of the Fund's Adviser since 1996. From 1988 through 1995, Mr. Durbiano was a Portfolio Manager and a Vice President of the Fund's Adviser. Mr. Durbiano has received the Chartered Financial Analyst designation and an M.B.A. in Finance from the University of Pittsburgh. |
Annual Shareholder Report
Name
Birth Date
Address
Positions Held with Trust
Date Service Began | Principal Occupation(s) for Past Five Years
and Previous Position(s) |
Steven J. Wagner
Birth Date: July 23, 1967
Vice President
Officer since: June 2012
Portfolio Manager since: November 2010 | Principal Occupations: Steven J. Wagner has been the Fund's Portfolio Manager since November 2010. He is Vice President of the Trust with respect to the Fund. Mr. Wagner joined Federated in 1997 as an analyst in the high yield area and has been Senior Investment Analyst and Vice President of the Fund's Adviser since 2003. Mr. Wagner received his B.S. from Boston College and his M.B.A. in Finance from the University of Pittsburgh. |
Annual Shareholder Report
Evaluation and Approval of Advisory Contract–May 2014
Federated Floating Rate Strategic Income Fund (the “Fund”)
Following a review and recommendation of approval by the Fund's independent trustees, the Fund's Board reviewed and approved at its May 2014 meetings the Fund's investment advisory contract for an additional one-year term. The Board's decision regarding the contract reflects the exercise of its business judgment on whether to continue the existing arrangements.
In this connection, the Federated Funds' Board had previously appointed a Senior Officer, whose duties include specified responsibilities relating to the process by which advisory fees are to be charged to a Federated fund. The Senior Officer has the authority to retain consultants, experts, or staff as may be reasonably necessary to assist in the performance of his duties, reports directly to the Board, and may be terminated only with the approval of a majority of the independent members of the Board. The Senior Officer prepared and furnished to the Board an independent, written evaluation that covered topics discussed below (the “Evaluation”). The Board considered that Evaluation, along with other information, in deciding to approve the advisory contract.
The Board is also familiar with and considered judicial decisions concerning allegedly excessive investment advisory fees, which have indicated that the following factors may be relevant to an Adviser's fiduciary duty with respect to its receipt of compensation from a fund: the nature and quality of the services provided by the Adviser to a fund and its shareholders, including the performance and expenses of the fund and of comparable funds; the Adviser's cost of providing the services, including the profitability to the Adviser of providing advisory services to a fund; the extent to which the Adviser may realize “economies of scale” as a fund grows larger and, if such economies exist, whether they have been shared with a fund and its shareholders or the family of funds; any “fall-out financial benefits” that accrue to the Adviser because of its relationship with a fund (including research services received from brokers that execute fund trades and any fees paid to affiliates of the Adviser for services rendered to a fund); comparative fee structures, including a comparison of fees paid to the Adviser with those paid by similar funds; and the extent of care, conscientiousness and independence with which the Board members perform their duties and their expertise, including whether they are fully informed about all facts the Board deems relevant to its consideration of the Adviser's services and fees. The Board noted that SEC disclosure requirements regarding the basis for the Board's approval of the Fund's advisory contract generally track the factors listed above. Consistent with these judicial decisions and SEC disclosure requirements, the Board also considered management fees charged to
Annual Shareholder Report
institutional and other clients of the Adviser for what might be viewed as like services. The Board was aware of these factors and was guided by them in its review of the Fund's advisory contract to the extent it considered them to be appropriate and relevant, as discussed further below.
The Board considered and weighed these circumstances in light of its substantial accumulated experience in governing the Fund and working with Federated on matters relating to the Federated funds, and was assisted in its deliberations by independent legal counsel. Throughout the year, and in connection with its May meetings, the Board requested and received substantial and detailed information about the Fund and the Federated organization that was in addition to the extensive materials that comprise and accompany the Senior Officer's Evaluation. Federated provided much of this information at each regular meeting of the Board, and furnished additional substantial information in connection with the May meeting at which the Board's formal review of the advisory contract occurred. At this May meeting, senior management of the Adviser also met with the independent trustees and their counsel to discuss the materials presented and any other matters thought relevant by the Adviser or the trustees. Between regularly scheduled meetings, the Board also received information on particular matters as the need arose. Thus, the Board's consideration of the advisory contract included review of the Senior Officer's Evaluation, accompanying data and additional information covering such matters as: the Adviser's investment philosophy, revenue, profitability, personnel and processes; investment and operating strategies; the Fund's short- and long-term performance (in absolute terms, both on a gross basis and net of expenses, as well as in relationship to its particular investment program and certain competitor or “peer group” funds and/or other benchmarks, as appropriate), and comments on the reasons for performance; the Fund's investment objectives; the Fund's expenses (including the advisory fee itself and the overall expense structure of the Fund, both in absolute terms and relative to similar and/or competing funds, with due regard for contractual or voluntary expense limitations); the use and allocation of brokerage commissions derived from trading the Fund's portfolio securities (if any); and the nature, quality and extent of the advisory and other services provided to the Fund by the Adviser and its affiliates. The Board also considered the preferences and expectations of Fund shareholders; the entrepreneurial risk assumed by the Adviser in sponsoring the funds; the continuing state of competition in the mutual fund industry and market practices; the range of comparable fees for similar funds in the mutual fund industry; the Fund's relationship to the Federated family of funds which include a comprehensive array of funds with different investment objectives, policies and strategies which are available for exchange without the incurrence of additional sales charges; compliance and audit reports concerning the Federated funds and the Federated companies that service them (including communications from regulatory agencies), as well as Federated's responses to any issues raised therein; and relevant developments in
Annual Shareholder Report
the mutual fund industry and how the Federated funds and/or Federated are responding to them. The Board's evaluation process is evolutionary. The criteria considered and the emphasis placed on relevant criteria change in recognition of changing circumstances in the mutual fund marketplace.
While mindful that courts have cautioned against giving such comparisons too much weight, the Board has found the use of comparisons of the Fund's fees and expenses to other mutual funds with comparable investment programs to be relevant. In this regard, the Board was presented with, and considered, information regarding the contractual advisory fee rates, net advisory fee rates and total expense ratios relative to a fund's peers. The Board focused on comparisons with other similar mutual funds more heavily than non-mutual fund products or services because it is believed that they are more relevant. For example, other mutual funds are the products most like the Fund, they are readily available to Fund shareholders as alternative investment vehicles, and they are the type of investment vehicle in fact chosen and maintained by the Fund's investors. The range of their fees and expenses therefore appears to be a relevant indicator of what consumers have found to be reasonable in the precise marketplace in which the Fund competes.
The Board reviewed the contractual advisory fee rate, net advisory fee rate where partially waived and other expenses of the Fund and noted the position of the Fund's fee rates relative to its peers. In this regard, the Board noted that the contractual advisory fee rate was below the median of the relevant peer group and that it was satisfied that the overall expense structure of the Fund remained competitive.
By contrast, the Senior Officer has reviewed Federated's fees for providing advisory services to products outside the Federated family of funds (e.g., institutional and separate accounts and sub-adviser services). He concluded that mutual funds and institutional accounts are inherently different products. Those differences include, but are not limited to, different types of targeted investors; being subject to different laws and regulations; different legal structures; different average account sizes and portfolio management techniques made necessary by different cash flows and different associated costs; and the time spent by portfolio managers and their teams, funds financial services, legal, compliance and risk management in reviewing securities pricing, addressing different administrative responsibilities, addressing different degrees of risk associated with management and a variety of different costs. The Senior Officer did not consider these fee schedules to be determinative in judging the appropriateness of mutual fund advisory fees.
The Fund's ability to deliver competitive performance when compared to its peer group was also deemed to be relevant by the Board as a useful indicator of how the Adviser is executing the Fund's investment program, which in turn was one of the Board's considerations in reaching a conclusion that the nature, extent, and quality of the Adviser's investment management services were such as to warrant continuation of the advisory contract.
Annual Shareholder Report
The Senior Officer reviewed information compiled by Federated, using data supplied by independent fund ranking organizations, regarding the performance of, and fees charged by, other mutual funds, noting his view that comparisons to fund peer groups may be helpful, though not conclusive, in judging the reasonableness of proposed fees. The Board considered, in evaluating such comparisons, that in some cases individual funds may exhibit significant and unique differences in their objectives and management techniques when compared to other funds within an industry peer group.
For the periods covered by the Evaluation, the Fund's performance for the one-year period was above the median of the relevant peer group, and the Fund's performance fell below the median of the relevant peer group for the three-year period. The Board discussed the Fund's performance with the Adviser and recognized the efforts being undertaken by the Adviser. The Board will continue to monitor these efforts and the performance of the Fund in the context of the other factors considered relevant by the Board.
The Board also received financial information about Federated, including information regarding the compensation and benefits Federated derived from its relationships with the Federated funds. This information covered not only the fees under the advisory contracts, but also fees received by Federated's subsidiaries for providing other services to the Federated funds under separate contracts (e.g., for serving as the Federated funds' administrator). The information also detailed any indirect benefit Federated may derive from its receipt of research services from brokers who execute Federated fund trades. In addition, the Board considered the fact that, in order for a fund to be competitive in the marketplace, Federated and its affiliates frequently waived fees and/or reimbursed expenses and have disclosed to fund investors and/or indicated to the Board their intention to do so in the future, where appropriate. Moreover, the Board receives regular reporting as to the institution, adjustment or elimination of these voluntary waivers. In addition, following discussions regarding the Senior Officer's May 2013 recommendations, Federated made meaningful reductions to gross advisory fees for several funds. At the Board meeting in May 2014, the Senior Officer proposed, and the Board approved, reductions in the contractual advisory fees of certain other funds.
Federated furnished information, requested by the Senior Officer, that reported revenues on a fund-by-fund basis and made estimates of the allocation of expenses on a fund-by-fund basis, using allocation methodologies specified by the Senior Officer. The Senior Officer noted that, while these cost allocation reports apply consistent allocation processes, the inherent difficulties in allocating costs continues to cause the Senior Officer to question the precision of the process and to conclude that such reports may be unreliable, since a single change in an allocation estimate may dramatically alter the resulting estimate of cost and/or profitability of a fund and may produce unintended consequences. The allocation information, including the Senior Officer's view that fund-by-fund estimations may be unreliable, was considered in the analysis by the Board.
Annual Shareholder Report
The Board and the Senior Officer also reviewed information compiled by Federated comparing profitability information for Federated to other publicly held fund management companies. In this regard, the Senior Officer concluded that Federated's profit margins did not appear to be excessive.
The Senior Officer's Evaluation also discussed the notion of possible realization of “economies of scale” as a fund grows larger. The Board considered in this regard that the Adviser has made significant and long-term investments in areas that support all of the Federated family of funds, such as personnel and processes for the portfolio management, shareholder services, compliance, internal audit, and risk management functions; and systems technology; and that the benefits of these efforts (as well as any economies, should they exist) were likely to be enjoyed by the fund family as a whole. Finally, the Board also noted the absence of any applicable regulatory or industry guidelines on this subject, which (as discussed in the Senior Officer's Evaluation) is compounded by the lack of any common industry practice or general pattern with respect to structuring fund advisory fees with “breakpoints” that serve to reduce the fee as the fund attains a certain size.
The Senior Officer noted that, subject to the comments and recommendations made within his Evaluation, his observations and the information accompanying the Evaluation supported a finding by the Board that the management fees for each of the funds were reasonable. Under these circumstances, no changes were recommended to, and no objection was raised to, the continuation of the Fund's advisory contract.
In its decision to continue an existing investment advisory contract, the Board was mindful of the potential disruptions of the Fund's operations and various risks, uncertainties and other effects that could occur as a result of a decision to terminate or not renew an advisory contract. In particular, the Board recognized that many shareholders have invested in the Fund on the strength of the Adviser's industry standing and reputation and with the expectation that the Adviser will have a continuing role in providing advisory services to the Fund. Thus, the Board's approval of the advisory contract reflected the fact that it is the shareholders who have effectively selected the Adviser by virtue of having invested in the Fund. The Board concluded that, in light of the factors discussed above, including the nature, quality and scope of the services provided to the Fund by the Adviser and its affiliates, continuation of the advisory contract was appropriate.
The Board based its decision to approve the advisory contract on the totality of the circumstances and relevant factors and with a view to past and future long-term considerations. Not all of the factors and considerations identified above were necessarily relevant to the Fund, nor did the Board consider any one of them to be determinative. With respect to the factors that were relevant, the Board's decision to approve the contract reflects its determination that Federated's performance and actions provided a satisfactory basis to support the decision to continue the existing arrangements.
Annual Shareholder Report
Voting Proxies on Fund Portfolio Securities
A description of the policies and procedures that the Fund uses to determine how to vote proxies, if any, relating to securities held in the Fund's portfolio is available, without charge and upon request, by calling 1-800-341-7400. A report on “Form N-PX” of how the Fund voted any such proxies during the most recent 12-month period ended June 30 is available via the Proxy Voting Record (Form N-PX) link associated with the Fund and share class name at www.FederatedInvestors.com/FundInformation. Form N-PX filings are also available at the SEC's website at www.sec.gov.
Quarterly Portfolio Schedule
The Fund files with the SEC a complete schedule of its portfolio holdings, as of the close of the first and third quarters of its fiscal year, on “Form N-Q.” These filings are available on the SEC's website at www.sec.gov and may be reviewed and copied at the SEC's Public Reference Room in Washington, DC. (Call 1-800-SEC-0330 for information on the operation of the Public Reference Room.) You may also access this information via the link to the Fund and share class name at www.FederatedInvestors.com/FundInformation.
Annual Shareholder Report
Mutual funds are not bank deposits or obligations, are not guaranteed by any bank and are not insured or guaranteed by the U.S. government, the Federal Deposit Insurance Corporation, the Federal Reserve Board or any other government agency. Investment in mutual funds involves investment risk, including the possible loss of principal.
This Report is authorized for distribution to prospective investors only when preceded or accompanied by the Fund's Prospectus, which contains facts concerning its objective and policies, management fees, expenses and other information.
Federated Floating Rate Strategic Income Fund
Federated Investors Funds
4000 Ericsson Drive
Warrendale, PA 15086-7561
Contact us at FederatedInvestors.com
or call 1-800-341-7400.
Federated Securities Corp., Distributor
CUSIP 31420C647
CUSIP 31420C597
CUSIP 31420C670
Q450751 (5/15)
Federated is a registered trademark of Federated Investors, Inc.
2015 ©Federated Investors, Inc.
Annual Shareholder Report
March 31, 2015
| Share Class | Ticker |
| A | FUSGX |
| B | FUSBX |
| C | FUSCX |
Federated Fund for U.S. Government Securities
Fund Established 1969
A Portfolio of Federated Income Securities Trust
Dear Valued Shareholder,
I am pleased to present the Annual Shareholder Report for your fund covering the period from April 1, 2014 through March 31, 2015. This report includes Management's Discussion of Fund Performance, a complete listing of your fund's holdings, performance information and financial statements along with other important fund information.
In addition, our website, FederatedInvestors.com, offers easy access to Federated resources that include timely fund updates, economic and market insights from our investment strategists, and financial planning tools. We invite you to register to take full advantage of its capabilities.
Thank you for investing with Federated. I hope you find this information useful and look forward to keeping you informed.
Sincerely,
J. Christopher Donahue, President
Not FDIC Insured • May Lose Value • No Bank Guarantee
CONTENTS
| 1 |
| 6 |
| 7 |
| 12 |
| 15 |
| 17 |
| 18 |
| 19 |
| 29 |
| 30 |
| 32 |
| 37 |
| 42 |
| 42 |
Management's Discussion of Fund Performance (unaudited)
The total return of Federated Fund for U.S. Government Securities (the “Fund”), based on net asset value for the 12-month reporting period ended March 31, 2015, was 4.64% for the Class A Shares, 3.85% for the Class B Shares and 4.00% for the Class C Shares. The Barclays Mortgage-Backed Securities Index (BMBS),1 the Fund's broad-based securities market index, returned 5.53% for the same period. The total return of the Lipper U.S. Mortgage Funds Average (LUSMFA),2 a peer group average for the Fund, was 5.21% for the same period. The Fund's and the LUSMFA's total returns for the most recently completed fiscal year reflected actual cash flows, transaction costs and other expenses, which were not reflected in the total return of the BMBS.
During the reporting period, the Fund's investment strategy focused on: (a) duration;3 (b) sector allocation; and (c) security selection. These were the most significant factors affecting the Fund's performance relative to the BMBS.
The following discussion will focus on the performance of the Fund's Class A Shares.
MARKET OVERVIEW
U.S. economic growth was strong relative to global growth, most notably in job creation metrics. The unemployment rate fell 0.7% to just 5.5% as over three million jobs were created during the 12-month reporting period. While moderate growth, a lower unemployment rate and the cessation of quantitative easing (QE) signaled a move towards less accommodative U.S. monetary policy, central banks across the globe moved aggressively to ease policy.
European and U.S. growth appeared to be in different stages of the cycle as evidenced by central bank actions. Prodded by anemic growth and disinflationary forces, the European Central Bank took unprecedented action announcing a QE program which will buy 1.1 trillion euros of sovereign debt in an attempt to stimulate growth. Germany's 10-year yield fell to just 0.18% as of period end. Similarly, the Bank of Japan embarked on a new, massive QE program also designed to fight stagnant growth and increase inflation.
Although U.S. growth appeared to be on a solid growth trajectory, global events seemed to exert a greater impact than domestic economic fundamentals. Geopolitical developments, weak economic growth, disinflation and the collapse of commodities resulted in a stronger U.S. dollar and robust bid for U.S. Treasury securities, which drove longer maturity yields downward.
Annual Shareholder Report
Spread sector performance was mixed relative to similar duration Treasuries. High-yield4 and investment-grade5 corporates posted negative excess returns while commercial mortgage-backed securities (CMBS)6 and conventional residential mortgage excess returns were positive. Longer duration Treasuries posted the highest levels of return due to the yield decline which was most significant for longer maturities. The two-year U.S. Treasury yield increased 14 basis points while the 10-year yield decreased 80 basis points to 1.92%.7
Duration
Portfolio interest rate sensitivity was consistently below that of the BMBS based on an expectation of stronger economic growth and, therefore, higher market yields. Despite the broad U.S. expansion, numerous global factors resulted in strong demand for U.S. Treasury notes and bonds, and yields fell. A portion of this strategy utilized derivatives, specifically Treasury futures.8 Treasury futures were sold as part of a policy which lowered the portfolio's effective duration relative to that of the BMBS. The negative impact on Fund performance from this interest rate strategy was significant.
sector allocation
An underweight in Ginnie Mae mortgage-backed securities (MBS) with a commensurate overweight in conventional mortgage securities proved beneficial as Ginnie Maes lagged considerably as program changes increased refinance risk and prepayments. Additionally, allocations to commercial mortgages–both agency and privately issued–were rewarding as CMBS posted positive excess returns. Overall, sector allocation made a positive impact on Fund performance.
SECURITY SELECTION
Within the CMBS allocation, longer duration, agency-issued commercial securities experienced significant spread tightening and price appreciation. On the residential side, purchases of agency MBS with various characteristics, which tend to reduce prepayment risk, experienced elevated demand as interest and mortgage rates declined. Security selection proved to be beneficial to Fund performance during the reporting period.
Annual Shareholder Report
| 1 | Please see the footnotes to the line graph under “Fund Performance and Growth of a $10,000 Investment” below for the definition of, and more information about, the BMBS. |
| 2 | Please see the footnotes to the line graph under “Fund Performance and Growth of a $10,000 Investment” below for the definition of, and more information about, the LUSMFA. |
| 3 | Duration is a measure of a security's price sensitivity to changes in interest rates. Securities with longer durations are more sensitive to changes in interest rates than other securities of shorter durations. |
| 4 | High-yield, lower-rated securities generally entail greater market, credit and liquidity risks than investment-grade securities and may include higher volatility and a higher risk of default. |
| 5 | Investment-grade securities are securities that are rated at least “BBB” or unrated securities of a comparable quality. Credit ratings are an indication of the risk that a security will default. They do not protect a security from credit risk. Lower-rated bonds typically offer higher yields to help compensate investors for the increased risk associated with them. Among these risks are lower creditworthiness, greater price volatility, more risk to principal and income than with higher-rated securities and increased possibilities of default. |
| 6 | The value of some mortgage-backed securities may be particularly sensitive to changes in the prevailing interest rates, and although the securities are generally supported by some form of government or private insurance, there is no assurance that private guarantors or insurers will meet their obligations. |
| 7 | Bond prices are sensitive to changes in interest rates, and a rise in interest rates can cause a decline in their prices. |
| 8 | The Fund's use of derivative instruments involves risks different from, or possibly greater than, the risks associated with investing directly in securities and other traditional instruments. |
Annual Shareholder Report
FUND PERFORMANCE AND GROWTH OF A $10,000 INVESTMENT
The graph below illustrates the hypothetical investment of $10,0001 in the Federated Fund for U.S. Government Securities (the “Fund”) from March 31, 2005 to March 31, 2015, compared to the Barclays Mortgage-Backed Securities Index (BMBS)2 and the Lipper U.S. Mortgage Funds Average (LUSMFA).3 The Average Annual Total Return table below shows returns for each class averaged over the stated periods.
Growth of a $10,000 Investment
Growth of $10,000 as of March 31, 2015

| Federated Fund for U.S. Government Securities - | Class A Shares | NA | BMBS | LUSMFA |
| F | NA | I | I |
| 3/31/2005 | 9,550 | | 10,000 | 10,000 |
| 3/31/2006 | 9,763 | | 10,267 | 10,206 |
| 3/31/2007 | 10,374 | | 10,979 | 10,822 |
| 3/31/2008 | 10,993 | | 11,838 | 11,274 |
| 3/31/2009 | 11,451 | | 12,795 | 11,597 |
| 3/31/2010 | 12,071 | | 13,462 | 12,626 |
| 3/31/2011 | 12,457 | | 14,050 | 13,307 |
| 3/31/2012 | 13,086 | | 14,923 | 14,138 |
| 3/31/2013 | 13,322 | | 15,217 | 14,660 |
| 3/31/2014 | 13,257 | | 15,247 | 14,657 |
| 3/31/2015 | 13,879 | | 16,090 | 15,421 |
41 graphic description end -->
| ■ | Total returns shown include the maximum sales charge of 4.50% ($10,000 investment minus $450 sales charge = $9,550). |
The Fund offers multiple share classes whose performance may be greater than or less than its other share class(es) due to differences in sales charges and expenses. See the Average Annual Total Return table below for the returns of the additional classes not shown in the line graph above.
Annual Shareholder Report
Average Annual Total Returns for the Period Ended 3/31/2015
(returns reflect all applicable sales charges and contingent deferred sales charges as specified below in footnote #1)
| | 1 Year | 5 Years | 10 Years |
| Class A Shares | -0.03% | 1.87% | 3.33% |
| Class B Shares | -1.65% | 1.70% | 3.19% |
| Class C Shares | 3.00% | 2.08% | 3.03% |
| BMBS | 5.53% | 3.63% | 4.87% |
| LUSMFA | 5.21% | 3.99% | 4.40% |
Performance data quoted represents past performance which is no guarantee of future results. Investment return and principal value will fluctuate so that an investor's shares, when redeemed, may be worth more or less than their original cost. Mutual fund performance changes over time and current performance may be lower or higher than what is stated. For current to the most recent month-end performance and after-tax returns, visit FederatedInvestors.com or call 1-800-341-7400. Returns shown do not reflect the deduction of taxes that a shareholder would pay on Fund distributions or the redemption of Fund shares. Mutual funds are not obligations of or guaranteed by any bank and are not federally insured.
| 1 | Represents a hypothetical investment of $10,000 in the Fund after deducting applicable sales charges: for Class A Shares, the maximum sales charge of 4.50% ($10,000 investment minus $450 sales charge = $9,550); for Class B Shares, the maximum contingent deferred sales charge is 5.50% on any redemption less than one year from the purchase date; for Class C Shares, a 1.00% contingent deferred sales charge would be applied to any redemption less than one year from purchase date. The Fund's performance assumes the reinvestment of all dividends and distributions. The BMBS and the LUSMFA have been adjusted to reflect reinvestment of dividends on securities in the index and the average. |
| 2 | The BMBS tracks agency mortgage backed pass-through securities (both fixed-rate and hybrid ARM) guaranteed by Ginnie Mae (GNMA), Fannie Mae (FNMA) and Freddie Mac (FHLMC). The index is not adjusted to reflect sales loads, expenses or other fees that the Securities and Exchange Commission requires to be reflected in the Fund's performance. The index is unmanaged and, unlike the Fund, is not affected by cash flows. It is not possible to invest directly in an index. |
| 3 | Lipper figures represent the average of the total returns reported by all of the mutual funds designated by Lipper, Inc. as falling in the respective category indicated and is not adjusted to reflect any sales charges. |
Annual Shareholder Report
Portfolio of Investments Summary Table (unaudited)
At March 31, 2015, the Fund's portfolio composition1 was as follows:
| Type of Investments | | Percentage of
Total Net Assets |
| U.S. Government Agency Mortgage-Backed Securities | | 80.4% |
| Non-Agency Mortgage-Backed Securities | | 8.0% |
| Non-Agency Commercial Mortgage-Backed Securities | | 4.3% |
| U.S. Government Agency Commercial Mortgage-Backed Securities | | 2.3% |
| U.S. Government Agency Adjustable Rate Mortgage Securities | | 1.2% |
| Asset-Backed Securities | | 1.1% |
| Derivative Contracts2,3 | | (0.0)% |
| Cash Equivalents4 | | 4.1% |
| Other Assets and Liabilities—Net5 | | (1.4)% |
| TOTAL | | 100.0% |
| 1 | See the Fund's Prospectus and Statement of Additional Information for a description of the principal types of securities in which the Fund invests. |
| 2 | Represents less than 0.1%. |
| 3 | Based upon net unrealized appreciation (depreciation) or value of the derivative contracts as applicable. Derivative contracts may consist of futures, forwards, options and swaps. The impact of a derivative contract on the Fund's performance may be larger than its unrealized appreciation (depreciation) or value may indicate. In many cases, the notional value or amount of a derivative contract may provide a better indication of the contract's significance to the portfolio. More complete information regarding the Fund's direct investments in derivative contracts, including unrealized appreciation (depreciation), value and notional values or amounts of such contracts, can be found in the table at the end of the Portfolio of Investments included in this Report. |
| 4 | Cash Equivalents include any investments in money market mutual funds and/or overnight repurchase agreements. |
| 5 | Assets, other than investments in securities and derivative contracts, less liabilities. See Statement of Assets and Liabilities. |
Annual Shareholder Report
Portfolio of Investments
March 31, 2015
Principal
Amount | | | Value |
| | | MORTGAGE-BACKED SECURITIES—80.4% | |
| | | Federal Home Loan Mortgage Corporation—27.5% | |
| $9,938,612 | | 3.000%, 8/1/2043 | $10,160,952 |
| 28,265,006 | | 3.500%, 4/1/2042 - 9/1/2043 | 29,739,471 |
| 19,357,485 | | 4.000%, 8/1/2025 - 1/1/2042 | 20,755,603 |
| 20,709,521 | | 4.500%, 2/1/2024 - 9/1/2041 | 22,649,538 |
| 11,259,303 | | 5.000%, 7/1/2020 - 10/1/2039 | 12,512,770 |
| 13,300,215 | | 5.500%, 3/1/2021 - 9/1/2037 | 15,023,948 |
| 80,407 | | 6.000%, 10/1/2017 - 2/1/2032 | 92,260 |
| 880,189 | | 6.500%, 10/1/2037 - 10/1/2038 | 1,007,119 |
| 333,286 | | 7.000%, 12/1/2031 | 393,281 |
| 504,992 | | 7.500%, 1/1/2021 - 8/1/2031 | 598,674 |
| | | TOTAL | 112,933,616 |
| | | Federal National Mortgage Association—46.0% | |
| 15,196,906 | | 2.500%, 5/1/2028 | 15,668,841 |
| 39,221,982 | | 3.500%, 12/1/2040 - 5/1/2043 | 41,454,339 |
| 53,759,818 | | 4.000%, 12/1/2031 - 6/1/2044 | 57,868,226 |
| 23,959,577 | | 4.500%, 12/1/2019 - 6/1/2044 | 26,213,747 |
| 15,724,330 | | 5.000%, 1/1/2024 - 1/1/2040 | 17,541,262 |
| 3,171,262 | | 5.500%, 9/1/2034 - 9/1/2037 | 3,585,000 |
| 19,877,100 | | 6.000%, 10/1/2028 - 4/1/2038 | 22,997,116 |
| 2,752,965 | | 6.500%, 6/1/2029 - 8/1/2037 | 3,176,594 |
| 561,426 | | 7.000%, 8/1/2028 - 1/1/2032 | 659,376 |
| 1,889 | | 7.500%, 1/1/2030 | 2,279 |
| 221 | | 11.750%, 10/1/2015 | 224 |
| 36 | | 13.000%, 8/1/2015 | 36 |
| | | TOTAL | 189,167,040 |
| | | Government National Mortgage Association—6.9% | |
| 6,000,000 | | 3.000%, 4/20/2045 | 6,180,158 |
| 13,817,937 | | 3.500%, 12/15/2040 | 14,586,020 |
| 4,293,857 | | 5.000%, 11/20/2038 - 9/20/2039 | 4,790,597 |
| 785,175 | | 5.500%, 12/20/2038 | 873,715 |
| 634,502 | | 6.000%, 9/20/2038 | 722,511 |
| 740,836 | | 7.500%, 12/15/2023 - 7/15/2030 | 886,018 |
| 89,669 | | 8.250%, 10/15/2030 | 111,019 |
| 47,390 | | 8.375%, 8/15/2030 | 54,050 |
Annual Shareholder Report
Principal
Amount | | | Value |
| | | MORTGAGE-BACKED SECURITIES—continued | |
| | | Government National Mortgage Association—continued | |
| $25 | | 11.250%, 9/20/2015 | $25 |
| | | TOTAL | 28,204,113 |
| | | TOTAL MORTGAGE-BACKED SECURITIES
(IDENTIFIED COST $309,768,660) | 330,304,769 |
| | | ADJUSTABLE RATE MORTGAGE—1.2% | |
| | | Federal National Mortgage Association ARM—1.2% | |
| 4,699,580 | | 3.038%, 1/1/2044
(IDENTIFIED COST $4,833,959) | 4,927,951 |
| | | ASSET-BACKED SECURITIES—1.1% | |
| | | Auto Receivables—0.9% | |
| 3,795,000 | | Santander Drive Auto Receivables Trust 2014-3, Class D, 2.650%, 8/17/2020 | 3,790,273 |
| | | Single Family Rental Securities—0.2% | |
| 703,000 | 1,2 | American Homes 4 Rent 2015-SFR1, Class E, 5.639%, 4/17/2052 | 725,228 |
| | | TOTAL ASSET-BACKED SECURITIES
(IDENTIFIED COST $4,480,603) | 4,515,501 |
| | | COLLATERALIZED MORTGAGE OBLIGATIONS—8.0% | |
| | | Non-Agency Mortgage-Backed Securities—8.0% | |
| 1,853,140 | | Countrywide Home Loans 2007-14, Class A18, 6.000%, 9/25/2037 | 1,706,610 |
| 496,462 | | Credit Suisse Mortgage Trust 2007-4, Class 4A2, 5.500%, 6/25/2037 | 440,443 |
| 1,929,044 | 1,2 | Credit Suisse Mortgage Trust 2012-CIM2, Class A1, 3.000%, 6/25/2042 | 1,927,615 |
| 5,109,482 | 1,2 | Credit Suisse Mortgage Trust 2013-IVR3, Class A2, 3.000%, 5/25/2043 | 5,069,952 |
| 1,804,128 | 1,2 | Credit Suisse Mortgage Trust 2014-WIN2, Class A2, 3.500%, 10/25/2044 | 1,843,416 |
| 3,736,551 | 1,2 | Credit Suisse Mortgage Trust 2015-WIN1, Class A6, 3.500%, 12/25/2044 | 3,807,668 |
| 789,537 | | First Horizon Alternative Mortgage Securities 2005-FA7, Class 2A1, 5.000%, 9/25/2020 | 777,610 |
| 1,345,738 | | Lehman Mortgage Trust 2007-9, Class 1A1, 6.000%, 10/25/2037 | 1,264,545 |
| 196,173 | 1,3 | Lehman Structured Securities Corp. Mortgage 2002-GE1, Class A, 0.000%, 7/26/2024 | 169,728 |
| 99,447 | | Sequoia Mortgage Trust 2010-H1, Class A1, 1.992%, 2/25/2040 | 100,205 |
| 285,391 | | Sequoia Mortgage Trust 2011-1, Class A1, 4.125%, 2/25/2041 | 285,137 |
| 1,487,910 | | Sequoia Mortgage Trust 2012-1, Class 2A1, 3.474%, 1/25/2042 | 1,522,496 |
| 3,907,677 | | Sequoia Mortgage Trust 2012-4, Class A3, 2.069%, 9/25/2042 | 3,666,238 |
| 2,627,018 | 1,2 | Sequoia Mortgage Trust 2014-1, Class 2A5, 4.000%, 4/25/2044 | 2,733,943 |
| 5,080,380 | 1,2 | Sequoia Mortgage Trust 2014-4, Class A5, 3.500%, 11/25/2044 | 5,177,642 |
| 415,465 | 1,3 | Structured Asset Securities Corp. 1998-RF4, Class AIO, 6.300%, 8/15/2028 | 36,561 |
Annual Shareholder Report
Principal
Amount | | | Value |
| | | COLLATERALIZED MORTGAGE OBLIGATIONS—continued | |
| | | Non-Agency Mortgage-Backed Securities—continued | |
| $2,552,748 | | Structured Asset Securities Corp. 2005-17, Class 5A1, 5.500%, 10/25/2035 | $2,238,239 |
| | | TOTAL COLLATERALIZED MORTGAGE OBLIGATIONS
(IDENTIFIED COST $33,825,272) | 32,768,048 |
| | | COMMERCIAL MORTGAGE-BACKED SECURITIES—6.6% | |
| | | Agency Commercial Mortgage-Backed Securities—2.3% | |
| 3,000,000 | 1,2 | FREMF Mortgage Trust 2013-K24, Class B, 3.502%, 11/25/2045 | 3,073,801 |
| 2,800,000 | 1,2 | FREMF Mortgage Trust 2013-K25, 3.618%, 11/25/2045 | 2,890,313 |
| 3,140,000 | 1,2 | FREMF Mortgage Trust 2014-K717, 3.630%, 11/25/2047 | 3,225,068 |
| | | TOTAL | 9,189,182 |
| | | Non-Agency Commercial Mortgage-Backed Securities—4.3% | |
| 5,300,483 | 1,2 | GS Mortgage Securities Corp. 2010-C2, Class A1, 3.849%, 12/10/2043 | 5,412,105 |
| 3,246,714 | 1,2 | JP Morgan Chase Commercial Mortgage Securities 2010-C2, Class A1, 2.749%, 11/15/2043 | 3,270,342 |
| 2,000,000 | | Morgan Stanley Capital I 2012-C4, Class A2, 2.111%, 3/15/2045 | 2,033,605 |
| 6,925,657 | 1,2 | WF-RBS Commercial Mortgage Trust 2011-C3, Class A2, 3.240%, 3/15/2044 | 7,071,095 |
| | | TOTAL | 17,787,147 |
| | | TOTAL COMMERCIAL MORTGAGE-BACKED SECURITIES
(IDENTIFIED COST $26,539,236) | 26,976,329 |
| | | REPURCHASE AGREEMENT—4.1% | |
| 17,068,000 | | Interest in $825,000,000 joint repurchase agreement 0.15%, dated 3/31/2015 under which Bank of America, N.A. will repurchase securities provided as collateral for $825,003,438 on 4/1/2015. The securities provided as collateral at the end of the period held with BNY Mellon as tri-party agent, were U.S. Government Agency securities with various maturities to 11/1/2043 and the market value of those underlying securities was $841,960,486. (AT COST) | 17,068,000 |
| | | TOTAL INVESTMENTS—101.4%
(IDENTIFIED COST $396,515,730)4 | 416,560,598 |
| | | OTHER ASSETS AND LIABILITIES - NET—(1.4)%5 | (5,664,678) |
| | | TOTAL NET ASSETS—100% | $410,895,920 |
Annual Shareholder Report
At March 31, 2015, the Fund had the following outstanding futures contracts:
| Description | Number of
Contracts | Notional
Value | Expiration
Date | Unrealized
Depreciation |
| 6United States Treasury Notes 2-Year Short Futures | 50 | $10,957,813 | June 2015 | $ (46,044) |
Unrealized Depreciation on Futures Contracts is included in “Other Assets and
Liabilities—Net.”
| 1 | Denotes a restricted security that either: (a) cannot be offered for public sale without first being registered, or being able to take advantage of an exemption from registration, under the Securities Act of 1933; or (b) is subject to a contractual restriction on public sales. At March 31, 2015, these restricted securities amounted to $46,434,477, which represented 11.3% of total net assets. |
| 2 | Denotes a restricted security that may be resold without restriction to “qualified institutional buyers” as defined in Rule 144A under the Securities Act of 1933 and that the Fund has determined to be liquid under criteria established by the Fund's Board of Trustees (the “Trustees”). At March 31, 2015, these liquid restricted securities amounted to $46,228,188, which represented 11.3% of total net assets. |
| 3 | Market quotations and price evaluations are not available. Fair value determined in accordance with procedures established by and under the general supervision of the Trustees. |
| 4 | The cost of investments for federal tax purposes amounts to $396,416,495. |
| 5 | Assets, other than investments in securities, less liabilities. See Statement of Assets and Liabilities. |
| 6 | Non-income-producing security. |
Note: The categories of investments are shown as a percentage of total net assets at March 31, 2015.
Various inputs are used in determining the value of the Fund's investments. These inputs are summarized in the three broad levels listed below:
Level 1—quoted prices in active markets for identical securities.
Level 2—other significant observable inputs (including quoted prices for similar securities, interest rates, prepayment speeds, credit risk, etc.). Also includes securities valued at amortized cost.
Level 3—significant unobservable inputs (including the Fund's own assumptions in determining the fair value of investments).
The inputs or methodology used for valuing securities are not an indication of the risk associated with investing in those securities.
Annual Shareholder Report
The following is a summary of the inputs used, as of March 31, 2015, in valuing the Fund's assets carried at fair value:
| Valuation Inputs |
| | Level 1—
Quoted
Prices | Level 2—
Other
Significant
Observable
Inputs | Level 3—
Significant
Unobservable
Inputs | Total |
| Debt Securities: | | | | |
| Mortgage-Backed Securities | $— | $330,304,769 | $— | $330,304,769 |
| Adjustable Rate Mortgage | — | 4,927,951 | — | 4,927,951 |
| Asset-Backed Securities | — | 4,515,501 | — | 4,515,501 |
| Collateralized Mortgage Obligations | — | 32,561,759 | 206,289 | 32,768,048 |
| Commercial Mortgage-Backed Securities | — | 26,976,329 | — | 26,976,329 |
| Repurchase Agreement | — | 17,068,000 | — | 17,068,000 |
| TOTAL SECURITIES | $— | $416,354,309 | $206,289 | $416,560,598 |
| OTHER FINANCIAL INSTRUMENTS* | $(46,044) | $— | $— | $(46,044) |
| * | Other financial instruments include futures contracts. |
The following acronym is used throughout this portfolio:
| ARM | —Adjustable Rate Mortgage |
See Notes which are an integral part of the Financial Statements
Annual Shareholder Report
Financial Highlights–Class A Shares
(For a Share Outstanding Throughout Each Period)
| Year Ended March 31 | 2015 | 2014 | 2013 | 2012 | 2011 |
| Net Asset Value, Beginning of Period | $7.49 | $7.74 | $7.82 | $7.71 | $7.77 |
| Income From Investment Operations: | | | | | |
| Net investment income | 0.191 | 0.171 | 0.191 | 0.241 | 0.271 |
| Net realized and unrealized gain (loss) on investments and futures contracts | 0.15 | (0.21) | (0.05) | 0.14 | (0.02) |
| TOTAL FROM INVESTMENT OPERATIONS | 0.34 | (0.04) | 0.14 | 0.38 | 0.25 |
| Less Distributions: | | | | | |
| Distributions from net investment income | (0.20) | (0.21) | (0.22) | (0.27) | (0.31) |
| Net Asset Value, End of Period | $7.63 | $7.49 | $7.74 | $7.82 | $7.71 |
| Total Return2 | 4.64% | (0.49)% | 1.80% | 5.05% | 3.19% |
| Ratios to Average Net Assets: | | | | | |
| Net expenses | 0.94% | 0.90% | 0.91% | 0.92% | 0.94% |
| Net investment income | 2.54% | 2.21% | 2.45% | 3.03% | 3.50% |
| Expense waiver/reimbursement3 | — | — | 0.00%4 | 0.00%4 | 0.01% |
| Supplemental Data: | | | | | |
| Net assets, end of period (000 omitted) | $367,904 | $390,752 | $489,819 | $530,857 | $559,964 |
| Portfolio turnover | 65% | 252% | 168% | 156% | 138% |
| Portfolio turnover (excluding purchases and sales from dollar-roll transactions) | 26% | 69% | 46% | 44% | 36% |
| 1 | Per share numbers have been calculated using the average shares method. |
| 2 | Based on net asset value, which does not reflect the sales charge, redemption fee or contingent deferred sales charge, if applicable. |
| 3 | This expense decrease is reflected in both the net expense and the net investment income ratios shown above. |
| 4 | Represents less than 0.01%. |
See Notes which are an integral part of the Financial Statements
Annual Shareholder Report
Financial Highlights–Class B Shares
(For a Share Outstanding Throughout Each Period)
| Year Ended March 31 | 2015 | 2014 | 2013 | 2012 | 2011 |
| Net Asset Value, Beginning of Period | $7.49 | $7.75 | $7.82 | $7.71 | $7.76 |
| Income From Investment Operations: | | | | | |
| Net investment income | 0.141 | 0.111 | 0.131 | 0.181 | 0.221 |
| Net realized and unrealized gain (loss) on investments and futures contracts | 0.15 | (0.22) | (0.04) | 0.15 | (0.02) |
| TOTAL FROM INVESTMENT OPERATIONS | 0.29 | (0.11) | 0.09 | 0.33 | 0.20 |
| Less Distributions: | | | | | |
| Distributions from net investment income | (0.15) | (0.15) | (0.16) | (0.22) | (0.25) |
| Net Asset Value, End of Period | $7.63 | $7.49 | $7.75 | $7.82 | $7.71 |
| Total Return2 | 3.85% | (1.38)% | 1.17% | 4.26% | 2.55% |
| Ratios to Average Net Assets: | | | | | |
| Net expenses | 1.69% | 1.65% | 1.66% | 1.67% | 1.69% |
| Net investment income | 1.79% | 1.45% | 1.70% | 2.31% | 2.75% |
| Expense waiver/reimbursement3 | — | — | 0.00%4 | 0.00%4 | 0.01% |
| Supplemental Data: | | | | | |
| Net assets, end of period (000 omitted) | $10,005 | $13,870 | $20,404 | $25,847 | $43,444 |
| Portfolio turnover | 65% | 252% | 168% | 156% | 138% |
| Portfolio turnover (excluding purchases and sales from dollar-roll transactions) | 26% | 69% | 46% | 44% | 36% |
| 1 | Per share numbers have been calculated using the average shares method. |
| 2 | Based on net asset value, which does not reflect the sales charge, redemption fee or contingent deferred sales charge, if applicable. |
| 3 | This expense decrease is reflected in both the net expense and the net investment income ratios shown above. |
| 4 | Represents less than 0.01%. |
See Notes which are an integral part of the Financial Statements
Annual Shareholder Report
Financial Highlights–Class C Shares
(For a Share Outstanding Throughout Each Period)
| Year Ended March 31 | 2015 | 2014 | 2013 | 2012 | 2011 |
| Net Asset Value, Beginning of Period | $7.48 | $7.74 | $7.81 | $7.70 | $7.76 |
| Income From Investment Operations: | | | | | |
| Net investment income | 0.141 | 0.111 | 0.131 | 0.181 | 0.211 |
| Net realized and unrealized gain (loss) on investments and futures contracts | 0.16 | (0.22) | (0.04) | 0.15 | (0.02) |
| TOTAL FROM INVESTMENT OPERATIONS | 0.30 | (0.11) | 0.09 | 0.33 | 0.19 |
| Less Distributions: | | | | | |
| Distributions from net investment income | (0.15) | (0.15) | (0.16) | (0.22) | (0.25) |
| Net Asset Value, End of Period | $7.63 | $7.48 | $7.74 | $7.81 | $7.70 |
| Total Return2 | 4.00% | (1.38)% | 1.17% | 4.27% | 2.43% |
| Ratios to Average Net Assets: | | | | | |
| Net expenses | 1.69% | 1.65% | 1.66% | 1.67% | 1.69% |
| Net investment income | 1.79% | 1.45% | 1.70% | 2.28% | 2.75% |
| Expense waiver/reimbursement3 | — | — | 0.00%4 | 0.00%4 | 0.01% |
| Supplemental Data: | | | | | |
| Net assets, end of period (000 omitted) | $32,987 | $36,992 | $60,557 | $73,624 | $71,492 |
| Portfolio turnover | 65% | 252% | 168% | 156% | 138% |
| Portfolio turnover (excluding purchases and sales from dollar-roll transactions) | 26% | 69% | 46% | 44% | 36% |
| 1 | Per share numbers have been calculated using the average shares method. |
| 2 | Based on net asset value, which does not reflect the sales charge, redemption fee or contingent deferred sales charge, if applicable. |
| 3 | This expense decrease is reflected in both the net expense and the net investment income ratios shown above. |
| 4 | Represents less than 0.01%. |
See Notes which are an integral part of the Financial Statements
Annual Shareholder Report
Statement of Assets and Liabilities
March 31, 2015
| Assets: | | |
| Total investment in securities, at value (identified cost $396,515,730) | | $416,560,598 |
| Restricted cash (Note 2) | | 32,500 |
| Income receivable | | 1,258,579 |
| Receivable for shares sold | | 37,291 |
| TOTAL ASSETS | | 417,888,968 |
| Liabilities: | | |
| Payable for investments purchased | $6,179,016 | |
| Payable for shares redeemed | 324,743 | |
| Bank overdraft | 8,413 | |
| Payable for daily variation margin | 7,031 | |
| Income distribution payable | 156,910 | |
| Payable for Directors'/Trustees' fees (Note 5) | 162 | |
| Payable for distribution services fee (Note 5) | 27,490 | |
| Payable for other service fees (Notes 2 and 5) | 137,938 | |
| Accrued expenses (Note 5) | 151,345 | |
| TOTAL LIABILITIES | | 6,993,048 |
| Net assets for 53,851,103 shares outstanding | | $410,895,920 |
| Net Assets Consist of: | | |
| Paid-in capital | | $409,052,894 |
| Net unrealized appreciation of investments and futures contracts | | 19,998,824 |
| Accumulated net realized loss on investments and futures contracts | | (18,197,192) |
| Undistributed net investment income | | 41,394 |
| TOTAL NET ASSETS | | $410,895,920 |
Annual Shareholder Report
Statement of Assets and Liabilities–continued
| Net Asset Value, Offering Price and Redemption Proceeds Per Share | | |
| Class A Shares: | | |
Net asset value per share ($367,904,006 ÷ 48,215,338 shares outstanding),
no par value, unlimited shares authorized | | $7.63 |
| Offering price per share (100/95.50 of $7.63) | | $7.99 |
| Redemption proceeds per share | | $7.63 |
| Class B Shares: | | |
Net asset value per share ($10,004,590 ÷ 1,310,825 shares outstanding),
no par value, unlimited shares authorized | | $7.63 |
| Offering price per share | | $7.63 |
| Redemption proceeds per share (94.50/100 of $7.63) | | $7.21 |
| Class C Shares: | | |
Net asset value per share ($32,987,324 ÷ 4,324,940 shares outstanding),
no par value, unlimited shares authorized | | $7.63 |
| Offering price per share | | $7.63 |
| Redemption proceeds per share (99/100 of $7.63) | | $7.55 |
See Notes which are an integral part of the Financial Statements
Annual Shareholder Report
Statement of Operations
Year Ended March 31, 2015
| Investment Income: | | |
| Interest | | $14,782,105 |
| Expenses: | | |
| Investment adviser fee (Note 5) | $1,761,555 | |
| Administrative fee (Note 5) | 332,693 | |
| Custodian fees | 27,561 | �� |
| Transfer agent fee | 500,198 | |
| Directors'/Trustees' fees (Note 5) | 3,418 | |
| Auditing fees | 26,450 | |
| Legal fees | 13,028 | |
| Portfolio accounting fees | 156,925 | |
| Distribution services fee (Note 5) | 349,601 | |
| Other service fees (Notes 2 and 5) | 1,057,733 | |
| Share registration costs | 49,269 | |
| Printing and postage | 45,319 | |
| Miscellaneous (Note 5) | 8,593 | |
| TOTAL EXPENSES | | 4,332,343 |
| Net investment income | | 10,449,762 |
| Realized and Unrealized Gain (Loss) on Investments and Futures Contracts: | | |
| Net realized gain on investments | | 884,881 |
| Net realized loss on futures contracts | | (747,295) |
| Net change in unrealized appreciation of investments | | 8,693,699 |
| Net change in unrealized appreciation of futures contracts | | (101,288) |
| Net realized and unrealized gain on investments and futures contracts | | 8,729,997 |
| Change in net assets resulting from operations | | $19,179,759 |
See Notes which are an integral part of the Financial Statements
Annual Shareholder Report
Statement of Changes in Net Assets
| Year Ended March 31 | 2015 | 2014 |
| Increase (Decrease) in Net Assets | | |
| Operations: | | |
| Net investment income | $10,449,762 | $10,387,246 |
| Net realized gain (loss) on investments and futures contracts | 137,586 | (6,701,227) |
| Net change in unrealized appreciation/depreciation of investments and futures contracts | 8,592,411 | (8,680,157) |
| CHANGE IN NET ASSETS RESULTING FROM OPERATIONS | 19,179,759 | (4,994,138) |
| Distributions to Shareholders: | | |
| Distributions from net investment income | | |
| Class A Shares | (10,151,047) | (11,822,227) |
| Class B Shares | (228,352) | (338,814) |
| Class C Shares | (668,483) | (910,046) |
| CHANGE IN NET ASSETS RESULTING FROM DISTRIBUTIONS TO SHAREHOLDERS | (11,047,882) | (13,071,087) |
| Share Transactions: | | |
| Proceeds from sale of shares | 29,770,082 | 23,132,031 |
| Net asset value of shares issued to shareholders in payment of distributions declared | 9,047,856 | 10,777,817 |
| Cost of shares redeemed | (77,667,278) | (145,011,461) |
| CHANGE IN NET ASSETS RESULTING FROM SHARE TRANSACTIONS | (38,849,340) | (111,101,613) |
| Change in net assets | (30,717,463) | (129,166,838) |
| Net Assets: | | |
| Beginning of period | 441,613,383 | 570,780,221 |
| End of period (including undistributed net investment income of $41,394 and $93,242, respectively) | $410,895,920 | $441,613,383 |
See Notes which are an integral part of the Financial Statements
Annual Shareholder Report
Notes to Financial Statements
March 31, 2015
1. ORGANIZATION
Federated Income Securities Trust (the “Trust”) is registered under the Investment Company Act of 1940, as amended (the “Act”), as a diversified, open-end management investment company. The Trust consists of nine portfolios. The financial statements included herein are only those of Federated Fund for U.S. Government Securities (the “Fund”). The financial statements of the other portfolios are presented separately. The assets of each portfolio are segregated and a shareholder's interest is limited to the portfolio in which shares are held. Each portfolio pays its own expenses. The Fund offers three classes of shares: Class A Shares, Class B Shares and Class C Shares. All shares of the Fund have equal rights with respect to voting, except on class-specific matters. The investment objective of the Fund is to provide current income.
2. SIGNIFICANT ACCOUNTING POLICIES
The following is a summary of significant accounting policies consistently followed by the Fund in the preparation of its financial statements. These policies are in conformity with U.S. generally accepted accounting principles (GAAP).
Investment Valuation
In calculating its net asset value (NAV), the Fund generally values investments as follows:
| ■ | Fixed-income securities acquired with remaining maturities greater than 60 days are fair valued using price evaluations provided by a pricing service approved by the Trustees. |
| ■ | Fixed-income securities and repurchase agreements acquired with remaining maturities of 60 days or less are valued at their cost (adjusted for the accretion of any discount or amortization of any premium), unless the issuer's creditworthiness is impaired or other factors indicate that amortized cost is not an accurate estimate of the investment's fair value, in which case it would be valued in the same manner as a longer-term security. |
| ■ | Shares of other mutual funds or non-exchange-traded investment companies are valued based upon their reported NAVs. |
| ■ | Derivative contracts listed on exchanges are valued at their reported settlement or closing price, except that options are valued at the mean of closing bid and asked quotations. |
| ■ | Over-the-counter (OTC) derivative contracts are fair valued using price evaluations provided by a pricing service approved by the Trustees. |
| ■ | For securities that are fair valued in accordance with procedures established by and under the general supervision of the Trustees, certain factors may be considered such as: the last traded or purchase price of the security, information obtained by contacting the issuer or dealers, analysis of the issuer's financial statements or other available documents, fundamental analytical data, the nature and duration of restrictions on disposition, the movement of the market in which the security is normally traded, public trading in similar securities or derivative contracts of the issuer or comparable issuers, movement of a relevant index, or other factors including but not limited to industry changes and relevant government actions. |
Annual Shareholder Report
If any price, quotation, price evaluation or other pricing source is not readily available when the NAV is calculated, or if the Fund cannot obtain price evaluations from a pricing service or from more than one dealer for an investment within a reasonable period of time as set forth in the Fund's valuation policies and procedures, the Fund uses the fair value of the investment determined in accordance with the procedures described below. There can be no assurance that the Fund could obtain the fair value assigned to an investment if it sold the investment at approximately the time at which the Fund determines its NAV per share.
Fair Valuation Procedures
The Trustees have ultimate responsibility for determining the fair value of investments for which market quotations are not readily available. The Trustees have appointed a valuation committee (“Valuation Committee”) comprised of officers of the Fund, Federated Investment Management Company (“Adviser”) and certain of the Adviser's affiliated companies to assist in determining fair value and in overseeing the calculation of the NAV. The Trustees have also authorized the use of pricing services recommended by the Valuation Committee to provide fair value evaluations of the current value of certain investments for purposes of calculating the NAV. The Valuation Committee employs various methods for reviewing third-party pricing-service evaluations including periodic reviews of third-party pricing services' policies, procedures and valuation methods (including key inputs, methods, models and assumptions), transactional back-testing, comparisons of evaluations of different pricing services, and review of price challenges by the Adviser based on recent market activity. In the event that market quotations and price evaluations are not available for an investment, the Valuation Committee determines the fair value of the investment in accordance with procedures adopted by the Trustees. The Trustees periodically review and approve the fair valuations made by the Valuation Committee and any changes made to the procedures.
Factors considered by pricing services in evaluating an investment include the yields or prices of investments of comparable quality, coupon, maturity, call rights and other potential prepayments, terms and type, reported transactions, indications as to values from dealers and general market conditions. Some pricing services provide a single price evaluation reflecting the bid-side of the market for an investment (a “bid” evaluation). Other pricing services offer both bid evaluations and price evaluations indicative of a price between the prices bid and asked for the investment (a “mid” evaluation). The Fund normally uses bid evaluations for any U.S. Treasury and Agency securities, mortgage-backed securities and municipal securities. The Fund normally uses mid evaluations for any other types of fixed-income securities and any OTC derivative contracts. In the event that market quotations and price evaluations are not available for an investment, the fair value of the investment is determined in accordance with procedures adopted by the Trustees.
Repurchase Agreements
The Fund may invest in repurchase agreements for short-term liquidity purposes. It is the policy of the Fund to require the other party to a repurchase agreement to transfer to the Fund's custodian or sub-custodian eligible securities or cash with a market value (after transaction costs) at least equal to the repurchase price to be paid under the repurchase agreement. The eligible securities are transferred to accounts with the custodian or sub-custodian in which the Fund holds a “securities entitlement” and exercises “control” as those terms are defined in the Uniform Commercial Code. The Fund has established procedures for monitoring the market value of the transferred securities and requiring the transfer of
Annual Shareholder Report
additional eligible securities if necessary to equal at least the repurchase price. These procedures also allow the other party to require securities to be transferred from the account to the extent that their market value exceeds the repurchase price or in exchange for other eligible securities of equivalent market value.
The insolvency of the other party or other failure to repurchase the securities may delay the disposition of the underlying securities or cause the Fund to receive less than the full repurchase price. Under the terms of the repurchase agreement, any amounts received by the Fund in excess of the repurchase price and related transaction costs must be remitted to the other party.
The Fund may enter into repurchase agreements in which eligible securities are transferred into joint trading accounts maintained by the custodian or sub-custodian for investment companies and other clients advised by the Fund's Adviser and its affiliates. The Fund will participate on a pro rata basis with the other investment companies and clients in its share of the securities transferred under such repurchase agreements and in its share of proceeds from any repurchase or other disposition of such securities.
Repurchase agreements are subject to Master Netting Agreements which are agreements between the Fund and its counterparties that provide for the net settlement of all transactions and collateral with the Fund, through a single payment, in the event of default or termination. Amounts presented on the Portfolio of Investments and Statement of Assets and Liabilities are not net settlement amounts but gross. As indicated above, the cash or securities to be repurchased, as shown on the Portfolio of Investments, exceeds the repurchase price to be paid under the agreement reducing the net settlement amount to zero.
Investment Income, Gains and Losses, Expenses and Distributions
Investment transactions are accounted for on a trade-date basis. Realized gains and losses from investment transactions are recorded on an identified-cost basis. Interest income and expenses are accrued daily. Distributions to shareholders are recorded on the ex-dividend date. Distributions of net investment income are declared and paid monthly. Investment income, realized and unrealized gains and losses and certain fund-level expenses are allocated to each class based on relative average daily net assets, except that Class A Shares, Class B Shares and Class C Shares may bear distribution services fees and other service fees unique to those classes.
Dividends are declared separately for each class. No class has preferential dividend rights; differences in per share dividend rates are generally due to differences in separate class expenses.
Other Service Fees
The Fund may pay other service fees up to 0.25% of the average daily net assets of the Fund's Class A Shares, Class B Shares and Class C Shares to unaffiliated financial intermediaries or to Federated Shareholder Services Company (FSSC) for providing services to shareholders and maintaining shareholder accounts. FSSC may voluntarily reimburse the Fund for other service
Annual Shareholder Report
fees. This reimbursement can be modified or terminated at any time at its sole discretion. In addition, unaffiliated third-party financial intermediaries may waive other service fees. This waiver can be modified or terminated at any time. For the year ended March 31, 2015, other service fees for the Fund were as follows:
| | Other Service
Fees Incurred |
| Class A Shares | $941,404 |
| Class B Shares | 29,760 |
| Class C Shares | 86,569 |
| TOTAL | $1,057,733 |
Premium and Discount Amortization/Paydown Gains and Losses
All premiums and discounts on fixed-income securities are amortized/accreted using the effective-interest-rate method. Gains and losses realized on principal payment of mortgage-backed securities (paydown gains and losses) are classified as part of investment income.
Federal Taxes
It is the Fund's policy to comply with the Subchapter M provision of the Internal Revenue Code (the “Code”) and to distribute to shareholders each year substantially all of its income. Accordingly, no provision for federal income tax is necessary. As of and during the year ended March 31, 2015, the Fund did not have a liability for any uncertain tax positions. The Fund recognizes interest and penalties, if any, related to tax liabilities as income tax expense in the Statement of Operations. As of March 31, 2015, tax years 2012 through 2015 remain subject to examination by the Fund's major tax jurisdictions, which include the United States of America and the Commonwealth of Massachusetts.
When-Issued and Delayed-Delivery Transactions
The Fund may engage in when-issued or delayed-delivery transactions. The Fund records when-issued securities on the trade date and maintains security positions such that sufficient liquid assets will be available to make payment for the securities purchased. Securities purchased on a when-issued or delayed-delivery basis are marked to market daily and begin earning interest on the settlement date. Losses may occur on these transactions due to changes in market conditions or the failure of counterparties to perform under the contract.
The Fund may transact in To Be Announced Securities (TBAs). As with other delayed-delivery transactions, a seller agrees to issue TBAs at a future date. However, the seller does not specify the particular securities to be delivered. Instead, the Fund agrees to accept any security that meets specified terms such as issuer, interest rate and terms of underlying mortgages. The Fund records TBAs on the trade date utilizing information associated with the specified terms of the transaction as opposed to the specific mortgages. TBAs are marked to market daily and begin earning interest on the settlement date. Losses may occur due to the fact that the actual underlying mortgages received may be less favorable than those anticipated by the Fund.
Dollar-Roll Transactions
The Fund engages in dollar-roll transactions in which the Fund sells mortgage-backed securities with a commitment to buy similar (same type, coupon and maturity), but not identical mortgage-backed securities on a future date. Both securities involved are TBA mortgage-backed securities. The Fund treats dollar-roll transactions as purchases and sales. Dollar-rolls are subject to interest rate risks and credit risks.
Annual Shareholder Report
Restricted Securities
The Fund may purchase securities which are considered restricted. Restricted securities are securities that either: (a) cannot be offered for public sale without first being registered, or being able to take advantage of an exemption from registration, under the Securities Act of 1933; or (b) are subject to contractual restrictions on public sales. In some cases, when a security cannot be offered for public sale without first being registered, the issuer of the restricted security has agreed to register such securities for resale, at the issuer's expense, either upon demand by the Fund or in connection with another registered offering of the securities. Many such restricted securities may be resold in the secondary market in transactions exempt from registration. Restricted securities may be determined to be liquid under criteria established by the Trustees. The Fund will not incur any registration costs upon such resales. The Fund's restricted securities, like other securities, are priced in accordance with procedures established by and under the general supervision of the Trustees.
Additional information on restricted securities, excluding securities purchased under Rule 144A that have been deemed liquid by the Trustees, if applicable, held at March 31, 2015, is as follows:
| Security | Acquisition
Date | Cost | Market
Value |
| Lehman Structured Securities Corp. Mortgage 2002-GE1, Class A, 0.000%, 7/26/2024 | 1/29/2002 | $161,147 | $169,728 |
| Structured Asset Securities Corp. 1998-RF4, Class AIO, 6.300%, 8/15/2028 | 12/15/1999 | $469,050 | $36,561 |
Futures Contracts
The Fund purchases and sells financial futures contracts to manage duration. Upon entering into a financial futures contract with a broker, the Fund is required to deposit in a segregated account a specified amount of cash or U.S. government securities which is shown as Restricted Cash in the Statement of Assets and Liabilities. Futures contracts are valued daily and unrealized gains or losses are recorded in a “variation margin” account. Daily, the Fund receives from or pays to the broker a specified amount of cash based upon changes in the variation margin account. When a contract is closed, the Fund recognizes a realized gain or loss. Futures contracts have market risks, including the risk that the change in the value of the contract may not correlate with the changes in the value of the underlying securities. There is minimal counterparty risk to the Fund since futures are exchange traded and the exchange's clearing house, as counterparty to all exchange-traded futures, guarantees the futures against default.
Futures contracts outstanding at period end are listed after the Fund's Portfolio of Investments.
The average notional value of long and short futures contracts held by the Fund throughout the period was $414,885 and $27,615,906, respectively. This is based on amounts held as of each month-end throughout the fiscal period.
Annual Shareholder Report
Additional Disclosure Related to Derivative Instruments
| Fair Value of Derivative Instruments |
| | Liability |
| | Statement of
Assets and
Liabilities
Location | Fair
Value |
Derivatives not accounted for as hedging instruments
under ASC Topic 815 | | |
| Interest rate contracts | Payable for daily
variation margin | $46,044* |
| * | Includes cumulative depreciation of futures contracts as reported in the footnotes to the Portfolio of Investments. Only the current day's variation margin is reported within the Statement of Assets and Liabilities. |
The Effect of Derivative Instruments on the Statement of Operations for the Year Ended March 31, 2015
| Amount of Realized Gain or (Loss) on Derivatives Recognized in Income |
| | Futures |
| Interest rate contracts | $(747,295) |
| Change in Unrealized Appreciation or (Depreciation) on Derivatives Recognized in Income |
| | Futures |
| Interest rate contracts | $(101,288) |
Other
The preparation of financial statements in conformity with GAAP requires management to make estimates and assumptions that affect the amounts of assets, liabilities, expenses and revenues reported in the financial statements. Actual results could differ from those estimated. The Fund applies Investment Company accounting and reporting guidance.
3. SHARES OF BENEFICIAL INTEREST
The following tables summarize share activity:
| Year Ended March 31 | 2015 | 2014 |
| Class A Shares: | Shares | Amount | Shares | Amount |
| Shares sold | 3,340,923 | $25,311,265 | 2,411,818 | $18,183,641 |
| Shares issued to shareholders in payment of distributions declared | 1,087,139 | 8,243,604 | 1,281,193 | 9,653,292 |
| Shares redeemed | (8,398,219) | (63,630,930) | (14,753,777) | (111,350,602) |
NET CHANGE RESULTING FROM
CLASS A SHARE TRANSACTIONS | (3,970,157) | $(30,076,061) | (11,060,766) | $(83,513,669) |
Annual Shareholder Report
| Year Ended March 31 | 2015 | 2014 |
| Class B Shares: | Shares | Amount | Shares | Amount |
| Shares sold | 119,952 | $909,629 | 105,988 | $804,910 |
| Shares issued to shareholders in payment of distributions declared | 28,751 | 217,984 | 43,152 | 325,191 |
| Shares redeemed | (689,779) | (5,228,970) | (931,447) | (7,012,742) |
NET CHANGE RESULTING FROM
CLASS B SHARE TRANSACTIONS | (541,076) | $(4,101,357) | (782,307) | $(5,882,641) |
| Year Ended March 31 | 2015 | 2014 |
| Class C Shares: | Shares | Amount | Shares | Amount |
| Shares sold | 468,623 | $3,549,188 | 548,342 | $4,143,480 |
| Shares issued to shareholders in payment of distributions declared | 77,367 | 586,268 | 106,086 | 799,334 |
| Shares redeemed | (1,163,644) | (8,807,378) | (3,535,504) | (26,648,117) |
NET CHANGE RESULTING FROM
CLASS C SHARE TRANSACTIONS | (617,654) | $(4,671,922) | (2,881,076) | $(21,705,303) |
NET CHANGE RESULTING FROM
TOTAL FUND SHARE TRANSACTIONS | (5,128,887) | $(38,849,340) | (14,724,149) | $(111,101,613) |
4. FEDERAL TAX INFORMATION
The timing and character of income and capital gain distributions are determined in accordance with income tax regulations, which may differ from GAAP. These differences are due to differing treatments for expired capital loss carryforwards and dollar-roll transactions.
For the year ended March 31, 2015, permanent differences identified and reclassified among the components of net assets were as follows:
| Increase (Decrease) |
| Paid-In Capital | Undistributed
Net Investment
Income (Loss) | Accumulated
Net Realized
Gain (Loss) |
| $(21,792,738) | $546,272 | $21,246,466 |
Net investment income (loss), net realized gains (losses), and net assets were not affected by this reclassification.
The tax character of distributions as reported on the Statement of Changes in Net Assets for the years ended March 31, 2015 and 2014, was as follows:
| | 2015 | 2014 |
| Ordinary income | $11,047,882 | $13,071,087 |
As of March 31, 2015, the components of distributable earnings on a tax basis were as follows:
| Undistributed ordinary income | $46,263 |
| Net unrealized appreciation | $20,144,103 |
| Capital loss carryforwards | $(18,347,340) |
Annual Shareholder Report
The difference between book-basis and tax-basis net unrealized appreciation/depreciation is attributable to differing treatments for REMIC and dollar-roll transactions.
At March 31, 2015, the cost of investments for federal tax purposes was $396,416,495. The net unrealized appreciation of investments for federal tax purposes excluding futures contracts was $20,144,103. This consists of net unrealized appreciation from investments for those securities having an excess of value over cost of $21,408,501 and net unrealized depreciation from investments for those securities having an excess of cost over value of $1,264,398.
At March 31, 2015, the Fund had a capital loss carryforward of $18,347,340 which will reduce the Fund's taxable income arising from future net realized gains on investments, if any, to the extent permitted by the Code, thereby reducing the amount of distributions to shareholders which would otherwise be necessary to relieve the Fund of any liability for federal income tax. Pursuant to the Code, a net capital loss incurred in taxable years beginning on or before December 22, 2010, is characterized as short-term and may be carried forward for a maximum of eight tax years (“Carryforward Limit”), whereas a net capital loss incurred in taxable years beginning after December 22, 2010, retains its character as either short-term or long-term, does not expire and is required to be utilized prior to the losses which have a Carryforward Limit.
The following schedule summarizes the Fund's capital loss carryforwards and expiration years:
| Expiration Year | Short-Term | Long-Term | Total |
| No Expiration | $7,313,813 | $1,460,082 | $8,773,895 |
| 2017 | $726,216 | NA | $726,216 |
| 2018 | $8,847,229 | NA | $8,847,229 |
The Fund used capital loss carryforwards of $487,363 to offset capital gains realized during the year ended March 31, 2015.
Capital loss carryforwards of $21,792,738 expired during the year ended March 31, 2015.
5. INVESTMENT ADVISER FEE AND OTHER TRANSACTIONS WITH AFFILIATES
Investment Adviser Fee
The Fund's investment advisory contract provides for payment to the Adviser if an annual investment advisory fee based on the Fund's average daily net assets as shown in the chart below plus 4.50% of the fund's gross income. The Adviser may voluntarily choose to waive any portion of its fee. The Adviser can modify or terminate this voluntary waiver at any time at its sole discretion.
| Average Daily Net Assets | Percentage of Average
Daily Net Assets |
| First $500 million | 0.250% |
| Second $500 million | 0.225% |
| Over $1 billion | 0.200% |
Annual Shareholder Report
Administrative Fee
Federated Administrative Services (FAS), under the Administrative Services Agreement, provides the Fund with administrative personnel and services. For purposes of determining the appropriate rate breakpoint, “Investment Complex” is defined as all of the Federated Funds subject to a fee under the Administrative Services Agreement. The fee paid to FAS is based on the average daily net assets of the Investment Complex as specified below, plus certain out-of-pocket expenses:
| Administrative Fee | Average Daily Net Assets
of the Investment Complex |
| 0.150% | on the first $5 billion |
| 0.125% | on the next $5 billion |
| 0.100% | on the next $10 billion |
| 0.075% | on assets in excess of $20 billion |
For the year ended March 31, 2015, the annualized fee paid to FAS was 0.078% of average daily net assets of the Fund.
Distribution Services Fee
The Fund has adopted a Distribution Plan (the “Plan”) pursuant to Rule 12b-1 under the Act. Under the terms of the Plan, the Fund will compensate Federated Securities Corp. (FSC), the principal distributor, from the daily net assets of the Fund's Class B Shares and Class C Shares to finance activities intended to result in the sale of these shares. The Plan provides that the Fund may incur distribution expenses at the following percentages of average daily net assets annually, to compensate FSC:
| Share Class Name | Percentage of Average Daily
Net Assets of Class |
| Class B Shares | 0.75% |
| Class C Shares | 0.75% |
FSC may voluntarily choose to waive any portion of its fee. FSC can modify or terminate this voluntary waiver at any time at its sole discretion. For the year ended March 31, 2015, distribution services fees for the Fund were as follows:
| | Distribution
Services
Fees Incurred |
| Class B Shares | $89,281 |
| Class C Shares | 260,320 |
| TOTAL | $349,601 |
When FSC receives fees, it may pay some or all of them to financial intermediaries whose customers purchase shares. For the year ended March 31, 2015, FSC retained $72,448 of fees paid by the Fund.
Other Service Fees
For the year ended March 31, 2015, FSSC received $415,293 of the other service fees disclosed in Note 2.
Annual Shareholder Report
Sales Charges
Front-end sales charges and contingent deferred sales charges (CDSC) do not represent expenses of the Fund. They are deducted from the proceeds of sales of Fund shares prior to investment or from redemption proceeds prior to remittance, as applicable. For the year ended March 31, 2015, FSC retained $5,298 in sales charges from the sale of Class A Shares. FSC also retained $39,238 of CDSC relating to redemptions of Class B Shares and $2,279 relating to redemptions of Class C Shares.
General
Certain Officers and Trustees of the Fund are Officers and Directors or Trustees of certain of the above companies. To efficiently facilitate payment, Directors'/Trustees' fees and certain expenses related to conducting meetings of the Directors/Trustees and other miscellaneous expenses are paid by an affiliate of the Adviser which in due course are reimbursed by the Fund. Such expenses may be included in Accrued and Miscellaneous Expenses on the Statement of Assets and Liabilities and Statement of Operations, respectively.
6. Investment TRANSACTIONS
Purchases and sales of investments, excluding long-term U.S. government securities and short-term obligations, for the year ended March 31, 2015, were as follows:
| Purchases | $18,931,882 |
| Sales | $18,178,135 |
7. LINE OF CREDIT
The Fund participates in a $100,000,000 unsecured, uncommitted revolving line of credit (LOC) agreement with PNC Bank. The LOC was made available for extraordinary or emergency purposes, primarily for financing redemption payments. Borrowings are charged interest at a rate offered to the Fund by PNC Bank at the time of the borrowing. As of March 31, 2015, there were no outstanding loans. During the year ended March 31, 2015, the Fund did not utilize the LOC.
8. INTERFUND LENDING
Pursuant to an Exemptive Order issued by the Securities and Exchange Commission, the Fund, along with other funds advised by subsidiaries of Federated Investors, Inc., may participate in an interfund lending program. This program provides an alternative credit facility allowing the Fund to borrow from other participating affiliated funds. As of March 31, 2015, there were no outstanding loans. During the year ended March 31, 2015, the program was not utilized.
9. SUBSEQUENT EVENTS
Effective June 1, 2015, the Fund's Class B Shares will be closed to new accounts and new investors.
Effective August 1, 2015, the Fund's Class B Shares will be closed to exchanges from Class B Shares of other Federated Funds and to new purchases made by existing shareholders (excluding reinvestment of dividends and capital gains).
Management has evaluated subsequent events through the date the financial statements were issued, and determined that no additional events have occurred that require disclosure.
Annual Shareholder Report
Report of Independent Registered Public Accounting Firm
TO THE board of trustees of federated income securities trust and SHAREHOLDERS OF Federated Fund for U.S. Government Securities:
We have audited the accompanying statement of assets and liabilities of Federated Fund for U.S. Government Securities (the “Fund”) (one of the portfolios constituting Federated Income Securities Trust), including the portfolio of investments, as of March 31, 2015, and the related statement of operations for the year then ended, the statement of changes in net assets for each of the two years in the period then ended, and the financial highlights for each of the five years in the period then ended. These financial statements and financial highlights are the responsibility of the Fund's management. Our responsibility is to express an opinion on these financial statements and financial highlights based on our audits.
We conducted our audits in accordance with standards of the Public Company Accounting Oversight Board (United States). Those standards require that we plan and perform the audit to obtain reasonable assurance about whether the financial statements and financial highlights are free of material misstatement. We were not engaged to perform an audit of the Fund's internal control over financial reporting. Our audits included consideration of internal control over financial reporting as a basis for designing audit procedures that are appropriate in the circumstances, but not for the purpose of expressing an opinion on the effectiveness of the Fund's internal control over financial reporting. Accordingly, we express no such opinion. An audit also includes examining, on a test basis, evidence supporting the amounts and disclosures in the financial statements and financial highlights, assessing the accounting principles used and significant estimates made by management, and evaluating the overall financial statement presentation. Our procedures included confirmation of securities owned as of March 31, 2015, by correspondence with the custodian and others or by other appropriate auditing procedures where replies from others were not received. We believe that our audits provide a reasonable basis for our opinion.
In our opinion, the financial statements and financial highlights referred to above present fairly, in all material respects, the financial position of Federated Fund for U.S. Government Securities, a portfolio of Federated Income Securities Trust, at March 31, 2015, the results of its operations for the year then ended, the changes in its net assets for each of the two years in the period then ended, and the financial highlights for each of the five years in the period then ended, in conformity with U.S. generally accepted accounting principles.
Boston, Massachusetts
May 21, 2015
Annual Shareholder Report
Shareholder Expense Example (unaudited)
As a shareholder of the Fund, you incur two types of costs: (1) transaction costs, including sales charges (loads) on purchase or redemption payments; and (2) ongoing costs, including management fees and to the extent applicable, distribution (12b-1) fees and/or other service fees and other Fund expenses. This Example is intended to help you to understand your ongoing costs (in dollars) of investing in the Fund and to compare these costs with the ongoing costs of investing in other mutual funds. It is based on an investment of $1,000 invested at the beginning of the period and held for the entire period from October 1, 2014 to March 31, 2015.
ACTUAL EXPENSES
The first section of the table below provides information about actual account values and actual expenses. You may use the information in this section, together with the amount you invested, to estimate the expenses that you incurred over the period. Simply divide your account value by $1,000 (for example, an $8,600 account value divided by $1,000 = 8.6), then multiply the result by the number in the first section under the heading entitled “Expenses Paid During Period” to estimate the expenses attributable to your investment during this period.
HYPOTHETICAL EXAMPLE FOR COMPARISON PURPOSES
The second section of the table below provides information about hypothetical account values and hypothetical expenses based on the Fund's actual expense ratio and an assumed rate of return of 5% per year before expenses, which is not the Fund's actual return. Thus, you should not use the hypothetical account values and expenses to estimate the actual ending account balance or your expenses for the period. Rather, these figures are required to be provided to enable you to compare the ongoing costs of investing in the Fund with other funds. To do so, compare this 5% hypothetical example with the 5% hypothetical examples that appear in the shareholder reports of the other funds.
Annual Shareholder Report
Please note that the expenses shown in the table are meant to highlight your ongoing costs only and do not reflect any transaction costs, such as sales charges (loads) on purchase or redemption payments. Therefore, the second section of the table is useful in comparing ongoing costs only, and will not help you determine the relative total costs of owning different funds. In addition, if these transaction costs were included, your costs would have been higher.
| | Beginning
Account Value
10/1/2014 | Ending
Account Value
3/31/2015 | Expenses Paid
During Period1 |
| Actual: | | | |
| Class A Shares | $1,000 | $1,025.10 | $4.75 |
| Class B Shares | $1,000 | $1,021.20 | $8.52 |
| Class C Shares | $1,000 | $1,022.60 | $8.52 |
Hypothetical (assuming a 5% return
before expenses): | | | |
| Class A Shares | $1,000 | $1,020.24 | $4.73 |
| Class B Shares | $1,000 | $1,016.50 | $8.50 |
| Class C Shares | $1,000 | $1,016.50 | $8.50 |
| 1 | Expenses are equal to the Fund's annualized net expense ratios, multiplied by the average account value over the period, multiplied by 182/365 (to reflect the one-half-year period). The annualized net expense ratios are as follows: |
| | |
| Class A Shares | 0.94% |
| Class B Shares | 1.69% |
| Class C Shares | 1.69% |
Annual Shareholder Report
Board of Trustees and Trust Officers
The Board of Trustees is responsible for managing the Trust's business affairs and for exercising all the Trust's powers except those reserved for the shareholders. The following tables give information about each Trustee and the senior officers of the Fund. Where required, the tables separately list Trustees who are “interested persons” of the Fund (i.e., “Interested” Trustees) and those who are not (i.e., “Independent” Trustees). Unless otherwise noted, the address of each person listed is Federated Investors Tower, 1001 Liberty Avenue, Pittsburgh, PA 15222. The address of all Independent Trustees listed is 4000 Ericsson Drive, Warrendale, PA 15086-7561; Attention: Mutual Fund Board. As of December 31, 2014, the Trust comprised nine portfolio(s), and the Federated Fund Family consisted of 40 investment companies (comprising 131 portfolios). Unless otherwise noted, each Officer is elected annually. Unless otherwise noted, each Trustee oversees all portfolios in the Federated Fund Family and serves for an indefinite term. The Fund's Statement of Additional Information includes additional information about Trust Trustees and is available, without charge and upon request, by calling 1-800-341-7400.
Interested TRUSTEES Background
Name
Birth Date
Positions Held with Trust
Date Service Began | Principal Occupation(s) for Past Five Years,
Other Directorships Held and Previous Position(s) |
John F. Donahue*
Birth Date: July 28, 1924
Trustee
Indefinite Term
Began serving: January 1986 | Principal Occupations: Director or Trustee of the Federated Fund Family; Chairman and Director, Federated Investors, Inc.; Chairman of the Federated Fund Family's Executive Committee.
Previous Positions: Chairman of the Federated Fund Family; Trustee, Federated Investment Management Company; Chairman and Director, Federated Investment Counseling. |
J. Christopher Donahue*
Birth Date: April 11, 1949
President and Trustee
Indefinite Term
Began serving: January 2000 | Principal Occupations: Principal Executive Officer and President of certain of the Funds in the Federated Fund Family; Director or Trustee of the Funds in the Federated Fund Family; President, Chief Executive Officer and Director, Federated Investors, Inc.; Chairman and Trustee, Federated Investment Management Company; Trustee, Federated Investment Counseling; Chairman and Director, Federated Global Investment Management Corp.; Chairman, Federated Equity Management Company of Pennsylvania and Passport Research, Ltd. (investment advisory subsidiary of Federated); Trustee, Federated Shareholder Services Company; Director, Federated Services Company.
Previous Positions: President, Federated Investment Counseling; President and Chief Executive Officer, Federated Investment Management Company, Federated Global Investment Management Corp. and Passport Research, Ltd. |
| * | Family relationships and reasons for “interested” status: John F. Donahue is the father of J. Christopher Donahue; both are “interested” due to their beneficial ownership of shares of Federated Investors, Inc. and the positions they hold with Federated and its subsidiaries. |
Annual Shareholder Report
INDEPENDENT TRUSTEES Background
Name
Birth Date
Positions Held with Trust
Date Service Began | Principal Occupation(s) for Past Five Years,
Other Directorships Held, Previous Position(s) and Qualifications |
John T. Collins
Birth Date: January 24, 1947
Trustee
Indefinite Term
Began serving: October 2013 | Principal Occupations: Director or Trustee of the Federated Fund Family; Chairman and CEO, The Collins Group, Inc. (a private equity firm).
Other Directorships Held: Director, KLX Corp.
Qualifications: Mr. Collins has served in several business and financial management roles and directorship positions throughout his career. Mr. Collins serves as Chairman Emeriti, Bentley University. Mr. Collins previously served as Director, FleetBoston Financial Corp.; Director and Audit Committee Member, Bank of America Corp. and Director, Beth Israel Deaconess Medical Center (Harvard University Affiliate Hospital). |
Maureen Lally-Green
Birth Date: July 5, 1949
Trustee
Indefinite Term
Began serving: August 2009 | Principal Occupations: Director or Trustee of the Federated Fund Family; Associate General Secretary, Diocese of Pittsburgh; Adjunct Professor of Law, Duquesne University School of Law.
Other Directorships Held: Director, CONSOL Energy Inc.
Qualifications: Judge Lally-Green has served in various legal and business roles and directorship positions throughout her career. Judge Lally-Green previously served as Professor of Law, Duquesne University School of Law and was a member of the Superior Court of Pennsylvania. Judge Lally-Green also holds the positions of: Member, Pennsylvania State Board of Education; Director, Saint Vincent College; Director and Chair, UPMC Mercy Hospital; Regent, St. Vincent Seminary; Director, Epilepsy Foundation of Western and Central Pennsylvania; Director, Our Campaign for the Church Alive!, Inc.; Director, Pennsylvania Bar Institute; and Director, Catholic High Schools of the Diocese of Pittsburgh, Inc. Judge Lally-Green has held the positions of: Director, Auberle; Director, Ireland Institute of Pittsburgh; Director, Saint Thomas More Society; and Director Cardinal Wuerl Catholic High School. |
Peter E. Madden
Birth Date: March 16, 1942
Trustee
Indefinite Term
Began serving: November 1991 | Principal Occupation: Director or Trustee, and Chair of the Board of Directors or Trustees, of the Federated Fund Family; Retired.
Other Directorships Held: None.
Qualifications: Mr. Madden has served in several business management, mutual fund services and directorship positions throughout his career. Mr. Madden previously served as President, Chief Operating Officer and Director, State Street Bank and Trust Company (custodian bank) and State Street Corporation (financial services). He was Director, VISA USA and VISA International and Chairman and Director, Massachusetts Bankers Association. Mr. Madden served as Director, Depository Trust Corporation and Director, The Boston Stock Exchange. Mr. Madden also served as a Representative to the Commonwealth of Massachusetts General Court. |
Annual Shareholder Report
Name
Birth Date
Positions Held with Trust
Date Service Began | Principal Occupation(s) for Past Five Years,
Other Directorships Held, Previous Position(s) and Qualifications |
Charles F. Mansfield, Jr.
Birth Date: April 10, 1945
Trustee
Indefinite Term
Began serving: January 2000 | Principal Occupations: Director or Trustee of the Federated Fund Family; Management Consultant.
Other Directorships Held: None.
Qualifications: Mr. Mansfield has served in several banking, business management and educational roles and directorship positions throughout his career. Mr. Mansfield previously served as Chief Executive Officer, PBTC International Bank; Partner, Arthur Young & Company (now Ernst & Young LLP); Chief Financial Officer of Retail Banking Sector, Chase Manhattan Bank; Senior Vice President, HSBC Bank USA (formerly, Marine Midland Bank); Vice President, Citibank; Assistant Professor of Banking and Finance, Frank G. Zarb School of Business, Hofstra University; Executive Vice President DVC Group, Inc. (marketing, communications and technology). |
Thomas M. O'Neill
Birth Date: June 14, 1951
Trustee
Indefinite Term
Began serving: October 2006 | Principal Occupations: Director or Trustee, Vice Chair of the Audit Committee of the Federated Fund Family; Sole Proprietor, Navigator Management Company (investment and strategic consulting).
Other Directorships Held: None.
Qualifications: Mr. O'Neill has served in several business, mutual fund and financial management roles and directorship positions throughout his career. Mr. O'Neill serves as Director, Medicines for Humanity and Director, The Golisano Children's Museum of Naples, Florida. Mr. O'Neill previously served as Chief Executive Officer and President, Managing Director and Chief Investment Officer, Fleet Investment Advisors; President and Chief Executive Officer, Aeltus Investment Management, Inc.; General Partner, Hellman, Jordan Management Co., Boston, MA; Chief Investment Officer, The Putnam Companies, Boston, MA; Credit Analyst and Lending Officer, Fleet Bank; Director and Consultant, EZE Castle Software (investment order management software); and Director, Midway Pacific (lumber). |
P. Jerome Richey
Birth Date: February 23, 1949
Trustee
Indefinite Term
Began serving: October 2013 | Principal Occupations: Director or Trustee of the Federated Fund Family; General Counsel, University of Pittsburgh.
Other Directorships Held: None.
Qualifications: Mr. Richey has served in several business and legal management roles and directorship positions throughout his career. Mr. Richey serves as Board Member, Epilepsy Foundation of Western Pennsylvania and Board member, World Affairs Council of Pittsburgh. Mr. Richey previously served as Chief Legal Officer and Executive Vice President, CONSOL Energy Inc. and Shareholder, Buchanan Ingersoll & Rooney PC (a law firm). |
Annual Shareholder Report
Name
Birth Date
Positions Held with Trust
Date Service Began | Principal Occupation(s) for Past Five Years,
Other Directorships Held, Previous Position(s) and Qualifications |
John S. Walsh
Birth Date: November 28, 1957
Trustee
Indefinite Term
Began serving: January 2000 | Principal Occupations: Director or Trustee, Chair of the Audit Committee of the Federated Fund Family; President and Director, Heat Wagon, Inc. (manufacturer of construction temporary heaters); President and Director, Manufacturers Products, Inc. (distributor of portable construction heaters); President, Portable Heater Parts, a division of Manufacturers Products, Inc.
Other Directorships Held: None.
Qualifications: Mr. Walsh has served in several business management roles and directorship positions throughout his career. Mr. Walsh previously served as Vice President, Walsh & Kelly, Inc. (paving contractors). |
OFFICERS
Name
Birth Date
Address
Positions Held with Trust
Date Service Began | Principal Occupation(s) for Past Five Years
and Previous Position(s) |
John W. McGonigle
Birth Date: October 26, 1938
EXECUTIVE VICE PRESIDENT AND SECRETARY
Officer since: January 1986 | Principal Occupations: Executive Vice President and Secretary of the Federated Fund Family; Vice Chairman, Executive Vice President, Secretary and Director, Federated Investors, Inc.
Previous Positions: Trustee, Federated Investment Management Company and Federated Investment Counseling; Director, Federated Global Investment Management Corp., Federated Services Company and Federated Securities Corp. |
Lori A. Hensler
Birth Date: January 6, 1967
TREASURER
Officer since: April 2013 | Principal Occupations: Principal Financial Officer and Treasurer of the Federated Fund Family; Senior Vice President, Federated Administrative Services; Financial and Operations Principal for Federated Securities Corp. and Edgewood Services, Inc.; and Assistant Treasurer, Federated Investors Trust Company. Ms. Hensler has received the Certified Public Accountant designation.
Previous Positions: Controller of Federated Investors, Inc.; Senior Vice President and Assistant Treasurer, Federated Investors Management Company; Treasurer, Federated Investors Trust Company; Assistant Treasurer, Federated Administrative Services, Federated Administrative Services, Inc., Federated Securities Corp., Edgewood Services, Inc., Federated Advisory Services Company, Federated Equity Management Company of Pennsylvania, Federated Global Investment Management Corp., Federated Investment Counseling, Federated Investment Management Company, Passport Research, Ltd., and Federated MDTA, LLC; Financial and Operations Principal for Federated Securities Corp., Edgewood Services, Inc. and Southpointe Distribution Services, Inc. |
Annual Shareholder Report
Name
Birth Date
Address
Positions Held with Trust
Date Service Began | Principal Occupation(s) for Past Five Years
and Previous Position(s) |
Peter J. Germain
Birth Date: September 3, 1959
CHIEF LEGAL OFFICER
Officer since: January 2005 | Principal Occupations: Mr. Germain is Chief Legal Officer of the Federated Fund Family. He is General Counsel and Vice President, Federated Investors, Inc.; President, Federated Administrative Services and Federated Administrative Services, Inc.; Vice President, Federated Securities Corp.; Secretary, Federated Private Asset Management, Inc.; and Secretary, Retirement Plan Service Company of America. Mr. Germain joined Federated in 1984 and is a member of the Pennsylvania Bar Association.
Previous Positions: Deputy General Counsel, Special Counsel, Managing Director of Mutual Fund Services, Federated Investors, Inc.; Senior Vice President, Federated Services Company; and Senior Corporate Counsel, Federated Investors, Inc. |
Richard B. Fisher
Birth Date: May 17, 1923
VICE PRESIDENT
Officer since: January 1986 | Principal Occupations: Vice Chairman or Vice President of some of the Funds in the Federated Fund Family; Vice Chairman, Federated Investors, Inc.; Chairman, Federated Securities Corp.
Previous Positions: President and Director or Trustee of some of the Funds in the Federated Fund Family; Executive Vice President, Federated Investors, Inc.; Director and Chief Executive Officer, Federated Securities Corp. |
Brian P. Bouda
Birth Date: February 28, 1947
CHIEF COMPLIANCE OFFICER AND SENIOR VICE PRESIDENT
Officer since: August 2004 | Principal Occupations: Senior Vice President and Chief Compliance Officer of the Federated Fund Family; Vice President and Chief Compliance Officer of Federated Investors, Inc. and Chief Compliance Officer of certain of its subsidiaries. Mr. Bouda joined Federated in 1999 and is a member of the American Bar Association and the State Bar Association of Wisconsin.
Previous Positions: Served in Senior Management positions with a large regional banking organization. |
Robert J. Ostrowski
Birth Date: April 26, 1963
Chief Investment Officer
Officer since: May 2004 | Principal Occupations: Robert J. Ostrowski joined Federated in 1987 as an Investment Analyst and became a Portfolio Manager in 1990. He was named Chief Investment Officer of Federated's taxable fixed-income products in 2004 and also serves as a Senior Portfolio Manager. Mr. Ostrowski became an Executive Vice President of the Fund's Adviser in 2009 and served as a Senior Vice President of the Fund's Adviser from 1997 to 2009. Mr. Ostrowski has received the Chartered Financial Analyst designation. He received his M.S. in Industrial Administration from Carnegie Mellon University. |
Todd A. Abraham
Birth Date: February 10, 1966
VICE PRESIDENT
Officer since: June 2012
Portfolio Manager since: May 2003 | Principal Occupations: Todd A. Abraham has been the Fund's Portfolio Manager since May 2003. He is Vice President of the Trust with respect to the Fund. He is Vice President of the Trust. Mr. Abraham has been a Senior Portfolio Manager from 2007, Portfolio Manager from 1995 to 2006, a Senior Vice President since 2007 and a Vice President of the Fund's Adviser from 1997 to 2006. Mr. Abraham joined Federated in 1993 as an Investment Analyst and served as Assistant Vice President from 1995 to 1997. Mr. Abraham served as a Portfolio Analyst at Ryland Mortgage Co. from 1992 to 1993. Mr. Abraham has received the Chartered Financial Analyst designation and an M.B.A. in Finance from Loyola College. |
Annual Shareholder Report
Evaluation and Approval of Advisory Contract–May 2014
Federated Fund for U.S. Government Securities (the “Fund”)
Following a review and recommendation of approval by the Fund's independent trustees, the Fund's Board reviewed and approved at its May 2014 meetings the Fund's investment advisory contract for an additional one-year term. The Board's decision regarding the contract reflects the exercise of its business judgment on whether to continue the existing arrangements.
In this connection, the Federated Funds' Board had previously appointed a Senior Officer, whose duties include specified responsibilities relating to the process by which advisory fees are to be charged to a Federated fund. The Senior Officer has the authority to retain consultants, experts, or staff as may be reasonably necessary to assist in the performance of his duties, reports directly to the Board, and may be terminated only with the approval of a majority of the independent members of the Board. The Senior Officer prepared and furnished to the Board an independent, written evaluation that covered topics discussed below (the “Evaluation”). The Board considered that Evaluation, along with other information, in deciding to approve the advisory contract.
The Board is also familiar with and considered judicial decisions concerning allegedly excessive investment advisory fees, which have indicated that the following factors may be relevant to an Adviser's fiduciary duty with respect to its receipt of compensation from a fund: the nature and quality of the services provided by the Adviser to a fund and its shareholders, including the performance and expenses of the fund and of comparable funds; the Adviser's cost of providing the services, including the profitability to the Adviser of providing advisory services to a fund; the extent to which the Adviser may realize “economies of scale” as a fund grows larger and, if such economies exist, whether they have been shared with a fund and its shareholders or the family of funds; any “fall-out financial benefits” that accrue to the Adviser because of its relationship with a fund (including research services received from brokers that execute fund trades and any fees paid to affiliates of the Adviser for services rendered to a fund); comparative fee structures, including a comparison of fees paid to the Adviser with those paid by similar funds; and the extent of care, conscientiousness and independence with which the Board members perform their duties and their expertise, including whether they are fully informed about all facts the Board deems relevant to its consideration of the Adviser's services and fees. The Board noted that SEC disclosure requirements regarding the basis for the Board's approval of the Fund's advisory contract generally track the factors listed above. Consistent with these judicial decisions and SEC disclosure requirements, the Board also considered management fees charged to
Annual Shareholder Report
institutional and other clients of the Adviser for what might be viewed as like services. The Board was aware of these factors and was guided by them in its review of the Fund's advisory contract to the extent it considered them to be appropriate and relevant, as discussed further below.
The Board considered and weighed these circumstances in light of its substantial accumulated experience in governing the Fund and working with Federated on matters relating to the Federated funds, and was assisted in its deliberations by independent legal counsel. Throughout the year, and in connection with its May meetings, the Board requested and received substantial and detailed information about the Fund and the Federated organization that was in addition to the extensive materials that comprise and accompany the Senior Officer's Evaluation. Federated provided much of this information at each regular meeting of the Board, and furnished additional substantial information in connection with the May meeting at which the Board's formal review of the advisory contract occurred. At this May meeting, senior management of the Adviser also met with the independent trustees and their counsel to discuss the materials presented and any other matters thought relevant by the Adviser or the trustees. Between regularly scheduled meetings, the Board also received information on particular matters as the need arose. Thus, the Board's consideration of the advisory contract included review of the Senior Officer's Evaluation, accompanying data and additional information covering such matters as: the Adviser's investment philosophy, revenue, profitability, personnel and processes; investment and operating strategies; the Fund's short- and long-term performance (in absolute terms, both on a gross basis and net of expenses, as well as in relationship to its particular investment program and certain competitor or “peer group” funds and/or other benchmarks, as appropriate), and comments on the reasons for performance; the Fund's investment objectives; the Fund's expenses (including the advisory fee itself and the overall expense structure of the Fund, both in absolute terms and relative to similar and/or competing funds, with due regard for contractual or voluntary expense limitations); the use and allocation of brokerage commissions derived from trading the Fund's portfolio securities (if any); and the nature, quality and extent of the advisory and other services provided to the Fund by the Adviser and its affiliates. The Board also considered the preferences and expectations of Fund shareholders; the entrepreneurial risk assumed by the Adviser in sponsoring the funds; the continuing state of competition in the mutual fund industry and market practices; the range of comparable fees for similar funds in the mutual fund industry; the Fund's relationship to the Federated family of funds which include a comprehensive array of funds with different investment objectives, policies and strategies which are available for exchange without the incurrence of additional sales charges; compliance and audit reports concerning the Federated funds and the Federated companies that service them (including communications from regulatory agencies), as well as Federated's responses to any issues raised therein; and relevant developments in
Annual Shareholder Report
the mutual fund industry and how the Federated funds and/or Federated are responding to them. The Board's evaluation process is evolutionary. The criteria considered and the emphasis placed on relevant criteria change in recognition of changing circumstances in the mutual fund marketplace.
While mindful that courts have cautioned against giving such comparisons too much weight, the Board has found the use of comparisons of the Fund's fees and expenses to other mutual funds with comparable investment programs to be relevant. In this regard, the Board was presented with, and considered, information regarding the contractual advisory fee rates, net advisory fee rates and total expense ratios relative to a fund's peers. The Board focused on comparisons with other similar mutual funds more heavily than non-mutual fund products or services because it is believed that they are more relevant. For example, other mutual funds are the products most like the Fund, they are readily available to Fund shareholders as alternative investment vehicles, and they are the type of investment vehicle in fact chosen and maintained by the Fund's investors. The range of their fees and expenses therefore appears to be a relevant indicator of what consumers have found to be reasonable in the precise marketplace in which the Fund competes.
The Board reviewed the contractual advisory fee rate, and other expenses of the Fund and noted the position of the Fund's fee rates relative to its peers. In this regard, the Board noted that the contractual advisory fee rate was below the median of the relevant peer group and that it was satisfied that the overall expense structure of the Fund remained competitive.
By contrast, the Senior Officer has reviewed Federated's fees for providing advisory services to products outside the Federated family of funds (e.g., institutional and separate accounts and sub-adviser services). He concluded that mutual funds and institutional accounts are inherently different products. Those differences include, but are not limited to, different types of targeted investors; being subject to different laws and regulations; different legal structures; different average account sizes and portfolio management techniques made necessary by different cash flows and different associated costs; and the time spent by portfolio managers and their teams, funds financial services, legal, compliance and risk management in reviewing securities pricing, addressing different administrative responsibilities, addressing different degrees of risk associated with management and a variety of different costs. The Senior Officer did not consider these fee schedules to be determinative in judging the appropriateness of mutual fund advisory fees.
The Fund's ability to deliver competitive performance when compared to its peer group was also deemed to be relevant by the Board as a useful indicator of how the Adviser is executing the Fund's investment program, which in turn was one of the Board's considerations in reaching a conclusion that the nature, extent, and quality of the Adviser's investment management services were such as to warrant continuation of the advisory contract.
Annual Shareholder Report
The Senior Officer reviewed information compiled by Federated, using data supplied by independent fund ranking organizations, regarding the performance of, and fees charged by, other mutual funds, noting his view that comparisons to fund peer groups may be helpful, though not conclusive, in judging the reasonableness of proposed fees. The Board considered, in evaluating such comparisons, that in some cases individual funds may exhibit significant and unique differences in their objectives and management techniques when compared to other funds within an industry peer group.
For the periods covered by the Evaluation, the Fund's performance for the one-year and five-year periods was above the median of the relevant peer group, and the Fund's performance fell below the median of the relevant peer group for the three-year period. The Board discussed the Fund's performance with the Adviser and recognized the efforts being undertaken by the Adviser. The Board will continue to monitor these efforts and the performance of the Fund in the context of the other factors considered relevant by the Board.
The Board also received financial information about Federated, including information regarding the compensation and benefits Federated derived from its relationships with the Federated funds. This information covered not only the fees under the advisory contracts, but also fees received by Federated's subsidiaries for providing other services to the Federated funds under separate contracts (e.g., for serving as the Federated funds' administrator). The information also detailed any indirect benefit Federated may derive from its receipt of research services from brokers who execute Federated fund trades. In addition, the Board considered the fact that, in order for a fund to be competitive in the marketplace, Federated and its affiliates frequently waived fees and/or reimbursed expenses and have disclosed to fund investors and/or indicated to the Board their intention to do so in the future, where appropriate. Moreover, the Board receives regular reporting as to the institution, adjustment or elimination of these voluntary waivers. In addition, following discussions regarding the Senior Officer's May 2013 recommendations, Federated made meaningful reductions to gross advisory fees for several funds. At the Board meeting in May 2014, the Senior Officer proposed, and the Board approved, reductions in the contractual advisory fees of certain other funds.
Federated furnished information, requested by the Senior Officer, that reported revenues on a fund-by-fund basis and made estimates of the allocation of expenses on a fund-by-fund basis, using allocation methodologies specified by the Senior Officer. The Senior Officer noted that, while these cost allocation reports apply consistent allocation processes, the inherent difficulties in allocating costs continues to cause the Senior Officer to question the precision of the process and to conclude that such reports may be unreliable, since a single change in an allocation estimate may dramatically alter the resulting estimate of cost and/or profitability of a fund and may produce unintended consequences. The allocation information, including the Senior Officer's view that fund-by-fund estimations may be unreliable, was considered in the analysis by the Board.
Annual Shareholder Report
The Board and the Senior Officer also reviewed information compiled by Federated comparing profitability information for Federated to other publicly held fund management companies. In this regard, the Senior Officer concluded that Federated's profit margins did not appear to be excessive.
The Senior Officer's Evaluation also discussed the notion of possible realization of “economies of scale” as a fund grows larger. The Board considered in this regard that the Adviser has made significant and long-term investments in areas that support all of the Federated family of funds, such as personnel and processes for the portfolio management, shareholder services, compliance, internal audit, and risk management functions; and systems technology; and that the benefits of these efforts (as well as any economies, should they exist) were likely to be enjoyed by the fund family as a whole. Finally, the Board also noted the absence of any applicable regulatory or industry guidelines on this subject, which (as discussed in the Senior Officer's Evaluation) is compounded by the lack of any common industry practice or general pattern with respect to structuring fund advisory fees with “breakpoints” that serve to reduce the fee as the fund attains a certain size.
The Senior Officer noted that, subject to the comments and recommendations made within his Evaluation, his observations and the information accompanying the Evaluation supported a finding by the Board that the management fees for each of the funds were reasonable. Under these circumstances, no changes were recommended to, and no objection was raised to, the continuation of the Fund's advisory contract.
In its decision to continue an existing investment advisory contract, the Board was mindful of the potential disruptions of the Fund's operations and various risks, uncertainties and other effects that could occur as a result of a decision to terminate or not renew an advisory contract. In particular, the Board recognized that many shareholders have invested in the Fund on the strength of the Adviser's industry standing and reputation and with the expectation that the Adviser will have a continuing role in providing advisory services to the Fund. Thus, the Board's approval of the advisory contract reflected the fact that it is the shareholders who have effectively selected the Adviser by virtue of having invested in the Fund. The Board concluded that, in light of the factors discussed above, including the nature, quality and scope of the services provided to the Fund by the Adviser and its affiliates, continuation of the advisory contract was appropriate.
The Board based its decision to approve the advisory contract on the totality of the circumstances and relevant factors and with a view to past and future long-term considerations. Not all of the factors and considerations identified above were necessarily relevant to the Fund, nor did the Board consider any one of them to be determinative. With respect to the factors that were relevant, the Board's decision to approve the contract reflects its determination that Federated's performance and actions provided a satisfactory basis to support the decision to continue the existing arrangements.
Annual Shareholder Report
Voting Proxies on Fund Portfolio Securities
A description of the policies and procedures that the Fund uses to determine how to vote proxies, if any, relating to securities held in the Fund's portfolio is available, without charge and upon request, by calling 1-800-341-7400. A report on “Form N-PX” of how the Fund voted any such proxies during the most recent 12-month period ended June 30 is available via the Proxy Voting Record (Form N-PX) link associated with the Fund and share class name at www.FederatedInvestors.com/FundInformation. Form N-PX filings are also available at the SEC's website at www.sec.gov.
Quarterly Portfolio Schedule
The Fund files with the SEC a complete schedule of its portfolio holdings, as of the close of the first and third quarters of its fiscal year, on “Form N-Q.” These filings are available on the SEC's website at www.sec.gov and may be reviewed and copied at the SEC's Public Reference Room in Washington, DC. (Call 1-800-SEC-0330 for information on the operation of the Public Reference Room.) You may also access this information via the link to the Fund and share class name at www.FederatedInvestors.com/FundInformation.
Annual Shareholder Report
Mutual funds are not bank deposits or obligations, are not guaranteed by any bank and are not insured or guaranteed by the U.S. government, the Federal Deposit Insurance Corporation, the Federal Reserve Board or any other government agency. Investment in mutual funds involves investment risk, including the possible loss of principal.
This Report is authorized for distribution to prospective investors only when preceded or accompanied by the Fund's Prospectus, which contains facts concerning its objective and policies, management fees, expenses and other information.
Federated Fund for U.S. Government Securities
Federated Investors Funds
4000 Ericsson Drive
Warrendale, PA 15086-7561
Contact us at FederatedInvestors.com
or call 1-800-341-7400.
Federated Securities Corp., Distributor
CUSIP 31420C704
CUSIP 31420C803
CUSIP 31420C886
28390 (5/15)
Federated is a registered trademark of Federated Investors, Inc.
2015 ©Federated Investors, Inc.
Item 2. Code of Ethics
(a) As of the end of the period covered by this report, the registrant has adopted a code of ethics (the "Section 406 Standards for Investment Companies - Ethical Standards for Principal Executive and Financial Officers") that applies to the registrant's Principal Executive Officer and Principal Financial Officer; the registrant's Principal Financial Officer also serves as the Principal Accounting Officer.
(c) There was no amendment to the registrant’s code of ethics described in Item 2(a) above during the period covered by the report.
(d) There was no waiver granted, either actual or implicit, from a provision to the registrant’s code of ethics described in Item 2(a) above during the period covered by the report.
(e) Not Applicable
(f)(3) The registrant hereby undertakes to provide any person, without charge, upon request, a copy of the code of ethics. To request a copy of the code of ethics, contact the registrant at 1-800-341-7400, and ask for a copy of the Section 406 Standards for Investment Companies - Ethical Standards for Principal Executive and Financial Officers.
Item 3. Audit Committee Financial Expert
The registrant's Board has determined that each of the following members of the Board's Audit Committee is an “audit committee financial expert,” and is "independent," for purposes of this Item: John T. Collins, Thomas M. O'Neill and John S. Walsh.
Item 4. Principal Accountant Fees and Services
(a) Audit Fees billed to the registrant for the two most recent fiscal years:
Fiscal year ended 2015 - $263,250
Fiscal year ended 2014 - $252,200
(b) Audit-Related Fees billed to the registrant for the two most recent fiscal years:
Fiscal year ended 2015 - $91
Fiscal year ended 2014 - $0
Travel to Audit Committee Meeting.
Amount requiring approval of the registrant’s audit committee pursuant to paragraph (c)(7)(ii) of Rule 2-01 of Regulation S-X, $100 and $0 respectively. Fiscal year ended 2015- Travel expenses for attendance at Audit Committee meeting.
(c) Tax Fees billed to the registrant for the two most recent fiscal years:
Fiscal year ended 2015 - $0
Fiscal year ended 2014 - $0
Amount requiring approval of the registrant’s audit committee pursuant to paragraph (c)(7)(ii) of Rule 2-01 of Regulation S-X, $0 and $0 respectively.
(d) All Other Fees billed to the registrant for the two most recent fiscal years:
Fiscal year ended 2015 - $0
Fiscal year ended 2014 - $0
Amount requiring approval of the registrant’s audit committee pursuant to paragraph (c)(7)(ii) of Rule 2-01 of Regulation S-X, $35,697 and $24,763 respectively. Fiscal year ended 2015- Service fee for analysis of potential Passive Foreign Investment Company holdings. Fiscal year ended 2014- Service fee for analysis of potential Passive Foreign Investment Company holdings.
(e)(1) Audit Committee Policies regarding Pre-approval of Services.
The Audit Committee is required to pre-approve audit and non-audit services performed by the independent auditor in order to assure that the provision of such services do not impair the auditor’s independence. Unless a type of service to be provided by the independent auditor has received general pre-approval, it will require specific pre-approval by the Audit Committee. Any proposed services exceeding pre-approved cost levels will require specific pre-approval by the Audit Committee.
Certain services have the general pre-approval of the Audit Committee. The term of the general pre-approval is 12 months from the date of pre-approval, unless the Audit Committee specifically provides for a different period. The Audit Committee will annually review the services that may be provided by the independent auditor without obtaining specific pre-approval from the Audit Committee and may grant general pre-approval for such services. The Audit Committee will revise the list of general pre-approved services from time to time, based on subsequent determinations. The Audit Committee will not delegate its responsibilities to pre-approve services performed by the independent auditor to management.
The Audit Committee has delegated pre-approval authority to its Chairman. The Chairman will report any pre-approval decisions to the Audit Committee at its next scheduled meeting. The Committee will designate another member with such pre-approval authority when the Chairman is unavailable.
AUDIT SERVICES
The annual Audit services engagement terms and fees will be subject to the specific pre-approval of the Audit Committee. The Audit Committee must approve any changes in terms, conditions and fees resulting from changes in audit scope, registered investment company (RIC) structure or other matters.
In addition to the annual Audit services engagement specifically approved by the Audit Committee, the Audit Committee may grant general pre-approval for other Audit Services, which are those services that only the independent auditor reasonably can provide. The Audit Committee has pre-approved certain Audit services, all other Audit services must be specifically pre-approved by the Audit Committee.
AUDIT-RELATED SERVICES
Audit-related services are assurance and related services that are reasonably related to the performance of the audit or review of the Company’s financial statements or that are traditionally performed by the independent auditor. The Audit Committee believes that the provision of Audit-related services does not impair the independence of the auditor, and has pre-approved certain Audit-related services, all other Audit-related services must be specifically pre-approved by the Audit Committee.
TAX SERVICES
The Audit Committee believes that the independent auditor can provide Tax services to the Company such as tax compliance, tax planning and tax advice without impairing the auditor’s independence. However, the Audit Committee will not permit the retention of the independent auditor in connection with a transaction initially recommended by the independent auditor, the purpose of which may be tax avoidance and the tax treatment of which may not be supported in the Internal Revenue Code and related regulations. The Audit Committee has pre-approved certain Tax services, all Tax services involving large and complex transactions must be specifically pre-approved by the Audit Committee.
ALL OTHER SERVICES
With respect to the provision of services other than audit, review or attest services the pre-approval requirement is waived if:
| (1) | The aggregate amount of all such services provided constitutes no more than five percent of the total amount of revenues paid by the registrant, the registrant’s adviser (not including any sub-adviser whose role is primarily portfolio management and is subcontracted with or overseen by another investment adviser), and any entity controlling, controlled by, or under common control with the investment adviser that provides ongoing services to the registrant to its accountant during the fiscal year in which the services are provided; |
| (2) | Such services were not recognized by the registrant, the registrant’s adviser (not including any sub-adviser whose role is primarily portfolio management and is subcontracted with or overseen by another investment adviser), and any entity controlling, controlled by, or under common control with the investment adviser that provides ongoing services to the registrant at the time of the engagement to be non-audit services; and |
| (3) | Such services are promptly brought to the attention of the Audit Committee of the issuer and approved prior to the completion of the audit by the Audit Committee or by one or more members of the Audit Committee who are members of the board of directors to whom authority to grant such approvals has been delegated by the Audit Committee. |
The Audit Committee may grant general pre-approval to those permissible non-audit services classified as All Other services that it believes are routine and recurring services, and would not impair the independence of the auditor.
The SEC’s rules and relevant guidance should be consulted to determine the precise definitions of prohibited non-audit services and the applicability of exceptions to certain of the prohibitions.
PRE-APPROVAL FEE LEVELS
Pre-approval fee levels for all services to be provided by the independent auditor will be established annually by the Audit Committee. Any proposed services exceeding these levels will require specific pre-approval by the Audit Committee.
PROCEDURES
Requests or applications to provide services that require specific approval by the Audit Committee will be submitted to the Audit Committee by both the independent auditor and the Principal Accounting Officer and/or Internal Auditor, and must include a joint statement as to whether, in their view, the request or application is consistent with the SEC’s rules on auditor independence.
(e)(2) Percentage of services identified in items 4(b) through 4(d) that were approved by the registrants audit committee pursuant to paragraph (c)(7)(i)(C) of Rule 2-01 of Regulation S-X:
4(b)
Fiscal year ended 2015 – 0%
Fiscal year ended 2014 - 0%
Percentage of services provided to the registrants investment adviser and any entity controlling, controlled by, or under common control with the investment adviser that provides ongoing services to the registrant that were approved by the registrants audit committee pursuant to paragraph (c)(7)(i)(C) of Rule 2-01 of Regulation S-X, 0% and 0% respectively.
4(c)
Fiscal year ended 2015 – 0%
Fiscal year ended 2014 – 0%
Percentage of services provided to the registrants investment adviser and any entity controlling, controlled by, or under common control with the investment adviser that provides ongoing services to the registrant that were approved by the registrants audit committee pursuant to paragraph (c)(7)(i)(C) of Rule 2-01 of Regulation S-X, 0% and 0% respectively.
4(d)
Fiscal year ended 2015 – 0%
Fiscal year ended 2014 – 0%
Percentage of services provided to the registrants investment adviser and any entity controlling, controlled by, or under common control with the investment adviser that provides ongoing services to the registrant that were approved by the registrants audit committee pursuant to paragraph (c)(7)(i)(C) of Rule 2-01 of Regulation S-X, 0% and 0% respectively.
| (g) | Non-Audit Fees billed to the registrant, the registrant’s investment adviser, and certain entities controlling, controlled by or under common control with the investment adviser: |
Fiscal year ended 2015 - $105,307
Fiscal year ended 2014 - $107,898
(h) The registrant’s Audit Committee has considered that the provision of non-audit services that were rendered to the registrant’s adviser (not including any sub-adviser whose role is primarily portfolio management and is subcontracted with or overseen by another investment adviser), and any entity controlling, controlled by, or under common control with the investment adviser that provides ongoing services to the registrant that were not pre-approved pursuant to paragraph (c)(7)(ii) of Rule 2-01 of Regulation S-X is compatible with maintaining the principal accountant’s independence.
Item 5. Audit Committee of Listed Registrants
Not Applicable
Item 6. Schedule of Investments
(a) The registrant’s Schedule of Investments is included as part of the Report to Stockholders filed under Item 1 of this form.
(b) Not Applicable; Fund had no divestments during the reporting period covered since the previous Form N-CSR filing.
Item 7. Disclosure of Proxy Voting Policies and Procedures for Closed-End Management Investment Companies
Item 8. Portfolio Managers of Closed-End Management Investment Companies
Item 9. Purchases of Equity Securities by Closed-End Management Investment Company and Affiliated Purchasers
Item 10. Submission of Matters to a Vote of Security Holders
No Changes to Report
Item 11. Controls and Procedures
(a) The registrant’s President and Treasurer have concluded that the
registrant’s disclosure controls and procedures (as defined in rule 30a-3(c) under the Act) are effective in design and operation and are sufficient to form the basis of the certifications required by Rule 30a-(2) under the Act, based on their evaluation of these disclosure controls and procedures within 90 days of the filing date of this report on Form N-CSR.
(b) There were no changes in the registrant’s internal control over financial reporting (as defined in rule 30a-3(d) under the Act) during the second fiscal quarter of the period covered by this report that have materially affected, or are reasonably likely to materially affect, the registrant’s internal control over financial reporting.
Item 12. Exhibits
(a)(1) Code of Ethics- Not Applicable to this Report.
(a)(2) Certifications of Principal Executive Officer and Principal Financial Officer.
(a)(3) Not Applicable.
(b) Certifications pursuant to 18 U.S.C. Section 1350.
SIGNATURES
Pursuant to the requirements of the Securities Exchange Act of 1934 and the Investment Company Act of 1940, the registrant has duly caused this report to be signed on its behalf by the undersigned, thereunto duly authorized.
Registrant Federated Income Securities Trust
By /S/ Lori A. Hensler
Lori A. Hensler, Principal Financial Officer
Date May 21, 2015
Pursuant to the requirements of the Securities Exchange Act of 1934 and the Investment Company Act of 1940, this report has been signed below by the following persons on behalf of the registrant and in the capacities and on the dates indicated.
By /S/ J. Christopher Donahue
J. Christopher Donahue, Principal Executive Officer
Date May 21, 2015
By /S/ Lori A. Hensler
Lori A. Hensler, Principal Financial Officer
Date May 21, 2015